
Submitted:
26 March 2025
Posted:
31 March 2025
You are already at the latest version
Abstract
The increasing adoption of Internet of Things (IoT) devices, coupled with the transition to Industry 4.0, has highlighted the necessity of evaluating LoRaWAN performance in complex geographical environments. This study presents an automated system for assessing LoRaWAN coverage in mountainous regions. The system addresses critical performance parameters such as Received Signal Strength Indicator (RSSI), Signal-to-Noise Ratio (SNR), transmission power, velocity, and data transmission intervals. The proposed methodology integrates qualitative and quantitative approaches in three phases: Analysis, Implementation, and Evaluation. The system is deployed in urban and rural regions of southern Ecuador, where real-time data acquisition enables both uplink and downlink performance assessment. The results demonstrate the feasibility of automating LoRaWAN coverage evaluation, minimizing manual intervention, and enhancing network monitoring efficiency. The findings support the optimization of IoT deployments in challenging terrains, facilitating improved communication reliability and scalability.
Keywords:
LoRa
; LoRaWAN
; software automation
; IoT performance evaluation
; LPWAN
; Wireless Sensor Networs
; testbed
1. Introduction
The implementation of technologies of the Internet of Things (IoT) has become a cornerstone of Industry 4.0, driving the integration of digital systems into manufacturing and industrial processes. By enabling seamless communication, real-time data analysis, and automation, IoT transforms traditional industries into smart, interconnected systems, fostering improvements in efficiency, productivity, and innovation [1]. The growing adoption of low power wide area network (LPWAN) devices, wearable sensors are expected to reach three billion by 2050, underscores the rapid expansion of IoT in various sectors [2].
The versatility of IoT extends across various domains, including security systems, industrial automation, smart cities, precision agriculture, and smart healthcare [3]. These applications utilize IoT to streamline operations, improve decision-making, and provide innovative solutions to complex challenges.
Three defining features underpin the widespread adoption of the IoT:
- Low Data Rate (DR): IoT devices typically transmit small, intermittent data packets. Low data rate communication protocols optimize bandwidth usage, ensuring scalability as the number of connected devices grows.
- Low Energy Consumption: Designed for remote or hard-to-access environments, IoT devices rely on energy-efficient protocols and hardware to extend battery life and reduce maintenance requirements.
- Cost Effectiveness: Affordability is crucial for large-scale implementations, such as in smart cities or agriculture. Cost-efficient IoT technologies promote accessibility for industries and governments around the world.
By addressing these requirements, the IoT continues to revolutionize industries. In smart agriculture, for example, IoT devices monitor soil moisture, weather, and crop health to optimize resource usage and increase yields. In healthcare, IoT enabled systems provide remote patient monitoring, offering personalized care while easing the burden on healthcare facilities [3,4].
As the IoT ecosystem evolves, advances such as low-power communication protocols (e.g., LoRaWAN) and edge computing enhance its efficiency, scalability and potential for deeper integration into critical sectors. These innovations are transforming the IoT into a fundamental component of modern infrastructure [4].
Effective communication technologies are fundamental to the advancement of the Internet of Things (IoT), as they provide the essential infrastructure for device interconnectivity and seamless data exchange. Among these technologies, LoRa and LoRaWAN stand out for their suitability in low-power, long-range applications, making them particularly advantageous in scenarios where energy efficiency and wide area coverage are paramount [5].
Emerging trends in IoT are increasingly shaped by the integration of artificial intelligence and machine learning (AI/ML), the adoption of fog computing architectures, and the development of hybrid multi-network solutions, such as the convergence of LoRa and 5G technologies, aiming to enhance scalability, adaptability, and real-time data processing capabilities [6].
One of the key advantages of LoRaWAN is its ability to operate in unlicensed frequency bands, significantly reducing barriers to entry for developers and businesses. This affordability encourages innovation and supports a wide range of applications. Their reliability and accessibility make them particularly suitable for scenarios that require communication over vast distances, such as rural connectivity and wide-area sensor networks. As global adoption grows, LoRa and LoRaWAN are driving scalable and efficient IoT solutions across industries [4].
The commonly used wireless communication technologies are ZigBee, Bluetooth, Sigfox, Wireless Fidelity (WiFi), and Long Range (LoRa) [7,8,9,10,11]. In particular, LoRaWAN has emerged as one of the most widely deployed LPWAN (Low Power Wide Area Network) technologies, garnering significant attention from both the research and the industrial communities due to its scalability, low power consumption, and extensive range. Its growing adoption is driven by its ability to address various applications of the Internet of Things (IoT), especially smart agriculture and the development of various applications in rural areas. In Figure 1, we can appreciate a graphic that compares different wireless technologies and their potential.
Thus, LPWAN technologies are not direct competitors to Bluetooth [13], WiFi [14], or ZigBee [15]. Instead, LPWAN provides unique features that make it particularly well suited for wide-area sensor network (WSN) applications. A detailed comparison of LoRaWAN, Sigfox and NB-IoT is presented in [10] and summarized in Table 1.
The implementation of key applications that can be replicated in Latin American countries is described below.
Significant advances have been made in the application of LoRa technology for animal tracking and smart agriculture. For example, in [18], an IoT-based crop monitoring system leverages LoRa as an efficient technology for agricultural applications. This study evaluates the performance of LoRa networks in a rural tree farm, focusing on the impact of the parameters of the physical layer (PHY), such as spreading factor, coding rate, and bandwidth, on communication performance.
The results indicate that the actual communication range was shorter than theoretically expected, with the spread factor and the coding rate playing a crucial role in the performance of the network. Furthermore, data reliability was observed to fluctuate with distance and PHY configurations, despite the received signal strength indicator (RSSI) remaining relatively stable. Furthermore, the study highlights the influence of the Fresnel zone on communication quality, demonstrating its impact on signal propagation and network performance.
These findings underscore the importance of fine-tuning PHY parameters for agricultural IoT applications, particularly in regions with diverse environmental conditions such as Latin America, where LoRaWAN can serve as a cost-effective and scalable connectivity solution for precision agriculture and environmental monitoring.
LoRaWAN offers an innovative IoT-based health monitoring solution designed for rural communities that uses its network infrastructure to enable secure, low-cost and energy-efficient communication. The system focuses primarily on tracking key health metrics, including blood pressure, glucose levels, and body temperature, particularly in areas with limited or no cell coverage. By reducing the need for long trips to healthcare facilities, it effectively reduces communication costs for patients, as demonstrated in [19]. This approach highlights the potential of IoT technologies in addressing critical healthcare challenges in underserved regions through real-time data acquisition and reliable transmission.
In addition to this, Cabezas et al. [20] proposed a smart monitoring system tailored for the control of temperature and relative humidity within Colombian pharmaceutical services. The system aims to ensure patient safety by minimizing medication errors through precise environmental control. Built on an IoT-based architecture, the solution integrates native and web services to manage real-time data while supporting multiple devices (IoT Level 4) for scalability. Incorporating a robust data quality management (DQM) framework ensures data accuracy, completeness, timeliness, and integrity. Key components include an ESP32 microcontroller and an SHT31 sensor, offering high-precision readings with deviations of only RH and . In addition, real-time alerts were implemented using Callme Bot via WhatsApp, improving system responsiveness.
Trends in Agriculture 4.0 leverage the integration of IoT in agriculture, bringing significant advances by merging innovation with traditional practices [21]. Real challenges can be addressed; for example, the average age of Ecuadorian farmers is 47 years [22]. The adoption of technologies such as smart agriculture could attract a younger workforce to rural areas by offering higher quality work opportunities.
Another important application is the implementation of exploring the use of LoRa technology for video transmission in custom WMSNs designed for smart agriculture in rural areas, as cited in [23]. Although LoRa’s inherent low data rate, high latency, and regulatory constraints make it unsuitable for real-time video streaming, it can still be leveraged for nonreal-time, low-bandwidth video applications, such as periodic surveillance monitoring. LoRaWAN networks operate at data rates between 0.3 kbps and 50 kbps, which is significantly lower than the bandwidth required for continuous video transmission. Furthermore, duty cycle limitations imposed by regulatory bodies (e.g., 1% in Europe under ETSI regulations) restrict continuous data transmission, further challenging real-time video applications.
However, LoRa remains a viable option for “delayed video surveillance” using efficient video compression techniques and short video clips instead of live streaming. By capturing and encoding small video segments using high-efficiency compression standards such as H.265 (HEVC) or Motion JPEG (MJPEG), it is possible to reduce the data size while maintaining sufficient image quality. These compressed video clips can then be transmitted over LoRa in a store-and-forward approach, where small chunks of data are sent periodically, ensuring compliance with LoRa’s transmission constraints [24].
In urban areas, efficient public transportation systems are crucial for enhancing economic productivity, ensuring seamless mobility, and promoting environmental sustainability. However, persistent challenges such as unpredictable schedules, traffic congestion, and inefficient resource utilization continue to hinder optimal transportation performance. These problems are particularly pronounced in densely populated urban environments, where high demand and limited infrastructure exacerbate operational inefficiencies [25].
The adoption of software tools for evaluating link parameters and monitoring network performance has become increasingly prevalent in the Internet of Things (IoT) sector. This includes both simulation-based platforms [26] and real-time analysis frameworks [27,28]. Automating these processes significantly enhances the efficiency of application deployment, especially in complex and resource-constrained environments.
This research was conducted in the southern region of Ecuador, with the city of Loja serving as the principal urban center. Loja has an estimated population of approximately 100,000 inhabitants, while the surrounding rural areas contribute an additional population of around 485,000. This demographic distribution highlights the predominantly rural nature of the province and its strategic focus on agricultural development [29].
The region is characterized by diverse geographic and climatic conditions. Its topography is dominated by the Andean mountain range, comprising steep slopes, deep valleys, and elevated plateaus, which pose significant challenges for communication systems due to frequent line-of-sight obstructions. Climatic conditions vary widely, encompassing tropical savanna, humid and semi-humid mesothermal zones, high-altitude páramo climates, and arid regions near the southern border with northern Peru. The average annual temperature is approximately 16 °C [30]. These geographic, climatic, and demographic attributes render the region particularly well-suited for the deployment of low-power wide-area network (LPWAN) technologies, such as LoRa. The mountainous terrain, in particular, offers advantageous locations for the strategic placement of LoRa gateways, enabling extended communication range and connectivity in remote rural areas.
As such, Loja constitutes an ideal testbed for evaluating real-world LPWAN implementations, especially in rural and agriculturally focused contexts. The field deployments described in this study illustrate the practical viability of such systems under diverse and challenging environmental conditions.
The remainder of this article is structured as follows: Section 2 outlines the motivation behind this study and presents a comprehensive review of related work. Section 3 details the methodology employed to define and configure the system’s evaluation parameters. Section 4 describes the implementation of the system software architecture. Section 5 presents the key findings obtained from the experimental evaluation, while Section 6 provides a critical analysis of the results. Finally, Section 7 concludes the article by summarizing the main contributions and proposing directions for future research.
2. Related Work
Most LoRaWAN coverage assessments are still based on manual measurements, which complicates the identification of coverage gaps and network issues. This lack of high-resolution and systematic data can negatively impact service quality, leading to packet loss, transmission interference, and poor application reliability. Although recent studies, such as those by Povalac et al. [31], have proposed automated tools and datasets to support large-scale traffic analysis, such solutions are not yet widely adopted in practical deployments. Their work presents an open source sniffer and a publicly available dataset that enables a comprehensive evaluation of LoRaWAN traffic, including uplink, downlink, and Class-B beacon transmissions, captured in four European cities. These tools offer a scalable foundation for automating network monitoring and diagnostics in real-world environments.
To address these challenges, an automated system can enable informed decision-making on infrastructure optimization, resource allocation, and troubleshooting. A better understanding of real-time coverage would allow for timely identification of weak signal areas, facilitating the planning of new base stations or adjustments to existing configurations to enhance signal quality. In addition, implementing automation in this process saves time and resources by continuously collecting coverage data, reducing the reliance on manual measurements in future network expansions. In addition, automation improves the scalability of the system, simplifying the integration of new base stations and end devices into growing IoT networks.
Testbeds play a crucial role in the evaluation of LoRaWAN deployments. They can be deployed in urban, suburban, and rural areas to assess the effectiveness of technology under different conditions. Testbeds serve as valuable platforms for testing new protocols, fine-tuning network parameters, and conducting controlled experiments before large-scale deployment, ensuring optimal system performance.
Several studies have explored LoRaWAN propagation models and network performance evaluations. Rida El Chall et al. [4] present an in-depth analysis of LoRaWAN technology, focusing on propagation models and measurement campaigns conducted in various environments in Lebanon, including indoor, outdoor, urban and rural areas. Their study validates theoretical models through empirical data, analyzing received signal strength indicator (RSSI) values, and evaluating network reliability via packet delivery ratio (PDR) and signal-to-noise ratio (SNR). Furthermore, they compared their measurement-based model with existing empirical propagation models tailored to different environmental conditions.
Similarly, Chasque [32] examines LoRa technology and the LoRaWAN protocol within an urban deployment in Quito, Ecuador. The study focuses on validating propagation models in environments with and without line of sight (LoS), employing key performance indicators such as RSSI, SNR, and PDR.
Extending the analysis to smart city applications, Ruz Nieto [33] evaluates low-power wide area networks (LPWAN) using a network simulator, a 3D engine, and a ray-tracing tool. Their test campaign, conducted in the city of Cartagena, Spain, demonstrates the effectiveness of simulation-based approaches in improving LoRaWAN communication performance in urban settings.
A complementary study by Faber et al. [34] provides both theoretical and experimental evaluations of LoRa performance under challenging conditions, such as low signal-to-noise ratios and long-distance communication. Their work models the LoRa physical layer, detailing the Chirp Spread Spectrum (CSS) modulation scheme and its behavior in additive white Gaussian noise (AWGN) channels, alongside urban and suburban environments.
Furthermore, Onykiienko et al. [35] investigate LoRa’s applicability in IoT data collection systems, focusing on signal power attenuation in urban conditions. Their study explores signal losses in both line-of-sight and nonline-of-sight scenarios and derives a path loss model based on real-world measurement campaigns. To validate their findings, they compared their proposed model with established empirical propagation models such as Okumura-Hata, WINNER+, and Free Space, allowing a better estimation of LoRa network efficiency under varying propagation factors.
A comprehensive review by Alipio et al. [36] categorizes the evaluation methodologies of LoRa and LoRaWAN into three primary types: testbeds, simulations, and mathematical models. Their study highlights critical performance metrics such as coverage range, reliability, scalability, energy efficiency, and security, emphasizing the importance of these approaches in optimizing network performance for IoT applications, including smart cities, precision agriculture, and industrial monitoring. The review also identifies key challenges, such as scalability constraints, interference management, and energy efficiency. Furthermore, it outlines future research directions that aim to improve testing frameworks to enhance the overall efficiency of LoRa-based IoT systems.
In contrast, Almuhaya et al. [37] focus on simulation-based evaluations, providing a comparative analysis of key simulation tools for LoRa and LoRaWAN networks. Their review examines features such as licensing models, supported operating systems, programming languages, popularity, and version history. However, the study is limited to computer-based simulations and does not consider testbed implementations or mathematical modeling, which are essential for a comprehensive performance assessment of LoRa and LoRaWAN networks.
Building on the need for empirical validation, Pospisil et al. [38] introduce a security-focused LoRaWAN testbed, which enables practical security assessments under real-world conditions. Their study demonstrates vulnerabilities in on-air LoRaWAN communications, specifically to Man-in-the-Middle (MitM) attacks, such as replay and bit-flipping attacks. Utilizing Software-Defined Radio (SDR) and GNU Radio, they show how an attacker can intercept, decrypt, and manipulate LoRaWAN messages, including reconstructing encryption keys in specific scenarios.
Their findings reinforce the classification of testbeds by Alipio et al. as essential for evaluating LoRaWAN security and performance. The study highlights the pressing need for enhanced cryptographic mechanisms, robust key management, and real-time intrusion detection. Moreover, Pospisil et al.’s testbed-based approach provides an empirical validation of security threats, complementing simulation-based evaluations such as those reviewed by Almuhaya et al.
Furthermore, their study identifies practical mitigation strategies, including the transition to LoRaWAN 1.1, improved credential security, and real-time monitoring of malicious activities. By addressing real-world security threats, their research bridges the gap between theoretical vulnerabilities and practical exploitation, reinforcing the importance of testbed-driven security evaluations in IoT networks. Future work should explore extended security assessments for newer LoRaWAN versions and the integration of automated attack detection frameworks to improve network resilience.
Other notable testbeds include LinkLab [27], which offers a scalable and flexible infrastructure for IoT experimentation. LinkLab supports various devices, protocols (including LoRa), and operating systems, featuring a web-based Integrated Development Environment (WebIDE) for remote application development and debugging. With a distributed architecture and fine-grained multi-user access control, LinkLab facilitates multi-site scalability. Its 150+ connected devices have been used for various applications, including LoRaWAN-based data collection. Increasive compilation of testbeds and shared caching mechanisms significantly improve development efficiency, making it an integrated solution for IoT research.
Yousuf et al. [28] propose a cost-effective LoRaWAN testbed using commercial off-the-shelf hardware and open-source software. Deployed at the University of Calgary, their set-up includes custom-built gateways and end devices operating in the 915 MHz ISM band. Their extensive indoor and outdoor measurements demonstrate reliable communication even in challenging environments such as multistory concrete buildings and dense urban areas. The testbed achieves a coverage range of up to 4.4 km outdoors, with a low packet drop rate of 15% under optimal conditions. The study also highlights the influence of key network parameters, such as spread factor and payload size, on packet delivery ratio and airtime, offering valuable information on low-cost IoT deployment strategies.
Impagliazzo et al. [39] present an IoT testbed platform designed to support smart city applications within the Cagliari Digital Lab (CDL). The platform employs a microservice architecture based on the FIWARE framework, ensuring scalability, interoperability, and real-time data visualization through tools such as Grafana and CesiumJS. Key features include secure identity management using Keycloak and scalable data storage via MinIO. The testbed enables real-time data acquisition and analysis, fostering collaboration between academia and industry for urban innovation.
This platform can be complemented by a LoRaWAN-based monitoring testbed to extend its capabilities for large-scale, low-power IoT deployments. The long-range and energy-efficient communication of LoRaWAN makes it suitable for real-time monitoring in urban and rural areas. Integrating LoRaWAN gateways and FIWARE-compatible IoT agents would enable seamless data ingestion, while its built-in encryption ensures secure transmissions. Such an integration would enhance the platform’s ability to monitor environmental conditions, urban mobility, and infrastructure health, providing a comprehensive solution for smart city applications.
In summary, testbeds provide an essential framework for evaluating and optimizing LoRaWAN networks. They complement simulation-based studies by allowing real-world validation of network performance, security, and scalability. Future research should continue to integrate testbeds with simulation and modeling techniques to develop more robust and resilient IoT infrastructures.
3. Materials and Methods
3.1. Methodological Framework
The design and implementation of the proposed system follow an Internet of Things (IoT) development methodology, adapted from established design frameworks [20,40]. This structured approach ensures that all components, from sensor integration to data visualization, are addressed systematically. The aim is to enable automated real-time monitoring of uplink and downlink performance in LoRaWAN networks deployed in rural and urban environments of southern Ecuador.
The methodology is described in ten stages, described as follows:
- Purpose Definition: The system is designed to monitor and evaluate LoRaWAN link quality metrics in real time. This supports performance optimization, particularly in geographically challenging regions, by eliminating manual measurement tasks.
- Object Identification: The physical components include LoRaWAN end devices (RAK10701), a centralized gateway with LoRa antennas, geolocation modules, a dedicated server and power supply systems suitable for field deployment.
- Data Specification: Key parameters collected include RSSI, SNR, transmission power, data rate, spreading factor, antenna height, and GPS coordinates. These are stored with time-stamps for detailed analysis of uplink and downlink communication.
- Service Definition: The system provides real-time monitoring, data logging, bidirectional link evaluation, georeferenced visualization, and customizable configuration profiles for testing scenarios.
- Network Design: Communication is established on a LoRaWAN architecture. The end devices transmit data to the gateway, which forwards information to the server via TCP/IP using the MQTT protocol. Fixed and mobile probes are supported.
- Data Storage Design: A MySQL database is implemented on a server configured with a fixed IP address. Data are securely transmitted using TLS-encrypted MQTT connections and stored for analysis and visualization.
- Application Interface: A Grafana-based dashboard was developed for visualization and monitoring of real-time performance metrics. The system also supports interactive georeferencing for spatial analysis of device behavior.
- Business Model Considerations: The system is scalable and low cost, making it suitable for adoption in smart agriculture, environmental monitoring, and rural IoT deployments. It supports government and academic initiatives aimed at improving connectivity and data-driven decision making in remote areas.
- Security Mechanisms: TLS certificates ensure secure data transmission. User access is restricted through authentication mechanisms and proper MQTT topic management.
- Prototype Development: A complete hardware and software testbed was developed and deployed. The prototype includes the RAK10701 device configured via the RUI3 firmware, a centralized server running Mosquitto, MySQL, and Grafana, and a gateway with multiple connectivity interfaces.
This structured methodology facilitates a robust and scalable implementation of real-time network monitoring in LoRaWAN environments and ensures reproducibility and adaptability for future expansions.
4. System Implementation
The automation architecture of the LoRaWAN system, shown in Figure 2, is organized into three main components: the gateway, the end devices, and the server. This architecture is designed to ensure efficient, reliable, and scalable network operation through the integration of robust hardware and software components.
For the implementation of the automation system, various hardware elements are utilized, including power supply systems, communication modules, and antennas. Each component plays a crucial role in maintaining network stability and performance and is described in detail below.
4.1. Components of the Architecture
- Server: The server consists of a computer running the Windows Server operating system, configured with a fixed IP address accessible via the MQTT and HTTPS protocols. Its primary responsibilities include managing the database, providing real-time data visualization, and ensuring secure communication. The server hardware specifications include an Intel Xeon E5640 processor at 2.67 GHz, 6 GB of RAM, and 500 GB of storage. TLS certificates, generated using OpenSSL, are used to encrypt data transmissions and safeguard network integrity.
-
Gateway: The gateway integrates several components, including geolocalization antennas, LoRa antennas, a processing unit, and a storage system. The RAK Wireless omnidirectional antenna operates within a frequency range of , has a gain of , and vertical polarization, making it ideal for outdoor use.The gateway acts as the central node, receiving data from end devices and forwarding them to the server for processing. It enforces network policies, manages security, and ensures data integrity, preventing losses, and guaranteeing reliable communication. With robust processing capabilities, the gateway efficiently handles large data volumes, performs filtering, and routes messages. Its connectivity options, including Ethernet, WiFi, and cellular interfaces, directly influence data transmission speed and reliability.
4.2. Software Implementation
The software configuration is essential to achieve optimal LoRaWAN network performance. This subsection outlines the setup implemented for the server, gateway, and end devices.
Server
The server hosts essential software services, including:
- Mosquitto: A lightweight MQTT broker that facilitates efficient real-time communication between IoT devices. Its low resource requirements make it well suited for constrained environments.
- MySQL: An open-source relational database management system to store, manage, and query large datasets. Its scalability and reliability make it ideal for both small- and large-scale applications.
- Grafana: A data analysis and visualization platform used to monitor network performance in real time. Grafana’s customizable dashboards and alerting features make it a powerful tool for tracking critical metrics.
MQTT Client
An MQTT client application was developed using the .NET framework and C# programming language. As shown in Figure 3, the application monitors specific MQTT topics, decodes the data frames received from the end devices, and stores the results in the database for further analysis.
End Device:
The end device, labeled RAK10701 in Figure 2, is a LoRaWAN network tester optimized for evaluating network deployments. Developed using the RUI3 framework by RAKWireless, the device supports various operating modes for data collection in various environments. The flow chart of the main menu (Figure 4) illustrates the device’s configuration options, allowing users to select operational modes tailored to specific network testing requirements.
4.3. System Testing and Monitoring
The end device performs tests for both fixed and mobile probes. Table 2 summarizes the monitored parameters, such as transmission power, data rate, antenna height, and number of retries for link testing. For mobile probes, additional metrics, such as vehicle velocity, are included to enhance data collection accuracy.
The flow chart described in Figure 5 defines the operation of the system to track the main signal parameters in both Uplink and Downlink. It enables statistical analysis and monitoring of the end device in static or mobile testbed configurations.
The data frame used to transmit LoRaWAN network statistics is a binary encoded information packet. Depending on the configuration, it may be divided into two frames or contained within a single frame. This packet encapsulates all the essential information for monitoring and evaluating network performance, including metrics such as RSSI, SNR, and network connection failures.
5. Results
This section presents an analysis of the experimental testing process conducted to evaluate the functionality and performance of the data collection automation system. These tests were critical to validating both the system infrastructure and its ability to collect, process and transmit data under real-world conditions.
The experimental results confirmed the effectiveness of the automation software in managing measurement tasks, ensuring that data collection could be carried out reliably and without the need for manual intervention. This validation highlights the robustness of the proposed system in maintaining efficient and accurate operation in diverse deployment scenarios.
In the following, the results corresponding to the configurable parameters provided by the software in the mode testing and field testing configurations are described.
5.1. Mode Testing
-
Sweep Tests Configuration: During the sweep tests, the implemented modes and data transmission performance under various configurations were evaluated on the end devices. The results of this evaluation are presented in Figure 6, where each configuration was tested using a sweep of five samples. The tests were conducted at transmission power levels of 20, 10, and 2 dBm, with data rate (DR) values of 0, 1, 2, and 3.Figure 6. Sweep test results configuration at the end device.
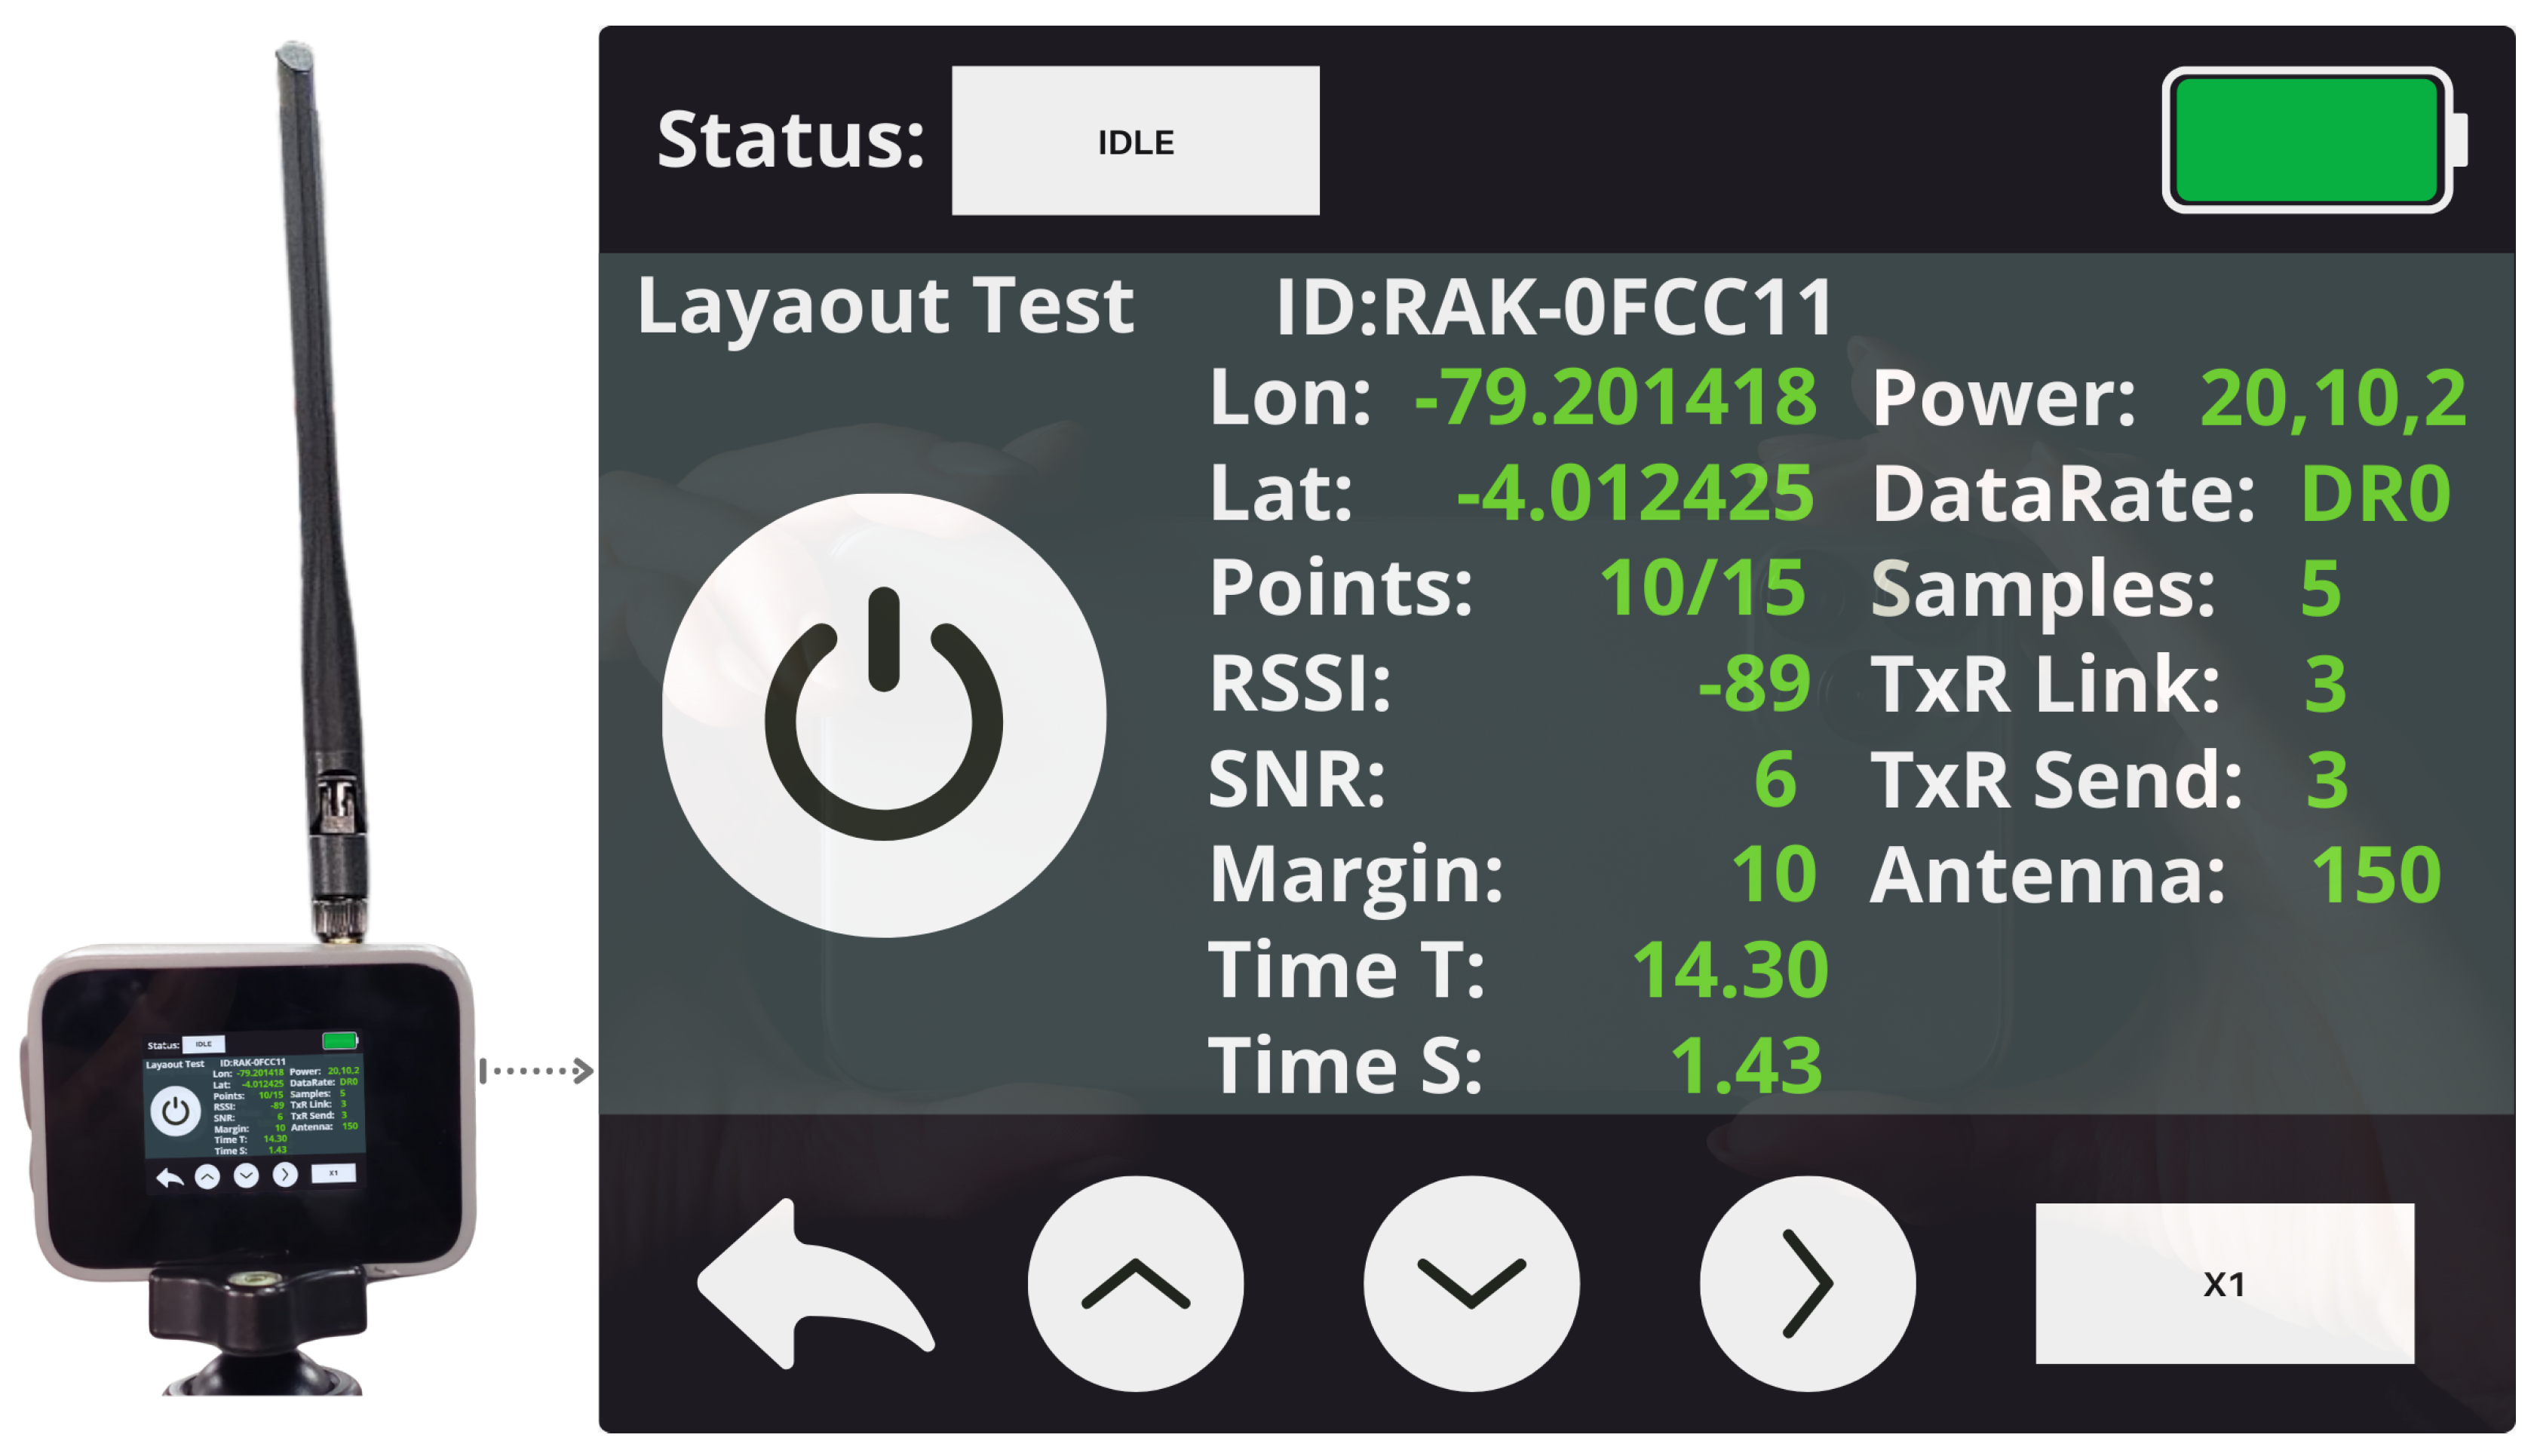 As a result, it was verified that the power sweeps at 20 dBm and 10 dBm were executed successfully, while all tests conducted at 2 dBm failed. This is evident in Figure 6, specifically in the "Points" section, where only ten tests of a total of fifteen were completed.
 -
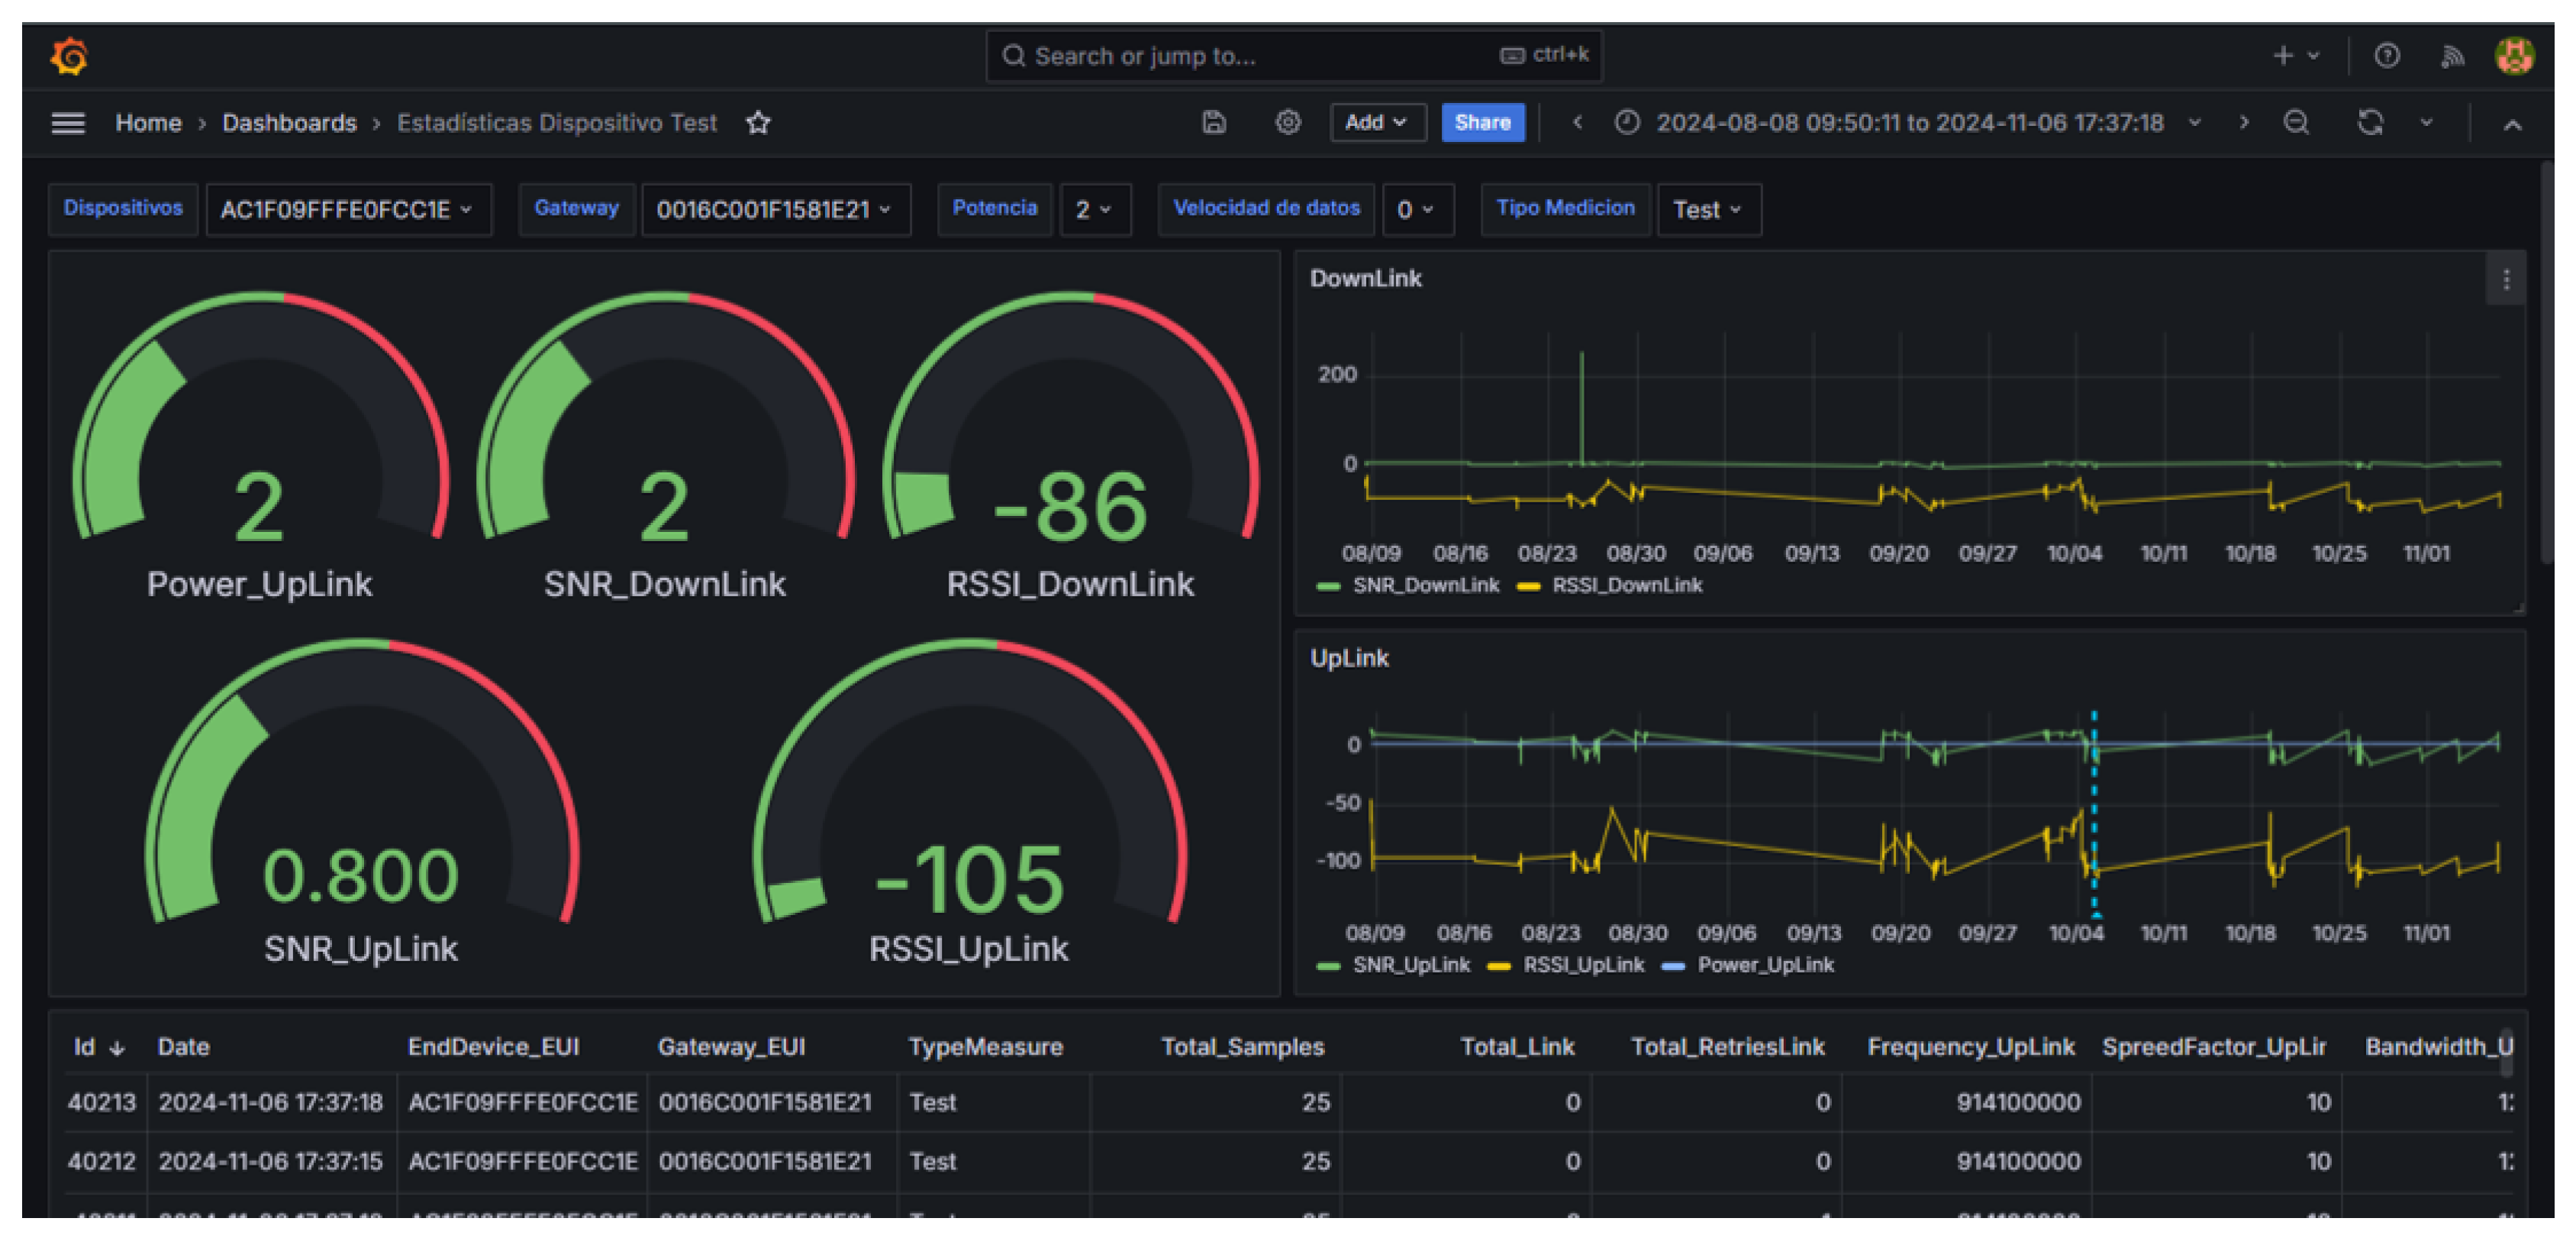
Link Performance Monitoring (LPM): Figure 7 presents the main dashboard design in the analyzer room, which provides a comprehensive visualization of the measured parameters in the uplink and downlink testbed. The software integrates gauge indicators for real-time monitoring and a time-series representation to analyze signal variations over time. This visualization highlights key metrics such as SNR, RSSI, and transmitted Power in the uplink, which are crucial for propagation model characterization and for assessing the reliability and performance of the communication link. Additionally, the dashboard can be customized to display other relevant parameters based on the specific requirements of the study.The time-series data collected can be recorded in a database for post-processing, specifically designed for the analysis of the propagation model using real-world data. This information can then be analyzed to optimize network performance, including adjusting the gateway location to enhance coverage and improve overall connectivity.Figure 7. Main dashboard displaying uplink and downlink statistics simultaneously.
-
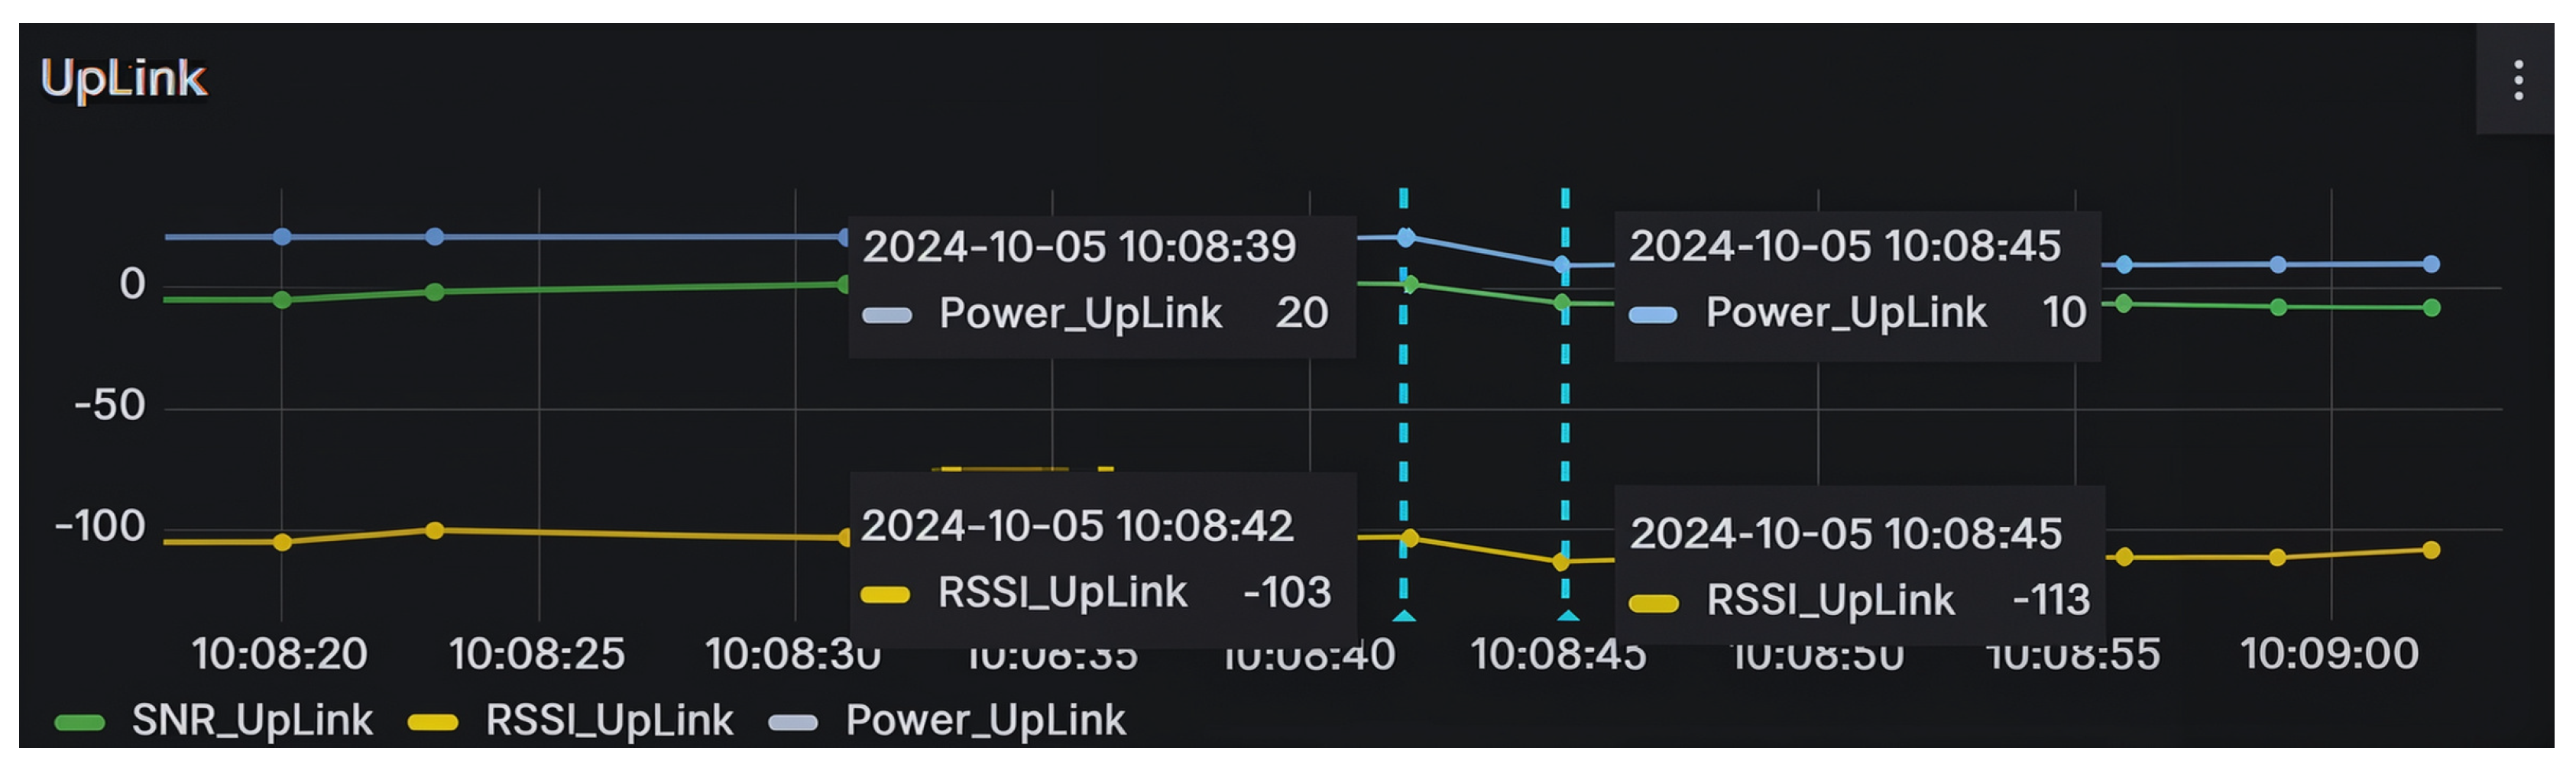
Tracking of the Set Tests: The tracking of signal parameters over time is illustrated in Figure 8, which presents the results of the tracking system using a time-series representation. This figure clearly depicts the transmission power sweep from 20 dBm to 10 dBm. Consequently, the signal strength, represented by the Received Signal Strength Indicator (RSSI), decreases from -103 dBm to -113 dBm, reflecting the expected attenuation in received signal power as the transmission power is reduced.Another critical parameter for evaluating signal quality is the Signal-to-Noise Ratio (SNR), shown as the green line in Figure 8. The SNR quantifies signal clarity relative to background noise and is essential for assessing the reliability and efficiency of the communication link.The tracking of parameters is performed in both the downlink and the uplink, which is one of the tool’s key strengths. This capability is particularly notable, as most existing tools analyze only the downlink. By enabling monitoring in both directions, a more comprehensive assessment of system performance is achieved, providing deeper insights into network behavior and facilitating more effective optimizations.Figure 8. Tracking of the set parameters in uplink.
-
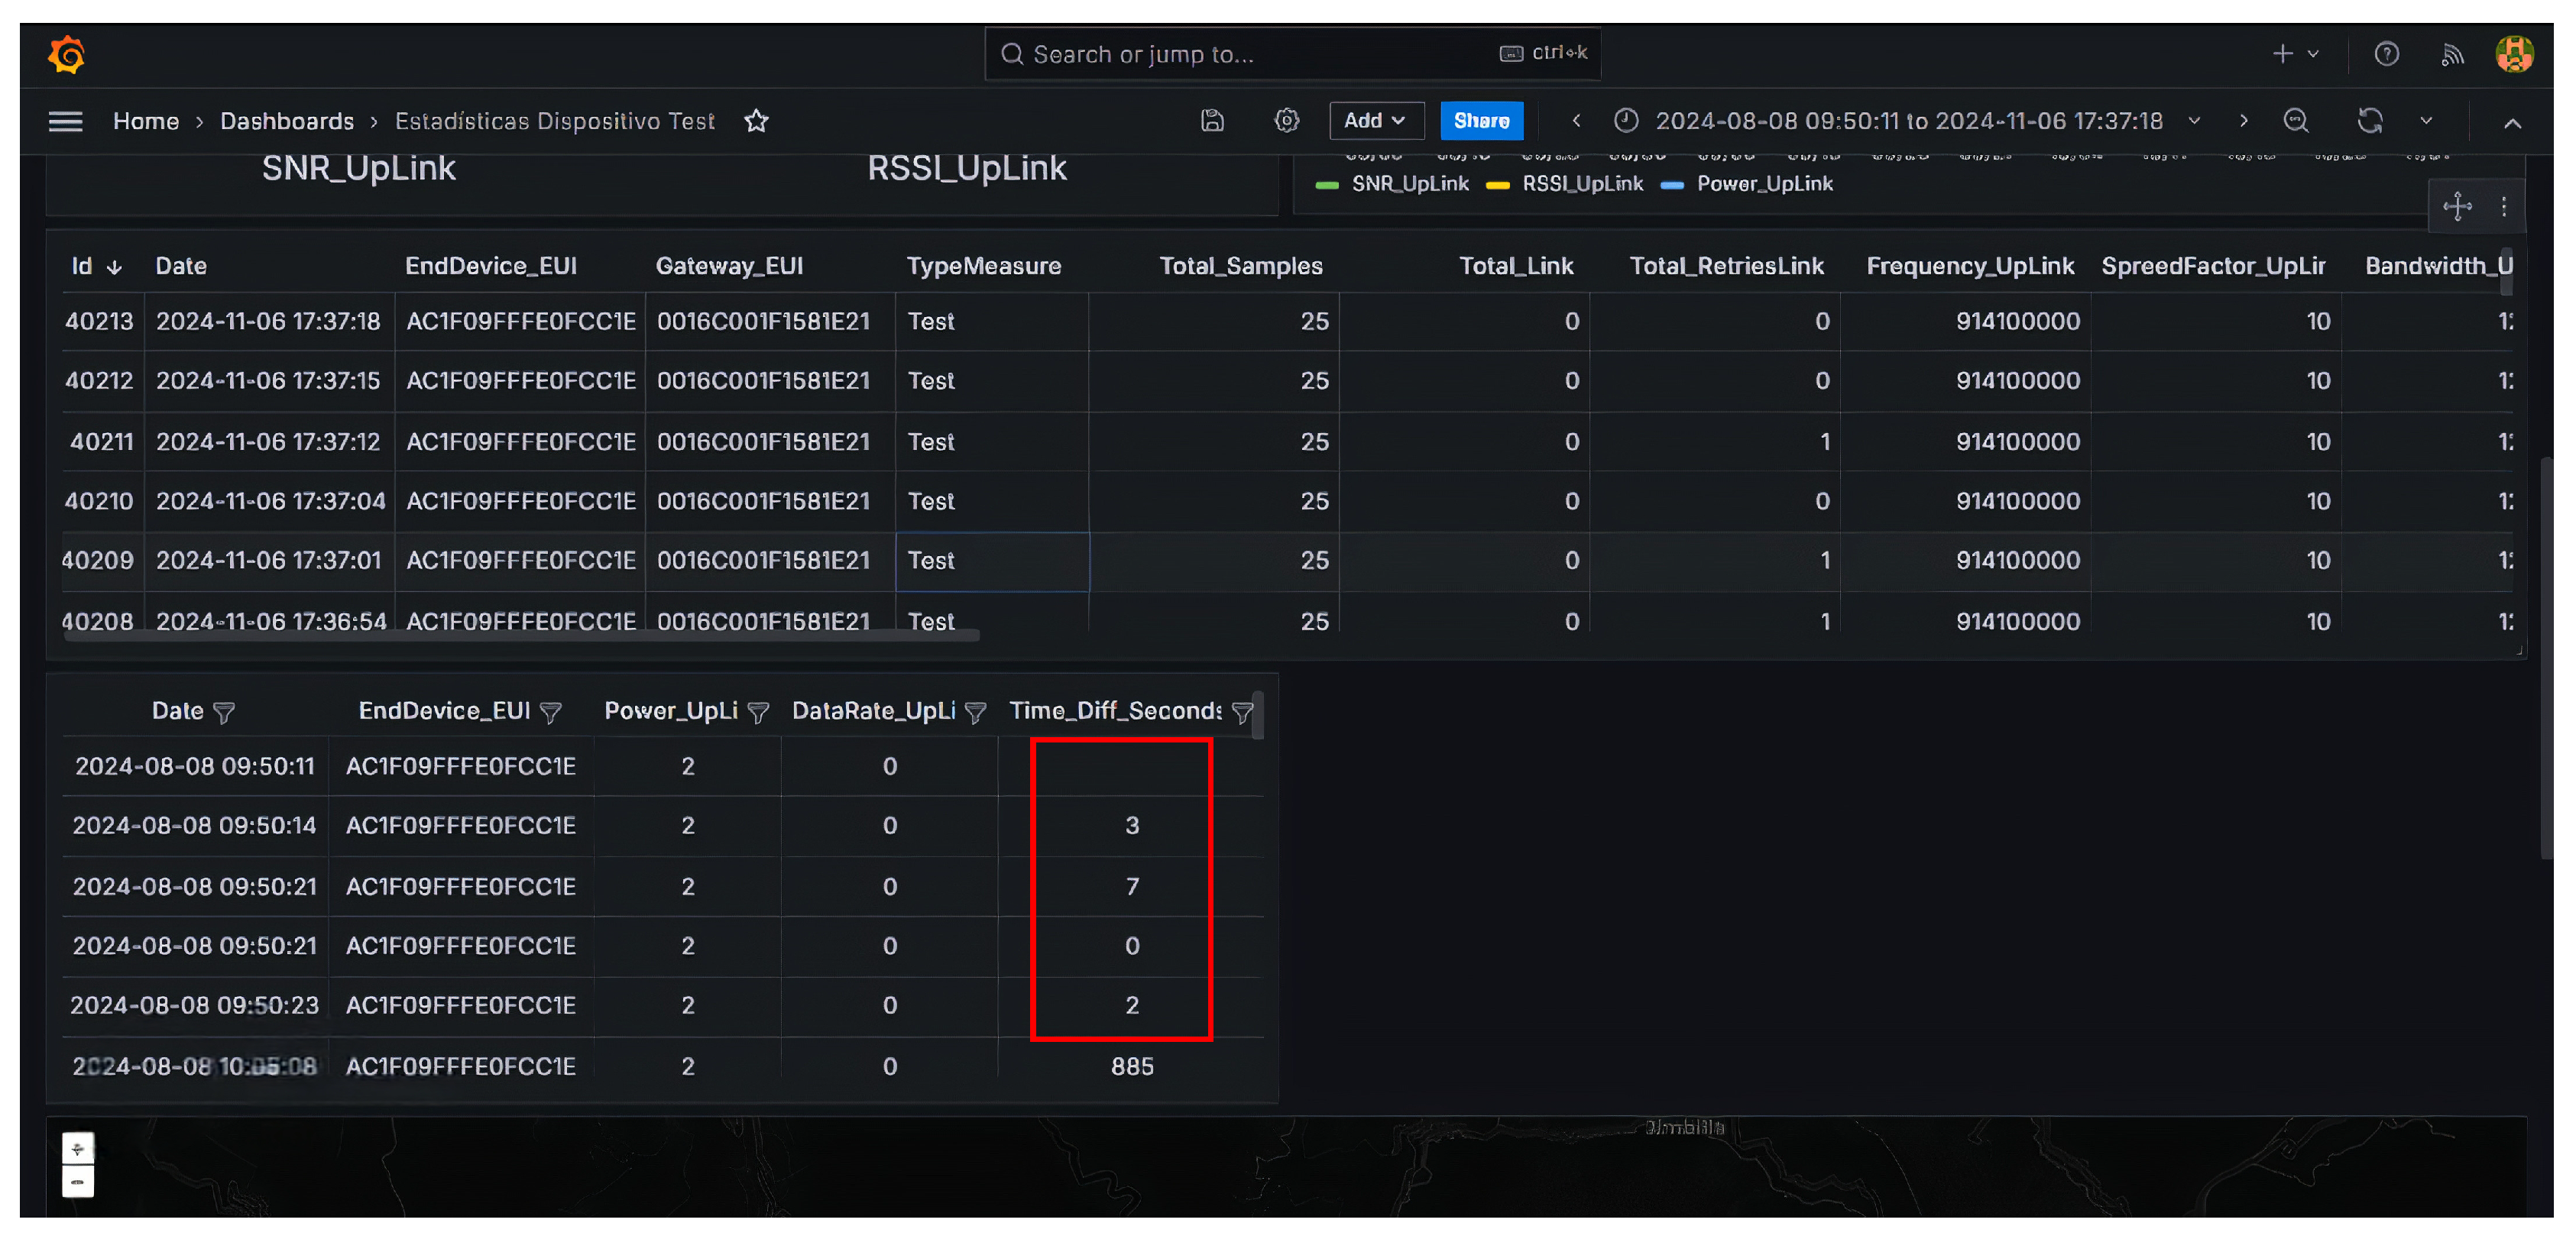
Time measuraents: Due to the minimum time intervals required by LoRaWAN between consecutive data transmissions, which is approximately 1 second, an observed variation of 3 to 5 seconds occurs between successive samples. This variation arises from factors such as network latency, duty cycle limitations, and channel access constraints imposed by the ALOHA-based medium access mechanism of LoRaWAN.This behavior is illustrated in Figure 9, where the elapsed time between successive data receptions is computed relative to the previous reading. The results provide a representative value for a realistic deployment scenario, highlighting the inherent variability in transmission timing due to network congestion, adaptive data rate (ADR) mechanisms, and environmental interference.Figure 9. Comparison of times between different data rates
5.2. Field Testing
The field tests were conducted in two different environments: a controlled area within the university and an open soccer field in a suburban area of Loja City. The testing procedure was as follows: first, the synchronization between the end devices and the gateway was verified. The network parameters, including spreading factor (SF), transmission power, and bandwidth, were then configured accordingly. The gateway was placed at a height of 2.10 m, while the end devices were placed at a height of 1.5 m. A photograph of the experimental setup is presented in Figure 10.
The automation component of the system was analyzed for its behavior during periodic measurements of parameters such as signal strength (RSSI) and signal-to-noise ratio (SNR). The measurements were then transmitted to the server for processing. The collected data were visualized in real time using Grafana, which enabled the identification of any issues in data transmission or system configuration. Through this process, it was verified that the data collected by the end devices were accurately stored and processed on the server.
Based on the collected data and the real-world measurements, a variation of 1 to 3 meters was observed between the actual distances and the distances reported by the end device, as shown in Figure 11.
The software platform developed for the LoRaWAN network provides real-time monitoring and visualization of key network parameters. As shown in Figure 12, the dashboard displays crucial metrics obtained from the end device, enabling efficient analysis and decision making for network optimization. The primary parameters include the following.
- Signal-to-Noise Ratio (SNR): The SNR value, shown as 6 on the dashboard Figure 6, indicates the clarity of the signal relative to background noise. A higher SNR value represents better communication quality, ensuring reliable data transmission.
- Velocity: The velocity metric shown in Figure 7, displayed as 0 in this case, tracks the movement of the end device. This parameter is particularly useful for mobile applications or probes that monitor dynamic environments.
- Spreading Factor (SF): The Spread Factor shown in Figure 7, set to 10, determines the duration of the LoRaWAN transmission. A higher SF provides greater coverage at the cost of lower data rates, making this a critical parameter for network optimization in wide-area deployments.
- Received Signal Strength Indicator (RSSI): The RSSI, in Figure 6 measured at -86 dBm, reflects the strength of the signal received at the gateway. This metric is essential for assessing link quality and ensuring adequate coverage in the network.
- Transmission Power: The transmission power in Figure 6, indicated as 2 dBm, shows the current power level used by the end device. Adjusting this parameter allows for efficient energy usage while maintaining reliable communication.
These parameters are presented through a clean and interactive dashboard, as illustrated in Figure 7, allowing network administrators to monitor system performance in real time. Furthermore, the dashboard supports georeferencing capabilities, shown in Figure 12, which facilitate a comprehensive spatial analysis of each end device. The intuitive visualization helps identify potential problems immediately, such as weak signal strength, low signal-to-noise ratio (SNR), or incorrect configuration parameters, thus supporting timely intervention and ensuring optimal network performance.
6. Discussion
The results obtained from the proposed automated system for the acquisition of real-time link data at LoRaWAN base stations demonstrate its effectiveness in optimizing network performance. The system successfully automates the monitoring and recording of key parameters, including RSSI, SNR, and transmission power, for uplink and downlink communications.
As illustrated in Figure 12, these parameters are visualized through a dedicated and interactive dashboard, providing valuable information on network conditions. Furthermore, the system was evaluated in a broader deployment scenario that included the city of Loja, where the Universidad Técnica Particular de Loja (UTPL) served as a central reference point. This extended analysis, which covers a complex urban environment, is shown in Figure 13, and demonstrates the robustness of the solution under various real-world conditions.
Compared to traditional manual measurement methodologies, the proposed system significantly improves data acquisition efficiency by eliminating human intervention and reducing measurement errors. The evaluated nodes and link parameters presented in Figure 13 validate the system’s capability to support reliable transmission analysis.
Although existing testbeds provide valuable support for the development of IoT applications, the design, implementation, and testing of such systems remain complex and time consuming [27]. By enabling automated collection of time series data, the system facilitates in-depth analysis of network behavior and supports informed decision-making for optimizing gateway placement and transmission configurations.
One of the primary strengths of the system is its ability to track and log link statistics in real time, improving the evaluation of LoRaWAN coverage under various environmental conditions. Field tests carried out in controlled and open environments validated the performance of the system in varying deployment scenarios, as illustrated in Figure 10. The results show that transmission power and spreading factor configurations significantly influence communication reliability, especially in regions with challenging topography and interference.
Despite these advantages, certain limitations were observed. The performance of the system can be affected by the duty cycle regulations imposed by LoRaWAN standards, potentially introducing latency in data transmission. In addition, network congestion and adaptive data rate (ADR) mechanisms can lead to variability in link quality measurements.
Future enhancements could involve the integration of predictive analytics and machine learning algorithms to dynamically adapt network parameters in real time, thereby increasing operational efficiency. This need for adaptive optimization was demonstrated in the sweep test shown in Figure 6.
The findings of this study align with previous research on LoRaWAN performance evaluation [27,36], confirming the importance of automated tools for monitoring and optimizing IoT networks. The ability to systematically collect and analyze link quality metrics positions the system as a valuable tool for large-scale IoT deployments, particularly in applications such as precision agriculture, environmental monitoring, and industrial automation.
In this context, it is pertinent to compare our system with the work of Povalac et al. [31], which also addresses the evaluation of the LoRaWAN network but from a different perspective. Povalac et al. proposed a passive traffic monitoring approach using a custom sniffer system deployed in four European cities. Their work focuses on capturing uplink, downlink and Class-B beacon traffic to analyze protocol compliance, security vulnerabilities, and synchronization capabilities via Class-B beacons.
In contrast, our research presents a fully automated real-time data acquisition framework designed for urban and rural deployments in southern Ecuador. The architecture leverages MQTT, MySQL, and Grafana to continuously monitor network performance metrics with minimal human intervention. Although Povalac et al. offer a broad protocol-level assessment and contribute an open data set for the research community, our work emphasizes practical field deployment and live monitoring under geographically and topographically diverse conditions.
These two approaches are complementary. Povalac et al. provide insight into large-scale network behavior and protocol adherence, whereas our system offers a scalable operational tool for real-time diagnostics and performance optimization in remote or rural settings. Together, these efforts contribute to the advancement of the robustness, scalability, and reliability of LoRaWAN-based IoT applications.
In general, the proposed system offers a scalable and efficient solution for LoRaWAN link monitoring, representing a meaningful contribution to the field of IoT network management and performance optimization.
7. Conclusions
The development and deployment of an automated system to evaluate LoRaWAN network coverage have demonstrated significant efficiency and precision. The proposed solution provides real-time data collection and analysis, representing a substantial improvement over conventional manual measurement approaches. By automating the coverage assessment process, the system minimizes human intervention, reducing measurement time, and mitigating errors associated with manual data acquisition.
The system’s integration of open communication protocols, such as MQTT, enhances its interoperability with diverse IoT platforms, making it highly adaptable across various applications and environments. Its scalability allows for deployment in diverse scenarios, from urban environments with high device density to remote rural areas where connectivity challenges persist. Furthermore, field tests revealed that signal quality in densely populated regions is often compromised by interference, highlighting the importance of adaptive network configurations.
Despite these advancements, certain limitations remain. Regulatory constraints, such as duty cycle restrictions, introduce unavoidable delays in data transmission. In addition, network congestion and Adaptive Data Rate (ADR) mechanisms contribute to fluctuations in link quality measurements. To address these issues, future research should explore the incorporation of predictive analytics and machine learning techniques to dynamically adjust network parameters, thus improving network efficiency and resilience.
This study underscores the critical role of automated tools in optimizing LoRaWAN deployments. By enabling large-scale data collection and analysis, the proposed system serves as a valuable tool for IoT applications requiring extensive coverage, such as smart agriculture, environmental monitoring, and industrial automation. Future work should focus on integrating multigateway architectures and hybrid LPWAN technologies to further improve network robustness and scalability. In addition, the implementation of advanced data visualization frameworks will improve real-time decision-making and operational efficiency.
In conclusion, this research contributes to a scalable and efficient solution for LoRaWAN network monitoring, advancing the state of IoT network management, and providing a robust foundation for future improvements in wireless communication technologies.
Author Contributions
All the authors have contributed to various degrees to ensuring the quality of this work: “Conceptualization, M.Q.C., L.C.E. and H.J.S.; methodology, M.Q.C.; software, H.J.S. and S.Q.C; validation, E.B.S. and M.Q.C; formal analysis, C.C.B., E.B.S. and M.Q.C.; investigation, H.J.S, M.Q.C, E.B.S. and C.C.B; resources, M.Q.C.; data curation, M.Q.C. and E.B.S.; writing—original draft preparation, H.J.S. and M.Q.C; writing—review and editing, C.C.B., M.Q.C, E.B.S.,H.J.S., S.Q.C. and L.C.E.; visualization, C.C.B.; supervision, M.Q.C.; project administration, M.Q.C. and E.B.S; funding acquisition, M.Q.C. All authors have read and agreed to the published version of the manuscript.”
Funding
Carlos Carrión Betancourt is supported in part by the Coordenação de Aperfeiçoamento de Pessoal de Nível Superior, Brasil (CAPES), with Finance Code 001, and the Secretary of Science and Technology of Ecuador (SENESCYT), with Contract Number 2015-AR7L7856.
Acknowledgments
The authors would like to thank the Universidad Técnica Particular de Loja (UTPL), Ecuador, for its invaluable support in providing the resources and facilities necessary for the successful development of this research. This work was developed within the framework of the project "Chapak: Sistema avanzado de vigilancia y control para zonas remotas mediante Tecnologías Emergentes" (project code: PROY_PROY_ARTIC_CE_2022_3668), funded by UTPL through the "Convocatoria de Proyectos 2022". We extend our gratitude to UTPL and all collaborators for their significant contributions.
Conflicts of Interest
“The authors declare no conflicts of interest.”
Abbreviations
The following abbreviations are used in this manuscript:
| MDPI | Multidisciplinary Digital Publishing Institute |
| ADR | Adaptive Data Rate |
| AWGN | Additive White Gaussian Noise |
| CSS | Chirp Spread Spectrum |
| DR | Data Rate |
| GPS | Global Positioning System |
| IoT | Internet of Things |
| LoRa | Long Range |
| LPWAN | Low Power Wide Area Network |
| WMNS | Wireless Multimedia Network Sensor |
| MQTT | Message Queuing Telemetry Transport |
| NB-IoT | Narrowband Internet of Things |
| PDR | Packet Delivery Ratio |
| QoS | Quality of Service |
| RSSI | Received Signal Strength Indicator |
| SF | Spreading Factor |
| SNR | Signal-to-Noise Ratio |
| TDOA | Time Difference of Arrival |
| WSN | Wireless Sensor Network |
References
- Syed, A.S.; Sierra-Sosa, D.; Kumar, A.; Elmaghraby, A. IoT in Smart Cities: A Survey of Technologies, Practices and Challenges. Smart Cities 2021, 4, 429–475. [Google Scholar] [CrossRef]
- Safi, H.; Jehangiri, A.I.; Ahmad, Z.; Ala’anzy, M.A.; Alramli, O.I.; Algarni, A. Design and Evaluation of a Low-Power Wide-Area Network (LPWAN)-Based Emergency Response System for Individuals with Special Needs in Smart Buildings. Sensors 2024, 24, 3433. [Google Scholar] [CrossRef] [PubMed]
- Zhou, Q.; Zheng, K.; Hou, L.; Xing, J.; Xu, R. Design and Implementation of Open LoRa for IoT. IEEE Access 2019, 7, 100649–100657. [Google Scholar] [CrossRef]
- El Chall, R.; Lahoud, S.; El Helou, M. LoRaWAN Network: Radio Propagation Models and Performance Evaluation in Various Environments in Lebanon. IEEE Internet of Things Journal 2019, 6, 2366–2378. [Google Scholar] [CrossRef]
- Sarker, V.K.; Queralta, J.P.; Gia, T.N.; Tenhunen, H.; Westerlund, T. A Survey on LoRa for IoT: Integrating Edge Computing. In Proceedings of the 2019 Fourth International Conference on Fog and Mobile Edge Computing (FMEC), 2019; pp. 295–300. [Google Scholar] [CrossRef]
- Andrade, R.O.; Yoo, S.G. A Comprehensive Study of the Use of LoRa in the Development of Smart Cities. Applied Sciences 2019, 9, 4753. [Google Scholar] [CrossRef]
- Tsouros, D.C.; Mitsios, S.B.; Lytras, T.K. A survey on the use of unmanned aerial vehicles for precision agriculture. Computers and Electronics in Agriculture 2019, 164, 111–121. [Google Scholar] [CrossRef]
- Raza, U.; Kulkarni, P.; Sooriyabandara, M. Low power wide area networks: An overview. IEEE Commun. Surveys Tuts. 2017, 19, 855–873, 2nd Quart. [Google Scholar] [CrossRef]
- de Carvalho Silva, J.; Rodrigues, J.J.P.C.; Alberti, A.M.; Solic, P.; Aquino, A.L.L. LoRaWAN—A low power WAN protocol for Internet of Things: A review and opportunities. In Proceedings of the Proc. 2nd Int. Multidisciplinary Conf. Comput. Energy Sci. (SpliTech), Split, Croatia, Jul. 2017; pp. 1–6. [Google Scholar]
- Mekkia, K.; Bajica, E.; Chaxela, F.; Meyerb, F. A comparative study of LPWAN technologies for large-scale IoT deployment. ICT Exp. 2018, 5, 1–7. [Google Scholar] [CrossRef]
- Finnegan, J.; Brown, S. A Comparative Survey of LPWA Networking. arXiv preprint 2018. [Online]. Available online: https://arxiv.org/abs/1802.04222.
- Barro, P.A.; Zennaro, M.; Degila, J.; Pietrosemoli, E. A Smart Cities LoRaWAN Network Based on Autonomous Base Stations (BS) for Some Countries with Limited Internet Access. Future Internet 2019, 11, 93. [Google Scholar] [CrossRef]
- Haartsen, J.C. Bluetooth Radio System. In Wiley Encyclopedia of Telecommunications; John Wiley & Sons, Inc.: Hoboken, NJ, USA, 2003. [Google Scholar] [CrossRef]
- Crow, B.; Widjaja, I.; Kim, J.; Sakai, P. IEEE 802.11 Wireless Local Area Networks. IEEE Commun. Mag. 1997, 35, 116–126. [Google Scholar] [CrossRef]
- Farahani, S. ZigBee Wireless Networks and Transceivers; Elsevier Science & Technology Books: San Diego, CA, USA, 2008; p. 339. [Google Scholar]
- Johnston, S.; Basford, P.; Bulot, F.; Apetroaie-Cristea, M.; Easton, N.; Davenport, C.; Foster, G.; Loxham, M.; Morris, A.; Cox, S. City Scale Particulate Matter Monitoring Using LoRaWAN Based Air Quality IoT Devices. Sensors 2019, 19, 209. [Google Scholar] [CrossRef] [PubMed]
- Basford, P.J.; Bulot, F.M.J.; Apetroaie-Cristea, M.; Cox, S.J.; Ossont, S.J. LoRaWAN for Smart City IoT Deployments: A Long Term Evaluation. Sensors 2020, 20. [Google Scholar] [CrossRef] [PubMed]
- Yim, D.; et al. An experimental LoRa performance evaluation in tree farm. In Proceedings of the 2018 IEEE Sensors Applications Symposium (SAS), March 2018. [Google Scholar]
- Mdhaffar, A.; Chaari, T.; Larbi, K.; Jmaiel, M.; Freisleben, B. IoT-based health monitoring via LoRaWAN. In Proceedings of the IEEE EUROCON 2017 -17th International Conference on Smart Technologies, 2017; pp. 519–524. [Google Scholar] [CrossRef]
- Cabezas, M.P.; Carvajal, J.D.; Vivas, F.Y.; Lopez, D.M. Smart Monitoring System for Temperature and Relative Humidity Adapted to the Specific Needs of the Colombian Pharmaceutical Service. IoT 2025, 6. [Google Scholar] [CrossRef]
- Aldhaheri, L.; Alshehhi, N.; Manzil, I.I.J.; Khalil, R.A.; Javaid, S.; Saeed, N.; Alouini, M.S. LoRa Communication for Agriculture 4.0: Opportunities, Challenges, and Future Directions. IEEE Internet of Things Journal 2024, 1–1. [Google Scholar] [CrossRef]
- Ministerio de Agricultura y Ganadería. Más de 6,000 jóvenes participarán en la primera escuela de emprendimiento del MAG, 2024. Accessed: 2024-12-08.
- Zaragoza-Esquerdo, M.; Parra, L.; Sendra, S.; Lloret, J. LoRa Video Streaming in Rural Wireless Multimedia Sensor Networks. In Proceedings of the 2024 19th International Symposium on Wireless Communication Systems (ISWCS), 2024; pp. 1–6. [Google Scholar] [CrossRef]
- Nurbay, T.; Kasenov, S.; Yeltay, A.; Zorbas, D. Cooperative Transmission of Large Files Over LoRa in Multimedia loT Networks. In Proceedings of the 2024 IEEE International Black Sea Conference on Communications and Networking (BlackSeaCom), 2024; pp. 153–158. [Google Scholar] [CrossRef]
- Bañez, J.H.A.; Pepino, L.M.R.; Dimayuga, P.G.M.; Arada, G.P.; Limpengco, D.A.G. LoRa on the Bus: Time and Location Monitoring System for Point-to-Point Buses. In Proceedings of the 2023 International Conference on Innovation and Intelligence for Informatics, Computing, and Technologies (3ICT), 2023; pp. 249–254. [Google Scholar] [CrossRef]
- Griva, A.I.; Boursianis, A.D.; Wan, S.; Sarigiannidis, P.; Psannis, K.E.; Karagiannidis, G.; Goudos, S.K. LoRa-Based IoT Network Assessment in Rural and Urban Scenarios. Sensors 2023, 23, 1695. [Google Scholar] [CrossRef] [PubMed]
- Gao, Y.; Zhang, J.; Guan, G.; Dong, W. LinkLab: A Scalable and Heterogeneous Testbed for Remotely Developing and Experimenting IoT Applications. In Proceedings of the 2020 IEEE/ACM Fifth International Conference on Internet-of-Things Design and Implementation (IoTDI), 2020; pp. 176–188. [Google Scholar] [CrossRef]
- Yousuf, A.M.; Rochester, E.M.; Ghaderi, M. A low-cost LoRaWAN testbed for IoT: Implementation and measurements. In Proceedings of the 2018 IEEE 4th World Forum on Internet of Things (WF-IoT), 2018; pp. 361–366. [Google Scholar] [CrossRef]
- Instituto Nacional de Estadística y Censos (INEC). 35.079 personas más viven en la provincia de Loja, 2024. Accessed: 2024-12-13.
- Prefectura de Loja. Nuestra Provincia - Prefectura de Loja, 2024. Accessed: 2024-12-13.
- Povalac, A.; Kral, J.; Arthaber, H.; Kolar, O.; Novak, M. Exploring LoRaWAN Traffic: In-Depth Analysis of IoT Network Communications. Sensors 2023, 23, 7333. [Google Scholar] [CrossRef] [PubMed]
- Chasque, A.A.A. Estudio de la tecnología Lora, LPWAN (Low Power Wide Area Network) para cubrir la zona urbana de la ciudad de Quito. Master’s thesis, Escuela Politécnica Nacional, Quito, Ecuador, 2022. Accessed: 2024-12-15.
- Ruz Nieto, A. Simulación realista de comunicaciones IoT en entornos urbanos. Master’s thesis, Universidad Politécnica de Cartagena, 2021. Accessed: 2024-12-13.
- Faber, M.J.; van der Zwaag, K.M.; dos Santos, W.G.V.; Rocha, H.R.d.O.; Segatto, M.E.V.; Silva, J.A.L. A Theoretical and Experimental Evaluation on the Performance of LoRa Technology. IEEE Sensors Journal 2020, 20, 9480–9489. [Google Scholar] [CrossRef]
- Onykiienko, Y.; Popovych, P.; Mitsukova, A.; Beldyagina, A.; Yaroshenko, R. LoRa Evaluation for University Campus in Urban Conditions. In Proceedings of the 2021 IEEE 4th International Conference on Advanced Information and Communication Technologies (AICT), 2021; pp. 98–101. [Google Scholar] [CrossRef]
- Alipio, M.; Bures, M. Current Testing and Performance Evaluation Methodologies of LoRa and LoRaWAN in IoT Applications: Classification, Issues, and Future Directives. Internet of Things 2024, 25, 101053. [Google Scholar] [CrossRef]
- Almuhaya, M.A.M.; Jabbar, W.A.; Sulaiman, N.; Abdulmalek, S. A Survey on LoRaWAN Technology: Recent Trends, Opportunities, Simulation Tools and Future Directions. Electronics 2022, 11. [Google Scholar] [CrossRef]
- Pospisil, O.; Fujdiak, R.; Mikhaylov, K.; Ruotsalainen, H.; Misurec, J. Testbed for LoRaWAN Security: Design and Validation through Man-in-the-Middle Attacks Study. Applied Sciences 2021, 11. [Google Scholar] [CrossRef]
- Impagliazzo, C.; Cabianca, M.; Clemente, M.L.; Siddi Moreau, G.; Vocale, M.; Leoni, L. A Testbed Platform to Support an IoT City Lab. IoT 2024, 5, 35–57. [Google Scholar] [CrossRef]
- Dadhich, P. IoT Design Methodology. https://www.drpankajdadhich.com/2022/06/lot-designmethodology.html, 2022. Accessed: 2025-03-22.
Figure 1.
Impact of range vs. bandwidth in wireless technology networks, modified from [12].
Figure 1.
Impact of range vs. bandwidth in wireless technology networks, modified from [12].
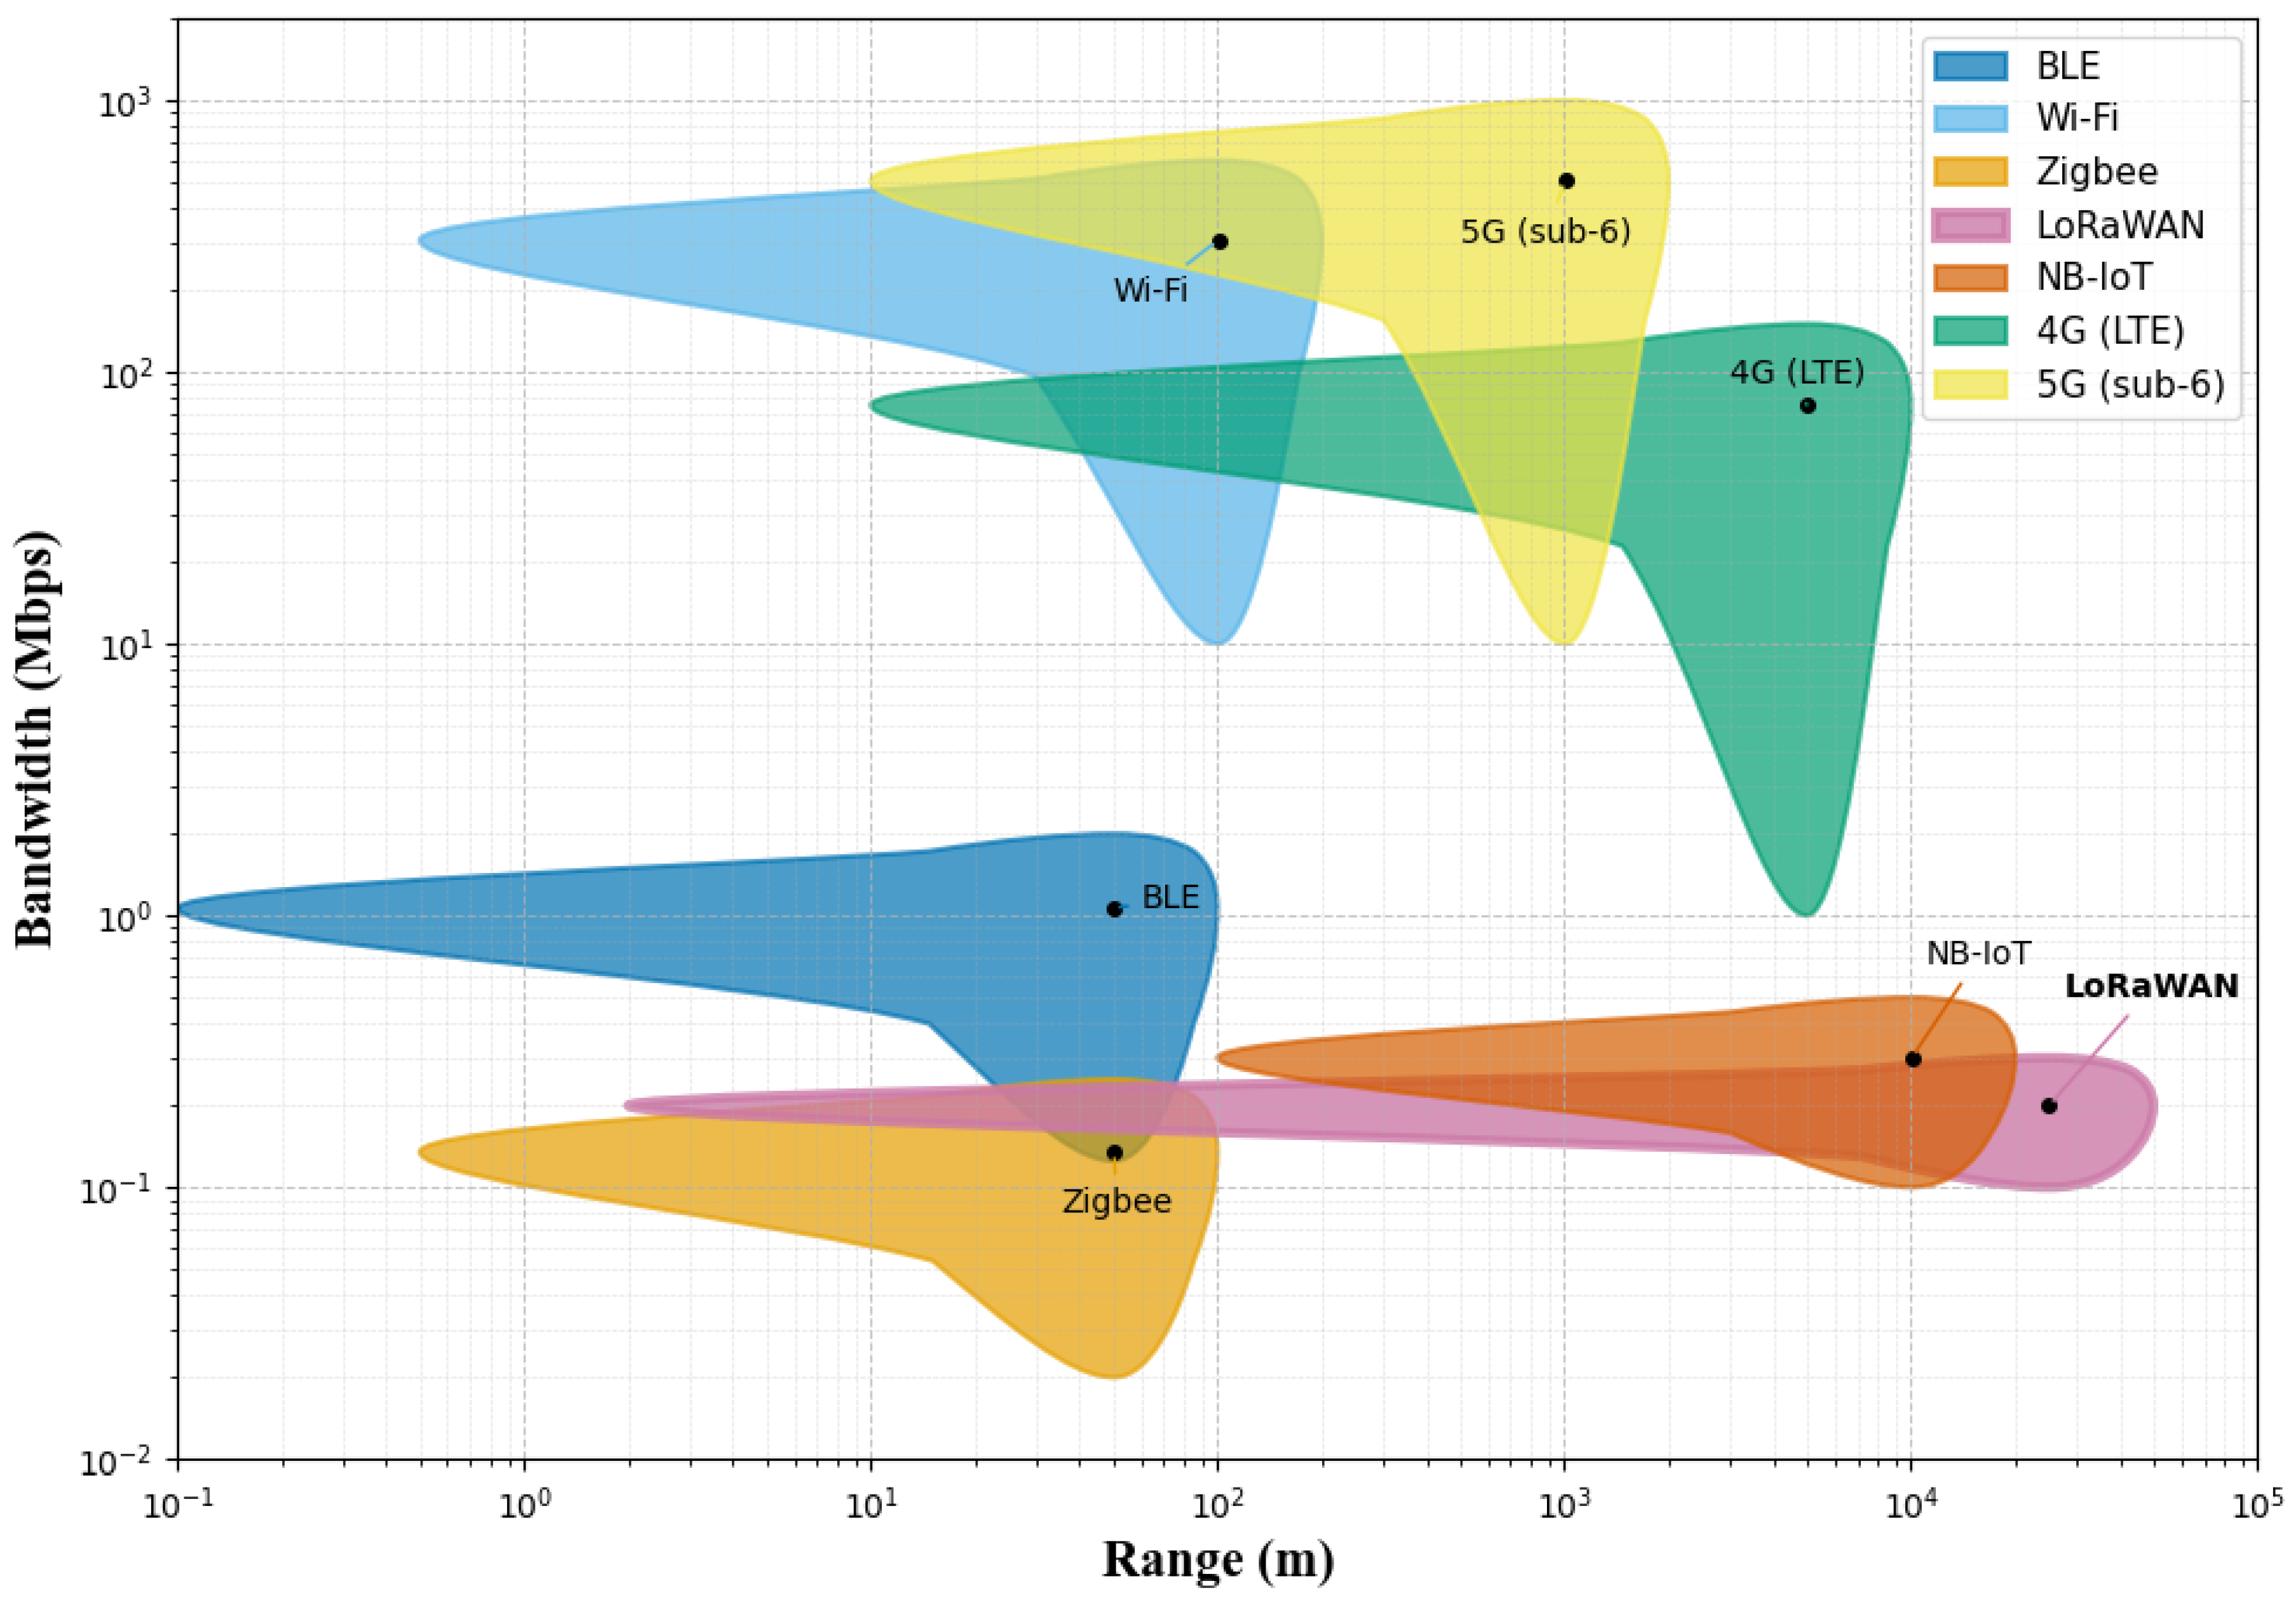
Figure 2.
LoRaWAN network automation system architecture.
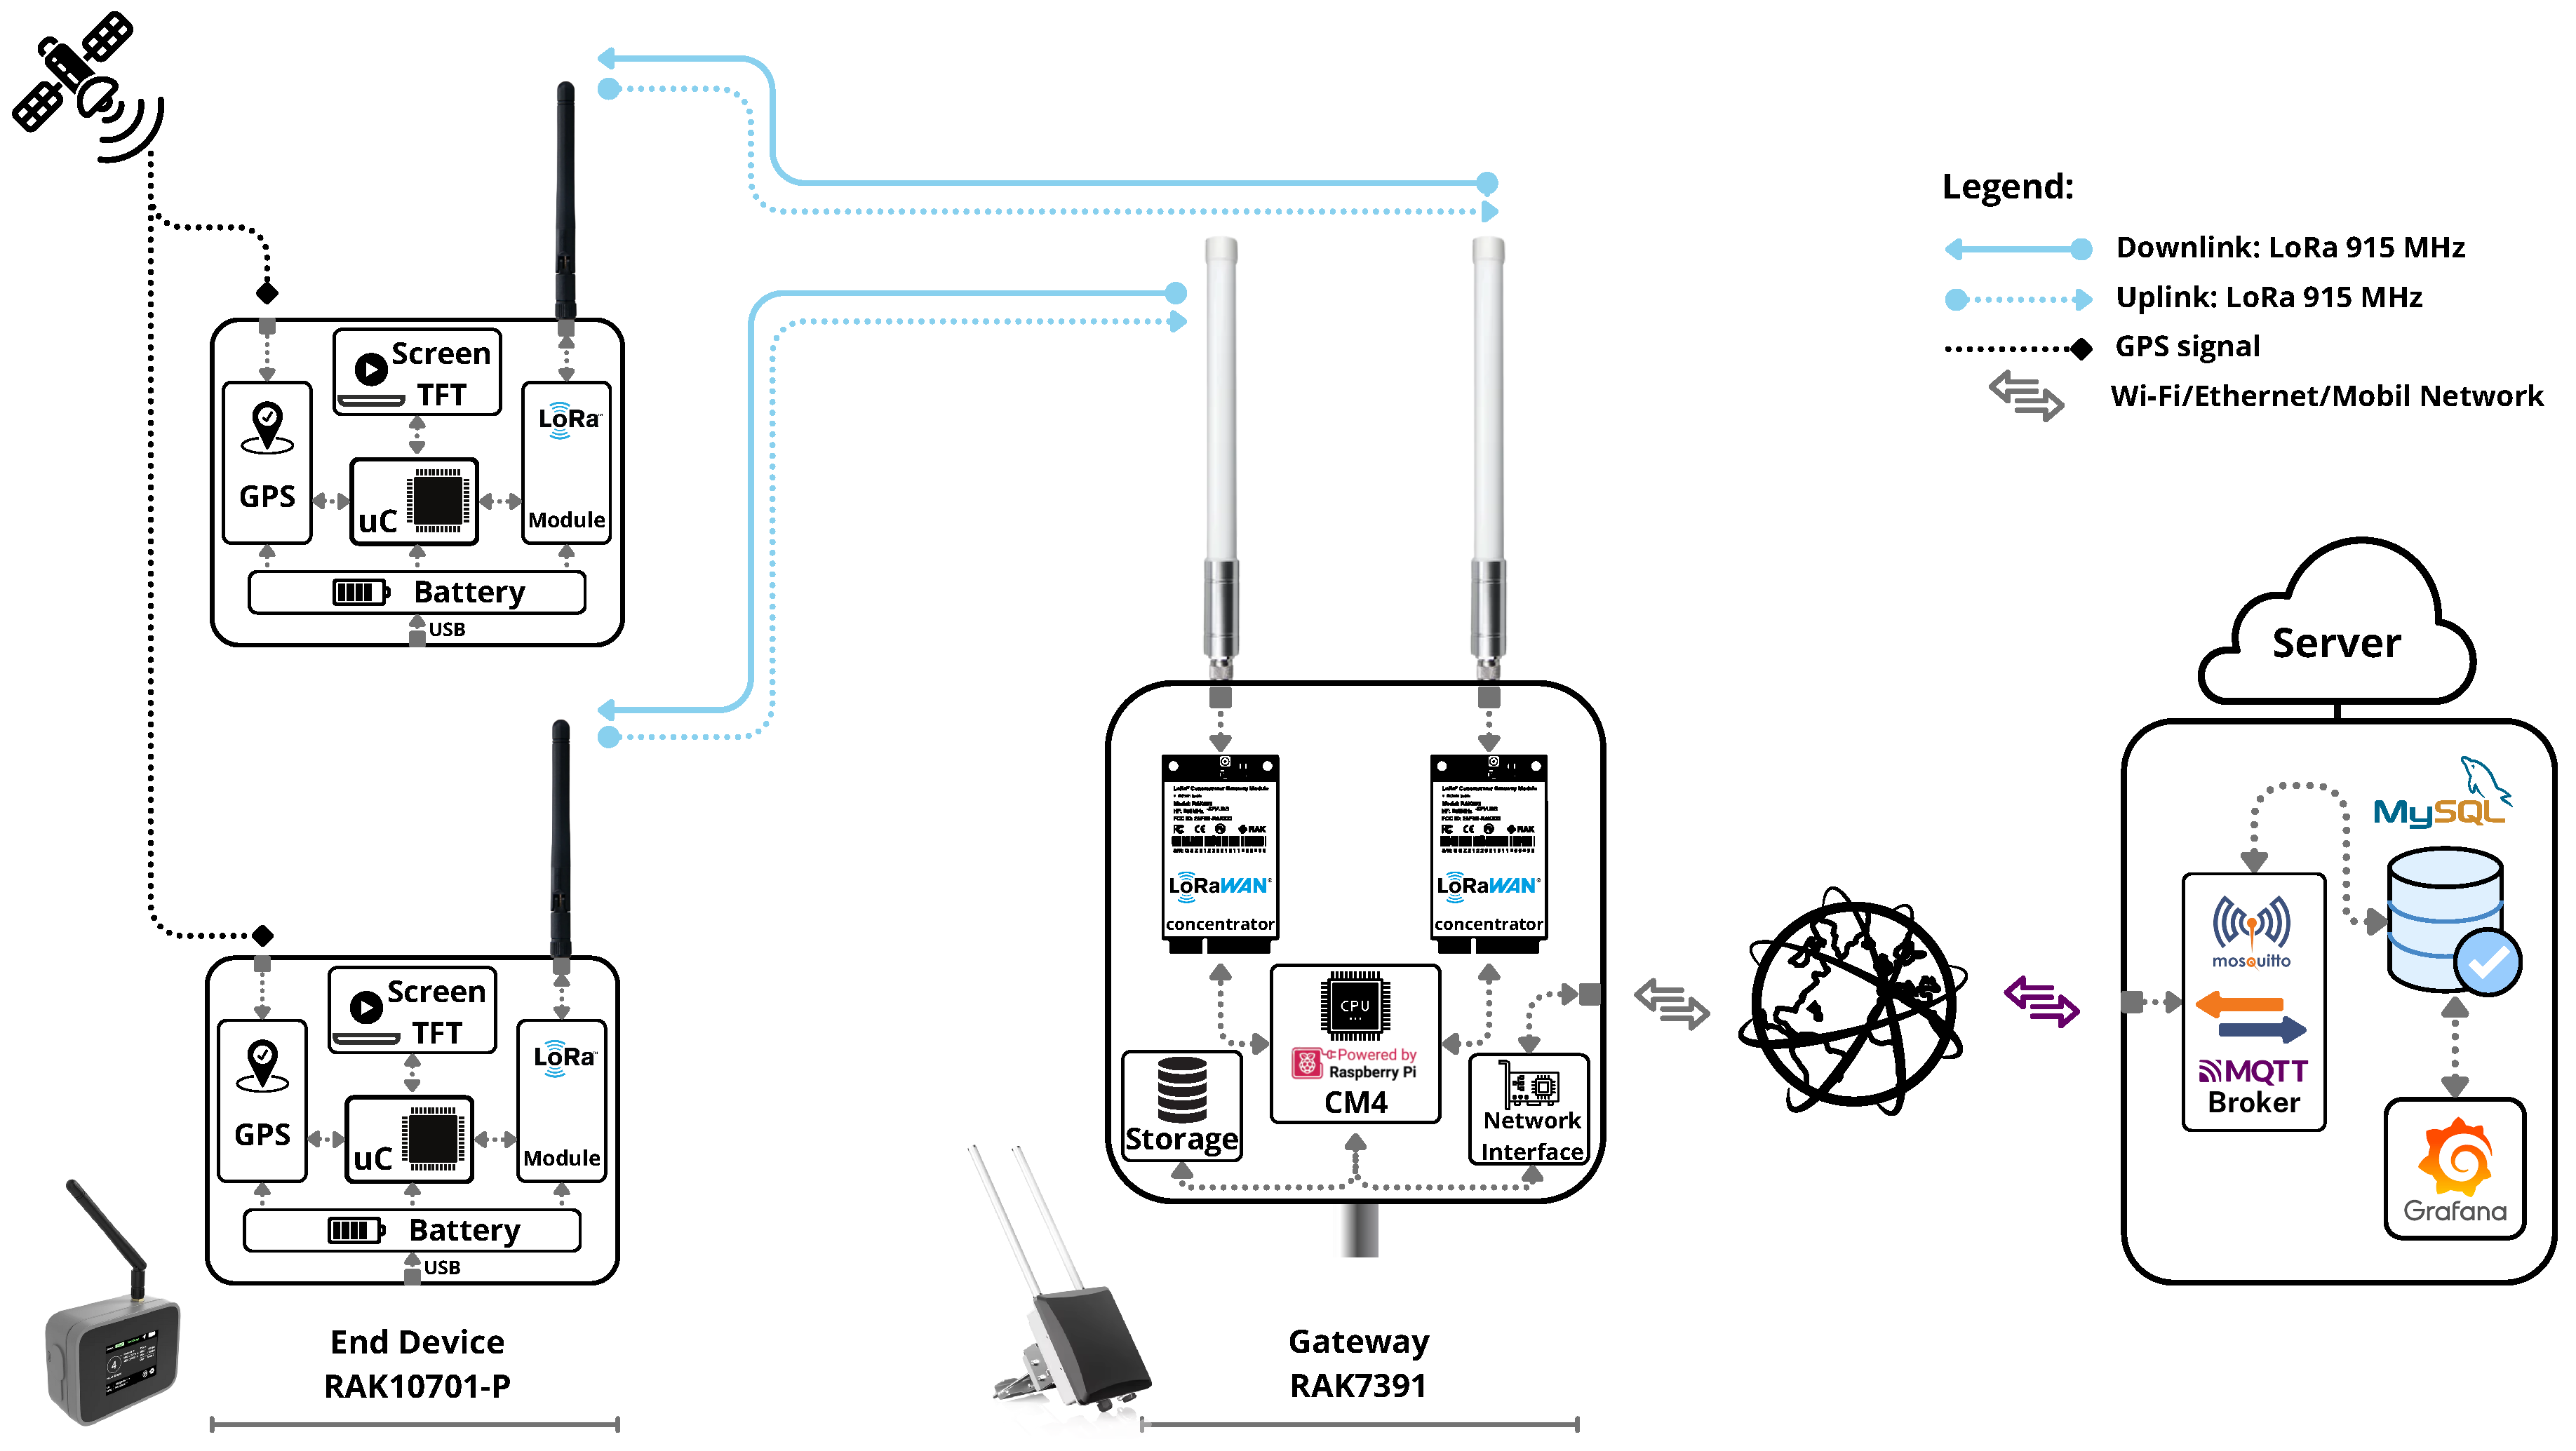
Figure 3.
Description of MQTT client flowchart.
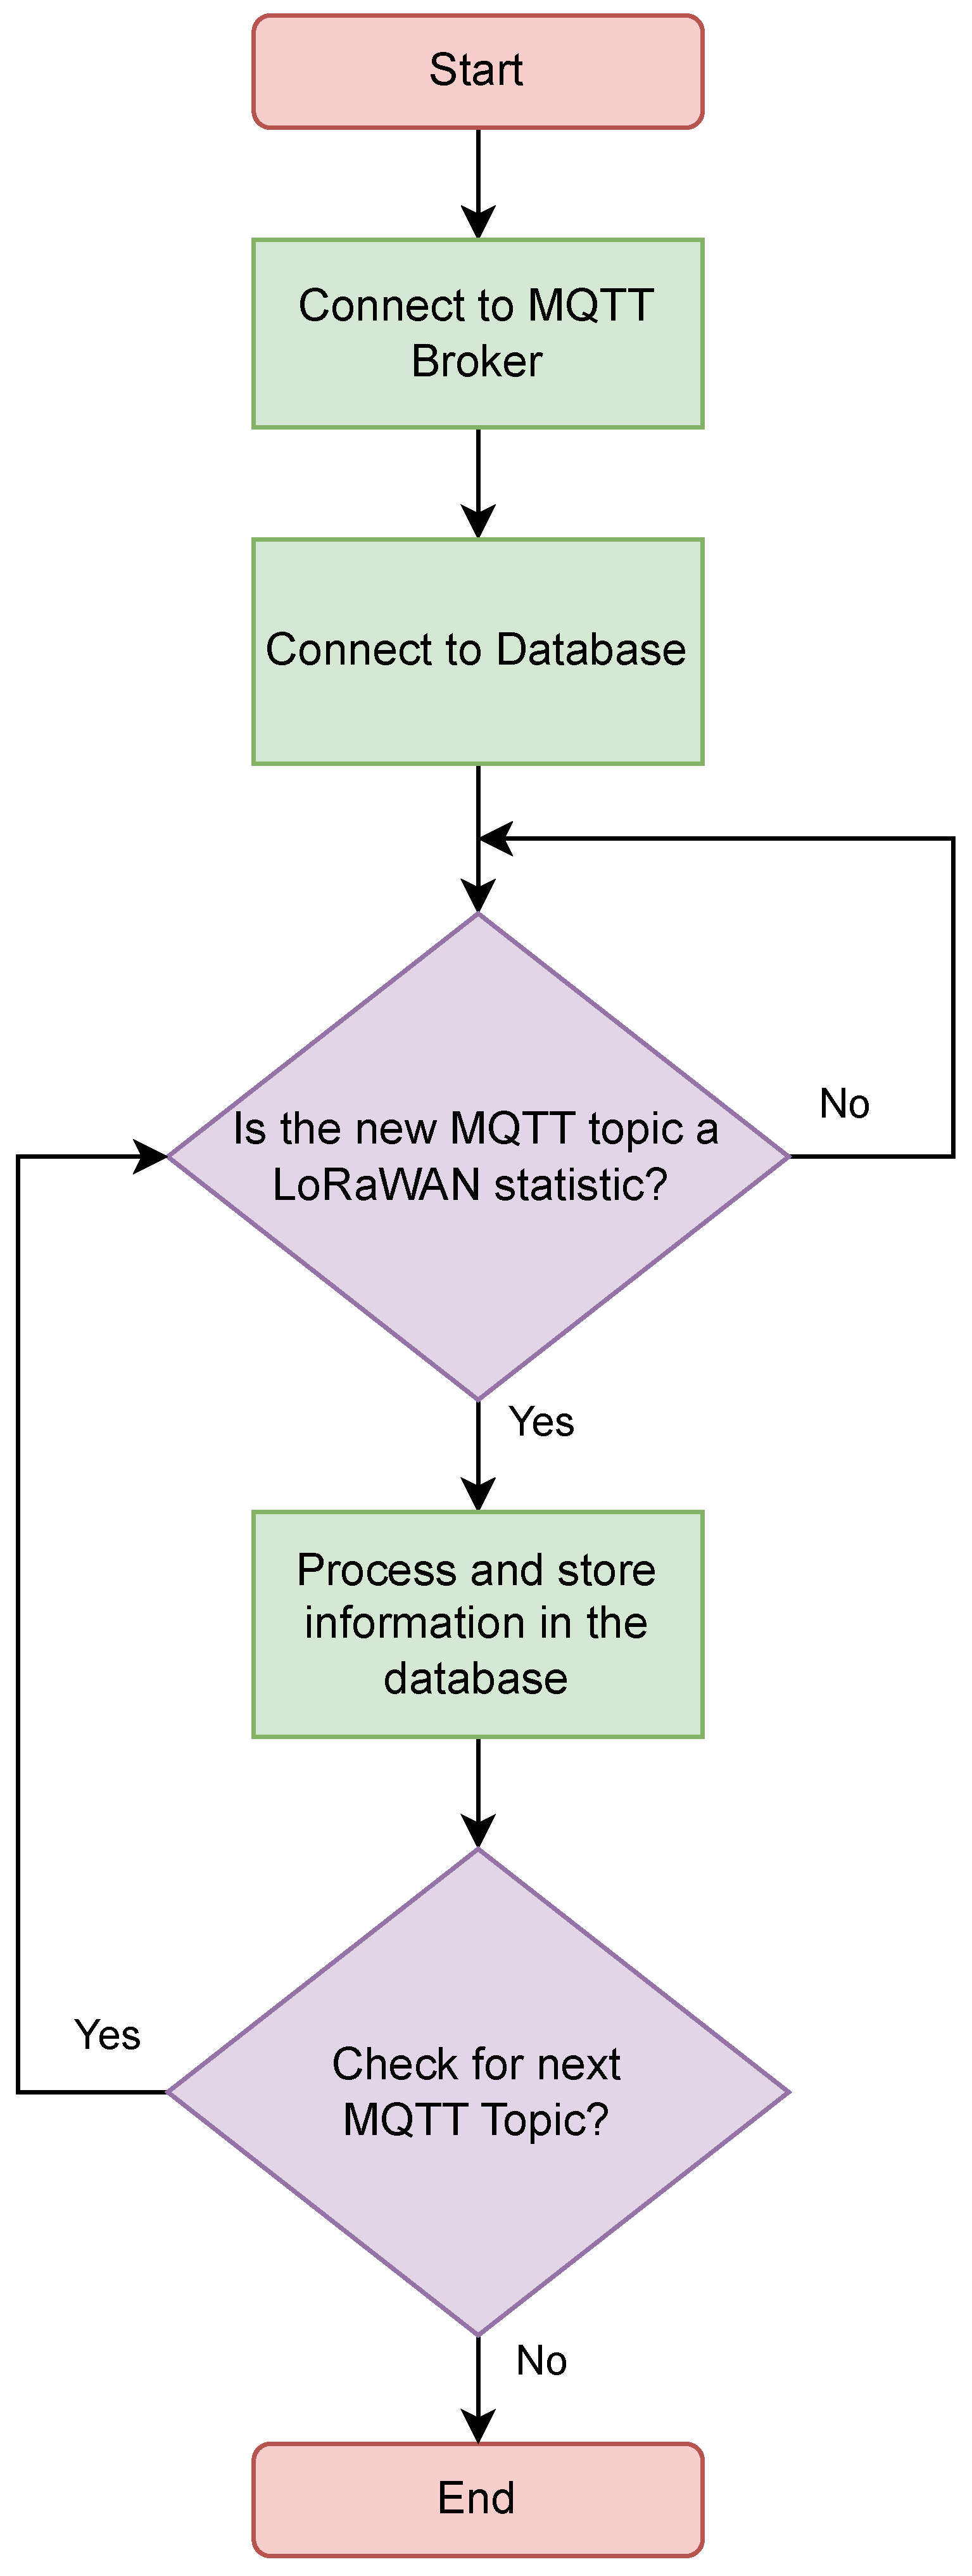
Figure 4.
Description of the End Device configuration flowchart.
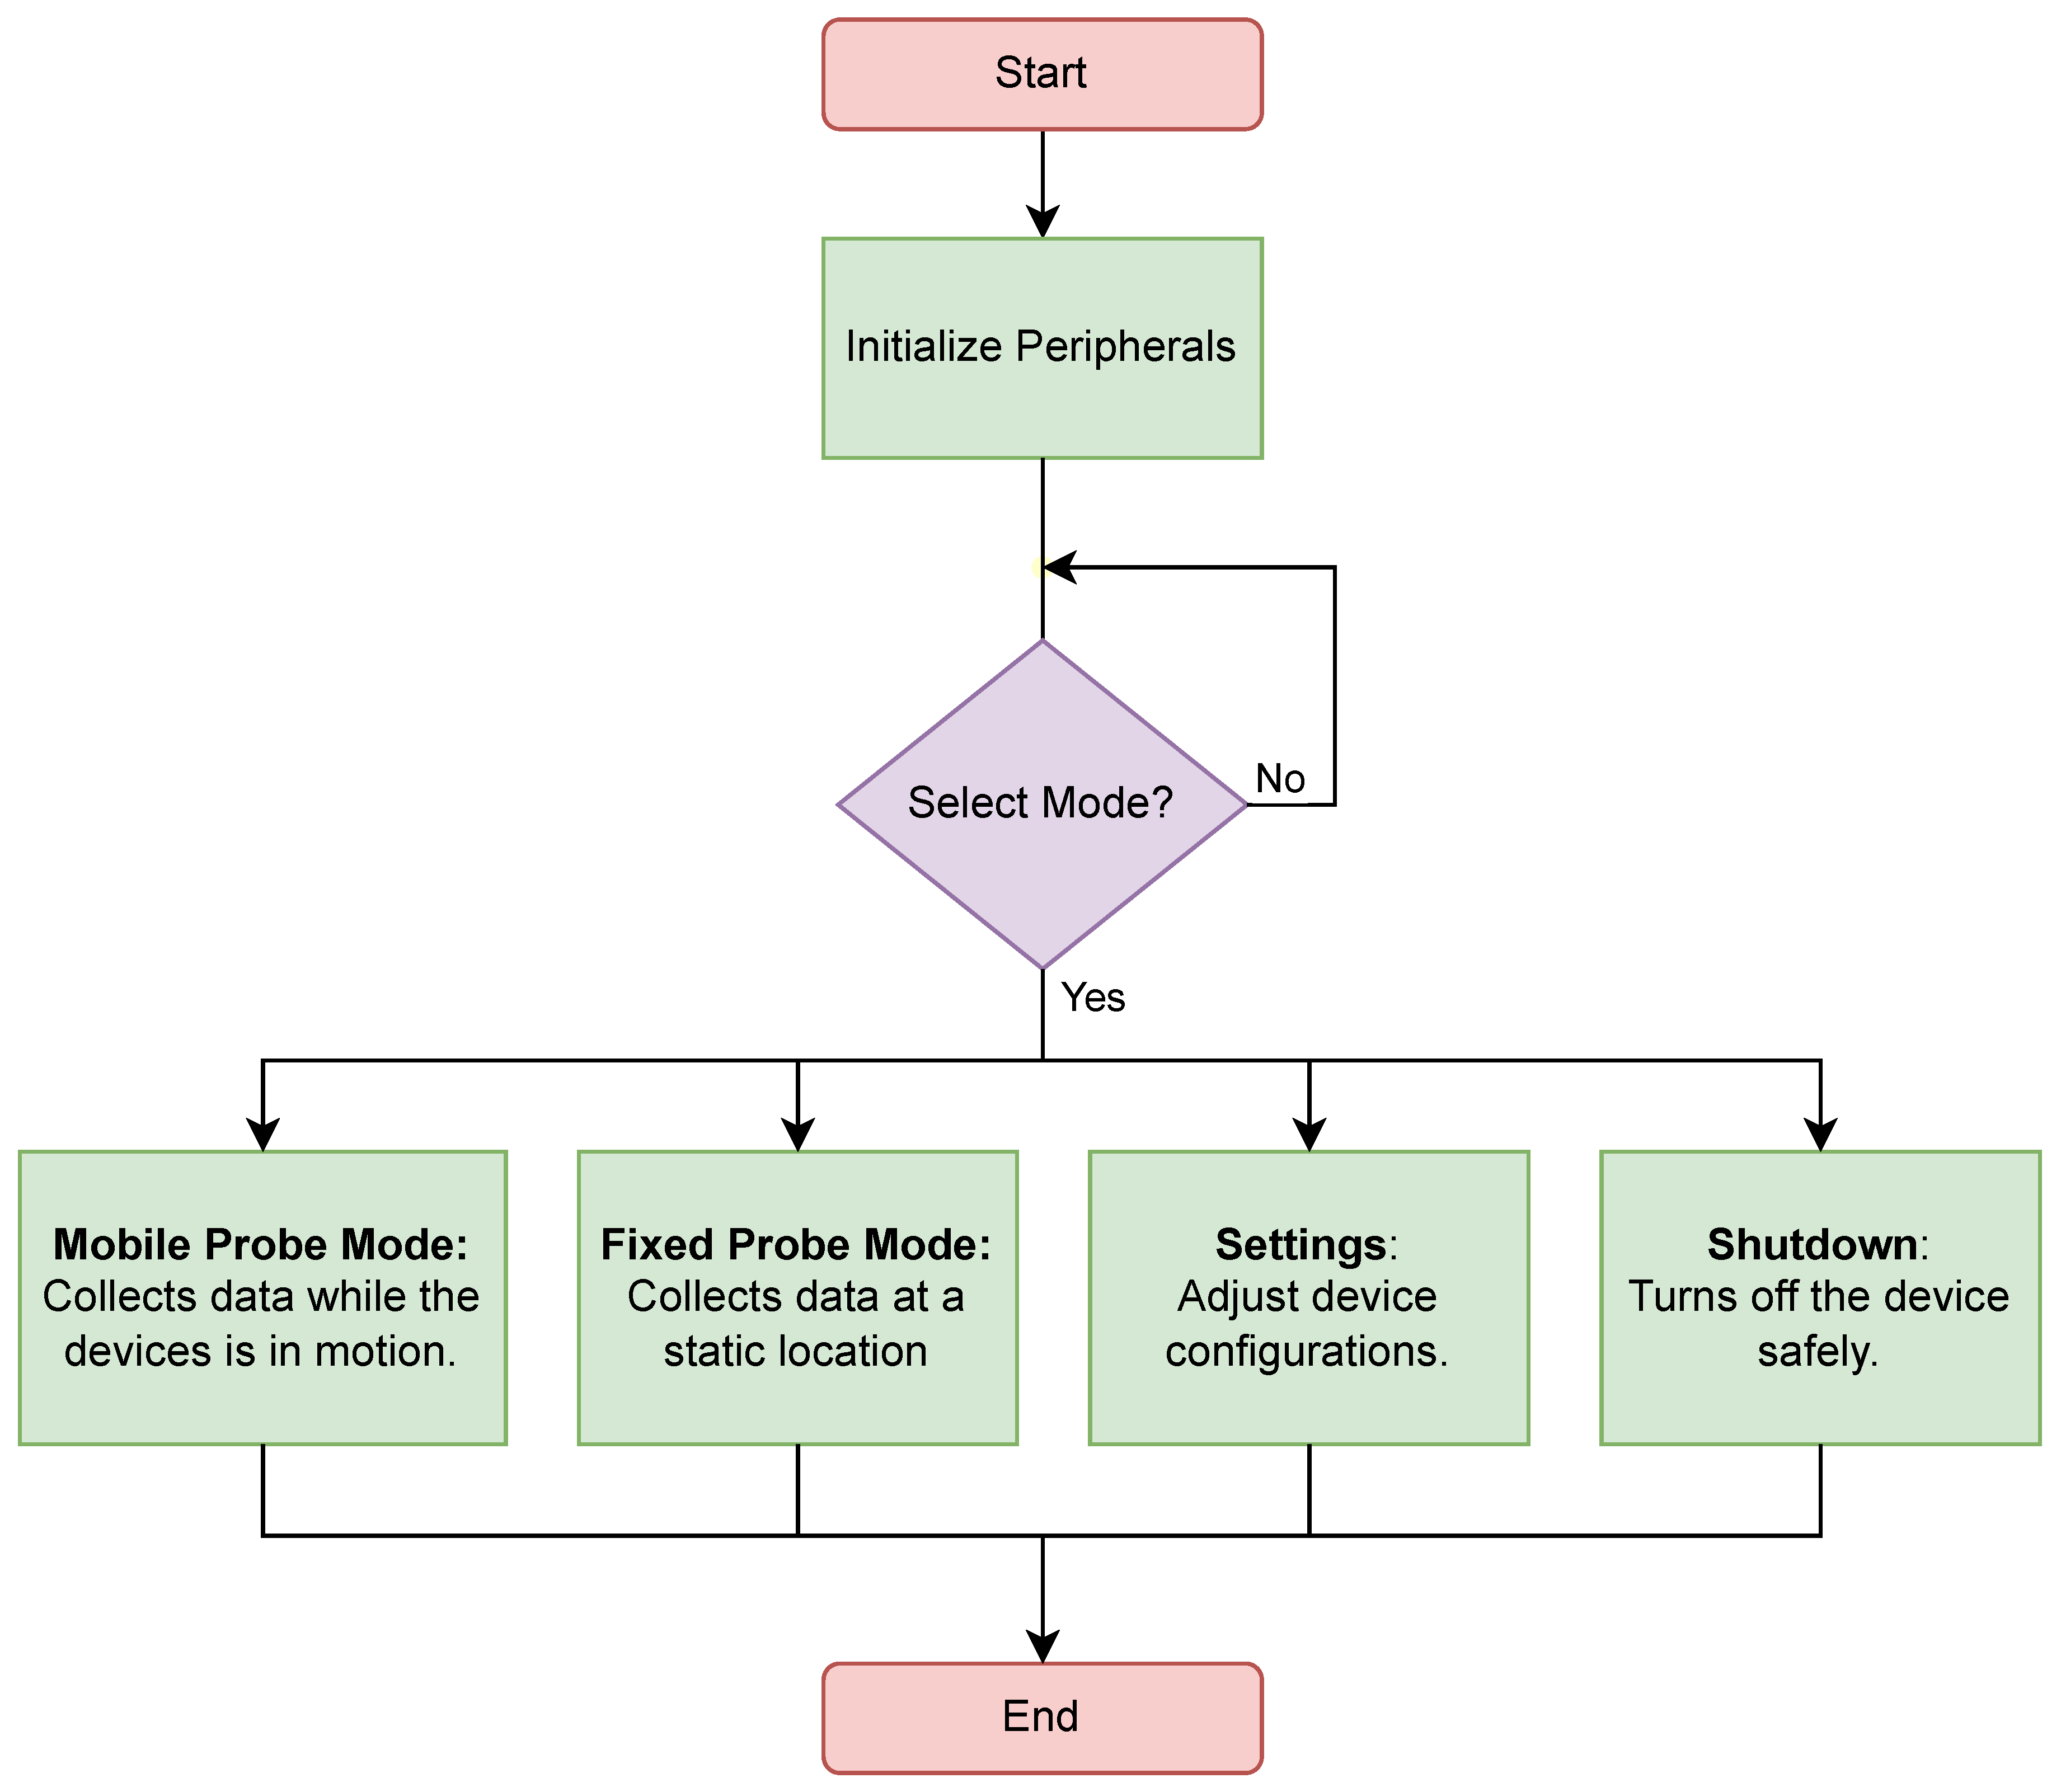
Figure 5.
LoRaWAN Transmission and Performance Measurement on the End Device.
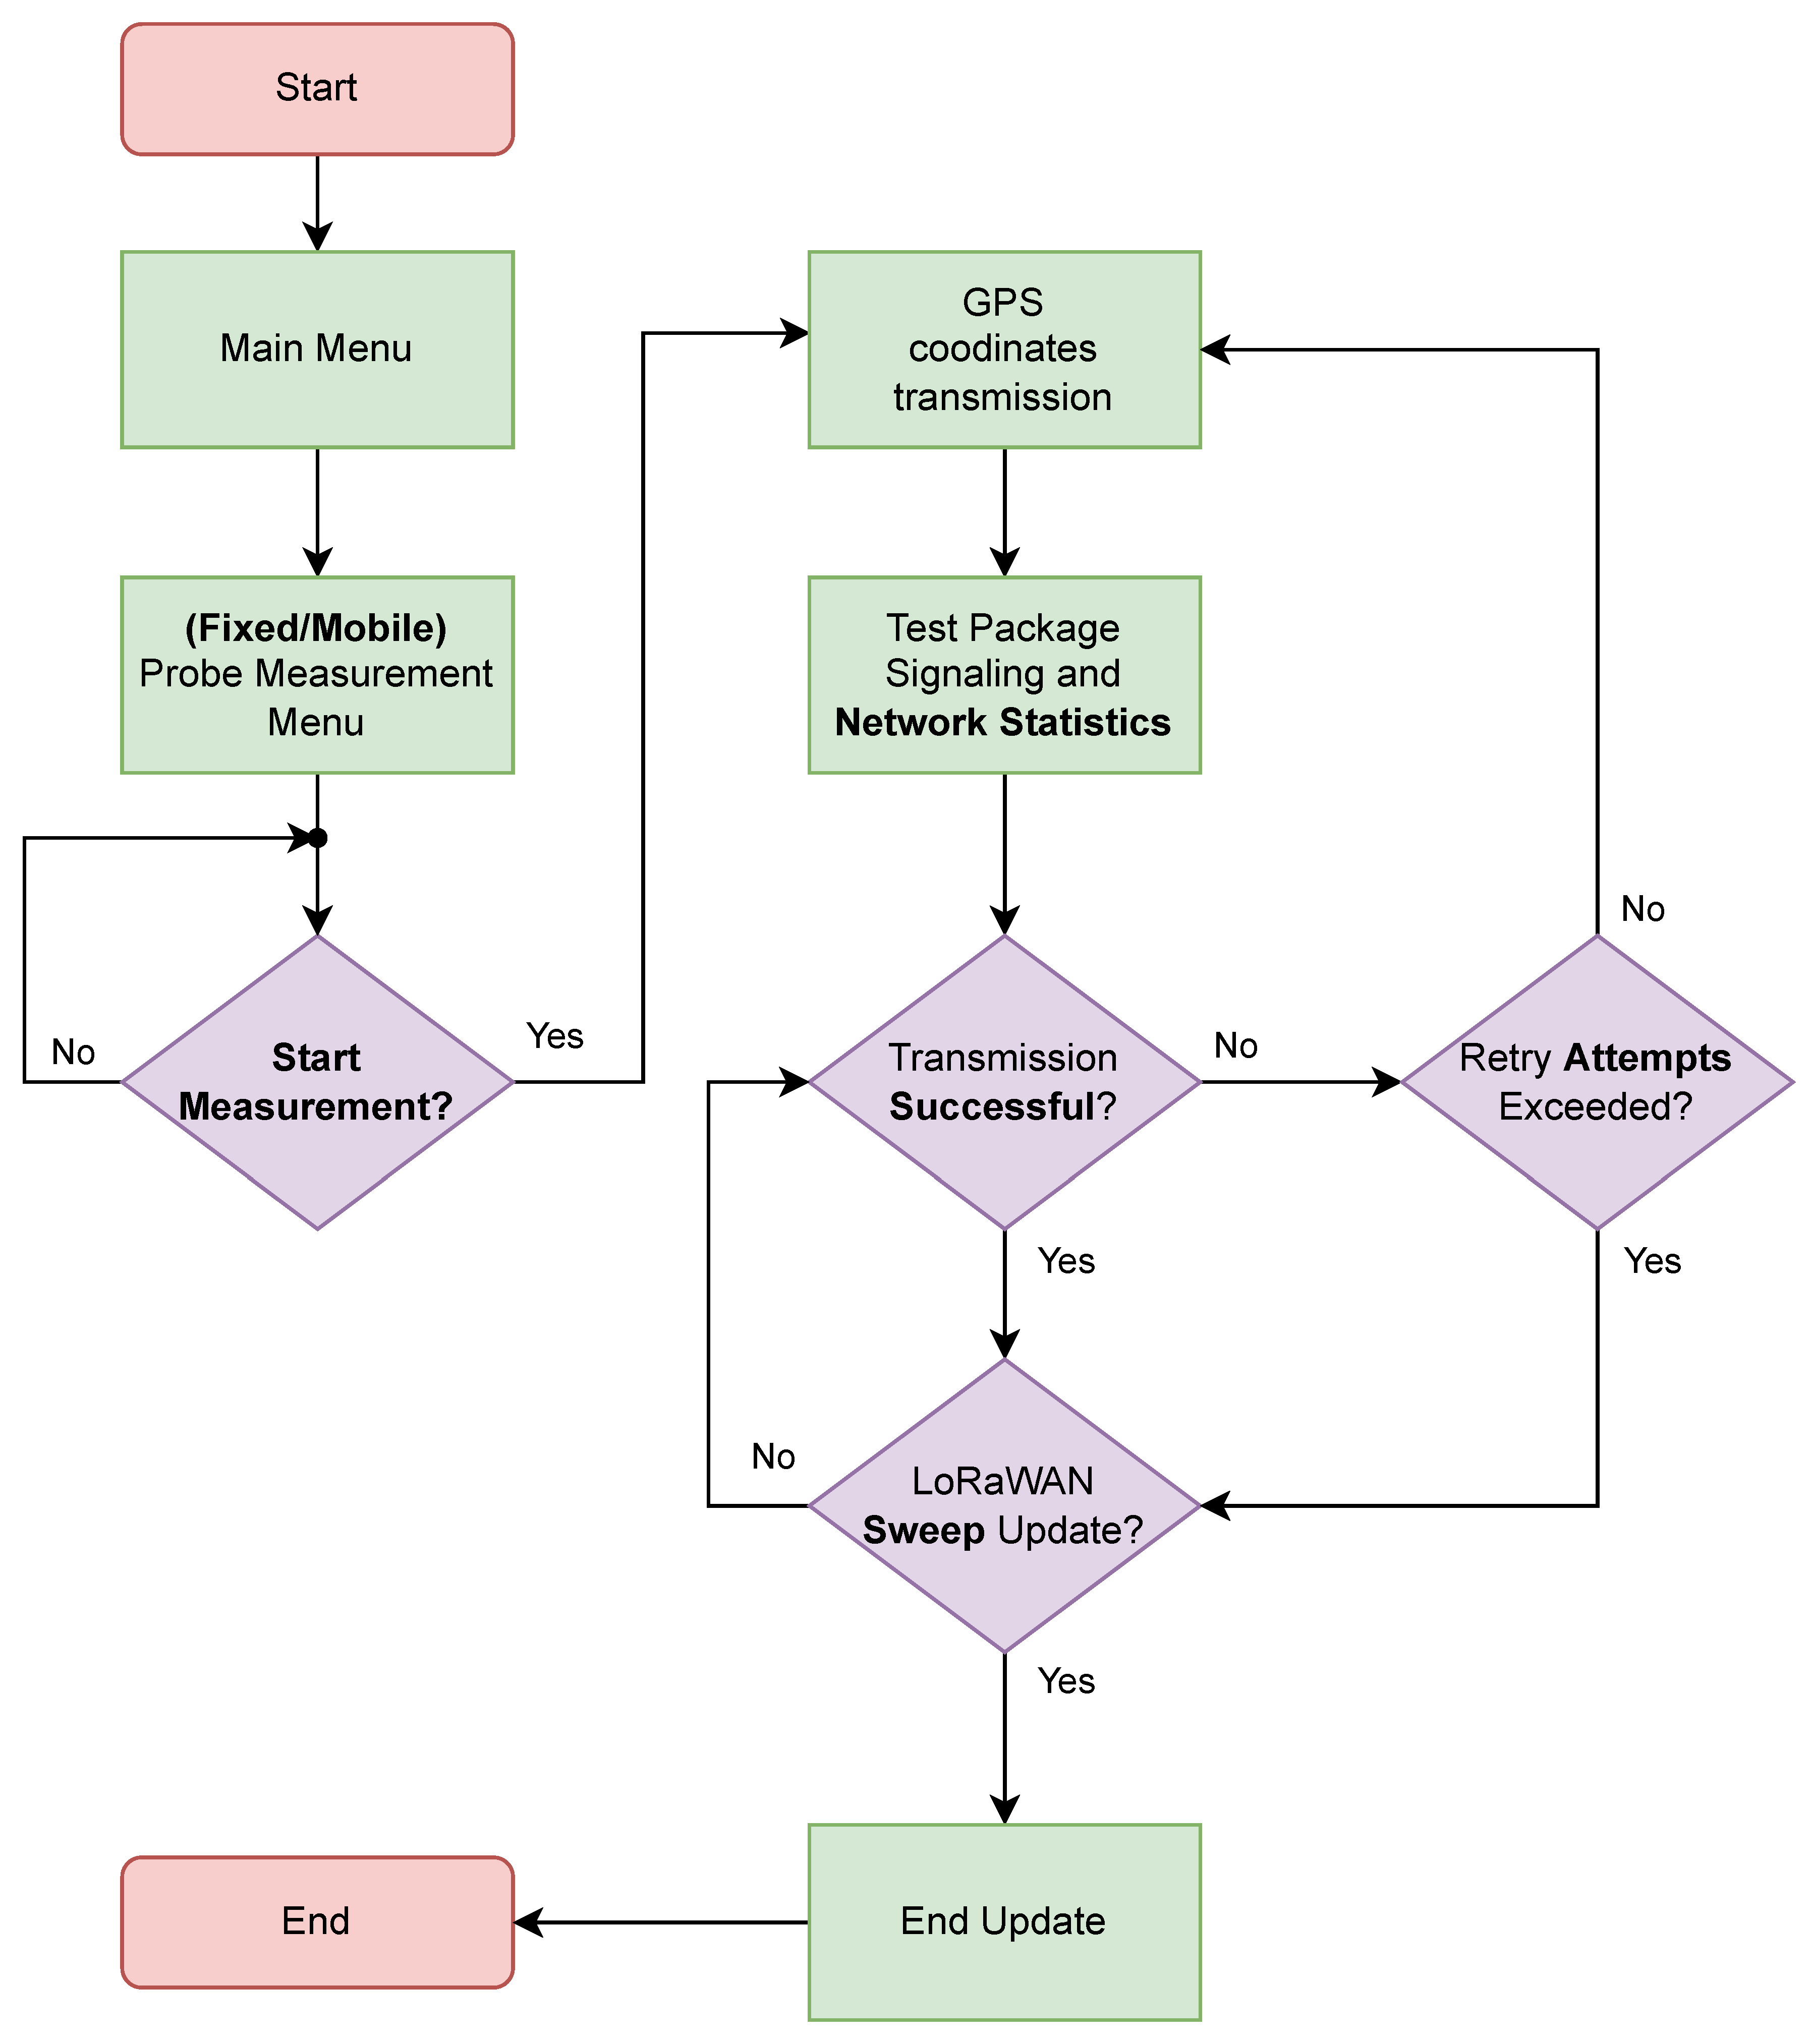
Figure 10.
Experimental setup showing the gateway and end device in a suburban open area.
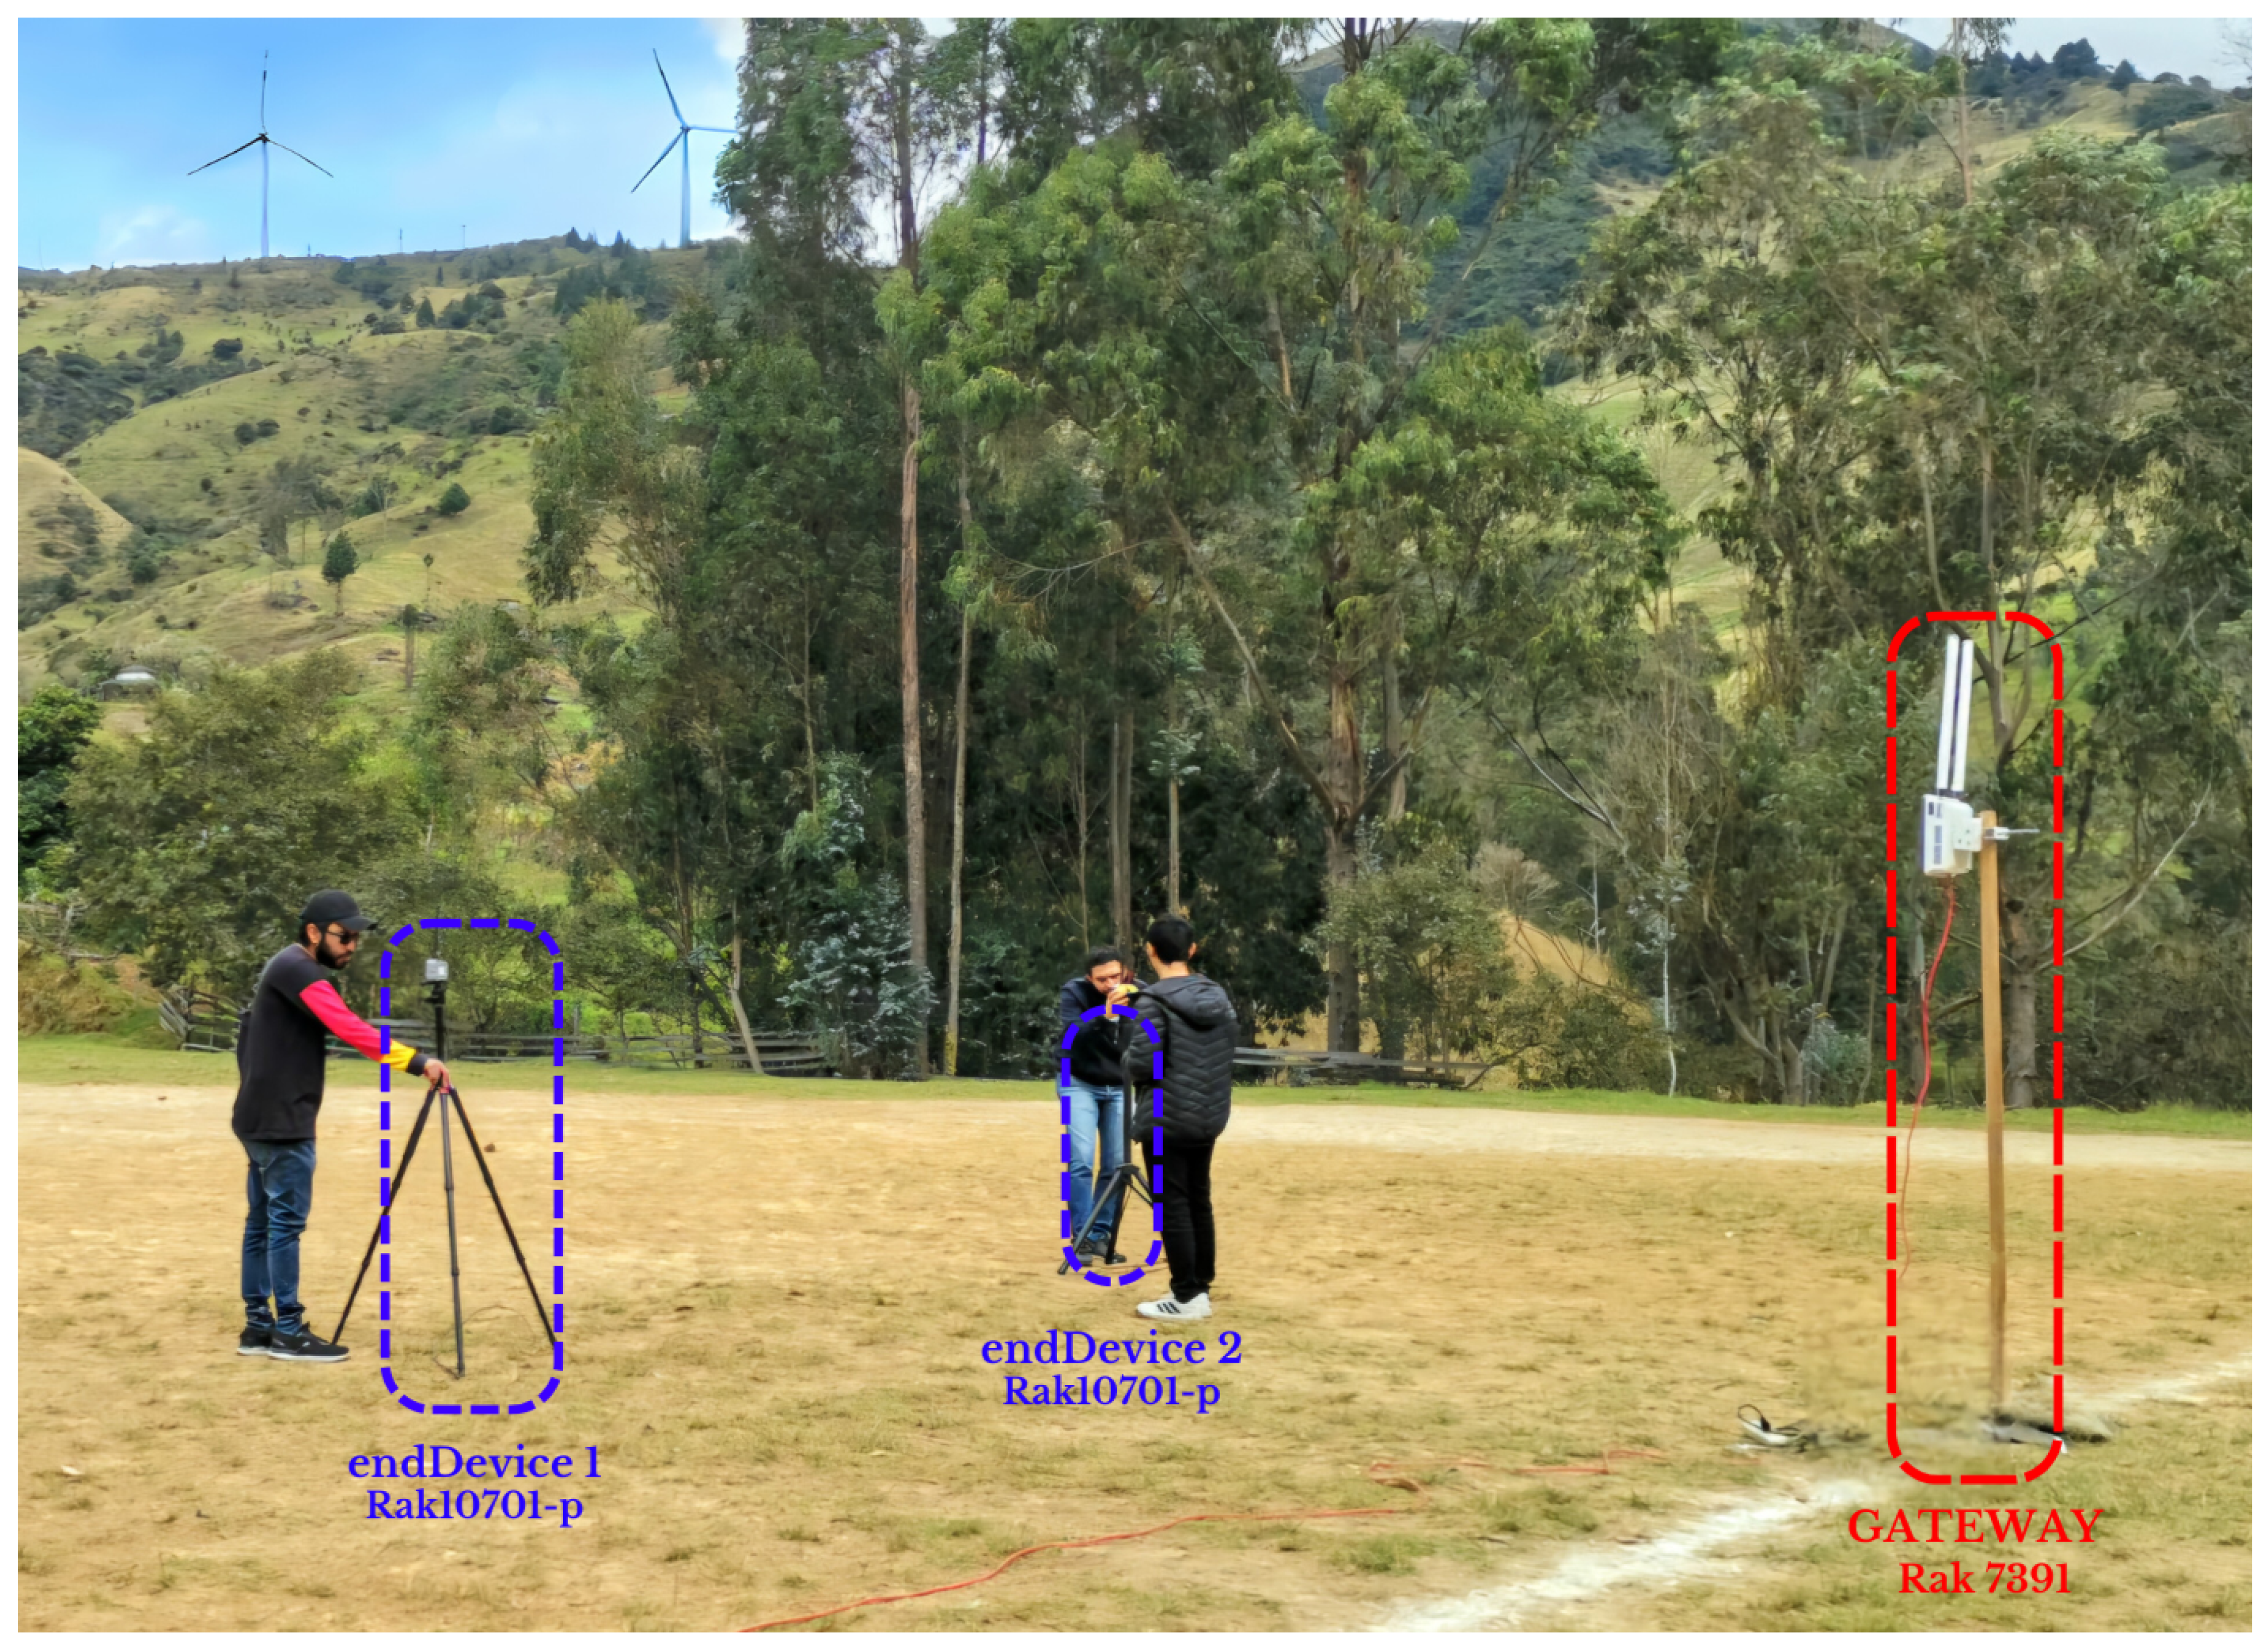
Figure 11.
Locations reported by the end device during the first test at 10 meters and subsequent measurements at 5-meter intervals.
Figure 11.
Locations reported by the end device during the first test at 10 meters and subsequent measurements at 5-meter intervals.
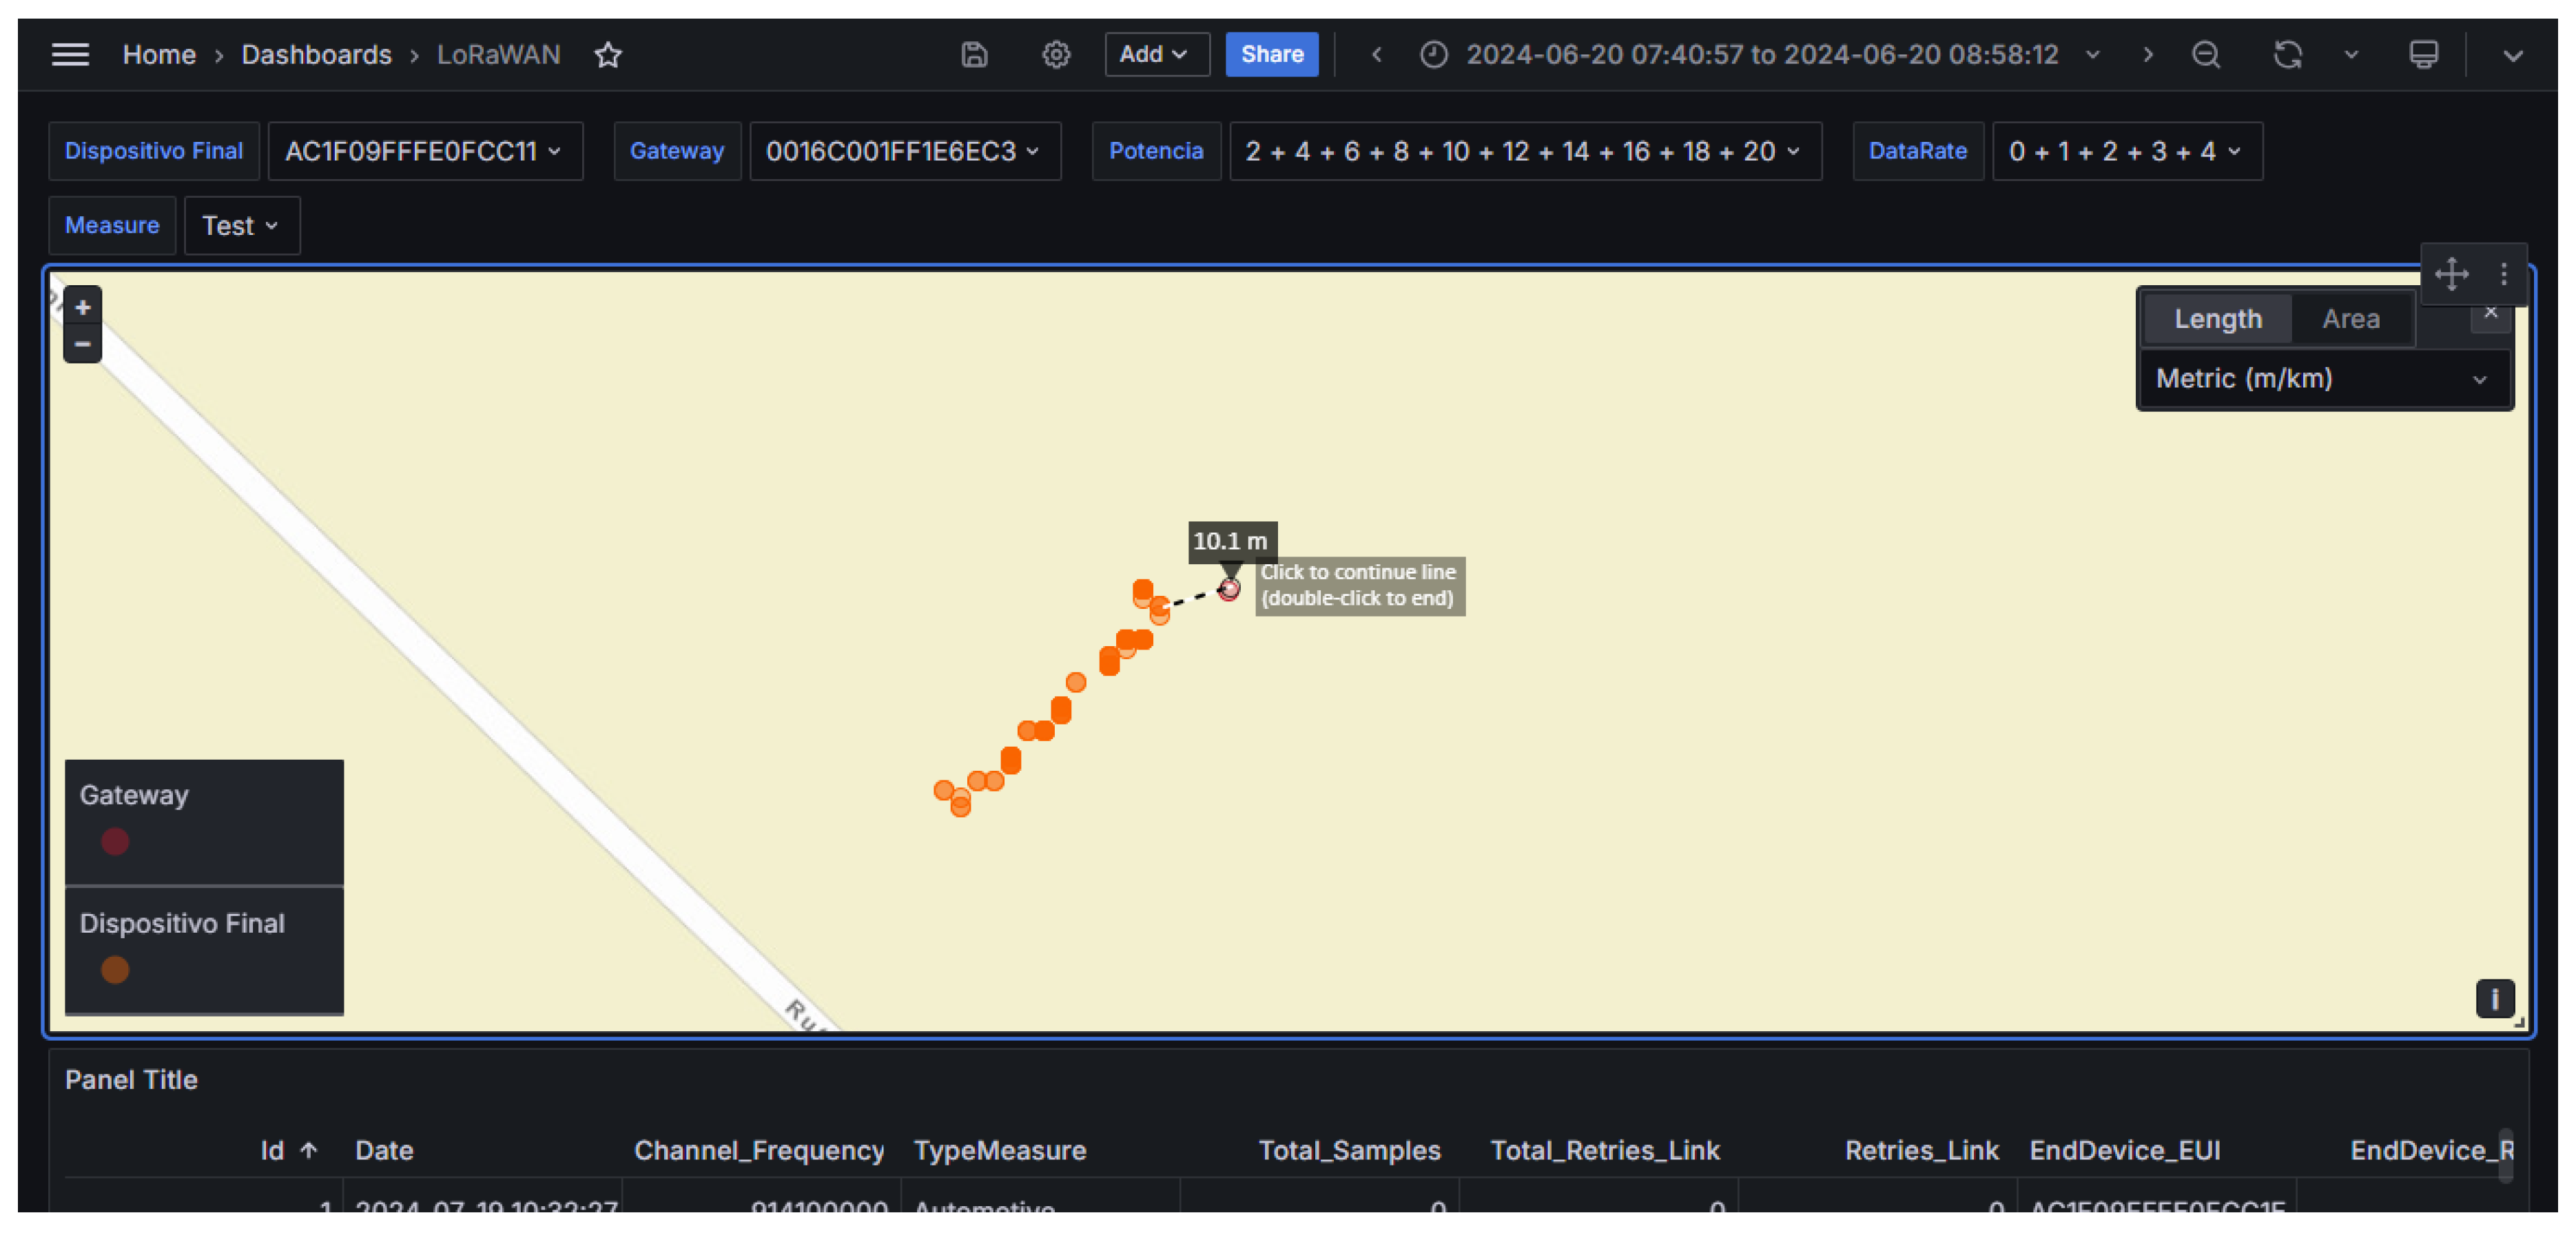
Figure 12.
LoRaWAN link statistics for analysis and its presentation in the dash board in the Lab.
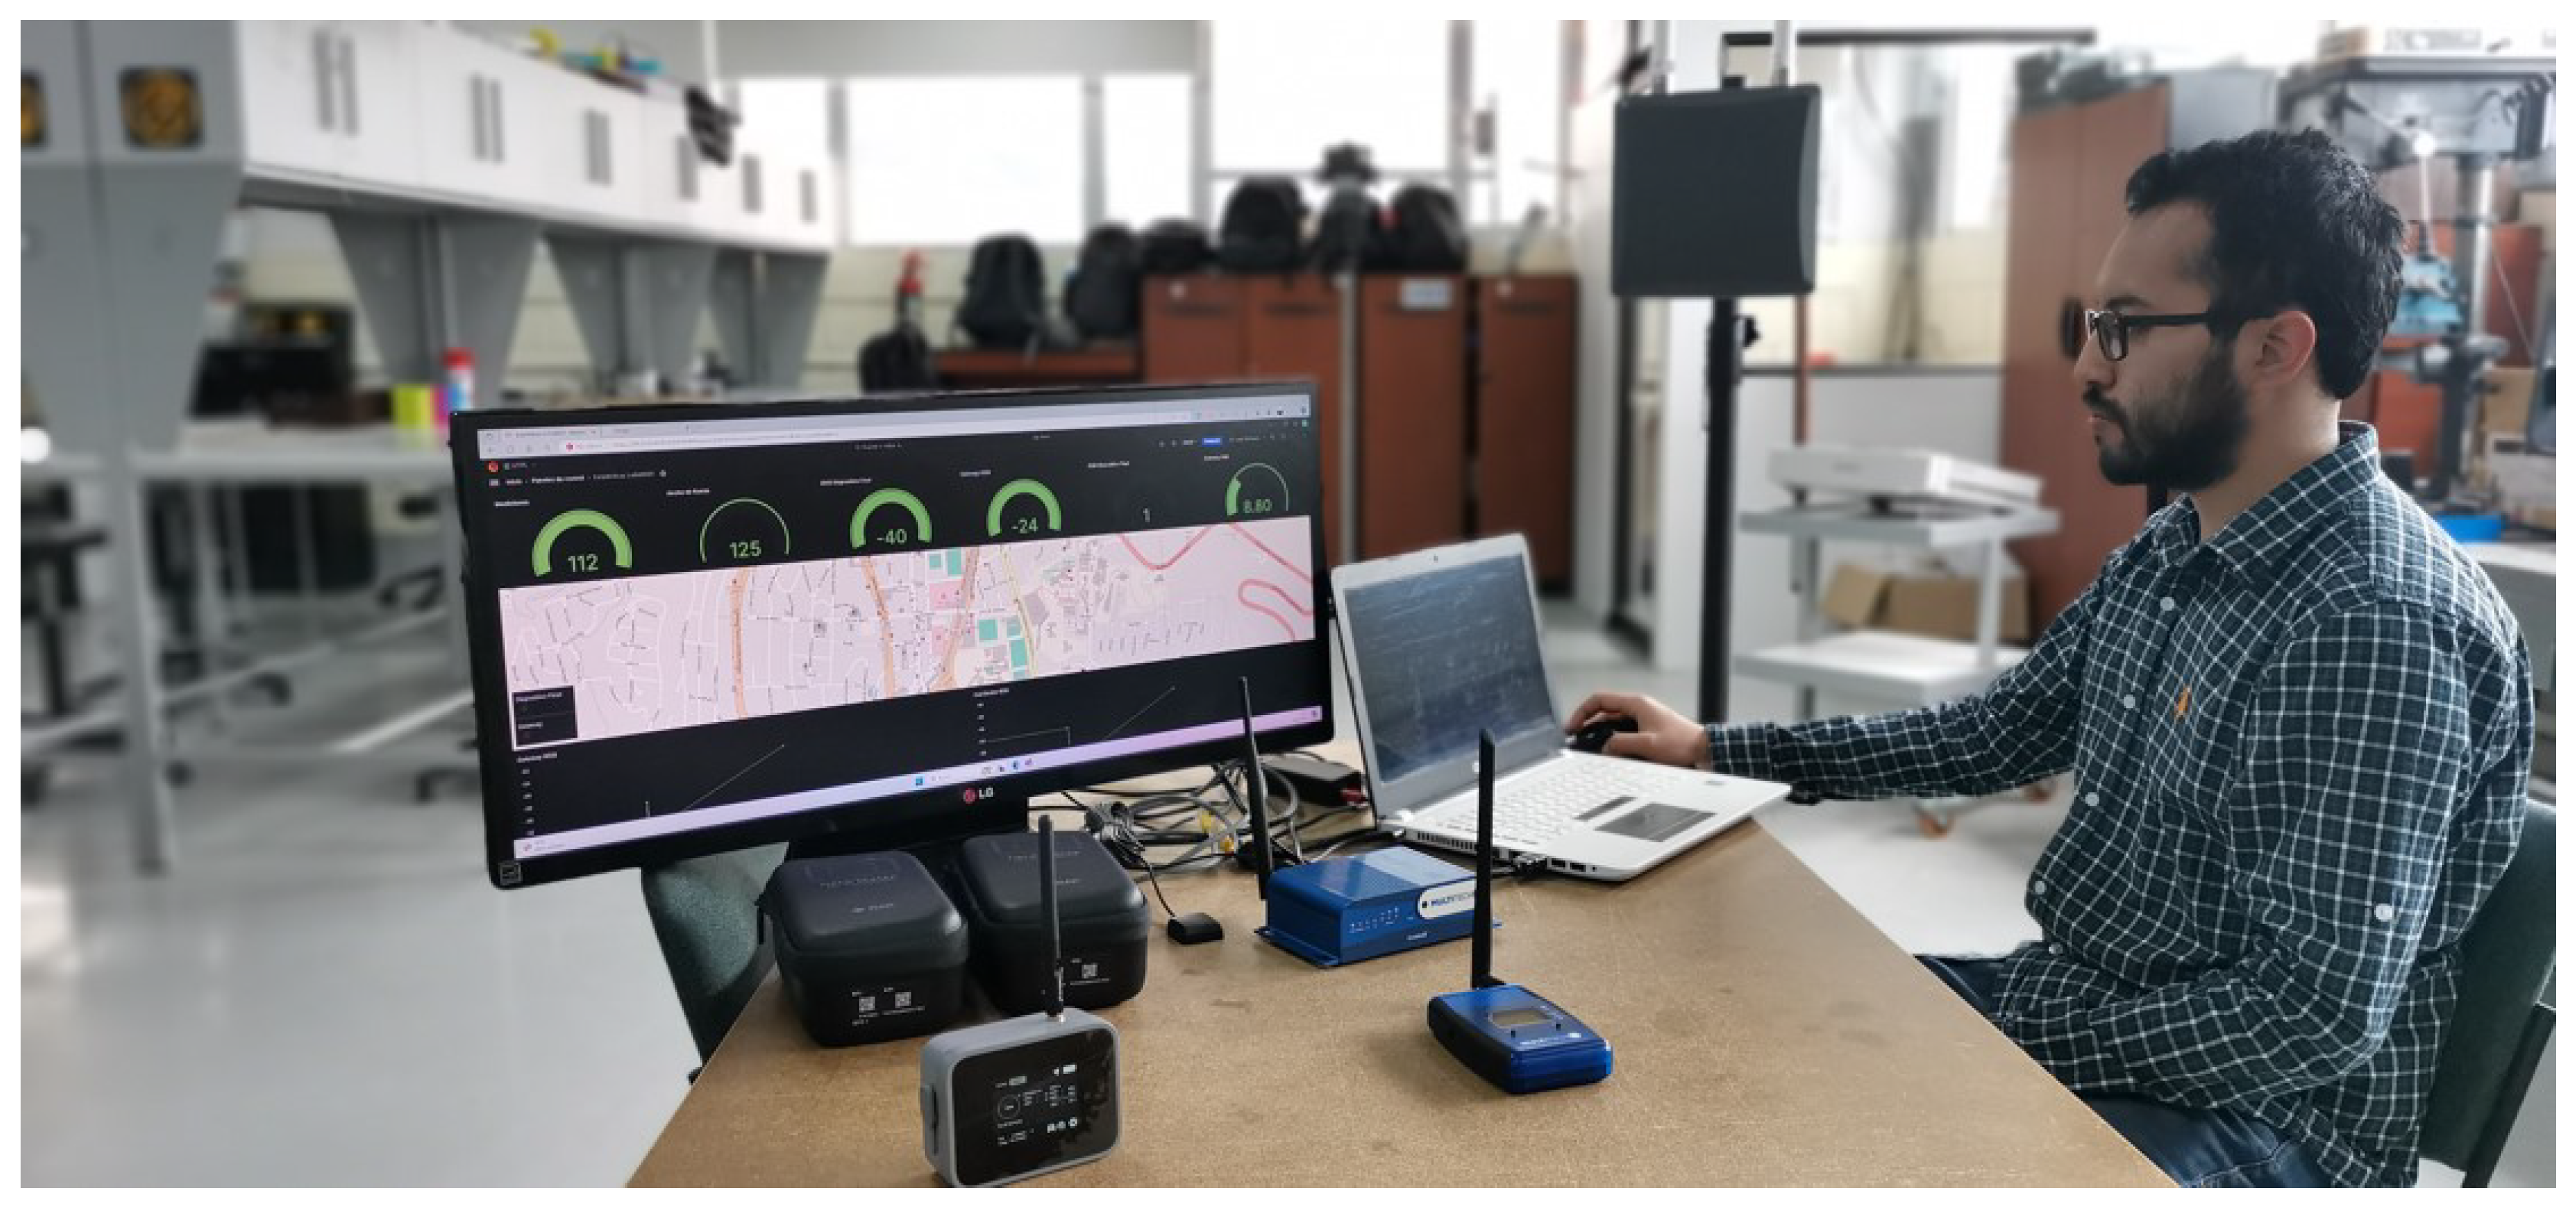
Figure 13.
Software evaluation in a suburban environment, with UTPL University as the central monitoring point.
Figure 13.
Software evaluation in a suburban environment, with UTPL University as the central monitoring point.
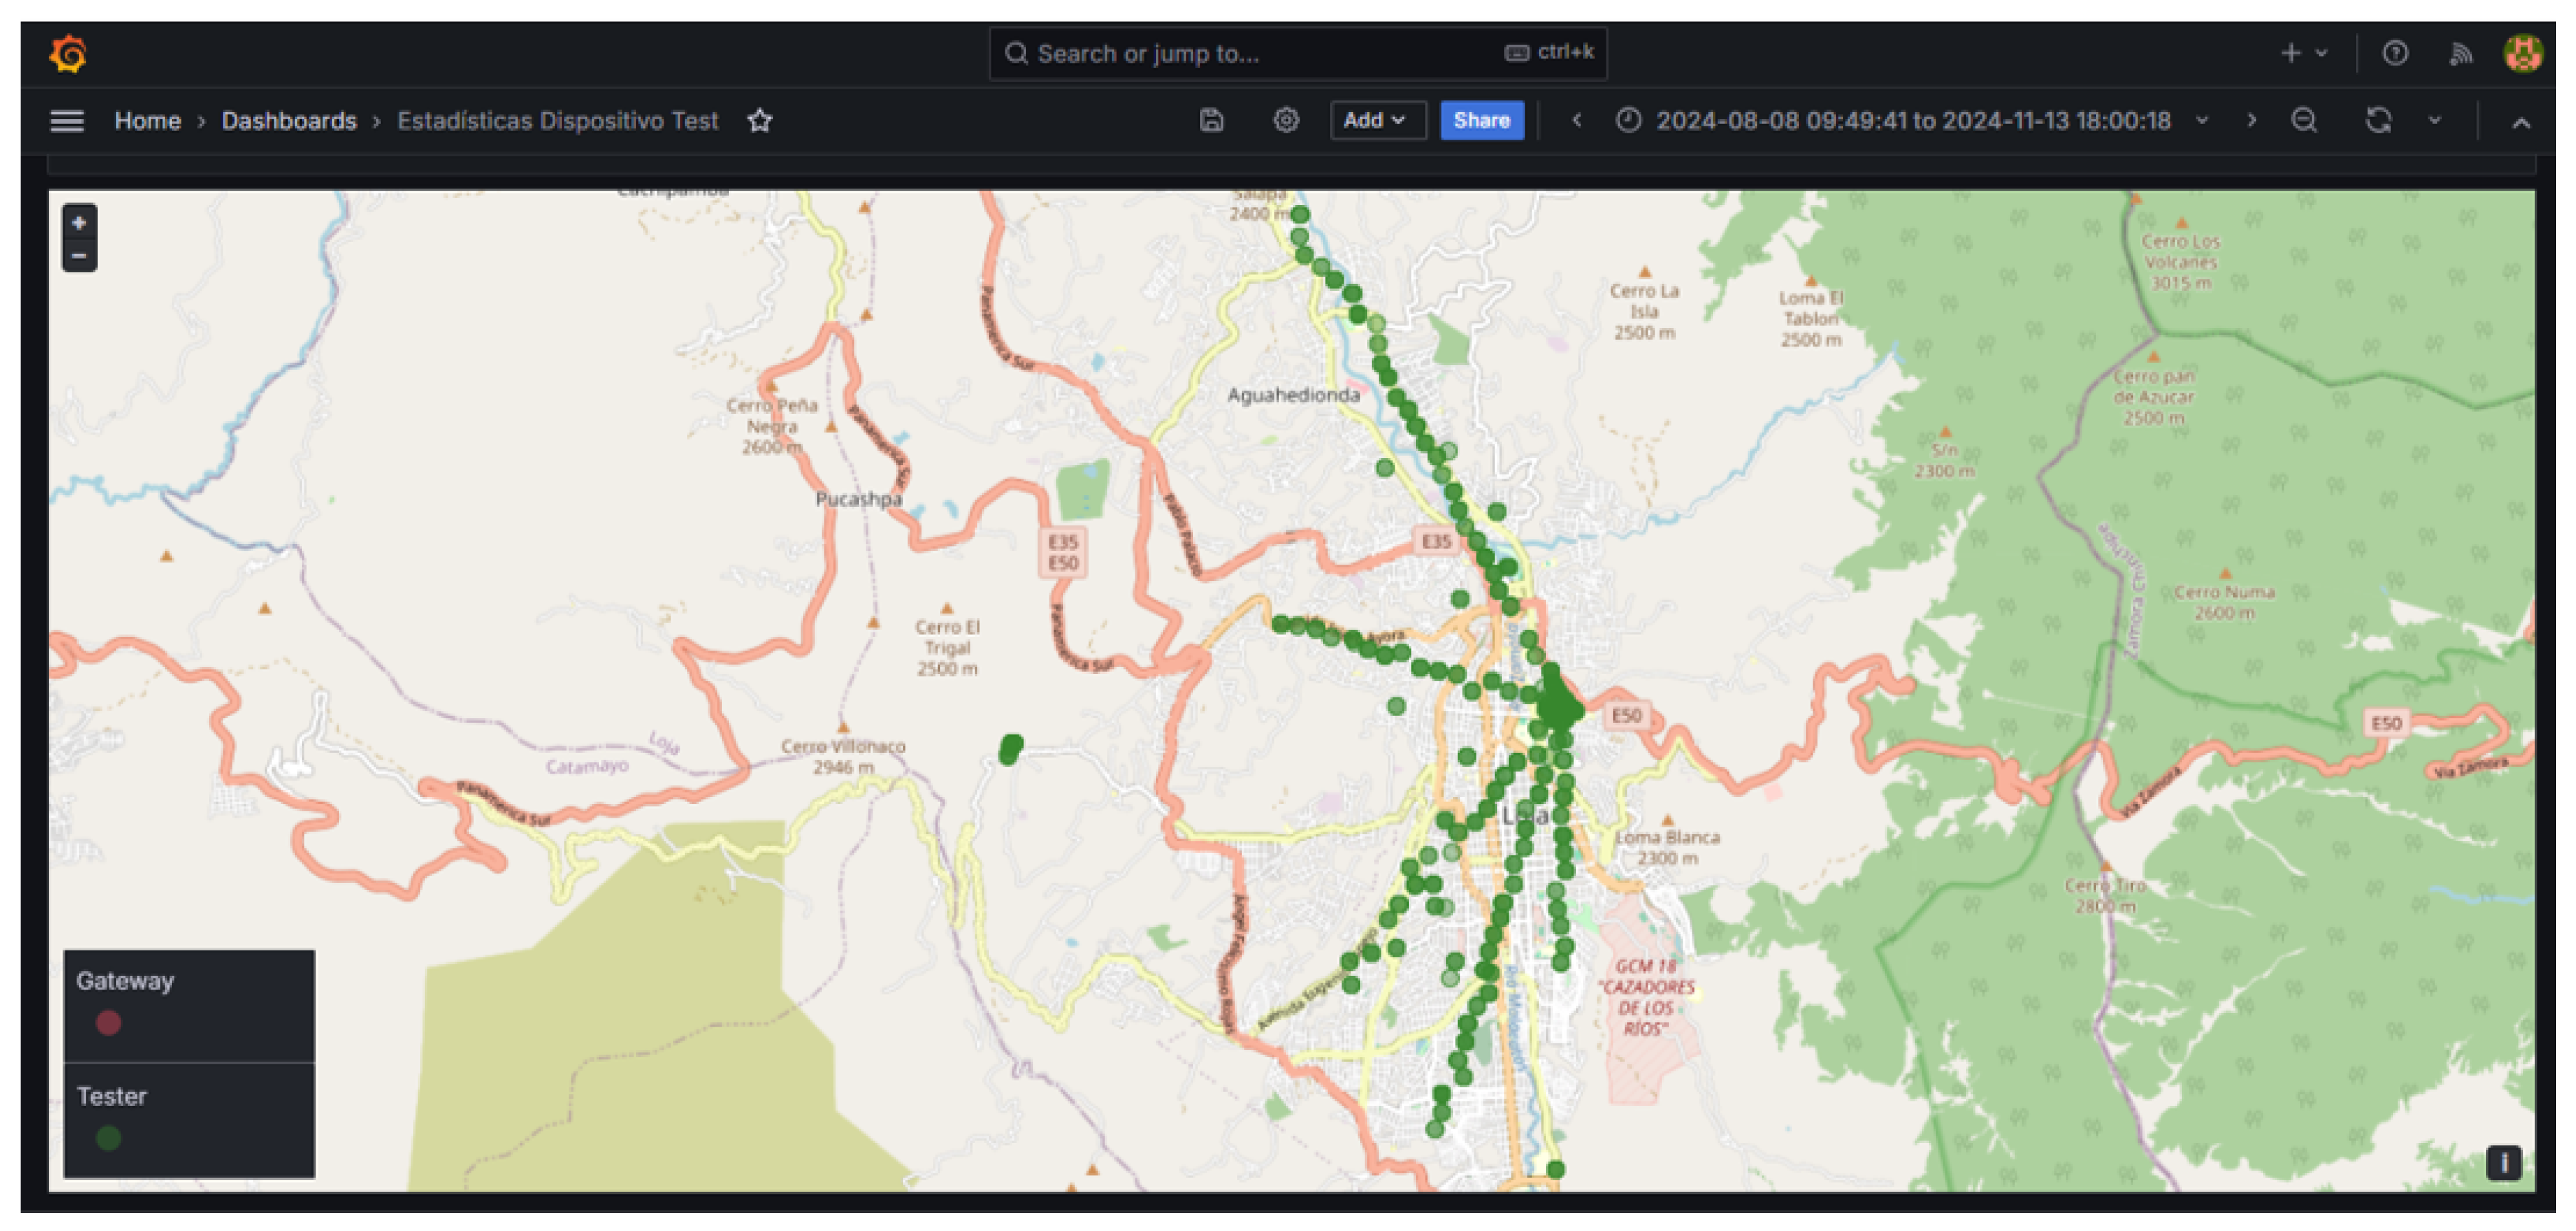

Table 1.
Comparison of different Low-Power Wide Area Network (LPWAN) technologies [10]. The standard for each technology is driven by multiple organizations. The modulation schemes used are Chirp Spread Spectrum (CSS), Binary Phase Shift Keying (BPSK), and Quadrature Phase Shift Keying (QPSK); the localization schemes used are Received Signal Strength Indication (RSSI) and Timed Difference of Arrival (TDOA). Adapted from [16,17].
| Feature | LoRaWAN | Sigfox | NB-IoT |
|---|---|---|---|
| Frequency Bands | Unlicensed | Unlicensed | Licensed |
| Range (Urban) | 5 km | 10 km | 1 km |
| Range (Rural) | 20 km | 40 km | 10 km |
| Max. Data Rate | 50 kbit/s | 0.1 kbit/s | 200 kbit/s |
| Max. Messages per Day | Unlimited | 140 Up, 4 Down | Unlimited |
| Modulation | CSS | BPSK | QPSK |
| Encryption | Yes | No | Yes |
| Adaptive Data Rate (ADR) | Yes | No | No |
| Private Networks | Yes | No | No |
| Gateways Location Determined By | Anyone | Operator | Operator |
| Localization | RSSI & TDOA | RSSI | No |
Table 2.
Preset parameters for statistics and its descriptions.
| Parameter | Description | Preset Values |
|---|---|---|
| Power | Transmission power | 2–20 dBm |
| Data Rate | Transmission data rate | DR0 to DR4 |
| Interval | Data sending interval | 1–10 s |
| Antenna | Antenna height | 1–500 cm |
| Samples | Number of tests conducted per point | 1–30 samples |
| TxR Link | Number of retries for link tests | 1–5 retries |
| TxR Send | Number of retries for data sending | 1–5 retries |
| TxP Inte | Power step interval for data scanning | 2:2:6 dBm |
Disclaimer/Publisher’s Note: The statements, opinions and data contained in all publications are solely those of the individual author(s) and contributor(s) and not of MDPI and/or the editor(s). MDPI and/or the editor(s) disclaim responsibility for any injury to people or property resulting from any ideas, methods, instructions or products referred to in the content. |
© 2025 by the authors. Licensee MDPI, Basel, Switzerland. This article is an open access article distributed under the terms and conditions of the Creative Commons Attribution (CC BY) license (http://creativecommons.org/licenses/by/4.0/).
Copyright: This open access article is published under a Creative Commons CC BY 4.0 license, which permit the free download, distribution, and reuse, provided that the author and preprint are cited in any reuse.


