
Submitted:
02 August 2024
Posted:
10 August 2024
You are already at the latest version
Abstract
Technological progress brings new tools to help society's development. In this context, the Internet of Things (IoT) helps to advance modern society. By connecting everyday objects and devices to the Internet, IoT enables benefits such as efficiency and automation, healthcare, environmental sustainability, safety, security, and data-driven decision-making. One of the possible technologies for devices' communication is LoRa, a wireless technology designed for the IoT that allows devices to communicate over long ranges using little battery power. This makes it useful for situations where it is needed to connect many devices spread out over a large area, like in smart cities or industrial settings. This paper aims to verify and evaluate the LoRa communication signal loss in a building environment. For this evaluation, we collected and processed data through experiments with LoRa links in the Instituto Federal de Pernambuco (IFPE) Campus.
Keywords:
Internet of Things
; IoT
; Signal Propagation
; LoRa
; LoRaWAN
1. Introduction
Low-power wide-area networks (LPWANs) are specialized telecommunication networks designed for transmitting small data packets over long distances while consuming minimal power. These networks enable IoT devices to operate efficiently without frequent battery replacements or recharging [1]. LPWANs can be implemented by various technologies such as SigFox, NB-IoT, and LoRa [2].
SigFox reaches long-range communication with minimal power consumption, however, it is a proprietary technology with limited bandwidth restricting data rates and use cases. Narrowband IoT (NB-IoT) uses licensed spectra, which ensures robust security and quality of service but comes at a steeper price point. In addition, LoRaWAN, a protocol built on top of Long Range Radio (LoRa) technology, employs spread spectrum modulation techniques that allow for long-range communication and is well-suited for connecting battery-operated devices to the Internet. LoRa is a patented technology, but it is available for general use [1]. Furthermore, LoRa operates in unlicensed spectrum bands [3], which enables the use of LoRaWAN without licensing fees. This openness fosters innovation and encourages community-driven deployments.
This way, LoRaWAN stands out for its openness, cost-effectiveness, and community-driven development. It fosters a wide range of use cases, from smart agriculture and asset tracking to smart cities and industrial monitoring. Its unlicensed spectrum approach empowers organizations and individuals to create private networks, democratizing IoT connectivity [1].
Given this context, the present paper aims to verify and evaluate the LoRa communication signal propagation loss in a building environment: the Instituto Federal de Pernambuco (IFPE) Campus. Through this analysis, we can better plan the deployment of antennas in indoor environments with similar characteristics, varying, for instance, the number of walls. To conduct this study, we performed experiments measuring the LoRa signal in communications with different distances, antennas, and configurations. With the preliminary results, we can evaluate path loss models to predict the LoRa signal propagation, comparing the predicted values with our measured ones and, perhaps, proposing adjustments for a specific model, if needed.
The remainder of this work is organized as follows. Section 2 presents related work on LoRa networks in building environments. Section 3 brings an overview of LoRa, and Signal Propagation concepts. Section 4 provides the validation plan of the experiment, including the requirements. Section 5 describes the execution of the experiment and shows the results. Finally, Section 6 concludes this paper.
2. Related Work
This Section presents some works related to LoRa signal strength in a building environment. Franksson & Liljegren [4] explore the limitations of LPWAN LoRa technology and how it can impact network implementations and products. The experiments show that the signal strength varied based on environmental factors such as distance, height, and surrounding area. In scenarios with no noise or signal obstruction, the signal strength remains strong even at distances exceeding 1100m, indicating a potential for long-range coverage. Furthermore, this thesis shows that the signal strength decays rapidly in environments with obstructions such as forests and urban areas, limiting the range to around 350m due to high noise levels and material density. In addition, this work demonstrates that exceeding the signal threshold of -120dBm led to packet corruption, making the data unreadable or lost completely. However, signal-to-noise ratio (SNR) has less impact on packet readability than signal strength, with packets being readable even at low SNR values. Packet loss was a critical consideration due to the limited duty cycles in LoRa transmissions, where lost packets could significantly impact data reliability.
Sanchez-Iborra et al. [5] studied the importance of LoRa technology in meeting the requirements of IoT applications such as smart cities, smart farming, and goods monitoring. According to the authors, LoRa technology addresses coverage, power consumption, and scalability issues in IoT applications by providing long-range communication capabilities, allowing devices to transmit data over several kilometers in urban, suburban, and rural environments. This extended coverage is achieved by using low-power transmissions and leveraging the sub-GHz bands, which have better propagation characteristics than higher frequency bands. In addition, LoRa devices enable long battery life for IoT devices and LoRaWAN offers a scalable solution for IoT deployments with various devices, which can accommodate the growing demand for IoT connectivity without compromising performance.
Paredes et al. [6] discussed the performance of LoRa networks in urban settings. This paper showed that LoRa enables long-range communication distances while consuming minimal power. This characteristic makes LoRa suitable for applications requiring communication over extended distances. In addition, LoRa operates in license-free frequency bands and facilitates the exchange of information at low data rates. This feature is advantageous for scenarios where limited data exchange is sufficient, and cost-effective devices and infrastructure are desired. The research highlights that LoRa can be utilized for ad-hoc networks deployed in urban areas. The analysis of propagation performance reveals insights into the maximum distance that LoRa technology can cover in urban areas. Path loss, shadowing, and multipath fading are considered, emphasizing the impact of urban conditions on radio link performance.
Finally, Griva et al. [7] study the performance of LoRa-based IoT networks in different environments. The assessment results in the study highlight key differences between rural and urban scenarios in terms of LoRa network performance. This paper shows that the network performance decreases with the increasing number of nodes in rural and urban environments. Further, the number and location of gateways, and the Equivalent Isotropically Radiated Power (EIRP), significantly impact the performance of LoRa networks. Other relevant parameters to LoRa implementations cited in this paper are transmission power, spreading factor, deployment area size, path loss models, and environmental conditions.
As we can see, many works are concerned with LoRa signal strength in various environments and deployments. The growing rise of IoT implementations highlights the importance of this kind of study applied to urban and rural environments and reinforces the motivation and justification of our work since it focuses on a building environment, which sets it apart from previous ones.
3. Background
This section briefly describes the main concepts approached in this work: LoRa, Chirp Spread Spectrum (CSS), Spreading Factor (SF), and signal propagation.
3.1. LoRa
Long Range Radio (LoRa) technology is a wireless communication protocol designed for the Internet of Things (IoT) [8]. It presents relevant features that make it a valid option for serving IoT networks. Among these features, we can cite long coverage range, since LoRa networks can reach up to 5 km in urban areas and 15 km in suburban areas; low power consumption, which allows devices to operate for extended periods; adaptative data range due to adaptative rate technique that adjusts output data rate of end devices; use of Chirp Spread Spectrum (CSS) modulation [9], a robust modulation that provides orthogonal transmissions at different data rates (Section 3.1.1); and simple architecture consisted of LoRa Gateways, servers, and end devices, that makes deployment easy.
These features make it possible to use the LoRa technology in different applications. LoRa is widely used for machine-to-machine (M2M) and IoT networks, such as smart agriculture (i.e., monitoring soil moisture, and weather conditions), asset tracking, and environmental sensing. Furthermore, industrial monitoring, smart city solutions, such as smart parking, waste management, and street lighting control, and utilities, such as water and gas metering, benefit from LoRaâs long range and low power consumption [9,10].
The myriad of LoRa applications offer many benefits to the LoRa-based wide area network (LoRaWAN). These networks operate in the 868 MHz / 915 MHz industrial, scientific, and medical (ISM) bands, available worldwide and generally do not require licensing. In addition, LoRa Gateway can handle thousands of end devices or nodes [9,11].
However, LoRaWAN is suitable for low data rate applications (up to about 27 Kbps), its network size is constrained by duty cycle regulations, affecting channel occupancy time, and LoRa technology is not ideal for real-time applications with strict latency and jitter requirements [8]. These limitations should be considered based on specific use cases [11], despite LoRa technology having several possible uses [9].
3.1.1. Chirp Spread Spectrum—CSS
Chirp Spread Spectrum (CSS) is a spread spectrum technique used in digital communications. It employs wideband linear frequency modulated chirp pulses for encoding. A chirp is a sinusoidal signal whose frequency increases or decreases over time, according to a polynomial expression for the relationship between time and frequency. CSS spreading technique relies on the chirp pulse linearity, unlike other spread spectrum methods (such as direct-sequence spread spectrum, DS-SS or frequency-hopping spread spectrum, FH-SS), that add pseudo-random elements to the signal. CSS is robust against channel noise, resistant to multi-path fading even at low power, and unaffected by the Doppler effect typical in mobile radio applications [12].
3.1.2. Spreading Factor—SF
Spreading factor (SF) is an important attribute in CSS-based LoRa modulation. SF controls the chirp rate, which, in turn, determines the speed of data transmission. The lower the SF the faster the chirps, leading to a higher data transmission rate. Conversely, increasing the SF halves the chirp sweep rate and, consequently, reduces the data transmission rate. Larger SFs provide more processing gain, allowing signals modulated with higher SF to be received with fewer errors. As a result, signals with higher SF can travel longer distances compared to those with lower SF.
For example [13], at bandwidth provides a 5.5 kbits/s bit rate. However, at bandwidth provides a 21.9 kbits/s bit rate. In addition, The receiver sensitivity, with a fixed bandwidth, is for and for (
3.2. Signal Propagation
Radio propagation is influenced by various phenomena that impact the behavior of electromagnetic waves as they travel through different environments. Some of these phenomena [14] are: radio wave reflection in obstacles that can cause multipath interference; diffraction, which allows signals to propagate beyond the line of sight when encountering edges or corners of obstacles; absorption, that occurs when the signal faces some materials such as water, building, and vegetation, that absorb part of the radio waves; scattering from small particle or irregular surfaces; free space path loss, the signal intensity decreasing due to the distance.
LoRaWAN technology is designed for long-range communication with low power consumption. So, its performance can be significantly impacted by environmental phenomena that influence radio propagation [15], especially by: strong attenuation in forests due to some characteristics such as vegetation, climate variation, and Non-Line-of-Sight (NLoS) conditions; obstacles and environmental variations in urban and suburban areas; propensity to link disruption due to high-speed mobility; and the spreading factor (SF) dilemma, since lower SF (e.g., SF7) provide higher data rates but shorter range and higher spreading factors (e.g., SF12) extend range but reduce data rate.
This reduction in an electromagnetic wave’s power density (attenuation) as it propagates through space is known as Path Loss. This effect is important in analyzing and designing the link budget of a telecommunications system, especially in wireless communications. Some examples of path loss models are [16]: The Free Space Loss Model assumes no obstructions or reflections in the signal path. It is a simple and widely used estimate in initial calculations of cell coverage in cellular systems. The Okumura-Hata Model is empirical, and based on real measurements. Consider factors such as frequency, antenna height, and type of environment. It is often used in mobile phone systems. The Walfisch-Ikegami Model considers diffraction and reflection in urban scenarios and is used to assess coverage in densely built-up areas. The Log-Distance Path Loss (LDPL) Model [17] combines the free space effect with attenuation due to obstacles and reflections in point-to-point link design and coverage analysis in complex environments.
This way, it is important to understand environmental factors and their impact on signal propagation for deploying radio systems and, more specifically, LoRa networks.
4. Experimental Methodology
Two devices, one transmitter (Tx), and one receiver (RX), evaluate the LoRa signal behavior. Both devices are TTGO LoRa32 equipment, an ESP32 microcontroller that uses LoRa communication technology [18], as illustrated in Figure 1. The transmitter was programmed to send 10 consecutive messages to obtain a better analysis of the data sent. Each of the messages sent contains a text, to verify the sending of data in the format of characters and an integer. All of this occurs during intervals of one second between each transmission.
The receiver, in turn, is configured to receive this information and save it in a CSV file, including the message, the Received Signal Strength Indicator (RSSI), and the Signal-to-Noise Ratio (SNR). The RSSI is a relative measurement that helps determine the strength of the received signal to ensure a robust wireless connection from the transmitter [19]. The SNR is the relationship between the power of the received signal and the background noise, commonly used to evaluate the quality of the received signal [20]. RSSI and SNR are obtained through functions that the LoRa library uses in Arduino. The function âLoRa.packetRssi()â obtains the RSSI measurement, and the function âLoRa.packetSnr()â obtains SNR data [21].
The transmitter and receiver were configured with the following parameters: Transmission Power (TP), which can vary between 0 and 14, will be maintained at its maximum value; Carrier Frequency (CF), adjusted according to Industrial, Scientific, and Medical (ISM) radio frequencies of the operating region, being 915 MHz in South America [22]; Spread Factor (SF), located in the range of 7 to 12; and Bandwidth (BW), adjusted to 125 kHz, 250 kHz and 500 kHz [7]. The functionality capacity of the device defines this information. Among these parameters, only the Spread Factor (SF) will be the variable chosen to carry out the analysis, as it is responsible for the amount of data sent, while the other parameters remain constant. SF = 12 represents a greater impact on communication performance than SF = 7 [23].
During the experimentation, the transmitting equipment maintained its native antenna. However, two antennas were used in the receiving equipment. The first is the native antenna of the TTGO LoRa32, model TX915-JZ-5, called Antenna 1. The second is a more powerful Steelbras Ap3900 antenna, identified as Antenna 2. The details of the antennas are shown in Table 1.
The test was carried out at the Federal Institute of Pernambuco, Caruaru City Campus, for three days. The spot allocates the receiver. The transmitter is positioned on the 16 spots, including . Figure 2 shows the test location and the distances between the receiver and the transmitter, when located in each position, expressed in meters. The Tx/Rx distances are also highlighted in Table 2.
The analysis of the collected data involved steps of understanding and preparing the data obtained from the six tests carried out: three of which the receiver was equipped with Antenna 1 and the others with Antenna 2. Next, the RSSI values obtained were evaluated, considering the different measurements due to changes in SF values and positioning of the transmitter in the 16 spots.
Throughout the measurement process, 2880 sets of data were collected. Each data set contains values for SF, antenna type, tested location, sending time, message sent, RSSI, and SNR. The configuration used establishes communication aiming at maximum power, with CF adjusted for the South American region of and BW optimized for long-distance sending with a value of . It is important to notice that SF was adopted as a variable in this analysis, as it directly influences the transmission data reach.
5. Results and Discussions
We collected the LoRa signal level at reception in six tests for each configuration, changing the receiver antenna between Antenna 1 and Antenna 2 and the transmitter position from spot P0 to spot P15. Figure 3 and Figure 4 graphically present the RSSI value [dBm] varying according to the distance of the 16 transmitter positions. Figure 3 shows the results from the configuration with Antenna 1 and Figure 4 shows the results with Antenna 2. In these figures, blue indicates the first test carried out with the adopted configuration and , red represents the second test (), and yellow represents the third test ().
Figure 3 shows better results when using the configuration with up to a distance of 30 m. After this distance, there is no clear advantage among these configurations, however the shows marginally better performance.
Figure 4 brings different results. In this case, and present RSSI higher values across the entire distance range, with a small advantage to the configuration.
Figure 5 depicts the first test conducted with Antenna 1, employing the same signal configuration as previously presented in Figure 3. The colors represent the RSSI level when sending data. Blue represents optimal signal transmission and red means receiving the LoRa signal during the test was impossible. It is observed that the spots , , , , and , indicated by the colors green and blue, did not face difficulties in receiving data due to their relatively short proximity between the transmitter and the receiver. Points , , and received all the data, but the RSSI decreased with the increase in the number of obstacles during the test. Finally, points , , and showed no signal reception.
Figure 6 represents the second test using Antenna 2 with as an example for data presentation. It is observed that the spots , , , , , and , indicated by the colors green and blue, did not face difficulties in receiving data due to their relatively short proximity between the sender and the receiver. Spots , , , , , and received all data, but RSSI decreased with obstacles during transmission. The other spots, in orange, received the signal with lower intensity. Still, there was no complete data loss during this test, demonstrating that the LoRa signal with this configuration covered all spots.
6. Conclusion and Future Work
This work verified and evaluated signal loss in LoRa communication by collecting and processing data from implementing LoRa links on the IFPE campus in Caruaru City. The collected data show that, using Antenna 1, the most efficient configuration is based on . With Antenna 2, the system presents better results with , highlighting that the configuration with Antenna 2 and allowed effective data transmission in all 16 spots. So, we can infer that the non-native antenna, which provides a higher gain, presents higher coverage. When analyzing the data acquired from each antenna individually, it was possible to verify that, for the Antenna 1 case, the increase in the SF causes a marginal decrease in the RSSI value. However, the increase in the SF causes an increase in the RSSI value for the Antenna 2 case. The apparent contradiction between increasing SF and decreasing distance reach in the first case is left for future work.
This work did not consider different obstacles and terrain, which can also be left for future work, even as analyzing different path loss models and using them to develop a specific model for building environments based on machine learning. Another future topic of interest is developing a system for transmitting data to a workstation for more efficient information collection and processing.
Acknowledgments
The authors thank Conselho Nacional de Desenvolvimento Cientà fico e Tecnológico (CNPq) and Fundação Coordenação de Aperfeiçoamento de Pessoal de Nà vel Superior (Capes) for partial financing of this work and the Instituto Federal de Pernambuco (IFPE) and Universidade Federal de Campina Grande (UFCG) for academic and infrastructure support.
References
- LoRaWAN vs NB-IoT: A Comparison Between IoT Trend-Setters.
- Lavric, A.; Petrariu, A.I.; Coca, E.; Popa, V. LoRa Traffic Generator Based on Software Defined Radio Technology for LoRa Modulation Orthogonality Analysis: Empirical and Experimental Evaluation. Sensors 2020. [CrossRef]
- Urabe, I.; Li, A.; Fujisawa, M.; Kim, S.; Hasegawa, M. Combinatorial MAB-Based Joint Channel and Spreading Factor Selection for LoRa Devices. Sensors 2023. [CrossRef]
- Franksson, R.; Liljegren, A. Measuring a LoRa Network Performance, Possibilities and Limitations. Master’s thesis, Blekinge Institute of Technology, 2017.
- Sanchez-Iborra, R.; Sanchez-Gomez, J.; Ballesta-Viñas, J.; Cano, M.; Skarmeta, A. Performance Evaluation of LoRa Considering Scenario Conditions. Sensors 2018. [CrossRef]
- Paredes, M.; Bertoldo, S.; Carosso, L.; Lucianaz, C.; Marchetta, E.; Allegretti, M.; Savi, P. Propagation measurements for a LoRa network in an urban environment. Journal of Electromagnetic Waves and Applications 2019. [CrossRef]
- Griva, A.; Boursianis, A.D.; Wan, S.; Sarigiannidis, P.; Psannis, K.E.; Karagiannidis, G.; Goudos, S. LoRa-Based IoT Network Assessment in Rural and Urban Scenarios. Sensors 2023. [CrossRef]
- Analysis of the advantages and disadvantages of LoRa wireless technology.
- LoRa Advantages Of LoRaWAN Disadvantages Of LoRaWAN.
- Why LoRa?
- Advantages of LoRa.
- Maleki, A.; Nguyen, H.H.; Bedeer, E.; Barton, R. A Tutorial on Chirp Spread Spectrum for LoRaWAN: Basics and Key Advances, 2023, [arXiv:eess.SP/2310.10503].
- Spreading Factors.
- Norton, K. System loss in radio wave propagation. Proc. IRE 1959.
- Ferreira, A.; Ortiz, F.; Costa, L.; Foubert, B.; Amadou, I.; Mitton, N. A study of the LoRa signal propagation in forest, urban, and suburban environments. Annals of Telecommunications 2020. [CrossRef]
- Etuk Uyoata, U. LoRa Network Planning Using Empirical Path Loss Models. 2022 IEEE Nigeria 4th International Conference on Disruptive Technologies for Sustainable Development (NIGERCON), 2022. [CrossRef]
- Valadares, D.C.G.; de Araújo, J.M.F.R.; Perkusich, Â.; Spohn, M.A.; Melcher, E.U.K.; Albuquerque, N.P. Towards 802.11 g signal strength estimation in an industrial environment: A practical study. Proceedings of the 33rd International Conference on Advanced Information Networking and Applications 2019). Springer, 2020.
- TTGO LoRa32 SX1276 OLED Board: Getting Started with Arduino IDE.
- LoRa â LoRa documentation.
- RSSI and SNR.
- An Arduino library for sending and receiving data using LoRa radios.
- Ulloa-Vasquez, F.; Carrizo, D.; Garcia-Santander, L. Comparative study of the cost of implementing wireless technologies for IoT and M2M for the last mile: A case study. Ingeniare: Revista Chilena de Ingenieria 2022.
- Kim, S.; Lee, H.; Jeon, S. An Adaptive Spreading Factor Selection Scheme for a Single Channel LoRa Modem. Sensors 2020. [CrossRef]
Figure 1.
TTGO LoRa 32 device.
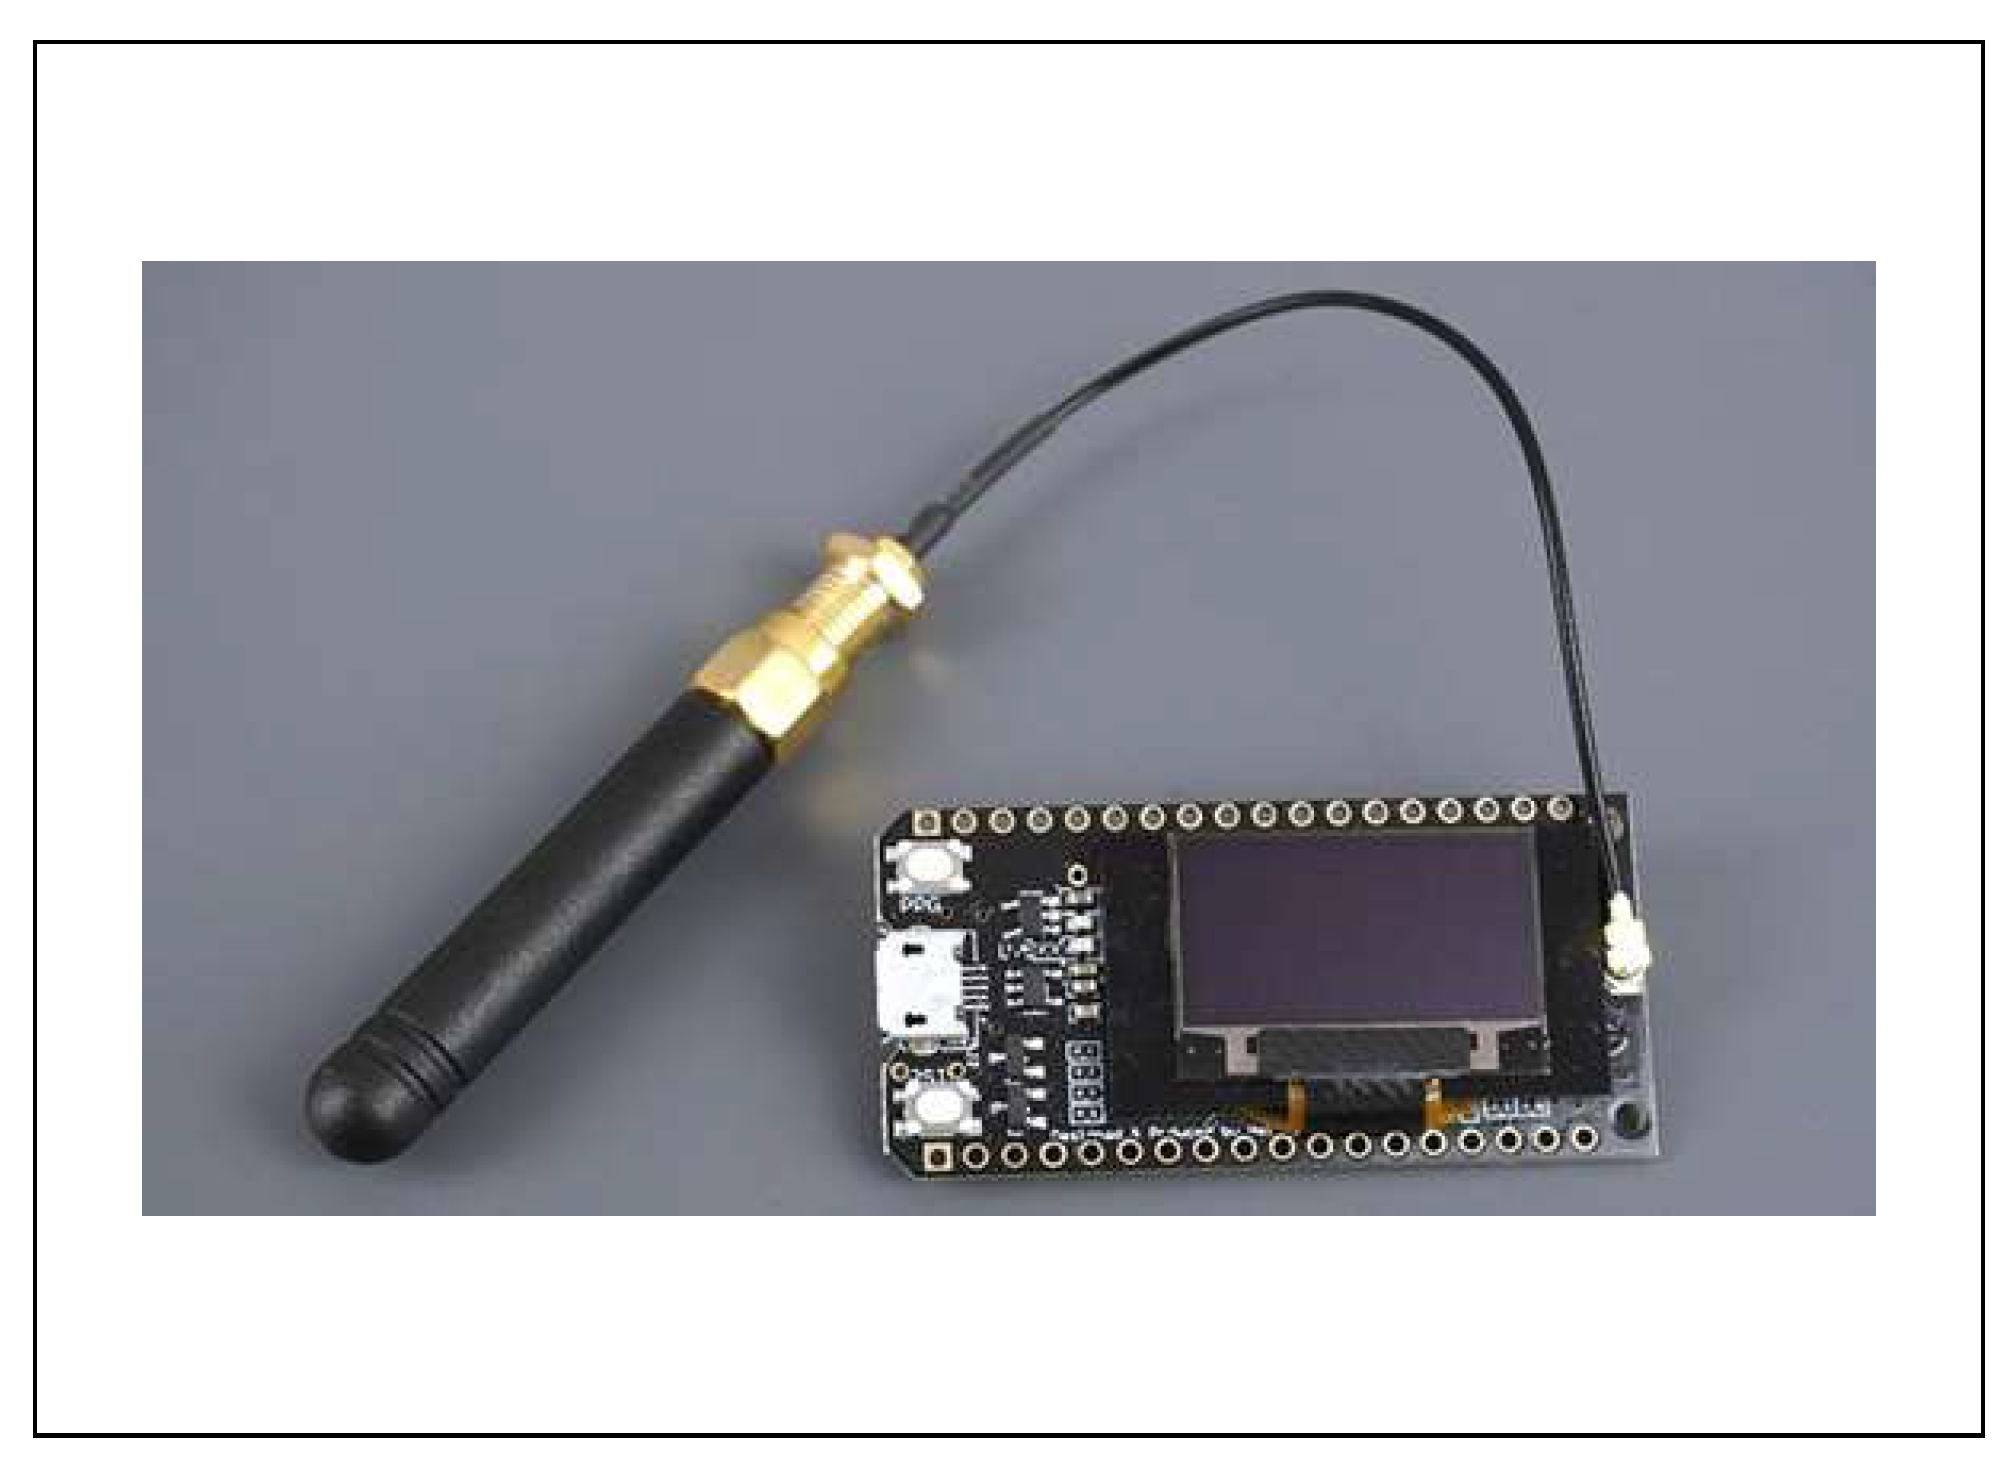
Figure 2.
IFPE Caruaru Campus.
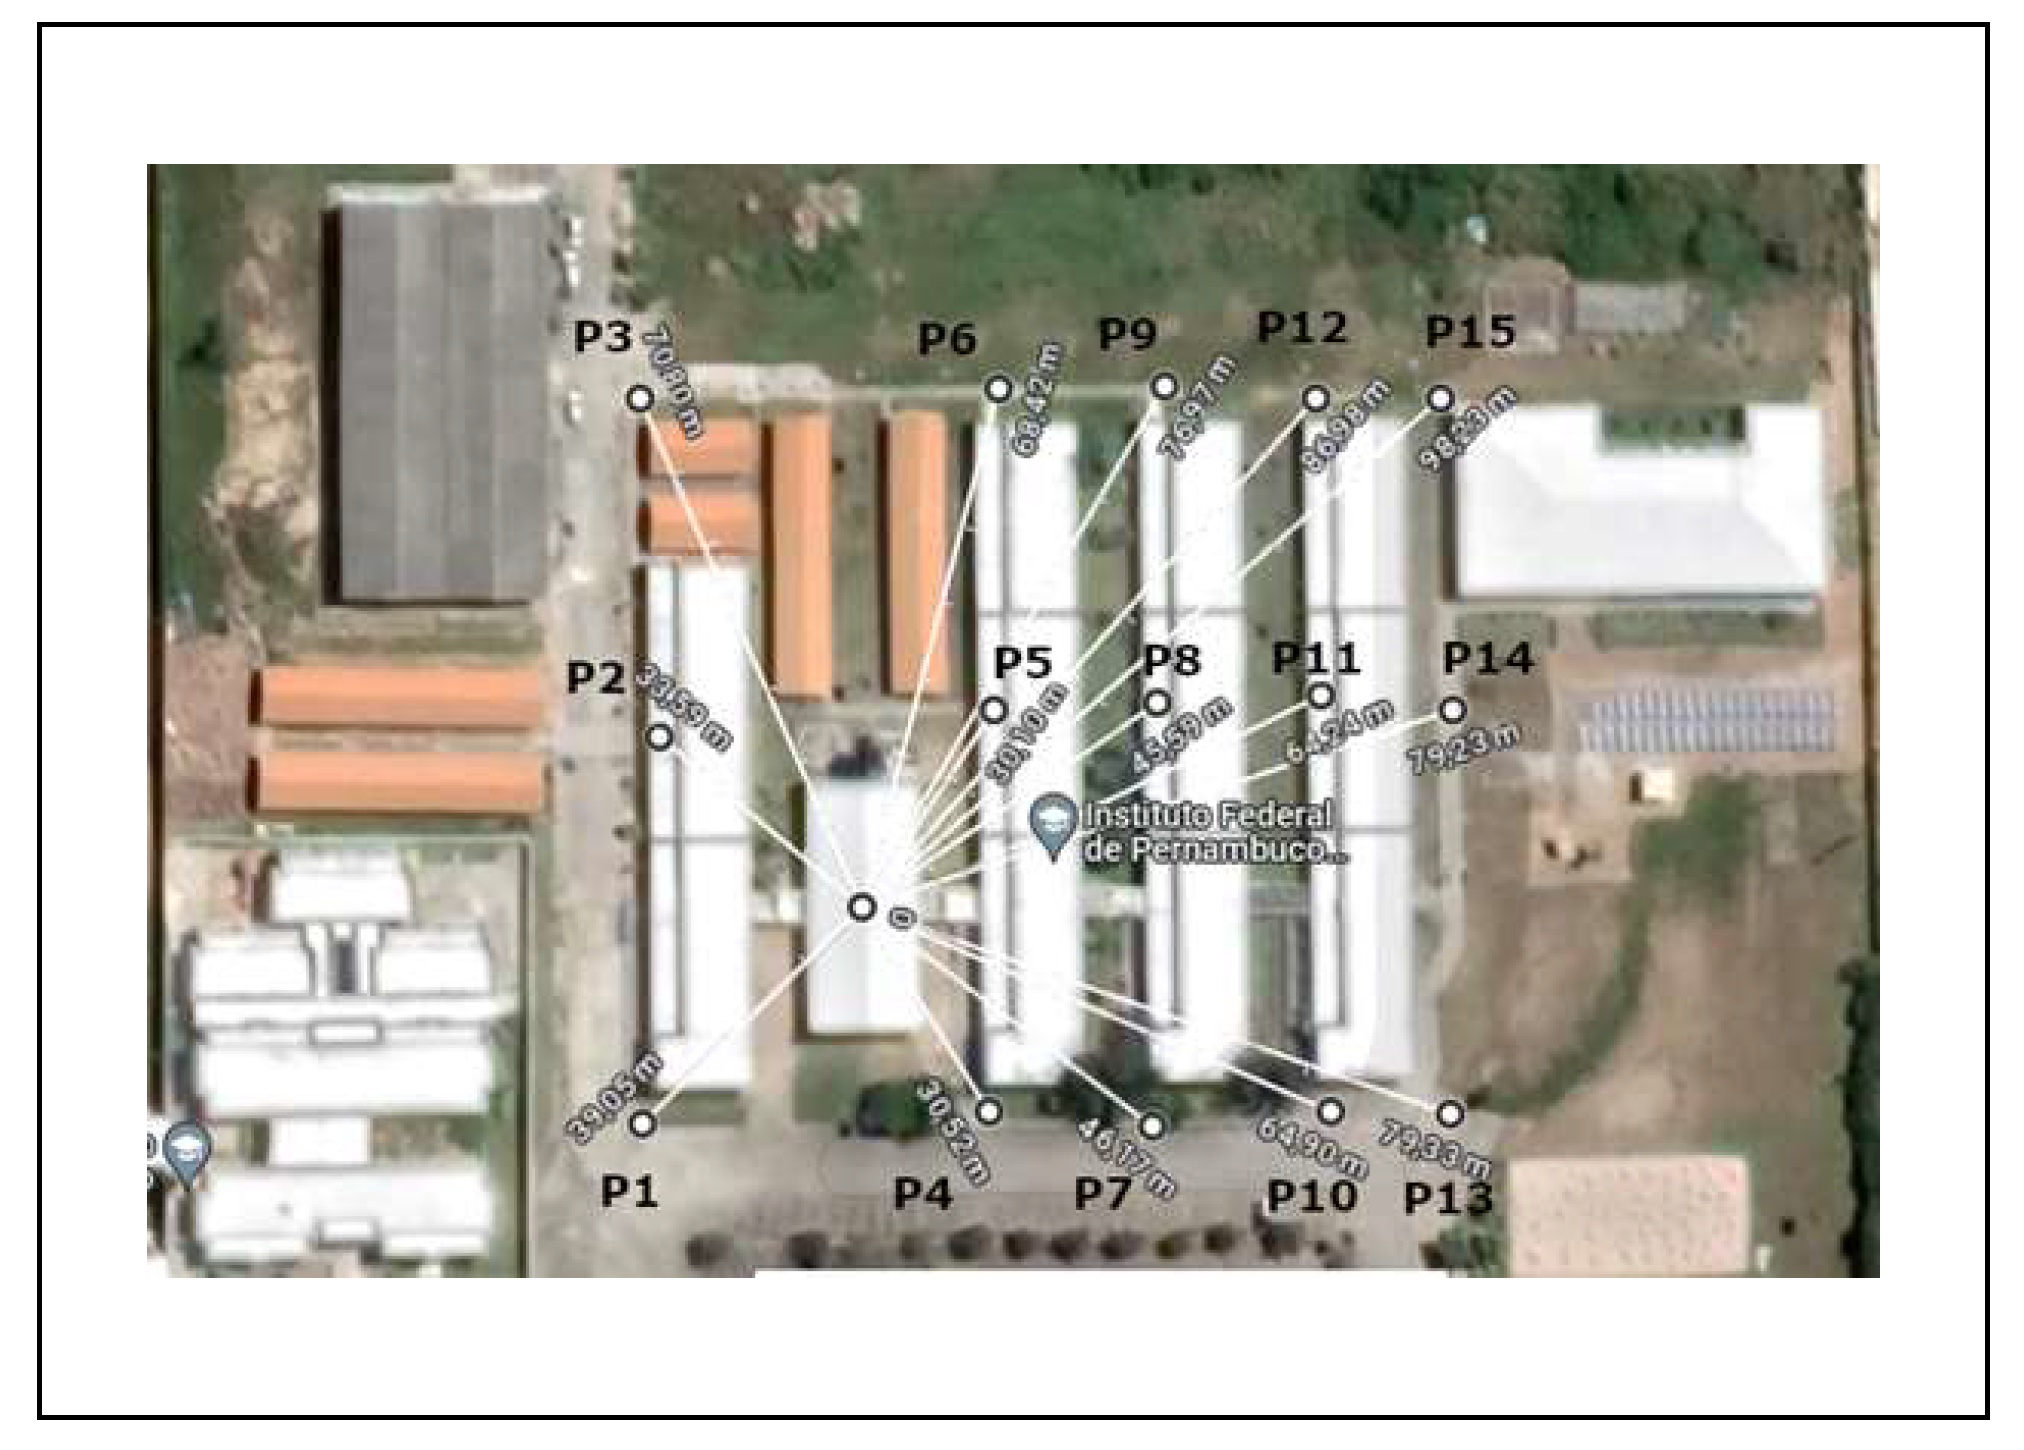
Figure 3.
Antenna 1 RSSI measurements.
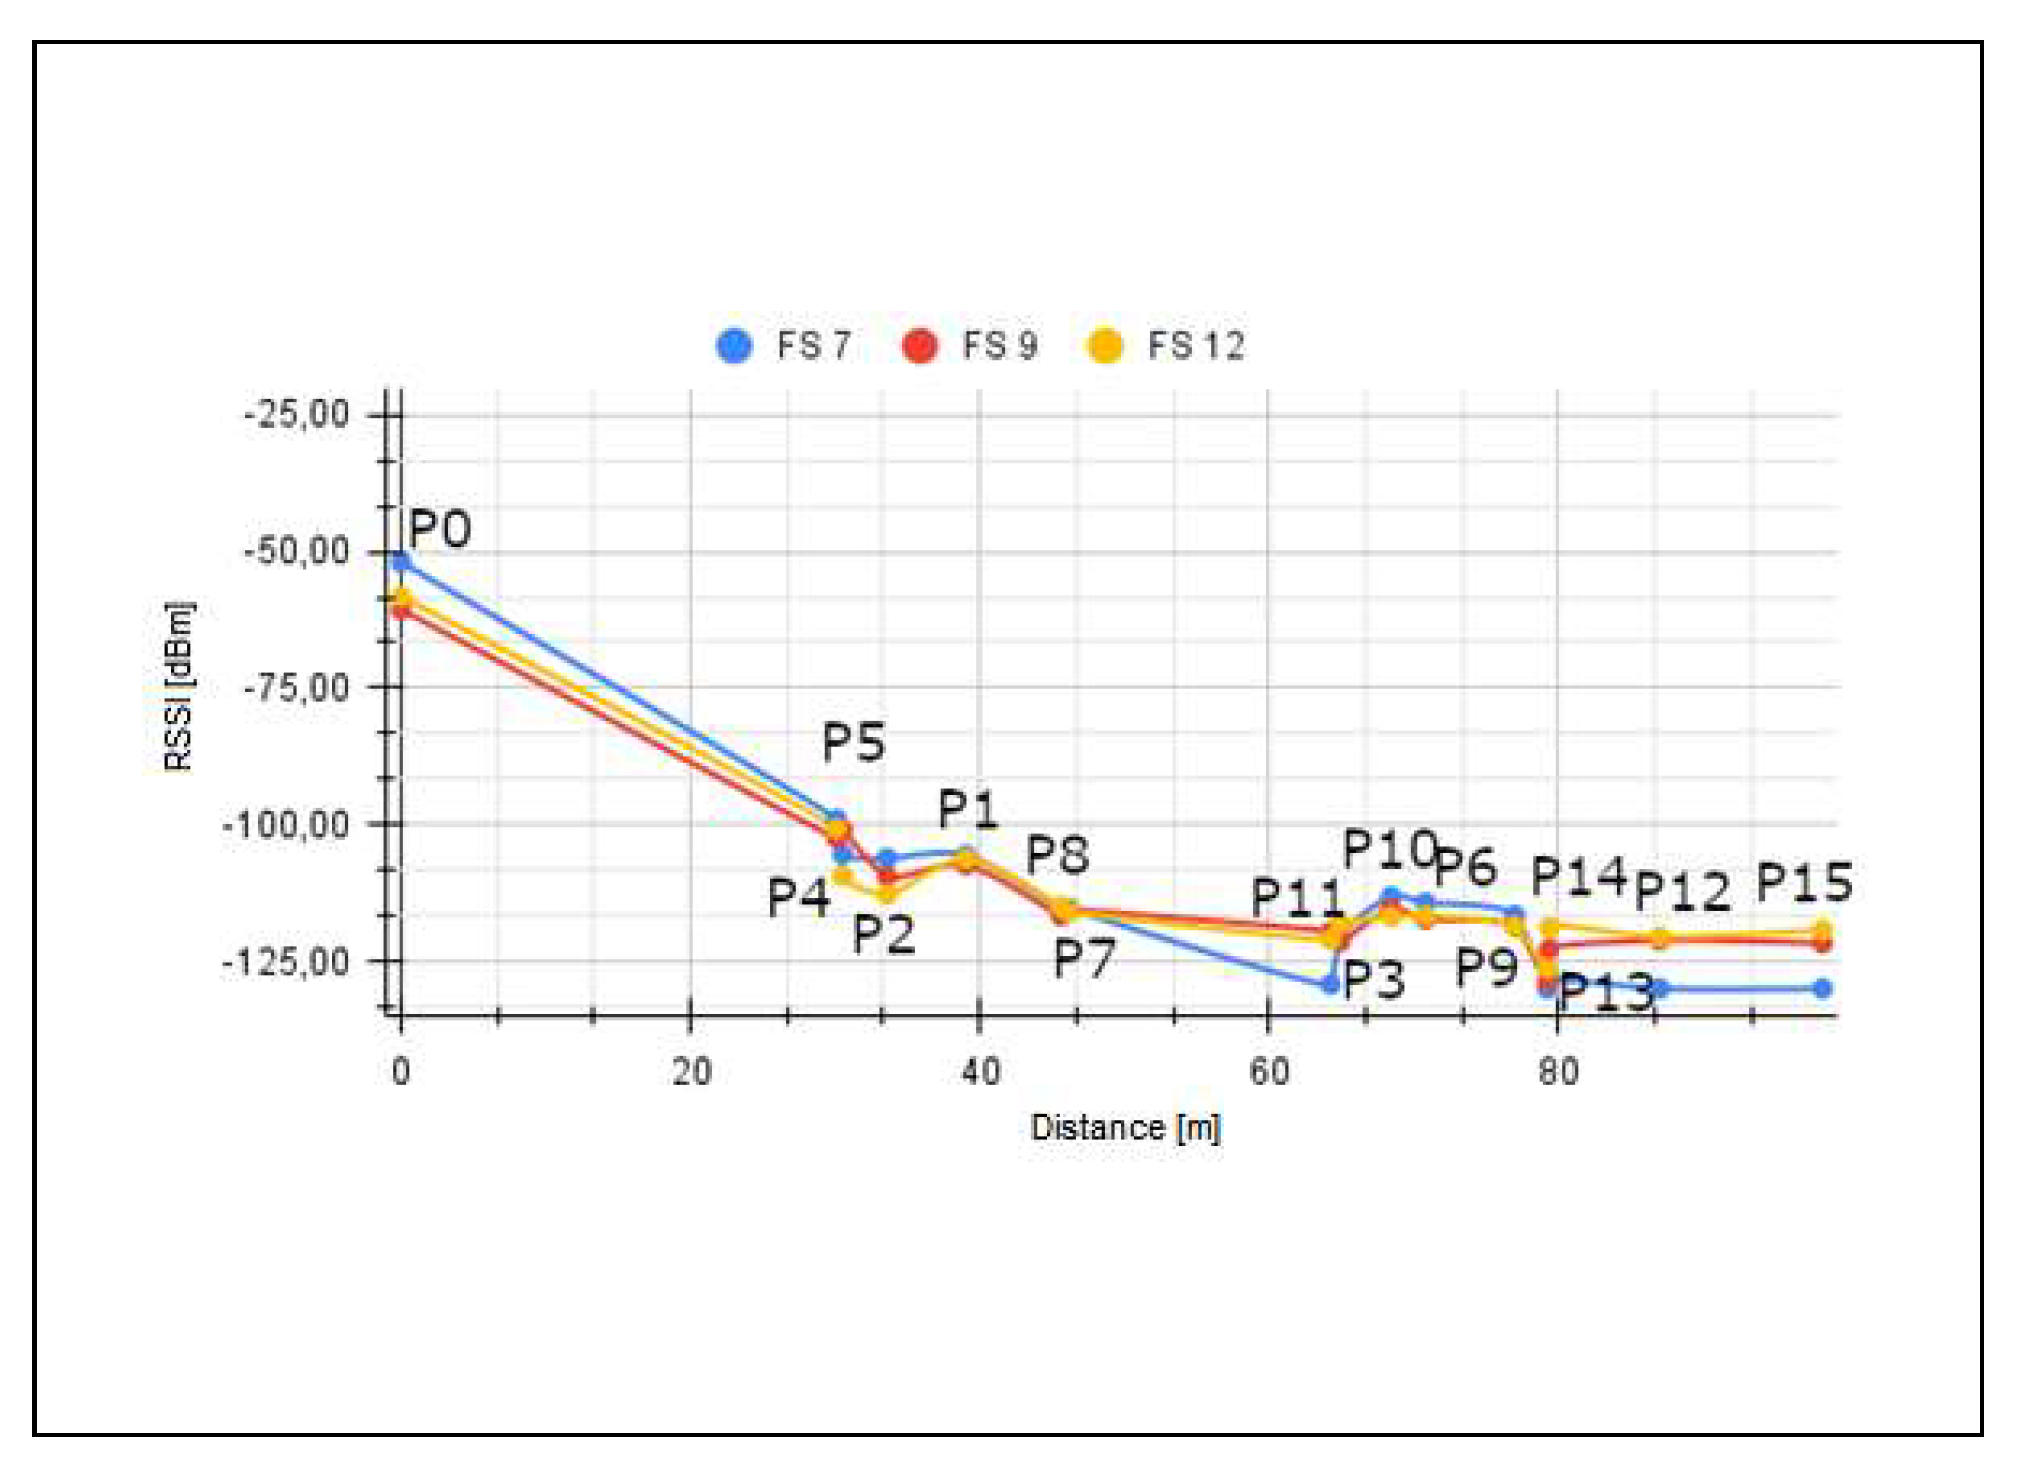
Figure 4.
Antenna 2 RSSI measurements.

Figure 5.
RSSI measurements for Antenna 1 Test 1.
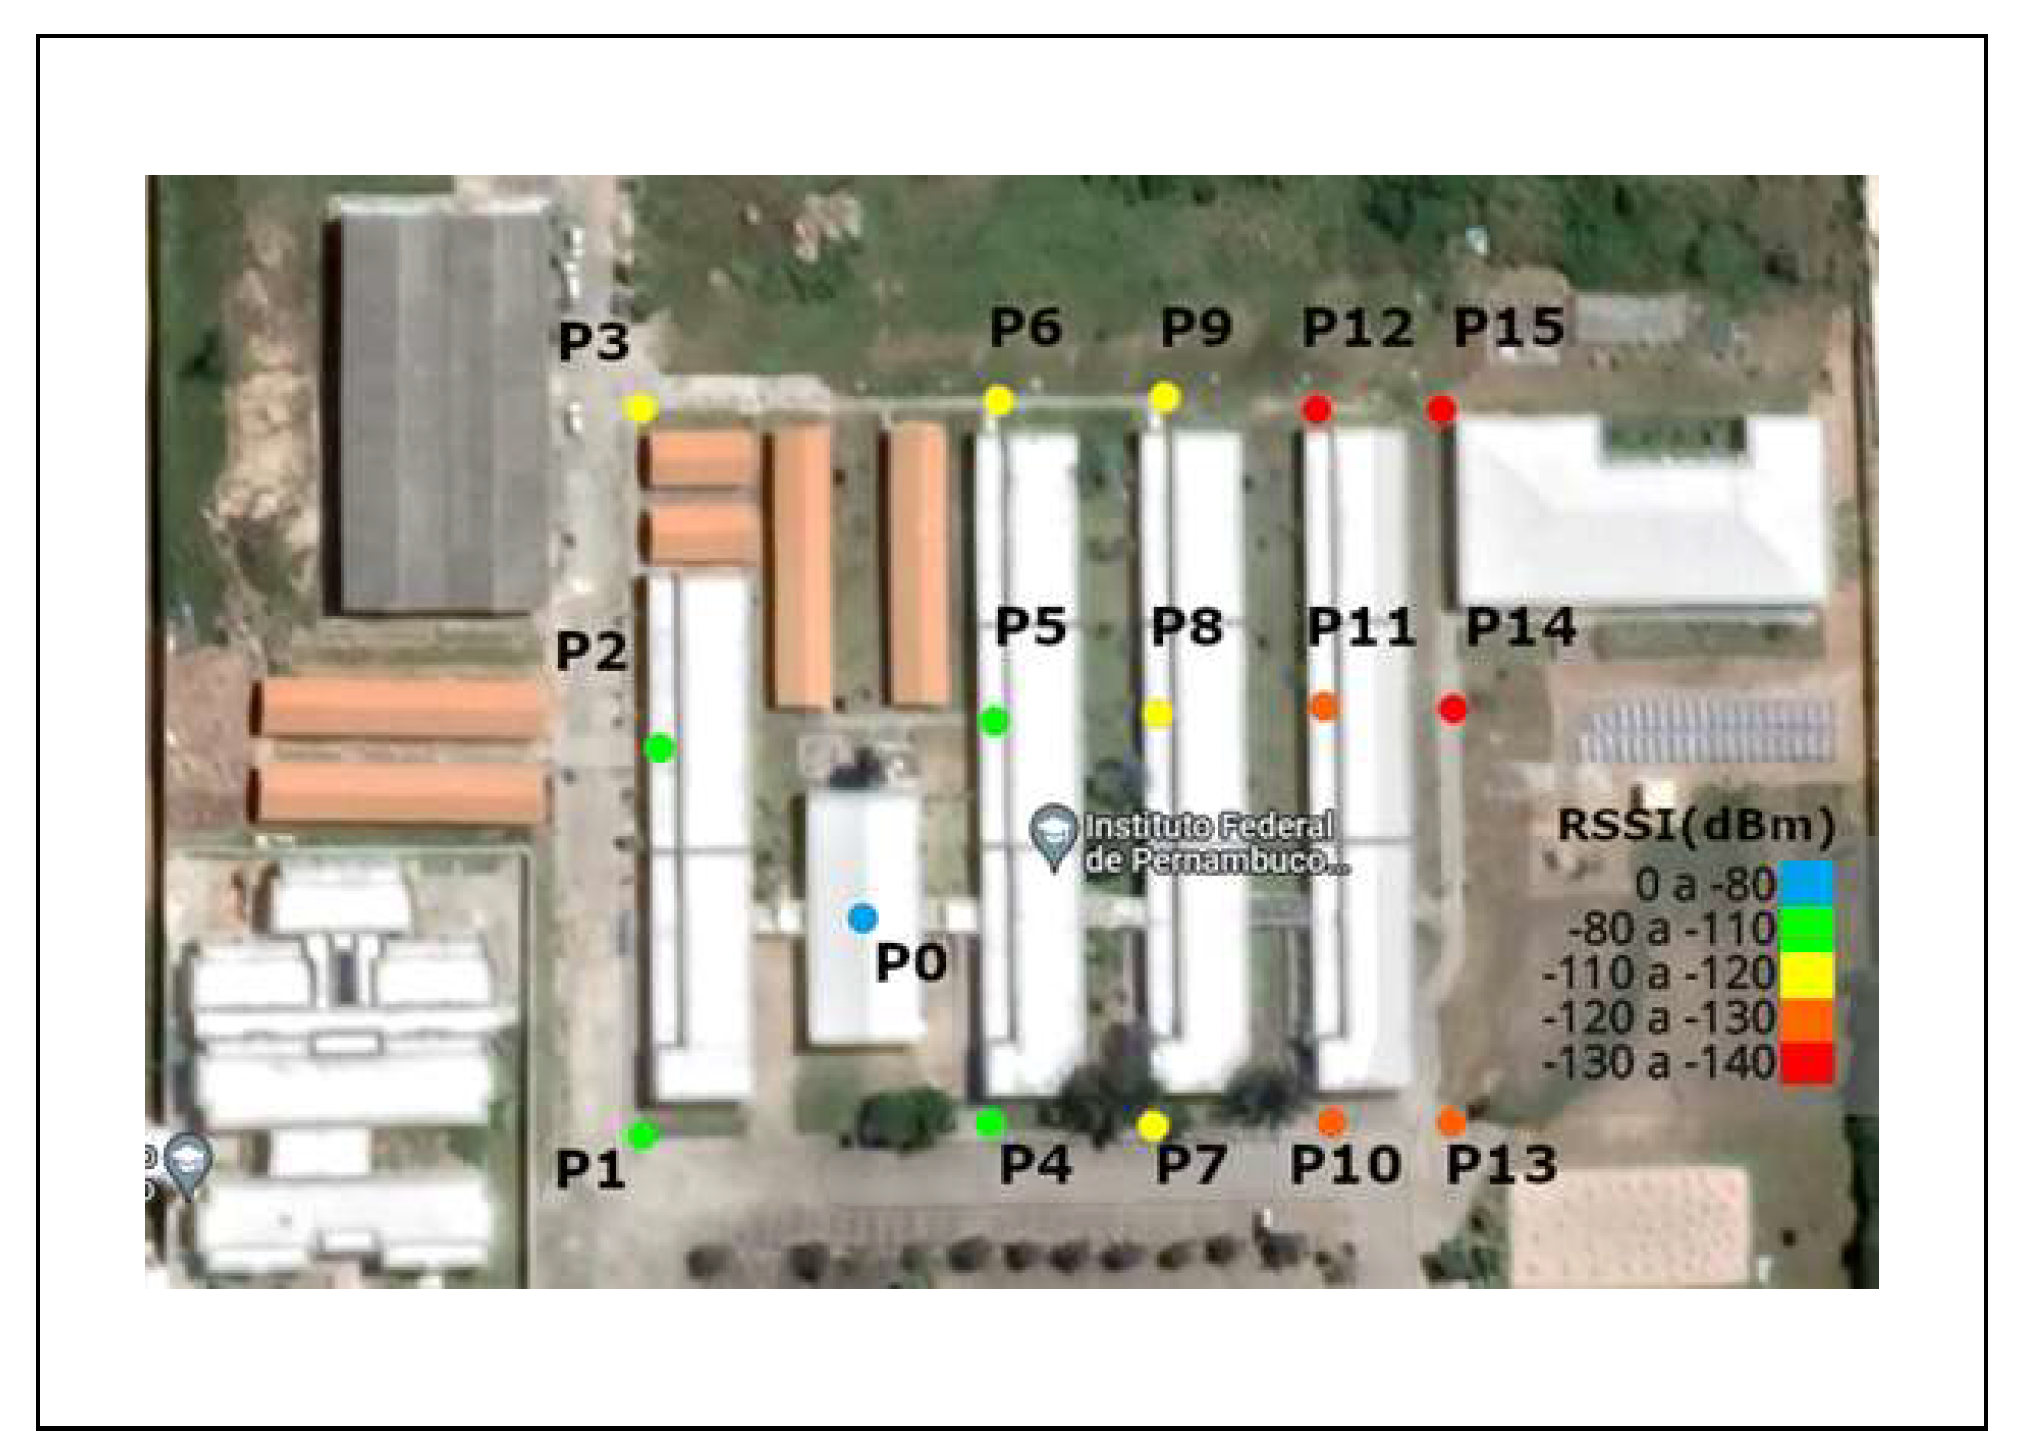
Figure 6.
RSSI measurements for Antenna 2 Test 2.


Table 1.
Characteristics of the Antennas.
| Antenna | Model | Power [W] | Gain [dBi] |
|---|---|---|---|
| 1 | TX915-JZ-5 | 10 | 2 |
| 2 | Steelbras Ap3900 | 100 | 5 |
Table 2.
Distances between Rx and Tx.
| Spot | ||||||||
| Dist. [m] | 0 | 39.1 | 33.6 | 70.8 | 30.5 | 30.1 | 68.4 | 46.2 |
| Spot | ||||||||
| Dist. [m] | 45.6 | 77.0 | 64.9 | 64.2 | 87.0 | 79.3 | 79.2 | 98.2 |
Disclaimer/Publisher’s Note: The statements, opinions and data contained in all publications are solely those of the individual author(s) and contributor(s) and not of MDPI and/or the editor(s). MDPI and/or the editor(s) disclaim responsibility for any injury to people or property resulting from any ideas, methods, instructions or products referred to in the content. |
© 2024 by the authors. Licensee MDPI, Basel, Switzerland. This article is an open access article distributed under the terms and conditions of the Creative Commons Attribution (CC BY) license (http://creativecommons.org/licenses/by/4.0/).
Copyright: This open access article is published under a Creative Commons CC BY 4.0 license, which permit the free download, distribution, and reuse, provided that the author and preprint are cited in any reuse.


