Submitted:
27 March 2025
Posted:
28 March 2025
You are already at the latest version
Abstract
Insects play a crucial role in ecosystem stability, biodiversity conservation, and environmental monitoring. Their diversity, distribution, and population dynamics are essential indicators of ecological health, particularly in regions undergoing environmental or anthropogenic changes. This study examines the variety of insects in urban, suburban, and rural environments in Kekedala City, Xinjiang, China, between April and August 2023. 63,090 specimens in all, belonging to 123 taxa and 57 families, were gathered. Two new species were discovered by combining DNA barcoding and morphological classification, adding to databases of biodiversity worldwide. Ecological indices, including Shannon-Wiener, Simpson’s Diversity, and Evenness, revealed high species diversity across all sites, with consistent species richness (17 species) and evenness near 1.0, indicating balanced community structures. Seasonal abundance peaked in July and August, correlating with higher humidity, although temperature did not significantly affect insect abundance. Statistical analyses, including Generalized Linear Models (GLM), confirmed a weak negative correlation between insect abundance and humidity, with no significant site-based differences in population levels. Indicating that insect populations are adaptive across land-use types, Non-Metric Multidimensional Scaling (NMDS) and Bray-Curtis metrics revealed slight differences in community composition. The identification of two new recorded species Stethoconus pyri and Pinacoplus didymogramma was confirmed by DNA barcoding, underscoring the significance of genetic technologies in biodiversity studies. This study highlights the adaptability of insect communities in rural, suburban, and urban settings. It also highlights the necessity of long-term monitoring and sophisticated molecular techniques in conservation plans of the future.
Keywords:
biodiversity richness
; insect population dynamics
; Kekedala city
; light trap
; monitoring
; species distribution
1. Introduction
Insects play an extremely important role in ecosystems such as pollinators, decomposers, predators and prey. Moreover, the conservation of insect biodiversity due to its role in ensuring food security and sustainable development of agriculture continues to evolve significance [1]. In China, as in any other country, insect biodiversity fluctuates, including in Xinjiang. Agricultural practices and environmental protection measures are the reasons behind this fluctuation. Moreover, they also play several crucial roles in the functioning of the ecosystem and the global economy [2]. Lepidopterans pests extensively feed on various plants and crops in Xinjiang wild fruit forests and cause several diseases and severe damage to the ecosystem [3]. Recently, the study of insect biodiversity has gained more attention because insects play an essential role in maintaining the natural ecosystem, from pollination to acting as the potential pests of crops [4].
The study of insect biodiversity provides an understanding of the concerned ecosystem’s health, as well as specific strategies and conditions to increase agricultural productivity [5]. For example, studying insect biodiversity highlights many important aspects of an insect’s relation to the ecosystem. However, insect populations are increasingly threatened by habitat loss, climate change, and different agricultural techniques including the application of pesticides [6]. In this regard, detailed understanding of insect biodiversity may provide valuable information for improving ecological management and sustainable farming practices [7]. Environmental factors, including light and temperature, are essential for sustaining insect biodiversity. About 80.7% of insects depend on the ground temperature (15-20℃), while humidity does not affect insect biodiversity as compared to light and temperature [8,9]. While these environmental variables are essential for understanding insect behavior and distribution, the monitoring of nocturnal pests presents additional challenges Light traps are budget-friendly and the most economical tools for monitoring nocturnal pests because they offer better cost-benefit ratios than traditional methods. These traps are used on an yearly basis to determine nocturnal insects and moths of groundnuts [10]. The advanced technology for tracking nocturnal moths, other lepidopterans, and coleopterans makes use of ultraviolet LEDs. These light traps utilize different sources of light that include a 200W incandescent lamp and a 160W mercury vapor lamp. Studies indicate that traps using ultraviolet LEDs capture a greater number of varieties of species in comparison to and incandescent lamps [8,11].
Available studies focusing on insect biodiversity within Xinjiang, especially in the Kekedala area of Ili Kazakh Autonomous Prefecture in China, are relatively scarce. This study represents the first concerted attempt to analyze the biodiversity of insects in the area through light trap monitoring. This prior lack of research stems from the region’s peculiar physiographical features, coupled with its diversified physiographic regions, which make it possible for many common and uncommon species of insects to thrive. These elements create persistent difficulties for scientists trying to determine insect biodiversity and its ecological impacts, particularly the implications overlooked by prior studies. Moreover, the lack of strong agricultural policies and a strategic framework tailored to this region has significantly hindered the progress of conservation agriculture policies within this region. This study underscores the pressing need to prioritize pivotal urban centers, such as Kekedala, in preserving insect biodiversity within the context of environmental sustainability, ecosystem balance, and agricultural productivity. In doing so, this research endeavors to establish the first phase of evidence for the development of insect biodiversity loss mitigation plans and sustainable conservation agriculture approaches within the area. The results are expected to enhance our understanding of insect diversity patterns in Xinjiang and also support global initiatives aimed at sustaining biodiversity and protecting ecosystems. In addition, aside from the need for biodiversity conservation, there is still a gap in knowledge concerning the connection of insect diversity to vegetation and climate change [7]. Indeed, there is a significant lack of knowledge about this specific aspect.
In light of the above, this study aims to investigate the biodiversity of insects and their identification through the automated monitoring of light traps in Kekedala City, Xinjiang, China. Recording changes and the taxonomic diversity at different sites highlight the need for further study of insect biodiversity to develop future agricultural and conservation efforts that will ensure food and ecological security amidst changing global environments.
2. Materials and Methods
The current research was sourced from the Fourth Division Forestry and Grassland Work Station (project name). Light traps were used in Kekedala city, Xinjiang, China to determine insect biodiversity.
2.1. Survey Approach and Timeline
This study primarily employed daily monitoring of insects via three light traps in Kekedala City, Xinjiang, China. Light traps are a common tool used in ecological and entomological studies to assess insect diversity and abundance in specific areas. Three light traps were strategically placed in different environments within the city, each with distinct ecological activities that influence insect population type and quantity. The light traps were monitored daily to record the number and types of insects captured. Data sampling for this study was conducted over a five-month period, from April 2023 to August 2023, to capture the seasonal variations in insect population. The overall study period spanned from 2022 to 2025, allowing for comprehensive analysis and comparison of insect diversity across multiple years.
2.2. Description and Setting of Research Site
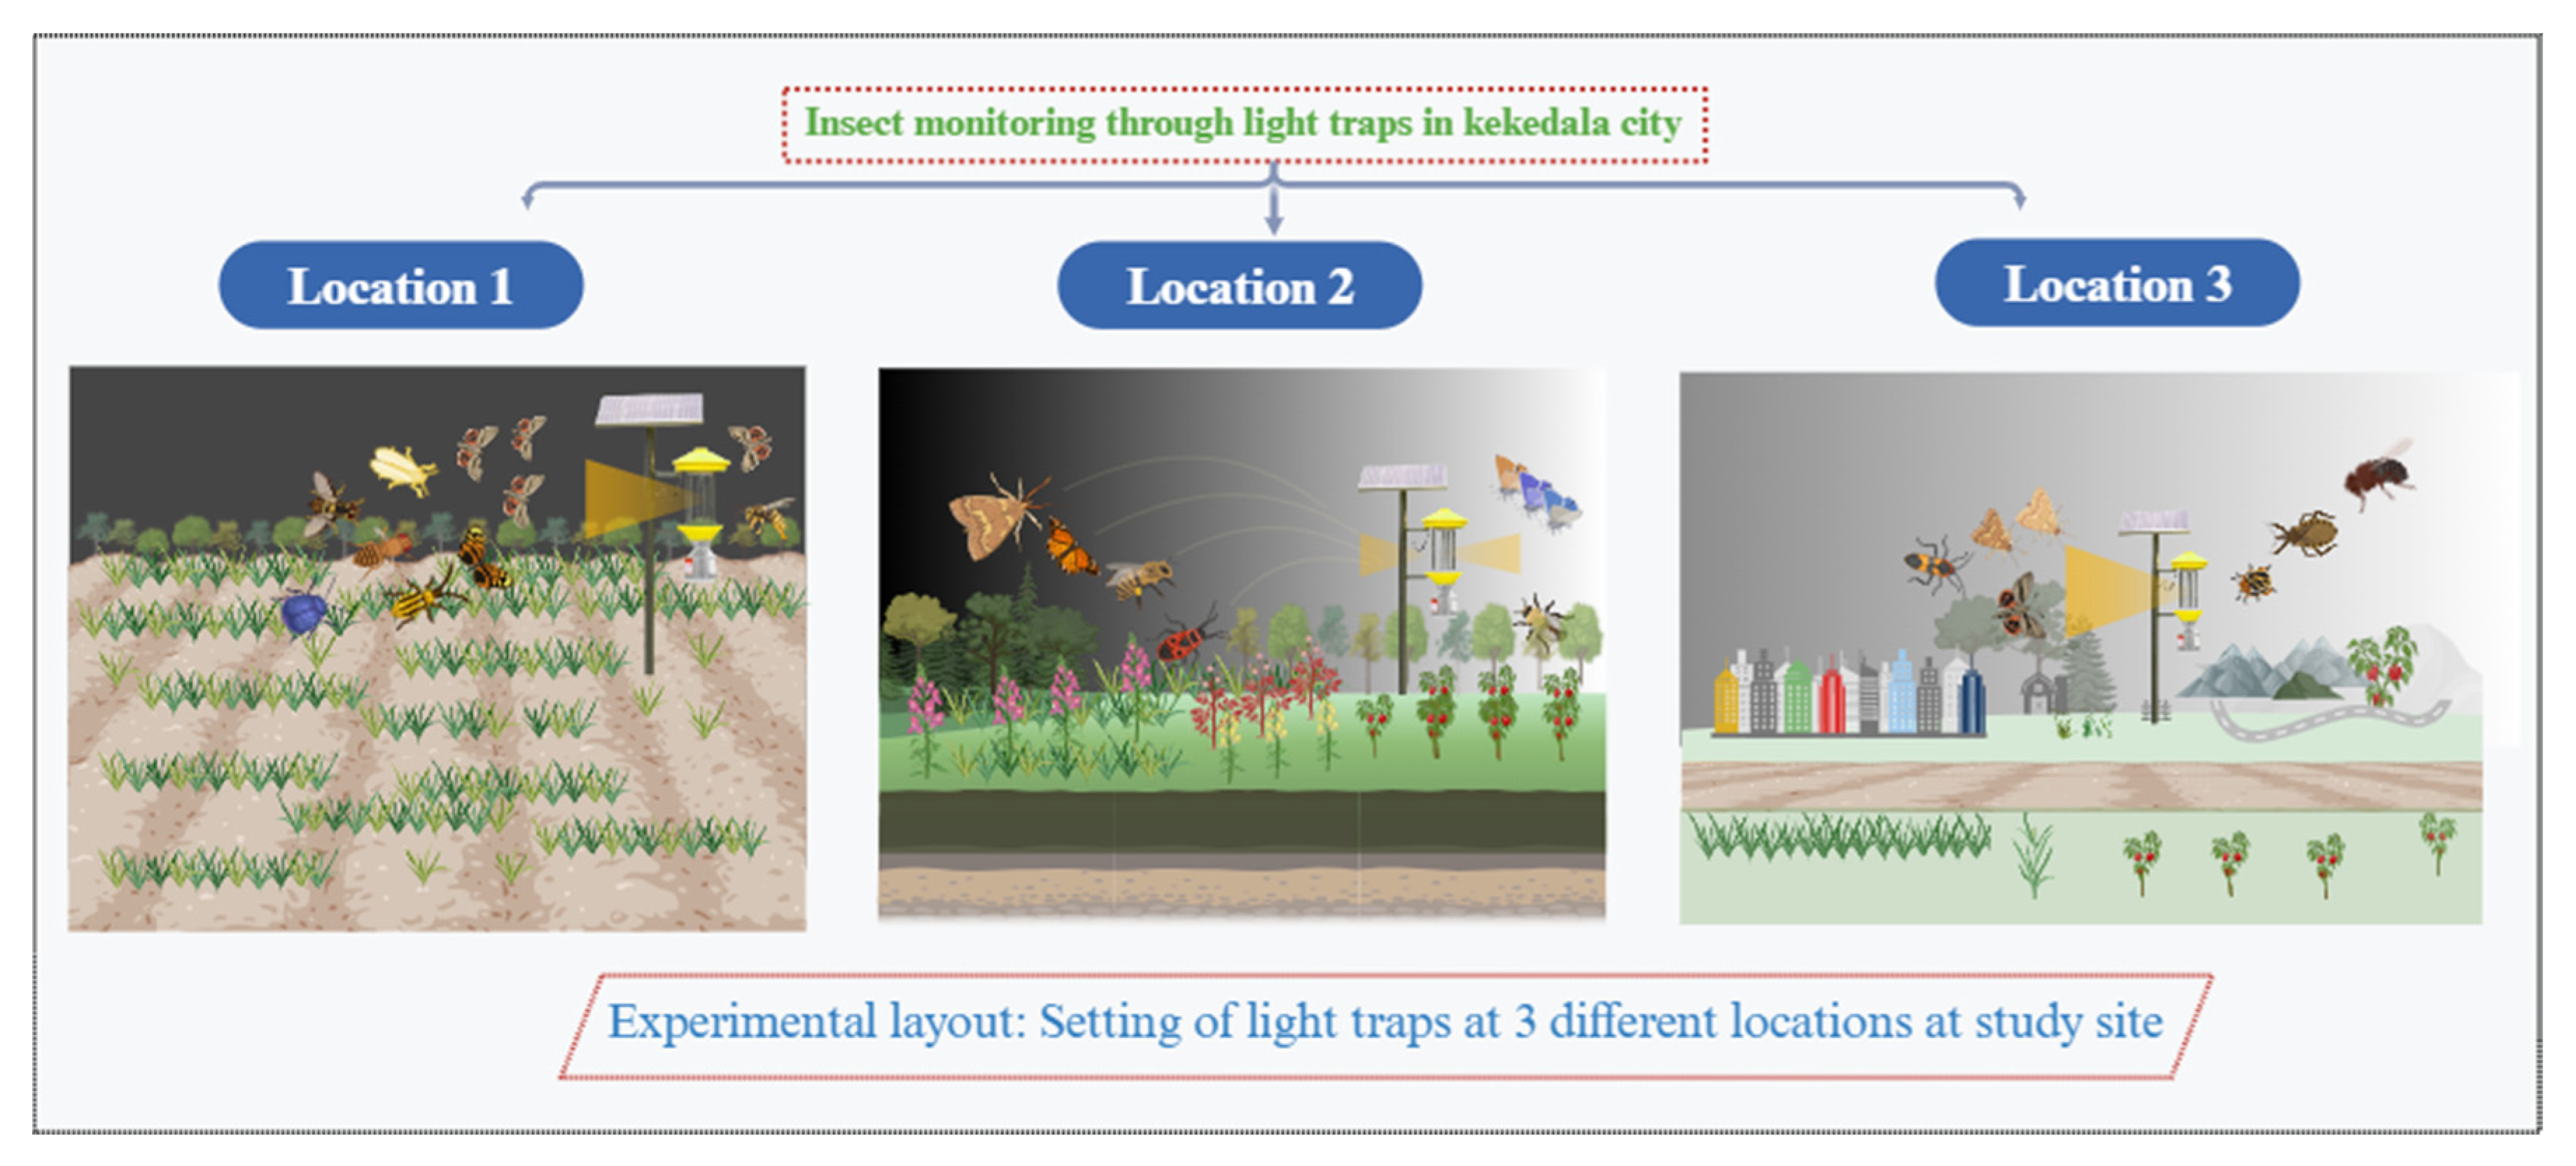
This study was carried out at 4th division of Kekedala City, Xinjiang, China. Three locations were selected for the current research to determine the biodiversity of insects. Each location had specific ecological characteristics. Location 1 was established near dry vegetation and barren land having wild shrubs and weeds. Location 2 was at the center of a garden and park abundant with flowers, fruit trees like plum, and had a diverse vegetation of China fir. Location 3 was near a water stream, surrounded by medium and long grasses, and several ornamental and some road sided plum trees and plants. The choice of these locations was aimed to determine the intense biodiversity of insects. These locations also provided an understanding of several environmental factors that influence insect biodiversity, which include the density of vegetation, availability of moisture, and complex habitat of insects.
The area of Location 1 was 30-35 m2 due to less urbanization and being near to the industry, while the location’s high vegetation area and ecological balance was expanded up to 80-90 m2, and the location was 50-60 m2. The wavelength of light was about 365-590 nm. It attracted all kind of insects including beetle, bugs, hoppers, and moths. The intensity of light effective to attract insects that was 5- 20 lux it is best combination with UV light traps.
| Location | Division | Area Name | Type of Vegetation | Total Area |
| 1 2 3 |
4th 4th 4th |
Kekedala, Ili Kazakh autonomous prefecture Kekedala, Ili Kazakh autonomous prefecture. Kekedala, Ili Kazakh autonomous prefecture. |
Terrestrial, wild shrubs and weeds China Fir, plum trees, Apple trees and weeds. Ornamental trees, wild grass, apple trees. |
30-35 m2 80-90 m2 50-60 m2 |
Figure 1 illustrate, Experimental layout, three locations in kekedala region of Xinjiang having setting up of automatic monitoring light traps.
Figure 1.
Overview of Insect monitoring through light trap.
2.3. Setting of Traps
The primary trapping method used in the current study involved three modern automated light traps. These traps are closely related to Magna light traps from Russell IPM (UK), equipped with solar panels and lights operating within the 350-420 nm wavelength range. This method is quite helpful in catching various insects. These traps were placed keeping in view the specific environmental conditions of each site. They were programmed to activate shortly after sunset at nearly 9:30 pm. The traps operated automatically overnight and were deactivated just before sunrise. This time was chosen because it coincided with peak insect activity. By doing so, the capture rates were maximized, which was helpful in comprehensive sampling of insect diversity. Traps were fitted with sensors to adjust light intensity, increasing their effectiveness in different environmental conditions including high humidity and decrease in temperature. Regular maintenance checks were performed to ensure consistent operation and data integrity throughout the study.
2.4. Sampling and Collection of Insects
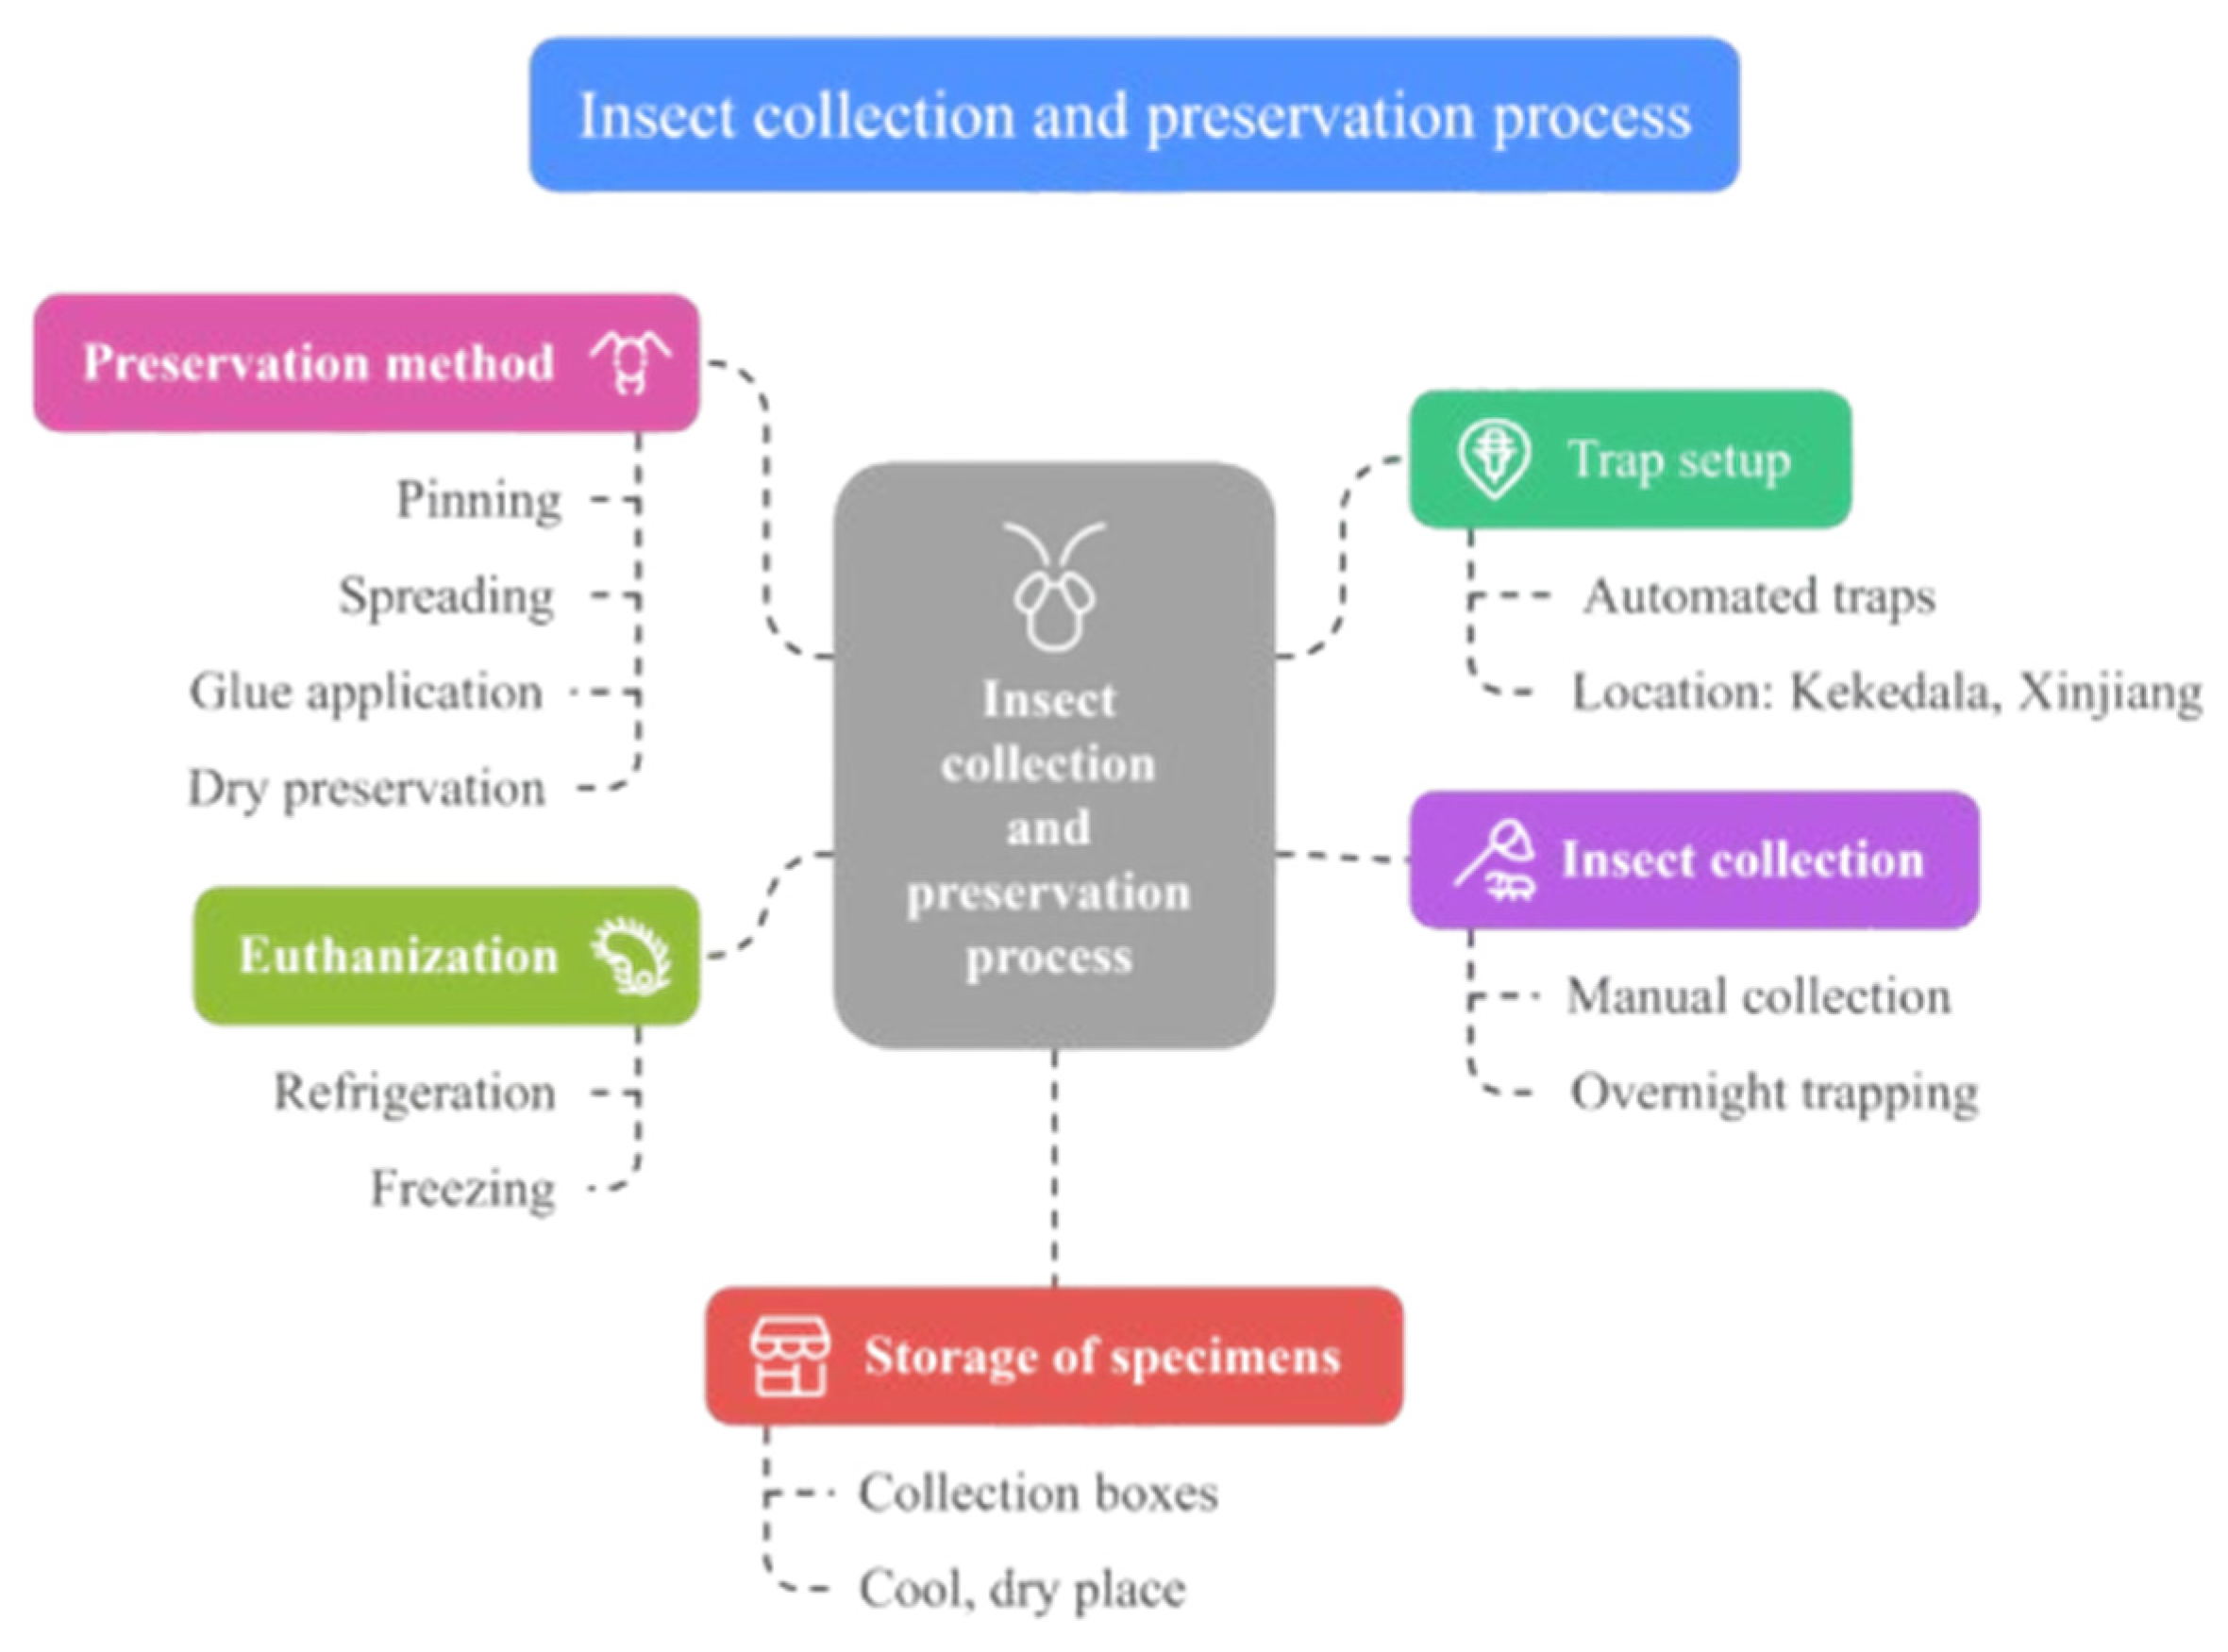
After setting up the traps, the captured insects were manually collected using an insect net. This net was designed with a sturdy handle, a durable hoop, and a fine mesh cloth bag suspended from the ring. The insect handle was lightweight, allowing the ease of use. The hoop was made of flexible steel wire, ensuring that it does not break during fieldwork. In the current study, refrigeration and freezing remained the preferred methods for euthanizing insects because dead specimens are more practical to examine than live ones. In this method, insects are preserved at low temperatures (-20 ℃) for a minimum of 2 hours. This help to maintain the insects in their original condition for a more extended period of time, which is helpful in proper pinning and analysis. Moreover, it is also essential to maintain adequate humidity within the storage containers.
2.5. Identification and Preservation Method
After their collection through light traps, they were preserved using techniques appropriate for long-term storage and specimen identification. Direct pinning, which puts an insect pin through the specimen’s body, was utilized for preservation. Only entomological pins were used, as standard pins are excessively short, thick, and susceptible to various defects. Pins with a diameter of No. 2 (0.46 mm) were predominantly utilized, while larger pins were chosen when required for bigger insects. A total of three distinct pins were employed according to insect size: No. 1 pins (0.40 mm in diameter) are intended for small or delicate specimens, No. 2 pins (0.46 mm in diameter) are intended for medium-sized insects, while No. 3 pins (0.50 mm in diameter) are for more extensive and robust insects when more support is necessary. The pinning technique guaranteed that the specimens were adequately maintained for meticulous examination and prolonged preservation. Once the insects had dried, glue was sometimes applied to secure them to the pin, as specimens could become loose and rotate around them.
However, glue is not an effective method for recently dead insects. In this research, most insects were pinned with the position of their legs or wings being inconsequential, provided that all body parts were visible and accessible for study. However, the wings were spread for moths, butterflies, and similar insects before placing the specimen into the collection box. A spreading board was utilized to spread the dorsal side of the wings. Insect wings were positioned according to established guidelines. For butterflies, moths, and mayflies, the rear borders of the forewings were aligned straight across, at right angles to the body, while the hindwings were brought far enough forward to eliminate any gap at the rear. Paper strips or other materials attached to the board were used to hold the wings. Antennae and other structures were aligned and held in place with pins. Once the wings were positioned, crossed pins were used to secure the antennae.
The collected insect specimens were returned to the laboratory for initial identification using an insect field guide. If species could not be conclusively identified in the field, assistance from taxonomic experts was sought to ensure their accurate classification. This additional step was essential to confirm the identity of challenging or less recognizable species. An advanced microscope was utilized for smaller insect specimens to ensure precise identification. This allowed for the clear observation of fine morphological details not visible to the naked eye, aiding in accurate species identification.
There are many ways to preserve the collected specimens, including dry preservation. Many types of insects (including soft-bodied insects) are stored dry in tiny boxes, paper envelopes, and other containers. The second method used is liquid preservation; ethanol and isopropanol, mixed with distilled water, were the most commonly used preservation fluids in the current study. Typically, a 75% (v/v) alcohol concentration was employed. Since alcohol and water do not naturally mix well, distilled water was used to ensure proper blending and solutions were thoroughly mixed to achieve homogeneity before application.
Figure 2.
demonstrate flow chart of Insect Collection and preservation process.
3. Data Analysis and Results
This chapter presents the procedures and outcomes of the data analysis performed to investigate insect biodiversity in Kekedala City using monitoring light traps. The dataset, named insects_data.csv, includes records from three locations (urban, semi-urban, and rural) spanning five months (April to August 2023). Each record contains information on sample_id, date, site, species, insects’ family, abundance, temperature, and humidity, totaling 63,090 observations of different species. The analyses were conducted in RStudio (R Core Team, 2025), and outputs—such as descriptive statistics, diversity indices, statistical tests, and visualizations—are reported in the following sections. Following R packages were used for this analysis in R Studio.
Data Preparation and Cleaning
Data Import
The raw data, stored in a comma-separated values (CSV) file, was imported into R Studio using the read.csv() function. The resulting data frame is referred to as insects_data throughout this chapter.
Data Structure and Type Conversion
Initial inspection of the data structure was done via str(), head(), and summary(). Necessary conversions included ensuring Date was recognized as a date object and Site, Species, and insect family were treated as factors to facilitate later statistical analyses.
Missing Values and Outlier Removal
A search for missing values was conducted using colSums(is.na(insects_data)). Where necessary, records with missing or implausible data (e.g., negative Abundance) were either removed or investigated individually to maintain data integrity.
Exploratory Data Analysis
Descriptive Statistics
Descriptive statistics for Abundance, Temperature, and Humidity were generated to understand their distributions across the three sites. This included measures such as min, 1st quartile, median, mean, 3rd quartile, max.
Table 1 presents the descriptive statistics for the abundance of insects, temperature, and humidity at three study locations.
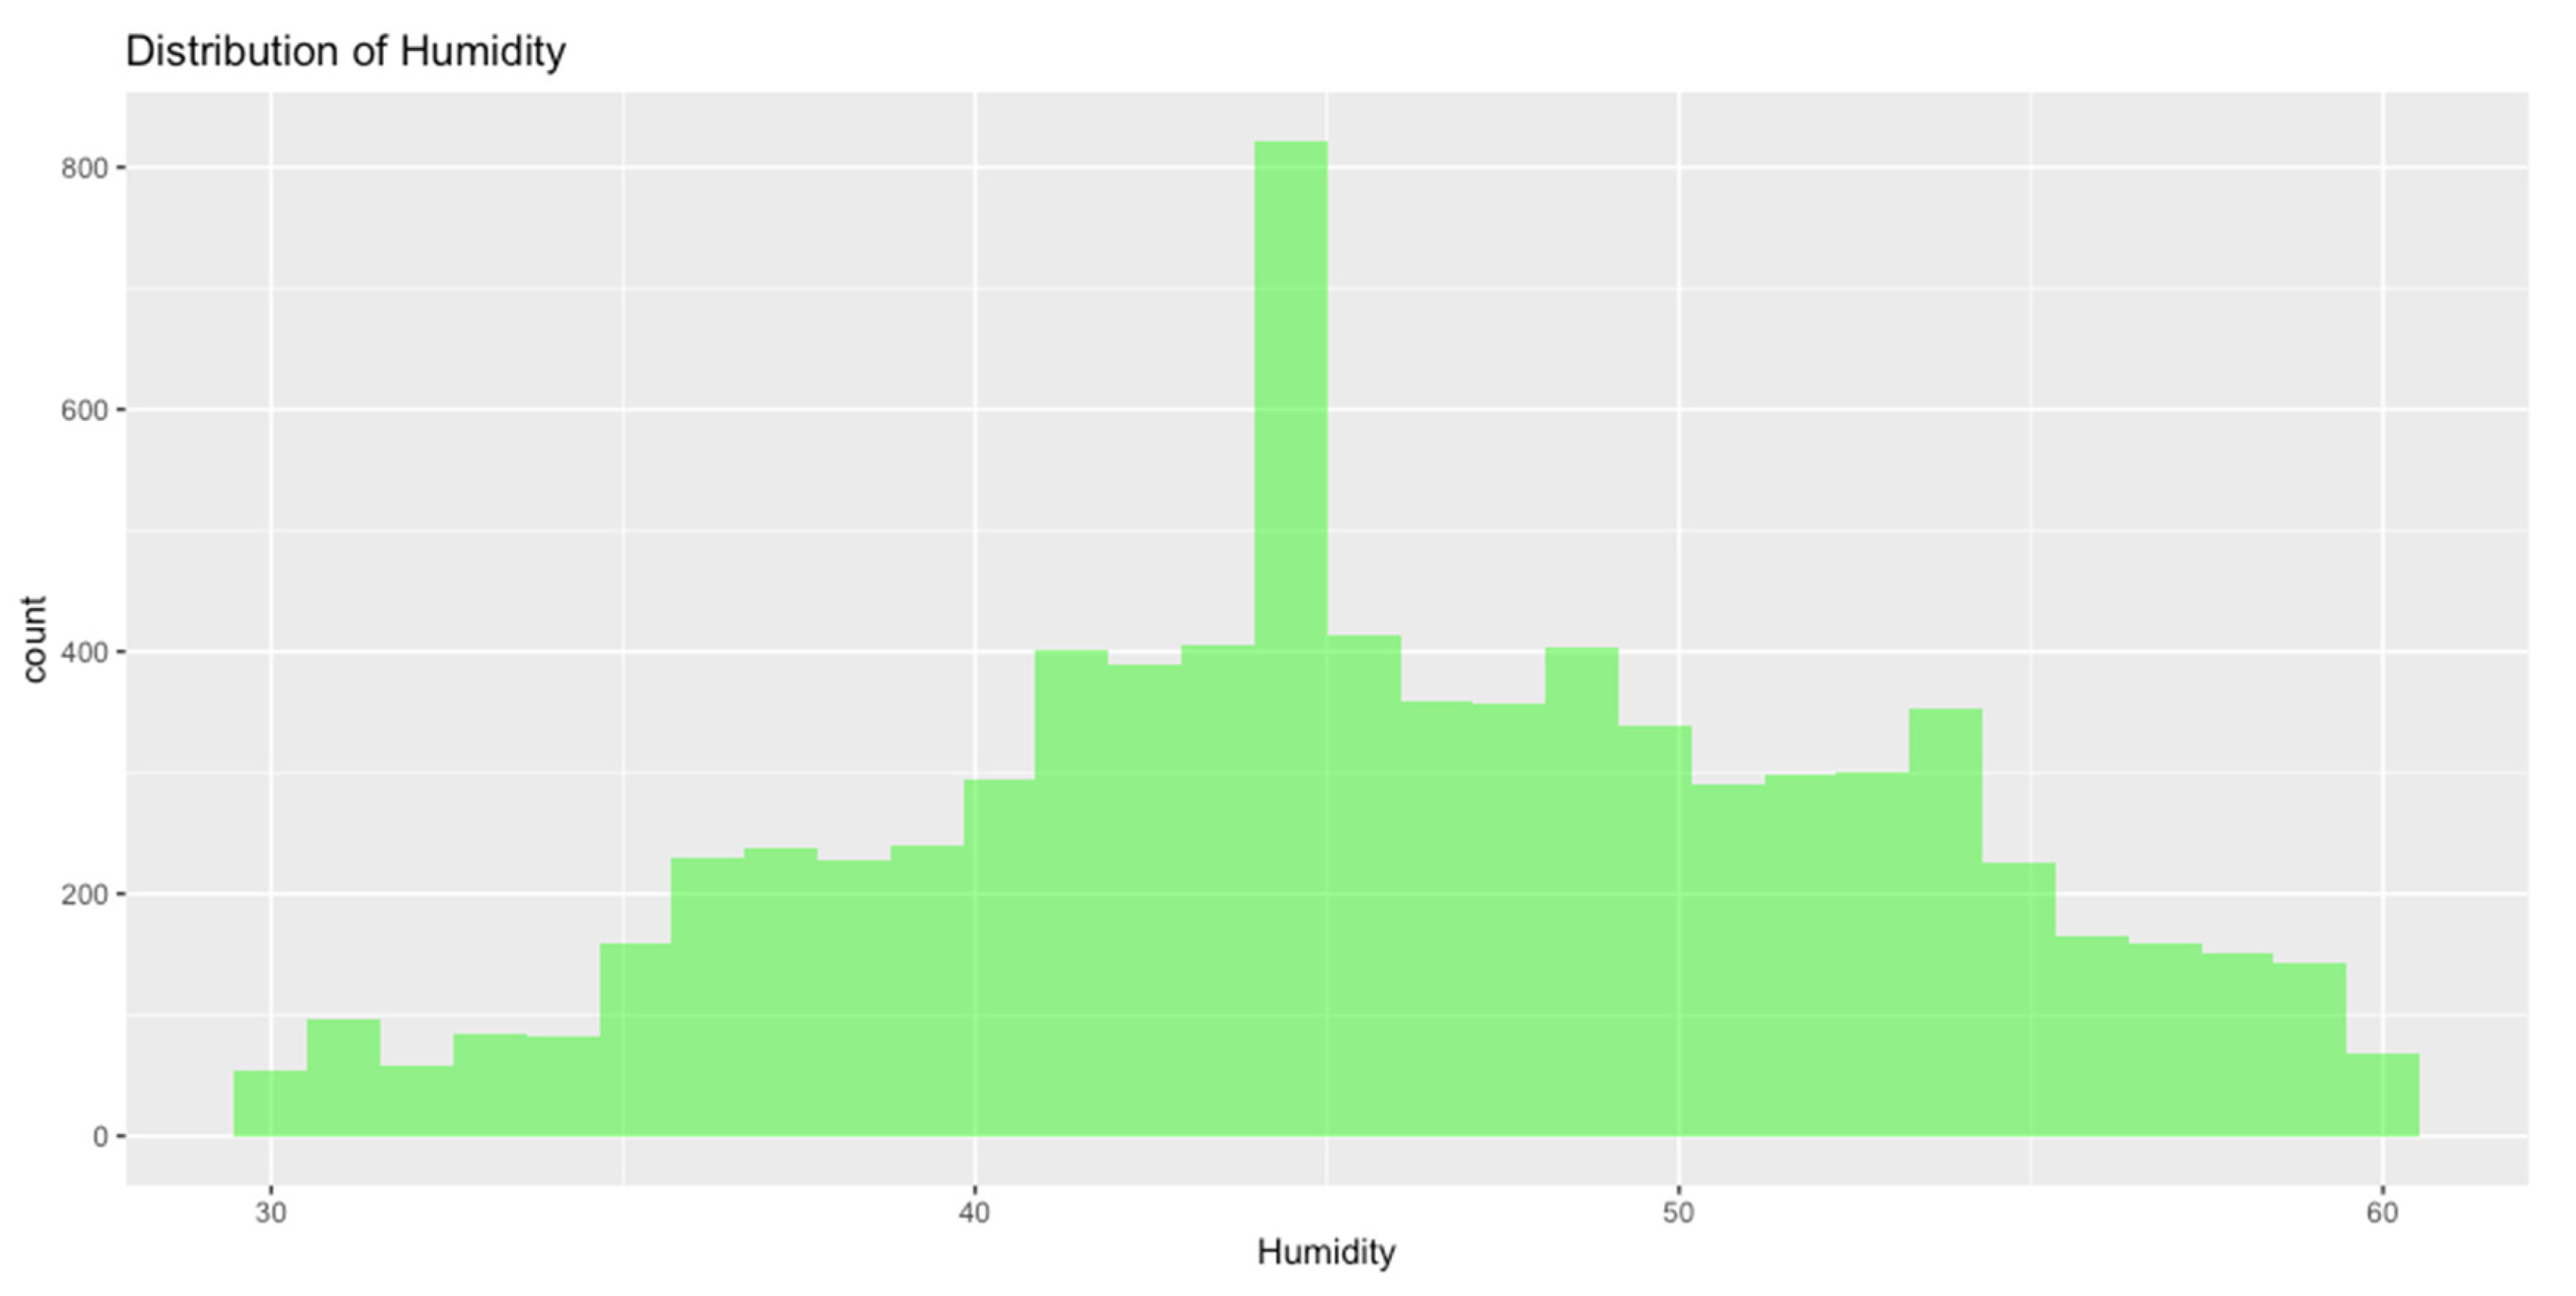
Distribution of Data
To further explore the data, histograms or density plots were generated to visualize temperature and humidity distribution.
Figure 1.
Distribution of Temperature.
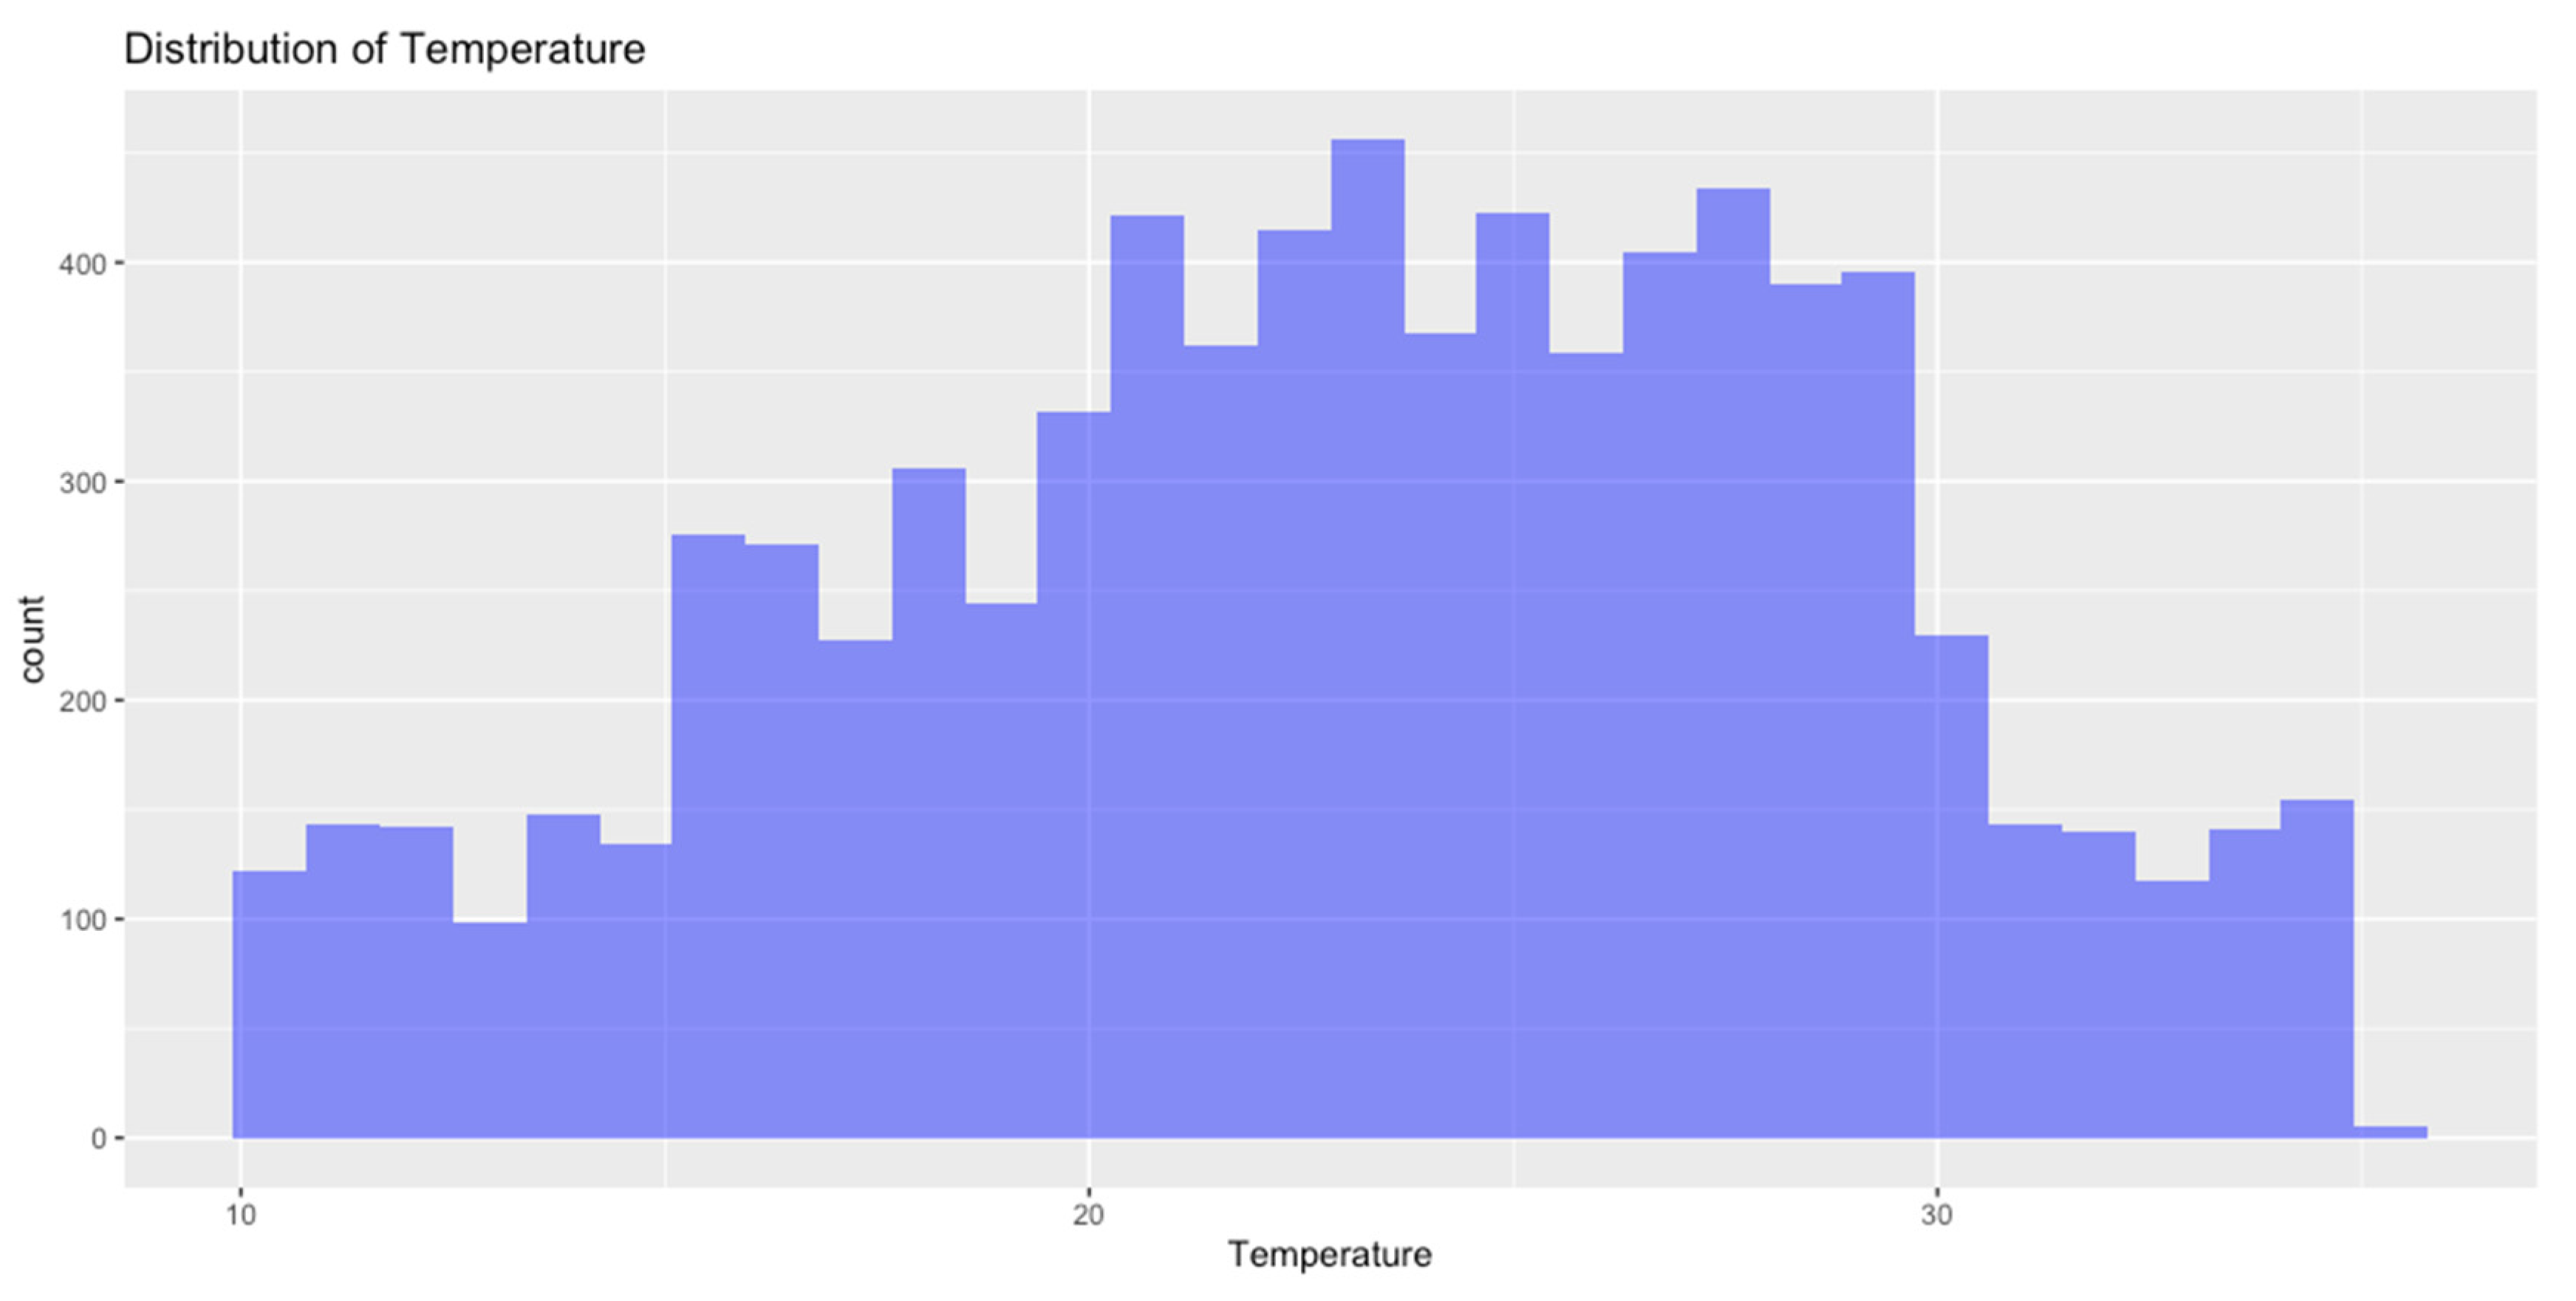
Figure 2.
Distribution of Humidity.
Temporal Trends
Because data collection spanned from April 2023 to August 2023, additional variables (e.g., Month) were derived from the Date field to visualize seasonal trends:
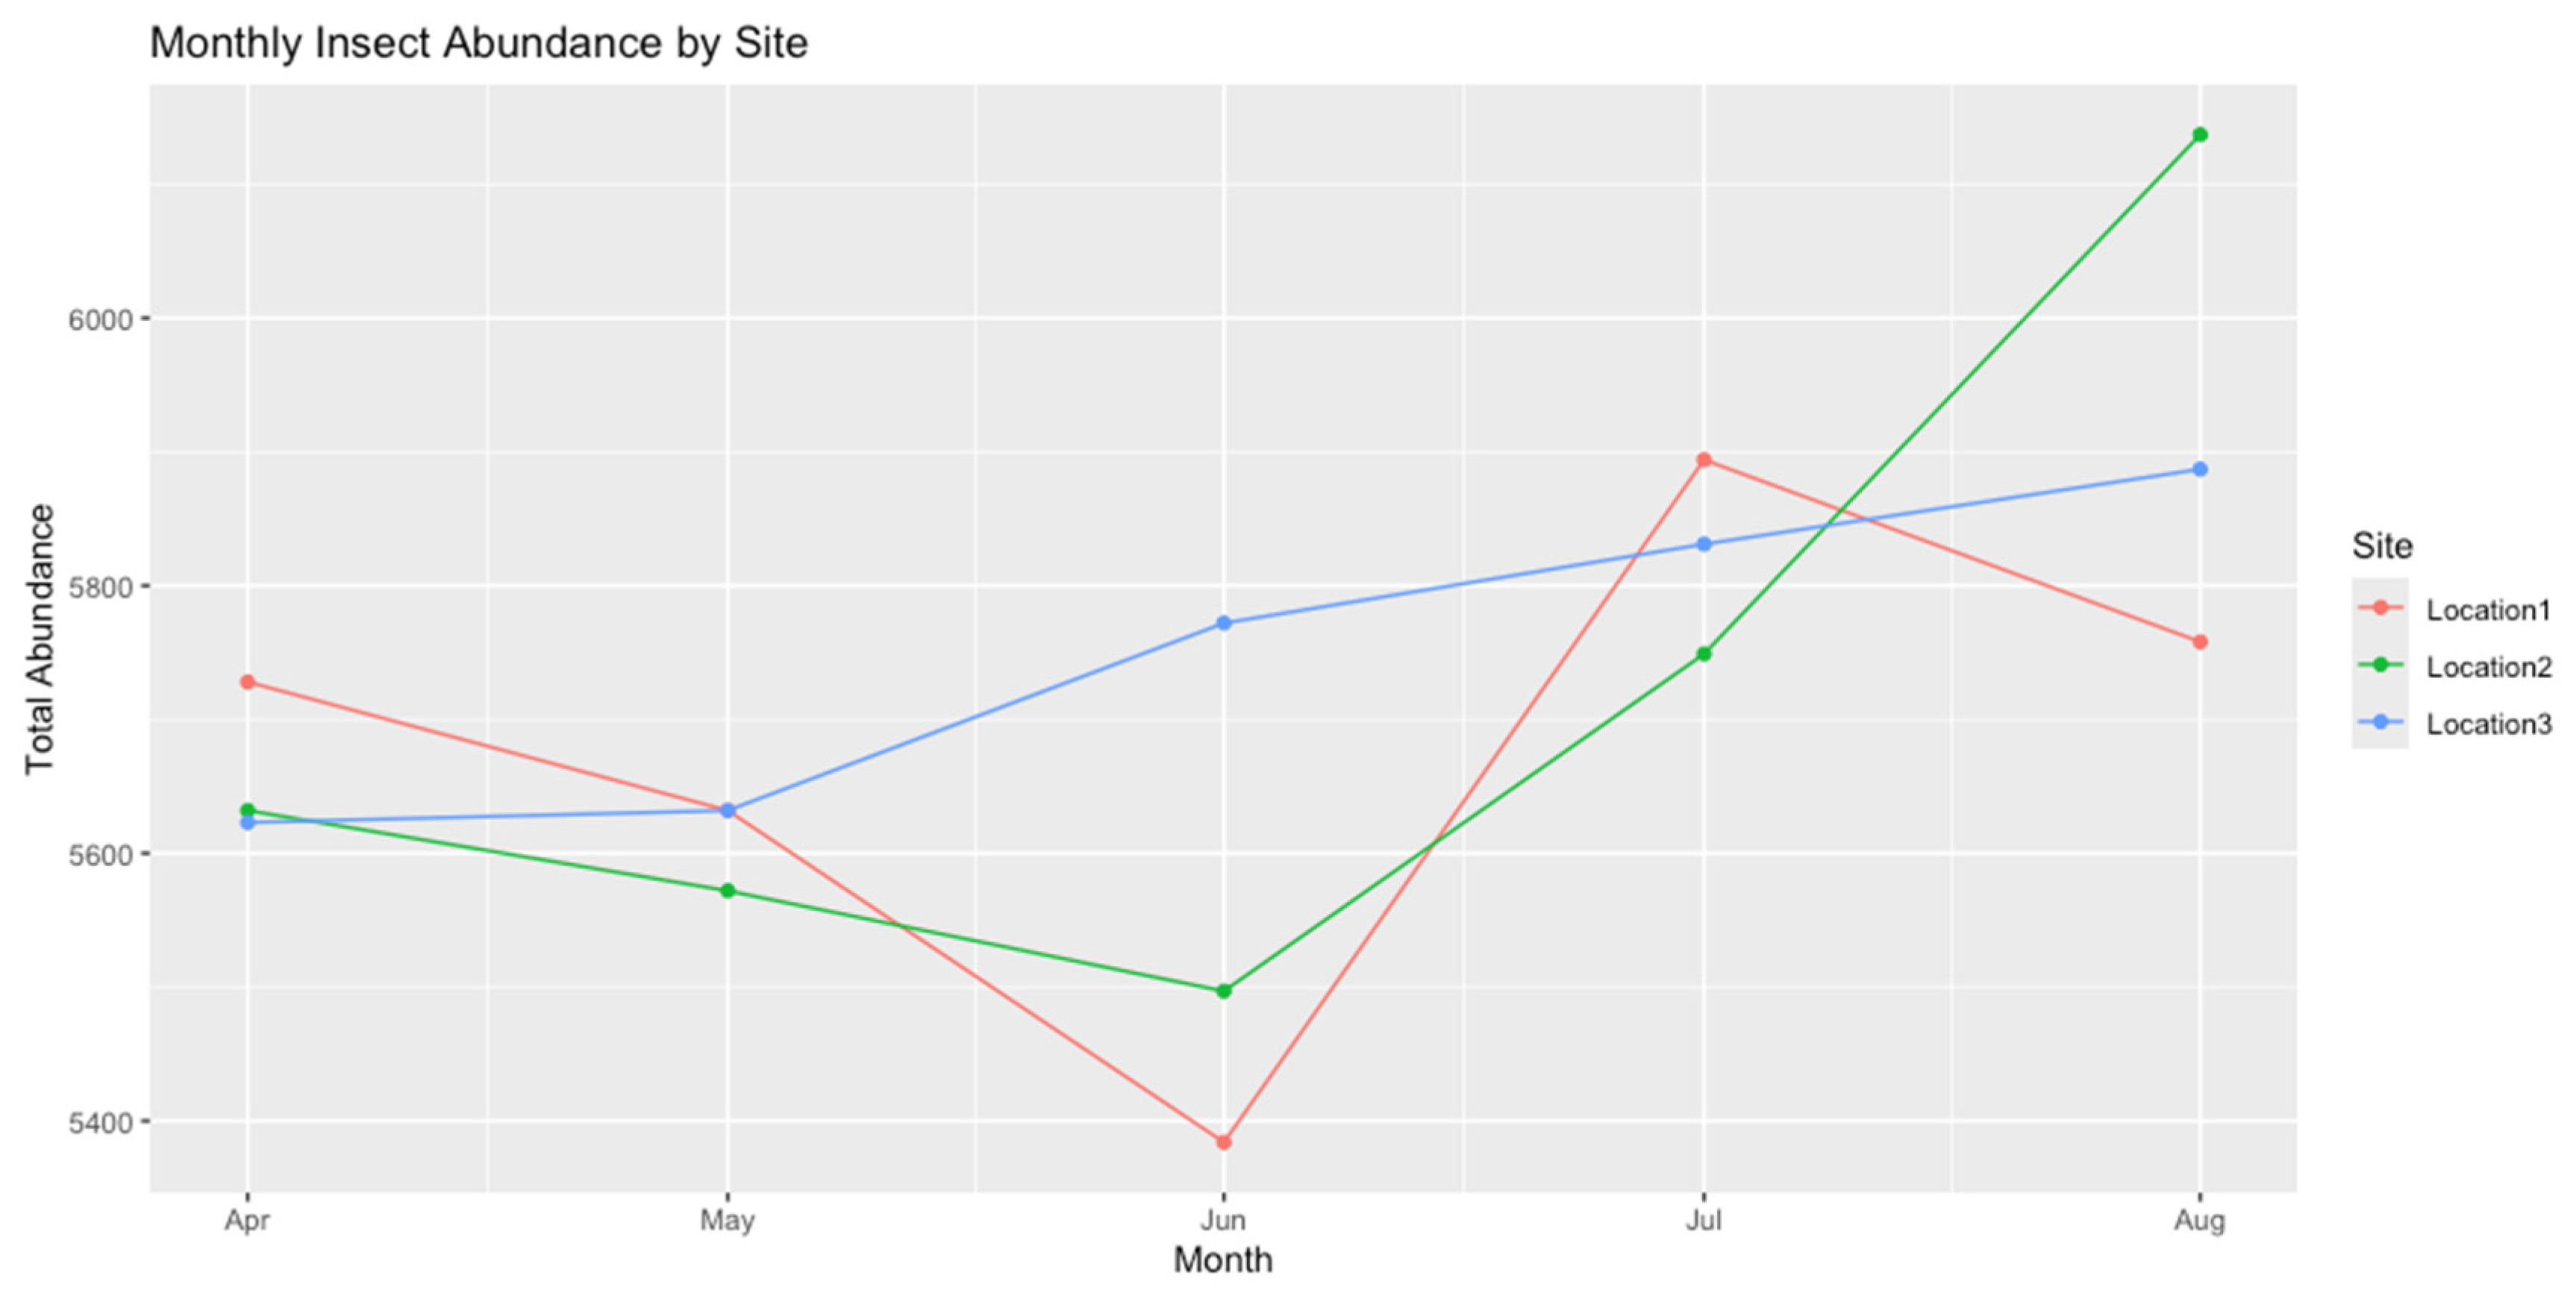
A preliminary line plot of monthly total abundance across the three sites provided an overview of seasonal fluctuations.
The figure above illustrates the monthly insect abundance from April to August 2023 in Kekedala City across three different study sites. Each line represents a different location: Location 1 (red), Location 2 (green), and Location 3 (blue). The graph shows the total insect abundance measured at each site over the five months, with a noticeable increase in insect counts, especially in June and August. Location 3 displays the highest abundance towards the end of the study period, while Location 1 shows more variability. Location 2 has a moderate trend, peaking in July. This pattern reflects the influence of environmental factors, such as temperature and humidity, on insect populations at each site.
Figure 3.
Monthly insect abundance in Kekedala City from April to August 2023 by site.
Biodiversity Indices
Construction of Site-Species Matrix
Biodiversity indices are essential for understanding species richness, evenness, and overall diversity within ecological communities. A Site-Species Matrix was created to analyze biodiversity, where rows represent each study site (Location1, Location2, Location3) and columns represent unique insect species. The cells in the matrix contain the total abundance of each species at each site over the study period. This matrix was constructed using the dplyr and tidyr packages in R, summarizing the total abundance of each species per site and converting it into a wide format for further analysis. The resulting matrix was then prepared for biodiversity analysis using the vegan package. A Site-Species matrix was created for biodiversity analysis, where rows represent each site and columns represent unique insect species. The cells indicate total abundance of each species at each site over the study period.
Table 2 displays the abundance of various insect species across three study locations (Location 1, Location 2, and Location 3) in Kekedala City during the study period. The species listed in the table are the most frequently observed during the study, with their corresponding abundance counts at each site. For each species, the total count is provided for the three locations, showing variation in species distribution and abundance.
Species such as Acronicta impleta, Amara aulica, and Anomala nimbosa were consistently abundant across all sites, with Acronicta impleta being the most abundant species at Location 1 (1486) and Location 3 (1661). Similarly, Amara aulica showed the highest abundance in Location 1 (1675) and Location 3 (1718). Other species, like Caddisfly and Eupithecia millefoliata, also appeared frequently, with Caddisfly reaching peak abundance at Location 3 (1832).
This table provides insight into the insect species most prevalent during the study, offering a clearer understanding of the biodiversity at different locations within Kekedala City and the factors influencing their distribution. The variations in species abundance across locations could be attributed to differences in environmental conditions such as temperature and humidity at each site
Calculation of Diversity Indices
Calculation of Diversity Indices explains the use of the vegan package in R to compute key biodiversity metrics for each study site. Using the vegan package, four diversity indices were calculated for each site: Species Richness (S), Shannon Diversity Index (H′), Simpson’s Index (D) and Evenness (E). These indices provide insights into the biodiversity of insect species across the three locations (Location1, Location2, Location3). The Shannon Index measures species diversity, considering both richness and evenness while the Simpson’s Index reflects the dominance of species within each site. Species Richness indicates the total number of unique species, and Evenness assesses how evenly individuals are distributed among species.
Using the vegan package, the following diversity indices were computed for each site:
- Species Richness (S)
- Shannon Diversity Index (H′)
- Simpson’s Index (D)
- Evenness (E)
Table 3 presents the diversity indices for insect species across the three study locations in Kekedala City. The indices include Shannon’s diversity index (H’), Simpson’s index (D), species richness (S), and species evenness (E), which provide a quantitative assessment of biodiversity at each site.
- Shannon (H’): This index reflects the species diversity, considering both the number of species and the evenness of their distribution. The values for all three locations are very similar, with Location 1 having an H’ of 2.831, Location 2 at 2.830, and Location 3 at 2.832, indicating relatively high species diversity across all sites.
- Simpson (D): Simpson’s index measures the probability that two randomly selected individuals from the sample will belong to the same species. Higher values indicate lower diversity. The values for all three locations are close to 0.941, suggesting a similar level of dominance of certain species across all sites.
- Richness (S): This is the total number of species observed at each site. All locations have the same richness value of 17 species, indicating a consistent number of species across the study locations.
- Evenness (E): This index indicates how evenly individuals are distributed among the different species. The values are very close to 1 for all sites, with Location 1 at 0.999, Location 2 at 0.999, and Location 3 at 0.9997. High evenness values suggest that the species populations are relatively evenly distributed, with no single species dominating.
Statistical Analysis
Comparison of Abundance and Diversity Across Sites
To assess whether abundance differs significantly among sites, ANOVA or Kruskal-Wallis tests (depending on normality) were performed. A separate test was conducted for the Shannon diversity index if daily or monthly site-specific indices were calculated.
Seasonal Differences
A repeated-measures or factorial ANOVA could be employed to examine seasonal differences (April–August) in abundance or diversity.
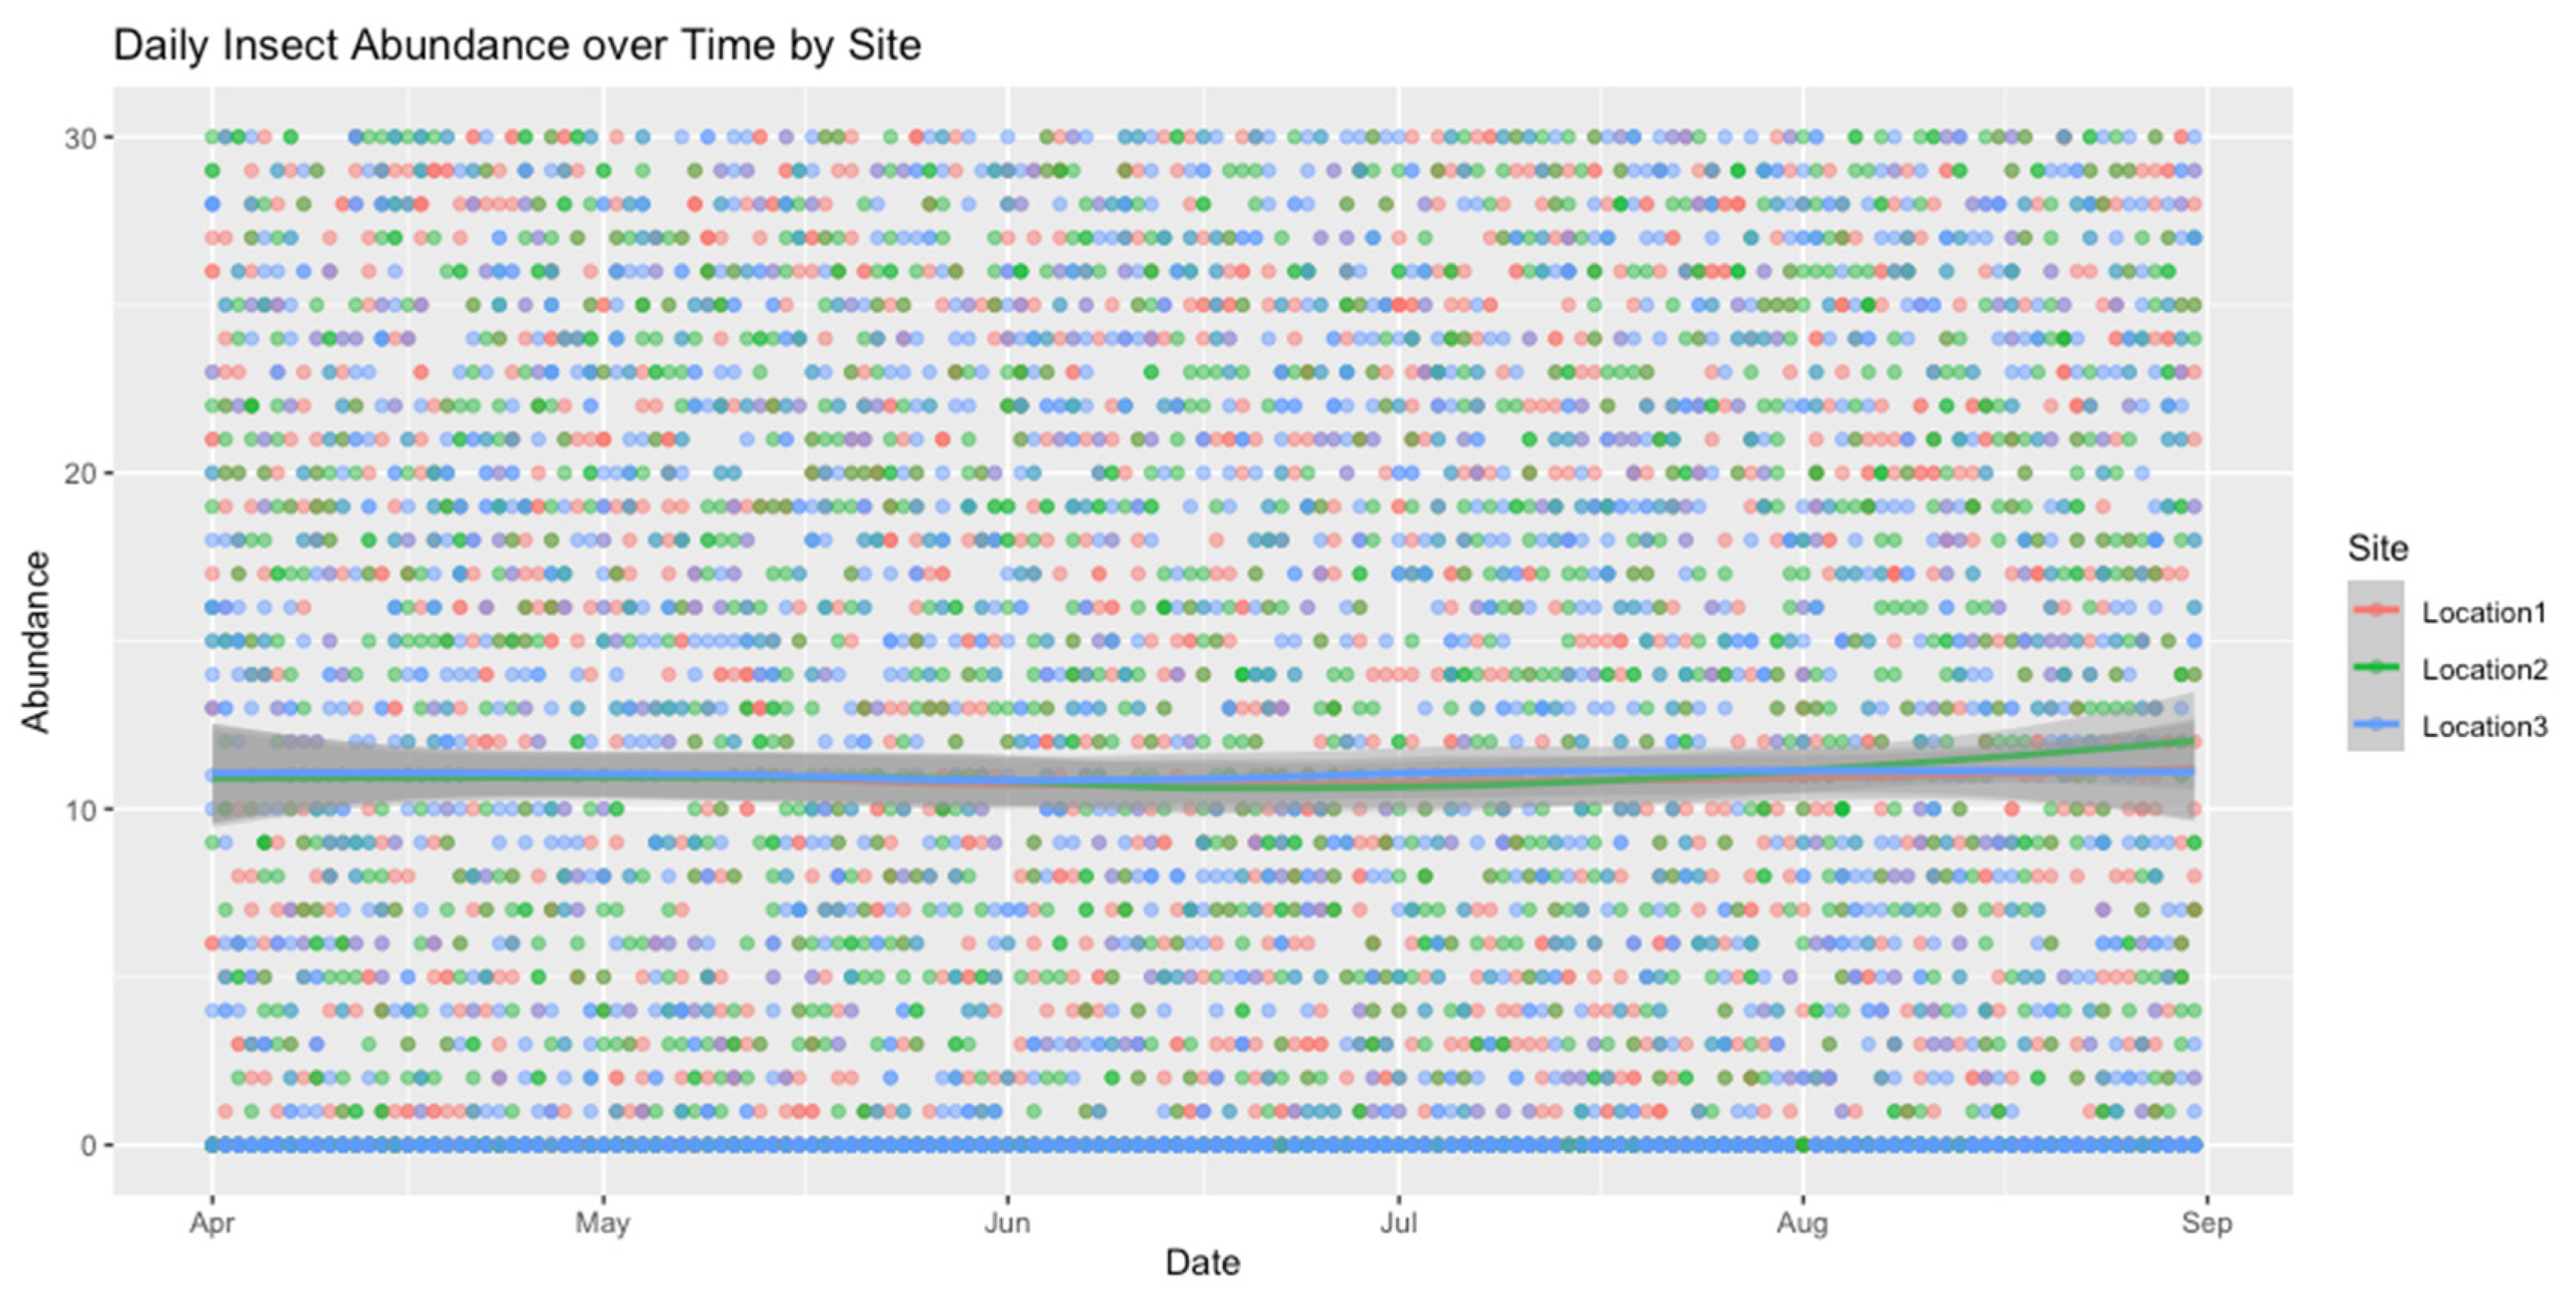
Figure 4.
illustrates seasonal patterns of insect abundance.
Statistical Analysis Results Comparing Monthly Abundance Across Sites

Table 6.
summarizes the statistical analysis results comparing monthly abundance across sites.
| Site | Month | Monthly Total |
| Location1 | April/2023 | 5728 |
| Location1 | May/2023 | 5632 |
| Location1 | June/2023 | 5384 |
| Location1 | July/2023 | 5894 |
| Location1 | August/2023 | 5758 |
| Location2 | April/2023 | 5632 |
| Location2 | May/2023 | 5572 |
| Location2 | June/2023 | 5497 |
| Location2 | July/2023 | 5749 |
| Location2 | August/2023 | 6137 |
| Location3 | April/2023 | 5623 |
| Location3 | May/2023 | 5632 |
| Location3 | June/2023 | 5772 |
| Location3 | July/2023 | 5831 |
| Location3 | August/2023 | 5887 |
Relationship with Environmental Variables
Correlation and regression methods were used to examine the influence of Temperature and Humidity on insect abundance.
Table 7.
Spearman’s rank correlation rho.
| S | P-Value | roh | |
| DailyAbundance & MeanHum | 16653600 | 0.4768 | -0.03329274 |
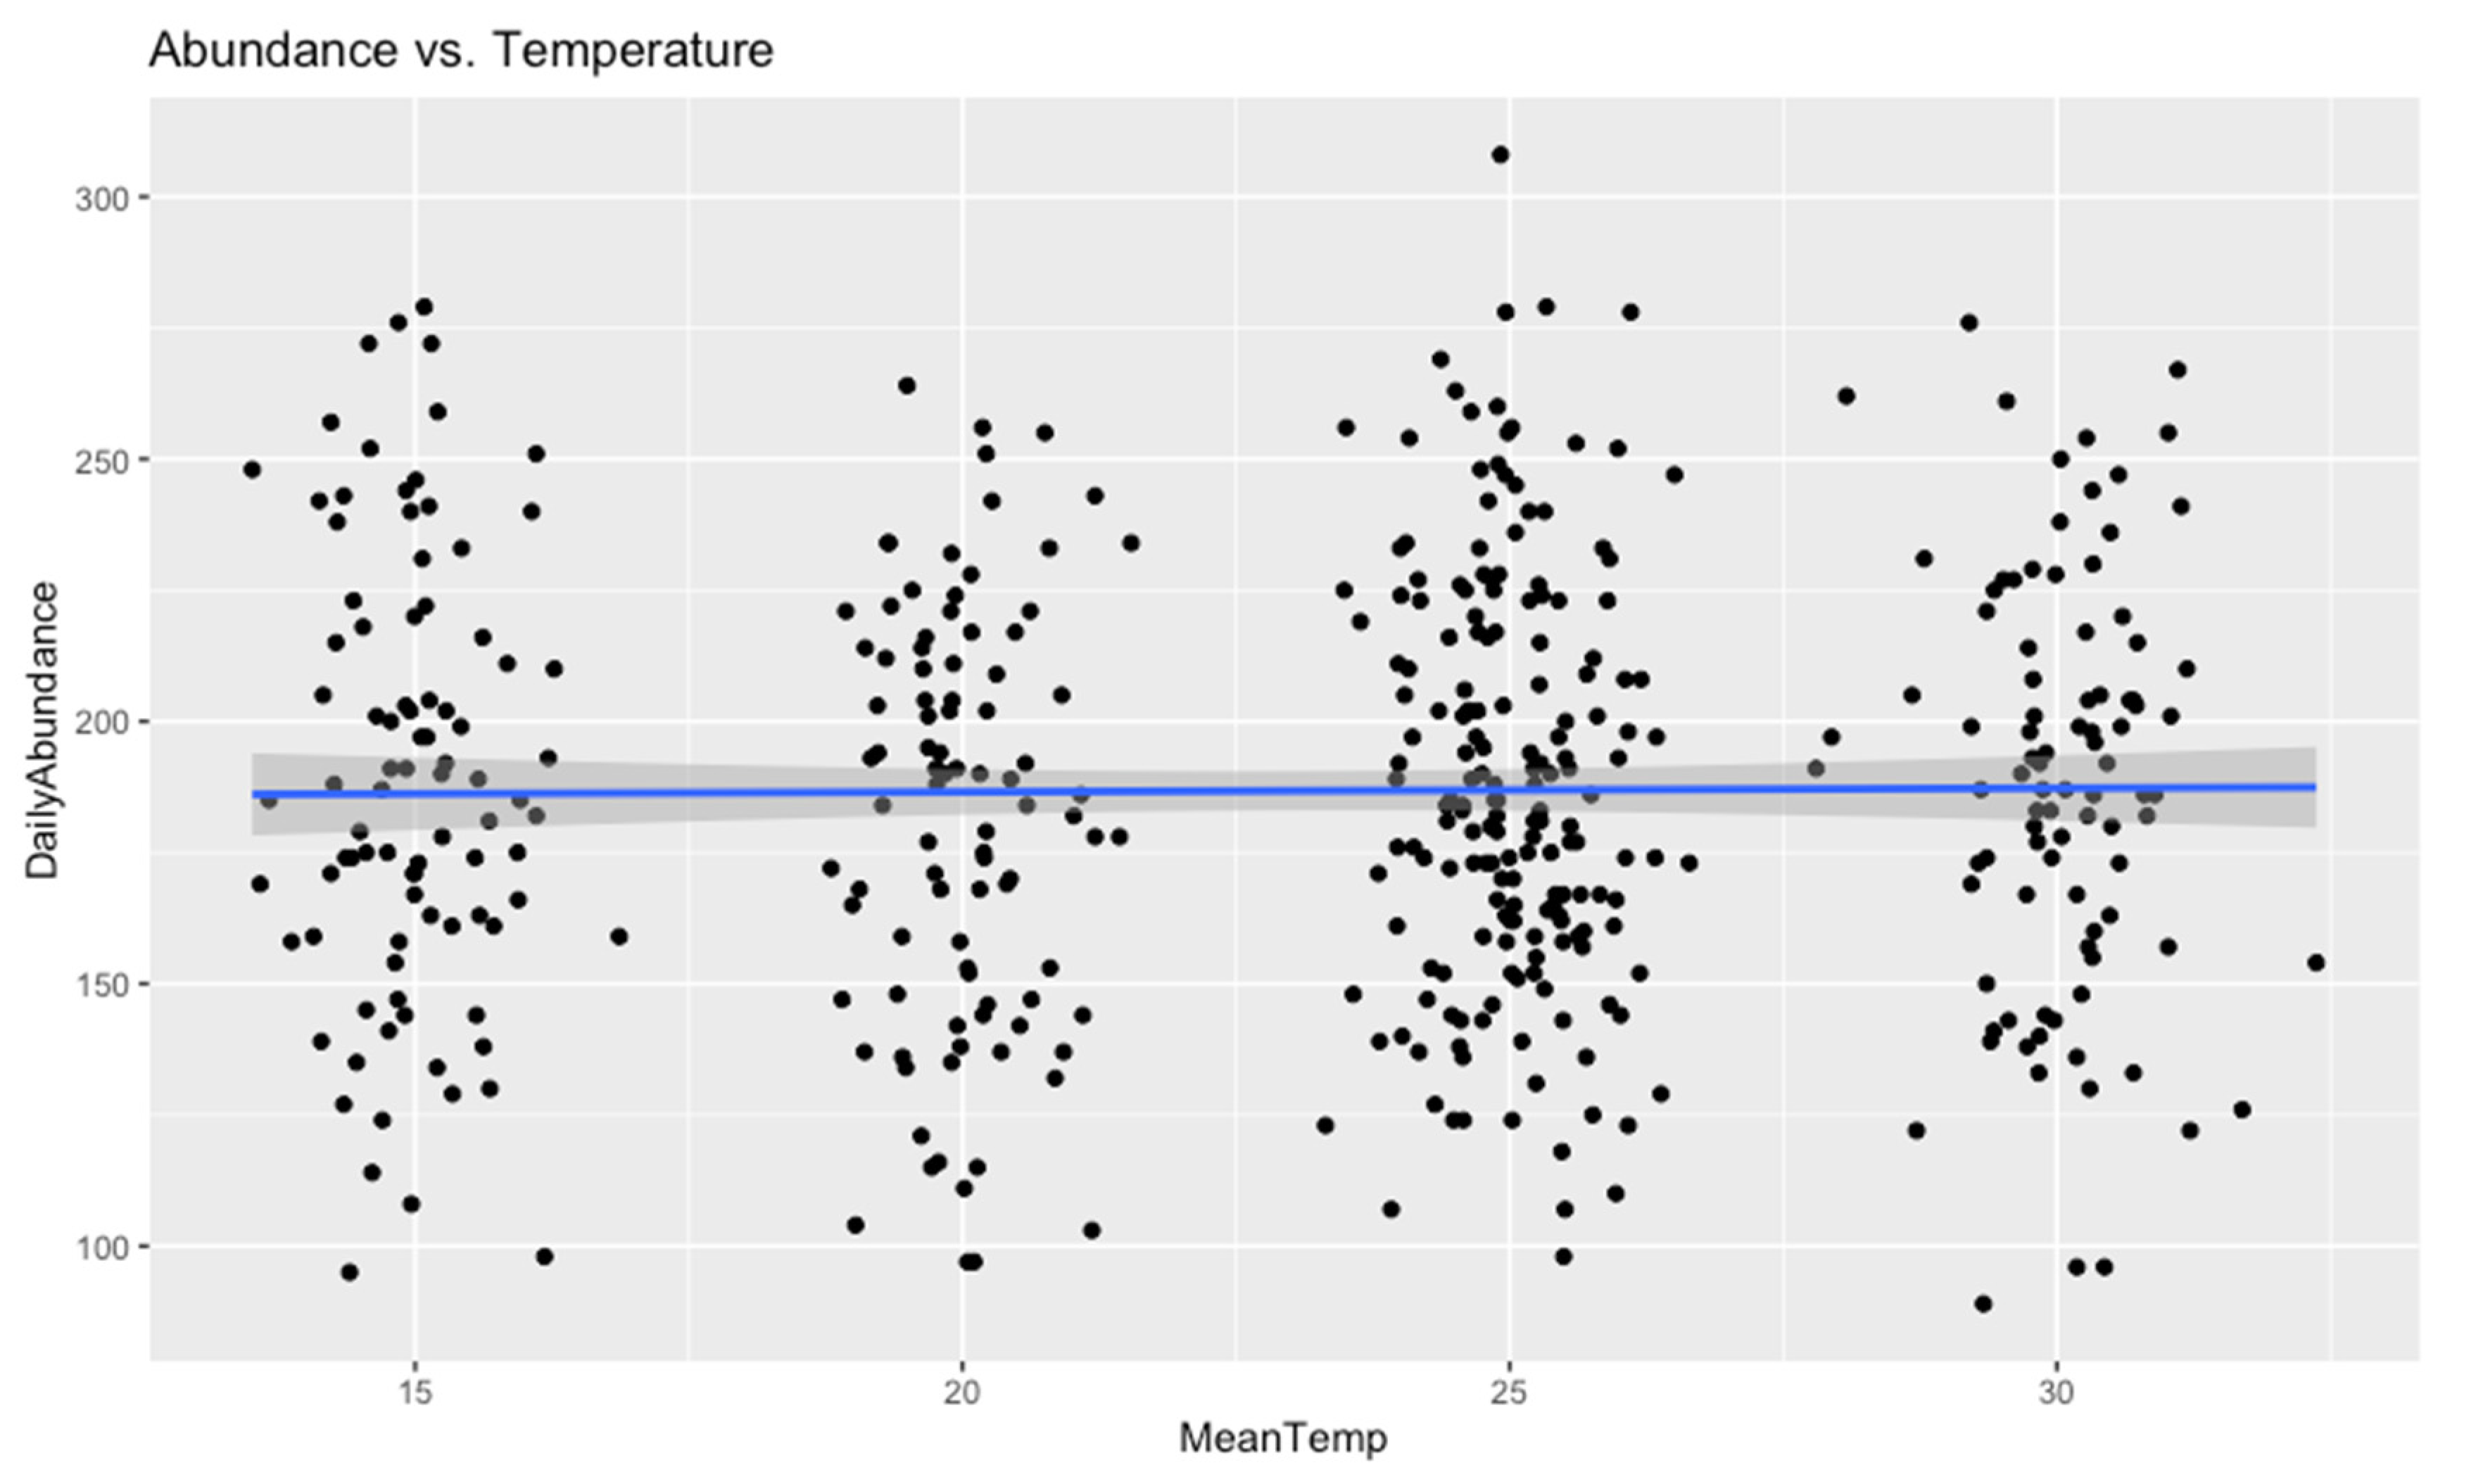
| DailyAbundance & MeanTemp | 15997559 | 0.8742 | 0.007412073 |
Table 8 shows the parameters estimated by the generalized linear model, indicating the significance of Temperature, Humidity, and Site on insect abundance.
A series of supplementary analyses was conducted to build on the initial findings and provide more nuanced insights into insect community structure, environmental drivers, and potential management implications. These additional approaches focused on examining species rarity, applying advanced statistical modeling, evaluating beta diversity, and exploring functional group dynamics. The key interpretations are summarized below:
Species-Level Exploration: Rare vs. Common Species
Sometimes linear models (ANOVA, simple regressions) do not fully capture non-linear or complex relationships between insect abundance and environmental variables. Below are two popular approaches: Generalized Additive Models (GAMs) and Mixed-Effects Models (GLMMs). While the initial generalized linear model (GLM) showed only a modest effect of MeanHumidity on insect abundance (Table 8 in the previous section), it assumed a linear relationship.
Identify and Classify Rare vs. Common Species
Distinguishing between species classified as “rare” versus “common” revealed that a small subset of species dominates overall abundance, while many occur in low numbers. This pattern suggests a community that is moderately uneven, with several highly adaptable taxa overshadowing multiple specialized or less competitive ones. Monitoring these rare species separately could be important for conservation, as they may be more sensitive to habitat changes and disturbances. Define thresholds for “rare” vs. “common.” For instance, you might call a species “rare” if it represents <1% of total abundance.
Figure 5.
Rear vs. Common species over time by site.
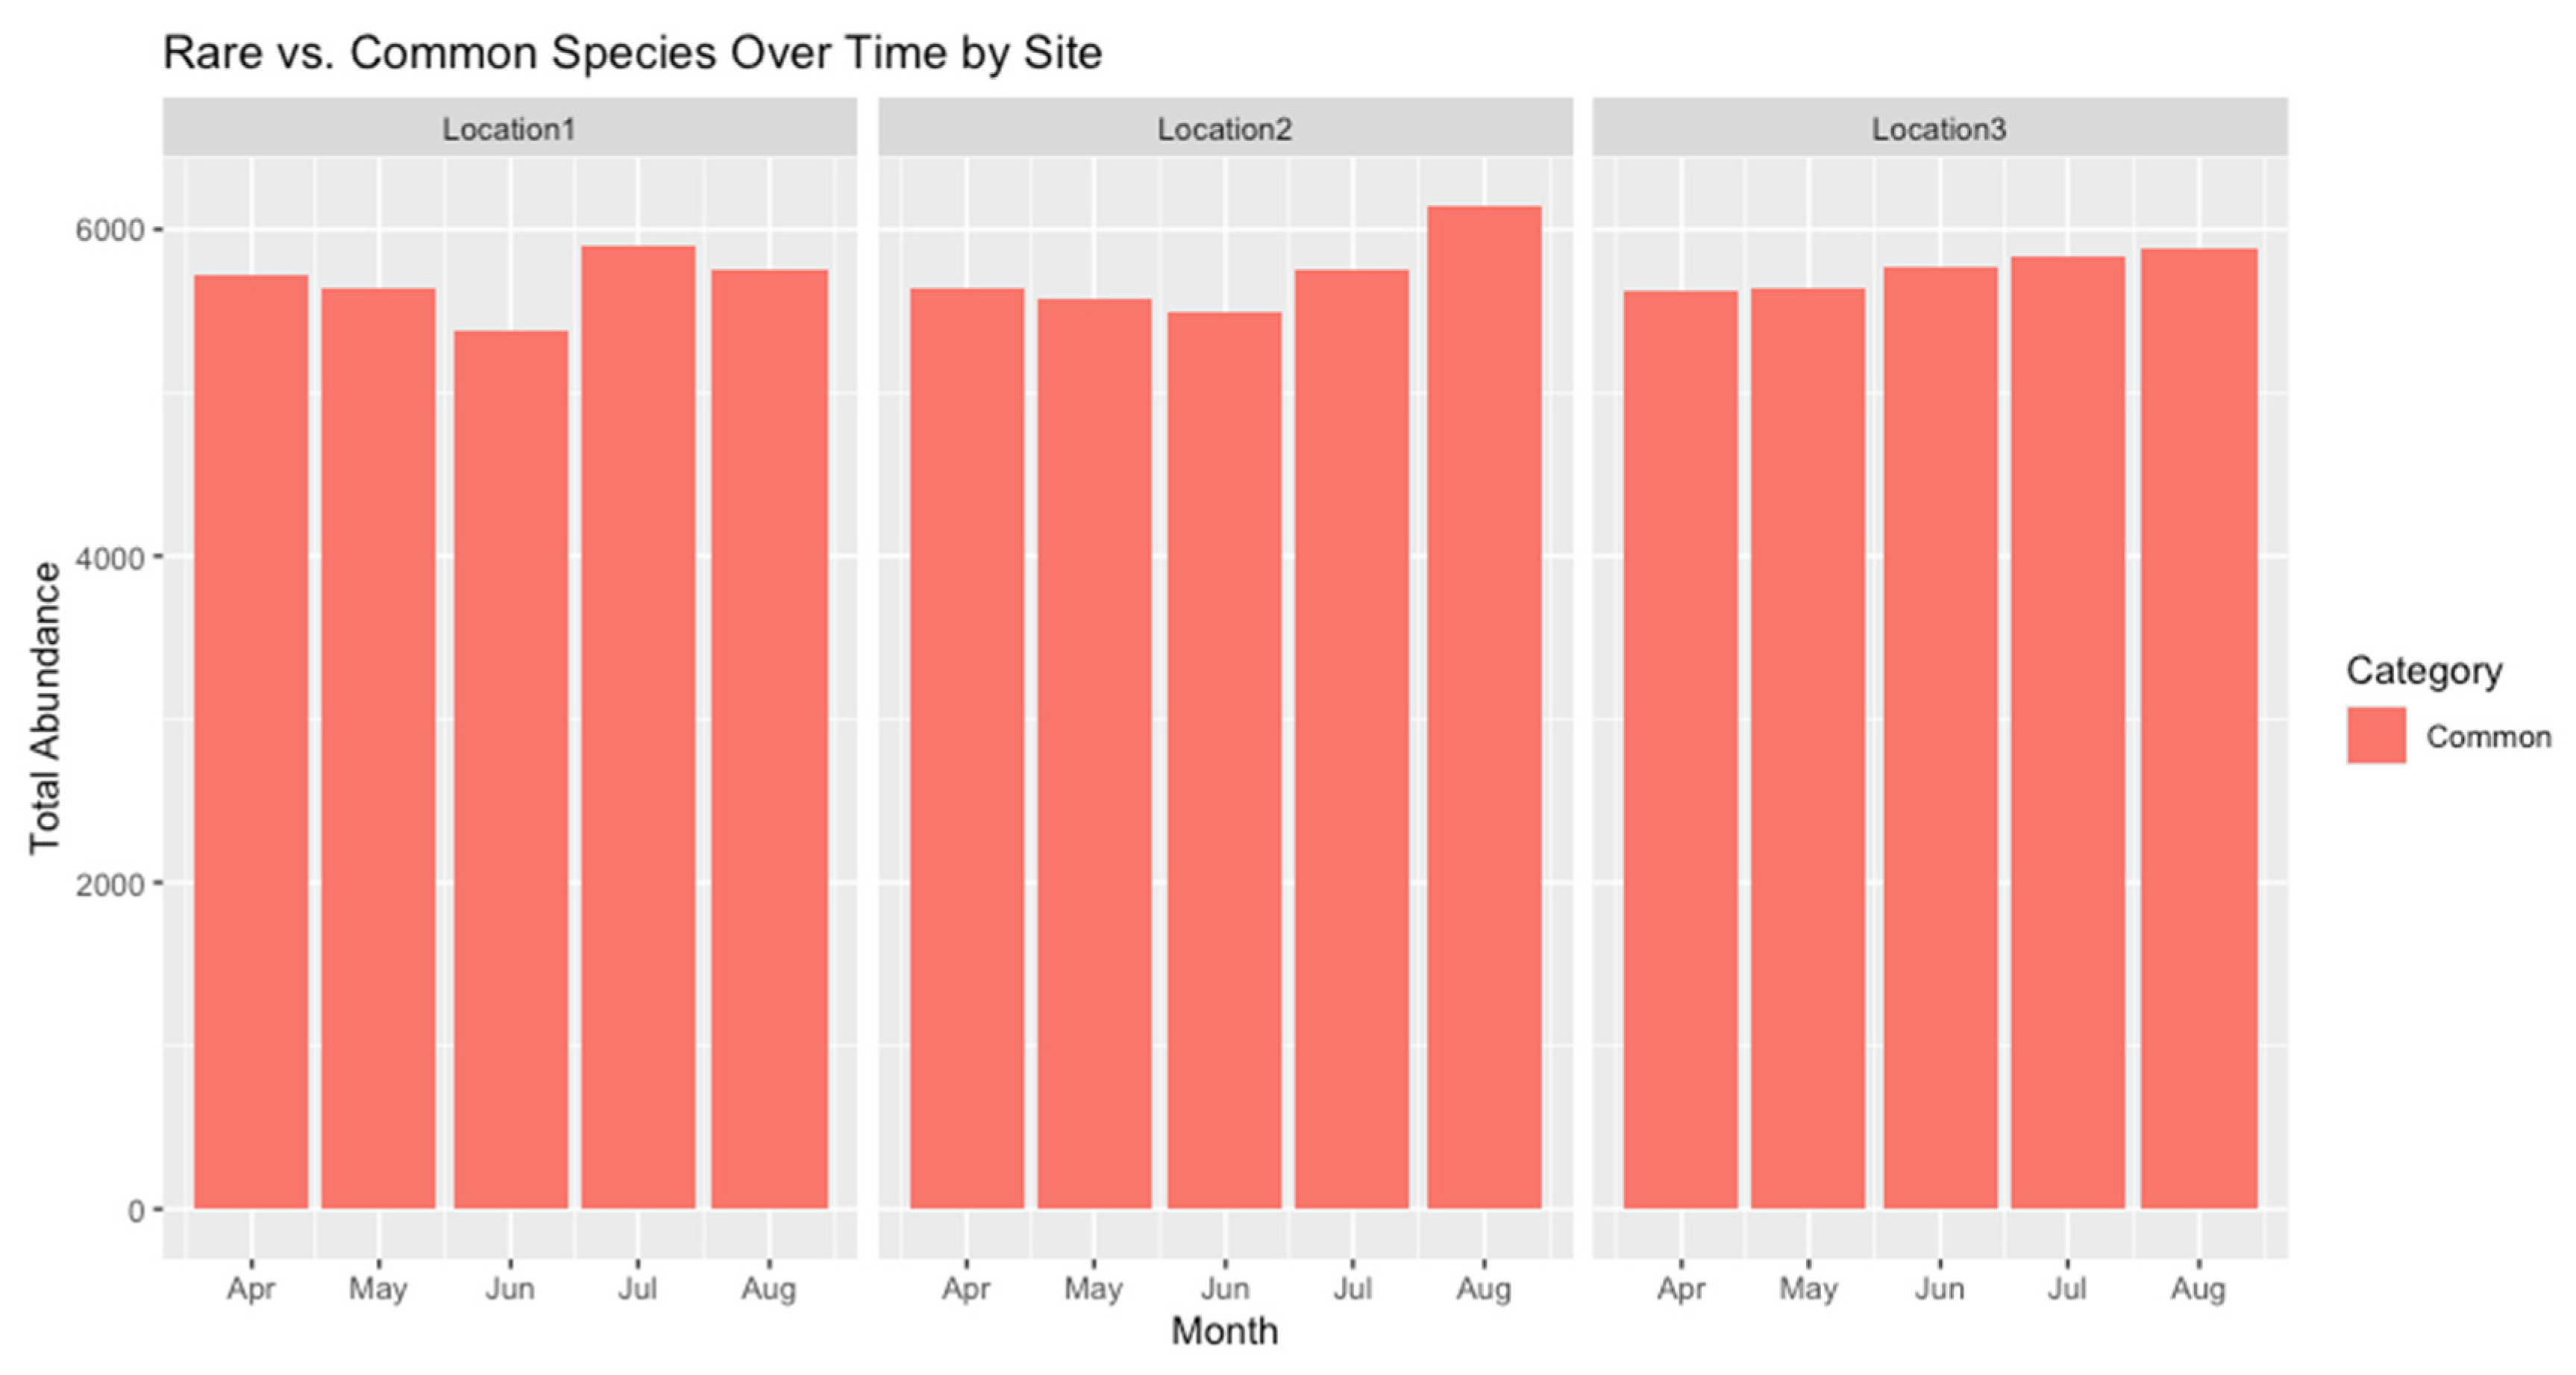
Figure 6.
Abundance vs. Temperature.
Advanced Statistical Modeling
Figure 8 presents the effects of mean temperature and mean humidity on daily insect abundance.
Figure 8.
Effect of Abundance and Temperature on Abundance.
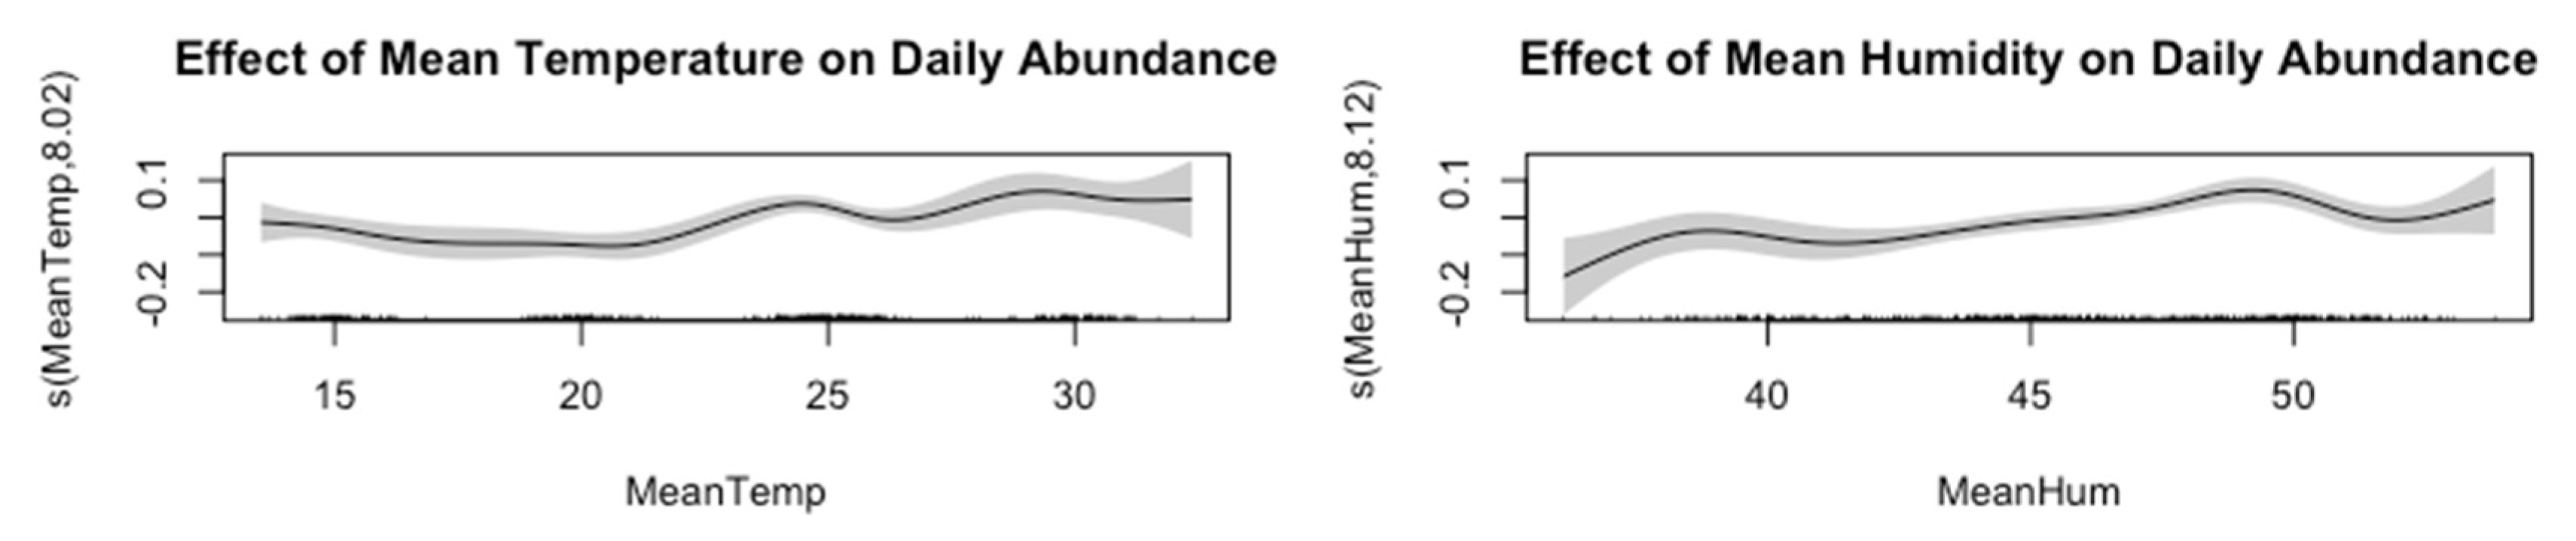
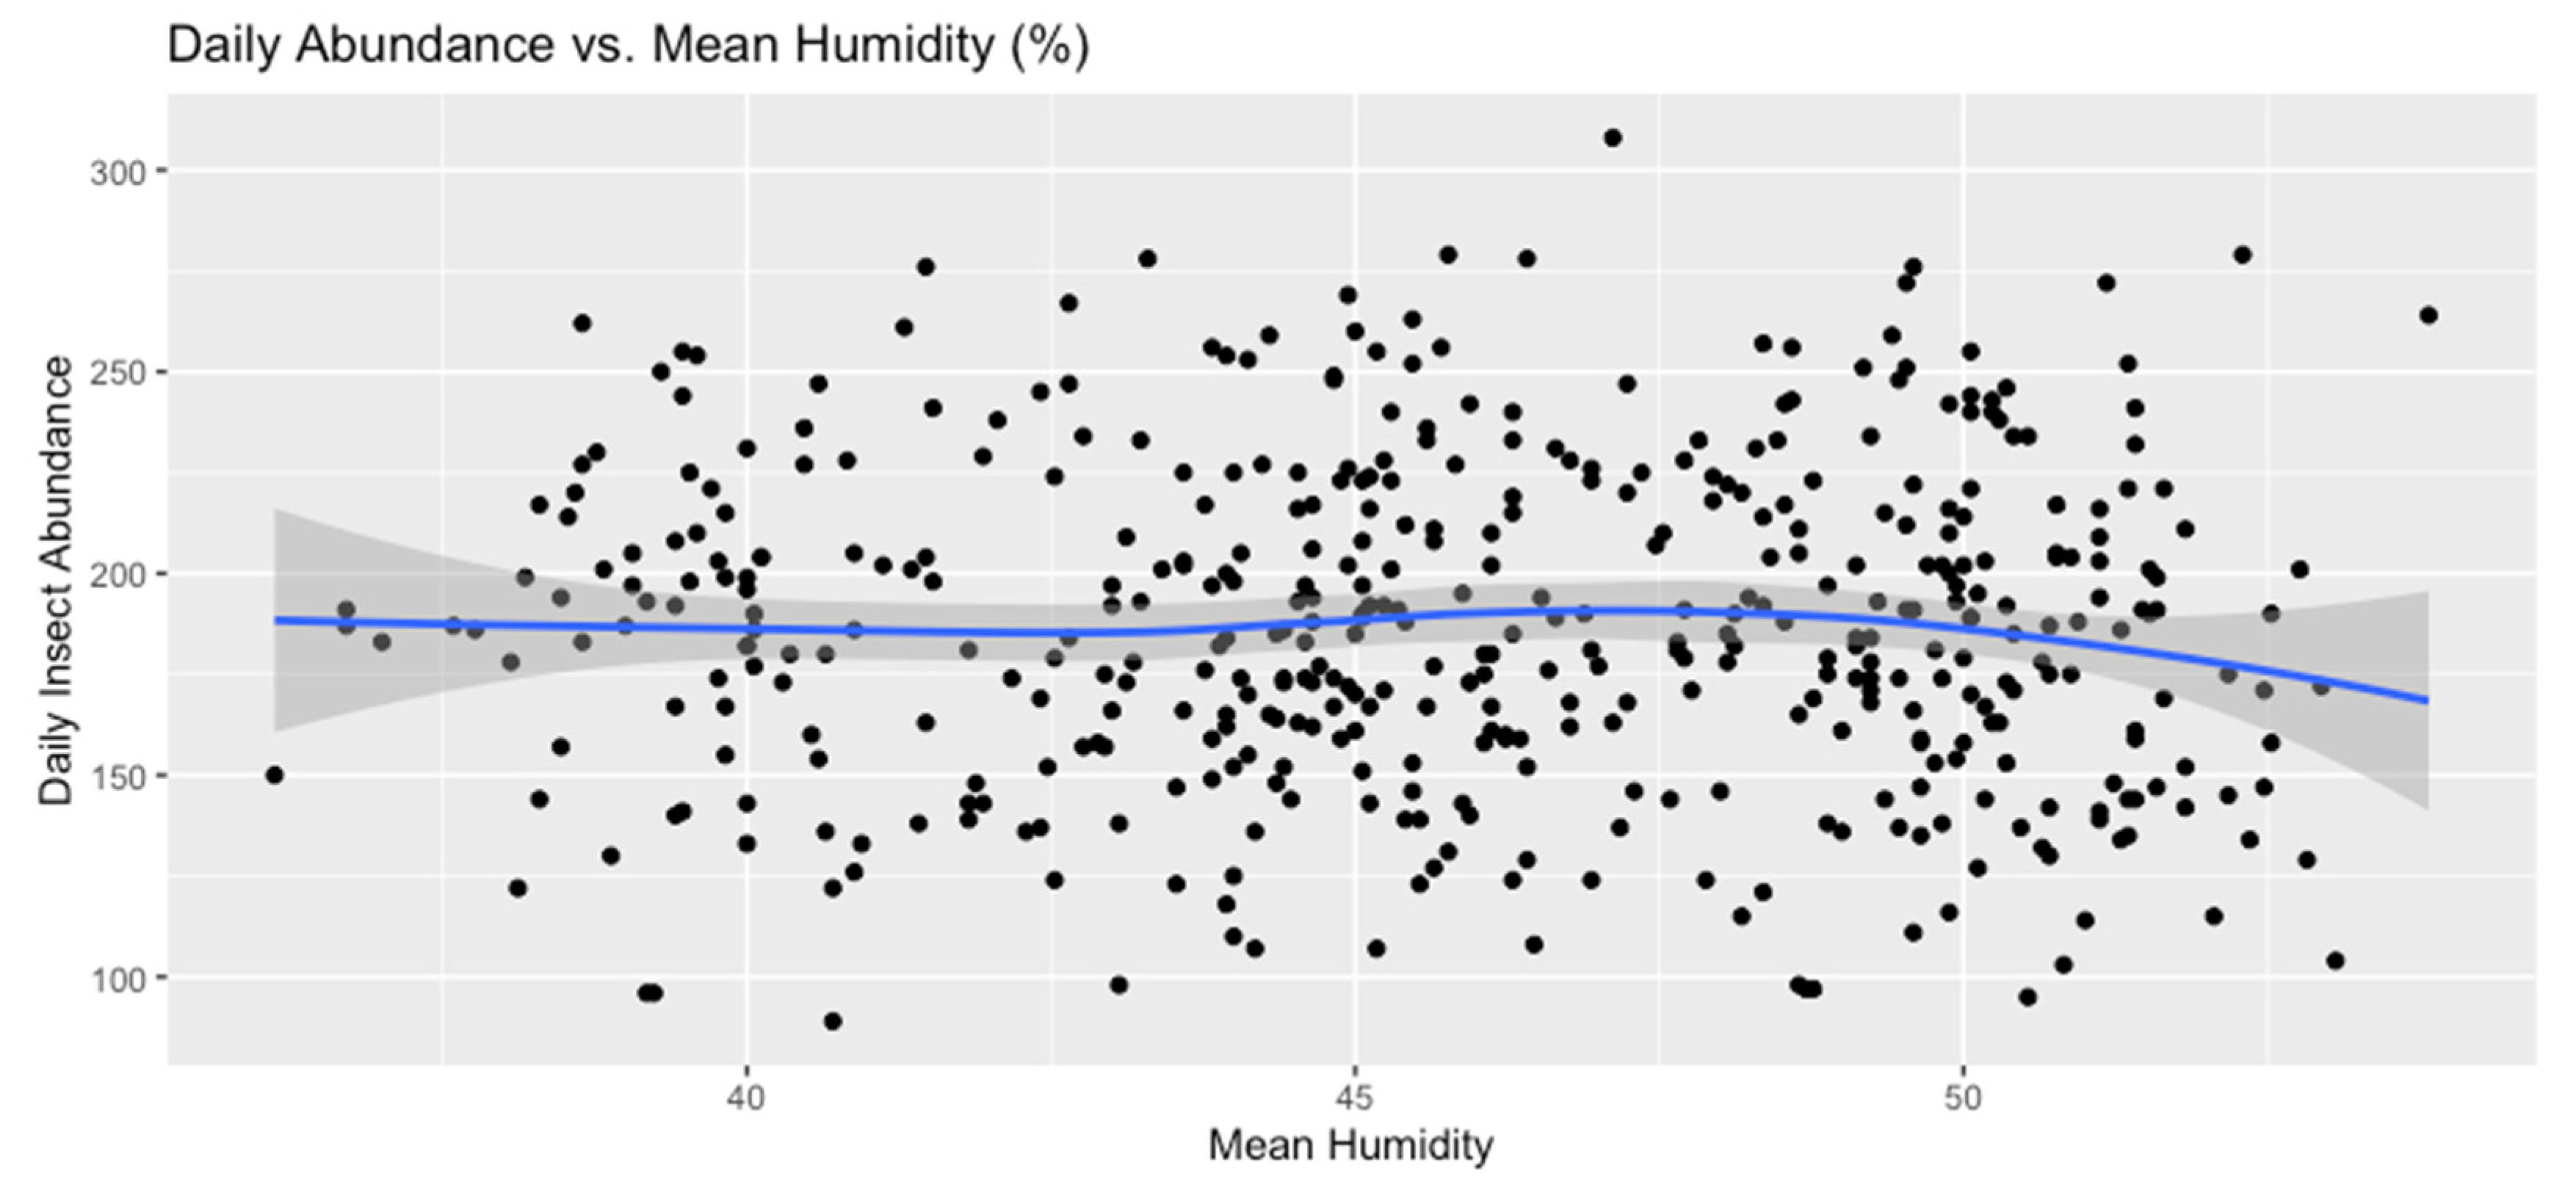
Figure 9.
Daily Abundance vs. Mean Humidity (%).
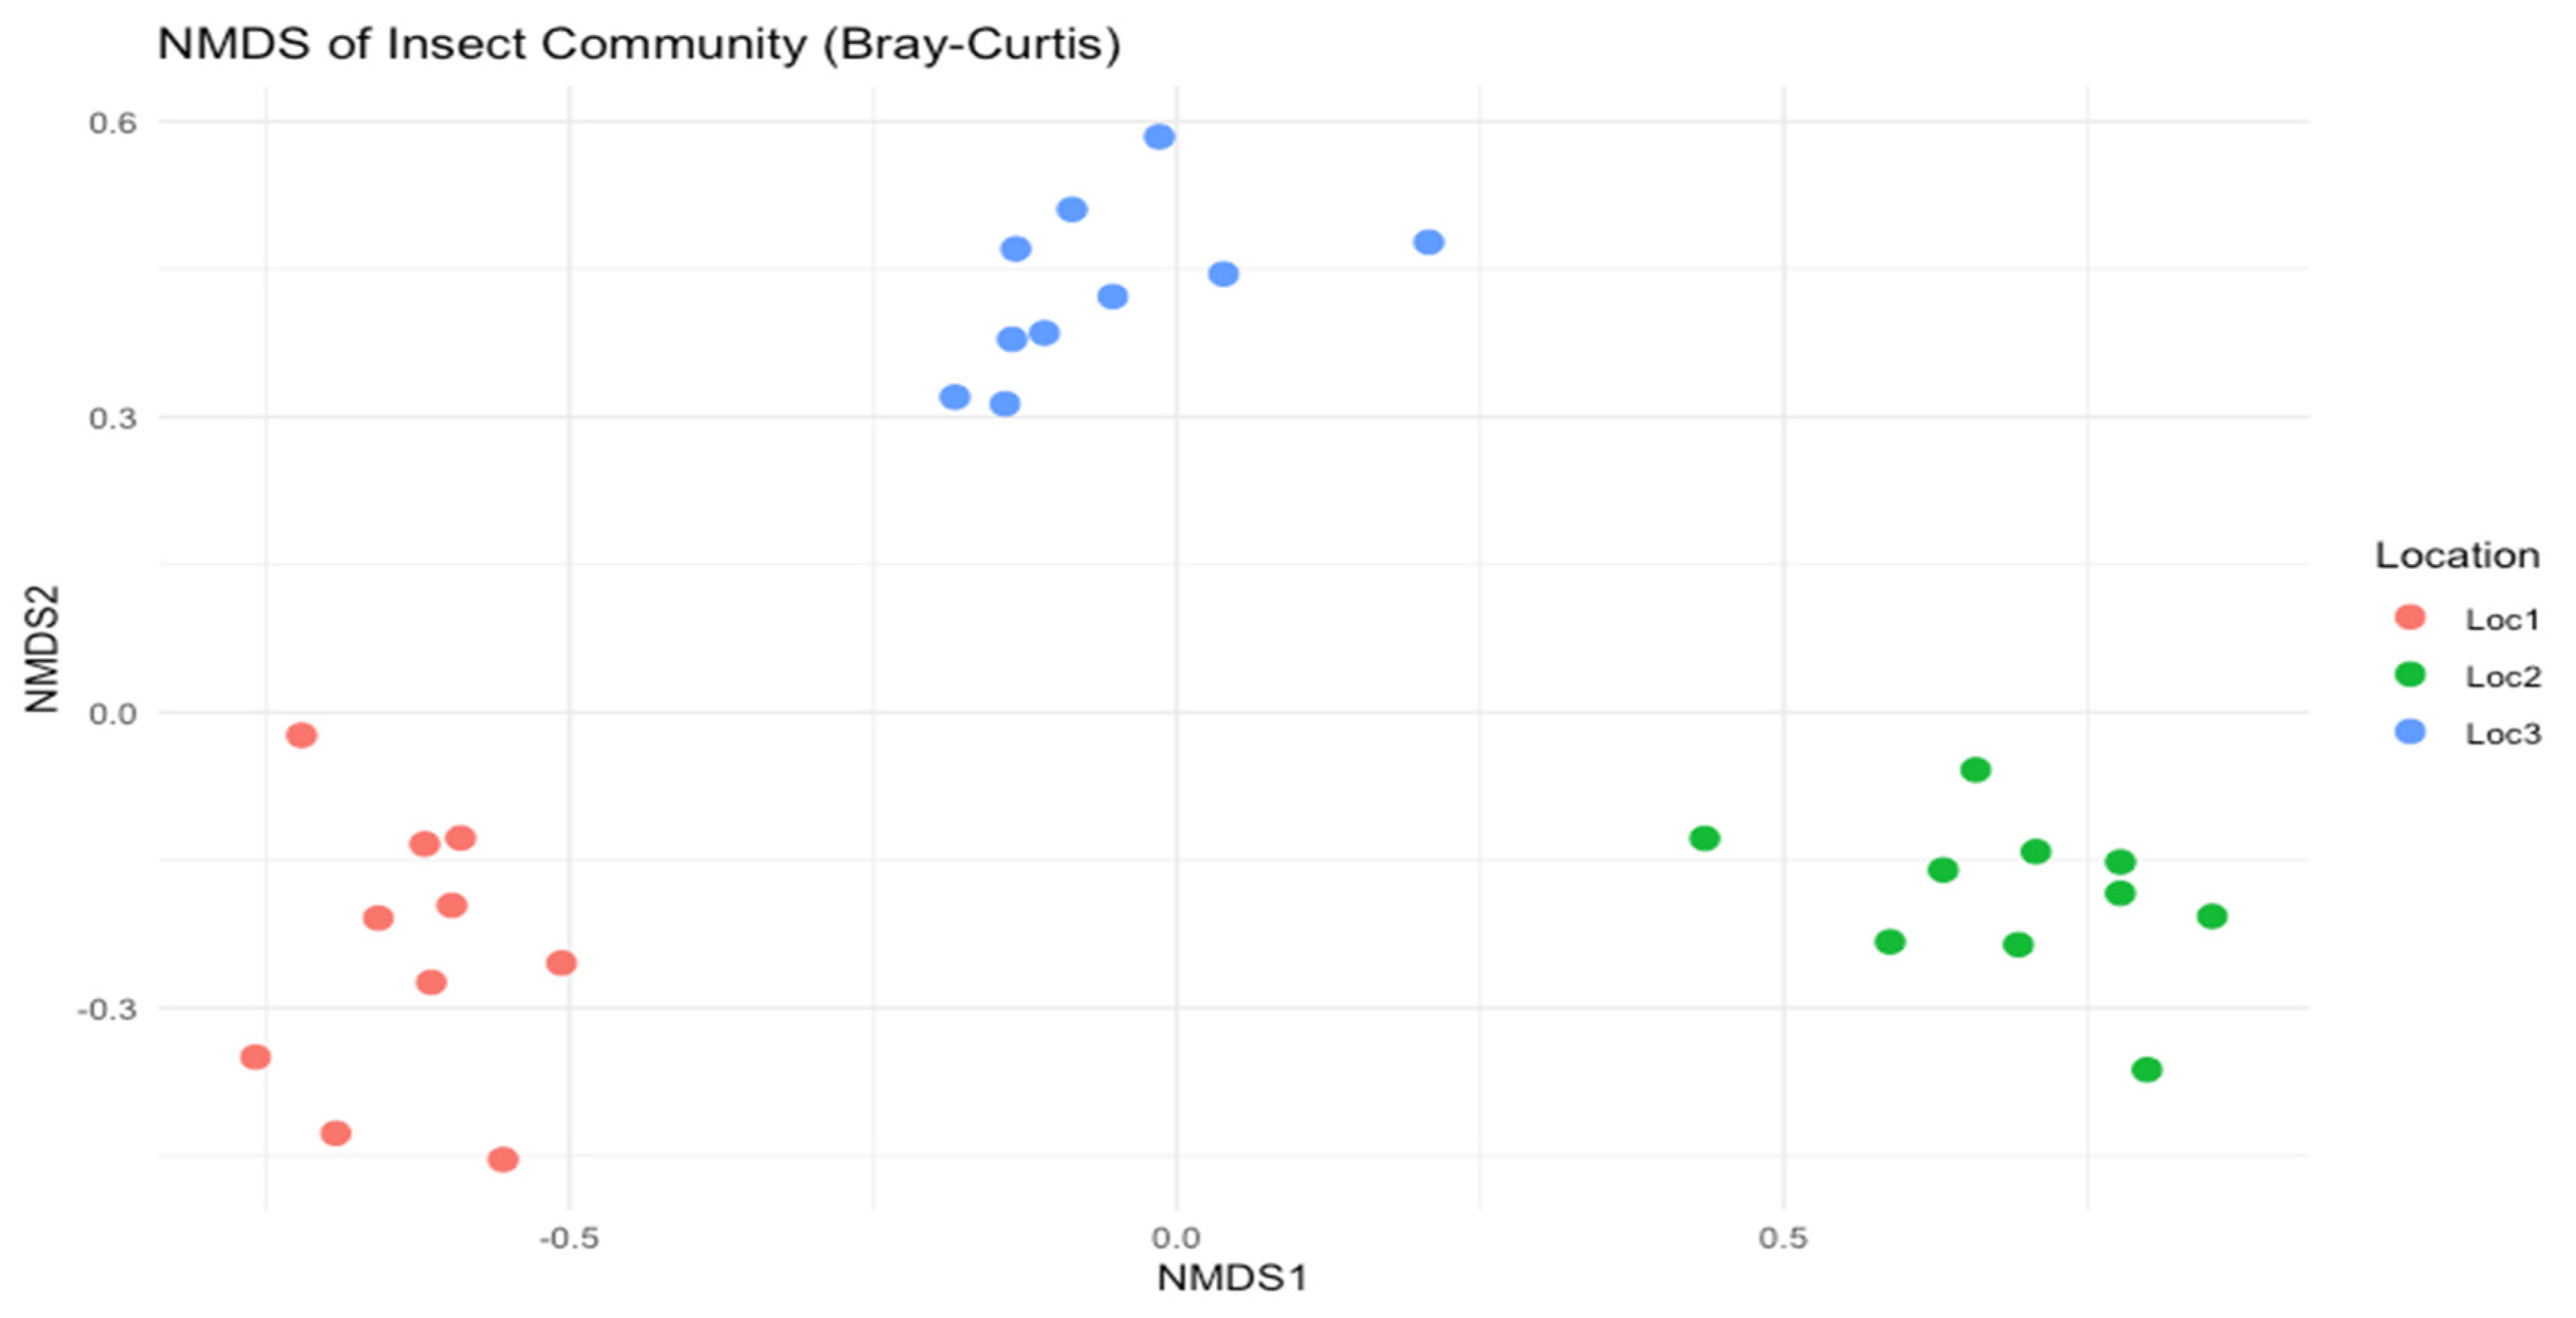
Community Composition Analysis
Ordination (NMDS or PCA)
A non-metric multidimensional scaling (NMDS) was performed to visualize differences in species composition among the three sites, using a Bray-Curtis distance measure.
Figure 10.
NMDS plot illustrating clustering of species communities for each site.
PERMANOVA
A PERMANOVA test (using adonis2) was conducted to statistically test for compositional differences between sites.
Table 9 presents the results of the PERMANOVA (Permutational Multivariate Analysis of Variance) test.
Indicator Species Analysis
To identify species indicative of specific sites or conditions, an Indicator Species Analysis was performed.
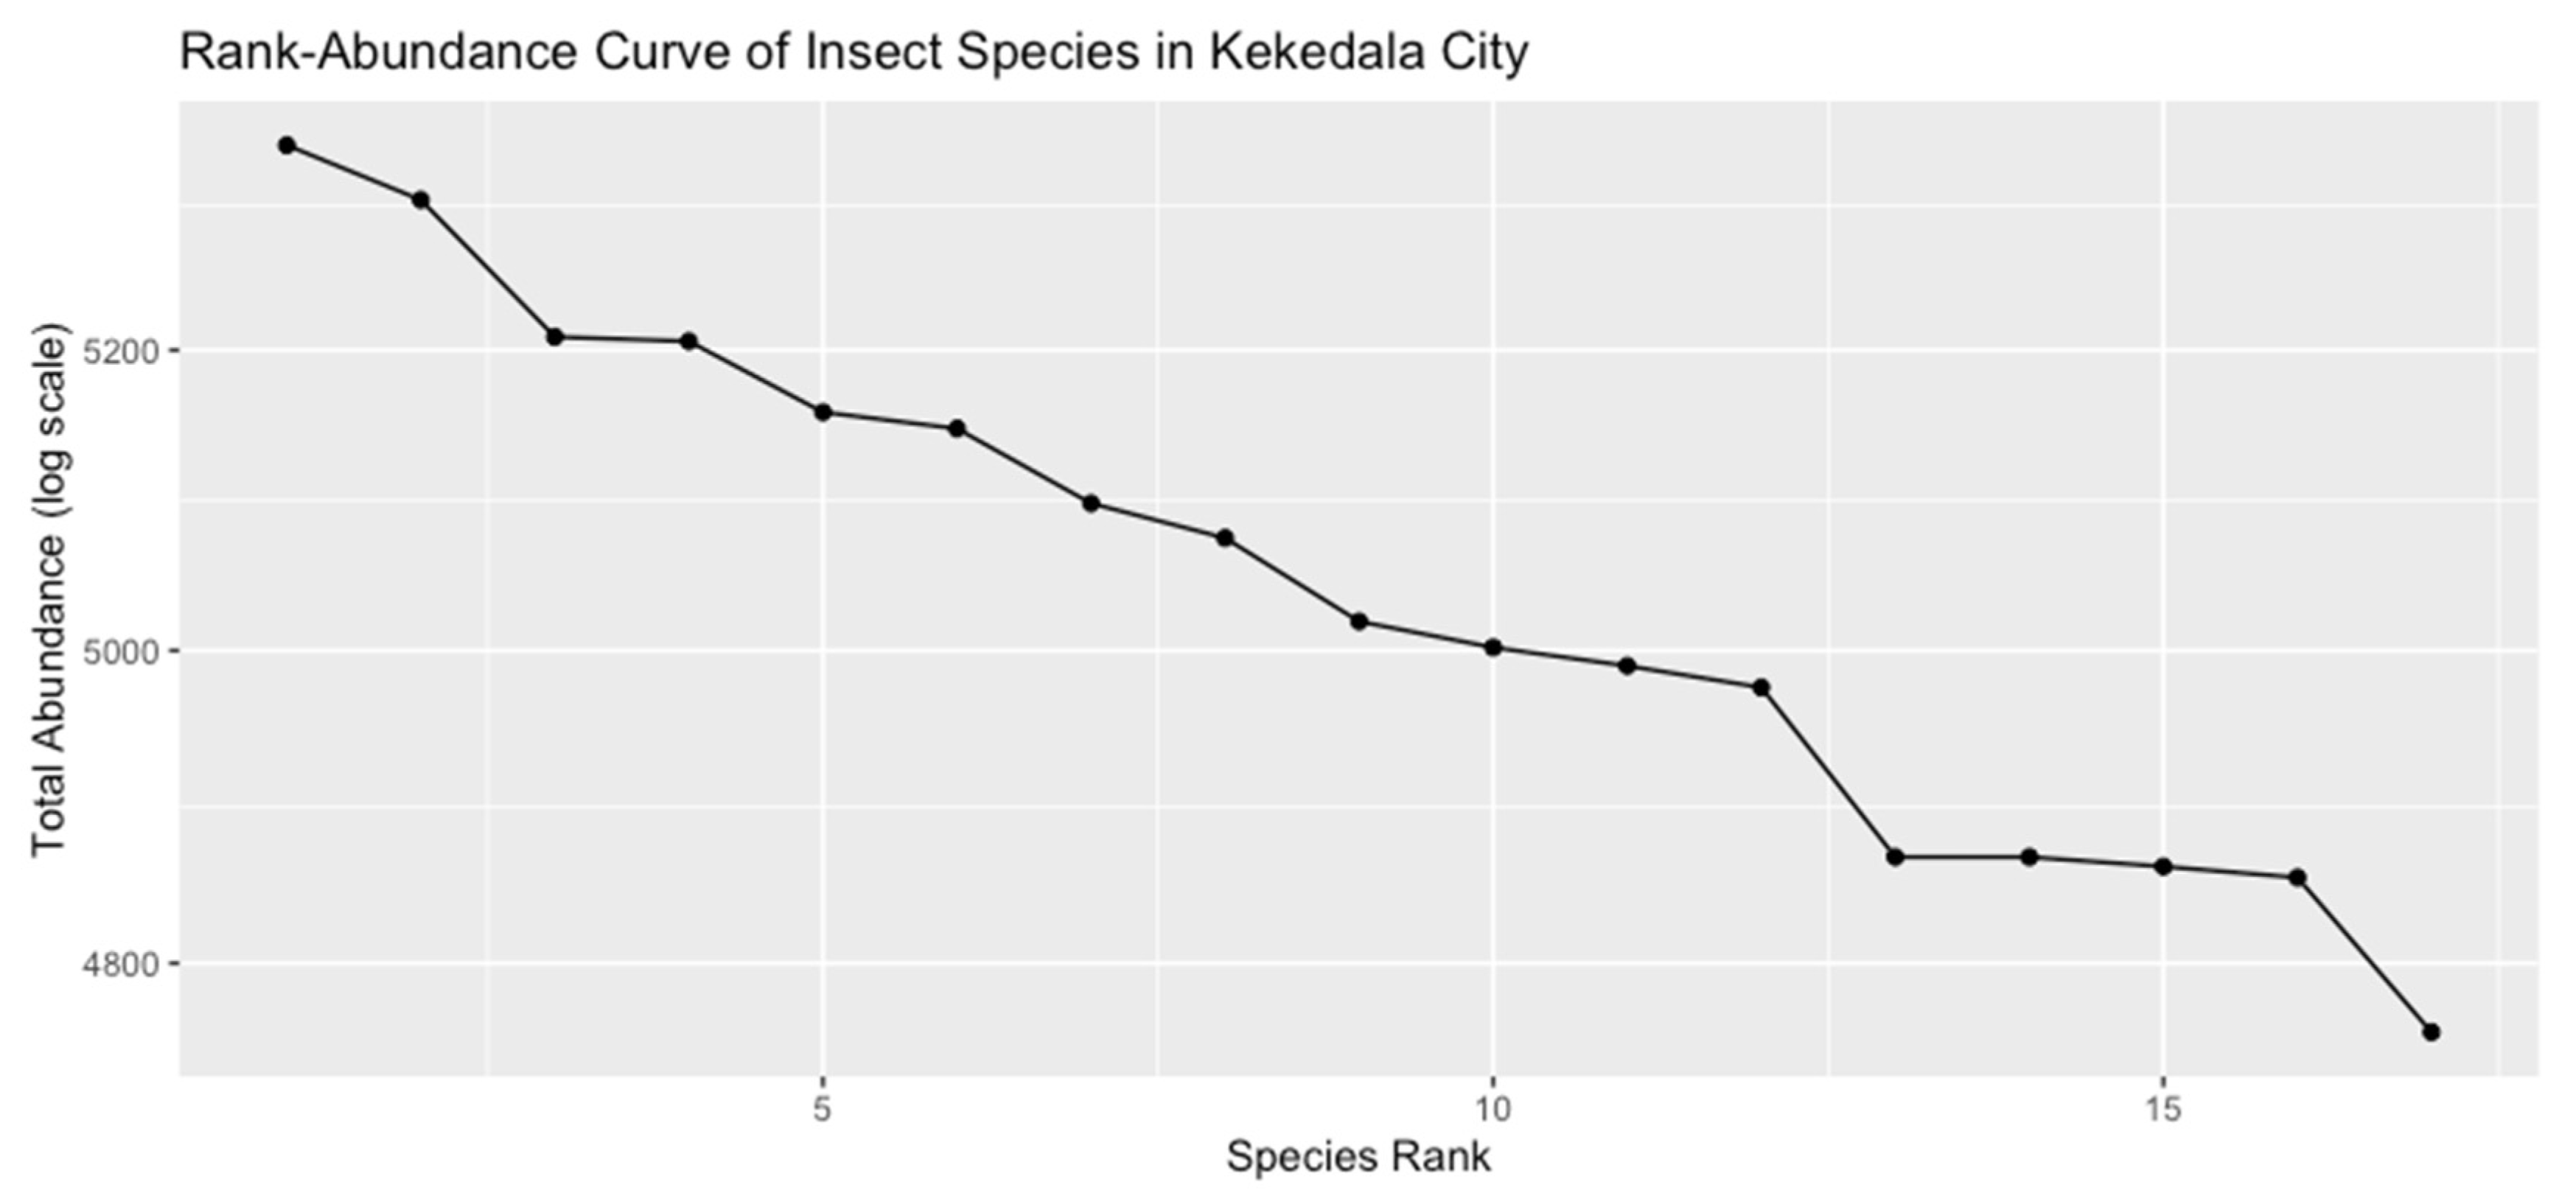
Rank-Abundance Patterns
While the earlier sections examined overall insect abundance and broad community metrics (e.g., Shannon index), a rank-abundance analysis provides another perspective by highlighting how a few species may dominate the community while others remain rare. A steep rank-abundance slope indicates low evenness, meaning a small number of species comprise most of the total abundance. A flatter slope suggests more equitable distributions among species. All records in insects data were summed by species, and these totals were sorted in descending order to produce a rank-abundance dataset. The analyses presented in this chapter provide a comprehensive view of insect biodiversity across urban, suburban, and rural locations in Kekedala City. Key findings include:
Figure 6.
Rank Abundance.
A portion of the rank-abundance data is summarized in Table 11, listing the five most abundant species (rank 1–5) and the five least abundant (rank 13–17):
Temporal Analysis of Key Species
Selection of Focal Species
To gain insight into how dominant species vary over time, two high-abundance species (e.g., Paracle fusca, Eupithecia millefoliata) were compared with one lower-abundance species (e.g., Protoschinia nuchalis). These species were selected based on their distinct ranks in the rank-abundance table.
Monthly Distribution
Monthly totals for each focal species were calculated and plotted:
Figure 6.
Monthly abundance trends for three focal species, illustrating differences in seasonal patterns.
Figure 6.
Monthly abundance trends for three focal species, illustrating differences in seasonal patterns.
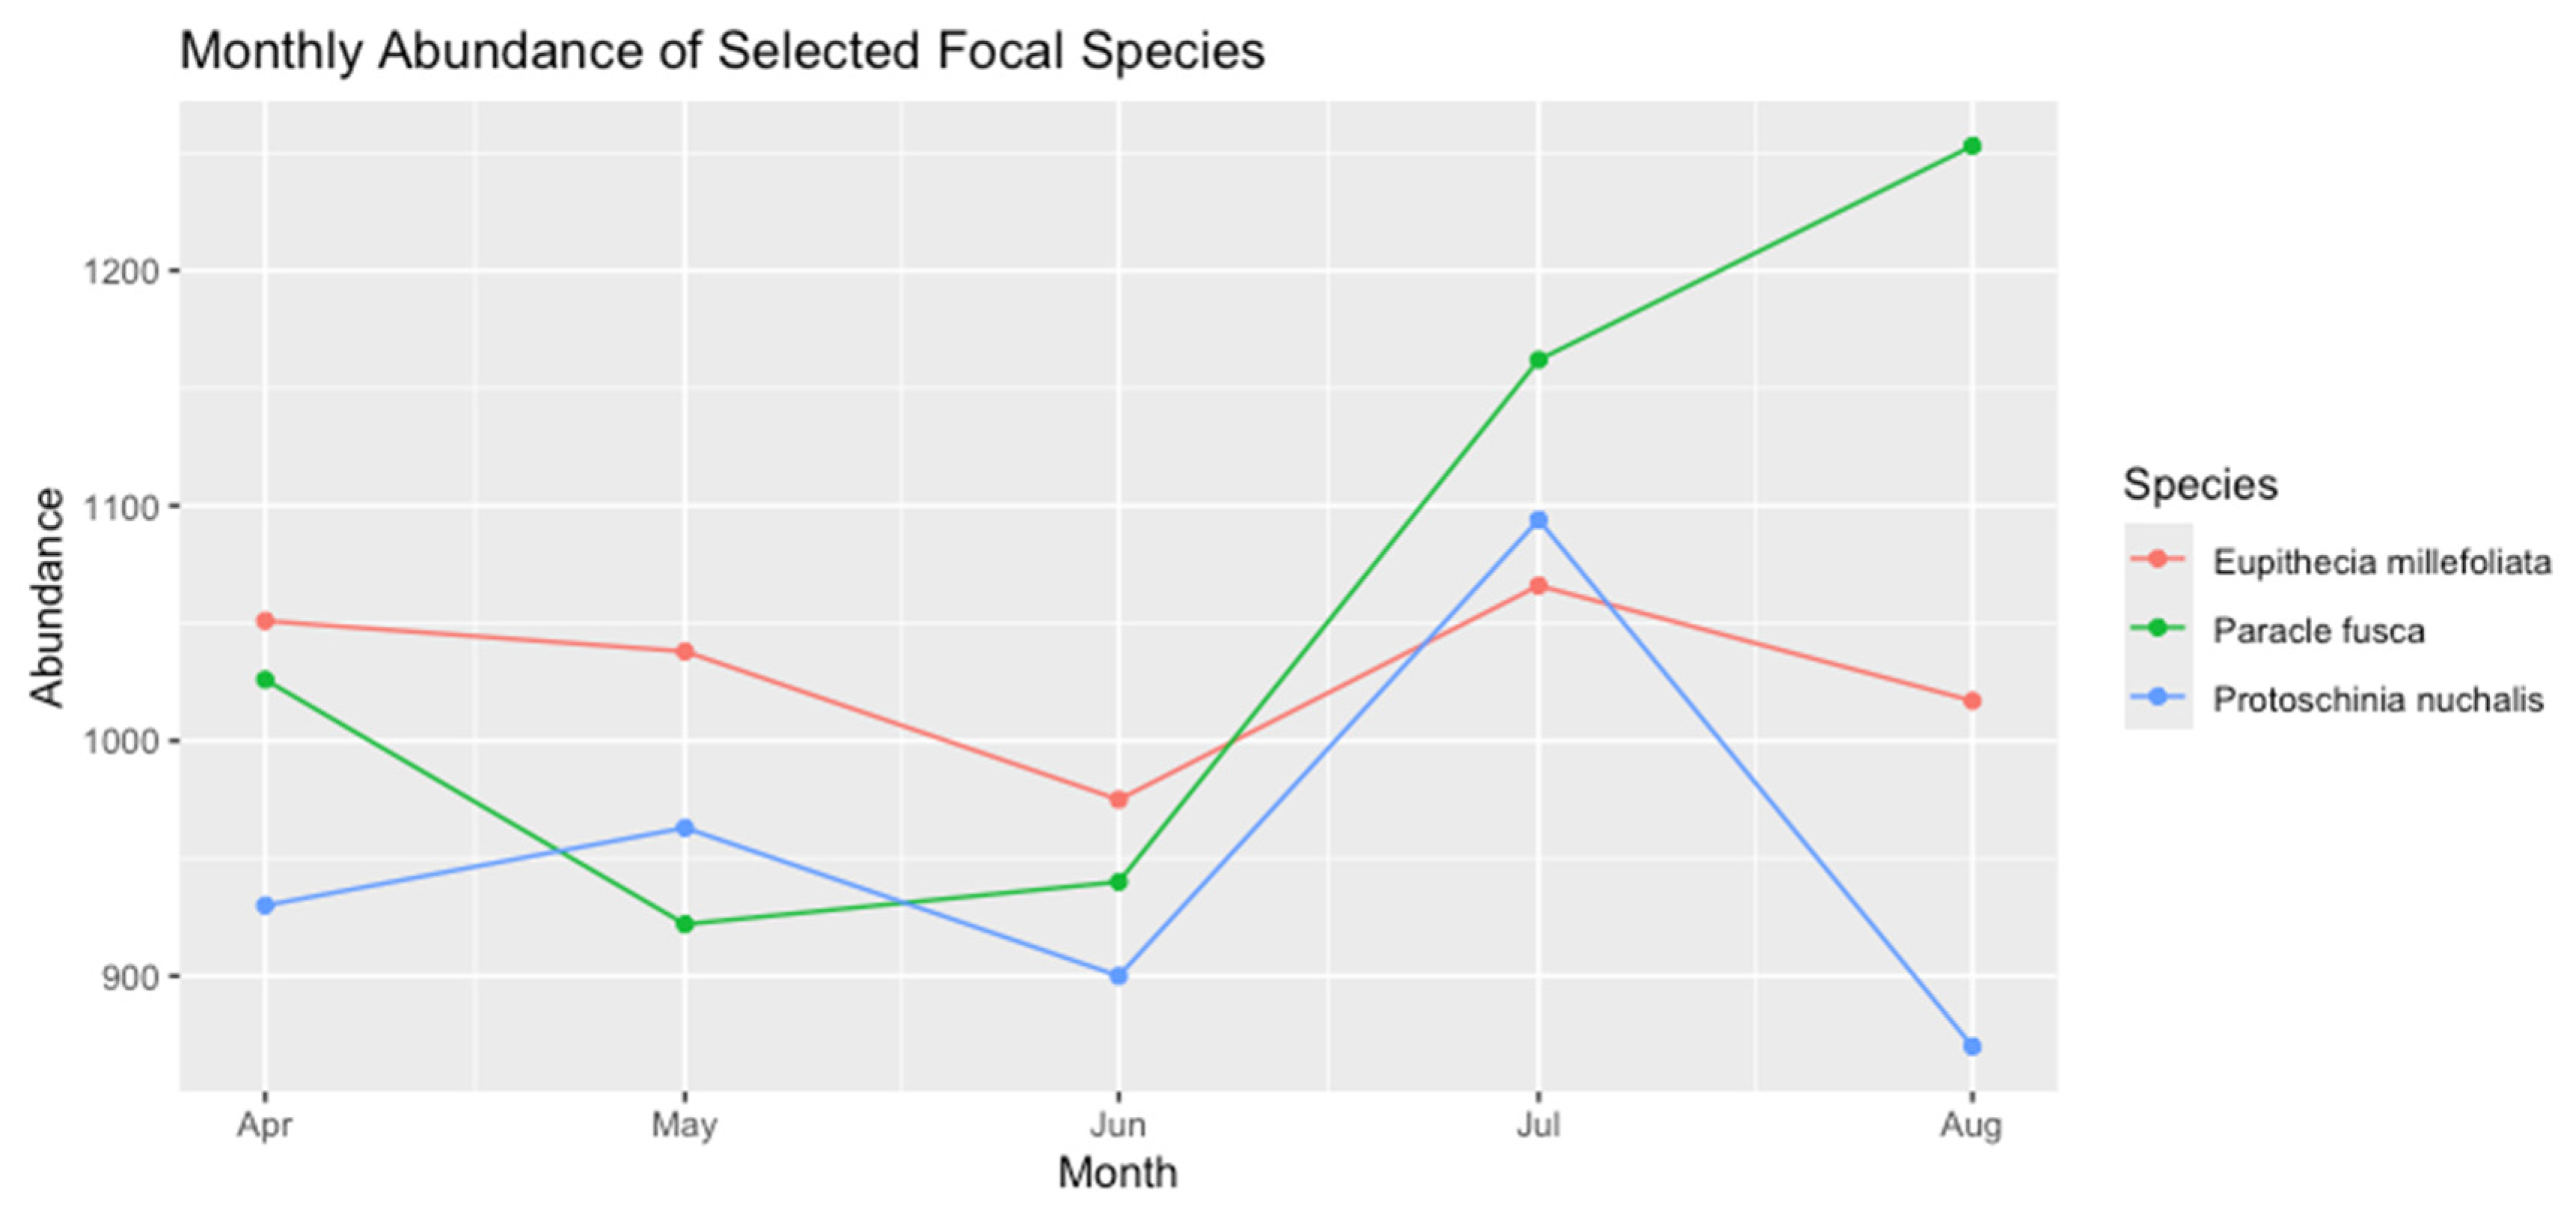
Paracle fusca peaked in July, coinciding with high overall insect abundance. Eupithecia millefoliata demonstrated a more gradual increase from April to August, hinting at a broader temporal window of activity. Protoschinia nuchalis, being among the lower-ranked species, remained consistently below ~500 captures per month and lacked a pronounced peak, suggesting it may occupy a more specialized or consistently low-density niche.
These patterns underscore the importance of species-level temporal data in understanding community structure. Even though Protoschinia nuchalis is relatively uncommon overall, its consistent presence indicates it may be adapted to conditions that persist throughout the sampling season.
Overview of Noval Species:
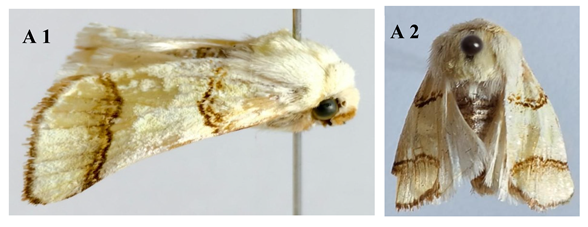 |
| Figure A (1 & 2) Pinacoplus didymogramma |
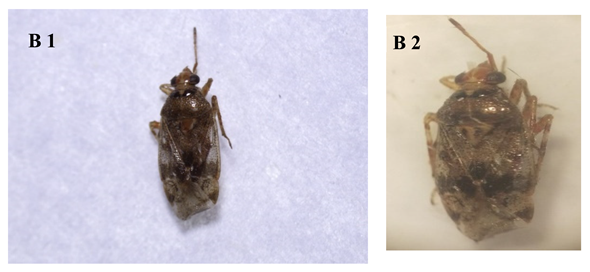 |
| Figure B (1 & 2) Stethoconus pyri |
Discussion
This study investigated insect biodiversity across urban, semi-urban, and rural habitats in Kekedala, China, from April to August 2023. The findings highlight the impact of environmental variables, especially temperature and humidity, on insect communities. The significant variations in insect composition and abundance across habitats corroborate similar research [12,13], where temperature and humidity were shown to influence insect activity. Species abundance was higher during warmer months, supporting the general consensus that temperature plays a critical role in regulating insect population dynamics [14,15,16]. In terms of biodiversity, semi-urban habitats in Kekedala hosted higher diversity compared to urban areas, indicating their role as refuges for species amidst urbanization. Semi-urban areas can act as transitional zones supporting a higher diversity of species compared to highly urbanized environments [17,18]. Lower species richness in semi-urban areas, suggesting that biodiversity in these areas may also be influenced by local environmental conditions and management practices [19,20].
The study identified key insect families such as Noctuidae (moths), Carabidae (ground beetles), and Formicidae [21], with species showing distinct temporal patterns in response to ecological factors like plant availability and temperature. Noctuidae species peaked in summer, driven by the availability of host plants [22,23] and some studies has similar seasonal patterns in temperate zones. However, tropical environments, such as those found in parts of Southeast Asia, the patterns of peak abundance for Noctuidae and other taxa might not coincide with warmer months due to varying seasonal climate patterns [23,24,25]. The habitat heterogeneity strongly influences insect distribution. Carabidae was particularly abundant in urban areas, suggesting its adaptability to human-modified environments [26,27,28]. However, some urban areas in Brazil exhibited a decline in Carabidae populations, suggesting that different urbanization pressures, such as pollution and landscape structure, may impact insect communities differently across geographical contexts [29,30,31].
Seasonal fluctuations in insect populations were observed, with peak diversity in summer, correlating with increased temperatures and food availability. Seasonal patterns in insect populations, particularly in response to changes in temperature and resources [32,33,34]. However, the migratory insect species, such as certain butterflies and dragonflies, show distinct seasonal movements driven by climatic conditions and food resource availability [23,35,36,37]. This reinforces the importance of seasonal and climatic factors in shaping insect biodiversity. The effectiveness of light traps as a tool for assessing nocturnal insect biodiversity, although it acknowledged biases in capturing only phototactic species. The overrepresentation of moths and beetles due to their attraction to light sources [38,39,40]. To mitigate these biases, by combining light traps with other collection methods such as pitfall traps, which could help capture non-phototactic species [41].
This study underscores the importance of habitat preservation, especially in semi-urban and rural areas, for maintaining insect diversity. Habitat fragmentation in urban environments negatively impacts insect populations [17,19,42]. Furthermore, the integrating green spaces and ecological corridors in urban areas could help mitigate biodiversity loss [43,44]. Additionally, the role of semi-urban and rural landscapes in supporting insect populations, advocating for the preservation of these areas as essential for maintaining overall biodiversity [45]. Community-based conservation and citizen science initiatives are vital for long-term monitoring and enhancing public awareness of the ecological importance of insect populations [46,47]. The role of citizen science in biodiversity conservation, noting that public engagement could lead to better environmental stewardship [48]. Integrating community members into the monitoring process not only increases the spatial and temporal scope of biodiversity assessments but also raises awareness about the impacts of urbanization and climate change on local ecosystems [43,49,50].
This study contributes to the growing body of literature on insect biodiversity, reinforcing the significance of climate, habitat heterogeneity, and seasonal fluctuations in shaping insect populations. The integration of community-based efforts and advanced monitoring techniques, such as light traps and complementary methods, will be crucial for ensuring the long-term sustainability of insect biodiversity in urban and semi-urban environments.
Conclusion
This study examines insect diversity in Kekedala City, focusing on species composition, seasonal patterns, and environmental impacts across urban, semi-urban, and rural areas. Light traps were used to collect and classify insect species, with abundance and distribution analyzed. Results showed that insect diversity was strongly influenced by environmental factors, with peak abundance in July and August. While total abundance did not vary by location, species richness and community composition were affected by habitat features such as vegetation and microclimate. The semi-urban garden site exhibited the highest species diversity, highlighting the importance of green spaces in urban areas for biodiversity. Shannon and Pielou’s Evenness Indices revealed complex ecological integration across habitats, influenced by localized environmental factors. Seasonal insect activity aligned with global patterns, reflecting breeding periods and resource availability. The study emphasized the importance of urban development that incorporates green spaces to support biodiversity. Indicator species identified in the study offer tools for ecological monitoring and biodiversity loss mitigation. Citizen science initiatives could further support biodiversity monitoring. This research provides crucial baseline data for Kekedala City’s biodiversity, guiding sustainable urban planning and conservation strategies.
Author Contributions
1: Conceptualization, writing– original draft, Software analysis, writing– review & editing, finalization. 2: Supervision and writing– review & editing.3: Review & editing in analysis. 4: Visualization, writing– review & editing. All authors have read and agreed to the published version of the manuscript.
Funding
Science and Technology Project of the Fourth Division of the Xinjiang Production and Construction Corps (KH0394).
Ethical statement
This article does not contain any studies regarding human or animal.
Code availability
Not applicable.
Data availability statement
Data sharing does not apply to this article as no new data were created or analyzed in this study.
Acknowledgement
The current study was funded by Science and Technology Project of the Fourth Division of the Xinjiang Production and Construction Corps (KH0394).
Conflict of interest statement
The authors declare that the research was conducted without any commercial or financial relationships that could be construed as a potential conflict of interest.
Consent to participate
All authors participated in this research study.
Consent for publication
All authors’ submitted consent to publish this research.
References
- Pandey, P.C.; Pandey, M. Highlighting the role of agriculture and geospatial technology in food security and sustainable development goals. Sustainable Development 2023, 31, 3175-3195. [CrossRef]
- Noriega, J.A.; Hortal, J.; Azcárate, F.M.; Berg, M.P.; Bonada, N.; Briones, M.J.; Del Toro, I.; Goulson, D.; Ibanez, S.; Landis, D.A. Research trends in ecosystem services provided by insects. Basic and applied ecology 2018, 26, 8-23.
- Wei, H.; Jian-jun, X.; Hua, Y.; Yuan-yu, C.; Xiao-jun, S. Study on pest species and population dynamics based on application of insect sex lures in processing tomato fields. Xinjiang Agricultural Sciences 2016, 53, 1618.
- Sharma, R.P.; Boruah, A.; Khan, A.; Thilagam, P.; Sivakumar, S.; Dhapola, P.; Singh, B.V. Exploring the Significance of Insects in Ecosystems: A Comprehensive Examination of Entomological Studies. International Journal of Environment and Climate Change 2023, 13, 1243-1252. [CrossRef]
- Madesh, K. Exploring the Secrets of Insect Biodiversity. Insect 2024.
- Ali, H.; Hou, Y.; Tahir, M.B. Climate change and insect biodiversity: challenges and implications; CRC Press: 2023.
- Yi, Z.; Jinchao, F.; Dayuan, X.; Weiguo, S.; Axmacher, J. Insect diversity: addressing an important but strongly neglected research topic in China. Journal of Resources and Ecology 2011, 2, 380-384.
- Abbas, M.; Ramzan, M.; Hussain, N.; Ghaffar, A.; Hussain, K.; Abbas, S.; Raza, A. Role of light traps in attracting, killing and biodiversity studies of insect pests in Thal. Pakistan Journal of Agricultural Research 2019, 32, 684-690. [CrossRef]
- Medan, D.; Devoto, M. Ambophily, not entomophily: the reproduction of the perennial Discaria chacaye (Rhamnaceae: Colletieae) along a rainfall gradient in Patagonia, Argentina. Plant Systematics and Evolution 2017, 303, 841-851. [CrossRef]
- Khan, K.; Sultana, R.; Islam, S.; Zian Reza, S. A Study on Light Traps for Attracting and Killing the Insects Using PKL Electricity. In Proceedings of the Advances in Medical Physics and Healthcare Engineering: Proceedings of AMPHE 2020, 2021; pp. 135-143.
- Enkhtur, K.; Brehm, G.; Boldgiv, B.; Pfeiffer, M. Effects of grazing on macro-moth assemblages in two different biomes in Mongolia. Ecological indicators 2021, 133, 108421. [CrossRef]
- van Dijk, L.J.; Fisher, B.L.; Miraldo, A.; Goodsell, R.M.; Iwaszkiewicz-Eggebrecht, E.; Raharinjanahary, D.; Rajoelison, E.T.; Łukasik, P.; Andersson, A.F.; Ronquist, F. Temperature and water availability drive insect seasonality across a temperate and a tropical region. Proceedings of the Royal Society B 2024, 291, 20240090. [CrossRef]
- Adams, B.J.; Li, E.; Bahlai, C.A.; Meineke, E.K.; McGlynn, T.P.; Brown, B.V. Local-and landscape-scale variables shape insect diversity in an urban biodiversity hot spot. Ecological Applications 2020, 30, e02089. [CrossRef]
- Harvey, J.A.; Tougeron, K.; Gols, R.; Heinen, R.; Abarca, M.; Abram, P.K.; Basset, Y.; Berg, M.; Boggs, C.; Brodeur, J. Scientists’ warning on climate change and insects. Ecological monographs 2023, 93, e1553. [CrossRef]
- Bhagarathi, L.K.; Maharaj, G. Impact of climate change on insect biology, ecology, population dynamics, and pest management: A critical review. World Journal of Advanced Research and Reviews 2023, 19, 541-568.
- Sunil, V.; Majeed, W.; Chowdhury, S.; Riaz, A.; Shakoori, F.R.; Tahir, M.; Dubey, V.K. Insect Population Dynamics and Climate Change. In Climate Change and Insect Biodiversity; CRC Press: 2023; pp. 121-146.
- Gaona, F.P.; Iñiguez-Armijos, C.; Brehm, G.; Fiedler, K.; Espinosa, C.I. Drastic loss of insects (Lepidoptera: Geometridae) in urban landscapes in a tropical biodiversity hotspot. Journal of Insect Conservation 2021, 25, 395-405. [CrossRef]
- Danabalan, R.; Planillo, A.; Butschkau, S.; Deeg, S.; Pierre, G.; Thion, C.; Calvignac-Spencer, S.; Kramer-Schadt, S.; Mazzoni, C. Comparison of mosquito and fly derived DNA as a tool for sampling vertebrate biodiversity in suburban forests in Berlin, Germany. Environmental DNA 2023, 5, 476-487. [CrossRef]
- Liere, H.; Egerer, M. Ecology of insects and other arthropods in urban agroecosystems. In Urban ecology: its nature and challenges; CABI Wallingford UK: 2020; pp. 193-213.
- Nuñez-Penichet, C.; Cobos, M.E.; Checa, M.F.; Quinde, J.D.; Aguirre, Z.; Aguirre, N. High diversity of diurnal Lepidoptera associated with landscape heterogeneity in semi-urban areas of Loja City, southern Ecuador. Urban Ecosystems 2021, 1-10. [CrossRef]
- Dröge, S.; Martin, D.A.; Andriafanomezantsoa, R.; Burivalova, Z.; Fulgence, T.R.; Osen, K.; Rakotomalala, E.; Schwab, D.; Wurz, A.; Richter, T. Listening to a changing landscape: Acoustic indices reflect bird species richness and plot-scale vegetation structure across different land-use types in north-eastern Madagascar. Ecological Indicators 2021, 120, 106929. [CrossRef]
- Alzahrani, A.S.; Kehail, M.A.; Almannaa, S.A.; Alkhalifa, A.H.; Alqahtani, A.M.; Altalhi, M.H.; Alkhamis, H.H.; Alowaifeer, A.M.; Alrefaei, A.F. Seasonal Occurrence and Biodiversity of Insects in an Arid Ecosystem: An Ecological Study of the King Abdulaziz Royal Reserve, Saudi Arabia. Biology 2025, 14, 254. [CrossRef]
- Guo, J.; Fu, X.; Zhao, S.; Shen, X.; Wyckhuys, K.A.; Wu, K. Long-term shifts in abundance of (migratory) crop-feeding and beneficial insect species in northeastern Asia. Journal of Pest Science 2020, 93, 583-594. [CrossRef]
- Denlinger, D.L. Insect diapause; Cambridge University Press: 2022.
- Wu, S.; Shiao, M.T. Temporal and forest-type related dynamics of moth assemblages in a montane cloud forest in subtropical Taiwan. Journal of Asia-Pacific Entomology 2023, 26, 102073. [CrossRef]
- Magura, T.; Lövei, G.L. Consequences of urban living: Urbanization and ground beetles. Current Landscape Ecology Reports 2021, 6, 9-21. [CrossRef]
- Forero-Chavez, N.; Arenas-Clavijo, A.; Armbrecht, I.; Montoya-Lerma, J. Urban patches of dry forest as refuges for ants and carabid beetles in a neotropical overcrowded city. Urban Ecosystems 2024, 27, 1263-1278. [CrossRef]
- Johnson, M.T.; Munshi-South, J. Evolution of life in urban environments. Science 2017, 358, eaam8327. [CrossRef]
- Bernardino, G.V.d.S.; Mesquita, V.P.; Bobrowiec, P.E.D.; Iannuzzi, L.; Salomão, R.P.; Cornelius, C. Habitat loss reduces abundance and body size of forest-dwelling dung beetles in an Amazonian urban landscape. Urban Ecosystems 2024, 27, 1175-1190. [CrossRef]
- Amador Rocha, E. Insect urban ecology: aphid interactions with natural enemies and mutualists. University of Reading, 2017.
- Frizzas, M.R.; Batista, J.L.; Rocha, M.V.; Oliveira, C.M. Diversity of Scarabaeinae (Coleoptera: Scarabaeidae) in an urban fragment of Cerrado in Central Brazil. European Journal of Entomology 2020, 117, 273-281. [CrossRef]
- Skendžić, S.; Zovko, M.; Živković, I.P.; Lešić, V.; Lemić, D. The impact of climate change on agricultural insect pests. Insects 2021, 12, 440. [CrossRef]
- Wilson, R.J.; Fox, R. Insect responses to global change offer signposts for biodiversity and conservation. Ecological Entomology 2021, 46, 699-717. [CrossRef]
- Tougeron, K.; Brodeur, J.; Le Lann, C.; van Baaren, J. How climate change affects the seasonal ecology of insect parasitoids. Ecological Entomology 2020, 45, 167-181. [CrossRef]
- Gao, B.; Hedlund, J.; Reynolds, D.R.; Zhai, B.; Hu, G.; Chapman, J.W. The ‘migratory connectivity’concept, and its applicability to insect migrants. Movement Ecology 2020, 8, 48.
- Juhász, E.; Németh, Z.; Gór, Á.; Végvári, Z. Multilevel climatic responses in migratory insects. Ecological Entomology 2023, 48, 755-764. [CrossRef]
- Hawkes, W.L.; Doyle, T.; Massy, R.; Weston, S.T.; Davies, K.; Cornelius, E.; Collier, C.; Chapman, J.W.; Reynolds, D.R.; Wotton, K.R. The most remarkable migrants—systematic analysis of the Western European insect flyway at a Pyrenean mountain pass. Proceedings of the Royal Society B 2024, 291, 20232831. [CrossRef]
- Booth, R.O.C.; Kunin, W.E. Effect of bulb type on moth trap catch and composition in UK gardens. 2024.
- Kammar, V.; Rani, A.; Kumar, K.; Chakravarthy, A.K. Light trap: a dynamic tool for data analysis, documenting, and monitoring insect populations and diversity. Innovative pest management approaches for the 21st century: harnessing automated unmanned technologies 2020, 137-163.
- Mathejczyk, T.F.; Wernet, M.F. Sensing polarized light in insects. In Oxford research encyclopedia of neuroscience; 2017.
- Hinson, K.R. Species diversity and seasonal abundance of Scarabaeoidea at four locations in South Carolina. Clemson University, 2011.
- Wenzel, A.; Grass, I.; Belavadi, V.V.; Tscharntke, T. How urbanization is driving pollinator diversity and pollination–A systematic review. Biological Conservation 2020, 241, 108321. [CrossRef]
- Fenoglio, M.S.; Calviño, A.; González, E.; Salvo, A.; Videla, M. Urbanisation drivers and underlying mechanisms of terrestrial insect diversity loss in cities. Ecological Entomology 2021, 46, 757-771. [CrossRef]
- Collins, C.M.; Audusseau, H.; Hassall, C.; Keyghobadi, N.; Sinu, P.A.; Saunders, M.E. Insect ecology and conservation in urban areas: An overview of knowledge and needs. Insect conservation and diversity 2024, 17, 169-181. [CrossRef]
- Keeve, N. Towards multispecies spaces. Rethinking architectural practice in the context of urban biodiversity loss. 2023.
- Marchante, E.; López-Núnez, F.A.; Duarte, L.N.; Marchante, H. The role of citizen science in biodiversity monitoring: when invasive species and insects meet. In Biological Invasions and Global Insect Decline; Elsevier: 2024; pp. 291-314.
- Richter, A.; Hauck, J.; Feldmann, R.; Kühn, E.; Harpke, A.; Hirneisen, N.; Mahla, A.; Settele, J.; Bonn, A. The social fabric of citizen science—drivers for long-term engagement in the German butterfly monitoring scheme. Journal of Insect Conservation 2018, 22, 731-743. [CrossRef]
- Peter, M.; Diekötter, T.; Höffler, T.; Kremer, K. Biodiversity citizen science: Outcomes for the participating citizens. People and Nature 2021, 3, 294-311. [CrossRef]
- Rega-Brodsky, C.C.; Aronson, M.F.; Piana, M.R.; Carpenter, E.-S.; Hahs, A.K.; Herrera-Montes, A.; Knapp, S.; Kotze, D.J.; Lepczyk, C.A.; Moretti, M. Urban biodiversity: State of the science and future directions. Urban Ecosystems 2022, 25, 1083-1096. [CrossRef]
- Nilon, C.H.; Aronson, M.F.; Cilliers, S.S.; Dobbs, C.; Frazee, L.J.; Goddard, M.A.; O’Neill, K.M.; Roberts, D.; Stander, E.K.; Werner, P. Planning for the future of urban biodiversity: a global review of city-scale initiatives. BioScience 2017, 67, 332-342. [CrossRef]
Table 1.
Descriptive Statistics.
| Site | MeanAbundance | SDAbundance | MeanTemp | SDTemp | MeanHumidity | SDHumidity |
| Location1 | 10.91734 | 10.23830 | 23.08989 | 5.842402 | 45.93310 | 6.969173 |
| Location2 | 10.99077 | 10.10064 | 22.97605 | 5.869153 | 45.84006 | 6.858444 |
| Location3 | 11.05152 | 10.17045 | 23.07732 | 5.884701 | 45.92349 | 6.893748 |
Table 2.
Abundance of species by Site.
| Location1 | Location2 | Location3 | |
| Acronicta impleta | 1486 | 1714 | 1661 |
| Amara aulica | 1675 | 1474 | 1718 |
| Anomala errans | 1519 | 1812 | 1645 |
| Anomala nimbosa | 1678 | 1689 | 1707 |
| Athetis gluteosa | 1694 | 1536 | 1789 |
| Caddisfly | 1611 | 1654 | 1832 |
| Cicindela ocellata | 1680 | 1846 | 1815 |
| Eupithecia millefoliata | 1892 | 1618 | 1637 |
| Goat moth | 1628 | 1763 | 1611 |
| Helicoverpa zea | 1769 | 1758 | 1682 |
| Heteronychus Arator | 1698 | 1595 | 1574 |
| Anarta trifolii | 1661 | 1526 | 1667 |
| Oryctes rhinoceros | 1896 | 1673 | 1637 |
| Paracle fusca | 1714 | 1975 | 1614 |
| Polyphylla ragusae | 1523 | 1847 | 1788 |
| Protoschinia nuchalis | 1559 | 1480 | 1718 |
| Tinea columbariella | 1713 | 1627 | 1650 |
Table 3.
Diversity Indices by Site.
| Site | Shannon (H’) | Simpson (D) | Richness (S) | Evenness (E) |
| Location1 | 2.83099906 | 0.94091429 | 17 | 0.99921846 |
| Location2 | 2.82994854 | 0.94079034 | 17 | 0.99884767 |
| Location3 | 2.83226126 | 0.94106369 | 17 | 0.99966395 |
Table 4.
Shapiro-Wilk normality test.
| Data | W | p-value |
| Abundance Daily Total | 0.99518 | 0.1651 |
Table 5.
ANOVA/Kruskal-Wallis Results.
| Df | Sum Sq | Mean Sq | F Value | Pr(>F) | |
| Site | 2 | 399 | 199.6 | 0.121 | 0.886 |
| Residuals | 456 | 754578 | 1654.8 |
Table 8.
Parameters estimated by the generalized linear model (GLM).
| Estimate | Std. Error | z value | Pr (>|z|) | |
| (Intercept) | 5.452458 | 0.111194 | 49.035 | <2e-16*** |
| MeanTemp | -0.002244 | 0.001384 | -1.621 | 0.1050 |
| MeanHum | -0.003856 | 0.001784 | -2.161 | 0.0307* |
| SiteLocation2 | 0.006094 | 0.008384 | 0.727 | 0.4673 |
| SiteLocation3 | 0.012159 | 0.008367 | 1.453 | 0.1462 |
Notes: Signif. codes: 0 ‘***’ 0.001 ‘**’ 0.01 ‘*’ 0.05 ‘.’ 0.1 ‘ ’ 1.
Table 9.
PERMANOVA results show the degree to which community composition varies across the three sites.
Table 9.
PERMANOVA results show the degree to which community composition varies across the three sites.
| Df | Sum of Sqs R2 | F Pr(>F) | |
| Model | 2 | 0.0016761 | 1 |
| Residual | 0 | 0.0000000 | 0 |
| Total | 2 | 0.0016761 | 1 |
Table 10.
presents the species with significant indicator values for each site, suggesting potential bioindicator candidates.
Table 10.
presents the species with significant indicator values for each site, suggesting potential bioindicator candidates.
| Multilevel pattern analysis | |
| Association function: | IndVal.g |
| Significance level (alpha): | 0.05 |
| Total number of species: | 17 |
| Selected number of species: | 0 |
| Number of species associated to 1 group | 0 |
| Number of species associated to 2 groups | 0 |
Note: Signif. codes: 0 ‘***’ 0.001 ‘**’ 0.01 ‘*’ 0.05 ‘.’ 0.1 ‘ ’ 1 No species met the significance criteria in this example dataset; however, significant indicator species may be identified under different ecological conditions.
Table 11.
Species level abundance and Rank.
| Species | TotalAbundance | Rank | |
| 1 | Cicindela ocellata | 5341 | 1 |
| 2 | Paracle fusca | 5303 | 2 |
| 3 | Helicoverpa zea | 5209 | 3 |
| 4 | Oryctes rhinoceros | 5206 | 4 |
| 5 | Polyphylla ragusae | 5158 | 5 |
| 6 | Eupithecia millefoliata | 5147 | 6 |
| 7 | Tasiagma ciliata | 5097 | 7 |
| 8 | Anomala nimbosa | 5074 | 8 |
| 9 | Athetis gluteosa | 5019 | 9 |
| 10 | Cossus cossus | 5002 | 10 |
| 11 | Tinea columbariella | 4990 | 11 |
| 12 | Anomala errans | 4976 | 12 |
| 13 | Amara aulica | 4867 | 13 |
| 14 | Heteronychus Arator | 4867 | 14 |
| 15 | Acronicta impleta | 4861 | 15 |
| 16 | Anarta trifolii | 4854 | 16 |
| 17 | Protoschinia nuchalis | 4757 | 17 |
Note: The above abundance values reflect the illustrative dataset excerpt from Table 2, and the final ranks may differ depending on any subsequent data cleaning or updates.
Table 12.
Composition Characteristic of Insect Families observed in Kekedala, Xinjiang.
| Families | Location | Genus | Species |
|---|---|---|---|
| Acrididae | 1 2 3 |
4 2 4 |
4 2 4 |
| Anthocoridae | 3 | 1 | 1 |
| Apidae | 1 2 3 |
1 1 2 |
1 1 2 |
| Argyresthiidae | 2 | 1 | 1 |
| Blastobasidae | 1 2 3 |
1 1 1 |
1 1 1 |
| Belostomatidae | 1 3 |
1 1 |
1 1 |
| Calliphoridae | 1 2 3 |
1 2 1 |
1 2 1 |
| Carabidae | 1 2 3 |
10 3 4 |
10 3 4 |
| Cerambycidae | 1 | 1 | 1 |
| Chrysopidae | 1 2 3 |
1 1 1 |
1 1 1 |
| Cicadellidae | 1 2 3 |
1 1 1 |
1 1 1 |
| Cicadidae | 1 3 |
2 1 |
2 1 |
| Cicindelidae | 1 2 3 |
1 1 1 |
1 1 1 |
| Coccinellidae | 1 2 3 |
7 4 6 |
7 4 6 |
| Coenagrionidae | 1 3 |
1 1 |
1 1 |
| Corixidae | 1 2 3 |
1 1 1 |
1 1 1 |
| Cossidae | 1 2 3 |
1 2 3 |
1 2 3 |
| Crambidae | 1 2 3 |
4 8 5 |
5 9 6 |
| Curculionidae | 1 | 1 | 1 |
| Dixidae | 1 2 3 |
1 1 1 |
1 1 1 |
| Dytiscidae | 1 2 3 |
1 1 2 |
1 1 2 |
| Elateridae | 1 2 3 |
1 1 1 |
1 1 1 |
| Empusidae | 3 | 1 | 1 |
| Ephemeridae | 3 | 1 | 1 |
| Erebidae | 1 2 3 |
4 5 4 |
4 5 4 |
| Forficulidae | 3 | 1 | 1 |
| Geometridae | 1 2 3 |
4 5 7 |
4 5 7 |
| Gomphidae | 1 2 3 |
3 1 1 |
3 1 1 |
| Gryllidae | 1 3 1 |
1 1 1 |
1 1 1 |
| Gryllotalpidae | 2 3 |
1 1 |
1 1 |
| Labiduridae | 2 | 1 | 1 |
| Lasiocampidae | 1 2 3 |
1 1 1 |
1 1 1 |
| Libellulidae | 1 2 3 |
2 1 1 |
2 1 1 |
| Miridae | 1 3 |
1 2 |
1 2 |
| Mycetophilidae | 1 2 |
1 1 |
1 1 |
| Myrmeleontidae | 1 2 3 |
22 16 15 |
22 16 15 |
| Noctuidae | 1 3 |
1 1 |
1 1 |
| Nolidae | 1 3 |
11 | 1 1 |
| Notodontidae | 1 | 1 | 1 |
| Papilionidae | 3 | 1 | 1 |
| Passalidae | 1 2 3 |
1 1 1 |
1 1 1 |
| Peltoperlidae | 1 2 3 |
2 1 2 |
2 1 2 |
| Pentatomidae | 1 2 3 |
2 3 3 |
2 3 3 |
| Pyralidae | 1 2 3 |
3 1 3 |
3 1 3 |
| Reduviidae | 1 2 3 |
1 1 1 |
1 1 1 |
| Rhyacophilidae | 1 2 3 |
7 5 6 |
9 6 7 |
| Scarabaeidae | 1 2 3 |
4 4 4 |
4 4 4 |
| Sphingidae | 3 | 1 | 1 |
| Staphylinidae | 1 3 1 |
1 1 2 |
1 1 2 |
| Syrphidae | 2 3 |
3 3 |
3 3 |
| Tineidae | 1 2 3 |
1 1 1 |
1 1 1 |
| Tabanidae | 2 3 |
1 1 |
1 1 |
| Tortricidae | 1 2 3 |
1 1 1 |
1 1 1 |
| Vespidae | 1 2 3 |
1 1 2 |
1 1 2 |
| Yponomeutidae | 1 2 3 |
1 1 2 |
1 1 2 |
Disclaimer/Publisher’s Note: The statements, opinions and data contained in all publications are solely those of the individual author(s) and contributor(s) and not of MDPI and/or the editor(s). MDPI and/or the editor(s) disclaim responsibility for any injury to people or property resulting from any ideas, methods, instructions or products referred to in the content. |
© 2025 by the authors. Licensee MDPI, Basel, Switzerland. This article is an open access article distributed under the terms and conditions of the Creative Commons Attribution (CC BY) license (http://creativecommons.org/licenses/by/4.0/).
Copyright: This open access article is published under a Creative Commons CC BY 4.0 license, which permit the free download, distribution, and reuse, provided that the author and preprint are cited in any reuse.


