
Submitted:
25 March 2025
Posted:
26 March 2025
You are already at the latest version
Abstract
Chemical phosphorus (P) fertilizer is often overused in arid regions with alkaline soils due to soil fixation. Fulvic acid (FA) has been reported to increase soil P availability, thus enhancing crop growth, yield and P use efficiency, but its interaction with P fertilization rates and potential to reduce P fertilizer application remains unclear. In this study, we conducted a 2-year (2019-2020) field experiment in Xinjiang, China, to study the impact of FA addition on cotton (Gossypium hirsutum) growth, yield and P use efficiency under different P fertilization rates (0, 50, 100, and 150 kg P2O5 ha-1). Our results showed that P fertilization significantly enhanced cotton biomass and seed cotton yields by 15-41%, mainly attributed to an increased emergency rate. Accordingly, soil Olsen-P levels increased by 7-22% with P fertilization. Partial nutrient balance, agronomic efficiency and partial factor productivity decreased with increasing P fertilization rates. Across all P fertilization rates, FA addition significantly increased soil Olsen-P levels by 6% in 2019, but not in 2020, and enhanced seed cotton yield through increasing bolls per plant in both years. In 2020, FA addition significantly improved the agronomic efficiency and partial factor productivity of P fertilizer, but did not affect apparent recovery efficiency and partial nutrient balance. No significant interactions between FA addition and P fertilization rates were observed for soil Olsen-P, cotton biomass, P uptake, yield and P use efficiency. These findings suggest that FA can improve cotton productivity by increasing soil P availability, and use efficiency of P fertilizers, irrespective of application rates. Therefore, FA addition is an effective strategy for cotton production in arid regions for optimizing P fertilization rates and improving seed cotton productivity.
Keywords:
fulvic acid
; phosphorus fertilization rate
; cotton
; yield
; phosphorus use efficiency
1. Introduction
Cotton is one of the most important fiber crops in the world and is vital for global textile production, rural livelihoods and economic development [1]. China is the world’s second-largest cotton producer (www.fao.org/faostat), with Xinjiang Uyghur Autonomous Region as the primary cotton-growing region. According to data from the National Bureau of Statistics (data.stats.gov.cn), in 2022, the planting area and the total lint yield of cotton in Xinjiang is about 2.50 million hectares and 5.39 million tons, accounting for 83% of China’s total cotton planting area and 90% of its total yield. Such extensive cultivation and high yields are mainly attributed to the widespread adoption of drip irrigation under plastic film mulching and the intensive uses of chemical fertilizers, both of which have significantly increased water use efficiency and soil nutrient availability, thus promoting cotton yield [2,3]. However, to sustain the high cotton yield, excessive chemical fertilizers are often applied, especially phosphorus (P) due to its generally lower use efficiency [4,5]. Soils in Xinjiang are generally alkaline with high calcium concentrations, and this region is typically arid with limited water availability for most times during the growing season. These factors caused rapid P fixation through adsorption and precipitation of calcium phosphate, in addition to the low diffusion rates in soils [6,7]. According to Tang et al. [5], the amount of applied chemical P fertilizer in most cotton field in Xinjiang was between 150 and 207 kg P2O5 ha−1, which is significantly higher than the requirement of cotton. The overapplication of P fertilizer leads to not only waste of P resources but might also several environmental risks, such as the eutrophication of water bodies.
Humic substances, like humic acid and fulvic acid (FA), have been reported to increase soil P availability [8,9], promote crop P uptake and use efficiency [10], and enhance crop yield [11,12,13]. Several reviews have summarized the underlying mechanisms for these effects [14,15,16,17]. Firstly, humic substances could improve soil P mobility and availability by chelating cations and thus reducing their adsorption on phosphate, changing soil pH, and stimulating microbial activities. Secondly, they could enhance plant nutrient uptake by increasing root growth or rhizosphere microbial activity. Thirdly, some humic substances exhibit auxin-like functions to regulate plant growth and development. Lastly, humic substances can modify plant secondary metabolism to alleviate drought or salt stresses. However, most of these studies have been conducted under controlled environmental conditions in the greenhouse, limiting their applications to field practice [18]. Additionally, some field studies have reported no significant effects or even negative outcomes from humic substance application [19,20,21], suggesting more field experiments are needed to demonstrate their effectiveness across different crops and environmental conditions [22].
In this study, FA was selected as the target humic substance due to its high solubility, making it suitable for the fertigation systems in arid regions. To assess the effects of FA addition in cotton fields and its potential to reduce the application rates of chemical P fertilizers, we conducted a 2-year field experiment and investigated the cotton growth, yield, P uptake and use efficiency as influenced by FA addition under different P fertilization rates. We hypothesized that FA addition would increase soil P availability and enhance cotton P uptake, thus promoting the cotton yield and P fertilizer use efficiency, especially under the lower application rates of P fertilizers.
2. Materials and Methods
2.1. Study Site
This experiment was conducted in a cotton field in Fukang City, Xinjiang, China (88°00′44.30”E, 44°10′21.05”N). This region has a continental arid climate, with an annual mean temperature of 6.6 °C and annual precipitation of 186 mm. The frost-free period averages 174 days per year. Cotton is the primary cash crop in this region, and the soil in the region is classified as Aridisols in Chinese soil taxonomy, equivalent to Calcisol in the FAO classification. Prior to the field trial, the surface soil (top 20 cm) core samples were collected and analyzed. The surface soil had a pH of 8.1 (water to soil = 5:1), electrical conductivity of 226 mS·cm−1, organic matter content of 18.1 g·kg−1, available nitrogen content of 46.23 mg·kg−1, and available phosphorus contents of 13.6 mg·kg−1.
2.2. Experimental Design
This field trial was conducted in a cotton farm with drip fertigation under plastic film. The experiment consisted of 8 treatments in a factorial design of four P fertilization rates (0, 50, 100 and 150 kg P2O5 ha−1, designated as P0, P50, P100, P150) and two FA addition levels (45 kg fulvic acid ha−1, designated as FA, and no fulvic acid addition, serving as control, CK). Treatments were arranged in a randomized complete block design with four replicates, resulting in a total number of 32 plots. The area of each plot was 20 m2 (5m *4m).
Before seeding, the surface soil (approximately 20 cm depth) was tilled and leveled. An 80 cm-width plastic film was laid on the ground with a spacing of 20 cm between rows, and one drip irrigation tape was placed beneath the center of each film. On May 8th, 2019 and April 20th, 2020, cotton was seeded on both sides of the irrigation tape (20 cm away from the tape) under the plastic film. Each plot had a water meter and valve, and a fertilization tank to monitor the amount of fertilizer and irrigation. Fertilization was applied via irrigation, with the total amount of fertilizers evenly distributed across six irrigation events during the growing season (Table 1). Urea (46-0-0, Kuitun Jinjiang Chemical Co., LTD.), monoammonium phosphate (12-61-0, Yunnan Zhongzheng Chemical Industry Co., LTD.), potassium sulfate (0-0-50, Laishuo Technology Co., LTD.), and fulvic acid (powder, Xinjiang Huier Agriculture CO., LTD) were used as fertilizers in this study. Other management practices followed the local agronomic standards.
2.3. Measurement and Calculation
Soil sampling and analysis. Before the experiment, topsoil samples were collected to analyze the physicochemical properties. At the boll opening stage, five soil cores of 0-20 cm depth were randomly collected from each plot and thoroughly mixed to create a composite soil sample. Approximately 50 g of each soil sample was separated and stored at 4 °C to analyze soil alkaline phosphatase activity, and the remaining portion was air-dried and ground to be sieved through a 1 mm screen for chemical analysis. Soil pH (soil-to-water ratio 1:5) was determined using an electrode, and available phosphorus was determined using the Olsen method [23]. Soil alkaline phosphatase activity was analyzed by the method using p-nitrophenyl phosphate (p-NPP) as substrate according to Tabatabai [24].
Cotton biomass and nutrient uptake. At the boll opening stage, 15 cotton plants were randomly sampled from each plot. Each plant was separated into different organs (shoot, leaf, shell, fiber, seed) and dried in an oven at 110 °C for 30 min, followed by drying at 80 °C until a constant weight. The dry matter weight of each organ was measured using an electronic scale with a precision of 0.01 g. Plant samples were then ground and digested with H2SO4-H2O2, and the total phosphorus concentration was determined using the molybdenum-antimony colorimetric method (Bao, 2000). Total plant P uptake was calculated as the sum of P uptake in each organ, determined by multiplying its dry weight by its P concentration.
Yield components. At the harvesting stage, the numbers of plants and bolls were countered manually based on 1-m length film in each plot to calculate the indices of plant per hectare (plant density) and boll per plant. 60 bolls of seed cotton were collected from the bottom, middle and top of plants and weighed to calculate the index of single boll weight. The theoretical yield was calculated as the product of plant density, number of bolls per plant and single boll weight.
Phosphorus use efficiency. The apparent recovery efficiency (RE), partial nutrient balance (PNB), agronomic efficiency (AE) and partial factor productivity (PFP) of P fertilizer were calculated using the following equations:
Where, U and Uo refer to plant total P uptake with and without P fertilization; F refers to the amount of P fertilizer applied; Uh refers to P content of the harvested portion (in this study, the straw was removed post-harvest, so the Uh = U), Y and Yo refers to seed cotton yield with and without P fertilization.
RE=(U-Uo)/F
PNB=Uh/F
AE=(Y-Yo)/F
PFP=Y/F
2.4. Statistical Analysis
A two-way analysis of variance (ANOVA) was conducted to assess the effects of P fertilization rates, FA addition and their interactions on soil and plant variables. The least significant difference (LSD) method was used for multiple comparisons of means where the main or interactive effect was significant. Statistical analysis and plotting were performed using SPSS 16.0 and Sigma plot 12.5 software.
3. Results
3.1. Soil pH, Olsen-P and Alkaline Phosphatase Activity
In 2019, P fertilization significantly increased soil Olsen-P levels. Compared to the P0, soil Olsen-P content was significantly higher under P50, P100 and P150 treatments. Additionally, FA addition significantly increased soil Olsen-P by 6%. However, neither P fertilization nor FA addition affected soil pH and alkaline phosphatase activity. There was no significant interaction between P fertilization and FA addition on soil pH, Olsen-P and alkaline phosphatase activity (Table 2).
In 2020, P fertilization significantly reduced soil pH value. Soil pH decreased progressively with increasing P fertilization rates, with a significantly lower value observed under P150 treatment compared to P0 treatment. Neither P fertilization nor FA addition affected soil Olsen-P and alkaline phosphatase activity. No significant interaction between P fertilization and FA addition was detected for soil pH, Olsen-P and alkaline phosphatase activity (Table 2).
3.2. Cotton Biomass
In 2019, the cotton shoot, leaf and total biomasses increased with the increasing P fertilization rates, with significantly higher values observed under P100 and P150 treatments compared to P0 treatment. FA addition significantly increased cotton leaf and shell biomass. However, no significant interaction between P fertilization and FA addition was detected for different cotton organs and total biomasses (Table 3).
In 2020, the shoot, leaf, fiber, seed and total biomasses were enhanced with increasing P fertilization rates, with a significantly higher value observed in P150 compared to P0 treatment. No significant effects of fulvic acid addition and its interaction with P fertilization were detected for different cotton organs and total biomasses (Table 4).
3.3. Cotton P Concentration
In 2019 and 2020, P fertilization did not affect P concentrations of different cotton organs, except the shell. The lowest shell P concentration was observed under the P50 treatment in 2019 and the P100 treatment in 2020. Fulvic acid addition increased shell P concentration in 2020 (Table 5 and Table 6). A significant interaction between P fertilization and FA addition was detected for leaf P concentration. FA addition significantly reduced leaf P concentration under the P0 and P150 treatments but had no effect under the P50 and P100 treatments (Figure 1).
3.4. Cotton P Uptake
3.5. Yield and Components
In both 2019 and 2020, seed cotton yield increased with increasing P fertilization rates, with the highest value observed under P150 treatment (Table 9 and Table 10). FA addition significantly increased seed cotton yield by 6% in 2019 and 11% in 2020. No significant interaction between P fertilization and FA addition was detected for seed cotton yield.
Analyzing yield components provides insights into the factors driving yield change. These results showed that P fertilization significantly increased plant density at the boll opening stage in both 2019 and 2020, and enhanced boll per plant and single-boll weight in 2020. These were consistent with the higher yield caused by increasing P fertilization rates in 2019 and 2020. FA addition significantly increased boll per plant in 2019 and 2020, consistent with the significantly higher yield caused by fulvic acid addition (Table 8 and Table 9). There was a significant interaction between P fertilization and FA addition for boll per plant in 2020. Without FA addition, boll per plant showed an increasing-then-decreasing trend with increasing P fertilization rates, with the highest value observed under the P50 treatment. In contrast, with FA addition, boll per plant exhibited an initial increase followed by a plateau, with the highest value observed under the P100 treatment (Figure 2).
3.6. Phosphorus Use Efficiency
In 2019 and 2020, partial nutrient balance, agronomic efficiency and partial factor productivity decreased with increasing P fertilization rates (Table 11 and Table 12). FA addition significantly increased agronomic efficiency and partial factor productivity in 2020 (Table 12). No significant interaction between P fertilization and fulvic acid addition was detected for apparent recovery efficiency, partial nutrient balance, agronomic efficiency and partial factor productivity.
4. Discussion
Soil Olsen-P is a reliable indicator of soil available phosphorus that could be absorbed by plants. In this study, P fertilization significantly increased soil Olsen-P, which is consistent with previous studies [25,26]. The increased Olsen-P might be caused by added P to the soil through fertilization. Additionally, soil pH decreased with increasing application of monoammonium phosphate (acidic) in this study, suggesting soil acidification caused by fertilization might be the other mechanism promoting soil P availability [7].
FA have been widely reported could increase soil P availability through mechanisms like acidification, chelating cations, or increasing microbial activity [9,10,27,28,29]. In this study, there was a significant increase in soil Olsen-P caused by FA addition in 2019. Concurrently, there was a slight decrease in soil pH and increase in alkaline phosphatase activity under FA addition treatment, although they were not significant. The changes in soil Olsen-P, pH and alkaline phosphatase activity suggest that FA addition might enhance soil P availability by promoting acidification and increasing soil microbial activity.
Lots of studies have reported that FA could stimulate plant root growth and rhizosphere microbial activity, increase plant nutrient uptake and promote plant growth [9,15,16,30,31]. However, in this study, we did not find a significant effect of FA on cotton P uptake and growth, except for increased leaf and shell biomass in 2019. It seemed much easier to observe the effects of FA acid addition in the laboratory or greenhouse experiments than in the field experiment because the impact factors are much more complicated in the field [18]. The dosage effect might influence the response of plant growth to FA addition The appropriate amount of FA could stimulate seed germination, root growth and nutrient uptake, but lower or higher amounts of FA have no positive effect or even negative effects [30,31]. In this study, the amount of FA was applied under the suggestion of the product and might not be the best amount to enhance cotton nutrient uptake and growth, and field trials testing the effects of FA amounts should be conducted in the future.
In this study, P fertilization significantly promoted seed cotton yield, which was consistent with previous studies [25,32,33]. The increasing harvest plant density, boll per plant, or single boll weight might explain the higher seed cotton yield under P fertilization treatment (Table 9 and Table 10). P is a crucial nutrient for seedling emergence rate, because at that stage, plants grow fast and cell division happens frequently, which needs much P for cell membrane and energy transfer system [34]. Additionally, P has the functions of stimulating crop development and enhancing carbohydrate transportation from leaf to bolls [35], which would result in more bolls per plant and higher single-boll weight.
The seed cotton yield and boll per plant were significantly higher under FA addition treatment (Table 9 and Table 10), suggesting that FA addition might promote seed cotton yield through increasing boll per plant in this study. It is common in arid regions that extreme drought and heat cause the shedding of cotton bolls during the flowering-boll stage and significantly reduce cotton yield [36]. FA has the function of increasing plant resistance to drought and other environmental stresses [16,17,37], which might reduce boll shedding and result in more boll per plant and higher seed cotton yield.
In this study, partial nutrient balance, agronomic efficiency and partial factor productivity decreased with the increasing P fertilization rates, which was consistent with most previous studies [38,39,40,41] and could be explained by the law of diminishing returns to fertilizer [42]. FA addition significantly increased agronomic efficiency and partial factor productivity in this study, but not apparent recovery efficiency and plant nutrient balance. These indicate that the main mechanism of FA addition on P fertilizer use efficiency was to promote cotton yield compared with enhancing plant P uptake.
5. Conclusions
Our study showed that the soil P availability, cotton biomass, uptake and yield showed an increasing trend with the increase of P fertilization rates. FA addition significantly increased seed cotton yield through increasing bolls per plant, thus promoting agronomic efficiency and partial factor productivity. Therefore, FA could be applied to enhance cotton yield and reduce the amount of applied P fertilizer in arid regions. Considering the seed cotton yield and partial nutrient balance (P), the P fertilization rate was recommended to be around 100 kg P2O5 ha−1 to get a higher seed cotton yield and keep the balance of P in this field.
Author Contributions
Conceptualization, K.Z., B.C. and J.S; methodology, C.M. and F.Y.; software, C.M. and F.Y..; validation, C.M. and F.Y. and K.Z.; formal analysis, K.Z.; investigation, C.M. and F.Y.; resources, K.Z.; data curation, C.M. and K.Z.; writing—original draft preparation, K.Z.; writing—review and editing, K.Z. and X.G; visualization, K.Z.; supervision, J.S.; project administration, K.Z.; funding acquisition, K.Z. All authors have read and agreed to the published version of the manuscript.
Funding
This research was funded by the Key Research and Development Project of Xinjiang Uygur Autonomous Region (Grant No. 2022B02020-2), the Science and Technology Major Project of Xinjiang Uygur Autonomous Region (Grant No. 2022A02003-2) and National Natural Science Foundation of China (Grant No. 41761067).
Data Availability Statement
The original contributions presented in the study are included in the article; further inquiries can be directed to the corresponding or first author.
Conflicts of Interest
The authors declare no conflict of interest.
References
- Khan, M.A.; Wahid, A.; Ahmad, M.; Tahir, M.T.; Ahmed, M.; Ahmad, S.; Hasanuzzaman, M. World cotton production and consumption: An overview. In Cotton production and uses: Agronomy, crop protection, and postharvest technologies, Shakeel, A., Mirza, H., Eds.; Springer Nature Singapore Pte Ltd.: Singapore, 2020; pp. 1-7.
- Bai, Y.; Mao, S.; Tian, L.; Li, L.; Dong, H. Advances and prospects of high-yielding and simplified cotton cultivation technology in Xinjiang cotton-growing area. Sci. Agric. Sin. 2017, 50, 38-50. [CrossRef]
- Feng, L.; Wan, S.; Zhang, Y.; Dong, H. Xinjiang cotton: Achieving super-high yield through efficient utilization of light, heat, water, and fertilizer by three generations of cultivation technology systems. Field Crops Res. 2024, 312, 109401. [CrossRef]
- Chen, J.; Guan, Y.; Wang, J.; Chu, G. The long-term evolution of phosphate fertilizer application amount, efficiency and types on main crops in Xinjiang. Xinjiang Agric. Sci. 2016, 53, 1858-1866.
- Tang, M.; Shen, C.; Zhang, Y.; Yan, C.; Fu, G.; Xu, Y.; Tang, G.; Geng, Q. Investigation of fertilizer use efficiency for cotton in Xinjiang. Soil Fertil. Sci. China 2022, 4, 161-168. [CrossRef]
- Muindi, E.D.M. Understanding soil phosphorus. Int. J. Plant Soil Sci. 2019, 31, 1-18. [CrossRef]
- Penn, C.J.; Camberato, J.J. A critical review on soil chemical processes that control how soil pH affects phosphorus availability to plants. Agriculture 2019, 9, 120. [CrossRef]
- Merwad, A.R.M.A. Effect of humic and fulvic substances and Moringa leaf extract on Sudan grass plants grown under saline conditions. Can. J. Soil Sci. 2017, 97, 703-716. [CrossRef]
- Shi, X.; Gu, D.; Yang, H.; Li, Y.; Jiang, Y.; Zhan, N.; Cui, X. Effect of exogenous organic matter on phosphorus forms in middle-high fertility cinnamon soil. Plants-Basel 2024, 13, 1313. [CrossRef]
- Liu, X.; Yang, J.; Tao, J.; Yao, R. Integrated application of inorganic fertilizer with fulvic acid for improving soil nutrient supply and nutrient use efficiency of winter wheat in a salt-affected soil. Appl. Soil Ecol. 2022, 170, 104255. [CrossRef]
- Alsudays, I.M.; Alshammary, F.H.; Alabdallah, N.M.; Alatawi, A.; Alotaibi, M.M.; Alwutayd, K.M.; Alharbi, M.M.; Alghanem, S.M.S.; Alzuaibr, F.M.; Gharib, H.S.; Awad-Allah, M.M.A. Applications of humic and fulvic acid under saline soil conditions to improve growth and yield in barley. BMC Plant Biol. 2024, 24, 191. [CrossRef]
- Bustos, I.; Schoebitz, M.; Zagal, E.; Muñoz, C. Evaluation of liquid phosphorus fertilizers and fulvic acids in a potato crop in an Andisol type soil. Int. J. Agric. Nat. Resour. 2022, 49, 123-129. [CrossRef]
- Hareem, M.; Danish, S.; Al Obaid, S.; Ansari, M.J.; Datta, R. Mitigation of drought stress in chili plants (Capsicum annuum L.) using mango fruit waste biochar, fulvic acid and cobalt. Sci. Rep. 2024, 14, 14270. [CrossRef]
- Ampong, K.; Thilakaranthna, M.S.; Gorim, L.Y. Understanding the role of humic acids on crop performance and soil health. Front. Agron. 2022, 4, 848621. [CrossRef]
- Bezuglova, O.; Klimenko, A. Application of humic substances in agricultural industry. Agronomy-Basel 2022, 12, 584. [CrossRef]
- Canellas, L.P.; Olivares, F.L.; Aguiar, N.O.; Jones, D.L.; Nebbioso, A.; Mazzei, P.; Piccolo, A. Humic and fulvic acids as biostimulants in horticulture. Sci. Hortic. 2015, 196, 15-27. [CrossRef]
- Rathor, P.; Gorim, L.Y.; Thilakarathna, M.S. Plant physiological and molecular responses triggered by humic based biostimulants-A way forward to sustainable agriculture. Plant Soil 2023, 492, 31-60. [CrossRef]
- Olk, D.C.; Dinnes, D.L.; Scoresby, J.R.; Callaway, C.R.; Darlington, J.W. Humic products in agriculture: potential benefits and research challenges-a review. J. Soils Sed. 2018, 18, 2881-2891. [CrossRef]
- Jordan, D.L.; Hare, A.T.; Wells, R. Peanut response to a commercial blend of nitrogen, phosphorus, potassium, and fulvic acid. Crop Forage Turf. Man. 2022, 8, e20180. [CrossRef]
- Kumar Sootahar, M.; Zeng, X.; Su, S.; Wang, Y.; Bai, L.; Zhang, Y.; Li, T.; Zhang, X. The effect of fulvic acids derived from different materials on changing properties of albic black soil in the Northeast Plain of China. Molecules 2019, 24, 1535. [CrossRef]
- Santos, M.D.; Cavalcanti, M.T.; Pessoa, L.N.; Silva, Z.G.D.; da Silva, A.M.; Souza, T.; Henschel, J.M.; Pereira, E.M.; Neto, M.A.D.; Diniz, B.L.M.T. Exploring the impact of humic biostimulants on cassava yield and nutrition in Northeast Brazil. Sustainability 2024, 16, 4088. [CrossRef]
- Rose, M.T.; Patti, A.F.; Little, K.R.; Brown, A.L.; Jackson, W.R.; Cavagnaro, T.R. A meta-analysis and review of plant-growth response to humic substances: Practical implications for agriculture. Adv. Agron. 2014, 124, 37-89. [CrossRef]
- Bao, S. Soil agro-chemistrical analysis 3rd ed.; China Agriculture Press: Beijing, China, 2000.
- Tabatabai, M. Soil enzymes. In Methods of soil analysis: Part 2 Microbiological and biochemical properties, Weaver, R.W., Angle, S., Bottomley, P., Bezdicek, D., Smith, S., Tabatabai, A., Wollum, A., Eds.; Soil Science Society of America, Inc. : 677 South Segoe Road, Madison, Wisconsin 53711 USA, 1994; Volume 5, pp. 775-833.
- Chen, B.; Sheng, J.; Jiang, P.; Liu, Y. Effect of applying different forms and rates of phosphoric fertilizer on phosphorus efficiency and cotton yield. Cotton Sci. 2010, 22, 49-56.
- Liu, T.; Dong, X.; Guo, K.; Wang, J.; Liu, X.; Sun, H. Effects of fertilizer types and application levels on phosphorus availability of saline soils and crops: A meta-analysis. Land Degrad. Dev. 2024, 35, 4068-4080. [CrossRef]
- Delgado, A.; Madrid, A.; Kassem, S.; Andreu, L.; del Campillo, M.D. Phosphorus fertilizer recovery from calcareous soils amended with humic and fulvic acids. Plant Soil 2002, 245, 277-286. [CrossRef]
- Shen, Y.; Ma, Z.; Chen, H.; Lin, H.; Li, G.; Li, M.; Tan, D.; Gao, W.; Jiao, S.; Liu, P.; et al. Effects of macromolecular organic acids on reducing inorganic phosphorus fixation in soil. Heliyon 2023, 9, e14892. [CrossRef]
- Yuan, Y.; Tang, C.; Jin, Y.; Cheng, K.; Yang, F. Contribution of exogenous humic substances to phosphorus availability in soil-plant ecosystem: A review. Crit. Rev. Environ. Sci. Technol. 2023, 53, 1085-1102. [CrossRef]
- Rauthan, B.S.; Schnitzer, M. Effects of a soil fulvic-acid on the growth and nutrient content of cucumber (Cucumis sativus) plants. Plant Soil 1981, 63, 491-495. [CrossRef]
- Zhang, P.; Zhang, H.; Wu, G.; Chen, X.; Gruda, N.; Li, X.; Dong, J.; Duan, Z. Dose-dependent application of straw-derived fulvic acid on yield and quality of tomato plants grown in a greenhouse. Front. Plant Sci. 2021, 12, 736613. [CrossRef]
- Dorahy, C.G.; Rochester, I.J.; Blair, G.J. Response of field-grown cotton ( Gossypium hirsutum L.) to phosphorus fertilisation on alkaline soils in eastern Australia. Aust. J. Soil Res. 2004, 42, 737-746. [CrossRef]
- Iqbal, B.; Kong, F.; Ullah, I.; Ali, S.; Li, H.; Wang, J.; Khattak, W.A.; Zhou, Z. Phosphorus application improves the cotton yield by enhancing reproductive organ biomass and nutrient accumulation in two cotton cultivars with different phosphorus sensitivity. Agronomy 2020, 10, 153. [CrossRef]
- Malhotra, H.; Vandana; Sharma, S.; Pandey, R. Phosphorus nutrition: plant growth in response to deficiency and excess. In Plant nutrients and abiotic stress tolerance, Mirza, H., Masayuki, F., Hirosuke, O., Kamrun, N., Barbara, H.-N., Eds.; Springer Nature Singapore Pte Ltd.: Singapore, 2018; pp. 171-190.
- Khan, F.; Siddique, A.B.; Shabala, S.; Zhou, M.; Zhao, C. Phosphorus plays key roles in regulating plants’ physiological responses to abiotic stresses. Plants 2023, 12, 2861. [CrossRef]
- Rehman, A.; Farooq, M. Morphology, physiology and ecology of cotton. Cotton Prod. 2019, 23-46. [CrossRef]
- Anjum, S.A.; Wang, L.; Farooq, M.; Xue, L.; Ali, S. Fulvic acid application improves the maize performance under well-watered and drought conditions. J. Agron. Crop Sci. 2011, 197, 409-417. [CrossRef]
- Mai, W.; Xue, X.; Feng, G.; Yang, R.; Tian, C. Can optimization of phosphorus input lead to high productivity and high phosphorus use efficiency of cotton through maximization of root/mycorrhizal efficiency in phosphorus acquisition? Field Crops Res. 2018, 216, 100-108. [CrossRef]
- Wang, H.; Wu, L.; Wang, X.; Zhang, S.; Cheng, M.; Feng, H.; Fan, J.; Zhang, F.; Xiang, Y. Optimization of water and fertilizer management improves yield, water, nitrogen, phosphorus and potassium uptake and use efficiency of cotton under drip fertigation. Agric. Water Manage. 2021, 245, 106662. [CrossRef]
- Yuan, F.; Ma, D.; Zhao, K.; Zhang, K. Effect of phosphorus fertilization rate on cotton field phosphorus condition, yield and phosphorus balance in Xinjiang. Southwest China J. Agric. Sci. 2021, 34, 1033-1041. [CrossRef]
- Zhang, Y.; Yao, Y.; Hu, W.; Gao, Y.; Tang, M. Effects of phosphate fertilizer application on P accumulation, distribution, utilization and yield of cotton. Xinjiang Agric. Sci. 2020, 57, 2004-2011.
- de Wit, C.d. Resource use efficiency in agriculture. Agric. Syst. 1992, 40, 125-151. [CrossRef]
Figure 1.
Leaf P concentration under different P fertilization rates and FA addition treatments, 2019.
Figure 1.
Leaf P concentration under different P fertilization rates and FA addition treatments, 2019.
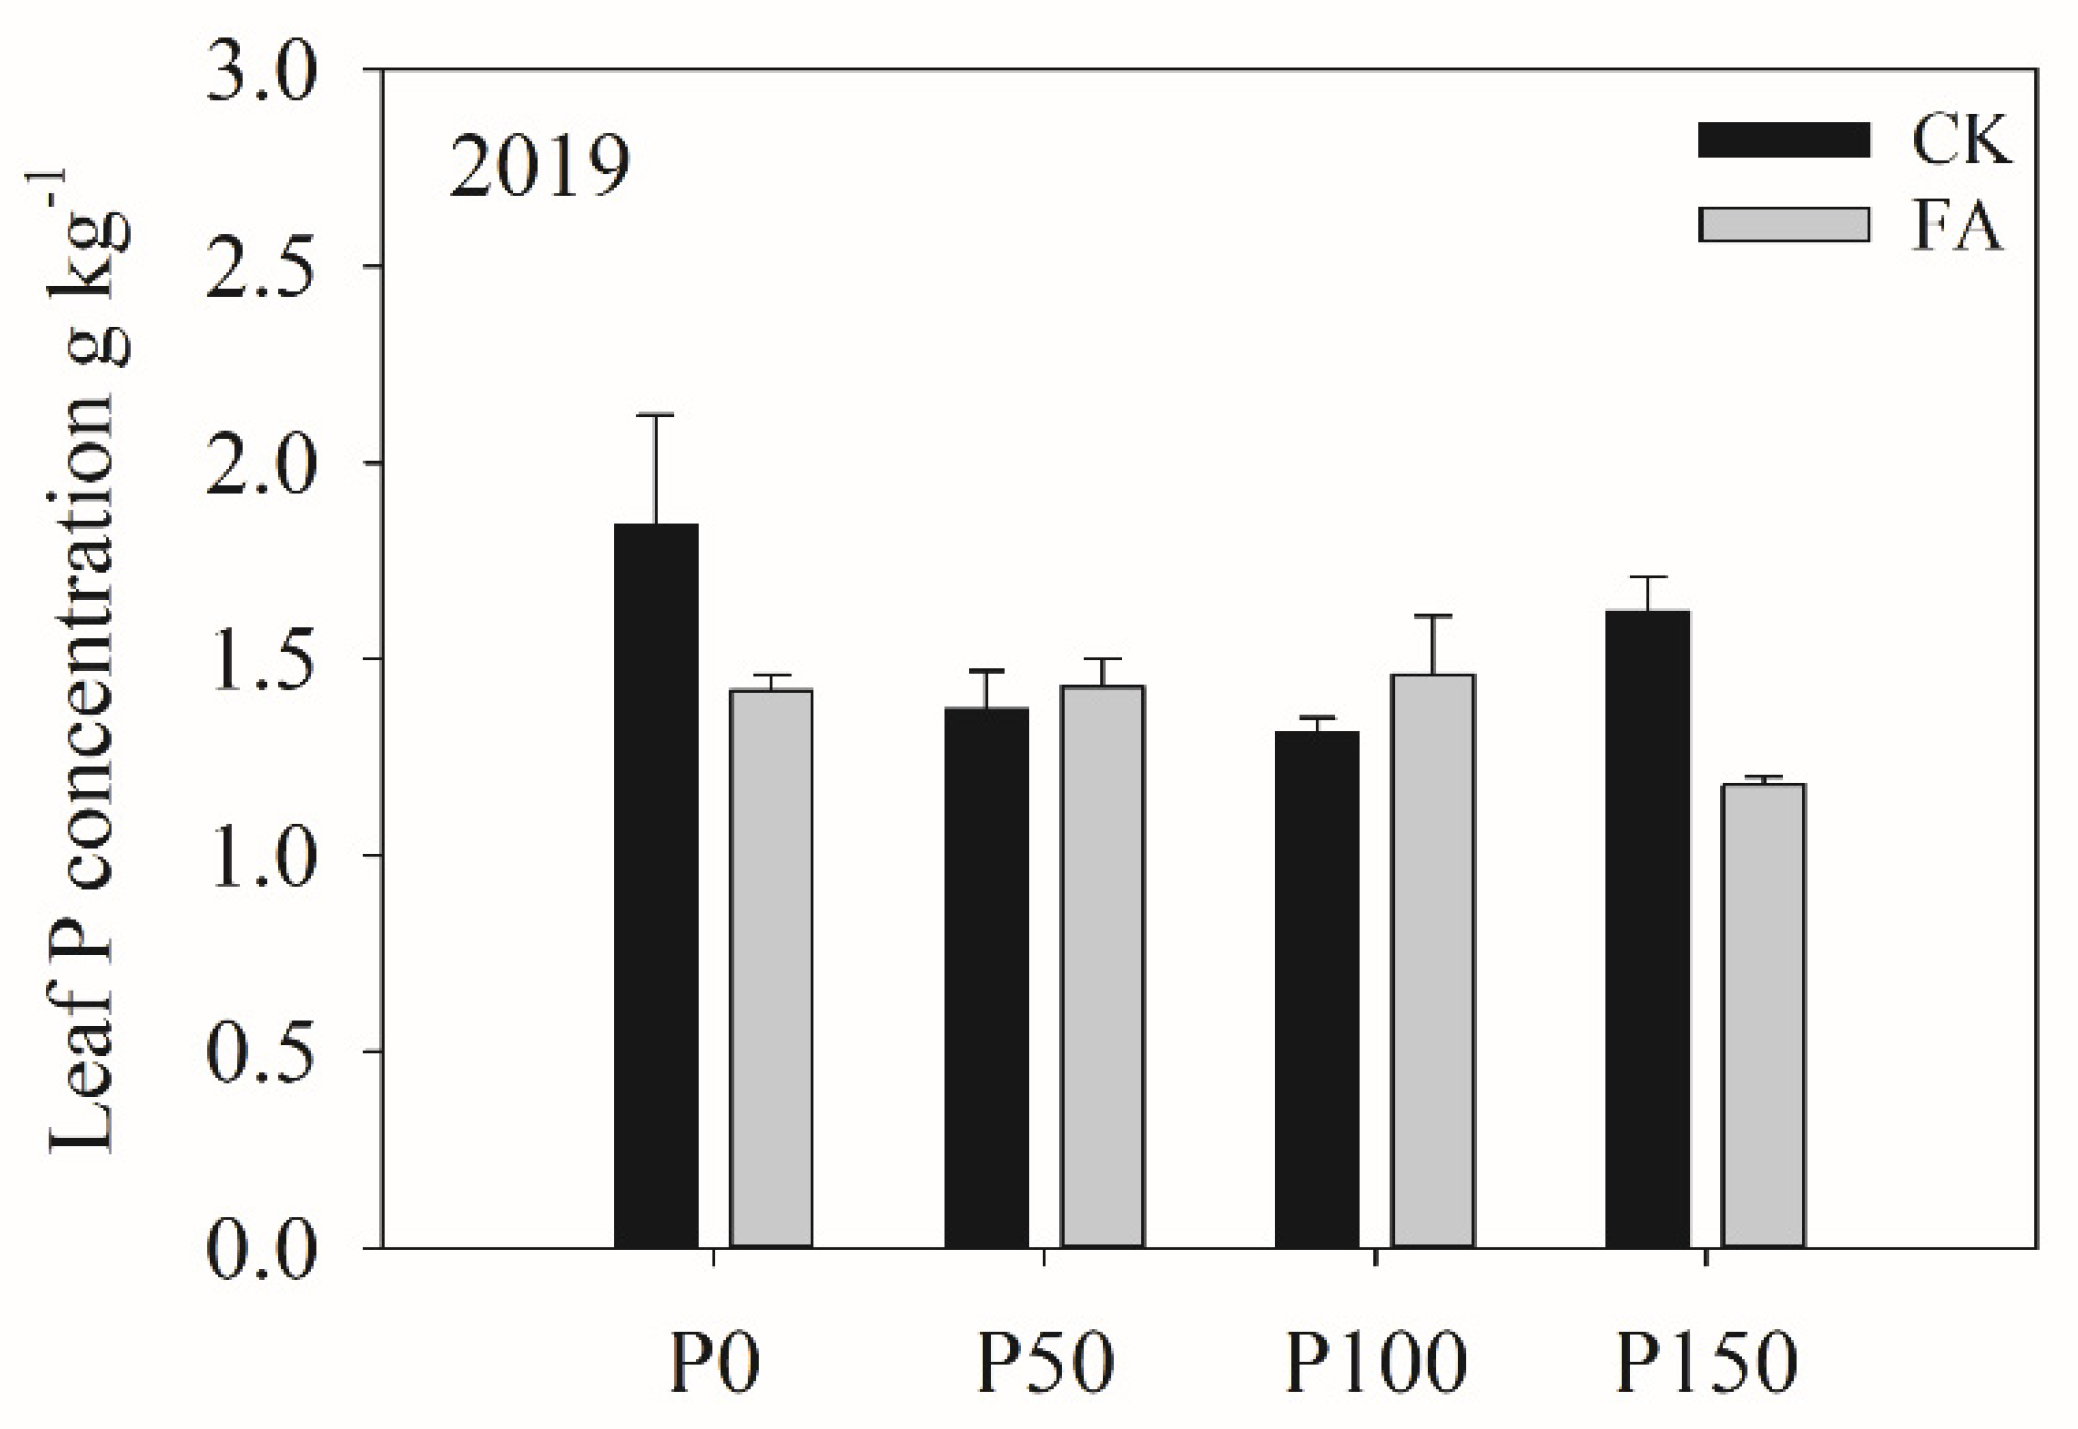
Figure 2.
Bolls per plant under different P fertilization rates and FA addition treatments, 2020.
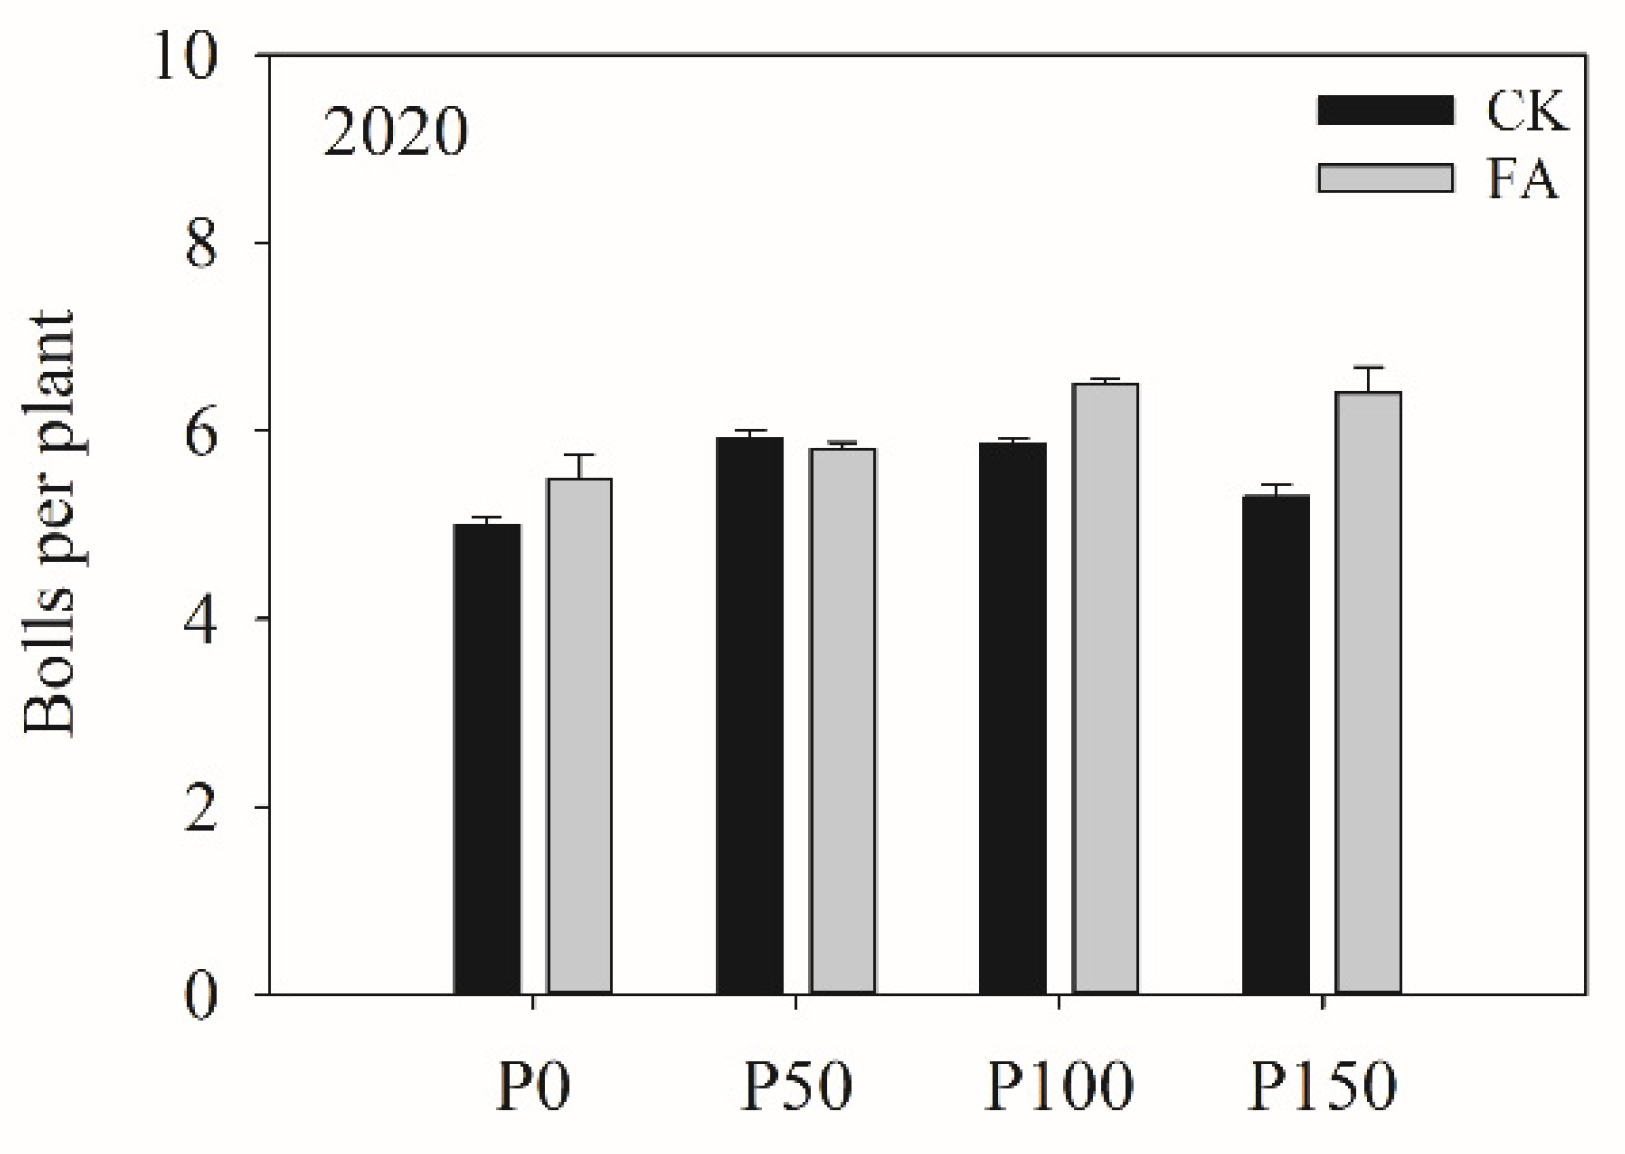

Table 1.
Irrigation scheme in 2019 and 2020.
| Time (month-day-year) |
Irrigation amount m3 ha−1 |
Time (month-day-year) |
Irrigation amount m3 ha−1 |
|---|---|---|---|
| 05-10-2019 | 656 | 04-28-2020 | 623 |
| 07-05-2019 | 578 | 06-14-2020 | 600 |
| 07-16-2019 | 237 | 06-26-2020 | 293 |
| 07-25-2019 | 320 | 07-15-2020 | 387 |
| 08-05-2019 | 554 | 08-02-2020 | 453 |
| 08-15-2019 | 492 | 08-17-2020 | 476 |
| 08-24-2019 | 359 | 08-26-2020 | 452 |
| Total irrigation amount in 2019 | 3196 | Total irrigation amount in 2020 | 3284 |
Table 2.
Soil pH, Olsen-P and alkaline phosphatase activity under different P fertilization rates and FA addition treatments.
Table 2.
Soil pH, Olsen-P and alkaline phosphatase activity under different P fertilization rates and FA addition treatments.
| 2019 | 2020 | |||||
|---|---|---|---|---|---|---|
| pH | Olsen-P | Alkaline phosphatase activity | pH | Olsen-P | Alkaline phosphatase activity | |
| mg kg−1 | mg kg−1 h−1 | mg kg−1 | mg kg−1 h−1 | |||
| P fertilization rates | ||||||
| P0 | 8.73±0.03 | 17.13±0.56c | 159.04±7.51 | 8.53±0.02a | 22.51±1.04 | 249.36±8.45 |
| P50 | 8.70±0.03 | 20.90±0.65a | 135.44±11.57 | 8.52±0.03a | 25.66±1.37 | 221.42±7.86 |
| P100 | 8.77±0.04 | 19.31±0.51b | 129.71±8.12 | 8.42±0.05ab | 24.26±0.50 | 218.05±11.99 |
| P150 | 8.68±0.04 | 20.28±0.35ab | 141.20±5.51 | 8.37±0.05b | 24.47±0.52 | 222.47±7.67 |
| FA addition | ||||||
| CK | 8.74±0.03 | 18.82±0.45b | 139.19±6.48 | 8.48±0.03 | 23.81±0.51 | 225.11±8.33 |
| FA | 8.69±0.02 | 19.98±0.53a | 142.47±6.33 | 8.44±0.04 | 24.94±0.90 | 231.52±3.55 |
| ANOVA (P values) | ||||||
| P fertilization rate | 0.403 | <0.001 | 0.188 | 0.014 | 0.280 | 0.156 |
| FA addition | 0.233 | 0.031 | 0.658 | 0.282 | 0.349 | 0.731 |
| P* FA | 0.842 | 0.750 | 0.906 | 0.218 | 0.980 | 0.702 |
Note: P0, P50, P100, P150 mean P fertilization rates at 0, 50, 100 and 150 kg P2O5 ha−1, FA means fulvic acid addition of 45 kg fulvic acid ha−1, CK means no fulvic acid addition as control. Within P fertilization rates or FA addition treatment, means followed by the same letter are not significantly different at P < 0.05 level. Same as follows.
Table 3.
Cotton biomass under different P fertilization rates and FA addition treatments at boll opening stage, 2019.
Table 3.
Cotton biomass under different P fertilization rates and FA addition treatments at boll opening stage, 2019.
| Shoot | Leaf | Shell | Fiber | Seed | Total | |
|---|---|---|---|---|---|---|
| kg ha−1 | kg ha−1 | kg ha−1 | kg ha−1 | kg ha−1 | kg ha−1 | |
| P fertilization rates | ||||||
| P0 | 1981±104b | 1737±165b | 1706±141 | 1694±112 | 2541±168 | 9660±631b |
| P50 | 2316±255ab | 2047±198ab | 2191±294 | 1831±161 | 2747±241 | 11132±1099ab |
| P100 | 2713±228a | 2245±209a | 2505±272 | 2112±170 | 3168±255 | 12743±1006a |
| P150 | 2765±167a | 2408±129a | 2513±204 | 2129±101 | 3084±155 | 12900±537a |
| FA addition | ||||||
| CK | 2351±158 | 1876±118b | 1932±152b | 1926±130 | 2890±195 | 10975±712 |
| FA | 2537±155 | 2343±129a | 2525±177a | 1957±76 | 2880±108 | 12242±592 |
| ANOVA (P values) | ||||||
| P fertilization rate | 0.042 | 0.044 | 0.056 | 0.117 | 0.168 | 0.048 |
| FA addition | 0.377 | 0.009 | 0.014 | 0.837 | 0.964 | 0.159 |
| P* FA | 0.839 | 0.786 | 0.984 | 0.653 | 0.517 | 0.883 |
Table 4.
Cotton biomass under different P fertilization rates and FA addition treatments at boll opening stage, 2020.
Table 4.
Cotton biomass under different P fertilization rates and FA addition treatments at boll opening stage, 2020.
| Shoot | Leaf | Shell | Fiber | Seed | Total | |
|---|---|---|---|---|---|---|
| kg ha−1 | kg ha−1 | kg ha−1 | kg ha−1 | kg ha−1 | kg ha−1 | |
| P fertilization rates | ||||||
| P0 | 1955±188c | 1079±169b | 2144±272 | 1640±102b | 2460±142b | 9277±771c |
| P50 | 2571±152b | 1179±60b | 2449±106 | 1970±89ab | 2856±111ab | 11026±211b |
| P100 | 2228±130bc | 1324±65b | 2554±108 | 1987±134a | 2980±201a | 11072±492b |
| P150 | 3136±127a | 1739±86a | 2700±181 | 2198±123a | 3297±185a | 13070±576a |
| FA addition | ||||||
| CK | 2431±180 | 1333±93 | 2435±141 | 1927±87 | 2891±127 | 11017±515 |
| FA | 2514±121 | 1328±100 | 2488±126 | 1970±99 | 2906±144 | 11206±507 |
| ANOVA (P values) | ||||||
| P fertilization rate | <0.001 | 0.001 | 0.228 | 0.019 | 0.011 | 0.002 |
| FA addition | 0.580 | 0.963 | 0.782 | 0.713 | 0.927 | 0.751 |
| P* FA | 0.231 | 0.684 | 0.747 | 0.390 | 0.228 | 0.948 |
Table 5.
Cotton P concentration under different P fertilization rates and FA addition treatments, 2019.
Table 5.
Cotton P concentration under different P fertilization rates and FA addition treatments, 2019.
| Shoot | Leaf | Shell | Fiber | Seed | |
|---|---|---|---|---|---|
| g kg−1 | g kg−1 | g kg−1 | g kg−1 | g kg−1 | |
| P fertilization rates | |||||
| P0 | 0.96±0.06 | 1.63±0.15 | 1.77±0.12a | 1.29±0.11 | 8.99±0.53 |
| P50 | 0.93±0.07 | 1.40±0.06 | 1.19±0.12b | 1.16±0.07 | 9.32±0.23 |
| P100 | 0.93±0.04 | 1.38±0.08 | 1.45±0.11ab | 0.97±0.04 | 9.68±0.25 |
| P150 | 0.96±0.04 | 1.40±0.09 | 1.44±0.18ab | 1.06±0.07 | 9.83±0.53 |
| FA addition | |||||
| CK | 0.95±0.03 | 1.53±0.09 | 1.54±0.11 | 1.13±0.05 | 9.41±0.30 |
| FA | 0.95±0.05 | 1.37±0.05 | 1.39±0.10 | 1.12±0.07 | 9.50±0.28 |
| ANOVA (P values) | |||||
| P fertilization rates | 0.973 | 0.192 | 0.028 | 0.074 | 0.464 |
| FA addition | 1.000 | 0.081 | 0.262 | 0.912 | 0.821 |
| P* FA | 0.918 | 0.047 | 0.131 | 0.972 | 0.173 |
Table 6.
Cotton P concentration under different P fertilization rates and FA addition treatments, 2020.
Table 6.
Cotton P concentration under different P fertilization rates and FA addition treatments, 2020.
| Shoot | Leaf | Shell | Fiber | Seed | |
|---|---|---|---|---|---|
| g kg−1 | g kg−1 | g kg−1 | g kg−1 | g kg−1 | |
| P fertilization rates | |||||
| P0 | 1.72±0.10 | 2.24±0.11 | 2.66±0.15ab | 1.27±0.08 | 10.61±0.45 |
| P50 | 1.61±0.12 | 2.03±0.13 | 2.88±0.25a | 1.14±0.07 | 10.90±0.35 |
| P100 | 1.54±0.08 | 2.30±0.09 | 2.16±0.16b | 1.22±0.06 | 11.76±0.43 |
| P150 | 1.48±0.14 | 2.23±0.19 | 2.81±0.19a | 1.10±0.07 | 10.37±0.61 |
| FA addition | |||||
| CK | 1.67±0.07 | 2.21±0.10 | 2.44±0.14b | 1.17±0.07 | 10.90±0.25 |
| FA | 1.51±0.08 | 2.20±0.10 | 2.82±0.14a | 1.20±0.03 | 10.92±0.42 |
| ANOVA (P values) | |||||
| P fertilization rates | 0.444 | 0.579 | 0.040 | 0.337 | 0.224 |
| FA addition | 0.147 | 0.948 | 0.048 | 0.659 | 0.959 |
| P* FA | 0.163 | 0.885 | 0.477 | 0.359 | 0.517 |
Table 7.
Cotton P uptakes under different P fertilization rates and FA addition treatments, 2019.
| Shoot | Leaf | Shell | Fiber | Seed | Total | |
|---|---|---|---|---|---|---|
| kg ha−1 | kg ha−1 | kg ha−1 | kg ha−1 | kg ha−1 | kg ha−1 | |
| P fertilization rates | ||||||
| P0 | 1.91±0.17 | 2.79±0.31 | 3.09±0.41 | 2.22±0.29 | 22.63±1.64b | 32.63±2.42 |
| P50 | 2.23±0.41 | 2.88±0.33 | 2.44±0.18 | 2.08±0.15 | 25.40±1.93ab | 35.02±2.66 |
| P100 | 2.52±0.22 | 3.17±0.46 | 3.56±0.39 | 2.04±0.17 | 30.98±3.02a | 42.26±3.90 |
| P150 | 2.66±0.20 | 3.31±0.16 | 3.46±0.30 | 2.28±0.22 | 29.90±1.32a | 41.62±1.18 |
| FA addition | ||||||
| CK | 2.20±0.13 | 2.85±0.21 | 2.92±0.29 | 2.14±0.15 | 27.09±1.97 | 37.20±2.47 |
| FA | 2.46±0.24 | 3.23±0.25 | 3.35±0.20 | 2.17±0.15 | 27.37±1.29 | 38.56±1.73 |
| ANOVA (P values) | ||||||
| P fertilization rates | 0.266 | 0.663 | 0.087 | 0.841 | 0.047 | 0.066 |
| FA addition | 0.372 | 0.271 | 0.201 | 0.913 | 0.901 | 0.642 |
| P* FA | 0.952 | 0.579 | 0.288 | 0.647 | 0.954 | 0.944 |
Table 8.
Cotton P uptakes under different P fertilization rates and FA addition treatments, 2020.
| Shoot | Leaf | Shell | Fiber | Seed | Total | |
|---|---|---|---|---|---|---|
| kg ha−1 | kg ha−1 | kg ha−1 | kg ha−1 | kg ha−1 | kg ha−1 | |
| P fertilization rates | ||||||
| P0 | 3.33±0.32b | 2.40±0.36b | 5.72±0.80a | 2.09±0.18 | 26.08±1.80b | 39.62±2.77b |
| P50 | 4.05±0.20ab | 2.42±0.23b | 7.06±0.72ab | 2.25±0.17 | 30.97±0.94ab | 46.74±1.59ab |
| P100 | 3.45±0.29b | 3.02±0.13ab | 5.51±0.46b | 2.45±0.23 | 35.19±2.95a | 49.62±3.42a |
| P150 | 4.70±0.55a | 3.96±0.50a | 8.35±0.69a | 2.41±0.17 | 33.99±2.39a | 53.41±2.28a |
| FA addition | ||||||
| CK | 4.01±0.33 | 2.97±0.28 | 6.35±0.61 | 2.25±0.16 | 31.48±1.55 | 47.06±2.09 |
| FA | 3.75±0.22 | 2.94±0.28 | 6.96±0.47 | 2.34±0.10 | 31.64±1.89 | 47.63±2.31 |
| ANOVA (P values) | ||||||
| P fertilization rates | 0.023 | 0.015 | 0.115 | 0.505 | 0.040 | 0.032 |
| FA addition | 0.424 | 0.940 | 0.181 | 0.619 | 0.944 | 0.734 |
| P* FA | 0.033 | 0.833 | 0.396 | 0.158 | 0.727 | 0.995 |
Table 9.
Seed cotton yields and components under different P fertilization rates and FA addition treatments, 2019.
Table 9.
Seed cotton yields and components under different P fertilization rates and FA addition treatments, 2019.
| Density | Bolls per plant | Single boll weight | Seed cotton yield | |
|---|---|---|---|---|
| *103 plant ha−1 | g | kg ha−1 | ||
| P fertilization rates | ||||
| P0 | 119.55±1.26b | 7.16±0.18 | 5.32±0.12 | 4558±187b |
| P50 | 127.55±3.12a | 7.43±0.12 | 5.53±0.07 | 5233±145a |
| P100 | 127.55±2.48a | 7.79±0.19 | 5.37±0.12 | 5321±135a |
| P150 | 133.85±1.80a | 7.4±0.13 | 5.52±0.08 | 5459±114a |
| FA addition | ||||
| CK | 126.95±3.27 | 7.26±0.18b | 5.42±0.12 | 4991±189b |
| FA | 127.3±2.41 | 7.63±0.15a | 5.45±0.07 | 5295±176a |
| ANOVA (P values) | ||||
| P fertilization rates | 0.002 | 0.062 | 0.428 | 0.001 |
| FA addition | 0.880 | 0.028 | 0.784 | 0.043 |
| P* FA | 0.351 | 0.939 | 0.974 | 0.618 |
Table 10.
Seed cotton yields and components under different P fertilization rates and FA addition treatments, 2020.
Table 10.
Seed cotton yields and components under different P fertilization rates and FA addition treatments, 2020.
| Density | Bolls per plant | Single boll weight | Seed cotton yield | |
|---|---|---|---|---|
| *103 plant ha−1 | g | kg ha−1 | ||
| P fertilization rates | ||||
| P0 | 126.25±1.83b | 5.25±0.15c | 5.26±0.11c | 3481±123c |
| P50 | 133.78±2.43a | 5.87±0.06b | 5.70±0.07b | 4469±101b |
| P100 | 133.75±2.63a | 6.19±0.12a | 5.93±0.03a | 4912±161a |
| P150 | 137.50±1.64a | 5.85±0.25a | 6.07±0.08a | 4862±164a |
| FA addition | ||||
| CK | 131.25±2.54 | 5.53±0.15b | 5.77±0.15 | 4192±202b |
| FA | 134.39±2.48 | 6.05±0.19a | 5.71±0.12 | 4670±262a |
| ANOVA (P values) | ||||
| P fertilization rates | 0.006 | <0.001 | <0.001 | <0.001 |
| FA addition | 0.141 | <0.001 | 0.416 | <0.001 |
| P* FA | 0.222 | 0.004 | 0.060 | 0.349 |
Table 11.
P fertilizer use efficiencies under different P fertilization rates and FA addition treatments, 2019.
Table 11.
P fertilizer use efficiencies under different P fertilization rates and FA addition treatments, 2019.
| RE | PNB | AE | PFP | |
|---|---|---|---|---|
| % | % | kg kg−1 | kg kg−1 | |
| P fertilization rates | ||||
| P0 | - | - | - | - |
| P50 | 20.93±12.11 | 159.19±12.11a | 18.57±2.89a | 104.66±2.89a |
| P100 | 26.91±8.86 | 96.04±8.86b | 10.17±1.35b | 53.21±1.35b |
| P150 | 16.97±1.78 | 63.06±1.78c | 7.70±0.76b | 36.39±0.76c |
| FA addition | ||||
| CK | 20.96±6.04 | 105.46±11.85 | 10.22±1.29 | 62.83±7.14 |
| FA | 22.24±6.19 | 106.74±12.21 | 14.07±2.05 | 66.68±8.18 |
| ANOVA (P values) | ||||
| P fertilization rates | 0.757 | <0.001 | 0.001 | <0.001 |
| FA addition | 0.907 | 0.907 | 0.065 | 0.065 |
| P* FA | 0.993 | 0.993 | 0.146 | 0.146 |
Note: RE, Apparent Recovery Efficiency; PNB, Partial Nutrient Balance; AE, Agronomic Efficiency; PFP, Partial Factor Productivity. Same as bellow.
Table 12.
P fertilizer use efficiencies under different P fertilization rates and FA addition treatments, 2020.
Table 12.
P fertilizer use efficiencies under different P fertilization rates and FA addition treatments, 2020.
| RE | PNB | AE | PFP | |
|---|---|---|---|---|
| % | % | kg kg−1 | kg kg−1 | |
| P fertilization rates | ||||
| P0 | - | - | - | - |
| P50 | 32.54±7.21 | 212.45±7.21a | 22.16±2.02a | 89.38±2.02a |
| P100 | 22.82±7.77 | 112.78±7.77b | 15.51±1.61b | 49.12±1.61b |
| P150 | 19.88±3.89 | 79.85±3.89c | 10.01±1.09c | 32.41±1.09c |
| FA addition | ||||
| CK | 23.54±4.53 | 133.48±15.22 | 12.90±1.39b | 53.98±6.19b |
| FA | 26.62±4.87 | 136.57±15.55 | 18.88±1.65a | 59.96±6.40a |
| ANOVA (P values) | ||||
| P fertilization rates | 0.427 | <0.001 | <0.001 | <0.001 |
| FA addition | 0.707 | 0.707 | 0.001 | 0.001 |
| P* FA | 0.990 | 0.990 | 0.650 | 0.650 |
Disclaimer/Publisher’s Note: The statements, opinions and data contained in all publications are solely those of the individual author(s) and contributor(s) and not of MDPI and/or the editor(s). MDPI and/or the editor(s) disclaim responsibility for any injury to people or property resulting from any ideas, methods, instructions or products referred to in the content. |
© 2025 by the authors. Licensee MDPI, Basel, Switzerland. This article is an open access article distributed under the terms and conditions of the Creative Commons Attribution (CC BY) license (http://creativecommons.org/licenses/by/4.0/).
Copyright: This open access article is published under a Creative Commons CC BY 4.0 license, which permit the free download, distribution, and reuse, provided that the author and preprint are cited in any reuse.


