Submitted:
07 February 2025
Posted:
08 February 2025
You are already at the latest version
Abstract
Wheat is a vital staple crop globally, addressing significant nutritional needs. In Ethiopia, the excessive application of nitrogen (N) and phosphorus (P) fertilizers can reduce crop production, including wheat. Additionally, excessive phosphorus application can limit zinc (Zn) uptake, making it essential to balance these nutrients to enhance yield and nutrient availability. Agricultural soils often face micronutrient deficiencies, prompting the promotion of blended multi-nutrient fertilizers. This study examined how different combinations of Zn and P fertilizers affect wheat yield and nutrient efficiency in Tigray, Northern Ethiopia, across three locations during the 2019 and 2020 cropping seasons. A randomized complete block design (RCBD) was used to assess varying P (0, 10, 20, 30 kg P ha-1) and Zn (0, 5, 10 kg Zn ha-1) application rates. Results showed that applying up to 20 kg P ha-1 significantly increased wheat grain and biomass yield, while 5 kg Zn ha-1 also boosted yield. However, excessive rates of both nutrients reduced yields, highlighting the importance of balanced application. The best results were achieved with 20 kg P ha-1 and 5 kg Zn ha-1, improving yield, nutrient efficiency, and zinc bioavailability, which can enhance wheat quality and support food security in diverse agro-climatic conditions.
Keywords:
1. Introduction
2. Materials and Methods
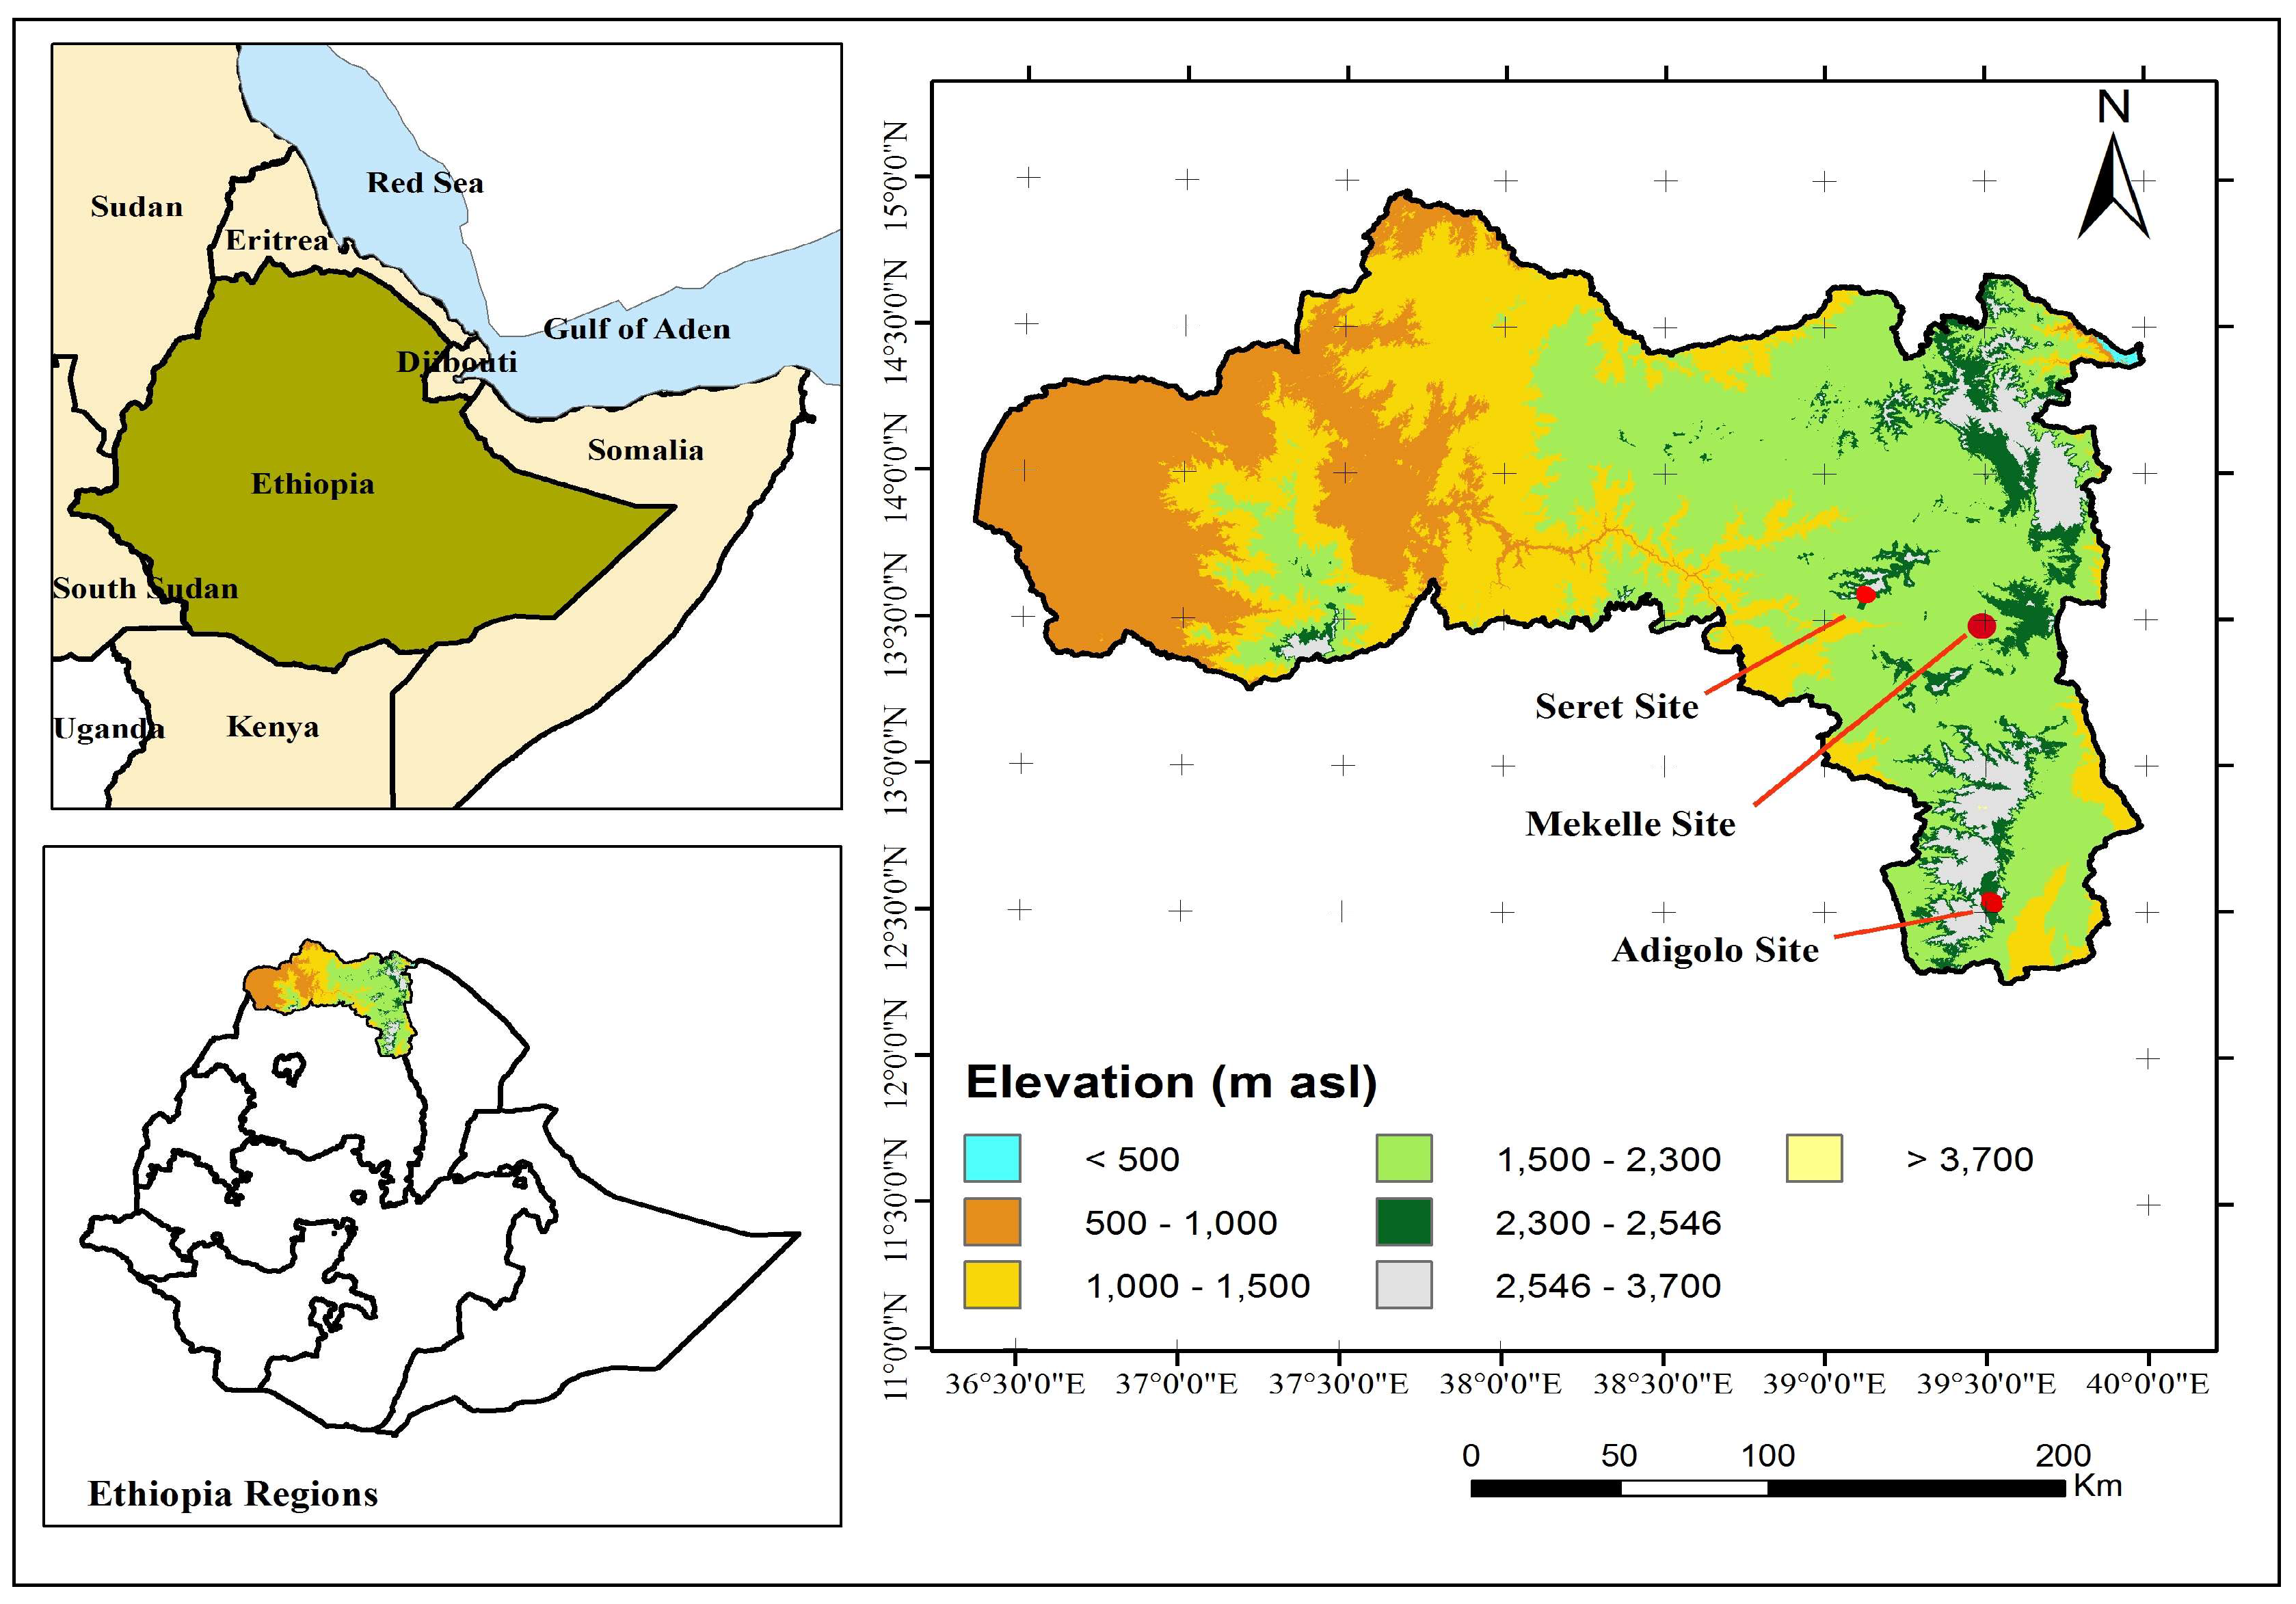
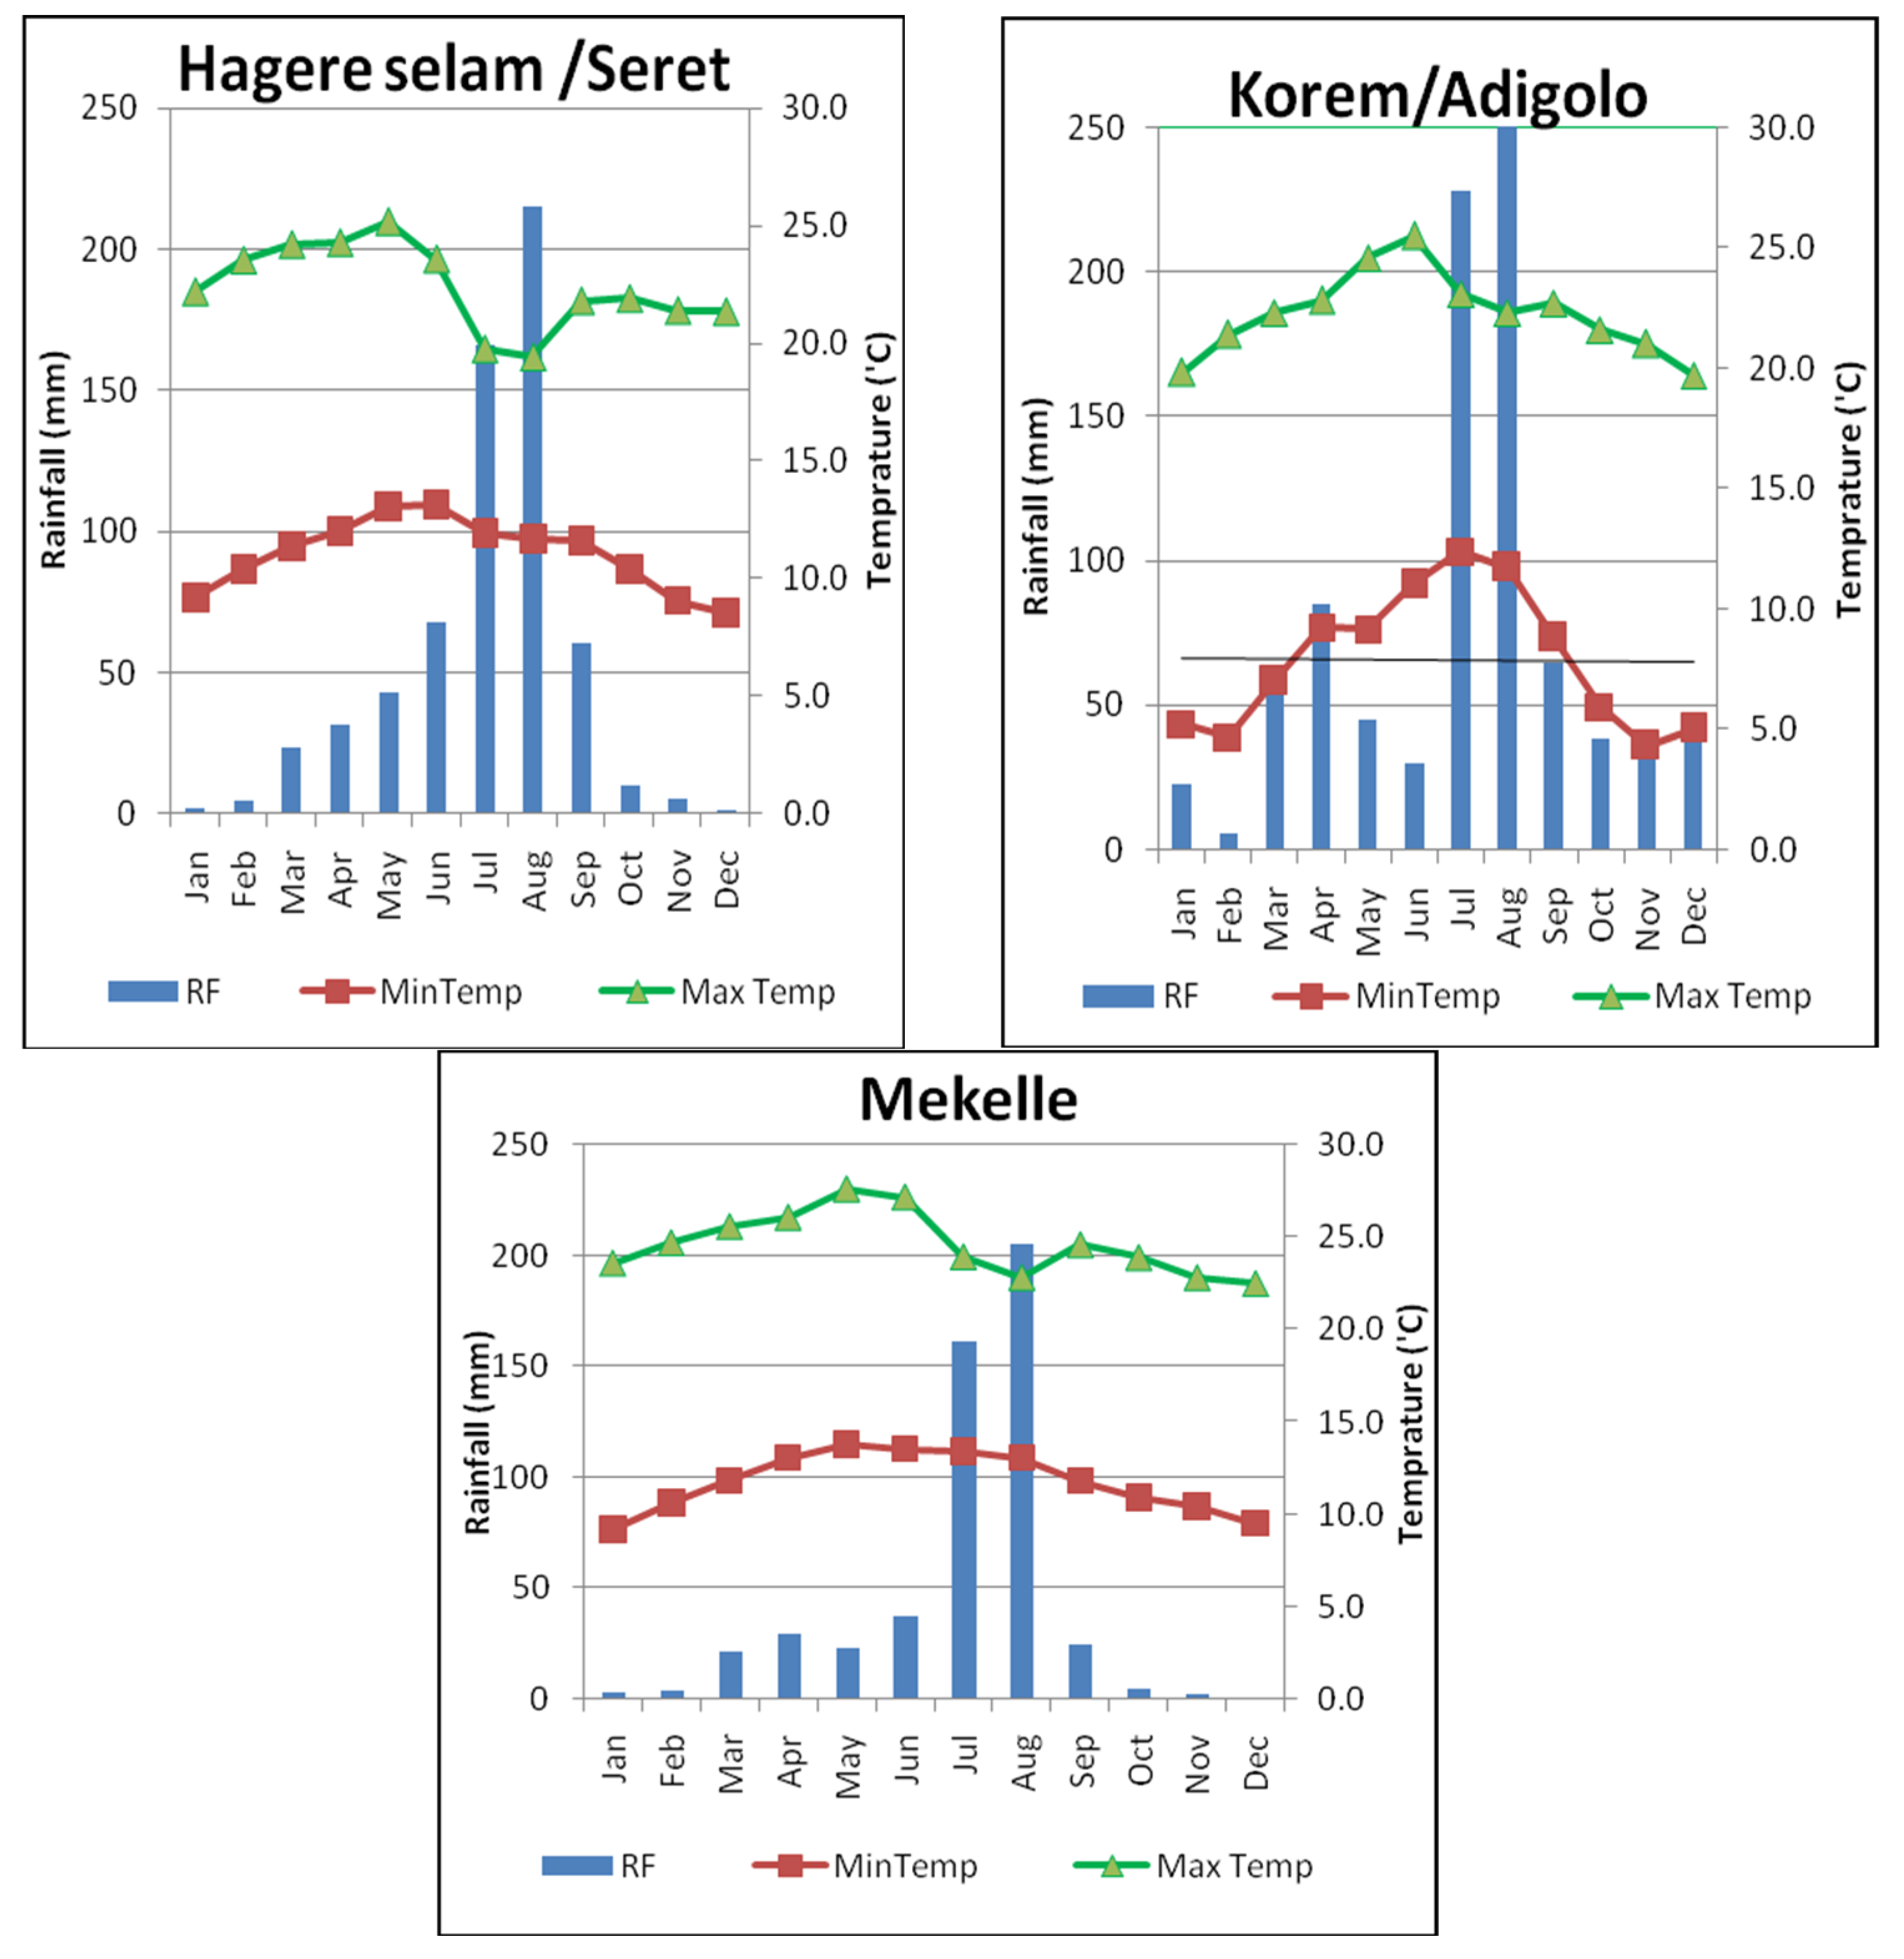
2.1. Description of Experimental Sites
2.2. Treatments and Experimental Design
2.3. Data Collection and Measurements
Soil Sampling and Analysis

 ,
,


 ,
,  ,
,  ,
,  ,
, 
2.4. Data Analysis
3. Results
3.1. Soil Characteristics
3.2. Effect of Zn and P on Yield and Yield Components of Wheat
3.3. Effect of Zn and P Application on Grain Nutrient Concentration
3.4. Nutrient Use Efficiency of Wheat
4. Discussion
5. Conclusions
Author Contributions
Funding
Data Availability Statement
Acknowledgments
Conflicts of Interest
References
- Giraldo, P.; Benavente, E.; Manzano-Agugliaro, F.; Gimenez, E. Worldwide Research Trends on Wheat and Barley: A Bibliometric Comparative Analysis. Agronomy 2019, 9, 352. [Google Scholar] [CrossRef]
- Erenstein, O.; Jaleta, M.; Mottaleb, K.A.; Sonder, K.; Donovan, J.; Braun, H.-J. Global Trends in Wheat Production, Consumption and Trade. In Wheat Improvement; Reynolds, M.P., Braun, H.-J., Eds.; Springer International Publishing: Cham, 2022; ISBN 978-3-030-90672-6. [Google Scholar]
- FAOSTAT Data: Production. Available online: https://www.fao.org/faostat/en/#data/QCL.
- Aleminew, A.; Legas, A. Grain Quality and Yield Response of Malt Barley Varieties to Nitrogen Fertilizer on Brown Soils of Amhara Region, Ethiopia. Journal of Agricultural Sciences 2015, 11, 135–143. [Google Scholar] [CrossRef]
- Victor Roch, G.; Maharajan, T.; Ceasar, S.A.; Ignacimuthu, S. The Role of PHT1 Family Transporters in the Acquisition and Redistribution of Phosphorus in Plants. Critical Reviews in Plant Sciences 2019, 38, 171–198. [Google Scholar] [CrossRef]
- Gadisa, N. Soil Nutrient Status and Farmers’ Perception on Soil Fertility in Ethiopia: Review. Journal of Biology, Agriculture and Healthcare 2021, 11, 8. [Google Scholar]
- Agegnehu, G.; Nelson, P.N.; Bird, M.I.; Van Beek, C. Phosphorus Response and Fertilizer Recommendations for Wheat Grown on Nitisols in the Central Ethiopian Highlands. Communications in Soil Science and Plant Analysis 2015, 46, 2411–2424. [Google Scholar] [CrossRef]
- Hailu, H.; Mamo, T.; Keskinen, R.; Karltun, E.; Gebrekidan, H.; Bekele, T. Soil Fertility Status and Wheat Nutrient Content in Vertisol Cropping Systems of Central Highlands of Ethiopia. Agric & Food Secur 2015, 4, 19. [Google Scholar] [CrossRef]
- Solomon, N.; Birhane, E.; Tilahun, M.; Schauer, M.; Gebremedhin, M.A.; Gebremariam, F.T.; Gidey, T.; Newete, S.W. Revitalizing Ethiopia’s Highland Soil Degradation: A Comprehensive Review on Land Degradation and Effective Management Interventions. Discov Sustain 2024, 5, 106. [Google Scholar] [CrossRef]
- Habtegebrial, K. Nitrogen and Sulphur Fertilizers Effects on Yield, Nitrogen Uptake and Nitrogen Use Efficiency of Upland Rice Variety on Irrigated Fulvisols of the Afar Region, Ethiopia. J. Soil Sci. Environ. Manage. 2013, 4, 62–70. [Google Scholar] [CrossRef]
- Hui, X.; Wang, X.; Luo, L.; Wang, S.; Guo, Z.; Shi, M.; Wang, R.; Lyons, G.; Chen, Y.; Cakmak, I.; et al. Wheat Grain Zinc Concentration as Affected by Soil Nitrogen and Phosphorus Availability and Root Mycorrhizal Colonization. European Journal of Agronomy 2022, 134, 126469. [Google Scholar] [CrossRef]
- Duga, R. Effect of Nitrogen, Phosphorus and Sulfur Nutrients on Growth and Yield Attributes of Bread Wheat. JENR 2021, 5. [Google Scholar] [CrossRef]
- Gebreslassie, H.B.; Demoz, H.A. A Review on: Effect of Phosphorus Fertilizer on Crop Production in Ethiopia. Journal of Biology 2016. [Google Scholar]
- Moreno-Lora, A.; Delgado, A. Factors Determining Zn Availability and Uptake by Plants in Soils Developed under Mediterranean Climate. Geoderma 2020, 376, 114509. [Google Scholar] [CrossRef]
- Tsadilas, C.; Evangelou, E.; Nikoli, T.; Tzioyvalekas, M. Determination of Critical Value of Available Soil Phosphorus for Wheat (Triticum Aestivum L.) in Calcareous Soils from Greece. JALSE 2022, 54, 322–332. [Google Scholar] [CrossRef]
- Wessells, K.R.; Brown, K.H. Estimating the Global Prevalence of Zinc Deficiency: Results Based on Zinc Availability in National Food Supplies and the Prevalence of Stunting. PLoS ONE 2012, 7, e50568. [Google Scholar] [CrossRef]
- Abera, Y.; Kebede, M. Assessment on the Status of Some Micronutrients in Vertisols of the Central Highlands of Ethiopia. nternational Research Journal of Agricultural Science and Soil Science 2013, 3, 169–173. [Google Scholar]
- Abera, Y.; Kassa, S. Status of Soil Micronutrients in Ethiopian Soils: A Review. ournal of Environment and Earth Science 2017, 7, 6. [Google Scholar]
- Belay, A.; Gashu, D.; Joy, E.J.M.; Lark, R.M.; Chagumaira, C.; Likoswe, B.H.; Zerfu, D.; Ander, E.L.; Young, S.D.; Bailey, E.H.; et al. Zinc Deficiency Is Highly Prevalent and Spatially Dependent over Short Distances in Ethiopia. Sci Rep 2021, 11, 6510. [Google Scholar] [CrossRef]
- Ozturk, H.; Niazi, P.; Mansoor, M.; Monib, A.W.; Alikhail, M.; Azizi, A. The Function of Zinc in Animal, Plant, and Human Nutrition. J. Res. Appl. Sci. Biotechnol. 2023, 2, 35–43. [Google Scholar] [CrossRef]
- Patil, R.; Sontakke, T.; Biradar, A.; Nalage, D. Zinc: An Essential Trace Element for Human Health and Beyond. Food Health 2023, 5, 13. [Google Scholar] [CrossRef]
- Alloway, B.J. Zinc in SoilS and Crop Nutrition; 2nd ed.; International Zinc Association and International Fertilizer Industry Association: Brussels, Belgium and Paris, France, 2008.
- Haileselassie, B.; Bedadi, B.; Kidanu, S.; Mamo, T. Effect of Zinc Containing Fertilizers on Yield and Grain Quality of Tef [(Eragrostis Tef (Zucc.) Trotter] in Some Soils of Tigray Region, Ethiopia.
- Khan, F.U.; Khan, A.A.; Qu, Y.; Zhang, Q.; Adnan, M.; Fahad, S.; Gul, F.; Ismail, M.; Saud, S.; Hassan, S.; et al. Enhancing Wheat Production and Quality in Alkaline Soil: A Study on the Effectiveness of Foliar and Soil Applied Zinc. PeerJ 2023, 11, e16179. [Google Scholar] [CrossRef]
- Firdous, S.; Agarwal, B.; Chhabra, V. Zinc-Fertilization Effects on Wheat Yield and Yield Components. Journal of Pharmacognosy and Phytochemistry 2018, 7, 3497–3499. [Google Scholar]
- Sánchez-Rodríguez, A.R.; Rey, M.-D.; Nechate-Drif, H.; Castillejo, M.Á.; Jorrín-Novo, J.V.; Torrent, J.; Del Campillo, M.C.; Sacristán, D. Combining P and Zn Fertilization to Enhance Yield and Grain Quality in Maize Grown on Mediterranean Soils. Sci Rep 2021, 11, 14. [Google Scholar] [CrossRef] [PubMed]
- Yadav, A.; Singh, D.; Kumar, R.; Sachan, R.; Kumar, K.; Singh, A.; Tiwari, A.; Singh, K.K. Response of Different Level of Phosphorus, Zinc and Rhizobium Inoculation on Growth Yield Attributes and Yield of Chickpea (Cicer Aretinum L.). IJECC 2022, 12, 1954–1964. [Google Scholar] [CrossRef]
- Cakmak, I.; Kutman, U.B. Agronomic Biofortification of Cereals with Zinc: A Review. European J Soil Science 2018, 69, 172–180. [Google Scholar] [CrossRef]
- Cakmak, I.; Kalayci, M.; Kaya, Y.; Torun, A.A.; Aydin, N.; Wang, Y.; Arisoy, Z.; Erdem, H.; Yazici, A.; Gokmen, O.; et al. Biofortification and Localization of Zinc in Wheat Grain. J. Agric. Food Chem. 2010, 58, 9092–9102. [Google Scholar] [CrossRef]
- Recena, R.; García-López, A.M.; Delgado, A. Zinc Uptake by Plants as Affected by Fertilization with Zn Sulfate, Phosphorus Availability, and Soil Properties. Agronomy 2021, 11, 390. [Google Scholar] [CrossRef]
- Simtow, F. An Assessment of National Fertiliser Policies, Regulations and Standards for Ethiopia. In Proceedings of the An Assessment of National Fertilizer Policies, Regulations and Standards for Ethiopia; African Fertilizer and Agribusiness Partnership: 50 Park Place, Suite 1003 Newark, NJ 07102, 2015; p. 35. p. 35.
- Elias, E.; Okoth, P.F.; Smaling, E.M.A. Explaining Bread Wheat (Triticum Aestivum) Yield Differences by Soil Properties and Fertilizer Rates in the Highlands of Ethiopia. Geoderma 2019, 339, 126–133. [Google Scholar] [CrossRef]
- Terfa, A.E.; Mellisse, B.T.; Kebede, M.M.; Elias, E.; Yadessa, G.B. Effect of Blended Fertilizer Application on Bread Wheat Yield and Profitability on Andosols of Southwestern Highlands of Ethiopian. Communications in Soil Science and Plant Analysis 2023, 54, 73–82. [Google Scholar] [CrossRef]
- Khattak, S.G.; Dominy, P.J.; Ahmad, W. Effect of Zn as Soil Addition and Foliar Application on Yield and Protein Content of Wheat in Alkaline Soil. J. Natn. Sci. Foundation Sri Lanka 2015, 43, 303. [Google Scholar] [CrossRef]
- Abay, K.A.; Abay, M.H.; Amare, M.; Berhane, G.; Aynekulu, E. Mismatch between Soil Nutrient Deficiencies and Fertilizer Applications: Implications for Yield Responses in Ethiopia. Agricultural Economics 2022, 53, 215–230. [Google Scholar] [CrossRef]
- Mousavi, S.R. Zinc in Crop Production and Interaction with Phosphorus. Australian Journal of Basic and Applied Sciences 2011, 5, 1503–1509. [Google Scholar]
- Singh, K.; Verma, G.; Manchanda, J.S. Soil and Foliar Zinc Application for Enhancing Grain Zinc Content of Aromatic Rice Genotypes Grown on Zinc Deficient and Sufficient Soil. Jour. of Soi. and Wat. Conser. 2020, 19, 223. [Google Scholar] [CrossRef]
- Weldua, Y.; Haileb, M.; Habtegebrielb, K. Effect of Zinc and Phosphorus Fertilizers Application on Yield and Yield Components of Faba Bean (Vicia Faba L.) Grown in Calcaric Cambisol of Semi-Arid Northern Ethiopia.
- Yohannes, D.; Kiros, H.; Yirga, W. Inoculation, Phosphorous and Zinc Fertilization Effects on Nodulation, Yield and Nutrient Uptake of Faba Bean (Vicia Faba L.) Grown on Calcaric Cambisol of Semiarid Ethiopia. J. Soil Sci. Environ. Manage. 2015, 6, 9–15. [Google Scholar] [CrossRef]
- Tarekegn, T.; Shiferaw, L.; Sirak, T.; Shimelis, F.; Maarten, W.; Vince, U. Hydrogeological Mapping for Climate Resilient WASH in Ethiopia – LOT 1; Target sites Ofla woreda, Tigray, Ed.; ACACIAWATER: Van Hogendorpplein 4 2805 BM Gouda, 2022. [Google Scholar]
- Gebreyohannes, T.; Smedt, F.D.; Hagos, M.; Gebresilassie, S.; Amare, K.; Kabeto, K.; Hussein, A.; Nyssen, J.; Bauer, H.; Moeyersons, J.; et al. Large-Scale Geological Mapping of the Geba Basin, Northern Ethiopia. In Proceedings of the Tigray Livelihood Paper No 9; VLIR – Mekelle University IUC Program: Mekelle, Ethiopia, 2010; p. 46.
- Andrea, S.; Paola, M.; Francesco, D.; Claudio, F.; Bekele, A. Erosion-Tectonics Feedbacks in Shaping the Landscape: An Example from the Mekele Outlier (Tigray, Ethiopia). Journal of African Earth Sciences 2017, 129, 870–886. [Google Scholar] [CrossRef]
- Yemane Gebremeskel; Weldemariam Gebrehiwot; Girmay Gebresamuel CASCAPE Experiences in Integrated Soil Fertility and Nutrient Management in Southern; Mekelle University: Mekelle, Ethiopia, 2020;
- Nyssen, J.; Naudts, J.; De Geyndt, K.; Haile, M.; Poesen, J.; Moeyersons, J.; Deckers, J. Soils and Land Use in the Tigray Highlands (Northern Ethiopia). Land Degrad Dev 2008, 19, 257–274. [Google Scholar] [CrossRef]
- Keram, K.S.; Sharma, B.L.; Kewat, M.L.; Sharma, G.D. Effect of Zinc Fertilization on Growth, Yield and Quality of Wheat Grown Under Agro-Climatic Condition of Kymore Plateau of Madhya Pradesh, India. The Bioscan 2014, 9, 1479–1483. [Google Scholar]
- Arshad, M.; Adnan, M.; Ahmed, S.; Khan, A.K.; Ali, I.; Ali, M.; Ali, A.; Khan, A.; Kamal, M.A.; Gul, F.; et al. Integrated Effect of Phosphorus and Zinc on Wheat Crop. American-Eurasian J. Agric. & Environ. Sci. 2016, 16, 455–459. [Google Scholar] [CrossRef]
- Bouyoucos, G.J. Hydrometer Method Improved for Making Particle Size Analyses of Soils1. Agronomy Journal 1962, 54, 464–465. [Google Scholar] [CrossRef]
- Walkley, A.; Black, I.A. An Examination of the Degtjareff Method for Determining Soil Organic Matter and a Proposed Modification of Thechromic Acid Titration Method 1934.
- Bremner, J.M.; Mulvaney, C.S. Nitrogen Total. In Methods of Soil Analysis: Part 2 Chemical and Microbiological Properties; Madison,: Wisconsin USA, 1982; pp. 595–625. [Google Scholar]
- Olsen, S.R. Estimation of Available Phosphorus in Soils by Extraction with Sodium Bicarbonate.
- Chapman, H.D. Cation-Exchange Capacity! In Methods of Soil Analysis: Part 2 Chemical and Microbiological Properties, 9.2; 1965; pp. 891–901.
- Jones, J. Laboratory Guide for Conducting Soil Tests and Plant Analysis; 1st ed.; Taylor & Francis Group: Milton, 2001; ISBN 978-0-8493-0206-0.
- Lindsay, W.L.; Norvell, W.A. Development of a DTPA Soil Test for Zinc, Iron, Manganese, and Copper. Soil Science Soc of Amer J 1978, 42, 421–428. [Google Scholar] [CrossRef]
- Minitab, L. Getting Started with Minitab Statistical Software 2021.
- Wieczorek, D.; Żyszka-Haberecht, B.; Kafka, A.; Lipok, J. Determination of Phosphorus Compounds in Plant Tissues: From Colourimetry to Advanced Instrumental Analytical Chemistry. Plant Methods 2022, 18, 22. [Google Scholar] [CrossRef]
- Elango, D.; Kanatti, A.; Wang, W.; Devi, A.R.; Ramachandran, M.; Jabeen, A. Analytical Methods for Iron and Zinc Quantification in Plant Samples. Communications in Soil Science and Plant Analysis 2021, 52, 1069–1075. [Google Scholar] [CrossRef]
- Goedhart, P.W.; Thissen, T.N.M. Biometris GenStat Procedure Library Manual 17th Edition; 2014; pp. 1–190.
- Tadesse, K.; Abdulkadir, B.; Admasu, W.; Habte, D.; Admasu, A.; Tadesse, A.; Debebe, A. Soil Test-Based Phosphorus Fertilizer Recommendation for Malting Barley Production on Nitisols. Open Agriculture 2022, 7, 171–180. [Google Scholar] [CrossRef]
- Gurjer, K.; Sharma, S.; Yadav, K. Establishment of Critical Limit of Zinc for Wheat Crop. The Pharma Innovation Journal 2022, 11, 1457–1461. [Google Scholar]
- Booker Tropical Soil Manual; Landon, Rj.R.K.M., Ed.; Paperback Edition.; Longman Scientific & Technical ; J. Wiley: Harlow, Essex, England : New York, NY, 1991; ISBN 13: 978-0-582-00557-0 (pbk).
- Hirzel, J.; Matus, I. Effect of Soil Depth and Increasing Fertilization Rate on Yield and Its Components of Two Durum Wheat Varieties. Chilean J. Agric. Res. 2013, 73, 55–59. [Google Scholar] [CrossRef]
- Noonari, S.; Kalhoro, S.A.; Ali, A.; Mahar, A.; Raza, S.; Ahmed, M.; Shah, S.F.A.; Baloch, S.U. Effect of Different Levels of Phosphorus and Method of Application on the Growth and Yield of Wheat. NS 2016, 08, 305–314. [Google Scholar] [CrossRef]
- Ghafoor, A.M.R. Effect of Phosphorus Fertilizer Application on Some Yield Components of Wheat and Phosphorus Use Efficiency in Calcareous Soil. Journal of Dynamics in Agricultural Research 2016, 3, 46–52. [Google Scholar]
- Liu, L.; Miao, Q.; Wang, H.; Xue, Y.; Qi, S.; Zhang, J.; Li, J.; Meng, Q.; Cui, Z. Optimizing Phosphorus Application for Winter Wheat Production in the Coastal Saline Area. Agronomy 2022, 12, 2966. [Google Scholar] [CrossRef]
- Zhang, W.; Liu, D.; Liu, Y.; Chen, X.; Zou, C. Overuse of Phosphorus Fertilizer Reduces the Grain and Flour Protein Contents and Zinc Bioavailability of Winter Wheat ( Triticum Aestivum L.). J. Agric. Food Chem. 2017, 65, 1473–1482. [Google Scholar] [CrossRef]
- Garcia-Oliveira, A.L.; Chander, S.; Ortiz, R.; Menkir, A.; Gedil, M. Genetic Basis and Breeding Perspectives of Grain Iron and Zinc Enrichment in Cereals. Front. Plant Sci. 2018, 9, 937. [Google Scholar] [CrossRef]
- Menna, A.; Semoka, J.; Amuri, N.; Mamo, T. Wheat Response to Applied Nitrogen, Sulfur, and Phosphorous in Three Representative Areas of the Central Highlands of Ethiopia -I. IJPSS 2015, 8, 1–11. [Google Scholar] [CrossRef]
- Keram, K.S.; Sharma, B.L.; Sharma, G.D.; Thakur, R.K. Impact of Zinc Application on Its Translocation into Various Plant Parts of Wheat and Its Effect on Chemical Composition and Quality of Grain. Academic Journals 2013, 8, 2218–2226. [Google Scholar] [CrossRef]
- A., S.; A., S.; N, M. Role of Zinc Nutrition for Increasing Zinc Availability, Uptake, Yield, and Quality of Maize ( Zea Mays L.) Grains: An Overview. Communications in Soil Science and Plant Analysis 2020, 51, 2001–2021. [CrossRef]
- Aboyeji, C.M.; Dunsin, O.; Adekiya, A.O.; Suleiman, K.O.; Chinedum, C.; Okunlola, F.O.; Joseph, A.; Ejue, S.W.; Adesola, O.O.; Olofintoye, T.A.J.; et al. Synergistic and Antagonistic Effects of Soil Applied P and Zn Fertilizers on the Performance, Minerals and Heavy Metal Composition of Groundnut. Open Agriculture 2020, 5, 1–9. [Google Scholar] [CrossRef]
- Fageria, V.D. Nutrient Interactions in Crop Plants. Journal of Plant Nutrition 2001, 24, 1269–1290. [Google Scholar] [CrossRef]
- Rietra, R.P.J.J.; Heinen, M.; Dimkpa, C.O.; Bindraban, P.S. Effects of Nutrient Antagonism and Synergism on Yield and Fertilizer Use Efficiency. Communications in Soil Science and Plant Analysis 2017, 48, 1895–1920. [Google Scholar] [CrossRef]
- Dargie, S.; Girma, T.; Chibsa, T.; Kassa, S.; Boke, S.; Abera, A.; Haileselassie, B.; Addisie, S.; Amsalu, S.; Haileselassie, M.; et al. Balanced Fertilization Increases Wheat Yield Response on Different Soils and Agroecological Zones in Ethiopia. Ex. Agric. 2022, 58, e23. [Google Scholar] [CrossRef]
- Soumya, S.; B C, V.; Debarati, B.; Somnath, R. Management of Phosphorus Zinc Antagonism to Improve Nutrient Use Efficiency Compressed. Food and Scientific Reports 2022, 03, 40–43. [Google Scholar]
- Ova, E.A.; Kutman, U.B.; Ozturk, L.; Cakmak, I. High Phosphorus Supply Reduced Zinc Concentration of Wheat in Native Soil but Not in Autoclaved Soil or Nutrient Solution. Plant Soil 2015, 393, 147–162. [Google Scholar] [CrossRef]
- Mohammed, S.B.; Dzidzienyo, D.K.; Yahaya, A.; L. Umar, M.; Ishiyaku, M.F.; Tongoona, P.B.; Gracen, V. High Soil Phosphorus Application Significantly Increased Grain Yield, Phosphorus Content but Not Zinc Content of Cowpea Grains. Agronomy 2021, 11, 802. [Google Scholar] [CrossRef]
- Kumar, D.; Patel, K.C.; Ramani, V.P.; Shukla, A.K.; Behera, S.K.; Patel, R.A. Influence of Different Rates and Frequencies of Zn Application to Maize–Wheat Cropping on Crop Productivity and Zn Use Efficiency. Sustainability 2022, 14, 15091. [Google Scholar] [CrossRef]
- Luo, L.; Zhang, X.; Zhang, M.; Wei, P.; Chai, R.; Wang, Y.; Zhang, C.; Siddique, K.H.M. Improving Wheat Yield and Phosphorus Use Efficiency through the Optimization of Phosphorus Fertilizer Types Based on Soil P Pool Characteristics in Calcareous and Non-Calcareous Soil. Agronomy 2023, 13, 928. [Google Scholar] [CrossRef]
- Zhu, Y.; Smith, S.E.; Smith, F.A. Zinc (Zn)-Phosphorus (P) Interactions in Two Cultivars of Spring Wheat (Triticum Aestivum L.) Differing in P Uptake Efficiency. Annals of Botany 2001, 88, 941–945. [Google Scholar] [CrossRef]
- Shabnam, R.; Iqbal, Md.T. Phosphorus Use Efficiency by Wheat Plants That Grown in an Acidic Soil. Braz J Sci Technol 2016, 3, 18. [Google Scholar] [CrossRef]
- Zhang, W.; Zhang, W.; Wang, X.; Liu, D.; Zou, C.; Chen, X. Quantitative Evaluation of the Grain Zinc in Cereal Crops Caused by Phosphorus Fertilization. A Meta-Analysis. Agron. Sustain. Dev. 2021, 41, 6. [Google Scholar] [CrossRef]
- Yu, B.-G.; Chen, X.-X.; Cao, W.-Q.; Liu, Y.-M.; Zou, C.-Q. Responses in Zinc Uptake of Different Mycorrhizal and Non-Mycorrhizal Crops to Varied Levels of Phosphorus and Zinc Applications. Front. Plant Sci. 2020, 11, 10. [Google Scholar] [CrossRef]
- Amanullah; Inamullah; Alwahibi, M. S.; Elshikh, M.S.; Alkahtani, J.; Muhammad, A.; Khalid, S.; Imran; Ahmad, M.; Khan, N.; et al. Phosphorus and Zinc Fertilization Improve Zinc Biofortification in Grains and Straw of Coarse vs. Fine Rice Genotypes. Agronomy 2020, 10, 1155. [Google Scholar] [CrossRef]
- Jayara, A.S.; Kumar, R.; Pandey, P.; Singh, S.; Shukla, A.; Singh, A.P.; Pandey, S.; Meena, R.L.; Reddy, K.I. Boosting Nutrient Use Efficiency Through Fertilizer Use Management. Appl. Ecol. Env. Res. 2023, 21, 2931–2952. [Google Scholar] [CrossRef]
- Hamzah Saleem, M.; Usman, K.; Rizwan, M.; Al Jabri, H.; Alsafran, M. Functions and Strategies for Enhancing Zinc Availability in Plants for Sustainable Agriculture. Front. Plant Sci. 2022, 13, 1033092. [Google Scholar] [CrossRef]

| Parameters* | Research sites | ||
|---|---|---|---|
| Seret | Adigolo | Mekelle | |
| Sand (%) | 25.4 | 22.21 | 34.50 |
| Silt (%) | 30.2 | 32.29 | 27.15 |
| Clay (%) | 44.4 | 45.50 | 38.35 |
| Textural class | C | C | CL |
| pH | 7.84 | 7.25 | 7.92 |
| SOC (%) | 0.95 | 1.032 | 0.71 |
| TN (%) | 0.18 | 0.192 | 0.17 |
| Av P (mg kg-1) | 6.55 | 6.91 | 5.46 |
| Zn ( mg kg-1) | 0.73 | 0.98 | 0.65 |
| CEC (cmol(+) kg-1) | 45.5 | 42.25 | 38.56 |
| Exch K (cmol(+) kg-1) | 0.22 | 0.2 | 0.20 |
| Exch Ca (cmol(+) kg-1) | 28.3 | 25.16 | 33.25 |
| Exch Mg (cmol(+) kg-1) | 10.1 | 8.72 | 12.42 |
| * C- Clay; CL- Clay Loam; SOC- soil organic carbon; SOM- soil organic matter; Av P- available phosphorus; TN- total nitrogen; CEC- Cation Exchange Capacity; Exch K, Ca, Mg-Exchangeable Potassium, Calcium, Magnesium | |||
| Site/treatments | Grain yield (t ha-1) | Biomass yield (t ha-1) |
|---|---|---|
| Due to location | ||
| Adigolo | 4.46a | 12.95a |
| Mekelle | 3.81c | 9.54c |
| Seret | 4.32b | 11.36b |
| LSD(0.05) | 0.03 | 0.101 |
| Due to P levels | ||
| P 0 | 3.11d | 8.76d |
| P 10 kg ha-1 | 3.87c | 10.47c |
| P 20 kg ha-1 | 5.30a | 13.68a |
| P30 kg ha-1 | 4.50b | 12.22b |
| LSD(0.05) | 0.034 | 0.117 |
| Due to Zn levels | ||
| Znc0 | 3.67c | 9.95c |
| Zn 5 kg ha-1 | 4.53a | 12.19a |
| Zn 10 kg ha-1 | 4.38b | 11.71b |
| LSD(0.05) | 0.03 | 0.101 |
| Treatment | Grain Yield (t.ha-1) | Biomass (t.ha-1) | |||||
|---|---|---|---|---|---|---|---|
| Zn (Kg ha-1) | P (Kg ha-1) | Seret | Adigolo | Mekelle | Seret | Adigolo | Mekelle |
| 0 | 0 | 2.57j | 2.83k | 2.18k | 6.72k | 8.47k | 5.83k |
| 0 | 10 | 3.37i | 3.67i | 3.05i | 8.59j | 10.90i | 7.82i |
| 0 | 20 | 4.88d | 4.99d | 4.35d | 13.39c | 15.04c | 10.13e |
| 0 | 30 | 4.16g | 4.36f | 3.61g | 10.64g | 12.71f | 9.15g |
| 5 | 0 | 3.39i | 3.29j | 2.66j | 9.11i | 9.93j | 6.90j |
| 5 | 10 | 4.43f | 4.61e | 3.85f | 9.76h | 12.15g | 10.76d |
| 5 | 20 | 5.81a | 6.05a | 5.36a | 15.38a | 17.10a | 12.69a |
| 5 | 30 | 5.17c | 5.19c | 4.59c | 14.45b | 16.54b | 11.47c |
| 10 | 0 | 3.84h | 3.91h | 3.32h | 11.95e | 11.52h | 8.43h |
| 10 | 10 | 4.05g | 4.11g | 3.67g | 11.46f | 13.15e | 9.61f |
| 10 | 20 | 5.37b | 5.79b | 5.06b | 12.55d | 14.38d | 12.45b |
| 10 | 30 | 4.73e | 4.69e | 4.01e | 12.35d | 13.47e | 9.19g |
| LSD(0.05) | 0.115 | 0.121 | 0.071 | 0.46 | 0.335 | 0.239 | |
| Treatment | Grain Zn mg/kg | Grain P g/kg | |||||
|---|---|---|---|---|---|---|---|
| Zn (Kg ha-1) | P (Kg ha-1) | Adigolo | Seret | Mekelle | Adigolo | Seret | Mekelle |
| 0 | 0 | 19.57k | 17.55l | 16.77k | 2.95k | 2.23k | 2.18l |
| 5 | 0 | 40.75e | 35.68f | 33.93e | 3.20j | 3.24i | 2.94j |
| 10 | 0 | 49.91b | 43.78b | 43.45b | 3.64i | 3.06j | 2.54k |
| 0 | 10 | 28.43i | 26.58j | 25.39i | 4.13g | 3.24i | 3.51g |
| 5 | 10 | 43.85d | 38.83d | 35.81d | 3.98h | 3.56g | 3.47h |
| 10 | 10 | 55.48a | 48.14a | 47.13a | 3.72i | 3.4h | 3.2i |
| 0 | 20 | 31.17h | 29.26i | 27.69h | 4.65d | 3.95f | 4.35c |
| 5 | 20 | 37.88f | 33.51g | 32.41f | 4.5e | 4.65c | 3.86e |
| 10 | 20 | 47.85c | 41.61c | 40.28c | 4.3f | 4.11e | 3.69f |
| 0 | 30 | 26.42j | 24.27k | 23.02j | 5.18b | 4.27d | 5.05a |
| 5 | 30 | 34.99g | 31.20h | 30.94g | 5.70a | 5.35a | 4.81b |
| 10 | 30 | 41.56e | 37.16e | 34.3e | 5.09c | 4.95b | 4.17d |
| LSD(0.05) | 1.865 | 0.928 | 1.339 | 0.102 | 0.198 | 0.046 | |
| Treatment | P use efficiency | Treatment | Zn use efficiency | ||||||
|---|---|---|---|---|---|---|---|---|---|
| P (kgha-1) |
Zn (kgha-1) |
Seret | Adigolo | Mekelle | Zn (kgha-1) |
P (kgha-1) |
Seret | Adigolo | Mekelle |
| 10 | 0 | 187.6f | 243.8g | 198.9e | 5 | 0 | 478.4e | 292.2f | 213.3f |
| 10 | 5 | 303.7cd | 375.7c | 492.6a | 5 | 10 | 607.4c | 737.9c | 985.1c |
| 10 | 10 | 474.1a | 458.2a | 377.3b | 5 | 20 | 1731.7a | 1727.6a | 1370.7a |
| 20 | 0 | 334.1c | 328.9d | 214.6d | 5 | 30 | 1546.3b | 1614.5b | 1126.9b |
| 20 | 5 | 432.9b | 431.9b | 342.7c | 10 | 0 | 523.5de | 305.5f | 259.4f |
| 20 | 10 | 291.6d | 295.7e | 330.6c | 10 | 10 | 474.1e | 468.0e | 377.3e |
| 30 | 0 | 130.8g | 141.5i | 110.4f | 10 | 20 | 583.2cd | 591.4d | 661.1d |
| 30 | 5 | 257.7e | 273.7f | 187.8e | 10 | 30 | 563.6cd | 500.0e | 336.4e |
| 30 | 10 | 187.9f | 166.7h | 112.1f | |||||
| LSD(0.05) | 30.05 | 26.12 | 19.56 | LSD(0.05) | 127.16 | 68.54 | 58.17 | ||
Disclaimer/Publisher’s Note: The statements, opinions and data contained in all publications are solely those of the individual author(s) and contributor(s) and not of MDPI and/or the editor(s). MDPI and/or the editor(s) disclaim responsibility for any injury to people or property resulting from any ideas, methods, instructions or products referred to in the content. |
© 2025 by the authors. Licensee MDPI, Basel, Switzerland. This article is an open access article distributed under the terms and conditions of the Creative Commons Attribution (CC BY) license (http://creativecommons.org/licenses/by/4.0/).


