Submitted:
24 September 2025
Posted:
25 September 2025
You are already at the latest version
Abstract
Suboptimal nutrient management is a major limitation to Chinese cabbage (Brassica rapa L. subsp. chinensis) productivity in Tanzania, where yields average 5.1 t ha⁻¹ compared to the global potential of 80–100 t ha⁻¹. This is largely due to nutrient-depleted acidic soils, low fertilizer use, and reliance on blanket recommendations. This study aimed to establish critical concentrations of nitrogen (N), phosphorus (P), and potassium (K) for optimal yield and nutrient use efficiency of Chinese cabbage under Morogoro conditions. A two-season field experiment (Nov 2024–Jan 2025; Feb–May 2025) was conducted at Sokoine University of Agriculture in a randomized complete block design with three replications and 22 treatments. Each macronutrient was varied systematically while others were held constant. Soil analysis revealed strongly acidic conditions (pH 5.01), low available P (2.24 mg kg⁻¹), low total N (0.14%), and low cation exchange capacity (7.28 Cmol(+) kg⁻¹), emphasising the need for balanced fertilization. Growth and yield data were subjected to ANOVA and Tukey’s HSD test, while quadratic regression models were used to determine critical nutrient concentrations. Balanced NPK fertilization significantly enhanced growth and yield compared to the control (p < 0.05). Optimal N, P, and K rates were 220–300 kg N ha⁻¹, 90–120 kg P ha⁻¹, and 120–180 kg K ha⁻¹, producing 6–8-fold yield increases (40–55 t ha⁻¹) over unfertilized controls (≈6 t ha⁻¹). Nutrient uptake and tissue concentrations followed curvilinear responses, with diminishing returns beyond optimal rates. Excess N (≥450 kg ha⁻¹) resulted in luxury consumption and reduced nutrient use efficiency. Balanced NPK fertilization at identified optimal rates maximizes yield and nutrient use efficiency while minimizing environmental and economic risks. These results provide science-based recommendations that could substantially improve Chinese cabbage productivity in Tanzania.
Keywords:
Chinese cabbage
; nutrient optimization
; critical nutrient concentration
; fertilizer management
; yield response
1. Introduction
Chinese cabbage (Brassica rapa L. subsp. chinensis), a globally significant leafy vegetable, is prized for its rapid growth, ecological adaptability, and nutrient-dense composition (Artemyeva & Solovyeva, 2006; Kim et al., 2016). As a member of the Brassicaceae family, it is a critical dietary source of vitamins (A, C, K), dietary fiber, and bioactive compounds such as glucosinolates and carotenoids (Lee et al., 2010; Traka, 2016). Its high water content (94–95%) and low caloric value have cemented its role as a dietary staple across Asia and Europe, with growing demand in Africa driven by urbanization and shifting consumer preferences drive demand for nutrient-rich vegetables (Larkcom, 2008; Everaarts et al., 2017; Afari-Sefa et al., 2016). However, its cultivation in resource-limited tropical regions like Tanzania faces critical agronomic challenges, primarily due to suboptimal nutrient management, which significantly affects yield potential, crop quality and stress resilience (Marschner, 2012; Fageria et al., 2011).
Globally, Chinese cabbage achieves yields exceeding 80–100 t ha⁻¹ under precision nutrient regimes in temperate zones, where balanced nitrogen (N), phosphorus (P), and potassium (K) applications sustain its high biomass turnover (Lee et al., 2010; Magnusson, 2014; Zhang et al., 2017). Even in tropical regions, improved practices such as split fertilization and micronutrient supplementation enable yields of 30–50 t ha⁻¹ (Chuan et al., 2019; Saha et al., 2020). In stark contrast, Tanzania’s yields average a dismal 5.1 t ha⁻¹, largely due to nutrient mismanagement compounded by acidic soils, erratic rainfall, and reliance on generic fertilizer recommendations (Everaarts et al., 2017; Hashim et al., 2018; Masso et al., 2017). The crop’s shallow root system intensifies these challenges, limiting access to subsoil nutrients and heightening dependence on precise topsoil fertilization (Pasakdee et al., 2006; White et al., 2013).
Insufficient soil nutrients are the root cause behind low yields, food insecurity, and poverty in African smallholder agricultural systems reliant on natural soil fertility (Barrett & Bevis, 2015). Replenishing depleted nutrients in a balanced manner is crucial to sustain crop production, especially in low-input agricultural setups. Despite the 2006 Abuja Declaration urging a rise in fertilizer application to 50 kg ha−1 by 2015, most Sub-Saharan African (SSA) smallholder farmers still use minimal to no fertilizers (NEPAD CAADP, 2011). In Tanzania, fertilizer consumption averages 16.4 kg ha−1, considerably lower than the SSA average of 22.5 kg ha−1 and the global average of 136.9 kg ha−1 (World Bank Group, 2021). This low fertilizer use leads to nutrient depletion in Tanzanian agricultural soil, causing deficiencies in vital macronutrients across over 70% of farmland fields (Amuri, 2015). Moreover, there’s emerging evidence of poor responses to NPK application (nitrogen, phosphorus, and potassium fertilizers) in SSA (Roobroeck et al., 2021). Factors contributing to this poor response include deficiencies in other macronutrients like calcium and sulfur (Kihara et al., 2017), low soil pH, reduced soil organic matter (SOM), and physical soil limitations. Soil organic matter plays a crucial role in enhancing soil fertility by augmenting nutrient concentrations and availability while creating optimal chemical and physical conditions for plant growth (Gerke, 2022; Lucas & Weil, 2012; Mandal et al., 2022). Identifying the chemical and physical constraints limiting yield growth is pivotal to effectively using fertilizers to provide essential nutrients and ultimately boost agricultural productivity in SSA.
Macronutrients, primarily nitrogen (N), phosphorus (P), and potassium (K), play an essential role in plant growth, metabolic functions, and overall yield performance (Havlin et al., 2020). Nitrogen is a fundamental component of chlorophyll, amino acids, and nucleotides, which drive photosynthesis and vegetative growth in leafy vegetables such as Chinese cabbage (Zhang et al., 2021). However, excessive nitrogen can lead to unbalanced growth, making plants more susceptible to pests and diseases while reducing nutrient use efficiency (NUE) (Marschner, 2012; Sun et al., 2022). Adequate nitrogen supply promotes leaf development and enhances photosynthetic capacity, leading to increased biomass (Marschner, 2012). However, excessive nitrogen can result in lush vegetative growth with reduced root development and increased susceptibility to pests and diseases (Krężel & Kołota, 2008; Chuan et al., 2019). Phosphorus is crucial for root development, ATP synthesis and nucleic acids, and energy transfer processes, which are essential during the early growth stages of Chinese cabbage (Huang et al., 2023). It supports early plant vigor and nutrient uptake efficiency. Deficiency in phosphorus can lead to stunted growth and delayed maturity, particularly in acidic soils where phosphorus is often immobilized and eventually affecting overall productivity (Hashim et al., 2018; Kochian et al., 2004; Xu et al., 2021). Potassium (K) is essential for osmotic balance, enzyme activation, and stomatal regulation, contributing to drought tolerance and overall plant health (Hawkesford et al., 2012; Niemieca & Komorowska, 2018). Potassium deficiencies impair photosynthesis and water regulation, reducing overall yield and quality (Amuri et al., 2017; Li et al., 2022). Beyond the primary macronutrients, secondary nutrients such as calcium (Ca), magnesium (Mg), and sulfur (S) also play significant roles in enhancing Chinese cabbage growth. Calcium strengthens cell walls, reducing the incidence of physiological disorders such as tip burn, while magnesium is the central atom in chlorophyll, directly influencing photosynthesis efficiency (Baitilwakea et al., 2011; Marschner, 2012; Wang et al., 2023). Sulfur contributes to the synthesis of amino acids and glucosinolates, which enhance the characteristic flavor and health benefits of vegetables (Tang et al., 2021).
While required in small quantities, micronutrients are indispensable for plant metabolic functions. Boron (B) is essential for cell wall formation, membrane integrity, and reproductive development. Boron deficiency can cause distorted leaf growth, poor root elongation, and reduced yield (Hashim et al., 2018; Cheng et al., 2022). Zinc (Zn) plays a crucial role in enzyme activation, auxin synthesis, and overall metabolic functions, making it crucial for leaf expansion and stress tolerance and chlorophyll production (Amuri et al., 2017; Liu et al., 2024). Iron (Fe) is integral to chlorophyll synthesis and electron transport in photosynthesis, with deficiencies leading to interveinal chlorosis and reduced photosynthetic efficiency (Alloway, 2008; Rengel, 2015; Zhou et al., 2023). Manganese (Mn) supports enzyme functions related to nitrogen metabolism and photosynthesis, while copper (Cu) aids in lignin synthesis and stress tolerance (Havlin et al., 2016). Recent studies have also highlighted the importance of selenium (Se) in enhancing the antioxidant system of Chinese cabbage, improving oxidative stress tolerance and plant resilience (Chuan et al., 2019; Saha et al., 2020; Fang et al., 2024).
In Morogoro, Tanzania, a major peri-urban production zone for leafy vegetables, soils exhibit severe limitations, including low pH (4.5–5.5), poor organic matter content (<1.5%), and deficiencies in essential macro- and micronutrients (Msanya et al., 2003; Bünemann et al., 2018). These soil constraints restrict nutrient availability and uptake efficiency, necessitating precise nutrient management strategies (Amuri et al., 2017). Farmers’ adherence to blanket fertilization practices (e.g., “5 g per hill”), such as the application of uniform NPK rates without considering soil variability, exacerbates nutrient imbalances, leading to inefficient fertilizer use and yield stagnation (Masso et al., 2017; Baitilwakea et al., 2011; Niemieca & Komorowska, 2018; Tittonell et al., 2008). Such practices not only depress yields but also degrade soils through leaching and toxicity, undermining sustainability (Vitousek et al., 2009). For instance, acidic soils in Morogoro immobilize P by forming insoluble Al/Fe-phosphate complexes, rendering even applied P unavailable to plants (Hashim et al., 2018; Kochian et al., 2004). Low soil pH generally increases the solubility of Zn and Fe, but excessively acidic conditions can still lead to deficiencies due to root toxicity, nutrient imbalances, and leaching, ultimately impairing Chinese cabbage’s metabolic efficiency (Rengel, 2015; Kochian et al., 2015).
Sustainable intensification of Chinese cabbage production hinges on optimizing nutrient use efficiency (NUE) the ratio of yield output to fertilizer input while minimizing ecological harm (Dobermann et al., 2003; Marschner, 2012). Critical nutrient concentrations, defined as the minimum soil or plant tissue nutrient levels required to achieve 90–95% of maximum yield, provide a science-based framework for precision fertilization (FAO, 2020). Globally, studies have established crop-specific thresholds for N (150–200 kg ha⁻¹), P (50–80 kg ha⁻¹), and K (100–150 kg ha⁻¹) in temperate systems (Lee et al., 2010; Krężel & Kołota, 2008). However, these values are rarely transferable to tropical regions, where distinct soil chemistry, microbial activity, and climatic stressors alter nutrient dynamics (Hashim et al., 2018). High rainfall in Morogoro accelerates leaching of nitrate-N and exchangeable K, necessitating higher basal applications to maintain sufficiency (Amuri et al., 2017; Rockström et al., 2017). This study addresses these challenges by investigating the interplay of macro- and micronutrient dynamics in Morogoro’s production systems, aiming to establish critical nutrient concentrations that enhance yield, nutrient use efficiency, and sustainable production of Chinese cabbage in Tanzania.
Chemical fertilizers are essential for increasing crop yields and ensuring food security, contributing up to 50% of yield improvement. However, excessive and unbalanced fertilizer use leads to increased production costs and environmental concerns, necessitating more efficient fertilization strategies. To address these issues, precision fertilization has been promoted, considering soil conditions, crop yield potential, and nutrient management to optimize fertilizer use. In China, vegetables, particularly Chinese cabbage (Brassica chinensis L.), play a significant role in agriculture, with a planting area of 2.64 million hectares in 2017, accounting for 13.21% of the total vegetable area. However, excessive fertilization practices have led to low nutrient use efficiency and minimal economic benefits. Various fertilization recommendation methods, such as soil testing, fertilizer effect functions, and site-specific nutrient management, have been explored, though challenges remain in their practicality, cost, and time efficiency for smallholder farmers.
An alternative approach is fertilizer recommendation based on yield response and agronomic efficiency, which does not require extensive soil testing and can be applied quickly based on specific plot conditions. This method accounts for soil nutrient supply, crop nutrient demand, and local production conditions to determine appropriate fertilizer rates. It has been successfully implemented for maize (Zea mays L.), wheat (Triticum aestivum L.), rice (Oryza sativa L.), soybean (Glycine max L.), potato (Solanum tuberosum L.), and radish (Raphanus sativus L.), demonstrating improved fertilizer efficiency, reduced nitrogen and phosphorus overuse, and increased farmer profitability. However, its application in Chinese cabbage remains unexplored, requiring further research to establish crop-specific nutrient parameters. Developing an independent fertilization recommendation system for Chinese cabbage is crucial for optimizing yield, enhancing nutrient use efficiency, and balancing economic and environmental benefits in intensive production systems.
2. Material and Methodology
2.1. Location and Climatic Condition of the Study Area
This study was conducted at the Sokoine University of Agriculture (SUA) Department of Soil and Geological Sciences (DSGS) training farm, located in Morogoro Municipality, Tanzania (Figure 2). The DSGS training farm lies at coordinates 6.051150°S, 37.383310°E and sits at an elevation of 540 meters above sea level. The region experiences an average annual rainfall of 800–950 mm and a mean annual temperature of 24 °C (Figure 1). The site is characterized by well-drained kaolinitic clay soils, which are generally low in fertility (Msanya et al., 2003; Kisetu et al., 2013).
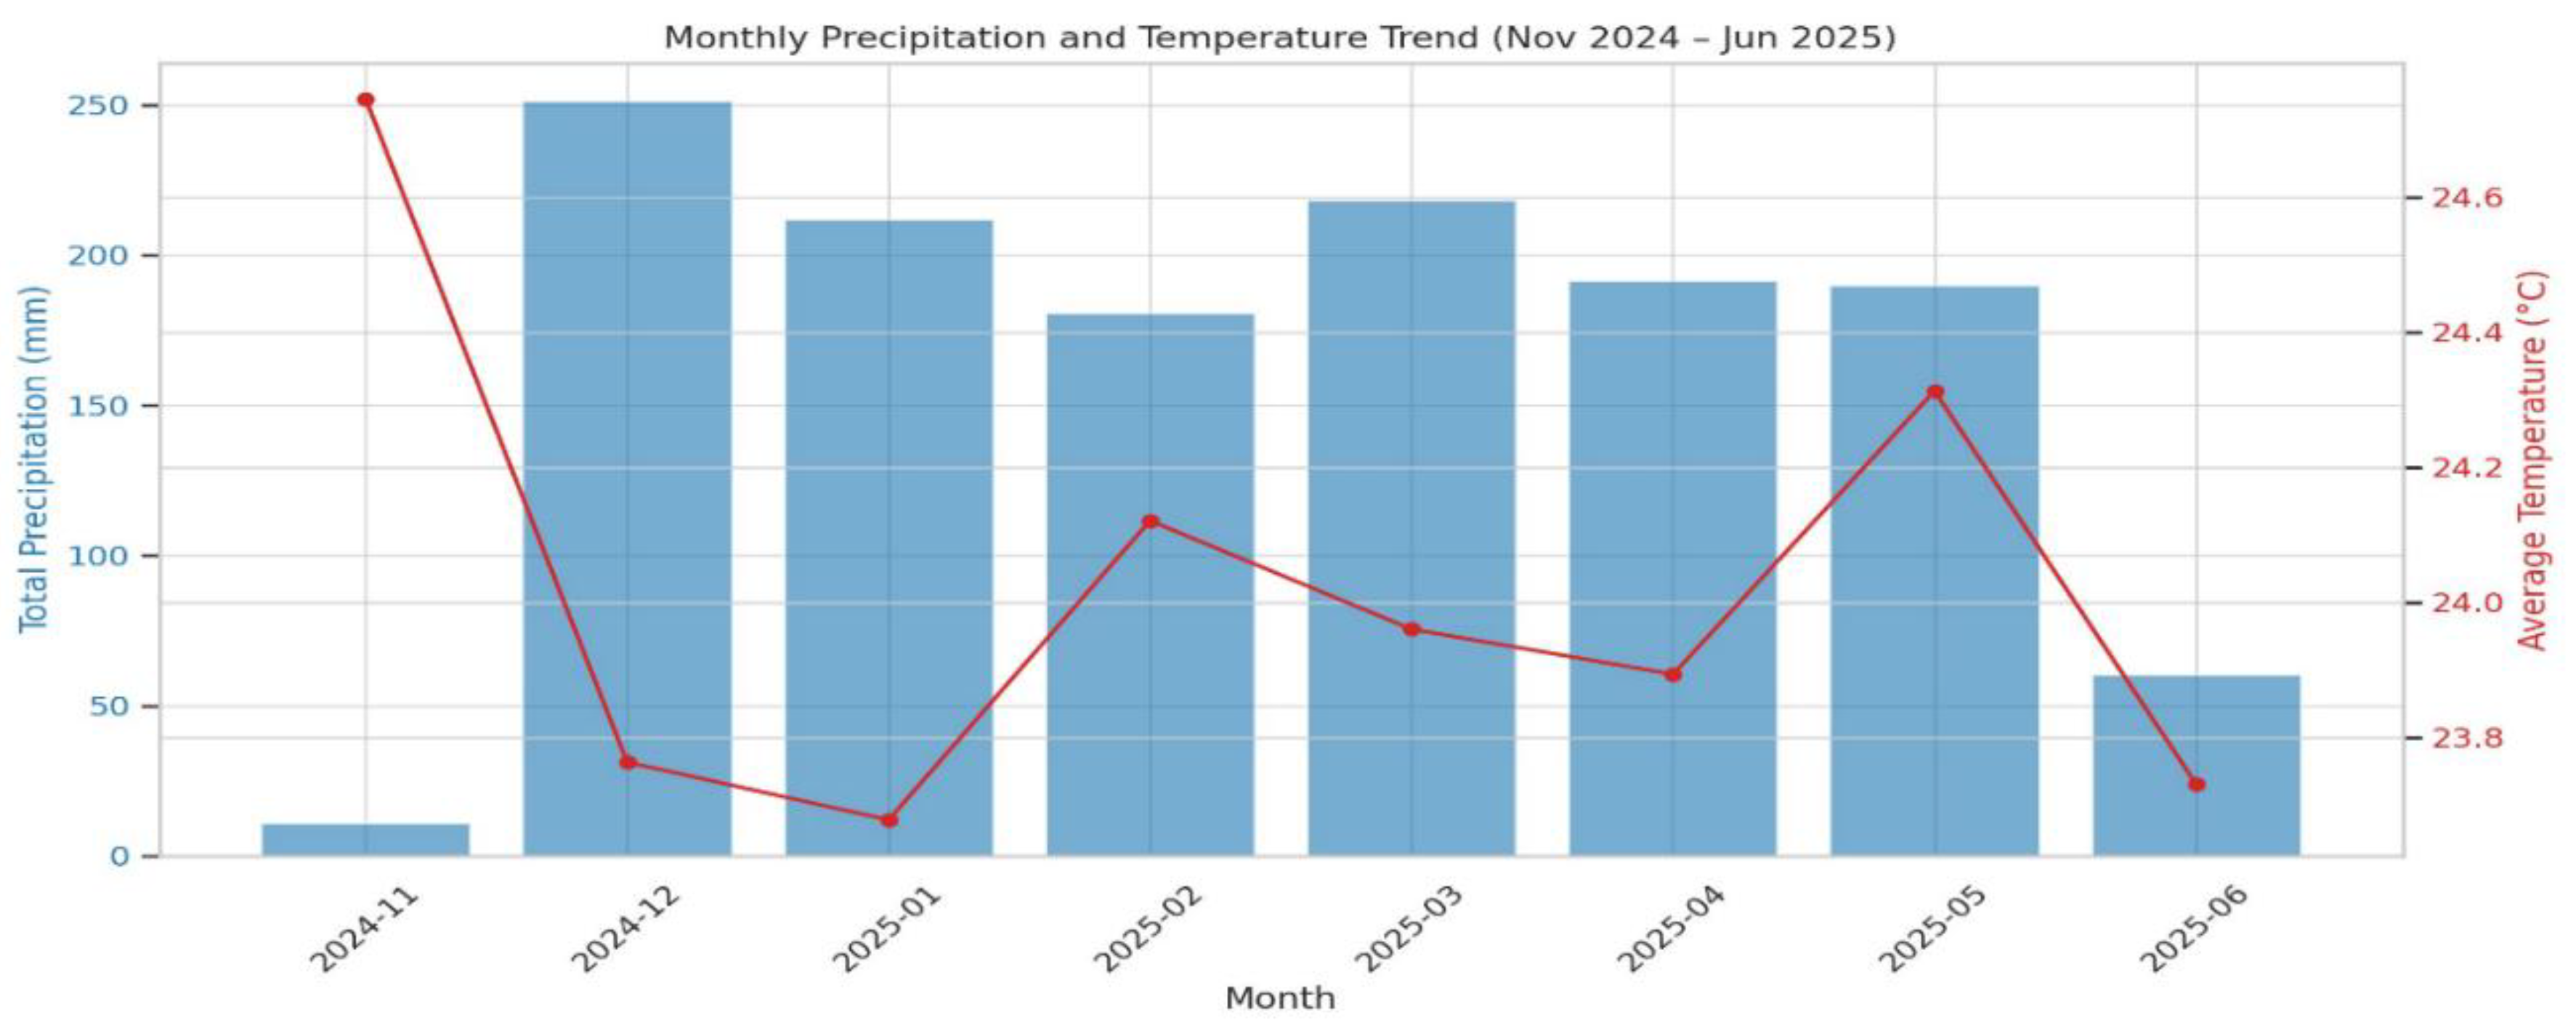
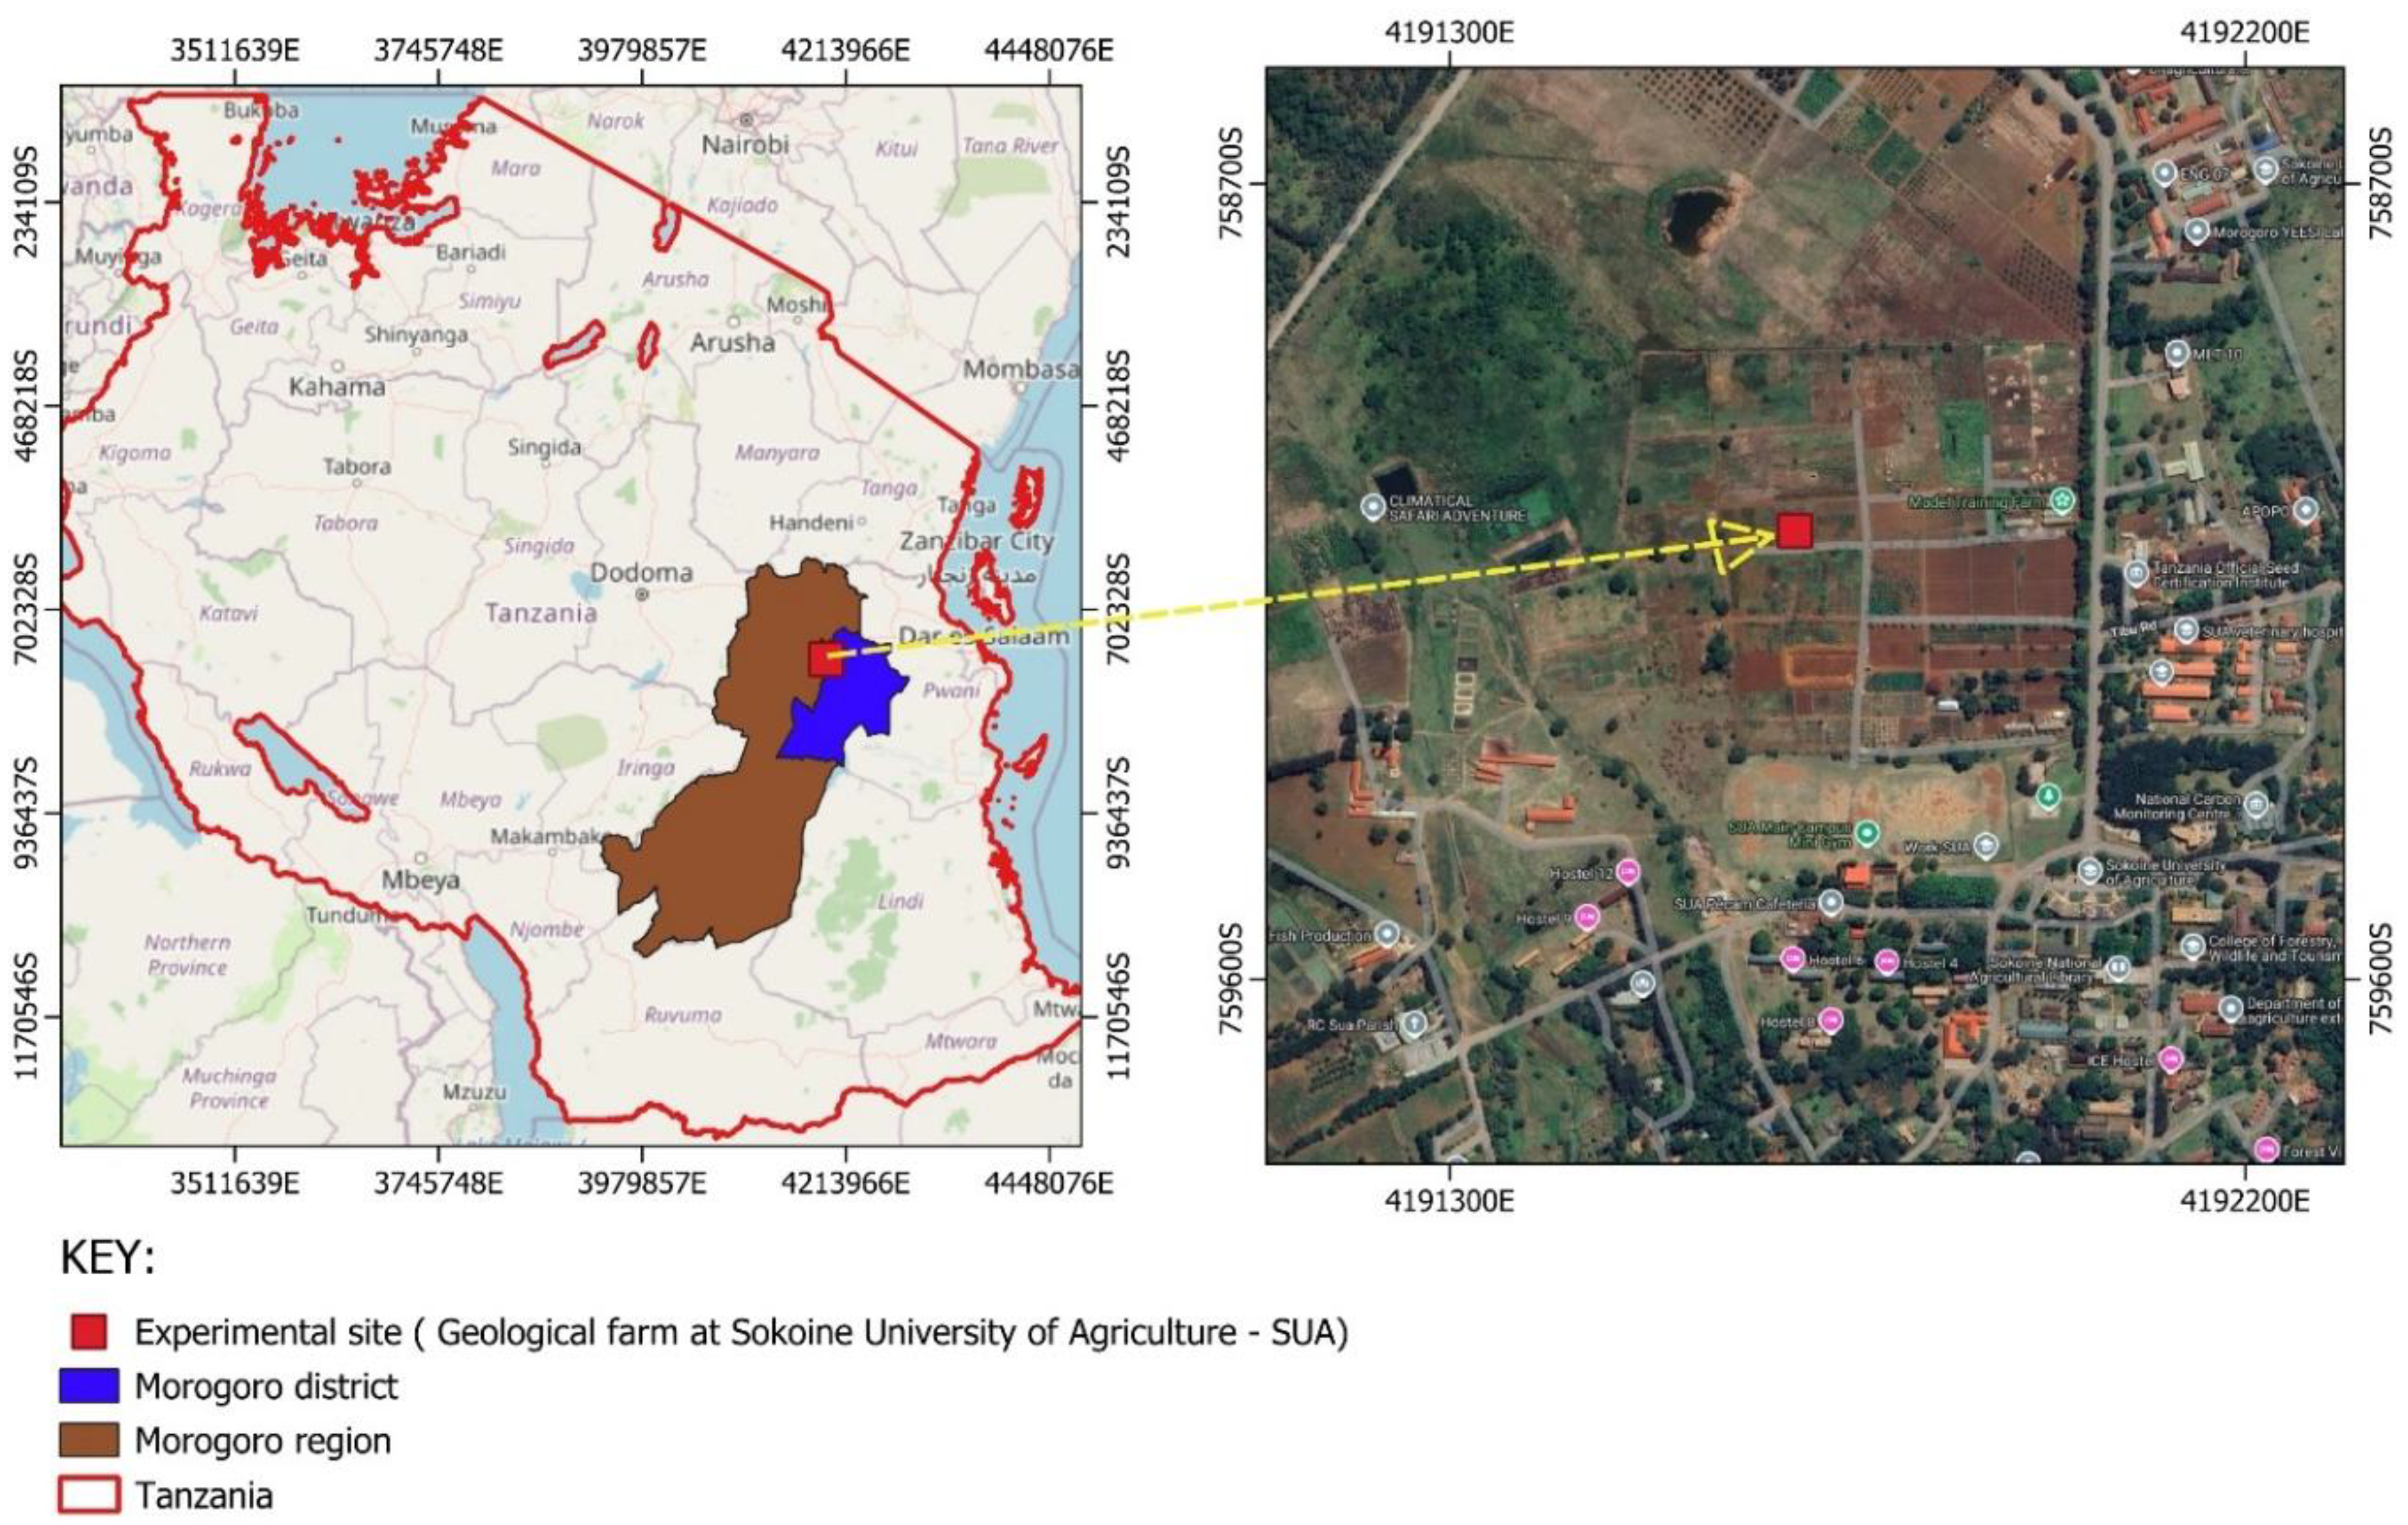
Figure 1.
A map showing the rainfall and temperature recorded during the experiment from November, 2024 to May, 2025.
Figure 1.
A map showing the rainfall and temperature recorded during the experiment from November, 2024 to May, 2025.
Figure 2.
A map showing where the experiment conducted.
2.2. Soil Sampling, Processing and Laboratory Procedures
Soil physical and chemical properties were determined before setting up trials. A soil sample (0–30 cm depth) was collected using a zig-zag pattern over the whole field area using soil auger from 10 spots within the field, which were then thoroughly mixed to get one composite soil sample. At least one kg of composite soil sample, obtained through the quartering procedure, was air-dried, ground, sieved to pass through 2 mm sieve, packed, and labeled for laboratory analysis. A composite sample was transported to Tanzania Coffee Research Institute (TacRi) Moshi station laboratory for the determination of physical and chemical properties following standard procedures.
Particle size distribution was determined by the Bouyoucos hydrometer method (Day, 1965; Moberg, 2001) after dispersing the soils with sodium hexametaphosphate followed by determining textural classes using the USDA textural triangle (Soil Survey Staff 2014). Soil pH in water and electrical conductivity (EC) were measured potentiometrically (Moberg, 2001; Okalebo, et al., 2002) in a soil: water ratio of 1:2.5 weight to volume basis using a soil pH-meter for soil pH and an EC-meter for electrical conductivity. The Walkley and Black wet oxidation method (Nelson and Sommer, 1982) was used to determine soil organic carbon (OC) and values were converted to organic matter (OM) by multiplying OC values by a factor of 1.724 (Duursma & Dawso 1981; Brady & Weil 2017). Total nitrogen (TN) was analysed by the Kjeldahl digestion method (Bremner & Mulvaney 1982). Extractable phosphorus (P) was determined by the Bray and Kurtz-1 method (Bray and Kurtz, 1945) followed by colour development by the molybdenum blue method (Murphy & Riley1962). An ultraviolent visible (UV/VIS) spectrophotometer (Bray and Kurtz, 1945) was used to determine the quantity of available P in the soil. The cation exchange capacity (CEC) and exchangeable bases (Ca+2, Mg+2, K+ and Na+) were extracted by the ammonium acetate (NH4OAc)-pH 7 saturation method (Chapman, 1965; Thomas, 1986) and quantified using an atomic absorption spectrophotometer (AAS) for Ca+2 and Mg+2 (Chapman, 1965; Moberg, 2001) and flame photometer for K+ and Na+ (Chapman, 1965; Moberg, 2001). The adsorbed NH4+ was displaced by K+ using 1 M KCl for the determination of CEC (Chapman, 1965; Thomas, 1986; Van Ranst et al., 1999) by the Kjeldahl distillation method (Bremner & Mulvaney 1982; Moberg, 2001). Extractable sulphur (SO42--S) was extracted using calcium monophosphate [Ca(H2PO4)2.H2O], following the development of particle suspensions (intensity of a beam of light) by the turbidimetric method (Moberg, 2001). An ultraviolent visible (UV/VIS) spectrophotometer was used to determine the quantity of extractable SO42--S in the soil (Chapman, 1965; Moberg, 2001). The diethylene-triamine-penta-acetic acid (DTPA) extracted micronutrients (Cu, Fe, Zn, and Mn) (Lindsay & Norvell 1978; Moberg, 2001) and were quantified using an atomic absorption spectrophotometer (Lindsay & Norvell 1978; Moberg, 2001). The total exchangeable base (TEB) was calculated as the sum of the four exchangeable bases (Ca2+, Mg2+, K+ and Na+) for a given soil sample. The C:N ratio, silt: clay ratio, exchangeable sodium percentage (ESP) and percentage base saturation (BS %) were calculated using formulas (Landon, 1991).
2.3. Experimental Layout and Treatments Application
The field was ploughed using a hand hoe as practiced by smallholder farmers before planting. Plots (1.8 × 1.2 m) were established at 30 × 60 cm spacing, with two seeds sown per hill and thinned to one plant post-emergence. A randomized complete block design (RCBD) with three replications was employed on two parallel fields across two growing seasons dry (from November 2024 to January 2025) and rainy (from February to April 2025) to account for seasonal variability. Treatments included: 0, 75, 150, 225, 300, 375, 450 kg N ha⁻¹ (Urea), P: 0, 30, 60, 90, 120, 150, 180 kg P ha⁻¹ (Triple Superphosphate (TSP)), and 0, 60, 120, 240, 280, 340, 400 kg K ha⁻¹ (Muriate of Potash (MoP)). All limiting nutrients were identified based on soil-test results and adjusted to optimum (non-limiting) levels by applying fertilizers to ensure that only one test nutrient varied at a time. All P (from TSP), K (from MoP) and half of N (from Urea) were applied at planting time and the remaining N top-dressed at 21 days after planting. Standard agronomic practices for irrigation, weed, and pest control were followed to ensure good crop growth.
2.4. Data Collection
2.4.1. Growth
To mitigate potential border effects, the harvest of Chinese cabbage was executed by preserving a 0.5 m stretch along each periphery of the experimental plot. A randomized selection protocol was enacted for the retrieval of plants from each field plot; subsequently growth parameters were assessed weekly starting from 21 days after planting (DAP) to monitor vegetative development and assess treatment effects on morphological traits (Adediran et al., 2022). These included plant height (cm) measured from the base to the tip of the tallest leaf using a meter ruler. Leaf length and width (cm) measured from six randomly selected plants per plot using a ruler (Singh et al., 2021). Number of leaves per plant counted manually.
2.4.2. Biomass and Yield Parameters
To assess crop response to added fertilizer nutrients, 6 plants (harvestable parts) were sampled weekly from 42 DAP in each field plot. These yield-related parameters recorded included fresh weight (g) measured immediately after harvesting using portable electronic scale. They were first washed with tape water, and then rinsed with distilled water in order to decontaminate them from dusts and pesticide applied and left in the screen house for 72 hours for air-drying. They were then dried in the oven at 65 0C for 48 hours to a constant weight for dry matter (%) and moisture content (%) determination using the formula outlined below. They were further cut by micro-hammer stainless steel and grinded in the Wiley micro-mill to attain finely specimens, requisite for the determination of nutrient concentration.
Nitrogen concentration (%) was quantified using Kjeldahl method while phosphorus and potassium were determined using the dry-ash method and finally quantified by colorimetric (UV-VIS Spectrophotometer) and flame photometry methods for P and K, respectively (Havlin et al., 2014; AOAC, 2019).
Final yield (t/ha) was computed by extrapolating the fresh biomass from each plot to hectare basis, while relative yield was calculated using the formula below:
2.5. Data Analysis
The collected data were subjected to statistical analysis to determine the effects of the fertilizer treatments. An analysis of variance (ANOVA) was performed to test for significant differences among the treatment means using GenStat 15th edition. The Tukey’s Honestly Significant Difference (HSD) test was used for post-hoc comparisons to separate treatment means at a significance level of p ≤ 0.05. The coefficient of variation (CV) was also calculated for each measured parameter to assess the degree of variability within the experiment. Microsoft excel (2016) was used to generate some graphics. However, response curves for N, P, and K were generated using quadratic regression models to determine critical nutrient concentrations and optimal fertilizer application rates for maximum yield and nutrient use efficiency.
3. Results
3.1. Fertility Status of the Experimental Site
The physico-chemical properties of the soil at the experimental site are summarized in Table 1. The soil reaction (pH 5.01 in H₂O, 1:2.5) indicated a strongly acidic condition. The electrical conductivity (EC) was 226 µS cm⁻¹, which is very low and indicates a non-saline soil suitable for vegetable production. Organic carbon (1.8%) and organic matter (3.10%) were medium, suggesting moderate nutrient supply capacity. Total nitrogen (0.14%) was low, indicating insufficient native N for high-yielding crops, but the C:N ratio of 12.86 reflected good-quality organic matter. Available phosphorus (2.24 mg kg⁻¹) was very low, requiring P fertilization, whereas available sulphur (39.2 mg kg⁻¹) was very high, ensuring adequate S supply. Exchangeable potassium (0.95 Cmol(+) kg⁻¹) and magnesium (3.51 Cmol(+) kg⁻¹) were high to very high, while calcium (0.63 Cmol(+) kg⁻¹) was medium and sodium (0.19 Cmol(+) kg⁻¹) was low. Cation exchange capacity (7.28 Cmol(+) kg⁻¹) was low, with a base saturation of 72.53%, indicating moderate nutrient-holding capacity. The Ca:Mg ratio was unfavourable, while the K:Mg ratio was adequate for vegetable growth. Micronutrients Cu (2.66 mg kg⁻¹), Fe (34.36 mg kg⁻¹), and Mn (45.55 mg kg⁻¹) were very high, while Zn (0.92 mg kg⁻¹) was medium. The soil texture was classified as clay, with 54.12% clay, 9.64% silt, and 36.24% sand, reflecting moderate water-holding capacity and good nutrient retention, though with a risk of phosphorus fixation under poor drainage. Some of the physical and chemical properties of the surface soil (0-30 cm) analyzed before fertilizer applications are as presented in Table 1.
3.2. Growth Performance of Chinese cabbage under Different Fertilizer Treatments
3.2.1. Plant Height Response to Fertilizer Treatments Across Seasons
Plant height of Chinese cabbage exhibited significant variation across fertilizer treatments and days after planting (DAP) in both cropping seasons (November 2024–January 2025 and March–May 2025). In the first season, plant height increased progressively with time, with statistically significant differences among treatments at 21, 28, 35, and 42 DAP (p < 0.05). The tallest plants at 42 DAP were recorded under treatment T₁₃ (N₂₂₅P₁₂₀K₂₄₀), with an average height of 38.44 cm. This was followed by T₁₂ (N₂₂₅P₉₀K₂₄₀) and T₁₅ (N₂₂₅P₁₂₀K₁₂₀), which attained 37.88 cm and 37.67 cm, respectively. The control (T₁: N₀P₀K₀) consistently recorded the shortest plants, measuring only 21.67 cm at 42 DAP.
During the second cropping season (March–May 2025), a similar pattern of increasing plant height with time was observed. However, treatment differences at 21 DAP were not statistically significant (p = 0.093), due to limited nutrient uptake during early crop establishment. At this stage, root systems may not have fully developed, and plant reliance on residual or seed nutrients may have minimized detectable treatment effects. Nevertheless, treatment differences became statistically significant at 28, 35, and 42 DAP (p < 0.05), demonstrating enhanced plant response as root systems matured and nutrient assimilation increased. The tallest plants at 42 DAP were again observed under T₁₂ (38.73 cm), followed by T₁₇ (37.87 cm) and T₁₆ (36.89 cm). The control treatment remained the least effective, recording only 24.58 cm at 42 DAP.
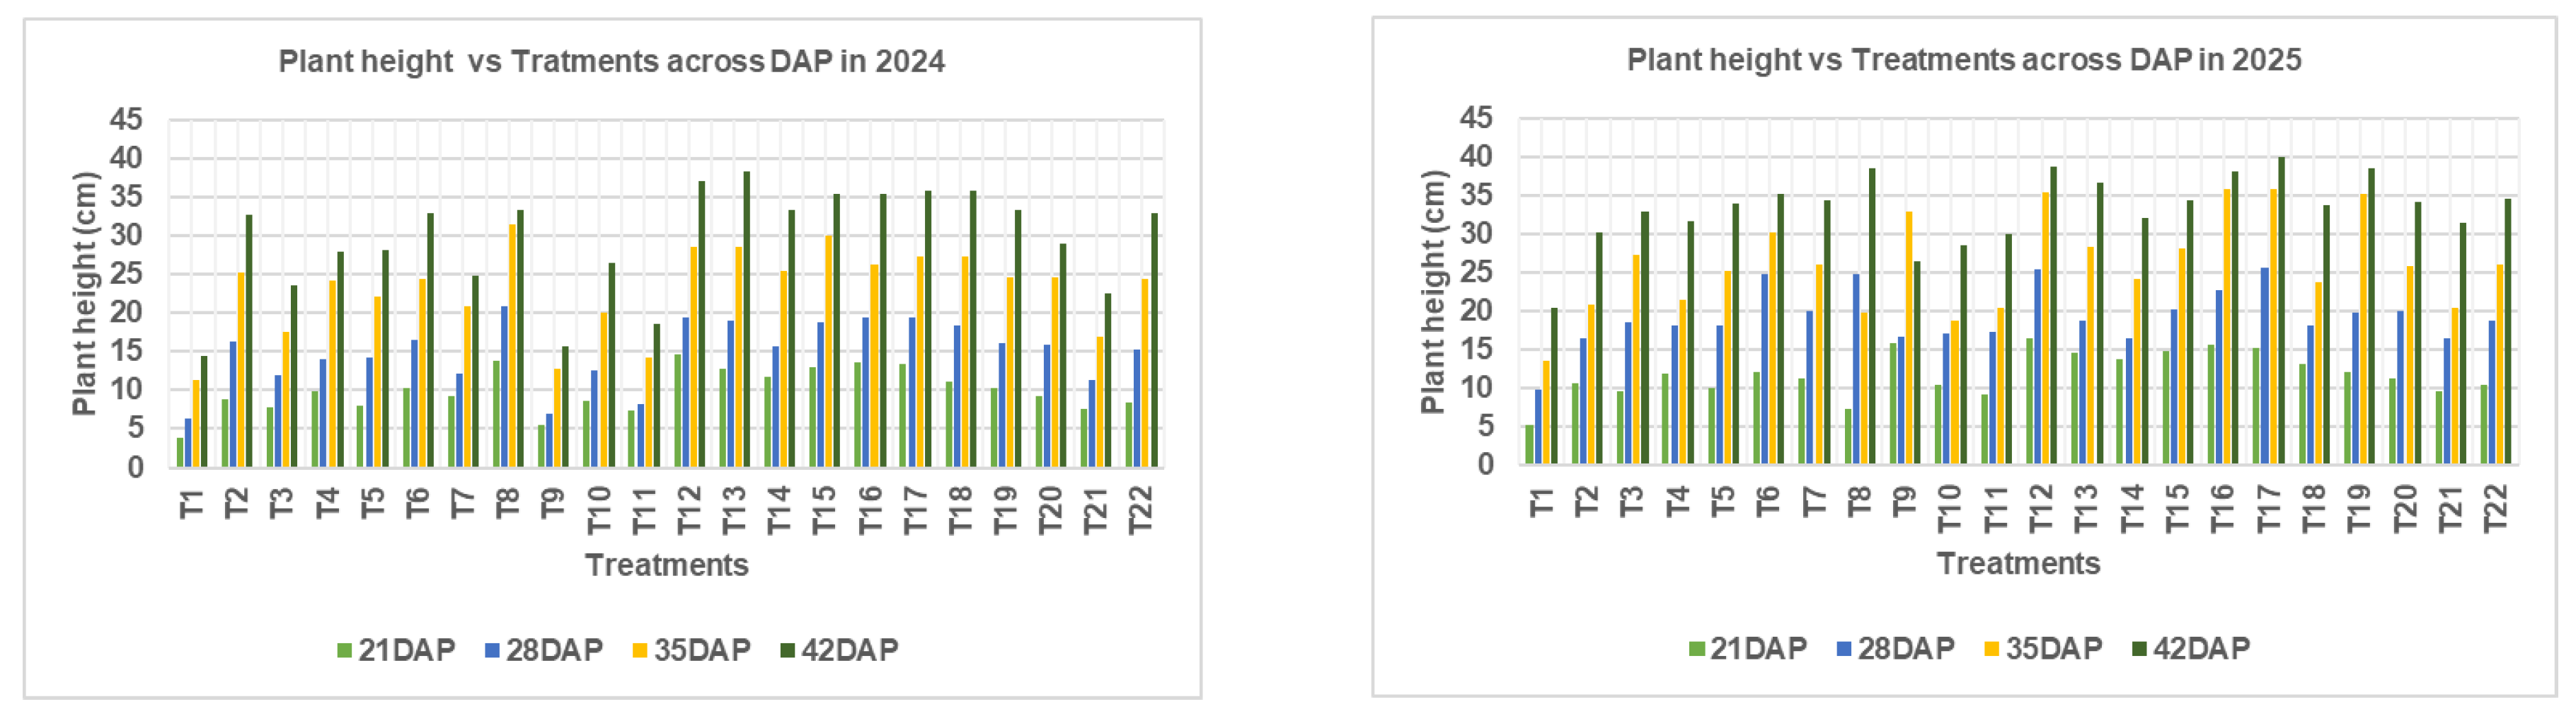
Figure 3.
Plant height of Chinese cabbage at 21, 28, 35, and 42 days after planting (DAP) under different NPK fertilizer rates during the 2024/2025 cropping seasons in Morogoro, Tanzania.
Figure 3.
Plant height of Chinese cabbage at 21, 28, 35, and 42 days after planting (DAP) under different NPK fertilizer rates during the 2024/2025 cropping seasons in Morogoro, Tanzania.
3.3. Leaf Count Response to NPK Fertilizer Application
The leaf count of Chinese cabbage showed significant variation across different NPK fertilizer treatments and sampling periods during both growing seasons (November 2024–January 2025 and February 2025–May 2025). During the first season, leaf count showed progressive increase from 21 DAP to 42 DAP across all treatments. At 21 DAP, leaf count ranged from 2 leaves (T1: N₀P₀K₀) to 7 leaves (T12: N₂₂₅P₉₀K₂₄₀), with most treatments producing 4-6 leaves. The statistical analysis revealed non-significant differences at 21 DAP (p = 0.056), indicating uniform early establishment across treatments. This was attributed to limited early nutrient uptake and physiological similarities in seedling establishment across treatments. At 28 DAP, significant treatment differences emerged (p < 0.05), suggesting that nutrient effects began to manifest as plants progressed into active vegetative growth. At 28 DAP, the control treatment (T1) maintained only 3 leaves, while the highest performing treatment T8 (N450P60K240) achieved 9 leaves. Notable high-performing treatments included T2 (N0P60K240) with 7 leaves, T4 (N150P60K240) with 7 leaves, and T12 (N225P90K240) with 9 leaves. By 35 DAP, treatment differences became more pronounced (p = 0.009), with leaf counts ranging from 4 leaves in the control to 11 leaves in treatments T8 (N450P60K240) and T12 (N225P90K240). The phosphorus effect was evident, with T12 (N225P90K240) showing superior performance compared to other P rates. At final harvest (42 DAP), highly significant differences were observed (p = 0.002). The control treatment (T1) produced only 4 leaves, while the best performing treatments achieved 14 leaves: T6 (N300P60K240), T13 (N225P120K240), and T18 (N225P60K120). Treatments combining higher phosphorus and moderate to high potassium (e.g., T12, T13, T15, T17, and T18) consistently outperformed others, suggesting a synergistic effect on leaf formation.
The second season showed different growth patterns, with generally higher initial leaf counts but responses that are more variable. At 21 DAP, leaf counts ranged from 4 to 9 leaves, with significant treatment effects (p = 0.029). The control treatment (T1) produced 4 leaves, while T12 (N225P90K240) and T17 (N225P60K60) achieved 9 leaves each. At 28 DAP, treatment T6 (N300P60K240) showed exceptional performance with 12 leaves, followed by T4 (N150P60K240) and T8 (N450P60K240) with 11 leaves each. The statistical significance was maintained (p = 0.011), indicating consistent treatment effects. Outstanding treatments included T16 (N225P60K0) with 15 leaves and T18 (N225P60K120) with 16 leaves, suggesting potential potassium interaction effects under different seasonal conditions.
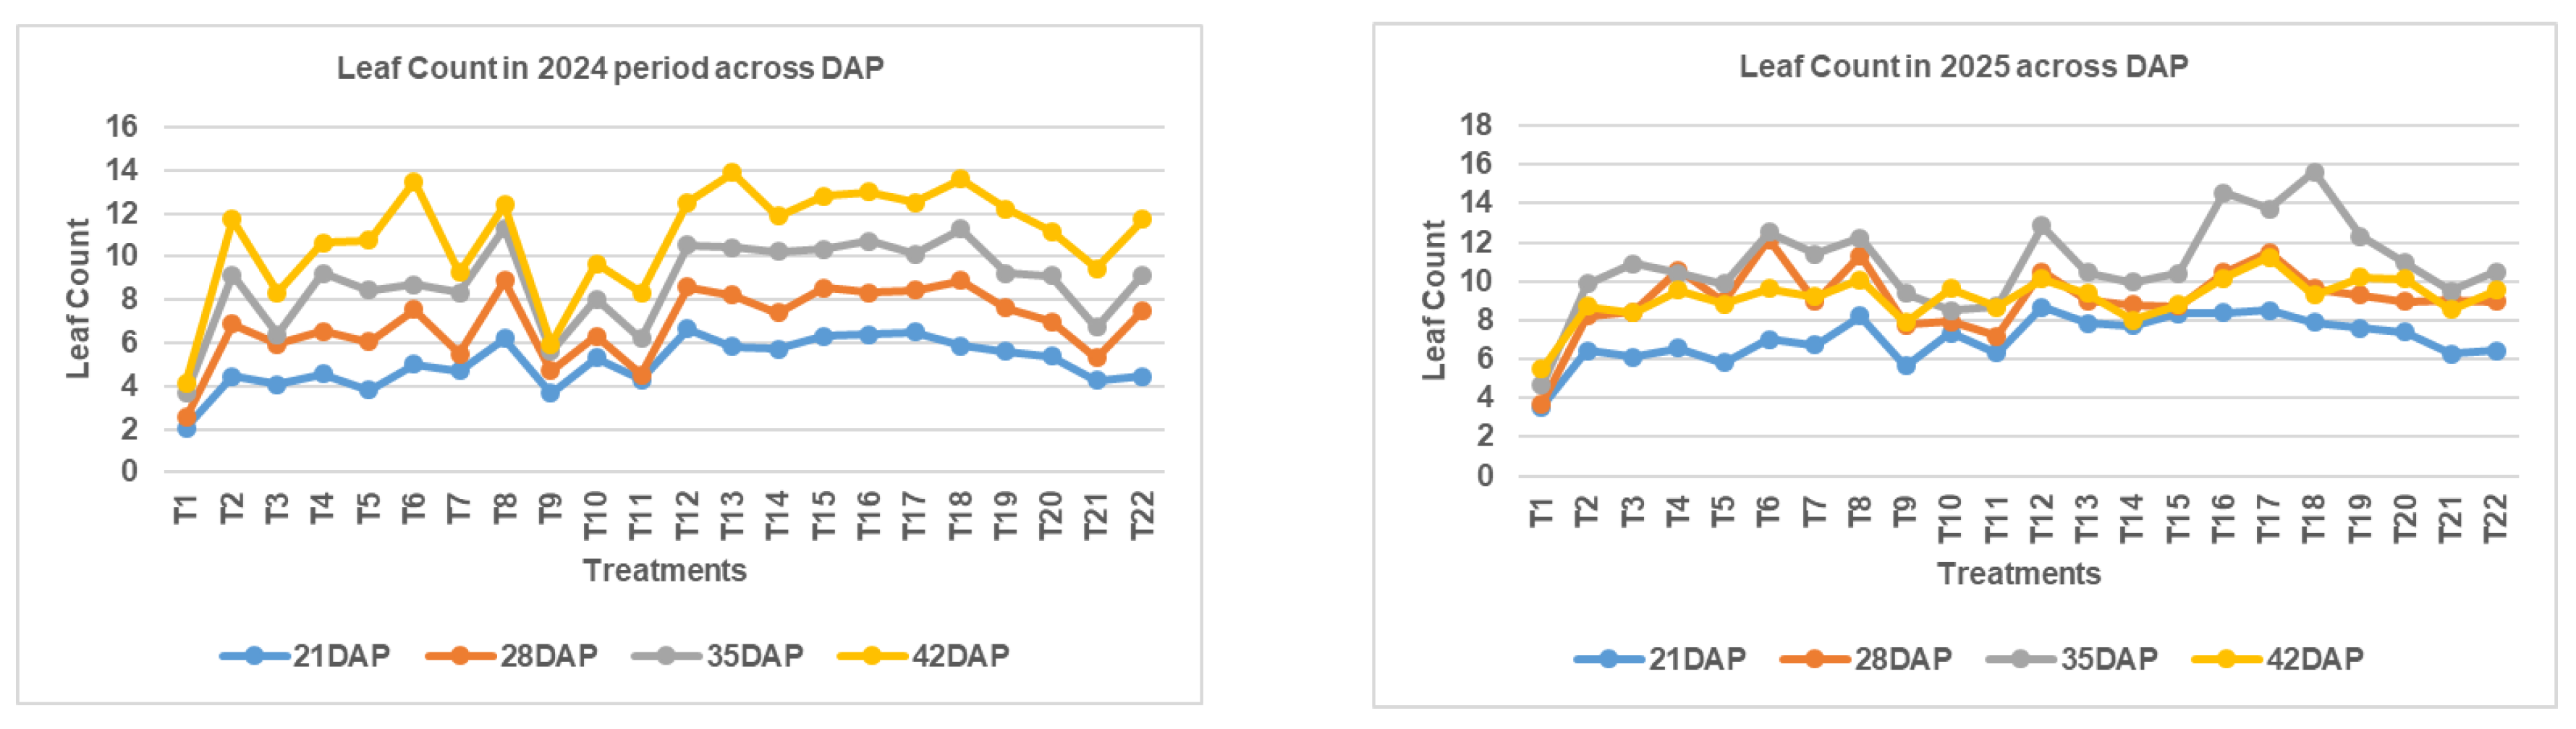
Figure 4.
Leaf count dynamics of Chinese cabbage under different NPK fertilizer treatments across two cropping seasons. Measurements were recorded at 21, 28, 35, and 42 days after planting (DAP). Treatments T12, T13, T17, and T18 showed consistently higher leaf counts across both seasons, indicating the positive effects of higher phosphorus and moderate potassium application.
3.4. Effect of NPK Fertilizer Rates on Leaf Area Index (LAI)
The leaf area index (LAI) exhibited progressive changes across different days after planting (DAP) in both growing seasons (Figure 5). In the November 2024 to January 2025 season, LAI increased with crop age, with considerable variations among treatments. At 21 DAP, the lowest LAI (0.0076) was observed in the control (T₁: N₀P₀K₀), while the highest value (0.4274) was recorded under T₁₆ (N₂₂₅P₆₀K₀). At 28 DAP, T₁₆ also had the highest LAI (1.1378), followed closely by T₁₂ (0.8807) and T₁₃ (0.845). By 35 DAP, the maximum LAI of 2.905 was found in T₈ (N₄₅₀P₆₀K₂₄₀), while T₁₃, T₁₅, and T₁₆ maintained high LAI values above 2.3. At 42 DAP, T₁₃ again showed the highest LAI (5.158), indicating enhanced canopy expansion under N₂₂₅P₁₂₀K₂₄₀. Notably, treatments with elevated phosphorus and potassium levels (e.g., T₁₂ to T₁₅) sustained higher LAI at later stages.
During the second season (February–May 2025), LAI progressively increased across growth stages, with notable variations among treatments. At 21 DAP, the highest LAI was observed in T₁₆ (N₂₂₅P₆₀K₀) at 0.7706, followed by T₁₂ (0.7151) and T₁₇ (0.7212), whereas the control (T₁) recorded the lowest (0.0327). By 28 DAP, T₈ (N₄₅₀P₆₀K₂₄₀) and T₁₂ had the highest LAI values of 2.188 and 2.175, respectively, while T₁₁ and T₁ (0.450 and 0.506) remained low. At 35 DAP, T₁₂ (4.582), T₁₆ (4.592), and T₁₇ (4.915) showed superior performance, suggesting the positive influence of balanced or moderately reduced potassium application. At 42 DAP, T₁₇ maintained the highest LAI (4.378), followed by T₁₆ (4.123) and T₁₉ (3.591), while T₁ and T₉ (2.684 and 1.305) remained among the lowest. Despite the lack of statistical significance (p > 0.05), the biological trends suggest that treatments combining adequate nitrogen and phosphorus with moderate or no potassium (e.g., T₁₂, T₁₆, T₁₇) consistently enhanced canopy development throughout the crop cycle.
3.5. Moisture and Dry Matter Accumulation Trends of Chinese Cabbage
3.5.1. Effect of NPK on Moisture and Dry Matter Contents in 2024 at Maturity Stage
These results highlight the influence of nutrient combinations on physiological water balance and biomass accumulation in Chinese cabbage and suggest that balanced nutrient application can enhance produce quality in terms of dry matter content. Moisture content and dry matter (DM) content varied considerably across the different fertilizer treatments applied to Chinese cabbage during the January 2025 harvest. Moisture content ranged from 62.95% (T₁: N₀P₀K₀) to 92.81% (T₁₃: N₂₂₅P₁₂₀K₂₄₀), whereas dry matter content varied inversely, ranging from 7.19% (T₁₃) to 37.05% (T₁). This inverse relationship between moisture and dry matter content was consistent across treatments, indicating that higher moisture levels are typically associated with lower dry matter accumulation and vice versa
The control treatment (T₁: N₀P₀K₀) recorded the lowest moisture content and the highest dry matter content, suggesting limited vegetative succulence under nutrient-deficient conditions. In contrast, treatments receiving balanced and elevated nutrient inputs, such as T₂ (N₀P₆₀K₂₄₀), T₁₃ (N₂₂₅P₁₂₀K₂₄₀), and T₁₅ (N₂₂₅P₁₈₀K₂₄₀), recorded some of the highest moisture levels (above 92%), with corresponding lower DM values (7.19%–7.52%).
Among treatments with varied nitrogen levels at a constant P₆₀K₂₄₀, T₅ (N₂₂₅P₆₀K₂₄₀) showed a relatively moderate moisture content (71.93%) and high dry matter (28.07%), suggesting an optimal balance for yield and produce storability. Meanwhile, phosphorus variation with constant N₂₂₅K₂₄₀ showed that moderate P rates (e.g., T₁₁: P₆₀) yielded balanced values (88.75% moisture and 11.25% DM), while excessive P (e.g., T₁₅: P₁₈₀) maintained high moisture but low DM (92.56% and 7.44%, respectively). Similarly, increasing potassium rates showed diminishing returns in terms of dry matter accumulation beyond K₁₈₀.
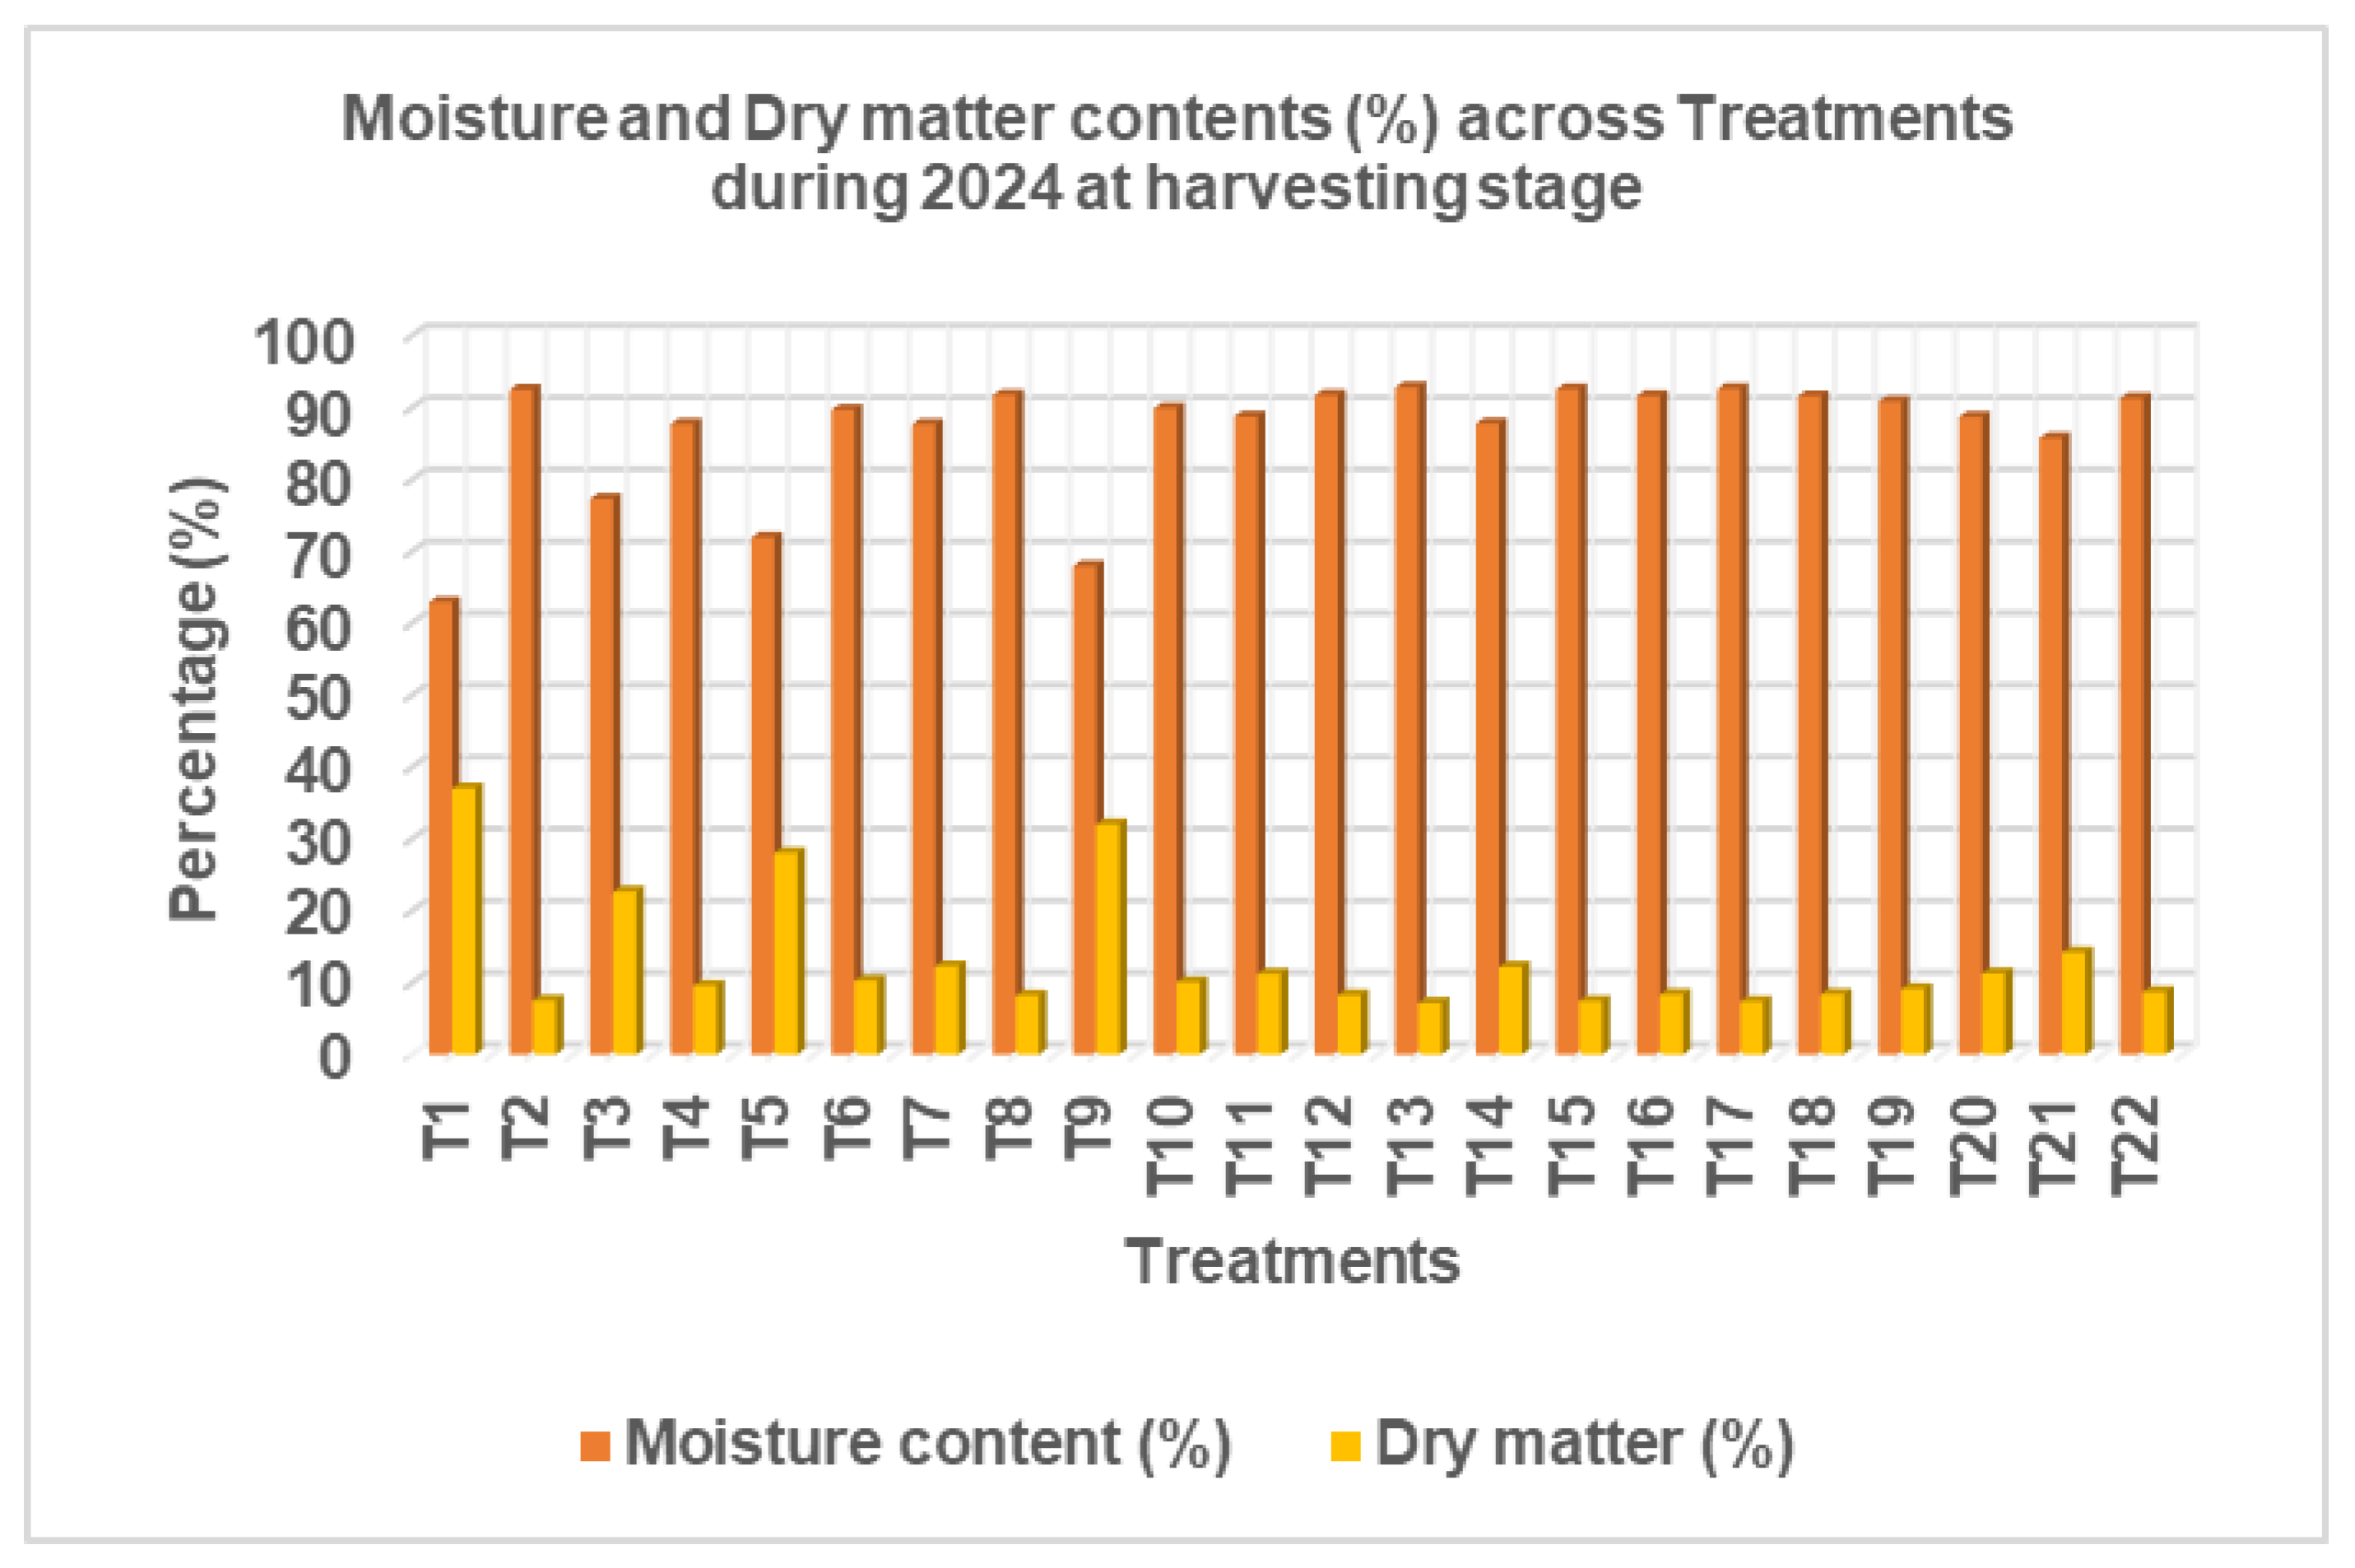
Figure 6.
Moisture and Dry Matter Content of the Crop at Harvesting Stage in 2024 Season.
3.5.2. Effect of NPK on Moisture and Dry Matter Contents in 2025 at Different Harvesting Stages
Moisture content varied significantly among treatments across the three sampling stages (42 DAP, 49 DAP, and at harvest). At 42 DAP, moisture content ranged from 88.67% (N300P60K240) to 98.51% (N225P150K240), with no significant differences (p = 0.66). However, at 49 DAP, moisture content showed a highly significant variation (p < 0.001). The highest value (92.25%) was recorded under N225P60K60, while the lowest (79.32%) was observed under the control (N0P0K0). At harvest, moisture content declined in all treatments, ranging from 71.16% in the control (N0P0K0) to 88.56% in N450P60K240, with significant differences detected (p = 0.046). Overall, moisture content tended to decrease with plant maturity, showing the highest values at 42 DAP and the lowest at harvest. Treatments with higher nitrogen (N ≥ 225 kg ha⁻¹) generally maintained higher moisture content compared to lower-N or control treatments.
Dry matter content showed an opposite trend to moisture, increasing with crop maturity. At 42 DAP, dry matter ranged from 1.49% (N225P150K240) to 11.33% (N300P60K240), but with no significant differences (p = 0.66). At 49 DAP, significant differences were observed (p < 0.001), with values ranging from 7.75% (N225P60K60) to 20.68% (control). At harvest, dry matter increased further, ranging from 11.44% (N450P60K240) to 28.84% (control), with significant treatment effects (p = 0.046). Interestingly, the control (N0P0K0) maintained the highest dry matter percentage across all stages despite having the lowest moisture content at harvest. Conversely, treatments receiving high nitrogen (N300–N450 kg ha⁻¹) showed lower dry matter accumulation, suggesting a dilution effect due to higher water retention in tissues.
The results indicate an inverse relationship between moisture content and dry matter. While higher fertilizer inputs (particularly nitrogen) enhanced moisture retention, this suppressed dry matter accumulation compared to the unfertilized control. The significance at 49 DAP and harvest suggests that nutrient management plays a stronger role in later crop stages than at early growth.
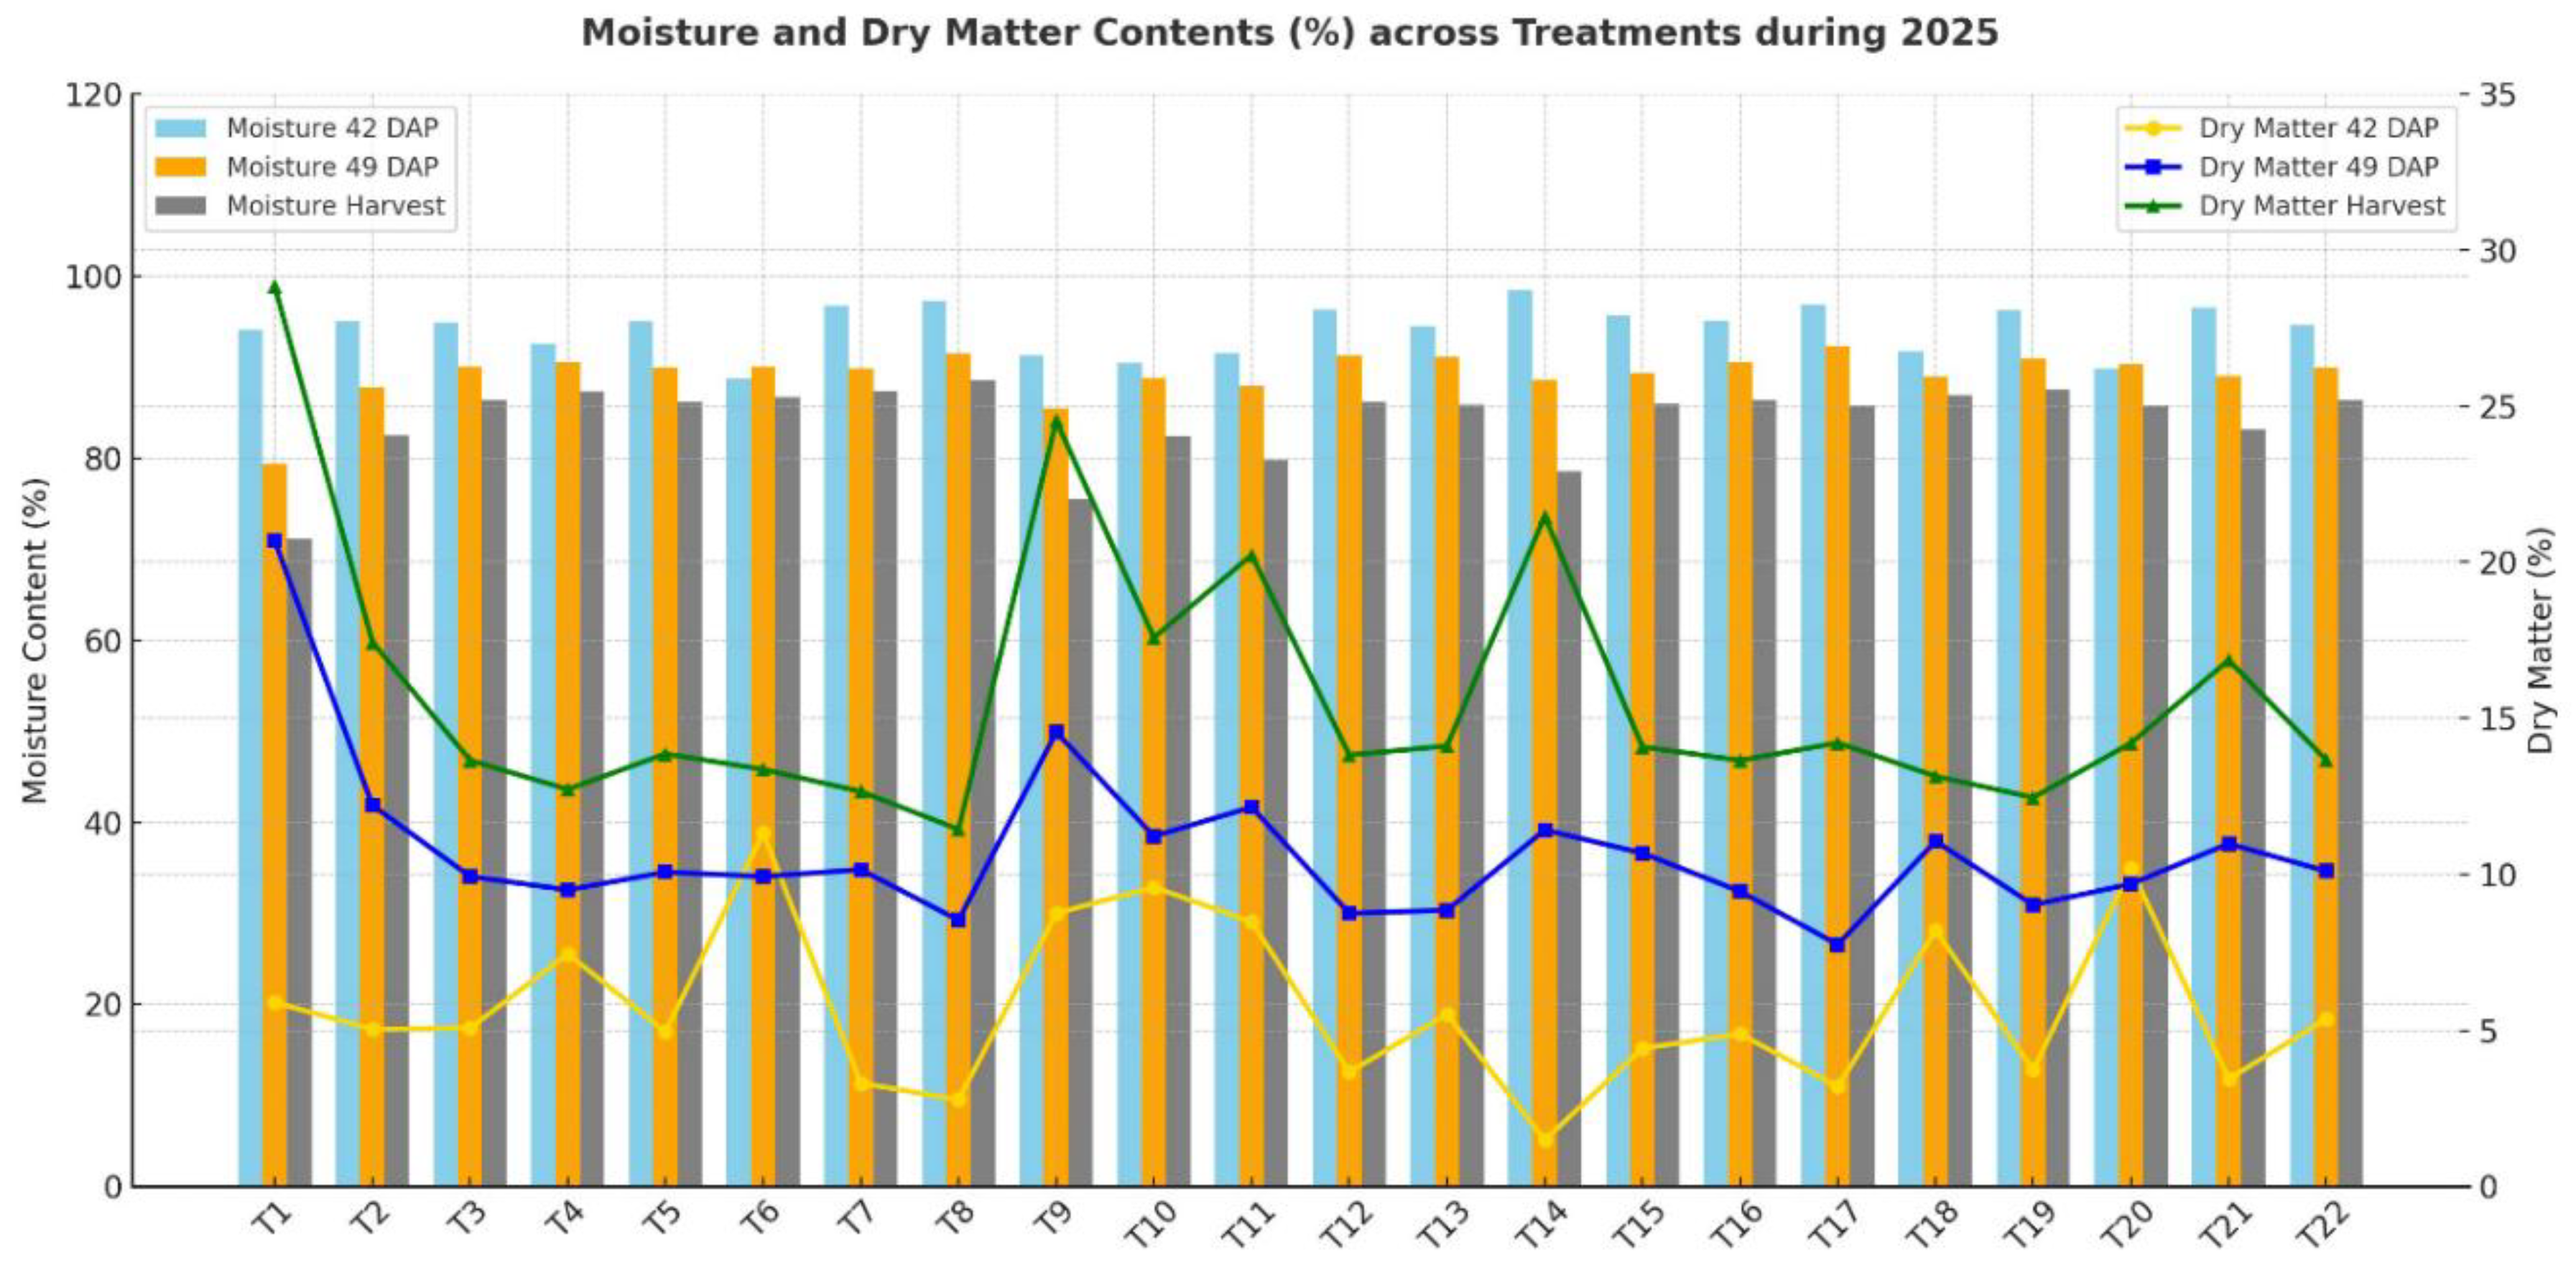
Figure 7.
Moisture and dry matter contents of Chinese cabbage leaves at 42 days after planting (DAP), 49 DAP, and at harvest across different fertilizer treatments. Bars represent moisture content (%) while lines represent dry matter content (%).
Figure 7.
Moisture and dry matter contents of Chinese cabbage leaves at 42 days after planting (DAP), 49 DAP, and at harvest across different fertilizer treatments. Bars represent moisture content (%) while lines represent dry matter content (%).
3.6. Influence of NPK Fertilizer Rates on the Nutrient Concentrations and Uptake of Chinese Cabbage During 2024-2025 Seasons
3.6.1. Phosphorus Concentration and Uptake in Chinese Cabbage
Phosphorus concentration (%) and uptake in Chinese cabbage varied with phosphorus application rates across the 2024 and 2025 seasons (Table 2). Although treatment effects were not statistically significant at the 5% level (p > 0.05), distinct trends were observed. In 2024, P % ranged from 0.04% at P₀ to 0.5203% at P₁₈₀, while uptake increased from 0.0088 g plant⁻¹ (P₀) to a maximum of 0.4502 g plant⁻¹ (P₁₈₀). A gradual increase was noted with increasing P rates, suggesting that higher fertilization enhanced phosphorus accumulation. However, the high coefficient of variation (CV = 123.5% for uptake) indicates strong variability among replications, which may have masked significant differences. In 2025, P % ranged between 0.0587% (absolute control) and 0.3405% (P₁₂₀), while uptake values varied from 0.011 g plant⁻¹ (absolute control) to 0.2218 g plant⁻¹ (P₁₂₀). Unlike 2024, the response pattern in 2025 showed an optimum point around P₁₂₀, beyond which uptake declined. This suggests a saturation effect where additional phosphorus did not translate into higher absorption. When data from both seasons are considered together, the results indicate that phosphorus uptake generally improves with fertilizer application, though the response is not strictly linear. Instead, uptake appears to follow a curvilinear trend, with maximum benefits obtained at P₁₂₀–P₁₈₀ depending on season. This is consistent with nutrient response models where crop uptake initially increases with nutrient supply but plateaus once plant demand is met. Although statistical significance was not achieved, the biological response patterns observed here remain agronomically relevant. The findings imply that phosphorus application up to P₁₂₀ may be sufficient to optimize uptake under the conditions of 2025, while higher rates such as P₁₈₀ may be beneficial under conditions similar to 2024.
Means followed by different superscript letters within the same column are significantly different according to Tukey test at p ≤ 0.05. Uptakes are in g ha-1.
3.6.2. Nitrogen Content and Uptake in Chinese Cabbage for 2024 and 2025 Seasons
Nitrogen (N) content (%) and uptake (g plant⁻¹) of Chinese cabbage varied significantly with different nitrogen application rates in both 2024 and 2025 seasons (Table 2). In 2024, leaf N concentration ranged from 1.073% in the N₄₅₀ treatment to 4.27% in the N₃₀₀ treatment, while N uptake varied from 0.324 g plant⁻¹ in the absolute control to 2.446 g plant⁻¹ in the N₁₅₀ treatment. Statistical analysis indicated that N content was significantly influenced by the applied rates (p = 0.044), although N uptake showed a marginal significance (p = 0.057). The coefficient of variation (CV) was higher for N uptake (61.4%) compared to N content (33.2%), suggesting greater variability in uptake response among the treatments. In the 2025 season, N content ranged from 0.7% in the absolute control to 4.597% in the N₃₀₀ treatment, and N uptake varied between 0.258 g plant⁻¹ in the control and 3.39 g plant⁻¹ in the N₃₀₀ treatment. Both N content and uptake were significantly affected by the application rates (p < 0.001 and p = 0.006, respectively), indicating a stronger response compared to the previous season. The CVs were 17.4% and 48.8% for N content and uptake, respectively, reflecting moderate variation in nutrient accumulation among treatments. Notably, intermediate application rates (N₁₅₀, N₂₂₅, and N₃₀₀ kg plant⁻¹) consistently resulted in higher N content and uptake compared to both the absolute control and the highest rate (N₄₅₀ kg plant⁻¹), indicating that excessive nitrogen may not translate into proportional increases in nutrient accumulation. This trend suggests that optimal nitrogen application is critical for efficient nutrient use and maximizing Chinese cabbage growth and yield.
3.6.3. Potassium Concentration and Uptake in Chinese Cabbage
Potassium application had a significant (p < 0.001) effect on tissue potassium concentration (K %) in both the 2024 and 2025 seasons, while K uptake was only significantly influenced (p < 0.001) in 2025 (Table 2). In 2024, K concentration increased progressively with increasing K rates up to K₂₄₀, reaching the highest value (4.13%), which was significantly higher than all other treatments. Beyond K₂₄₀, K % declined, with the lowest concentrations recorded in the absolute control (1.57%) and K₀ (2.0%). In 2025, a similar pattern was observed, with the highest K concentration (3.87%) obtained at K₂₄₀, which was statistically higher than all other treatments. The absolute control consistently recorded the lowest K concentration (1.27%). These results demonstrate that increasing potassium application rates enhances tissue K accumulation up to a threshold level, beyond which no further increase is observed. Potassium uptake (g ha⁻¹) in 2024 ranged from 0.189 kg ha⁻¹ in the absolute control to 2.216 g ha⁻¹ at K₂₄₀, but the differences among treatments were not statistically significant (p = 0.277). In contrast, in 2025, K uptake was significantly affected by K fertilization, with the highest uptake (3.142 g ha⁻¹) observed at K₂₄₀, followed by K₁₈₀ (2.558 g ha⁻¹). Both were significantly higher than the control (0.144 g ha⁻¹). This finding suggests that adequate K fertilization improves nutrient accumulation in Chinese cabbage, especially under favorable growing conditions. Generally, K₂₄₀ consistently produced the highest K % and K uptake, indicating it was the most effective rate for optimizing K nutrition in Chinese cabbage during the two growing seasons.
3.7. Yield and Optimal Rates as Influenced by N, P and K Fertilizers on Chinese Cabbage
3.7.1. Yield Response of Chinese Cabbage to N, P, and K Fertilization
Significant differences (p < 0.001) in nitrogen (N) yield were observed across the treatments in both seasons (Table 2). In 2024, N yield ranged from 6.03 t ha⁻¹ in the absolute control to 43.54 t ha⁻¹ at N₃₀₀, representing more than a sevenfold increase. Similarly, in 2025, N yield followed the same trend, with the lowest yield recorded in the control (5.77 t ha⁻¹) and the highest at N₃₀₀ (40.74 t ha⁻¹). However, the response curve showed that yields tended to plateau beyond N₃₀₀, with N₄₅₀ producing statistically similar yields to lower N levels (N₁₅₀–N₃₇₅). This indicates that application rates above N₃₀₀ did not result in additional yield benefits and may have contributed to luxury consumption or inefficiency in N use. Phosphorus (P) yield was also significantly (p < 0.05) influenced by P fertilization in both seasons. In 2024, P yield increased from 6.03 t ha⁻¹ in the control to 40.19 t ha⁻¹ at P₁₅₀, after which no significant increment was recorded. Similarly, in 2025, the highest P yield (37.69 t ha⁻¹) was obtained at P₉₀, suggesting that optimal P supply may have been achieved at moderate application rates, beyond which yield response diminished. Potassium (K) yield exhibited a clear and significant response (p < 0.001) to K fertilization in both seasons. In 2024, K yield increased steadily from 6.03 t ha⁻¹ in the control to 55.33 t ha⁻¹ at K₁₂₀, after which a slight decline was noted at higher rates, indicating a possible luxury uptake or antagonistic effect at excessive K levels. A similar pattern was recorded in 2025, with K yield peaking at K₁₈₀ (40.74 t ha⁻¹), followed by a gradual decline in yield at higher application rates. In general, the results indicate that Chinese cabbage achieved optimal yields at moderate to high fertilizer application rates, while excessive N and K applications led to diminishing returns. This emphasizes the need to optimize fertilizer use to enhance nutrient use efficiency and minimize unnecessary input costs.
3.7.2. Relative yield of Chinese cabbage to nitrogen, phosphorus, and potassium application in 2024–2025 seasons
The relative yield of Chinese cabbage varied significantly with the application rates of nitrogen (N), phosphorus (P), and potassium (K) across both 2024 and 2025 growing seasons (p < 0.05). For nitrogen, the relationship between N rate and relative yield followed a quadratic trend for both seasons, as expressed by the regression Equations (6) and (7):
where y represents relative yield (%) and x the applied N rate (kg ha⁻¹). The negative quadratic term in both equations confirms that yield initially increased with rising N rates, reached a maximum, and then declined beyond the optimum due to diminishing returns and potential nutrient imbalance. The calculated vertex of the 2024 equation indicated that the optimum N rate occurred at 220.5 kg ha⁻¹, while the 2025 curve displayed a broader peak with yield maximization closer to 300 kg ha⁻¹. Maximum relative yields were 96.48% in 2024 and 90.92% in 2025 at N300 before declining at N375 and N450. These results demonstrate that Chinese cabbage responds strongly to N fertilization, but excessive N beyond 300 kg ha⁻¹ can lower yield and reduce nutrient use efficiency.
Phosphorus also displayed a quadratic yield response, modeled as in Equation (8) and (9):
The estimated optimum P rates were 103.8 kg ha⁻¹in 2024 and 118.9 kg ha⁻¹ in 2025, which corresponded to the highest relative yields of 58.66% and 89.15%, respectively. Beyond P120, the response plateaued, suggesting that higher P inputs did not result in significant yield gains and that moderate P fertilization is adequate under the prevailing low-P soils of Morogoro.
For potassium, a similar quadratic response was observed, as expressed by the Equation (10) and (11):
The vertex of the 2024 curve indicated that maximum relative yield was achieved at 211 kg K ha⁻¹, with 89.83% yield recorded at K120. In 2025, yield increased gradually with K rates up to 345 kg K ha⁻¹ but plateaued thereafter. The relatively lower R² values for K suggest that yield response to K was more variable and possibly influenced by soil residual K or other interacting factors such as moisture.
Therefore, the regression models confirmed that nitrogen had the strongest and most consistent effect on relative yield, followed by potassium, while phosphorus had a moderate but season-dependent influence. The fitted equations provide a quantitative basis for establishing critical nutrient levels, suggesting that optimum productivity under Morogoro conditions can be achieved with approximately 220–300 kg N ha⁻¹, 90–120 kg P ha⁻¹, and 120–180 kg K ha⁻¹, while avoiding excessive application that would reduce nutrient use efficiency and increase production costs.

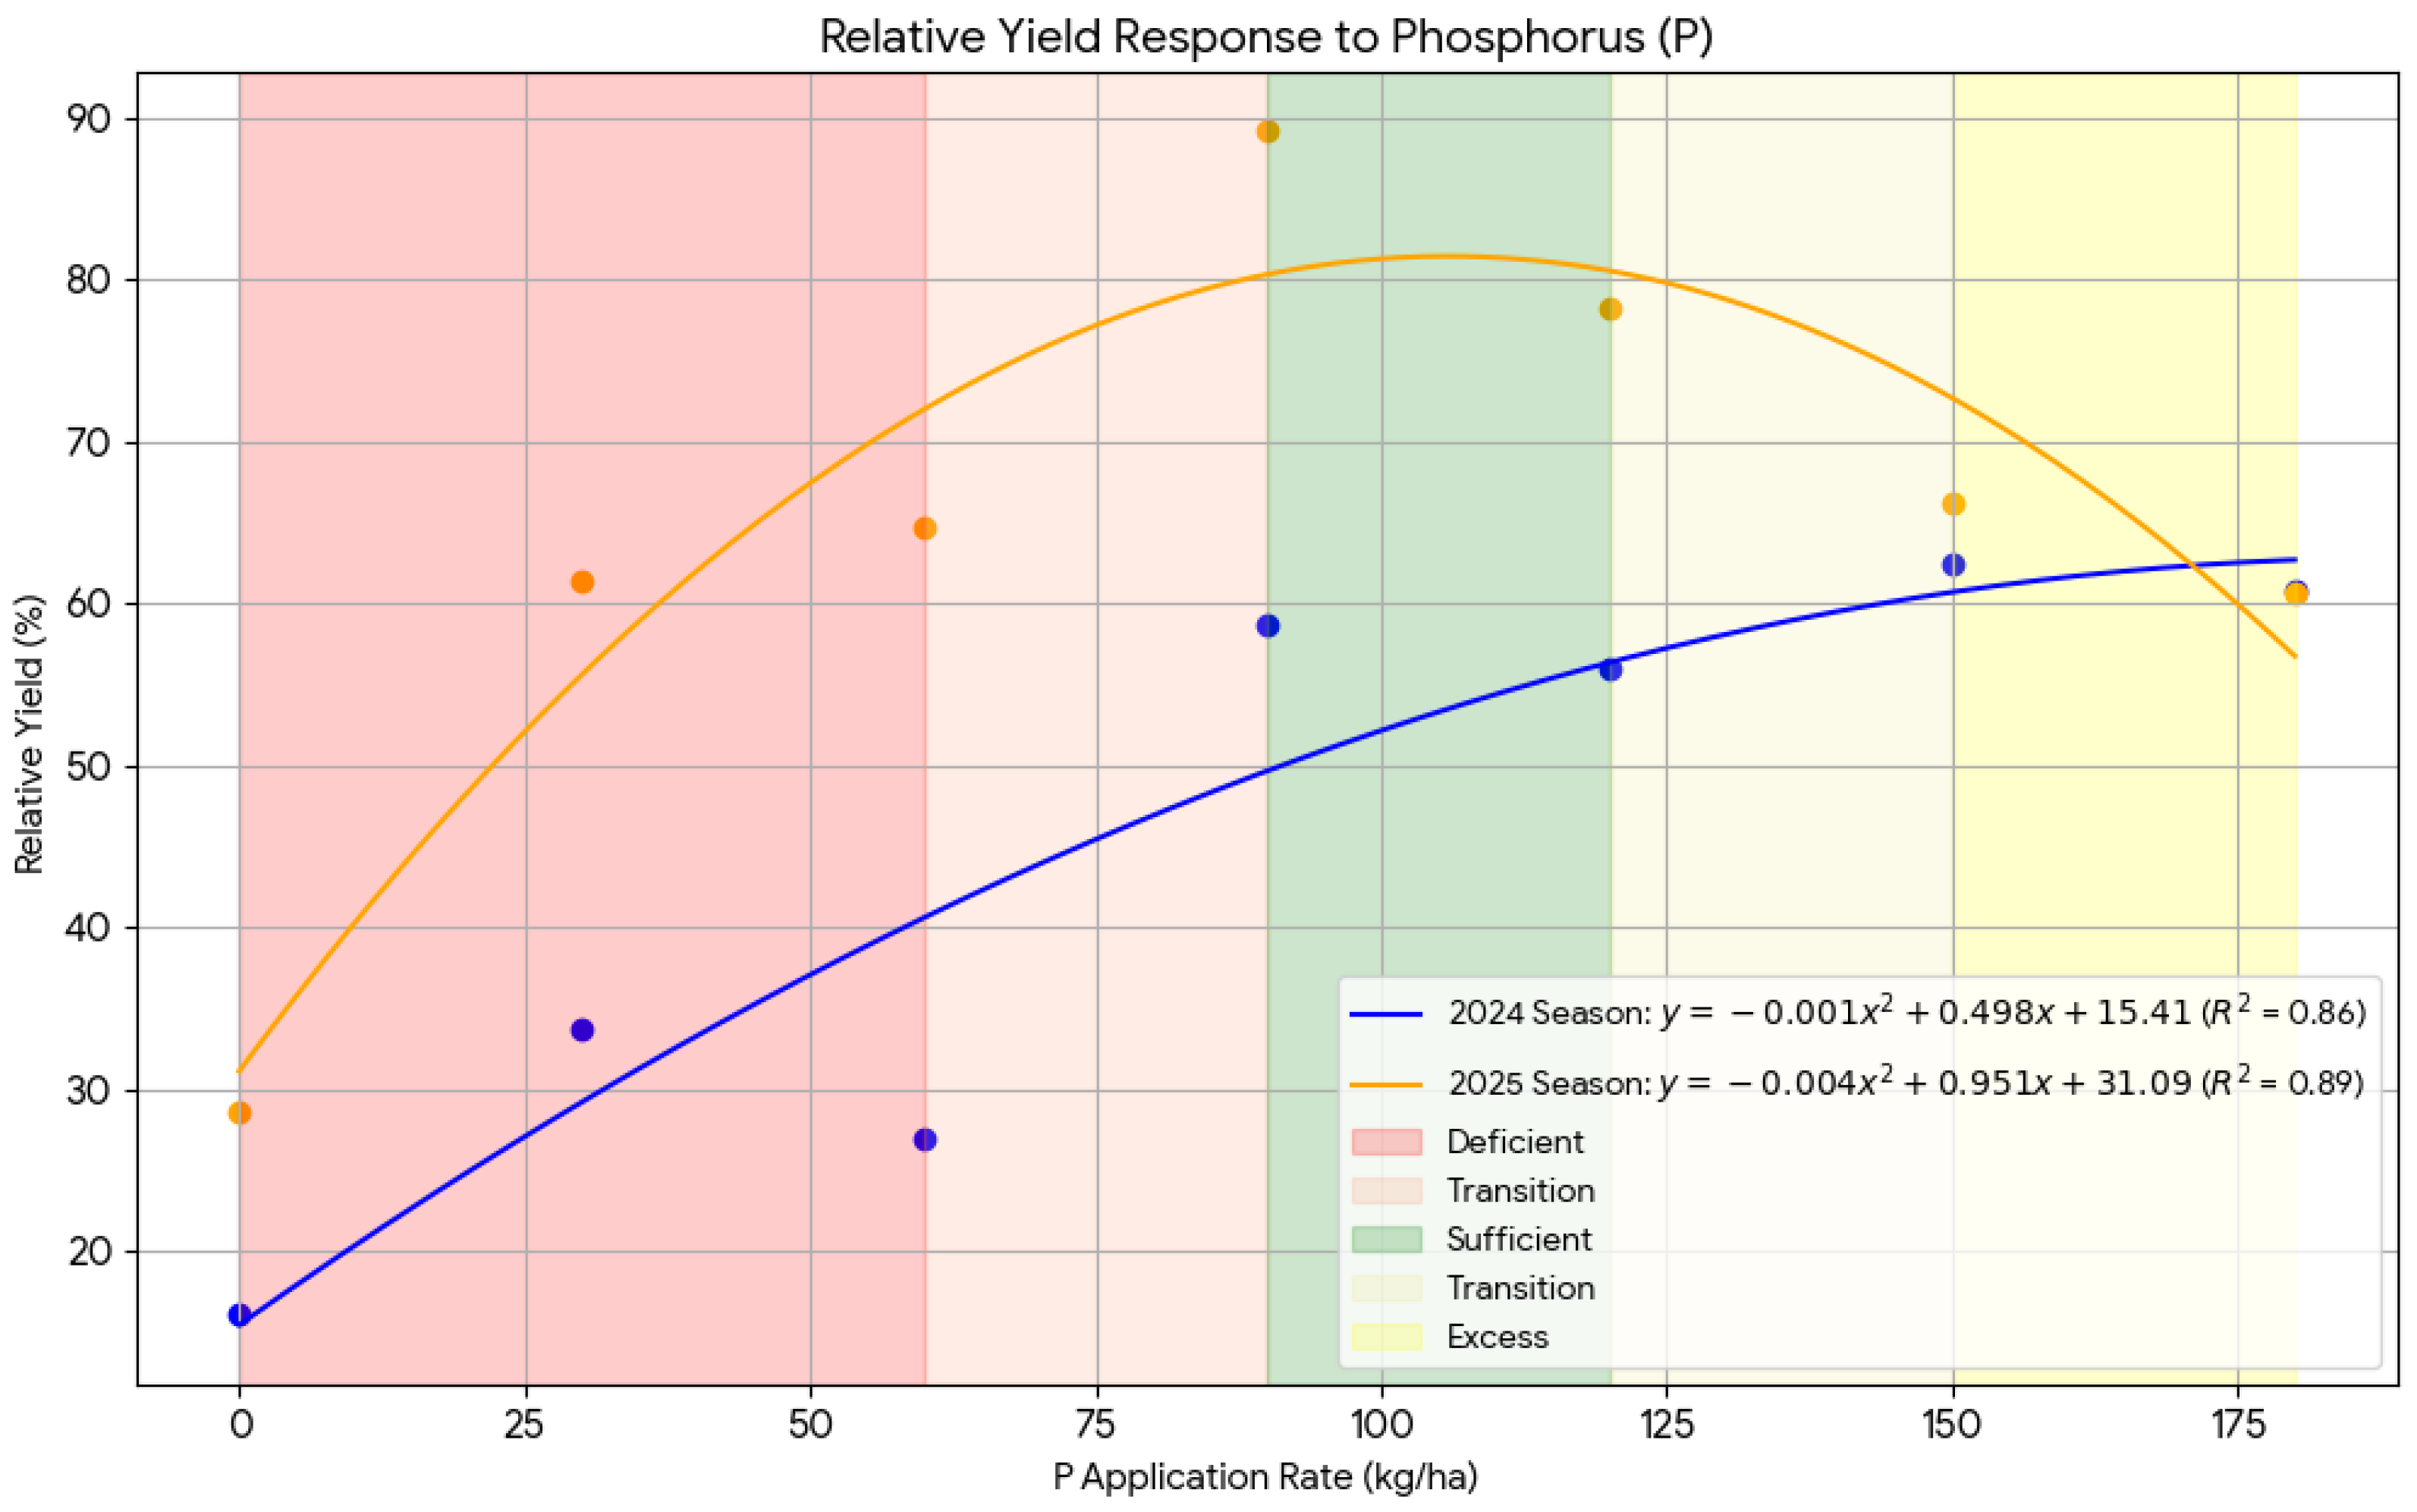
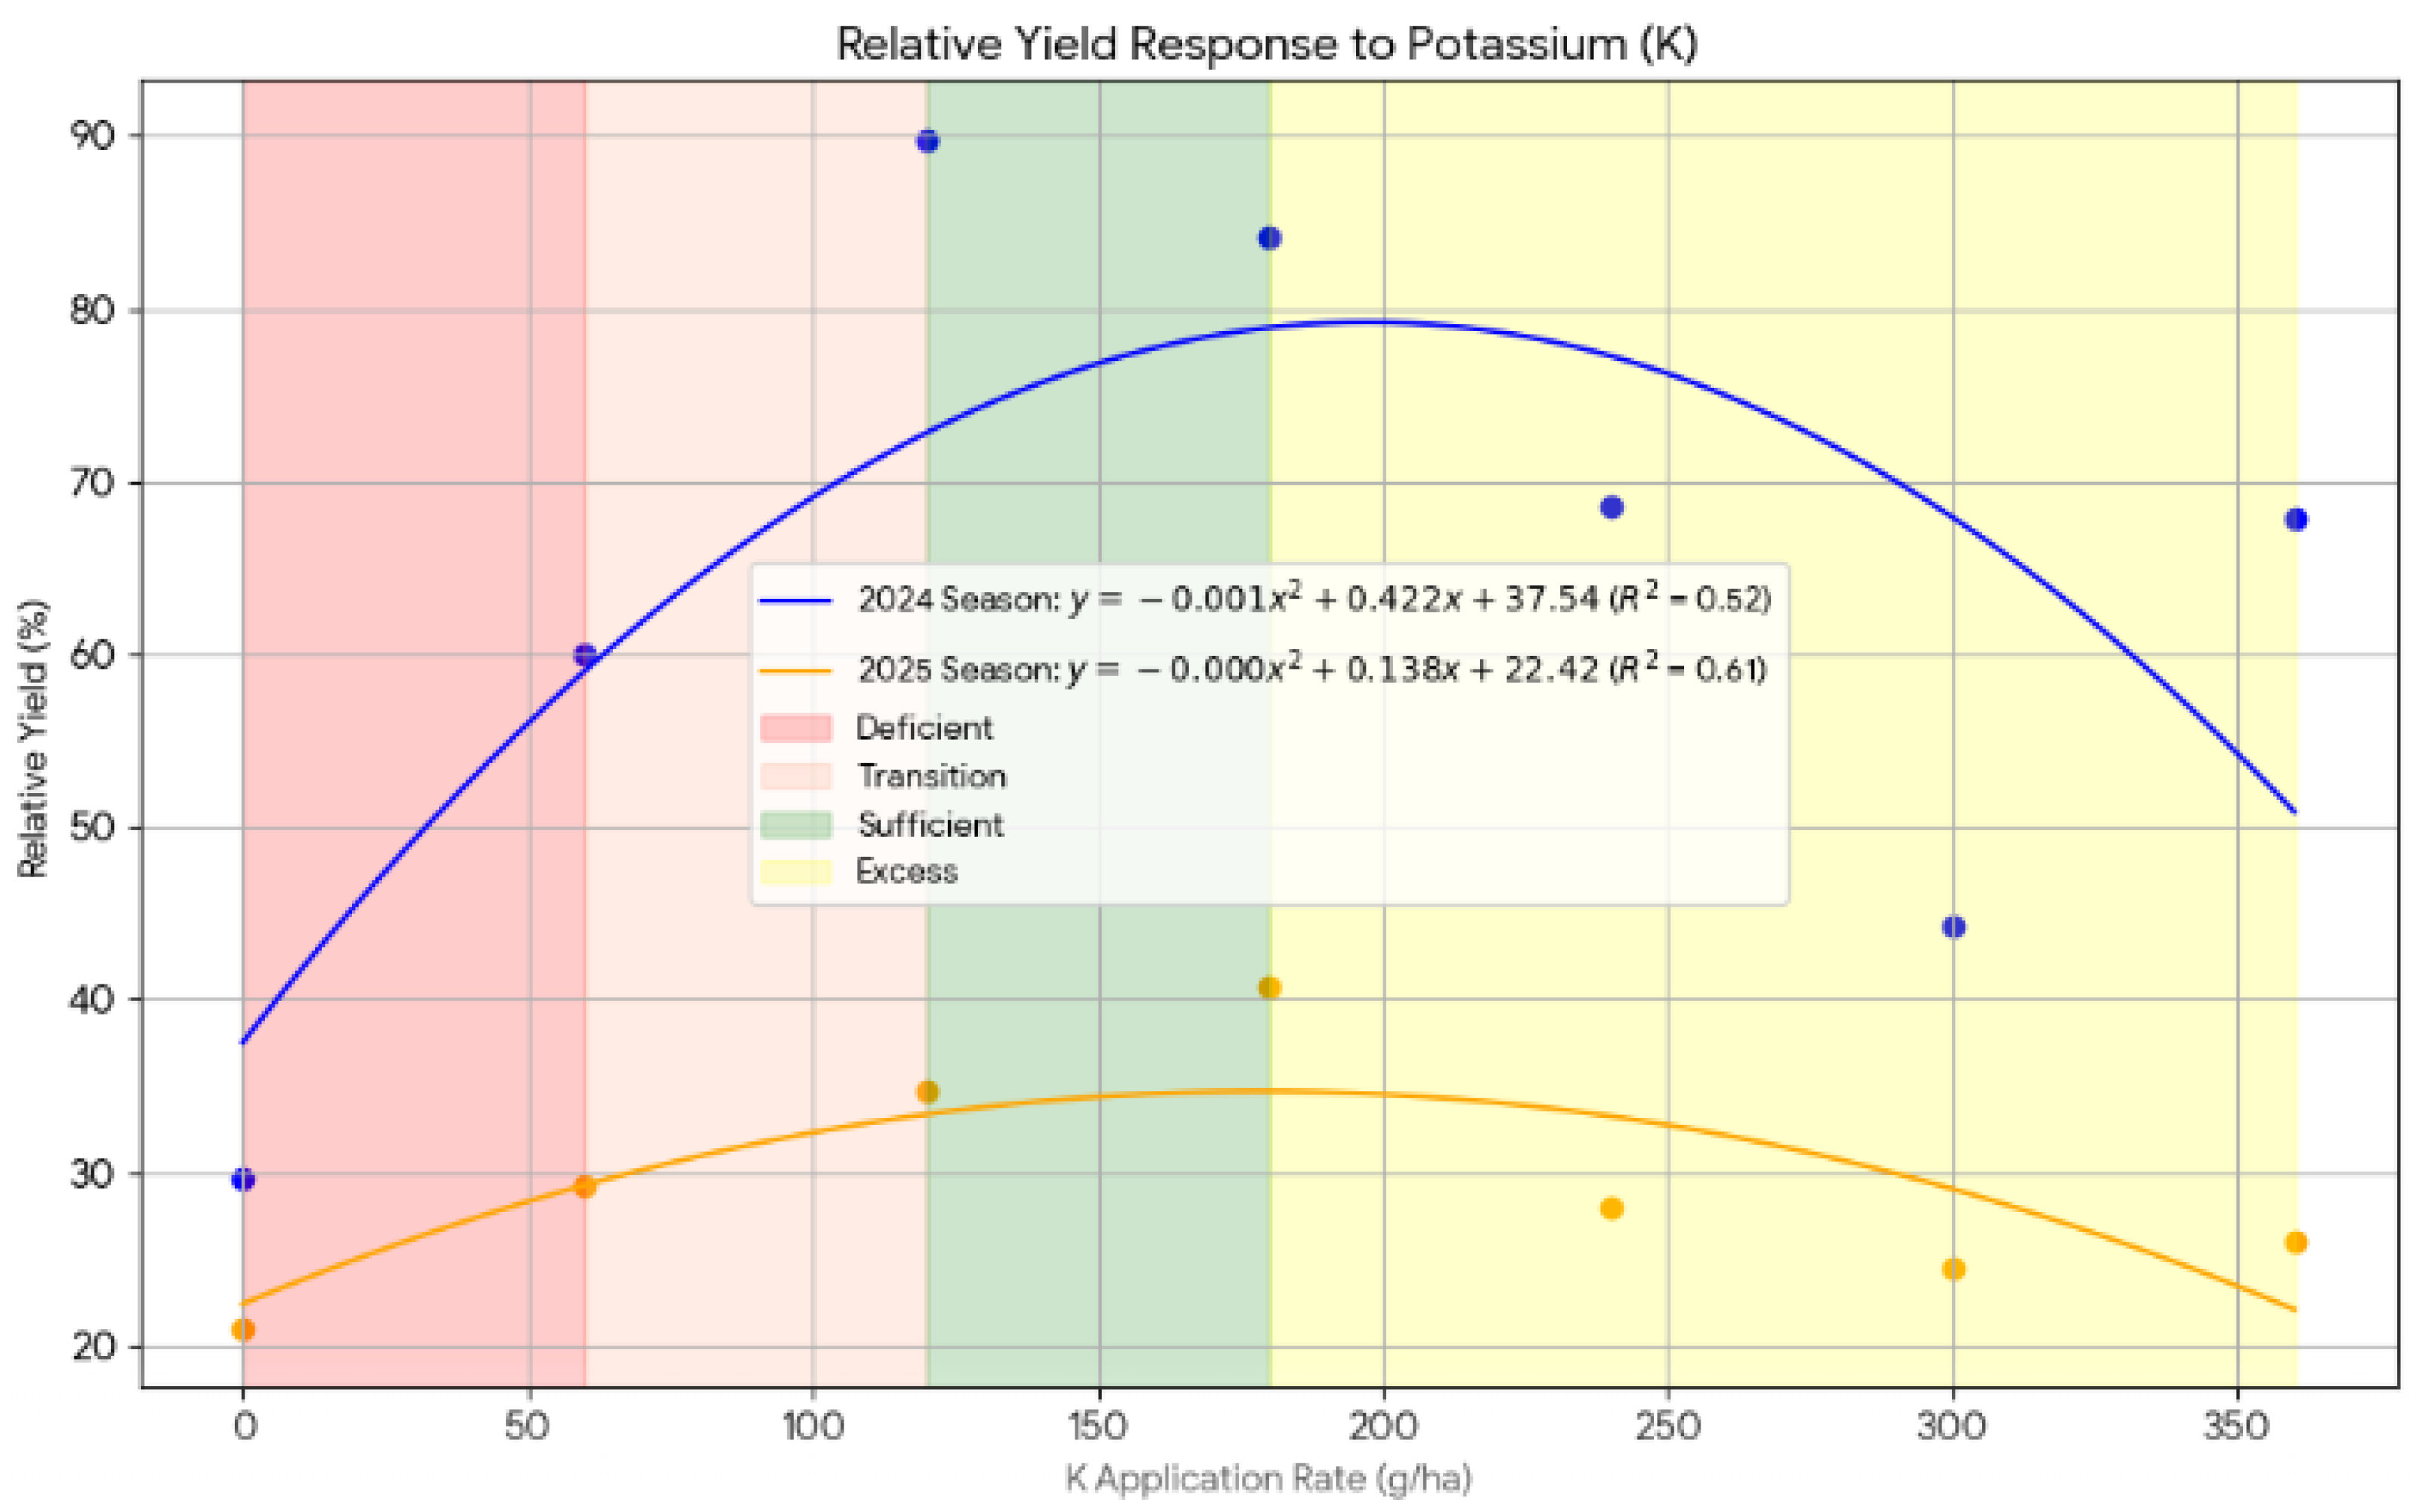
Figure 8.
The nitrogen response curve showing the relationship between relative yield to increasing nutrient concentration to Chinese cabbage during 2024 and 2025 seasons.
Figure 8.
The nitrogen response curve showing the relationship between relative yield to increasing nutrient concentration to Chinese cabbage during 2024 and 2025 seasons.
Figure 9.
The phosphorus response curve showing the relationship between relative yield and applied fertilizers to Chinese cabbage during 2024 and 2025 seasons.
Figure 9.
The phosphorus response curve showing the relationship between relative yield and applied fertilizers to Chinese cabbage during 2024 and 2025 seasons.
Figure 10.
The potassium response curve showing the relationship between relative yield and applied fertilizers to Chinese cabbage during 2024 and 2025 seasons.
Figure 10.
The potassium response curve showing the relationship between relative yield and applied fertilizers to Chinese cabbage during 2024 and 2025 seasons.
4. Discussion
4.1. Integrated Growth Response of Chinese Cabbage to NPK Fertilization Regimes: Physiological Mechanisms and Agronomic Implications
The growth performance of Chinese cabbage, quantified through plant height, leaf number, and leaf area index (LAI), was profoundly influenced by NPK fertilization, with treatment effects becoming statistically significant after 28 days after planting (DAP). This delayed response indicates that adequate root system establishment is a prerequisite for effective nutrient uptake and utilization, marking a physiological transition from seed-dependent to soil nutrient-dependent growth phases (Okonkwo et al., 2024). Across both cropping seasons, treatments combining moderate-to-high nitrogen (N ≈ 225 kg ha-1) with ample phosphorus (P ≈ 90–120 kg ha-1), such as T₁₂ (N₂₂₅P₉₀K₂₄₀) and T₁₃ (N₂₂₅P₁₂₀K₂₄₀), consistently achieved superior performance. These treatments produced plant heights of 38.44-38.73 cm, 14 leaves at harvest, and LAI values exceeding 5.0 at 42 DAP. The balanced N:P:K ratio in T₁₃ (1:0.53:1.07) approaches the theoretical optimum for brassica crops, facilitating enhanced cell division, protein synthesis, and chlorophyll formation, thereby promoting synergistic effects on multiple growth processes (Kim et al., 2025; Maselesele et al., 2022). The critical role of phosphorus as a co-limiting nutrient was evident, as adequate N and P levels optimized canopy development. Notably, the strong performance of T₁₆ (N₂₂₅P₆₀K₀) suggests that indigenous soil potassium may be sufficient for canopy expansion when nitrogen and phosphorus are non-limiting, though potassium remains essential for other physiological functions (Li et al., 2025; Choudhary et al., 2024).
A key inverse relationship was observed between moisture content and dry matter (DM) accumulation. High NPK treatments achieved approximately 92.81% moisture content but a lower DM percentage (7.19%), whereas the unfertilized control (T₁) exhibited 62.95% moisture and 37.05% DM. This reflects a dilution effect where rapid vegetative growth under balanced nutrition dilutes cellular solute concentrations, a phenomenon supported by studies showing that enhanced nitrogen availability promotes cell expansion and turgor but can reduce dry matter accumulation per unit of tissue volume (Rodriguez-Morales et al., 2024; Liu et al., 2025). These differences were highly significant at 49 DAP, identifying this stage as critical for nutrient-mediated cellular metabolism. The control treatment exhibited severe nutrient limitations, with 43-58% reductions across all growth parameters, unequivocally underscoring the necessity of external nutrient supplementation.
In this scenario, the optimal fertilization regime for maximizing vegetative growth of Chinese cabbage under the studied conditions consists of moderate to high N (225-300 kg ha-1) balanced with P at 90–120 kg ha-1 and adequate potassium. The findings imply a trade-off between maximizing yield (associated with higher moisture content) and preserving post-harvest quality (associated with higher dry matter content). Therefore, practical fertilizer management should target balanced NPK combinations applied to coincide with root system establishment (post-28 DAP) to maximize nutrient use efficiency, while also considering seasonal environmental interactions that modulate nutrient availability and uptake (Ahmed et al., 2024; Islam et al., 2024).
4.2. Optimal NPK Fertilization for Enhanced Nutrient Dynamics and Yield of Chinese Cabbage
The findings of this study provide clear evidence that the growth and productivity of Chinese cabbage are highly sensitive to nutrient management, particularly nitrogen (N), phosphorus (P), and potassium (K) supply. The observed yield trends across the 2024 and 2025 seasons followed a characteristic curvilinear response, with yields increasing sharply with nutrient application up to an optimum level, after which diminishing returns and yield reductions were recorded. This pattern is well-documented in nutrient response studies, where an initial increase in nutrient availability stimulates vigorous vegetative growth, enhanced nutrient uptake, and increased photosynthetic activity, until a point at which the crop’s demand is satisfied and further nutrient supply becomes inefficient or even inhibitory (Fageria, 2016; Bindraban et al., 2020). Nitrogen exerted the strongest influence on both tissue concentration and yield, with maximum yield and N uptake consistently observed at intermediate to high application rates. Beyond approximately 300 kg N ha⁻¹, yield declined, indicating a shift from nutrient limitation to nutrient excess, where luxury consumption, nitrate accumulation, and potential metabolic imbalances may occur (Guo et al., 2019; Ali et al., 2021). Such results accentuate the importance of targeting an N rate that maximizes agronomic efficiency and minimizes environmental risks such as nitrate leaching and greenhouse gas emissions, which are increasingly recognized as sustainability concerns in intensive vegetable systems (Wang et al., 2022; Tubiello et al., 2023).
Potassium fertilization also had a significant positive effect on Chinese cabbage growth, particularly in enhancing turgor maintenance, leaf expansion, and stomatal conductance, which translated into higher biomass accumulation and yield at moderate K rates (Rengel & Damon, 2019). However, the plateauing of yields at higher rates suggests that once plant K requirements are met, additional inputs do not result in yield benefits and may interfere with the uptake of other cations such as magnesium (Mg²⁺) and calcium (Ca²⁺) due to competitive exchange at the root surface (Zörb et al., 2014; Ahmad et al., 2023). This highlights the need for site-specific K management strategies to prevent unnecessary fertilizer costs and avoid nutrient imbalances. Phosphorus responses were more moderate and season-dependent, which can be attributed to the complex dynamics of P in soil, including strong sorption to Fe and Al oxides common in tropical soils (Nziguheba et al., 2016). The yield increase observed up to approximately 100–120 kg P ha⁻¹ suggests that this range meets the critical P requirement for Chinese cabbage under the conditions of this study. Beyond this level, yield gains plateaued, supporting previous research that reported limited P use efficiency at higher application rates in acidic soils, where fixation limits plant-available P (Fan et al., 2021; Zhang et al., 2022).
Taken together, these findings affirm that nutrient management for Chinese cabbage should be guided by the principle of maximum return to input rather than indiscriminate fertilizer use. The evidence from this study supports the recommendation to apply approximately 225–300 kg N ha⁻¹, 90–120 kg P ha⁻¹, and 120–180 kg K ha⁻¹ as the most agronomically and economically efficient combination. These rates align with the concept of balanced fertilization, which aims to synchronize nutrient supply with crop demand to enhance nutrient use efficiency, minimize losses, and sustain long-term soil fertility (Fixen et al., 2015; Ma et al., 2022). Adoption of these optimized rates in Morogoro and similar agro-ecological zones would likely improve farmer profitability, reduce input costs, and mitigate environmental risks such as nutrient runoff and eutrophication.
5. Conclusions and Recommendations
5.1. Conclusions
This comprehensive two-season study conclusively demonstrates that balanced NPK fertilization is fundamental for optimizing the growth, yield, and nutrient uptake of Chinese cabbage (Brassica rapa L. subsp. chinensis) in the agro-ecological conditions of Morogoro, Tanzania. The severe growth limitations observed in the unfertilized control underscore the inherent nutrient deficiency of the native soil, necessitating external nutrient supplementation for viable production. The synthesis of agronomic and physiological data revealed a clear curvilinear response to all three macronutrients, establishing a distinct hierarchy of influence with nitrogen (N) as the primary yield-limiting factor, followed by phosphorus (P) and potassium (K). The optimal application rates that maximize yield and nutrient use efficiency while avoiding the diminishing returns of luxury consumption are 220–300 kg N ha⁻¹, 90–120 kg P ha⁻¹, and 120–180 kg K ha⁻¹.
A critical trade-off was identified between maximizing yield and preserving post-harvest quality. High NPK inputs drive rapid vegetative growth, resulting in high fresh yield and moisture content, but concurrently dilute dry matter accumulation a key determinant of storability and nutritional density. Furthermore, the delayed treatment significance until 28 days after planting (DAP) highlights that robust root system establishment is a prerequisite for efficient nutrient utilization. Therefore, transitioning from maximal to optimal fertilization strategies is imperative for achieving sustainable, productive, and economically efficient Chinese cabbage cultivation in the region.
5.2. Recommendations
Based on the findings, the following recommendations are made for farmers, agronomists, and policymakers in Morogoro and similar agro-ecological zones:
- 1.
- Adopt Optimal Fertilizer Rates: Apply N220–N₃₀₀, P₉₀–P₁₂₀, and K₁₂₀–K₁₈₀ kg ha⁻¹ to maximize growth, yield, and nutrient use efficiency. Avoid excessive N (> N₃00) or K (> K180) as these lead to diminishing returns and potential nutrient losses.
- 2.
- Use Balanced Nutrient Management: Incorporate phosphorus and potassium together with nitrogen for synergistic effects on canopy development and leaf formation. Conduct regular soil testing to adjust fertilizer rates according to indigenous nutrient reserves, particularly for potassium, which may be sufficient in some cases.
- 3.
- Time Fertilizer Applications Appropriately: Use split applications, with a basal dose at planting and top-dressing around 3–4 weeks after planting (21–28 DAP), aligning nutrient supply with the period of rapid vegetative growth and root development.
- 4.
- Balance Yield with Quality: For fresh markets, full NPK rates can be applied to maximize succulence. For longer shelf life or processing markets, consider slightly lower N rates (≈N₂₂₅) to increase dry matter content and improve storability.
- 5.
- Focus on Further Research: Conduct multi-location and multi-season trials to refine recommendations across diverse climatic conditions. Explore integrated nutrient management (INM) combining optimized mineral fertilizer with organic amendments to sustain soil fertility, enhance nutrient use efficiency, and improve postharvest quality. Conducting cost-benefit analyses and environmental risk assessments of the recommended fertilizer practices.
Author Contributions
Conceptualization, SPN. Implementation, All. Formal Analysis, All. Writing—Original Draft, SPN. Writing—Review and Editing, JMS. All authors contributed to the article and approved the submitted version.
Funding
This work did not receive any fund.
Data Availability Statement
No publically available datasets were analyzed in this study.
Conflicts of Interest
The authors declare no conflict of interest of any kind. The authors declare that the research was conducted in the absence of any commercial or financial relationships that could be construed as a potential conflict of interest.
References
- Afari-Sefa, V.; Rajendran, S.; Kessy, R. F., Karanja, D. K., Musebe, R., & Samali, S. (2016). Impact of nutritional-sensitive interventions on household production and consumption of vegetables in Tanzania. Global Food Security, 9, 37–43. [CrossRef]
- Ahmad, I.; Aslam, M.; Razaq, M.; Murtaza, G. (2023). Potassium nutrition and its interaction with other nutrients: Implications for sustainable crop production. Frontiers in Plant Science, 14, 1104567. [CrossRef]
- Ahmed, S.; Rahman, M.; Hassan, K. (2024). Environmental interactions with NPK fertilizer efficiency in tropical vegetable production systems. Journal of Tropical Agriculture, 62(3), 145-158. [CrossRef]
- Ali, A.; Li, Y.; Waqas, M. (2021). Optimizing nitrogen management to improve vegetable yield and reduce environmental impact. Agronomy, 11(6), 1102. [CrossRef]
- Amuri, N. A., Mhoro, L., Mwasyika, T., & Semu, E. (2017). Potential of Soil Fertility Management to Improve Essential Mineral Nutrient Concentrations in Vegetables in Dodoma and Kilombero, Tanzania. Journal of Agricultural Chemistry and Environment, 6(02), 105.
- Amuri, N.; Semu, E.; Mrema, J. P., & Msanya, B. M. (2017). Soil fertility evaluation for optimization of fertilizer use in irrigated lowland rice in Tanzania. Journal of Agricultural Science, 9(12), 100–114. [CrossRef]
- Aung, S. S., Myint, A. K., Maw, T. T., Win, K. K., & Ngwe, K. (2019). Chemical and organic fertilizers application on yield, nutrient uptake and nitrogen use efficiency of chinese cabbage (Brassica pekinensis) in different soils. Journal of Agricultural Research, 6 (2), 60–69.
- Baitilwakea, M. A., Mrema, J. P., & Semu, E. (2011). Phosphorus sorption characteristics of selected Tanzanian soils. African Journal of Agricultural Research, 6(1), 1–10.
- Barrett, C.; Bevis, L. (2015). Food security and soil fertility in Sub-Saharan Africa. Agricultural Systems, 134, 11–20.
- Bindraban, P. S., Dimkpa, C. O., & Pandey, R. (2020). Exploring phosphorus fertilizers and fertilization strategies for improved human and environmental health. Nutrient Cycling in Agroecosystems, 116, 295–318. [CrossRef]
- Bongani, M.; Muhammad, S.(2020). Fertilizer use and environmental impacts in smallholder agriculture. Sustainability, 12(7), 2850.
- Brady, N.C. and Weil, R. R. (2017). The nature and properties of soil. 15th Edition. Pearson Education. Essex, England. 1104 pp.
- Bray, R.H. and Kurtz, L. T. (1945). Determination of total organic and available forms of phosphorus in soils. Soil Science, 59: 39-45.
- Bremner, J.M. and Mulvaney, C. S. (1982). Total nitrogen. In: Methods of Soil Analysis. Part 2 Black et al. (Eds) Agronomy Monograph 9, American Society of Agronomy, Madison, Wisconsin, USA. pp. 1149-1170.
- Bünemann, E. K., Bongiorno, G., Bai, Z., Creamer, R. E., De Deyn, G., de Goede, R., ... & Brussaard, L. (2018). Soil quality A critical review. Soil Biology and Biochemistry, 120, 105–125. [CrossRef]
- Chapman, H.D. (1965). Cation exchange capacity. In: Methods of Soil Analysis, Part 1. Black, C. A., Evans, D. D., White, J. L., Ensminger, L. E. and Clark, F. E. (Eds), American Society of Agronomy, Madison, Wisconsin. pp. 891-901.
- Choudhary, V. K., Kumar, P. S., & Dixit, A. (2024). Synergistic effects of potassium and bio-fertilizers on leaf development and yield of Chinese cabbage (Brassica rapa L. subsp. pekinensis). Journal of Plant Nutrition, 47(5), 789-805.
- Chuan, L.; He, P.; Jin, J.; Li, X.; Zhao, S.(2019). Nutrient management for improving Chinese cabbage yield and quality in a temperate agricultural system. Agronomy Journal, 111(3), 1234–1244. [CrossRef]
- Day, P.R (1965). Particle fractionation and particle size analysis. In: Methods of Soil Analysis, Part 1. Black, C. A., Evans, D. D., White, J. L., Ensminger, L. E. and Clark, F. E. (Eds), American Society of Agronomy, Madison, Wisconsin. pp. 545-566.
- Duursma, E.K. and Dawson, R. (eds) (1981). Marine organic chemistry: Evolution, composition, interactions and chemistry of organic matter in seawater. Elsevier, Amsterdam, The Netherlands. 521 pp.
- Everaarts, A. P., de Putter, H. & Maerere, A. P. (2017). Profitability, labour input, fertilizer application and crop protection in vegetable production in the Arusha region, Tanzania. Journal of Animal and Plant Sciences, 32(3), 5181-5202.
- Everaarts, A. P., Neeteson, J. J., & De Willigen, P. (2017). Yield and nutrient uptake of Chinese cabbage in response to nitrogen and potassium fertilization. Journal of Plant Nutrition, 40(15), 2167–2176. [CrossRef]
- Fageria, N.K. (2016). The use of nutrients in crop plants (2nd ed.). CRC Press.
- Fageria, N. K., Baligar, V. C., & Jones, C. A. (2011). Growth and mineral nutrition of field crops (3rd ed.). CRC Press.
- Fan, M.; Shen, J.; Yuan, L.; Jiang, R.; Zhang, F. (2021). Improving crop productivity and resource use efficiency to ensure food security and environmental quality in China. Journal of Experimental Botany, 72(2), 338–354. [CrossRef]
- Fixen, P. E., Brentrup, F., Bruulsema, T. W., Garcia, F., Norton, R., & Zingore, S. (2015). Nutrient/fertilizer use efficiency: Measurement, current situation and trends. Managing Water and Fertilizer for Sustainable Agricultural Intensification, 8–38.
- Guo, J., Liu, X., Zhang, Y., Shen, J., Han, W., Zhang, W., ... & Zhang, F. (2019). Significant acidification in major Chinese croplands. Science, 327(5968), 1008–1010. [CrossRef]
- Hashim, M., Marschner, P., & Rengel, Z. (2018). Zinc availability in Tanzanian soils: Implications for crop production. Soil Science and Plant Nutrition, 64(6), 777–785. [CrossRef]
- Havlin, J. L., Beaton, J. D., Tisdale, S. L., & Nelson, W. L. (2020). Soil fertility and fertilizers (9th ed.). Pearson Education.
- Hawkesford, M. J., Kopriva, S., & De Kok, L. J. (2012). Nutrient use efficiency in plants: Concepts and approaches. Springer.
- Huang, X., Chen, L., & Wang, Z. (2023). Phosphorus nutrition and its impact on root architecture in vegetables. Soil Biology & Biochemistry, 125, 134-145.
- Journal of Plant Physiology, 171(9), 656–669. [CrossRef]
- Kim, H., Lee, S., & Zhang, C. (2025). Optimizing nitrogen-phosphorus-potassium ratios for enhanced physiological processes in brassica crops. Scientia Horticulturae, 325, 112765.
- Kochian, L. V., Hoekenga, O. A., & Piñeros, M. A. (2004). How do crop plants tolerate acid soils? Mechanisms of aluminum tolerance and phosphorus efficiency. Annual Review of Plant Biology, 55, 459–493. [CrossRef]
- Landon, J. R. (ed.) (1991). Booker Tropical Soil Manual: A handbook for Soil Survey and Agricultural Land Evaluation in the Tropics and Subtropics. Longman, New York. 450 pp.
- Larkcom, J. (2008). Asian vegetables: Cultivation and nutritional importance. London: HarperCollins.
- Lee, J. G., Lee, B. Y., & Lee, H. J. (2010). Accumulation of phytochemicals in Chinese cabbage grown under different fertilization regimes. Journal of Agricultural and Food Chemistry, 58(3), 1613–1621. [CrossRef]
- Li, T., Wang, Y., & He, P. (2025). The role of indigenous soil potassium reserves in vegetable production systems: Implications for fertilizer recommendations. Soil Science and Plant Nutrition, 71(1), 45-55.
- Lindsay W., L. and Norvell W. A. (1978). Development of a DTPA soil test for zinc, iron, manganese and copper. Soil Science Society of America Journal, 42: 421–428.
- Liu, X., Wang, Y., Qian, X., Wu, Z., Zhou, R., Hou, X., Qi, Y., & Jiang, F. (2025). Maintaining high yield and improving quality of non-heading Chinese cabbage through nitrogen reduction in different seasons. Agronomy, 15(3), 571. [CrossRef]
- Ma, Q., Wang, X., & Liu, Y. (2022). Optimizing NPK fertilization to improve vegetable yield and nutrient use efficiency. Sustainability, 14(8), 4572. [CrossRef]
- Magnusson, M. (2014). Mineral Fertilizers and Green Mulch in Chinese Cabbage [Brassica pekinensis (Lour.) Rupr.]: Effect on Nutrient Uptake, Yield and Internal Tipburn. Acta Agriculturae Scandinavica, Section B — Soil and Plant Science. 52(1): 25-35. [CrossRef]
- Marschner, P. (2012). Marschner’s Mineral Nutrition of Higher Plants 3rd Edition. Elsevier Ltd. 649 pp.
- Maselesele, D., Ogola, J. B. O., & Murovhi, R. N. (2022). Nutrient uptake and yield of Chinese cabbage (Brassica rapa L. Chinensis) increased with application of macadamia husk compost. Horticulturae, 8(3), Article 196. [CrossRef]
- Masso, C., Baijukya, F., & Ebanyat, P. (2017). Challenges and opportunities for agricultural intensification in the East African Highlands. Agricultural Systems, 153, 11–21. [CrossRef]
- Mntambo, M. (2017). Vegetable production for income and nutrition security in Tanzania. Journal of Agriculture and Rural Development, 5(2), 45–54.
- Moberg, J. R. (2001). Soil and Plant Analysis Manual. Revised Edition. The Royal Veterinary and Agricultural University, Chemistry Department, Copenhagen, Denmark. 137 pp.
- Msanya, B. M. (2021). Soil fertility management for sustainable vegetable production in Tanzania. Morogoro: Sokoine University of Agriculture Press.
- Msanya, B. M., Kimaro, D. N., Kimbi, G. G., & Mhoro, L. (2003). Soil-landscape relationships in the Morogoro District, Tanzania. African Journal of Science and Technology, 4(1), 66–78.
- Murphy, J. and Riley, J. P. (1962). Modified single solution method for determination of phosphate in natural waters. Analytica Chimica Acta, 27: 31-36.
- Nelson, D. W. and Sommers L. E. (1982). Total carbon, organic carbon, and organic matter. In: Methods of Soil Analysis. II. Chemical and Microbiological properties. Second Edition. Page, A. L., Miller, R. H., Keeney, D. R., Baker, D. E., Roscoe E., Ellis, J. and Rhodes, J. D. (Eds). Madison, Wisconsin, USA. pp. 539-581.
- NSST. (1992). National Soil Service of Tanzania: Soil laboratory manual. Ministry of Agriculture, Tanzania.
- Nziguheba, G., Palm, C. A., & Bationo, A. (2016). Integrated soil fertility management in Africa: Principles, practices, and prospects. Nutrient Cycling in Agroecosystems, 104(3), 347–361. [CrossRef]
- Okalebo, J. R., Gathua, K. W and Woomer, P. L. (2002). Laboratory methods of soil and plant analysis: A working manual. 2nd Edition. TSBF-CIAT and SACRED Africa, Nairobi. 127 pp.
- Pasakdee, S., Agus, F., & Van Noordwijk, M. (2006). Root architecture of Brassica crops under varying soil conditions. Plant and Soil, 285(1–2), 85–100. [CrossRef]
- Rengel, Z., & Damon, P. M. (2019). Crop nutrition: Physiology and management of nutrients. Advances in Agronomy, 158, 1–55. [CrossRef]
- Rockström, J., Williams, J., Daily, G., Noble, A., Matthews, N., Gordon, L., ... & Smith, J. (2017). Sustainable intensification of agriculture for human prosperity and global sustainability. Ambio, 46(1), 4–17. [CrossRef]
- Rodriguez-Morales, A., Santos, P., & Gonzalez, M. (2024). Combined effect of nitrogen, phosphorus and potassium fertilizers on plant metabolism and growth regulation in cruciferous vegetables. Plant Physiology and Biochemistry, 189, 67-78. [CrossRef]
- Saha, S., Chakraborty, D., & Singh, S. B. (2020). Micronutrient management in tropical vegetable production systems. Advances in Agronomy, 161, 175–246. [CrossRef]
- Soil Survey Staff (2014). Key to Soil Taxonomy. 12th Edition. Natural Resources Conservation Service, United States Department of Agriculture (USDA) Handbook, Washington DC. 372 pp.
- Thomas, G. W. (1986). Exchangeable cations. In: Methods of Soil Analysis, Part 2. Chemical and Microbiological Properties. 2nd Edition. Page, A. L., Miller, R. H., Keeney, D. R., Baker, D. E., Roscoe E., Ellis, J. and Rhodes, J. D. (Eds). Madison, Wisconsin, USA. pp. 403-430.
- Tittonell, P., Vanlauwe, B., Leffelaar, P. A., Shepherd, K. D., & Giller, K. E. (2008). Exploring diversity in soil fertility management of smallholder farms in western Kenya. Agriculture, Ecosystems & Environment, 110(3–4), 149–165. [CrossRef]
- Traka, M. H. (2016). Health benefits of glucosinolates. Advances in Botanical Research, 80, 247–279. [CrossRef]
- Tubiello, F. N., Conchedda, G., Wanner, N., Federici, S., Rossi, S., & Grassi, G. (2023). Greenhouse gas emissions from fertilizer use: Trends and mitigation options. Nature Food, 4, 452–461. [CrossRef]
- Van Ranst, E., Nerloo, M., Demeyer, A. and Pauwels, J. M. (1999). Manual for the soil Chemistry and Fertilizer Laboratory. Analytical Methods for soils and Plants Equipment and Management of Consumable. International Training Centre for Post-Gradutes Soil Scientists and Department of Applied Analytical and Physical Chemistry. Laboratory of Analytical Chemistry and Applied Ecochemistry, University of Ghent. 243 p.
- Vanlauwe, B., Descheemaeker, K., Giller, K. E., Huising, J., Merckx, R., Nziguheba, G.,... & Zingore, S. (2015). Integrated soil fertility management in sub-Saharan Africa: Unravelling local adaptation. Soil, 1(1), 491–508. [CrossRef]
- Vitousek, P. M., Naylor, R., Crews, T., David, M. B., Drinkwater, L. E., Holland, E.,... & Zhang, F. S. (2009). Nutrient imbalances in agricultural development. Science, 324(5934), 1519–1520. [CrossRef]
- Wang, F., Zhang, J., & Sun, Y. (2022). Nitrogen management in vegetable production: Balancing productivity and environmental protection. Agriculture, Ecosystems & Environment, 337, 108057. [CrossRef]
- Wang, J., Li, H., & Zhang, P. (2023). Calcium and magnesium roles in vegetable stress tolerance. Journal of Plant Science, 92(5), 500-515.
- Zhang, H., Xu, F., Wu, Y., Hu, H., & Dai, X. (2017). Progress of potassium management in agricultural systems of China. Journal of Integrative Agriculture, 16(12), 2800–2810. [CrossRef]
- Zhu, H. (2022). Global production and market trends of Chinese cabbage. Horticultural Plant Journal, 8(1), 15–2.
- Zörb, C., Senbayram, M., & Peiter, E. (2014). Potassium in agriculture—Status and perspectives.
Figure 5.
Leaf Area Index (LAI) of Chinese cabbage at 21, 28, 35, and 42 days after planting (DAP) as influenced by different NPK fertilizer rates during the 2024-2025 cropping seasons in Morogoro, Tanzania.
Figure 5.
Leaf Area Index (LAI) of Chinese cabbage at 21, 28, 35, and 42 days after planting (DAP) as influenced by different NPK fertilizer rates during the 2024-2025 cropping seasons in Morogoro, Tanzania.
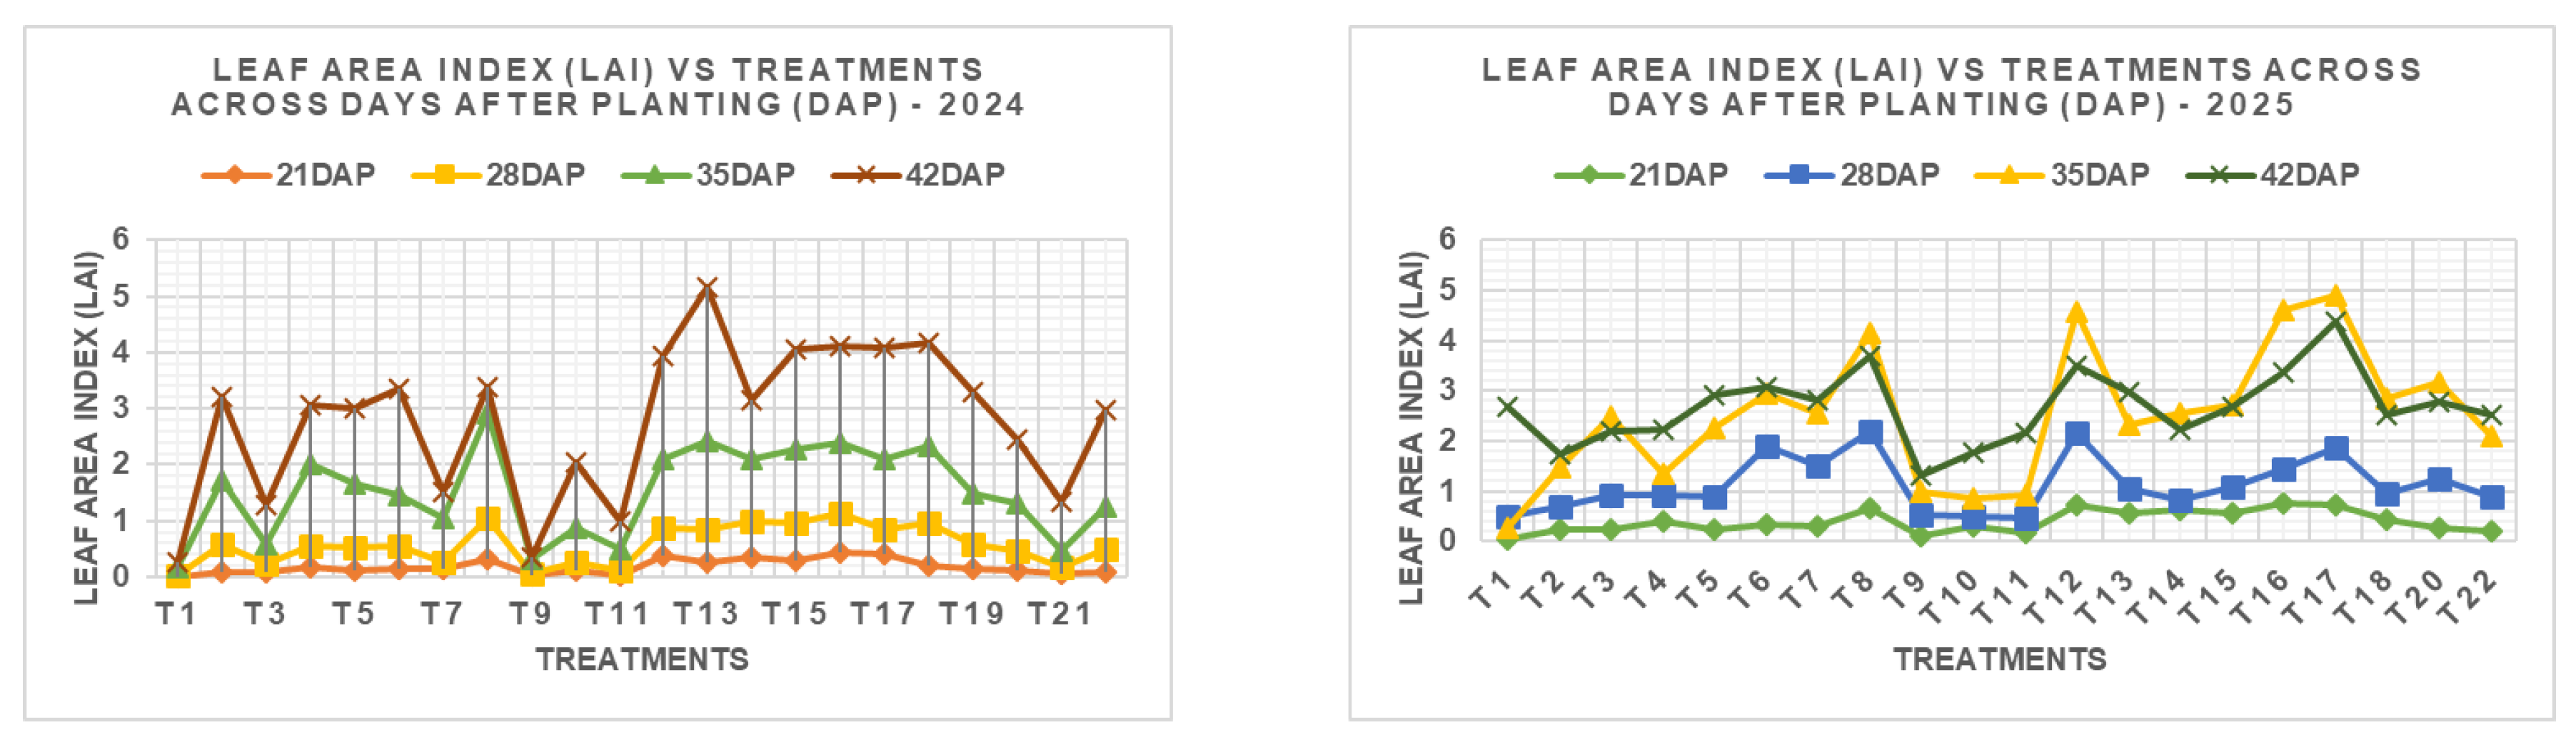

Table 1.
Physical and chemical properties of soil where experiment laid.
| Parameter | Soil A | Critical Level | Fertility Status | Reference |
|---|---|---|---|---|
| pH (H₂O, 1:2.5) | 5.01 | 5.5–7.3 | Strongly acidic | Thiagalingam (2003); Landon (1991) |
| EC (µS cm⁻¹) | 226 | < 4000 | Very low | NSST (1992) |
| Organic carbon (%) | 1.8 | 2.51–3.5 | Medium | Landon (1991) |
| Organic matter (%) | 3.10 | 4.3–6.0 | Medium | Landon (1991) |
| Total nitrogen (%) | 0.14 | > 0.5 | Low | Tisdale et al. (2004) |
| C:N ratio | 12.86 | 8–13 | Good quality | NSST (1992) |
| Available P (mg kg⁻¹) | 2.24 | > 20 | Very low | Nziguheba et al. (2016) |
| Available S (mg kg⁻¹) | 39.2 | 11–15 | Very high | Landon (1991) |
| Exch. K (Cmol(+) kg⁻¹) | 0.95 | > 0.4 | High | Landon (1991) |
| Exch. Ca (Cmol(+) kg⁻¹) | 0.63 | 2.6–5.0 | Medium | Landon (1991) |
| Exch. Mg (Cmol(+) kg⁻¹) | 3.51 | 1.1–2.0 | Very high | Landon (1991) |
| Exch. Na (Cmol(+) kg⁻¹) | 0.19 | 0.1–0.3 | Low | Landon (1991) |
| CEC (Cmol(+) kg⁻¹) | 7.28 | 15–40 | Low | Landon (1991) |
| Ca:Mg ratio | 0.179 | 3:1 | Unfavourable | Landon (1991) |
| K:Mg ratio | 0.271 | < 1:1 | Adequate | Rengel & Damon (2019) |
| ESP (%) | 2.61 | < 6.0 | Non-sodic | NSST (1992) |
| Base saturation (%) | 72.53 | > 75 | Medium | Landon (1991) |
| Cu (mg kg⁻¹) | 2.66 | > 0.6 | Very high | Landon (1991) |
| Zn (mg kg⁻¹) | 0.92 | > 1 | Medium | Landon (1991) |
| Fe (mg kg⁻¹) | 34.36 | > 4.5 | Very high | Landon (1991) |
| Mn (mg kg⁻¹) | 45.55 | > 1 | Very high | Landon (1991) |
| Clay (%) | 54.12 | 35–60 | High | USDA (2017) |
| Silt (%) | 9.64 | 20–40 | Low | USDA (2017) |
| Sand (%) | 36.24 | 20–50 | Medium | USDA (2017) |
| Textural class | Clay | – | Moderate water-holding capacity | USDA (2017) |
Key: EC = Electric conductivity, ESP = Exchangeable sodium percentage and USDA = United States Department of Agriculture, K = Potassium, Ca = Calcium, P = Phosphorus, Mg = Magnesium, S = Sulphur, Zn = Zinc, Cu = Copper, Mn = Manganese, Fe = Iron, Na = Sodium, and CEC = Cation exchange capacity.
Table 2.
Effect of nitrogen, phosphorus, and potassium application rates on nutrient concentration (%) and uptake (g ha⁻¹) in Chinese cabbage during the 2024 and 2025 seasons.
Table 2.
Effect of nitrogen, phosphorus, and potassium application rates on nutrient concentration (%) and uptake (g ha⁻¹) in Chinese cabbage during the 2024 and 2025 seasons.
| Nitrogen Analysis for 2024-2025 Seasons | Phosphorus Analysis for 2024-2025 Seasons | Potasium Analysis for 2024-2025 Seasons | ||||||||||||
|---|---|---|---|---|---|---|---|---|---|---|---|---|---|---|
| Application Rate (kg/ha) | 2024 | 2025 | Application Rate (kg/ha) | 2024 | 2025 | Application Rate (kg/ha) | 2024 | 2025 | ||||||
| N_% | N_Uptake | N_% | N_Uptake | P_% | P_Uptake | P_% | P_Uptake | K_% | K_Uptake | K_% | K_Uptake | |||
| Absolute control | 2.68ab | 0.32a | 0.7a | 0.26a | Absolute control | 0.11ab | 0.01a | 0.01a | 0.01a | Absolute control | 1.57a | 0.19a | 1.27a | 0.14a |
| N0 | 3.7ab | 1.98ab | 1.03ab | 0.52ab | P0 | 0.04a | 0.01a | 0.14ab | 0.03ab | K0 | 2ab | 1.74ab | 1.7ab | 1.05b |
| N75 | 2.91ab | 0.68ab | 2.04bc | 1.47abc | P30 | 0.13ab | 0.04a | 0.15ab | 0.08ab | K60 | 2.57bc | 2.13ab | 2.13b | 1.35bc |
| N150 | 4.16ab | 2.45b | 2.36c | 1.51abc | P60 | 0.39ab | 0.14ab | 0.27ab | 0.17ab | K120 | 3.17cd | 2.18ab | 2.9b | 1.9cd |
| N225 | 4.15ab | 2.32b | 4.47de | 3.02bc | P90 | 0.21ab | 0.14ab | 0.28ab | 0.21b | K180 | 3.53de | 2.05ab | 3.2c | 2.5 de |
| N300 | 4.27b | 2.41b | 4.6e | 3.39c | P120 | 0.24ab | 0.15ab | 0.34b | 0.22 b | K240 | 4.13e | 2.22b | 3.87d | 3.14e |
| N375 | 3.14ab | 0.8ab | 3.22cd | 2.41abc | P150 | 0.23ab | 0.16ab | 0.28ab | 0.1 ab | K300 | 3.17cd | 1.32ab | 3.1c | 1.6bc |
| N450 | 1.07a | 1.04ab | 2.14bc | 1.78abc | P180 | 0.52b | 0.45b | 0.18ab | 0.09ab | K360 | 2.13ab | 1.7 ab | 2.1b | 1.35bc |
| p-value | 0.044 | 0.057 | <0.001 | 0.006 | p_value | 0.246 | 0.115 | 0.223 | 0.153 | p_value | <0.001 | 0.277 | <0.001 | < 0.001 |
| CV (%) | 33.2 | 61.4 | 17.4 | 48.8 | CV_% | 92.6 | 123.5 | 62 | 82.3 | CV_% | 10.5 | 58.5 | 8 | 17.7 |
Disclaimer/Publisher’s Note: The statements, opinions and data contained in all publications are solely those of the individual author(s) and contributor(s) and not of MDPI and/or the editor(s). MDPI and/or the editor(s) disclaim responsibility for any injury to people or property resulting from any ideas, methods, instructions or products referred to in the content. |
© 2025 by the authors. Licensee MDPI, Basel, Switzerland. This article is an open access article distributed under the terms and conditions of the Creative Commons Attribution (CC BY) license (http://creativecommons.org/licenses/by/4.0/).
Copyright: This open access article is published under a Creative Commons CC BY 4.0 license, which permit the free download, distribution, and reuse, provided that the author and preprint are cited in any reuse.


