
Submitted:
21 March 2025
Posted:
24 March 2025
You are already at the latest version
Abstract
Perceptual awareness refers to the conscious detection and identification of a sensory event. In neuroelectric brain activity, it is associated with a modality-specific negative-going event-related potential, which can be observed as early as 100–300 ms after the stimulus onset. In this study, we measured brain activity during the auditory attentional blink, comparing brain responses when participants correctly reported both the first (T1) and second (T2) targets versus when only T1 was detected, but T2 was missed. To ensure robust statistical power, we pooled data across six previously published studies for the current analyses. Our results revealed that accurately reporting both T1 and T2 elicited a greater negativity between 150-300 ms over the frontocentral and central scalp area following T2 onset, compared to trials where T1 was detected but T2 was not. Additionally, a positive displacement, peaking around 800 ms over the central-parietal scalp area, followed the early negativity. Successful detection of both T1 and T2 was also associated with more pronounced alpha suppression, peaking at approximatively 500 ms before and 800 ms after T2 onset. These findings suggest that neural correlates of auditory awareness emerge both prior to the stimulus sequence an soon after T2 onset. The pre-stimulus difference in alpha power may serve as an indicator of lapses in attention, with greater alpha reflecting periods when participants were less engaged or off-task.
Keywords:
Attentional blink
; EEG
; perceptual awareness
; auditory
; lapse
; distraction
Introduction
Our auditory environment comprises many sounds, with only a subset being part of our perceptual experience. The latter is called perceptual awareness, which can be operationalized as the explicit reporting of hearing a particular stimulus [1]. Auditory perceptual awareness has been studied using bistable stimuli [1,2,3] or by comparing neural activity when a task-relevant stimulus is detected versus when it is not [4]. In the latter case, Gutschalk et al. [4] observed a negative wave between 70 and 300 ms post-stimulus onset when participants reported hearing the task-relevant stimulus (i.e., target) compared to when they did not. The amplitude distribution of this negative wave, referred to as “awareness-related negativity,” is consistent with generators located in the auditory cortex along the superior temporal gyrus. Notably, both detected and undetected targets generate comparable exogenous middle-latency evoked responses originating from the auditory cortex. This suggests that the awareness-related negativity is elicited after sensory registration and may reflect fluctuations in endogenous attention when the incoming stimulus is compared to a representation of the designated target stimulus. In other words, the awareness-related negativity is the difference between trials in which the comparison process yields a “match” versus when it yields a “no match” signal.
The present study uses an attentional blink paradigm to examine brain activity associated with perceptual awareness. In our paradigm, participants are presented with a sequence of auditory stimuli that may comprise a first (T1) target and a second (T2) target. When both auditory targets are present, and near each other in time, participants often fail to notice/report the 2nd (i.e., T2) target, commonly referred to as the Attentional blink (AB). The AB may reflect a deficit in consolidation where the sensory trace elicited by T2 is not transferred into working memory.
The consolidation account is supported by event-related potential (ERP) studies showing reduced P3b amplitude in the AB condition [5,6], an ERP component associated with context updating [7,8,9]. The P3b is sometimes preceded by an early negativity at central sites between 100 and 300 ms after probe onset [5]. The latter shows a similarity with the awareness-related negativity. These ERP modulations were revealed by subtracting ERPs elicited by the T1 alone from ERPs when both T1 and T2 were presented. This difference wave minimizes ERPs elicited by the distractors and highlights neural activity associated with the AB condition. However, this approach has weaknesses; namely, it uses conditions with different stimulus configurations, making it difficult to determine whether the difference wave isolated the awareness-related negativity or some other neural responses related to the stimulus configuration, such as an exogenous negative deflection peaking at about 100 ms after sound onset (i.e., the N1 wave) and a change detection negativity referred to as the mismatch negativity (MMN).
Shen et al. [10] compared hits versus misses in the AB condition (i.e., when T2 closely followed T1) and found a larger P3b response to hits than misses [for a similar result for visual AB see, 11]. There was no difference in evoked response amplitude preceding the P3b, which suggests that perceptual awareness may occur after the stimulus has been consolidated in working memory. However, only a subset of participants was included in that analysis, so the statistical power may have been insufficient to detect the awareness-related negativity.
In the present study, we re-analyzed EEG data from six auditory AB studies [5,10,12,13,14,15] with no overlapping participants. We focused only on the AB condition, sorted the trials as a function of participant responses, and compared neuroelectric activity when both T1 and T2 were correctly detected versus when only the target was. We anticipated an early negativity wave during the AB condition when both T1 and T2 were correctly detected versus when T2 was undetected.
The small or nonsignificant awareness-related negativity could be related to a lapse of attention and mind wandering. Prior studies have shown enhanced alpha power in trials where participants reported lapse of attention or mind wandering [16,17]. Hence, in addition to time domain analysis, we conducted time-frequency analysis to assess the link between pre-stimulus alpha power and the ERP amplitude elicited when both T1 and T2 were correctly detected versus when only T1 was reported. We anticipate greater alpha power preceding the presentation of T1 and T2.
Methods
Participants
Sixty-six participants (Mean age = 23.1 years; SD = 3.48; 39 female) who took part in one of six auditory AB EEG studies conducted by our group [5,10,12,13,14,15] met the criteria for the present study. We pooled data across these studies to ensure sufficient statistical power for the present analyses. Participants were between 18 and 30 years of age, had normal hearing assessed using pure tone audiometry, and had no history of psychiatric, neurological, or other significant illnesses. In the sample of participants, performance at the AB condition ranged from 52% to 85% accuracy (i.e., correctly detecting T2 in the trials where the T1 was also correctly detected). All participants had at least 15 trials included in the ERP average.
Stimuli and Procedure
In all studies, participants were presented with a sequence of 16 sounds. Each sound had a duration of 30 ms, including 2 ms linear onset and offset slopes. The stimulus onset asynchrony was fixed at 90, 105, 120 or 150 ms, depending on the experimental condition or study. Standard sounds, termed distractors, were pure tones with their frequency randomly chosen out of 21 frequencies equally spaced on a logarithmic scale between 529 Hz and 1,330 Hz. The target sound was composed of six 5-ms pulses with frequencies randomly selected from the set of frequencies. The probe sound was a fast frequency-modulated glide that changed smoothly from 636 Hz to 1,006 Hz. The stimuli were synthesized at a sampling rate of 44,100 Hz using Adobe Audition 1.5. They were presented binaurally at 75 dB sound pressure level (SPL) using insert earphones (ER-3A, Etymotic Research, Elk Grove, Illinois, USA). Stimulus presentation was controlled using Presentation software (version 13.0, Neurobehavioral Systems, Albany, California, USA).
The target was the fifth sound in the sequence, and the probe was presented immediately after the target [5,10,12] or at the second position (~200 ms) after the target [13,14,15]. All studies included control conditions in which the probe was presented at the seventh or eighth position after the target, only T1 or T2 was presented, or neither T1 nor T2 was presented. After each stimulus sequence, participants indicated whether T1 and T2 were presented. The questions appeared in the center of the computer screen and remained until the participant responded by pressing “1” for “yes” or “2” for “no” on a keyboard.
The auditory stimulation and electroencephalography (EEG) recording took place in a double-walled, sound-attenuating booth. Participants sat one meter in front of a screen. They were instructed to keep their eyes open and to maintain their gaze on the fixation cross to minimize eye movements. A white fixation cross appeared in the center of the computer screen, starting 1000 ms prior to sequence onset and ending 500 ms after the sequence. Participant’s compliance with the instructions was monitored using a video camera.
Participants familiarized themselves with the stimuli and tasks in a practice block, during which all trial types were repeated twice. All participants met a criterion of at least 60% correct T1 and T2 detection when both were present in the sequence and T2 was presented at the +1 or +2 position.
EEG Recording
EEG was recorded initially from 64 or 76 electrode montage using a NeuroScan SynAmps 2 (Compumedics, El Paso, TX) or a BioSemi Active Two acquisition system (BioSemi V.O.F., Amsterdam, The Netherlands). All signals were bandpass filtered between 0.16 Hz and 100 Hz, sampled at a rate of 500 or 512 Hz, digitized, and stored continuously.
EEG Preprocessing
The data were analyzed using the Brain Electrical Source Analysis (BESA) software (BESA Research 7.1; MEGIS, Gräfelfing, Germany). For each participant, ocular movements were identified from the continuous EEG recording and used to generate a set of components that best explained the eye movement artifacts. The scalp projections of these components were then subtracted from the EEG signal to minimize ocular contamination, such as blinks and lateral and vertical eye movements.
The EEG datasets sampled at 512 Hz were decimated to a 500 Hz sampling rate. All EEG datasets were converted to a common 52-electrode montage shared by all participants and comprised electrodes from the 10-20 system. The electrodes below and lateral to the eyes, FT9, FT10, TP9, TP10, P9, P10, and Iz were not included in the analyses because they were missing in some participants and tend to be noisier than the scalp electrodes. The continuous EEG was first bandpass .5 to 90 Hz and then parsed into epochs according to the probe onset. Epochs comprised a 1000-ms pre- and post-stimulus interval time-locked on T2 onset. The baseline correction used the mean amplitude between -1000 and -800 ms before T2 onset. Those epochs, including extreme values (peak-to-peak deflections exceeding 120 µV), were automatically marked and excluded from the averages. The proportion of epochs included in the averages ranged among the participants from 90 to 100%.
ERP Analysis
Previous reports presented results related to AB and how it varies as a function of various experimental conditions. The present study focuses only on neural activity elicited during the AB condition when both T1 and T2 were detected (Hit) versus when T1 was detected but T2 was missed. Only participants with ERP averages with more than 15 accepted trials for hits and misses were included in the ERP and time-frequency analysis. A preliminary analysis did not reveal a significant interaction between condition (hits, misses) and T2 position (+1 vs +2) nor SOAs. Therefore, the T2-locked evoked brain activity elicited by the +1 and +2 T2 position and SOAs were combined, and further analyses focused on the difference between hits and misses.
Time-Frequency Analysis
We employed a complex demodulation method with 1 Hz wide frequency bins and a 50 ms time resolution within the 2-50 Hz range to decompose single-trial EEG data into a time-frequency representation. To account for individual differences in baseline activity, the mean signal power for each participant was normalized to a baseline interval, which was defined as the period between -1000 and -800 ms before T2 onset. Our primary focus in the time-frequency analysis was on the alpha band (8–12 Hz), as this frequency range has been consistently linked to attention-related processes in previous studies [14,18]. By isolating this specific frequency band, we aimed to explore its role in perceptual awareness during the auditory AB.
Results
Figure 1 shows the group mean ERPs elicited by hits and misses time-locked on T2 onset at the midline central-parietal site (CPz). The ERP amplitude before T2 onset was comparable for hits and misses. However, the ERPs associated with correctly identifying T1 and T2 were more negative between 100 and 300 ms after T2 onset than when participants failed to report the presence of T2. The difference in ERP amplitude was most prominent over the left central-parietal scalp area and inverted in polarity at mid-temporal and inferior temporal-parietal sites (not shown), consistent with generators located in the superior temporal gyrus. This early modulation was followed by an enhanced positivity peaking at about 800 ms in the midline right central areas.
A clustered-based statistic on ERP amplitude revealed significant differences between ERPs elicited by hits and misses during the AB condition (Table 1). The first, third and fourth clusters correspond to the positive modulation with larger positivity for hits than misses at central and parietal sites, which reversed polarity at frontopolar and inferior frontal electrodes (Cluster #3 and #4). The second cluster shows a difference in ERP amplitude between hits and misses that peaked at about 236 ms after T2 onset over the central and central-parietal scalp areas.
Figure 2 shows the group mean temporal spectral evolution (TSE) spectrograms for the whole trial time-locked to T2 onset. The hits and misses were associated with transient theta power (~5 Hz) at sequence onset, followed by sustained alpha power (~10 Hz) throughout the stimulus sequence, which was largest over the left and right parietal scalp areas (not shown). The cluster analysis procedure and permutation-based statistics revealed two significant spatiotemporal clusters (Table 2). The first cluster started at 550 ms after T2 and ended at the end of the epoch. The second cluster revealed greater pre-stimulus alpha synchronization starting at -750 ms and ending 250 ms before T2 onset.
Brain Behavior Correlations
We used Spearman’s rho to evaluate the relationship between ERP modulations and AB performance. There were no significant correlations between the AB performance and the amplitude of the negative or positive modulations. A significant negative correlation was found between the amplitude of the early negativity and late positivity (rs = -0.271, p = 0.028), indicating that as the negativity between 200 and 260 ms increased, the positivity between 750 and 850 ms following T2 became more pronounced.
Discussion
The correct detection of T1 and T2 was associated with a transient negative wave between 150-300 ms following T2 onset, which was followed by greater P3b amplitude. The timing and amplitude distribution of the early negativity show similarities with the awareness-related negativity observed when listeners detect a pre-defined target embedded in distractors [1,4,19,20]. In the present study, the negativity associated with correctly reporting the presence of T2 was largest over central scalp sites and inverted polarity at inferior parietal-occipital sites, consistent with sources located in the superior temporal gyrus. This is consistent with findings from magnetoencephalography showing sources of awareness-related negativity in the superior temporal gyrus [4]. Moreover, using high-field fMRI (i.e., 7 Tesla), Heynckes et al. [21] showed a difference in neural activity within primary auditory areas for detected versus undetected targets, with no significant difference in neural activities in the planum polare or planum temporale.
The findings from the present study differ from those of a prior study from our group focusing on the AB condition, which reported only greater P3b amplitude when T1 and T2 were both detected [10]. Here, with greater statistical power with a larger sample size, the data show a clear and unequivocal awareness-related negativity associated with the participants’ perception of T2. Our findings highlight the importance of using a large sample size when investigating the neural correlates of perceptual awareness.
In this study, the data support that the difference in T2 evoked-related activity is related to attentional allocation, with greater attention-related negativity when participants correctly detect both targets than when only the first target was correctly identified. Prior studies of auditory selective attention have shown greater negativity between 100 and 300 ms after sound onset for attended (i.e., task-relevant) than unattended (i.e., task-irrelevant stimuli [22,23]. That attention-related negativity is greater in amplitude when the task-relevant stimuli belong to a perceptual auditory object [24,25,26,27]. In the context of AB paradigm, the hit trials indicate more focused attention, which is related to greater attention-related negativity. In contrast, weaker attentional focus or lapse of attention leads to those trials where the second target T2 is undetected.
In the present study, oscillations observed before T2 exhibit a distinct 10-Hz rhythm, which aligns with the stimulation rate used in our AB experiments. Interestingly, this 10-Hz entrainment was evident despite slight variations in the presentation rates across studies. After T2, however, the 10-Hz entrainment disappears, even though the stimulus sequence continues. Previous research suggests that alpha power is a key indicator of attentional engagement, with lower alpha reflecting focused attention on the task, while higher alpha activity is associated with attention lapses or mind-wandering wandering [16,17]. If participants' attention drifts during the AB task, this could hinder T2 detection. The increased alpha power observed prior to T2 onset in our study supports this hypothesis.
The awareness-related negativity observed in the present study was followed by a positive displacement peaking at about 800 ms after T2 onset over the parietal region. The positive displacement bears similarities to the P3b component, although it exhibited a more lateralized and anterior distribution than the typical P3b. This modulation may reflect post-perceptual processes associated with decision-making and response preparation rather than awareness. The delayed and or reduced P3b in the AB condition has often been interpreted as indicative of a deficit in memory consolidation [5,6,28,29]. However, our findings reveal a difference in pre-stimulus alpha power, consistent with a lapse of attention. Thus, the deficits in memory consolidation may be related to the fact that participants’ attention was fully engaged during that trial.
Conclusion
The current study demonstrates that the correct identification of both T1 and T2 is associated with two distinct neural modulations: a negative and positive readiness potential (RP), peaking around 250 ms and 800 ms after T2 onset, respectively. The early negative modulation bears a resemblance to awareness-related negativity (ARN), a component typically linked to the detection of perceptual changes or shifts in attention. Meanwhile, the later positive modulation aligns with the P3b response, often interpreted as reflecting post-perceptual cognitive processes such as decision-making and response preparation. These findings suggest a temporal distinction in the neural processes underlying the successful identification of T1 and T2. Future studies could further elucidate the source of these modulations, particularly within the auditory cortex, by employing intracerebral recordings in epileptic patients or utilizing high-field functional magnetic resonance imaging techniques. Such research could provide valuable insights into the neural mechanisms responsible for both early and late modulations in cognitive processing, especially in the context of attentional shifts and decision-making.
Author Contributions
C.A. and D.S. were involved in conception and study design. D.S. acquired the data. M.O preprocessed and analyzed the EEG data. C.A., M.O., L.J.B, D.S., and B.R. contributed to interpretation, manuscript preparation, and final approval of the manuscript.
Ethics Statement
The experimental protocol was approved by the Human Research and Ethics Committee at Baycrest Centre, Toronto, Ontario, Canada.
Acknowledgments
This research was supported by a grant from the Natural Sciences and Engineering Research Council (RGPIN-2021-02721) to Claude Alain.
Competing Interests
The authors declare no competing interests.
References
- Dembski, C., C. Koch, and M. Pitts. Perceptual awareness negativity: a physiological correlate of sensory consciousness. Trends Cogn Sci, 2021, 25, 660–670. [Google Scholar]
- Alain, C., et al. Neural alpha oscillations index context-driven perception of ambiguous vowel sequences. iScience 2023, 26, 108457. [Google Scholar] [CrossRef] [PubMed]
- Higgins, N.C., et al. Adaptation in the sensory cortex drives bistable switching during auditory stream segregation. Neurosci Conscious 2023, niac019. [Google Scholar]
- Gutschalk, A., C. Micheyl, and A.J. Oxenham, Neural correlates of auditory perceptual awareness under informational masking. PLoS Biol, 2008. 6(6): p. e138.
- Shen, D. and C. Alain. Neuroelectric correlates of auditory attentional blink. Psychophysiology 2010, 47, 184–91. [Google Scholar]
- Vogel, E.K. and S.J. Luck, Delayed working memory consolidation during the attentional blink. Psychon Bull Rev, 2002. 9(4): p. 739-43.
- Lindin, M., M. Zurron, and F. Diaz, Changes in P300 amplitude during an active standard auditory oddball task. Biol Psychol, 2004. 66(2): p. 153-67.
- Barcelo, F. and R.T. Knight, An information-theoretical approach to contextual processing in the human brain: evidence from prefrontal lesions. Cereb Cortex, 2007. 17 Suppl 1: p. i51-60.
- Polich, J. , Updating P300: an integrative theory of P3a and P3b. Clin Neurophysiol, 2007. 118(10): p. 2128-48.
- Shen, D., D. T. Vuvan, and C. Alain, Cortical sources of the auditory attentional blink. J Neurophysiol, 2018. 120(2): p. 812-829.
- Kranczioch, C., S. Debener, and A.K. Engel, Event-related potential correlates of the attentional blink phenomenon. Brain Res Cogn Brain Res, 2003. 17(1): p. 177-87.
- Shen, D. and C. Alain, Temporal attention facilitates short-term consolidation during a rapid serial auditory presentation task. Exp Brain Res, 2011. 215(3-4): p. 285-92.
- Shen, D. and C. Alain, Implicit temporal expectation attenuates auditory attentional blink. PLoS One, 2012. 7(4): p. e36031.
- Shen, D., B. Ross, and C. Alain, Temporal cuing modulates alpha oscillations during auditory attentional blink. Eur J Neurosci, 2016. 44(2): p. 1833-45.
- Shen, D., B. Ross, and C. Alain. Temporal deployment of attention in musicians: Evidence from an attentional blink paradigm. Ann N Y Acad Sci 2023, 1530, 110–123. [Google Scholar]
- Compton, R.J., D. Gearinger, and H. Wild, The wandering mind oscillates: EEG alpha power is enhanced during moments of mind-wandering. Cogn Affect Behav Neurosci, 2019. 19(5): p. 1184-1191.
- Boudewyn, M.A. and C.S. Carter, I must have missed that: Alpha-band oscillations track attention to spoken language. Neuropsychologia, 2018. 117: p. 148-155.
- Backer, K.C., M. A. Binns, and C. Alain, Neural dynamics underlying attentional orienting to auditory representations in short-term memory. J Neurosci, 2015. 35(3): p. 1307-18.
- Dykstra, A.R. , et al., Neural Correlates of Auditory Perceptual Awareness and Release from Informational Masking Recorded Directly from Human Cortex: A Case Study. Front Neurosci, 2016. 10: p. 472.
- Konigs, L. and A. Gutschalk, Functional lateralization in auditory cortex under informational masking and in silence. Eur J Neurosci, 2012. 36(9): p. 3283-90.
- Heynckes, M., et al. Layer-specific correlates of detected and undetected auditory targets during attention. Curr Res Neurobiol 2023, 4, 100075. [Google Scholar]
- Alho, K. , et al., Brain mechanism of selective listening reflected by event-related potentials. Electroencephalogr Clin Neurophysiol, 1987. 68(6): p. 458-70.
- Hansen, J.C. and S.A. Hillyard, Endogenous brain potentials associated with selective auditory attention. Electroencephalogr Clin Neurophysiol, 1980. 49(3-4): p. 277-90.
- Alain, C., A. Achim, and F. Richer, Perceptual context and the selective attention effect on auditory event-related brain potentials. Psychophysiology, 1993. 30(6): p. 572-80.
- Alain, C. and S.R. Arnott, Selectively attending to auditory objects. Front Biosci, 2000. 5: p. D202-12.
- Alain, C. and D.L. Woods, Signal clustering modulates auditory cortical activity in humans. Percept Psychophys, 1994. 56(5): p. 501-16.
- Arnott, S.R. and C. Alain, Effects of perceptual context on event-related brain potentials during auditory spatial attention. Psychophysiology, 2002. 39(5): p. 625-32.
- Akyurek, E.G., M. Leszczynski, and A. Schubo, The temporal locus of the interaction between working memory consolidation and the attentional blink. Psychophysiology, 2010. 47(6): p. 1134-41.
- Arnell, K.M. Visual, auditory, and cross-modality dual-task costs: electrophysiological evidence for an amodal bottleneck on working memory consolidation. Percept Psychophys 2006, 68, 447–57. [Google Scholar]
Figure 1.
Brain responses elicited when the primary and secondary targets were correctly detected versus when only the primary target was detected. A) Group Mean event-related potential time-locked on T2 onset (0 ms) at the midline central parietal electrode (CPz) for hits and misses. The color shaded areas show the group mean standard deviation. The gray shaded areas show the interval where the amplitude difference was significant. B) Iso-contour maps for the difference in ERP amplitude between hits and misses. The contour maps show the mean amplitude for the early (216-256 ms) and late (780-820 ms) modulations following the probe onset.
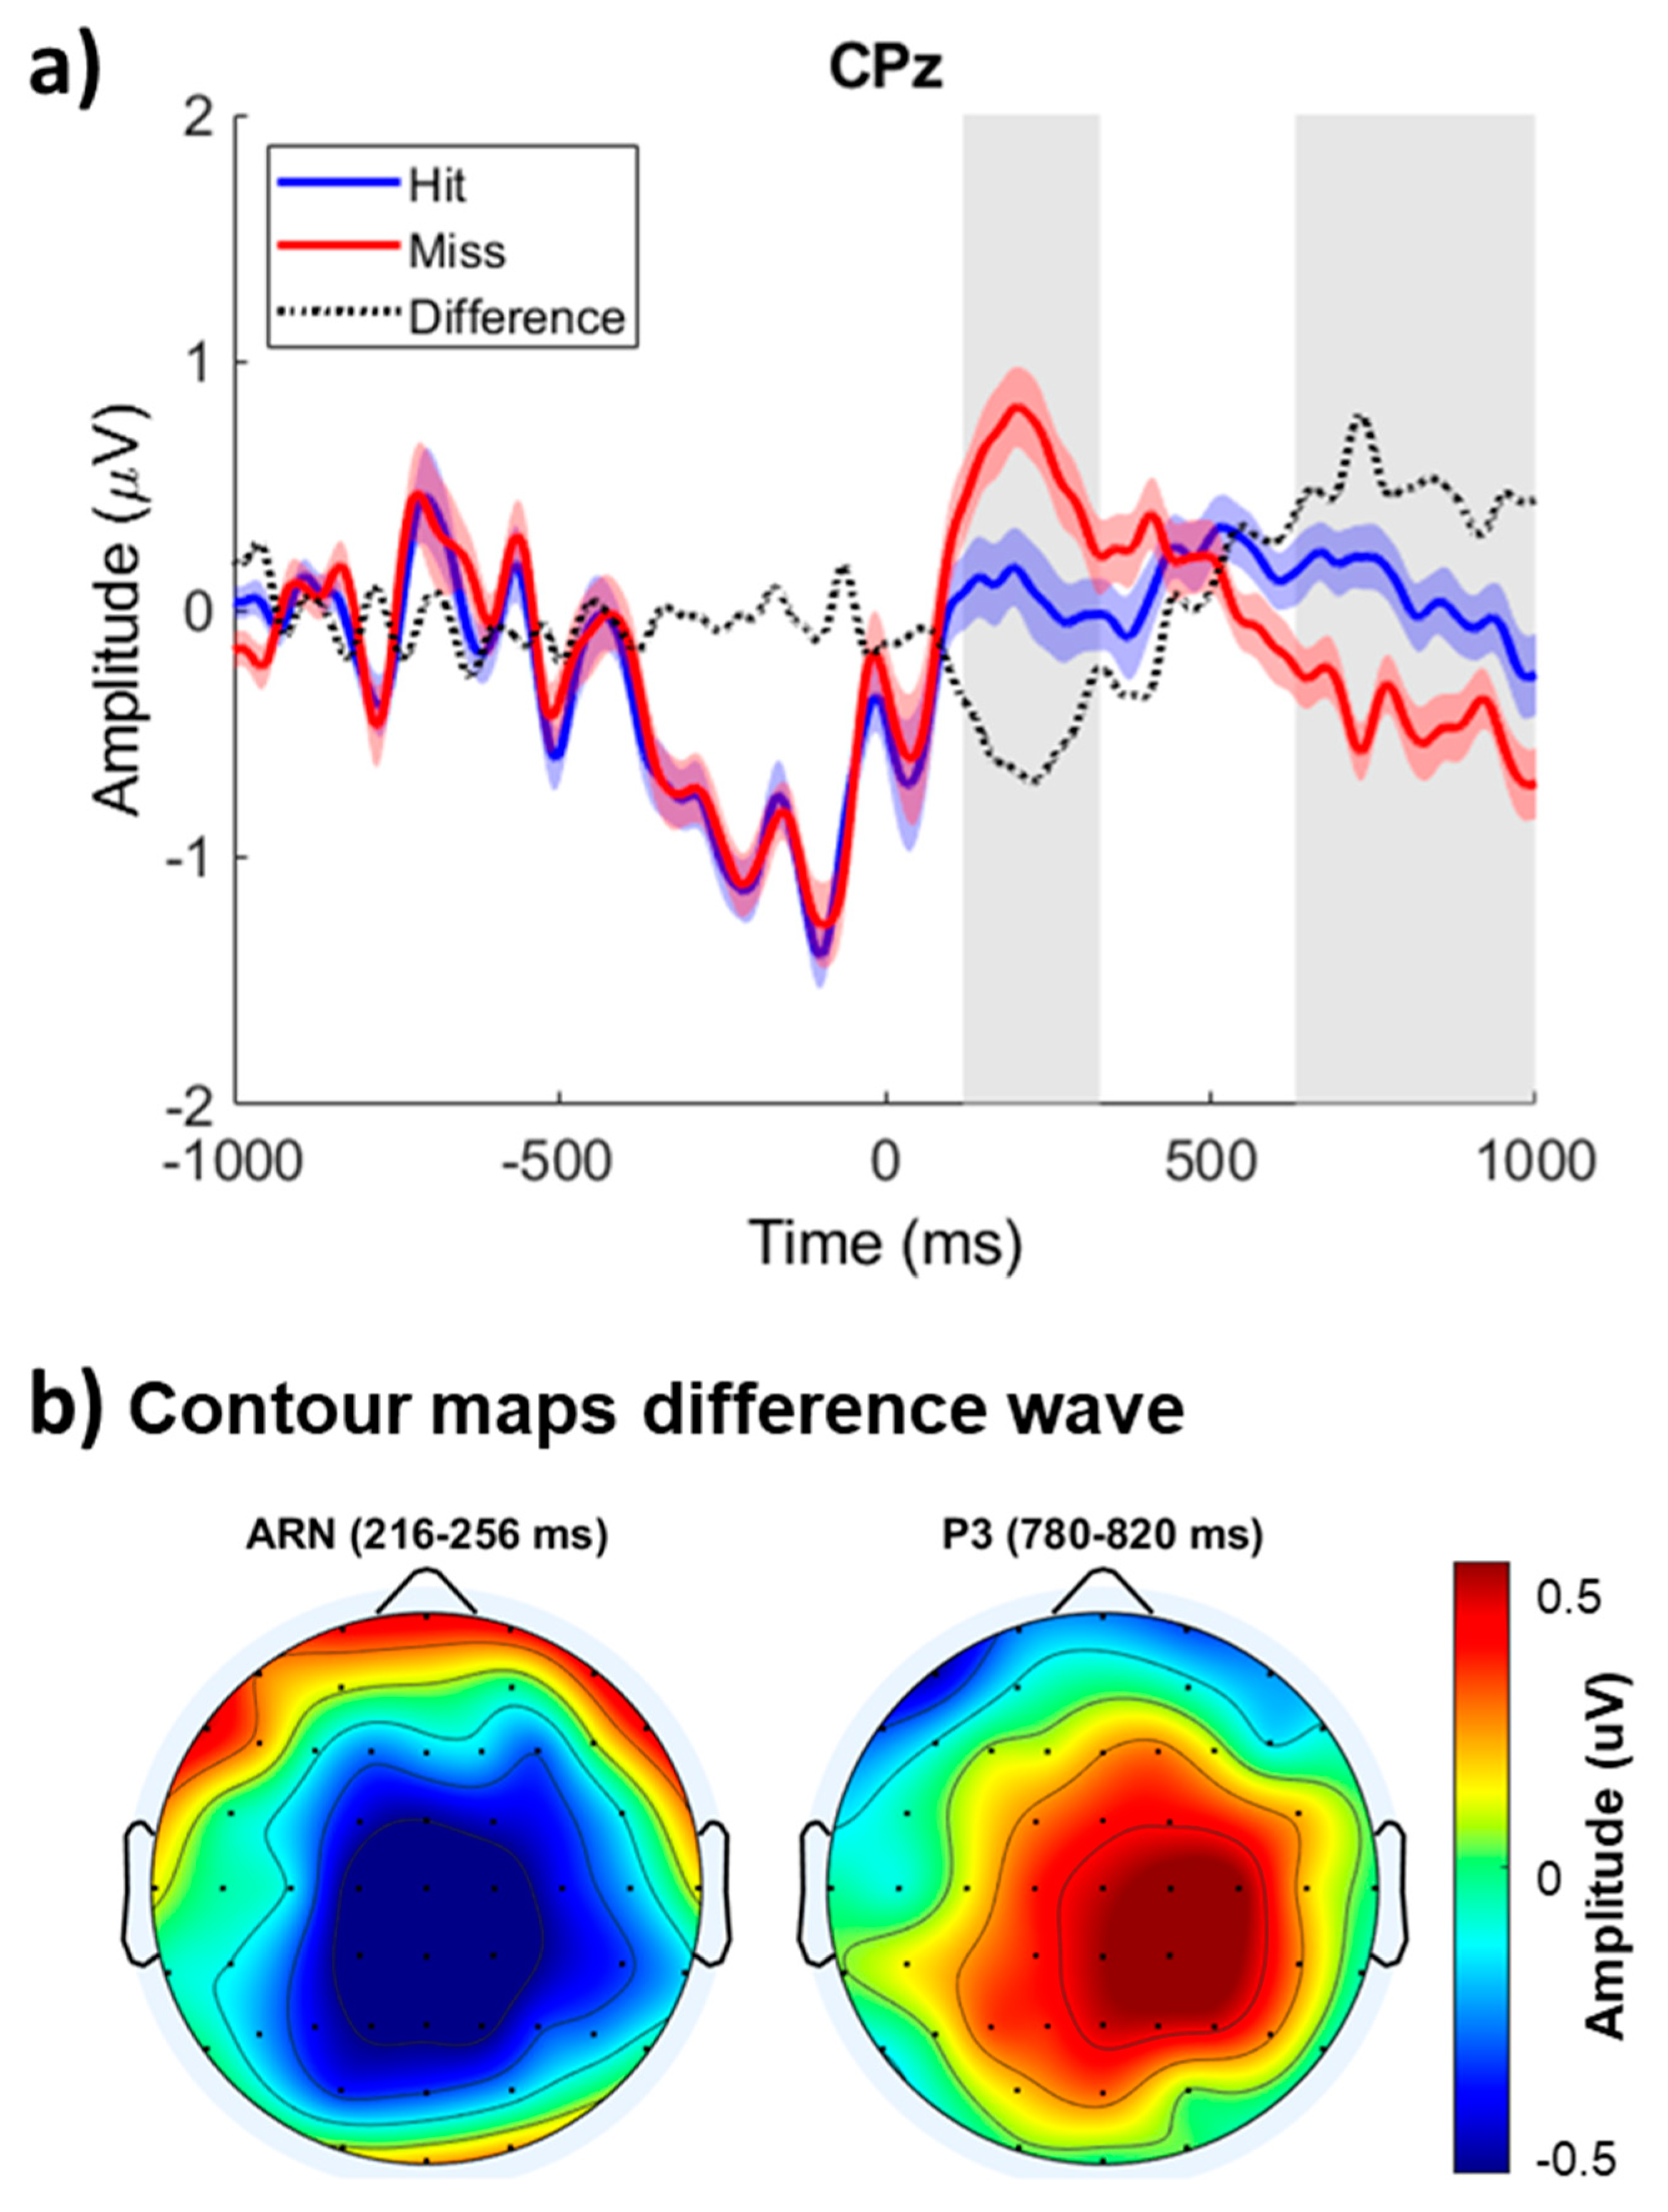
Figure 2.
Alpha power (% change relative to baseline -1000 to -800 ms) before and after the onset of the secondary target. Time-frequency for hits (left panel) and misses (right panel) from the right central electrode (C4). The dashed box highlights the intervals of differences in alpha power (8-12 Hz). Alpha synchronization was higher for the misses.
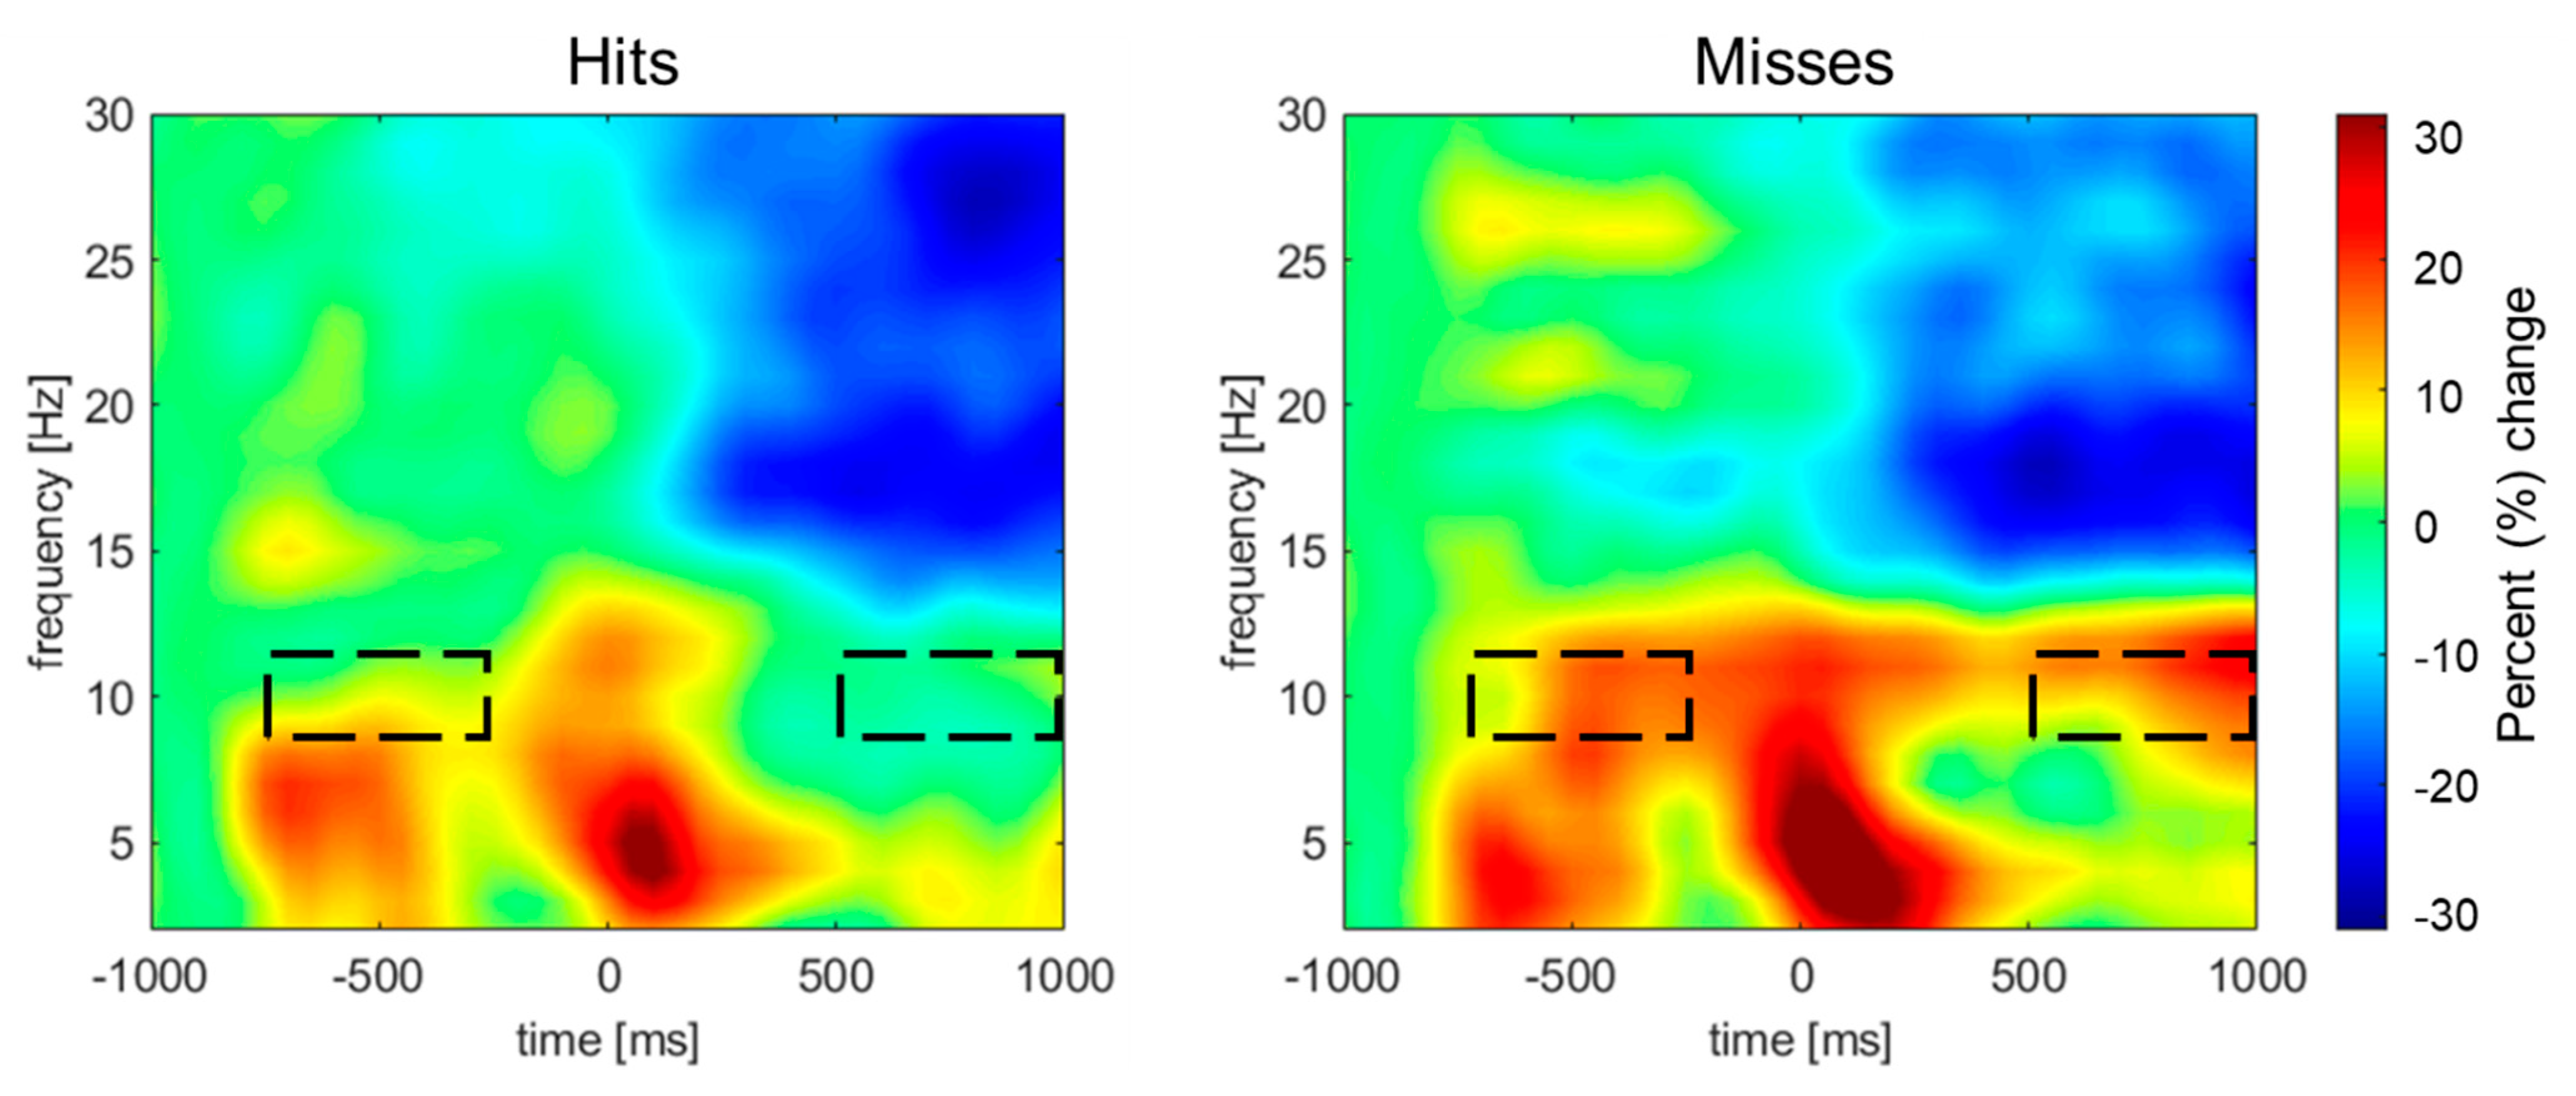

Table 1.
Clustered statistics of ERP amplitude.
| Cluster # | Range (ms) | Peak latency/electrode | Electrodes | p Values |
|---|---|---|---|---|
| 1 | 616 to 998 | 798ms/C4 | C4, P4, P3, O2, O1, P7, Pz, TP7,Oz,PO4, PO3, CP5, CP6, CP1, CP2, FC2, FC1, CPz, P1, POz, P2, P6, P5, C1, C2, F2, FCz, Cz | <0.001 |
| 2 | 92 to 430 | 236ms/CP1 | F4, C3, C4, P4, P3, P8, Pz, TP7, TP8, PO4, PO3, CP5, CP6, CP1, CP2, FC2, FC1, FC6, CPz, P1, POz, P2, P6, C6, P5, C1, C2, C5, F2, F1, FCz, Cz | <0.001 |
| 3 | 526 to 704 | 646ms/FPz | Fp1, Fp2, F4, F8, F7, AF3, AF4, F6, AF8, F5, AF7, Fpz | 0.004 |
| 4 | 706 to 998 | 740ms/AF7 | Fp1, Fp2, F4, F8, F7, AF3, AF4, F6, AF8, F5, AF7, Fpz | 0.006 |
Table 2.
Clustered statistics of alpha power (8-12 Hz).
| Cluster # | Range (ms) | Peak latency/electrode | Electrodes | p Values |
|---|---|---|---|---|
| 1 | 550 to1000 | 850/C4 | Fp1, Fp2, F4, F3, C3, C4, P4, P3, O2, O1, F8, F7, T8, T7, P8, P7, Pz, Fz, TP7, TP8, Oz, PO4, PO3, CP5, CP6, CP1, CP2, FC2, FC1, AF3, AF4, FC6, FC5, CPz, P1, POz, P2, P6, C6, P5, C1, C2, C5, F2, F6, F1, AF8, F5, AF7, Fpz, FCz, Cz | <0.001 |
| 2 | -700 to -250 | 500/C4 | C4, CP6, CP2, C6, C1, C2, Cz | =0.023 |
Disclaimer/Publisher’s Note: The statements, opinions and data contained in all publications are solely those of the individual author(s) and contributor(s) and not of MDPI and/or the editor(s). MDPI and/or the editor(s) disclaim responsibility for any injury to people or property resulting from any ideas, methods, instructions or products referred to in the content. |
© 2025 by the authors. Licensee MDPI, Basel, Switzerland. This article is an open access article distributed under the terms and conditions of the Creative Commons Attribution (CC BY) license (http://creativecommons.org/licenses/by/4.0/).
Copyright: This open access article is published under a Creative Commons CC BY 4.0 license, which permit the free download, distribution, and reuse, provided that the author and preprint are cited in any reuse.


