
Submitted:
20 March 2025
Posted:
21 March 2025
You are already at the latest version
Abstract
Rabbit meat is a high-protein, low-fat health food with increasing consumption especially in the Asia-Pacific region. Therefore, muscle growth and development of meat rabbits are important economic traits. In order to reveal the primary signal pathway related to muscle growth, We first compared the body weight between two rabbit breeds with distinct growth rates (fast-growing(Checkered Giant (Ju)) vs. slow-growing (Sichuan linen (Ma)), and then examined the diameter of muscle fiber on 28-day, 56-day and 84-day. The transcriptome of thigh and longissimus thoracis from 56-day-old and rabbits was performed. The results showed the body weight of Ju rabbit was significantly higher than that of Ma rabbit after 3-week age (p>0.05), and the diameter of thigh and the longissimus dorsi muscle fiber from Ma rabbit was significantly bigger than that from Ju rabbit (p>0.05) at 56-day of age. Transcriptomic analysis showed that 284 and 305 DEGs were screened in thigh muscle and longissimus dorsi muscle, respectively using |log2FC|>1 and padj< 0.05. GO analysis of DEGs Ma vs Ju was performed, and these DEGs in the thigh muscle were enriched in these terms related to muscle cell migration, smooth muscle cell migration, sarcomere, myofibril, actin filament bundle, and those in Longissimus dorsi muscle were enriched in these terms related to muscle cell migration, smooth muscle cell migration, muscle structure development, actin cytoskeleton, contractile fiber, myofibril, myosin complex and actin filament binding. Sequentially, GO, KEGG and PPI analysis of DEGs or co-expressive DEGs in thigh and longissimus dorsi muscle suggested that HIF-1 signaling pathway and Glycolysis/Gluconeogenesis is related to muscle development between Ma and Ju rabbit, and the expressive difference of hub-genes related to energy metabolism might is the primary reason for the difference in muscle development between Ma and Ju rabbit.
Keywords:
Muscle fiber
; Muscle development
; Transcriptome
; Rabbit
1. Introduction
In 2021, 570 million meat rabbits provided 900,000 tons of rabbit meat in the world,and the rabbit (Oryctolagus cuniculus) is regarded as an ideal meat-producing animal in theory, because of its short life cycle, short gestation period, large number of litters, and high feed conversion ability [1]. It contains high protein, essential amino acids and a variety of trace elements. In addition, its sensitization and low cholesterol levels have also been demonstrated [1,2]. The thigh muscle and the longissimus dorsi muscle both are the focuses of molecular breeding. With the development and application of molecular biology and bioinformatics, it is possible to reveal the basis of meat rabbit production performance at the molecular level [3]. Therefore, finding muscle growth and development of meat rabbit genes has become particularly significant.
In recent years, RNA sequencing (RNA-Seq) has become a popular choice for gene expression studies [4,5,6,7]. Moreover, sequencing technology is continuously improving, and the costs have decreased. In particular, RNA-Seq has been used to simultaneously measure multitudinous of gene expression levels and to discover differentially expressed genes between two or more groups of a variety of applications [4,8,9]. Therefore, in an increasing number of studies, RNA sequencing has been used to screen and identify key regulatory genes in biological processes such as growth, development, metabolism, and diseases [10,11,12,13,14].
Sichuan linen (Ma) rabbits are an important local domestic rabbit resource with strong adaptability and excellent meat quality, suitable for breeding in hilly areas; Checkered Giant (Ju) rabbits have huge body size and better meat performance [15]. Existing studies have found that differential expression of some genes leads to changes in a subset of skeletal muscle characteristics (e.g., fiber type, oxidative capacity, and insulin binding). The expression of myosin heavy chain (MyHC) gene isoforms (I, IIa, IIx, IIb) [16] and actin (ACTN) [17] and troponin C (TNNC) [18] in skeletal muscle has been reported to be an important feature of a muscle fiber structure and function [19]. These genes such as myostatin (MSTN) [20], muscle regulation factors (MRFs), paired box (PAX), myogenic transcription factor 2C (MEF2C), and insulin-like growth factors (IGFs) [21] form a complex regulatory network involved in regulating physiological activities such as skeletal muscle growth, myofiber type conversion, and metabolism of intramuscular fat deposition [22]. Muscle transcriptional helper studies in a variety of animal models have preliminarily elucidated the transcriptional regulatory network for physiological processes such as muscle fiber type, muscle proliferation and hypertrophy [23]. The objective of the study is to explore the differences in transcriptomic profiles of thigh and longissimus dorsi muscle from Ma and Ju rabbit, thus revealing the hub-gene and primary signaling pathway caused the differences in muscle development between Ju and Ma rabbit.
2. Materials and Methods
2.1. Animals and Muscle Tissue Samples
Ma (n = 9) and Ju (n = 9) were feed with complete diet (Table 1). We collected thirty-six thigh muscle and longissimus dorsi muscle samples of two rabbit breeds (28-day-old, 56-day-old, and 84-day-old, male, same environmental condition and feeding) from the meat rabbit research base of Sichuan Academy of Animal Husbandry Science. All samples were rinsed three times with PBS. Then, the samples were divided into two groups. One group was immediately frozen in liquid nitrogen until RNA extraction was needed, and the other was sectioned into muscle blocks and stored in muscle-specific fixation solution (SAKURA, RAS,USA) to generate paraffin sections.
2.2. Paraffin Section Preparation and Analysis
Muscle tissue samples were collected from the thigh muscle and the longissimus dorsi muscle of rabbit at 28, 56, and 84 days of age. The tissue samples were fixed in 10% formalin in PBS at room temperature for 3 days and then dehydrated, embedded, and sectioned (thickness=4㎛) for routine H&E staining [24]. Images were collected using Olympus BX-53 under 10× eyepiece and 20× objective lens. There were 3 biological replicates in each stage. For each slice, the area of muscle fibers in 3 non-overlapping and non-lost visual fields were measured through image J. The ANOVA in IBM SPSS Statistics 27.0.1 was used for analyzing the average cross-sectional area (CSA)of each stage .
2.3. RNA Sample Detection and Library Construction
RNA integrity was assessed by using the RNA Nano 6000 Assay Kit of the Bioanalyzer 2100 system (Agilent Technologies, CA, USA). Total RNA was used as an input material for the RNA sample preparations. Briefly, mRNA was purified from total RNA using poly-Toligo-attached magnetic beads. Fragmentation was carried out by using divalent cations under elevated temperature in First Strand Synthesis Reaction Buffer(5X). First strand cDNA was synthesized by using random hexamer primer and M-MuLV Reverse Transcriptase (RNase H-). Second strand cDNA synthesis was subsequently performed by using DNA Polymerase I and RNase H. Remaining overhangs were converted into blunt ends via exonuclease/polymerase activities. After adenylation of 3’ ends of DNA fragments, Adaptor with hairpin loop structure were ligated to prepare for hybridization. In order to select cDNA fragments of preferentially 370~420 bp in length, the library fragments were purified with AMPure XP system. Then PCR was performed with Phusion High-Fidelity DNA polymerase, Universal PCR primers and Index (X) Primer. At last, PCR products were purified (AMPure XP system) and library quality was assessed on the Agilent Bioanalyzer 2100 system.
2.4. Clustering and Quality Control of RNA-Seq Libraries
The clustering of the index-coded samples was performed on a cBot Cluster Generation System by using TruSeq PE Cluster Kit v3-cBot-HS (Illumia) and according to the manufacturer’s instructions. After cluster generation, the library preparations were sequenced on an Illumina Novaseq platform and 150 bp paired-end reads were generated.
Raw data (raw reads) of the fastq format were first processed through fastp software. In this step, clean data (clean reads) were obtained by removing reads containing adapter, reads containing ploy-N and low-quality reads from raw data. At the same time, Q20, Q30, and GC content the clean data were calculated. All the downstream analyses were based on the clean data with high quality.
2.5. Analysis of Sequencing Data
Reference genome and gene model annotation files were directly downloaded from genome website. Index of the reference genome was built by using Hisat2 v2.0.5 and paired-end clean reads were aligned to the reference genome by using Hisat2 v2.0.5. FPKM, expected number of Fragments Per Kilobase of transcript sequence per Millions base pairs sequenced. FeatureCounts v1.5.0-p3 was used to count the reads mapped to each gene. Then, FPKM of each gene was calculated based on the length of the gene and reads mapped to this gene. Differential expression analysis of two conditions/groups (two biological replicates per condition) was performed by using the DESeq2 R package (1.20.0). The resulting P-values were adjusted by using the Benjamini and Hochberg’s approach for controlling the false discovery rate. Genes with an adjusted P-value <=0.05 found by DESeq2 were assigned as differentially expressed. Gene Ontology (GO) enrichment analysis of differentially expressed genes was implemented by the clusterProfiler R package, in which gene length bias was corrected. GO terms with the corrected P-value less than 0.05 were considered as significantly enriched by differential expressed genes. We used clusterProfiler R package to test the statistical enrichment of differential expression genes in KEGG pathways. We used the online Search Tool for the Retrieval of Interacting Genes (STRING database, Version 10.5; http://string-db.org/) to build a protein-protein interaction (PPI) network based on broad function of genome-wide data [25]. After carefully calculating, the threshold >0.150 was applied to build the PPI network, and the cytoscape software (version 3.7.0; http://cytoscape.org/) was used to visualize and analyze the biological networks. The nodes of the networks represented “hub genes” that highly interacted with other genes or proteins.
3. Results
3.1. The Changes in the Area of Muscle Fibers of Rabbits’ Skeletal Muscle at Different Stages
The body weight of Ju rabbit is significantly higher than that of Ma rabbit after 3-week age (Figure 1A). To better observe the changes in the characteristics of rabbits’ thigh muscle and longissimus dorsi muscle, we generated paraffin-sections of the two muscle tissue sites in three developmental stages (Figure 1B and C). We found that as they got older, their cross-sectional areas of muscle fibers increase significantly. On 56-day-old stage, the CAS differed significantly between the same muscle tissue of Ma and Ju (Figure 1D and E) (Table S1), but the area of thigh and longissimus dorsi muscles has no difference (Figure 1F). In the nest experiment, we explored the transcriptome profiles of thigh and longissimus dorsi muscle from two breed at 56-day-old.
3.2. Summarization of RNA-Seq
Twelve libraries of 56-day-old rabbits’ thigh and longissimus dorsi muscle were constructed. All libraries obtained raw data with an average of 40.25 to 47.07 million. Under strict filtering conditions, libraries contained 6.51G effective clean bases, accounting for approximately 98.01 % of the raw reads. Furthermore, the Q30 = 94.58 % of all libraries (Table 2).
Firstly, we analyzed the exons distribution of mRNAs. All candidate mRNAs were found to be mainly spliced by exons (77.33%), introns (7.93 %), and intergenic regions (14.74 %) (Figure 2A) (Table S3). After we calculated the expression values (FPKM) of all genes in each sample, and showed the distribution of gene expression levels in different samples by box plots (Figure 2B). The expression levels of co-expression genes in all samples were analyzed using Pearson’s correlation (Figure 2C), and the average correlation coefficient of duplicate samples within the same tissue and breed (r=0.950, p<0.01) was higher than that within breed (r=0.942, p<0.01). Average correlation coefficient within the breed (r=0.945, p<0.01) and within the same muscle (r=0.937, p<0.01) was higher than that between different breed and muscle (r=0.923, p<0.01). The cluster-heatmap of DEGs showed the expressive pattern of all DEGs was divided into 4 group: Ju_Leg, Ju_Long, Ma_Leg and Ma_Long (Figure 2D). The results suggested RNA-seq high reproducibility and reliability.
3.3. Differential Expression Analysis of mRNAs in Rabbit Skeletal Muscle
We subsequently performed differential expression analysis on genes in the thigh muscle and longissimus dorsi muscle of two rabbit breeds at 56 days post-natal. Venn diagram analysis revealed 11,492 and 11,728 co-expressed genes in the thigh and longissimus dorsi muscles, respectively, across both breeds (Figure 3A and B). Through comparative analysis between the Ma and Ju breeds using established thresholds (|log2FC| > 0 and padj < 0.05; see Table S4), we identified 1,983 differentially expressed genes (DEGs) in thigh muscle tissue (785 upregulated and 1,198 downregulated) and 1,955 DEGs in longissimus dorsi muscle tissue (734 upregulated and 1,221 downregulated)(Figure 3C).Using established thresholds (|log2FC| > 1 and padj < 0.05; see Table S5), we identified 284 EGs in thigh muscle tissue (90 upregulated and 194 downregulated) and 305 DEGs in longissimus dorsi muscle tissue (106 upregulated and 199 downregulated)(Figure 3D).
3.4. GO Enrichment and KEGG Pathway of DEGs in Thigh and Longissimus Dorsi Muscle
Firstly, we analyzed the DEGs which were screened using low thresholds (|log2FC| > 0 and padj < 0.05) between Ma and Ju, and explore the potential functions of DEGs.
In thigh muscle, Gene Ontology (GO) enrichment analysis revealed that these DEGs were significantly associated with 706 biological process terms, 41 cellular component terms, and 62 molecular function terms (Table S5). KEGG pathway analysis indicated DEGs were significantly associated with 64 pathways (p<0.05). These GO enrichment and pathways be related to development of muscles (Table 3).
In longissimus dorsi muscles, Gene Ontology (GO) enrichment analysis revealed that these DEGs were significantly associated with 500 biological process terms, 52 cellular component terms, and 49 molecular function terms (Table S5). KEGG pathway analysis indicated DEGs were significantly associated with 64 pathways (P<0.05). These GO enrichment and pathways be related to development of muscles (Table 4).
In thigh and longissimus dorsi muscle, DEGs were enriched to three common GO term (muscle cell migration, smooth muscle cell migration and myofibril) and two common KEGG pathway (HIF-1 signaling pathway, and Glycolysis/Gluconeogenesis). The result suggested HIF-1 signaling pathway and Glycolysis/Gluconeogenesis is related to muscle development between different rabbit breeds.
3.5. GO Enrichment, KEGG Pathway and PPI of Top-50 DEGs
Secondly, we screened the DEGs using high thresholds (|log2FC| > 1 and padj < 0.05) between Ma and Ju, and further explore the potential functions of DEGs by GO enrichment, KEGG pathway and PPI analysis.
In thigh muscle, These DEGs were significantly enriched GO term (Figure 4A) related to muscle development (muscle cell migration(GO:0014812), positive regulation of cell proliferation(GO:0008284), smooth muscle cell migration(GO:0014909)) and molecule binding (regulation of cell adhesion(GO:0030155), cell adhesion molecule binding(GO:0050839), fibroblast growth factor binding(GO:0017134), integrin binding(GO:0005178), extracellular matrix binding(GO:0050840), fibronectin binding(GO:0001968)), and significantly enriched KEGG pathway (Figure 4B) related to MicroRNAs in cancer(ocu05206), PI3K-Akt signaling pathway(ocu04151), HIF-1 signaling pathway(ocu04066) and ECM-receptor interaction(ocu04512). PPI result (Figure 4C) showed two group, PRL is one key hub-gene in group 1, and NF-κB, BCL, MYC and GAPDH are important hub-gene in Group 2.
In longissimus dorsi muscle, These DEGs were significantly enriched GO term (Figure 4D) related to muscle development of biological process (muscle organ morphogenesis (GO:0048644), muscle structure development (GO:0061061), muscle tissue morphogenesis (GO:0055008),muscle organ development (GO:0007517), muscle tissue development (GO:0060537)), and fiber (contractile fiber(GO:0043292),myofibril(GO:0030016),contractile fiber part(GO:0044449),stress fiber(GO:0001725)) and filament bundle (contractile actin filament bundle(GO:0097517),actin filament bundle(GO:0032432)) of cellular component.These DEGs were significantly enriched KEGG pathway (Figure 4E) related to dilated cardiomyopathy (ocu05414), hypertrophic cardiomyopathy (ocu05410), motor proteins(ocu04814),HIF-1 signaling pathway (ocu04066), adrenergic signaling in cardiomyocytes (ocu04261), cardiac muscle contraction (ocu04260), glycolysis/gluconeogenesis (ocu00010), arrhythmogenic right ventricular cardiomyopathy (ocu05412), ribosome(ocu03010), proteoglycans in cancer (ocu05205). PPI result (Figure 4F) showed three group, PRL is one key hub-gene in group 1, and GAPDH and MYL/MYH are important hub-gene in Group 2 and 3, respectively. These results indicate that the DEGs among breed exhibits variability between thigh and longissimus dorsi muscle.
3.6. The Analysis of Co-Expressive and Tissue-Specific Expressive DEGs in Thigh and Longissimus Dorsi Muscle
Finally, we analyzed co-expressive and tissue-specific expressive DEGs in thigh and longissimus dorsi muscle. The 124 co-expressive DEGs (Figure 5A) were significantly enriched GO term (Figure 5D) related to Golgi to vacuole transport (GO:0006896), AP-3 adaptor complex (GO:0030123), AP-type membrane coat adaptor complex (GO:0030119), membrane coat (GO:0030117), coated membrane(GO:0048475), NADP binding (GO:0050661), oxidoreductase activity, acting on the aldehyde or oxo group of donors, NAD or NADP as acceptor (GO:0016620), structural constituent of ribosome (GO:0003735), oxidoreductase activity, acting on the aldehyde or oxo group of donors (GO:0016903), NAD binding (GO:0051287), and GAPDH is a important hub-gene in PPI network of these co-expressive DEGs (Figure 5E). The result suggested that the difference in energy metabolism related to glucose might be the reason for the difference in muscle development between Ma and Ju rabbit.
The longissimus dorsi muscle-specific expresive DEGs were significantly enriched GO term (Figure 5B) related to purine and nucleoside t biosynthetic process (ATP biosynthetic process (GO:0006754), purine ribonucleoside triphosphate biosynthetic process (GO:0009206), purine nucleoside triphosphate biosynthetic process (GO:0009145), ribonucleoside triphosphate biosynthetic process (GO:0009201), nucleoside triphosphate biosynthetic process (GO:0009142), purine nucleoside monophosphate biosynthetic process (GO:0009127), purine ribonucleoside monophosphate biosynthetic process (GO:0009168), ribonucleoside monophosphate biosynthetic process (GO:0009156), nucleoside monophosphate biosynthetic process (GO:0009124), purine ribonucleotide biosynthetic process (GO:0009152), purine nucleotide biosynthetic process (GO:0006164), purine-containing compound biosynthetic process (GO:0072522), ribonucleotide biosynthetic process (GO:0009260), ribose phosphate biosynthetic process (GO:0046390)), and proton transport related molecules (energy coupled proton transport, down electrochemical gradient (GO:0015985), ATP synthesis coupled proton transport (GO:0015986), mitochondrial proton-transporting ATP synthase complex, coupling factor (GO:0000276), mitochondrial proton-transporting ATP synthase complex (GO:0005753), proton-transporting ATP synthase complex, coupling factor (GO:0045263), proton-transporting ATP synthase complex (GO:0045259), proton-transporting two-sector ATPase complex, proton-transporting domain (GO:0033177), proton-transporting two-sector ATPase complex (GO:0016469), structural constituent of ribosome (GO:0003735)). PPI of these DEGs cluster into three independent network (Figure 5C), and SOX, MYH/MYL and PRL are hub-genes of networks.
The thigh muscle-specific expressive DEGs were significantly enriched GO term (Figure 5F) related to structural constituent of ribosome (GO:0003735), chemokine activity (GO:0008009), chemokine receptor binding (GO:0042379), cytokine activity (GO:0005125), G protein-coupled receptor binding (GO:0001664), Hsp70 protein binding (GO:0030544), oxidoreductase activity, acting on the aldehyde or oxo group of donors, NAD or NADP as acceptor (GO:0016620), oxidoreductase activity, acting on the aldehyde or oxo group of donors (GO:0016903), NAD binding (GO:0051287), cytokine receptor binding (GO:0005126), and unfolded protein binding (GO:0051082). These DEGs form a regulatory network consisting of NF-κB, BCL, CXCL10 and PRL hub genes.
4. Discussion
Skeletal muscle development is a dynamic developmental process. It gradually differentiates from mesoderm-derived cells into myoblasts, merges into myotubes, and matures to form muscle fibers [26]. Skeletal muscle morphology has been extensively measured in pigs [27,28], chickens [29] and sheep [30], but little research has been done on rabbits. In one study, hind leg muscles of fetus, child and adult rabbits were collected for paraffin section, founding extremely significant differences in the diameter, number, area and density of skeletal muscle fibers of the fetus, child, adult rabbit hind legs [31]. In addition, it was found that the leg muscles of fetuses’ rabbits were not fully developed at 2 weeks [32]. There were only a few primary muscle cells. When in childhood and adulthood, secondary muscle fibers have been completely formed, and the diameter of muscle fibers has increased significantly. Exploration of skeletal muscle structure reveals changes in leg muscle fibers during fetal, childhood, and adult stages, providing a theoretical basis for better understanding of rabbit skeletal muscle development.
With the development of high-throughput sequencing, RNA sequencing technology has been applied to systematically study animal growth and development regulatory genes, and massive amounts of transcriptional data have been produced, especially for mammals. RNA-Seq was used to study the transcriptome of the breast muscle of Jinghai yellow chickens at different growth phase and found that RAC2 might regulate cell proliferation by regulating the PAKs/MAPK8 pathway [33]. Additionally, RNA-Seq was used for tissues transcriptome analysis such as skeletal muscles of crossbred beef steers, found that variation among DEG identified by cohort suggests that environment and breed play large roles in the expression of genes associated with feed efficiency in the muscle of beef cattle [34].
To uncover genes that regulate muscle tissue development, in this study, we used RNA-Seq to analyze and identify differentially expressed genes in the muscle tissue transcriptome between Sichuan linen rabbits and Checkered Giant rabbits. Hence, we collected the thigh muscle and longissimus dorsi muscle, from Sichuan linen rabbit and Checkered Giant rabbit, of 28, 56, and 84 days for RNA-seq to explore mRNAs that might have potential regulatory effects on skeletal muscle development. The sample correlation and HCA verified the reliability of the samples. We identified 1983 differentially expressed genes, including 785 upregulated and 1198 downregulated genes, in the thigh muscle of Sichuan linen rabbits compared with that of Checkered Giant rabbits. GO enrichment analysis of these genes showed significant enrichment in related to muscle cell migration, negative regulation of cell death, smooth muscle cell migration, onsarcomere, Myofibril, actin filament bundle, organic acid binding, calmodulin binding, and NADP binding. KEGG pathway annotation revealed that these genes were enriched in Glycolysis/Gluconeogenesis, HIF-1 signaling pathway, PI3K-Akt signaling pathway, FoxO signaling pathway, and MAPK signaling pathway in the thigh muscle of the two breeds of rabbit.
We found that these up-regulated genes GAPDH, PGM1, IGF1, and SGK1 were significantly higher and the down-regulated gene ACSS1 was lower in Ma Leg compared with Ju Leg. These results may suggest that they play critical roles in muscle development of rabbit. Studies have shown that these differentially expressed genes play important roles in different biological processes such as cell proliferation, apoptosis, and migration. GAPDH were expressed in breast muscles, with the prolongation of ages in breast muscle, the number of DETs decreased progressively [35]. PGM1 in regulating the growth and development of myoblasts and specific IMP deposition in Jingyuan chickens [36]. IGF1 have been demonstrated to play essential roles in protein synthesis and fish muscle growth [37]. That serum- and glucocorticoid-inducible kinase 1 (SGK1) regulates muscle mass maintenance via downregulation of proteolysis and autophagy as well as increased protein synthesis during hibernation [38]. Acss1 may constitute a regulatory effect in mitochondrial dynamics and muscle wasting, and was negatively related to the weight of gastrocnemius [39]. So we speculate these genes involved in rabbit muscle development.
We identified 1955 differentially expressed genes, including 734 upregulated and 1221 downregulated genes, in the longissimus dorsi muscle of Sichuan linen rabbits compared with that of Checkered Giant rabbits. GO enrichment analysis showed that these genes were significantly enriched in muscle cell migration, inflammatory response, actin cytoskeleton, contractile fiber, myofibril, sarcomere calcium ion binding, fibronectin binding, and actin filament binding. KEGG pathway analysis results revealed that HIF-1 signaling pathway, Glycolysis/Gluconeogenesis, regulation of actin cytoskeleton, and PPAR signaling pathway were significantly enriched. We found that these up-regulated genes GAPDH, ALDOA, ACTN1, and MYH10 were significantly higher and the down-regulated gene ACSS1 was lower in Ma Long compared with Ju Long. ALDOA genes related to glycogen degradation, glucose transport, and glycolysis [40]. That proper regulation of ACTN1 levels is essential for normal muscle and neuromuscular junction development [41]. Bisulfite sequencing was utilized to analyze and compare the muscle DNA methylation profiles of Larimichthys crocea inhabiting different environments, finding muscle-related genes such as myh10, myf5 and myf6 etc [42].
Through analyzing the GO enrichment and KEGG pathways of related up-regulated and down-regulated Top-50 DEGs.In this part we also found some GO enrichment and KEGG pathway involved in rabbit muscle development,like muscle cell cellular homeostasis,muscle structure development,sarcolemma,glycoprotein complex,fibroblast growth factor bindingand growth factor binding, Circadian rhythm and PPAR signaling pathway,etc.These results surmise that genes in these pathways may play a key role in muscle development.
At present, although the function of these DEGs in rabbit muscle development has not been reported, according to our analysis results in this study, we hypothesize that these DEGs may play an important role in determining the differences in muscle development between Ma and Ju rabbits. The function of these candidate genes should be investigated in future studies.
5. Conclusions
In this study, RNA-Seq was used to analyze the transcriptome of the thigh muscle and the longissimus dorsi muscle between Sichuan linen rabbits and Checkered Giant rabbits, and our data showed that the differentially expressed genes in muscle tissues of the two rabbit breeds were mainly enriched in some important pathways such as Glycolysis/Gluconeogenesis and HIF-1 signaling pathway. These DEGs may play an important role in muscle development. These results provide an important theoretical basis for future clarifying the regulation mechanism of muscle development and molecular breeding of Ma rabbit.
Supplementary Materials
The following supporting information can be downloaded at the website of this paper posted on Preprints.org.
Institutional Review Board Statement
Not applicable.
Informed Consent Statement
Not applicable.
Data Availability Statement
The transcriptomic data has been stored in .
Acknowledgments
This work was supported by the Basic Research Program of Sichuan Animal Husbandry Research Institute, Sichuan Provincial Science and Technology Department.
Conflicts of Interest
The authors declare no conflicts of interest.
Abbreviations
The following abbreviations are used in this manuscript:
| Ma | Sichuan linen rabbits |
| Ju | Checkered Giant rabbits |
| Leg | the thigh muscle |
| LD | Linear dichroism |
| Long | the longissimus dorsi muscle |
| GAPDH | glyceraldehyde-3-phosphatedehydrogenase |
| PGM1 | phosphoglucomutase 1 |
| IGF-1 | Insulin like growth factor 1 |
| SGK1 | Serum/glucocorticoid regulated kinase 1 |
| ACSS1 | Acyl-CoA synthetase short chain family member 1 |
| ALDOA | Aldolase, fructose-bisphosphate A |
| ACTN1 | Actinin alpha 1 |
| MYH10 | Myosin heavy chain 10 |
| HE | hematoxylin-eosin staining |
| CAS | Cross sectional area of muscle fibers |
| HCA | hierarchical cluster analysis |
| PCA | principal component analysis |
References
- Cullere, M.; Dalle Zotte, A. Rabbit meat production and consumption: State of knowledge and future perspectives. Meat Sci. 2018, 143, 137–146. [Google Scholar] [CrossRef] [PubMed]
- Dalle Zotte, A.; Szendrő, Z. The role of rabbit meat as functional food. Meat Sci. 2011, 88, 319–331. [Google Scholar] [CrossRef] [PubMed]
- Kuang, L.; Lei, M.; Li, C.; Zhang, X.; Ren, Y.; Zheng, J.; Guo, Z.; Zhang, C.; Yang, C.; Mei, X.; et al. Identification of Long Non-Coding RNAs Related to Skeletal Muscle Development in Two Rabbit Breeds with Different Growth Rate. Int. J. Mol. Sci. 2018, 19, 2046. [Google Scholar] [CrossRef]
- Dillies, M.-A.; Rau, A.; Aubert, J.; Hennequet-Antier, C.; Jeanmougin, M.; Servant, N.; Keime, C.; Marot, G.; Castel, D.; Estelle, J.; et al. A comprehensive evaluation of normalization methods for Illumina high-throughput RNA sequencing data analysis. Briefings Bioinform. 2012, 14, 671–683. [Google Scholar] [CrossRef]
- Reuter, J.; Spacek, D.V.; Snyder, M. High-throughput sequencing technologies. Mol. Cell 2015, 58, 586–597 [CrossRef]. [Google Scholar] [CrossRef]
- Hrdlickova, R.; Toloue, M.; Tian, B. RNA-Seq methods for transcriptome analysis. Wiley Interdiscip. Rev. RNA 2016, 8. [Google Scholar] [CrossRef]
- Song, C, Huang, Y, Yang, Z, Ma, Y. ; Chaogetu, B.; Zhuoma, Z.; Chen, H. RNA-Seq Analysis Identifies Differentially Expressed Genes Insubcutaneous Adipose Tissuein Qaidamford Cattle, Cattle-Yak, and Angus Cattle. Animals (Basel) 2019, 9, 1077 [CrossRef].
- Paradis, F.; Yue, S.; Grant, J.R.; Stothard, P.; Basarab, J.A.; Fitzsimmons, C. Transcriptomic analysis by RNA sequencing reveals that hepatic interferon-induced genes may be associated with feed efficiency in beef heifers1. J. Anim. Sci. 2015, 93, 3331–3341. [Google Scholar] [CrossRef] [PubMed]
- Li, H.; Wei, X.; Yang, J.; Dong, D.; Huang, Y.; Lan, X.; Plath, M.; Lei, C.; Qi, X.; Bai, Y.; et al. Developmental transcriptome profiling of bovine muscle tissue reveals an abundant GosB that regulates myoblast proliferation and apoptosis. Oncotarget 2017, 8, 32083–32100. [Google Scholar] [CrossRef]
- Jing, L.; Hou, Y.; Wu, H.; Miao, Y.; Li, X.; Cao, J.; Brameld, J.M.; Parr, T.; Zhao, S. Transcriptome analysis of mRNA and miRNA in skeletal muscle indicates an important network for differential Residual Feed Intake in pigs. Sci. Rep. 2015, 5, 11953. [Google Scholar] [CrossRef]
- Jang, M.-K.; Lee, S.; Jung, M.H. RNA-Seq Analysis Reveals a Negative Role of KLF16 in Adipogenesis. PLOS ONE 2016, 11, e0162238–e0162238. [Google Scholar] [CrossRef] [PubMed]
- Keel, B.N.; Zarek, C.M.; Keele, J.W.; Kuehn, L.A.; Snelling, W.M.; Oliver, W.T.; Freetly, H.C.; Lindholm-Perry, A.K. RNA-Seq Meta-analysis identifies genes in skeletal muscle associated with gain and intake across a multi-season study of crossbred beef steers. BMC Genom. 2018, 19, 430. [Google Scholar] [CrossRef] [PubMed]
- Pareek, C.S.; Sachajko, M.; Jaskowski, J.M.; Herudzinska, M.; Skowronski, M.; Domagalski, K.; Szczepanek, J.; Czarnik, U.; Sobiech, P.; Wysocka, D.; et al. Comparative Analysis of the Liver Transcriptome among Cattle Breeds Using RNA-seq. Veter- Sci. 2019, 6, 36. [Google Scholar] [CrossRef] [PubMed]
- Zhang, G.; Wu, P.; Zhou, K.; He, M.; Zhang, X.; Qiu, C.; Li, T.; Zhang, T.; Xie, K.; Dai, G.; et al. Study on the transcriptome for breast muscle of chickens and the function of key gene RAC2 on fibroblasts proliferation. BMC Genom. 2021, 22, 1–15. [Google Scholar] [CrossRef]
- Ballan, M.; Bovo, S.; Bertolini, F.; Schiavo, G.; Schiavitto, M.; Negrini, R.; Fontanesi, L. Population genomic structures and signatures of selection define the genetic uniqueness of several fancy and meat rabbit breeds. J. Anim. Breed. Genet. 2023, 140, 663–678. [Google Scholar] [CrossRef]
- Allen, D.L.; Leinwand, L.A. Postnatal Myosin Heavy Chain Isoform Expression in Normal Mice and Mice Null for IIb or IId Myosin Heavy Chains. Dev. Biol. 2001, 229, 383–395. [Google Scholar] [CrossRef]
- Galeandro, V.; Notarnicola, A.; Bianco, A.; Tafuri, S.; Russo, L.; Pesce, V.; Moretti, B.; Petruzzella, V. ACTN3/ACE genotypes and mitochondrial genome in professional soccer players’ performance. . 2017, 31, 207–213. [Google Scholar]
- Gao, S.; Nanaei, H.A.; Wei, B.; Wang, Y.; Wang, X.; Li, Z.; Dai, X.; Wang, Z.; Jiang, Y.; Shao, J. Comparative Transcriptome Profiling Analysis Uncovers Novel Heterosis-Related Candidate Genes Associated with Muscular Endurance in Mules. Animals 2020, 10, 980. [Google Scholar] [CrossRef]
- Chaosap, C.; Sitthigripong, R.; Sivapirunthep, P.; Pungsuk, A.; Adeyemi, K.D.; Sazili, A.Q. Myosin heavy chain isoforms expression, calpain system and quality characteristics of different muscles in goats. Food Chem. 2020, 321, 126677. [Google Scholar] [CrossRef]
- Kambadur, R.; Sharma, M.; Smith, T.P.; Bass, J.J. Mutations in myostatin (GDF8) in Double-Muscled Belgian Blue and Piedmontese Cattle. Genome Res. 1997, 7, 910–915. [Google Scholar] [CrossRef]
- Aboalola, D.; Han, V.K.M. Different Effects of Insulin-Like Growth Factor-1 and Insulin-Like Growth Factor-2 on Myogenic Differentiation of Human Mesenchymal Stem Cells. Stem Cells Int. 2017, 2017, 1–15. [Google Scholar] [CrossRef]
- Ren, H.; Xiao, W.; Qin, X.; Cai, G.; Chen, H.; Hua, Z.; Cheng, C.; Li, X.; Hua, W.; Xiao, H.; Zhang, L.; Dai, J.; Zheng, X.; Zhu, Z.; Qian, C.; Yao, J.; Bi, Y. Myostatin regulates fatty acid desaturation and fat deposition through MEF2C/miR222/SCD5 cascade in pigs. Commun Biol. 2020, 3, 612 [CrossRef]. [Google Scholar] [CrossRef] [PubMed]
- Yu, M.; Feng, Y.; Yan, J.; Zhang, X.; Tian, Z.; Wang, T.; Wang, J.; Shen, W. Transcriptomic regulatory analysis of skeletal muscle development in landrace pigs. Gene 2024, 915, 148407. [Google Scholar] [CrossRef] [PubMed]
- Wang, C.; Yue, F.; Kuang, S. Muscle Histology Characterization Using H&E Staining and Muscle Fiber Type Classification Using Immunofluorescence Staining. Bio-Protocol 2017, 7, e2279–e2279. [Google Scholar] [CrossRef]
- Szklarczyk, D.; Morris, J.H.; Cook, H.; Kuhn, M.; Wyder, S.; Simonovic, M.; Santos, A.; Doncheva, N.T.; Roth, A.; Bork, P.; Jensen, L.J.; von Mering, C. The STRING database in 2017: quality-controlled protein-protein association networks, made broadly accessible. Nucleic Acids Res. 2017, 45, D362–D368 [CrossRef]. [Google Scholar] [CrossRef] [PubMed]
- Zammit, P.S. Function of the myogenic regulatory factors Myf5, MyoD, Myogenin and MRF4 in skeletal muscle, satellite cells and regenerative myogenesis. Semin. Cell Dev. Biol. 2017, 72, 19–32. [Google Scholar] [CrossRef]
- Fröhlich, T.; Kemter, E.; Flenkenthaler, F.; Klymiuk, N.; Otte, K.A.; Blutke, A.; Krause, S.; Walter, M.C.; Wanke, R.; Wolf, E.; et al. Progressive muscle proteome changes in a clinically relevant pig model of Duchenne muscular dystrophy. Sci. Rep. 2016, 6, 33362. [Google Scholar] [CrossRef]
- Cho, I.-C.; Park, H.-B.; Ahn, J.S.; Han, S.-H.; Lee, J.-B.; Lim, H.-T.; Yoo, C.-K.; Jung, E.-J.; Kim, D.-H.; Sun, W.-S.; et al. A functional regulatory variant of MYH3 influences muscle fiber-type composition and intramuscular fat content in pigs. PLOS Genet. 2019, 15, e1008279. [Google Scholar] [CrossRef]
- Gesek, M.; Murawska, D.; Otrocka-Domagała, I.; Michalska, K.; Zawacka, M. Effects of caponization and age on the histology, lipid localization, and fiber diameter in muscles from Leghorn cockerels. Poult. Sci. 2019, 98, 1354–1362. [Google Scholar] [CrossRef]
- Siqin, Q.; Nishiumi, T.; Yamada, T.; Wang, S.; Liu, W.; Wu, R.; Borjigin, G. Relationships among muscle fiber type composition, fiber diameter and MRF gene expression in different skeletal muscles of naturally grazing Wuzhumuqin sheep during postnatal development. Anim Sci J. 2017, 88, 2033–2043 [CrossRef]. [Google Scholar] [CrossRef]
- Zheng, Q.; Zhu, C.; Jing, J.; Ling, Y.; Qin, S.; Wang, J.; Zha, L.; Liu, Y.; Fang, F. Morphological changes and functional circRNAs screening of rabbit skeletal muscle development. BMC Genom. 2021, 22, 1–12. [Google Scholar] [CrossRef] [PubMed]
- Saito, K.; Morita, T.; Takasu, H.; Kuroki, K.; Fujiwara, T.; Hiraba, K.; Goto, S. Histochemical study of rabbit medial pterygoid muscle during postnatal development. Odontology 2016, 105, 141–149. [Google Scholar] [CrossRef] [PubMed]
- Zhang, G.; Wu, P.; Zhou, K.; He, M.; Zhang, X.; Qiu, C.; Li, T.; Zhang, T.; Xie, K.; Dai, G.; et al. Study on the transcriptome for breast muscle of chickens and the function of key gene RAC2 on fibroblasts proliferation. BMC Genom. 2021, 22, 1–15. [Google Scholar] [CrossRef] [PubMed]
- Keel, B.N.; Zarek, C.M.; Keele, J.W.; Kuehn, L.A.; Snelling, W.M.; Oliver, W.T.; Freetly, H.C.; Lindholm-Perry, A.K. RNA-Seq Meta-analysis identifies genes in skeletal muscle associated with gain and intake across a multi-season study of crossbred beef steers. BMC Genom. 2018, 19, 430. [Google Scholar] [CrossRef]
- Ren, P.; Liu, J.; Zhang, D.; Yang, C.; Yu, C.; Chen, M.; Lin, Z.; Liu, Y. Transcriptome analysis of breast muscle and liver in full-sibling hybrid broilers at different ages. Gene 2022, 842, 146801. [Google Scholar] [CrossRef]
- Zhao, W.; Cai, Z.; Wei, C.; Ma, X.; Yu, B.; Fu, X.; Zhang, T.; Gu, Y.; Zhang, J. Functional identification of PGM1 in the regulating development and depositing of inosine monophosphate specific for myoblasts. Front. Veter- Sci. 2023, 10, 1276582. [Google Scholar] [CrossRef]
- Duran, B.O.S.; Zanella, B.T.T.; Perez, E.S.; Mareco, E.A.; Blasco, J.; Dal-Pai-Silva, M.; de la Serrana, D.G. Amino Acids and IGF1 Regulation of Fish Muscle Growth Revealed by Transcriptome and microRNAome Integrative Analyses of Pacu (Piaractus mesopotamicus) Myotubes. Int. J. Mol. Sci. 2022, 23, 1180. [Google Scholar] [CrossRef]
- Andres-Mateos, E.; Brinkmeier, H.; Burks, T.N.; Mejias, R.; Files, D.C.; Steinberger, M.; Soleimani, A.; Marx, R.; Simmers, J.L.; Lin, B.; et al. Activation of serum/glucocorticoid-induced kinase 1 (SGK1) is important to maintain skeletal muscle homeostasis and prevent atrophy. EMBO Mol. Med. 2012, 5, 80–91. [Google Scholar] [CrossRef]
- Cui, H.; Hu, D.; Liu, Y.; Zhao, J. Identifying Acss1, Mtfp1 and Oxct1 as key regulators and promising biomarkers of sarcopenia in various models. Gene 2023, 896, 148053. [Google Scholar] [CrossRef]
- Yin, Y.; Zhang, Y.; Hua, Z.; Wu, A.; Pan, X.; Yang, J.; Wang, X. Muscle transcriptome analysis provides new insights into the growth gap between fast- and slow-growing Sinocyclocheilus grahami. Front. Genet. 2023, 14, 1217952. [Google Scholar] [CrossRef]
- Blondelle, J.; Tallapaka, K.; Seto, J.T.; Ghassemian, M.; Clark, M.; Laitila, J.M.; Bournazos, A.; Singer, J.D.; Lange, S. Cullin-3–dependent deregulation of ACTN1 represents a pathogenic mechanism in nemaline myopathy. J. Clin. Investig. 2019, 4. [Google Scholar] [CrossRef] [PubMed]
- Xie, S.; Jiang, L.; Song, W.; Zheng, J.; Liu, Y.; Chen, S.; Yan, X. Skeletal muscle feature of different populations in large yellow croaker (Larimichthys crocea): from an epigenetic point of view. Front. Mol. Biosci. 2024, 11, 1403861. [Google Scholar] [CrossRef] [PubMed]
Figure 1.
The areas of muscle fibers of rabbits’ skeletal muscle at different stages. A: The change in body weight of Ma and Ju rabbit from 1-week to 13-week age. B: The H&E staining of thigh muscles. C: The H&E staining of longissimus dorsi muscles. D: The diameter of thigh muscle from Ma and Ju rabbit on 28,56,84 day-old. E: The diameter of longissimus dorsi muscles from Ma and Ju rabbit on 28,56,84 day-old. E: The comparison of muscle fiber area between thigh and longissimus dorsi muscles.
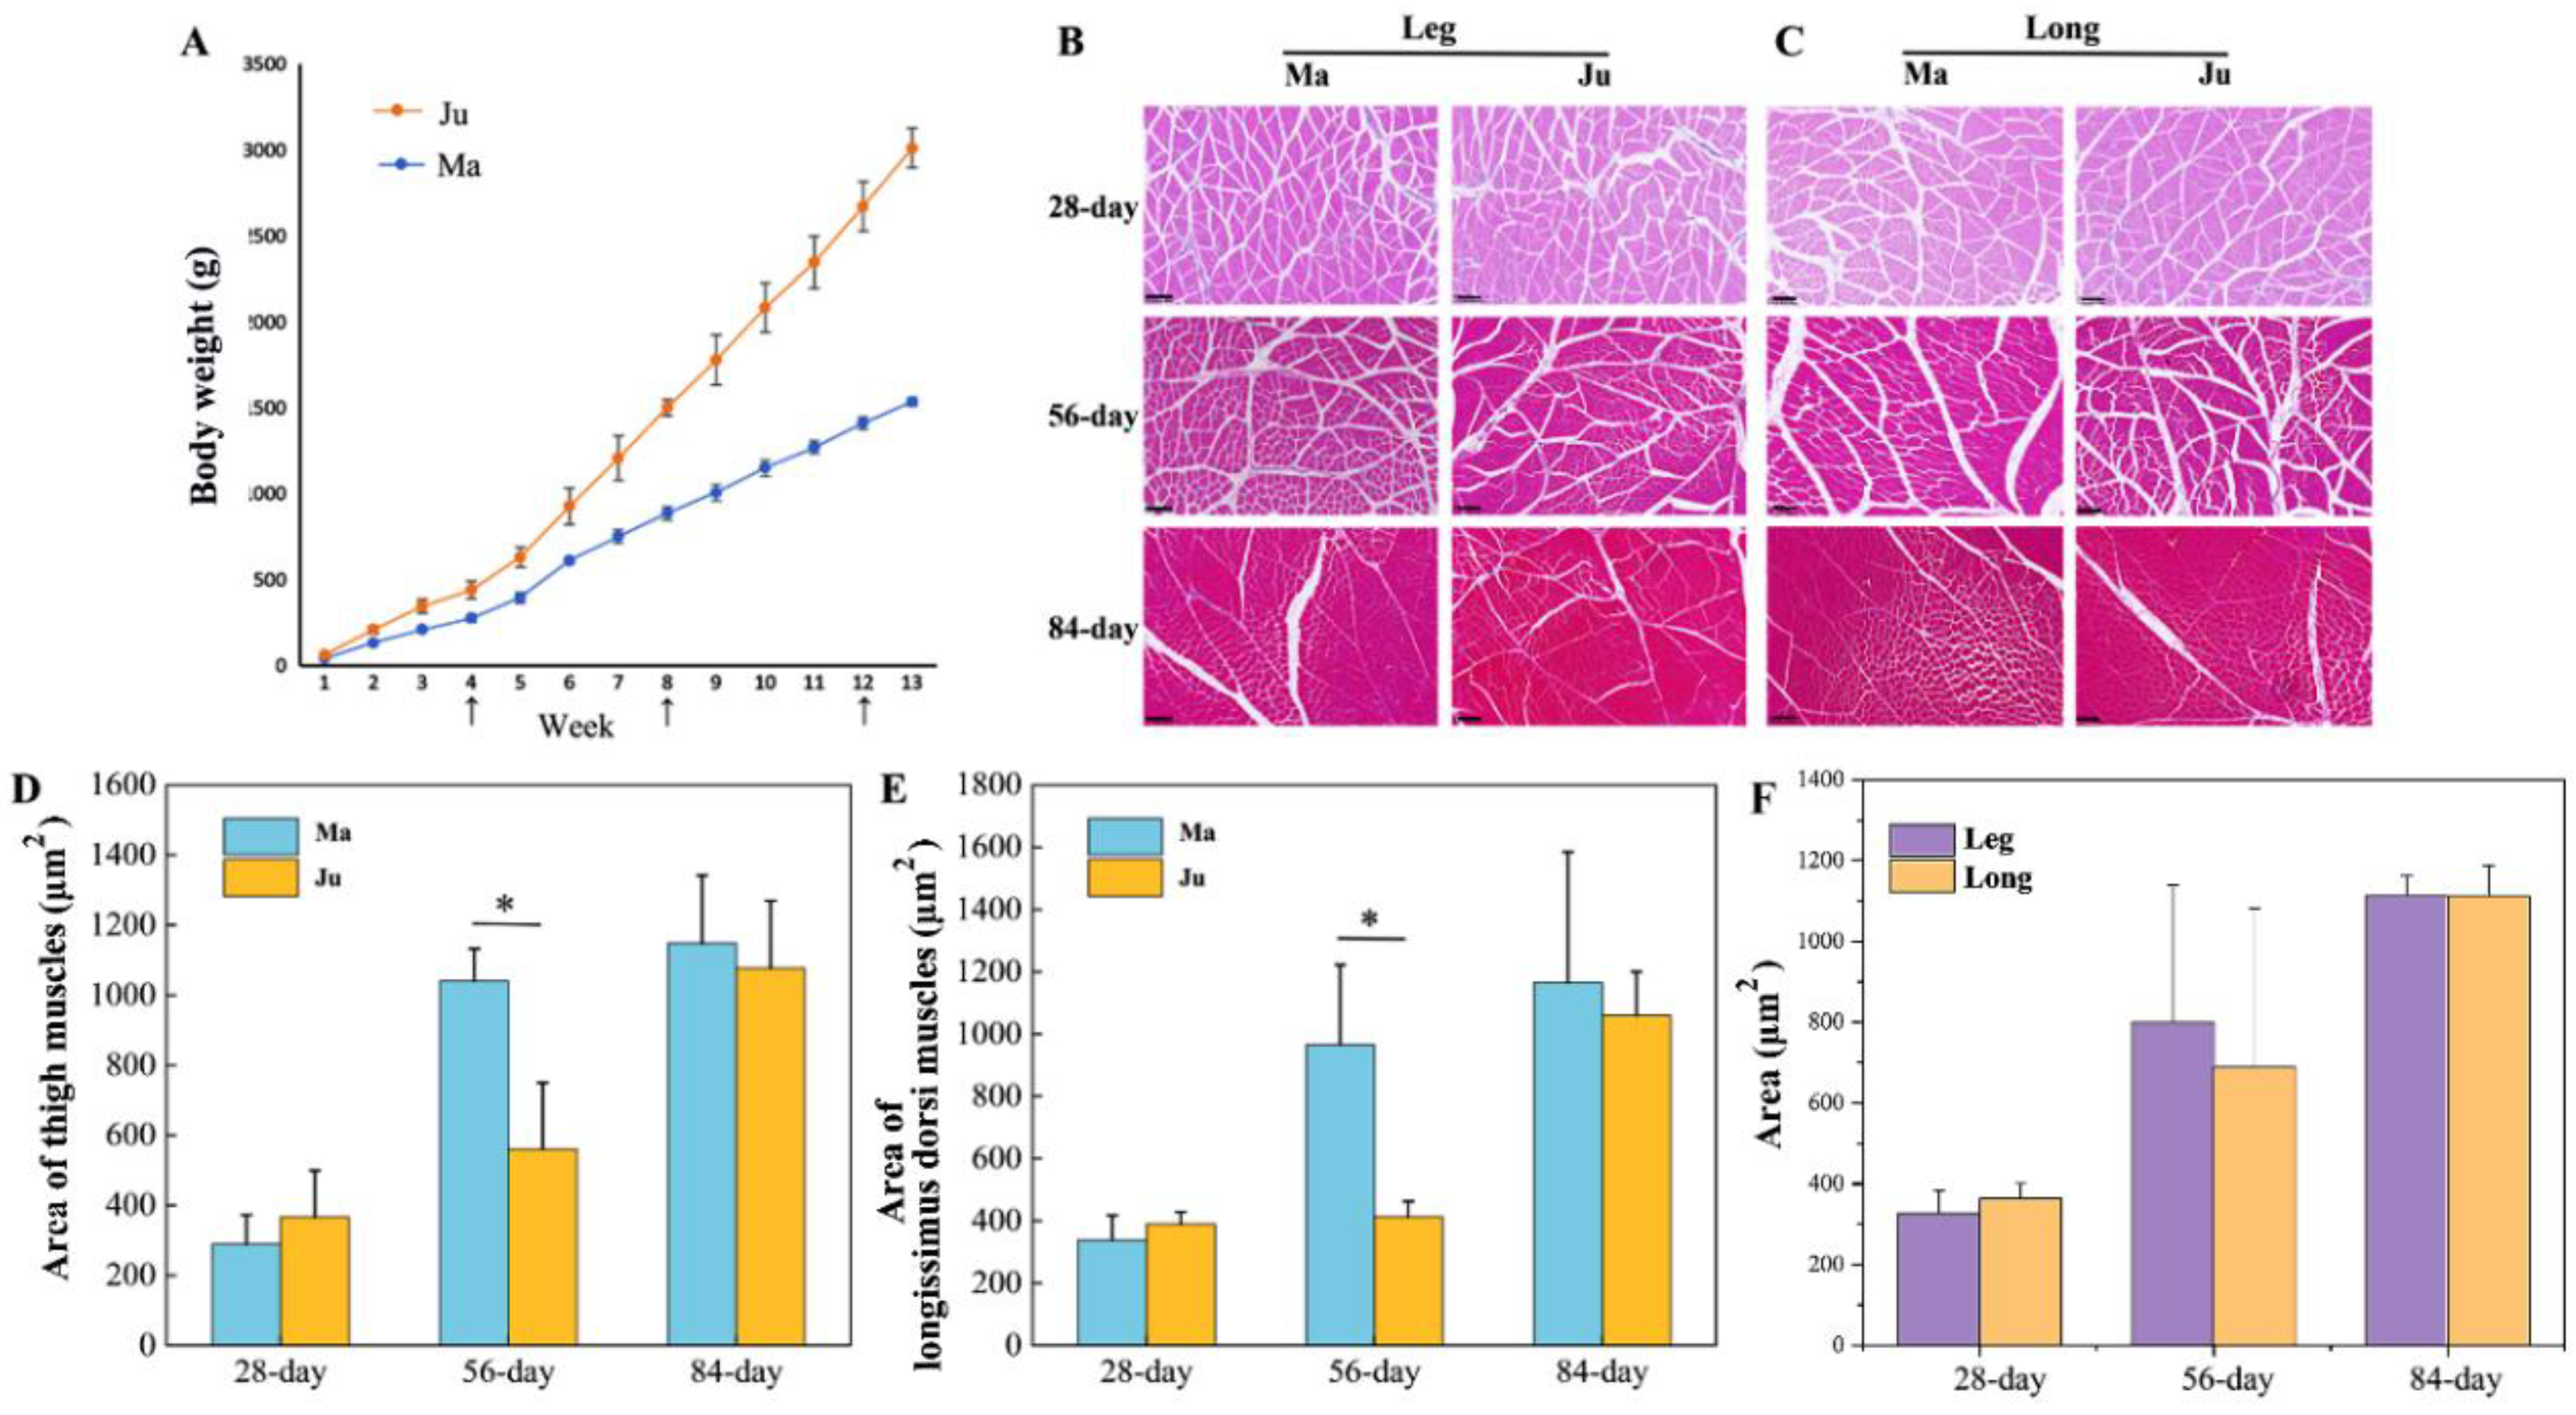
Figure 2.
Summarization of RNA-seq data. A: Distribution of gene expression levels in different samples. B: The distribution of FPKM in all samples. C: The correlation analysis of all samples. D: Hierarchical clustering heat map of all DEGs. ML: thigh muscle of Ma rabbit; MB: longissimus dorsi muscles of Ma rabbit; JL: thigh muscle of Ju rabbit; JB: longissimus dorsi muscles of Ju rabbit.
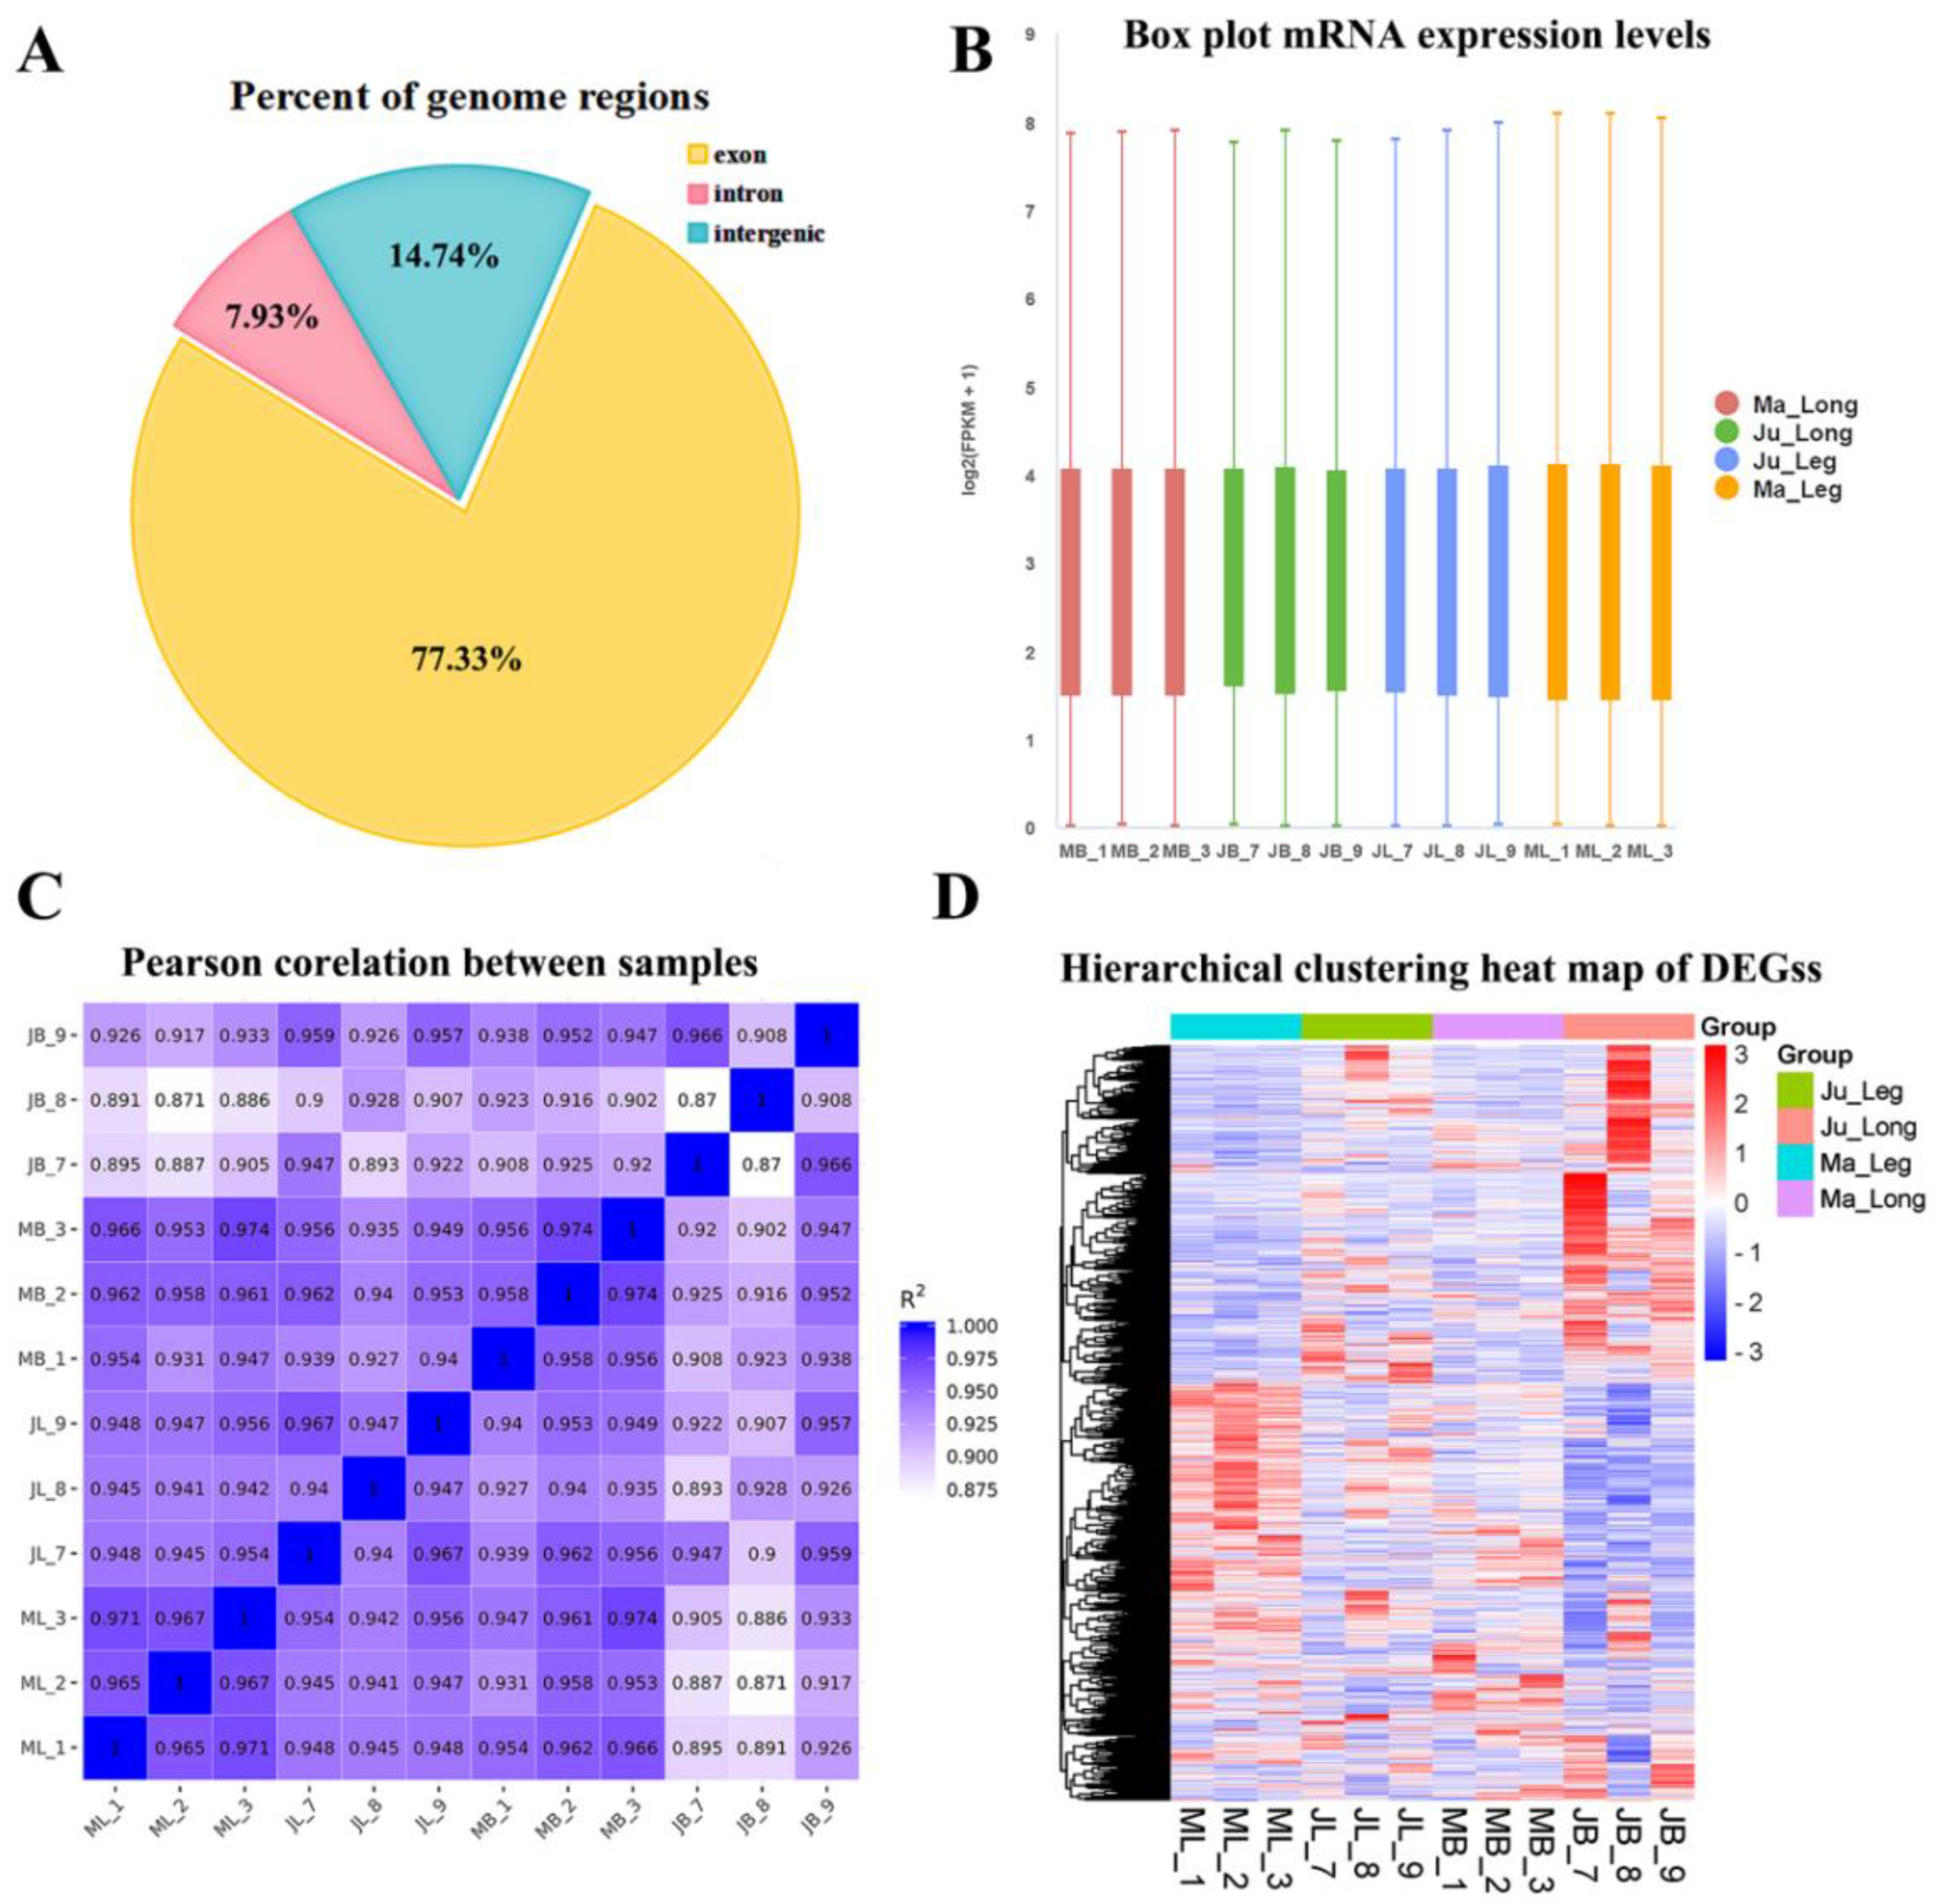
Figure 3.
Differentially expressed genes in rabbit muscle tissues. A: Venn diagram of co-expressive gene in the thigh muscle of Ma and Ju rabbit. B: DEGs of Ma vs Ju rabbit using thresholds |log2FC|>0 method. C: DEGs of Ma vs Ju rabbit using |log2FC|>1 method. Ma_Leg: Thigh muscle from Ma rabbit; Ju_Leg:Thigh muscle from Ju rabbit; Ma_Long: Longissimus dorsi muscle from Ma rabbit; Ju_Long: Longissimus dorsi muscle from Ju rabbit.
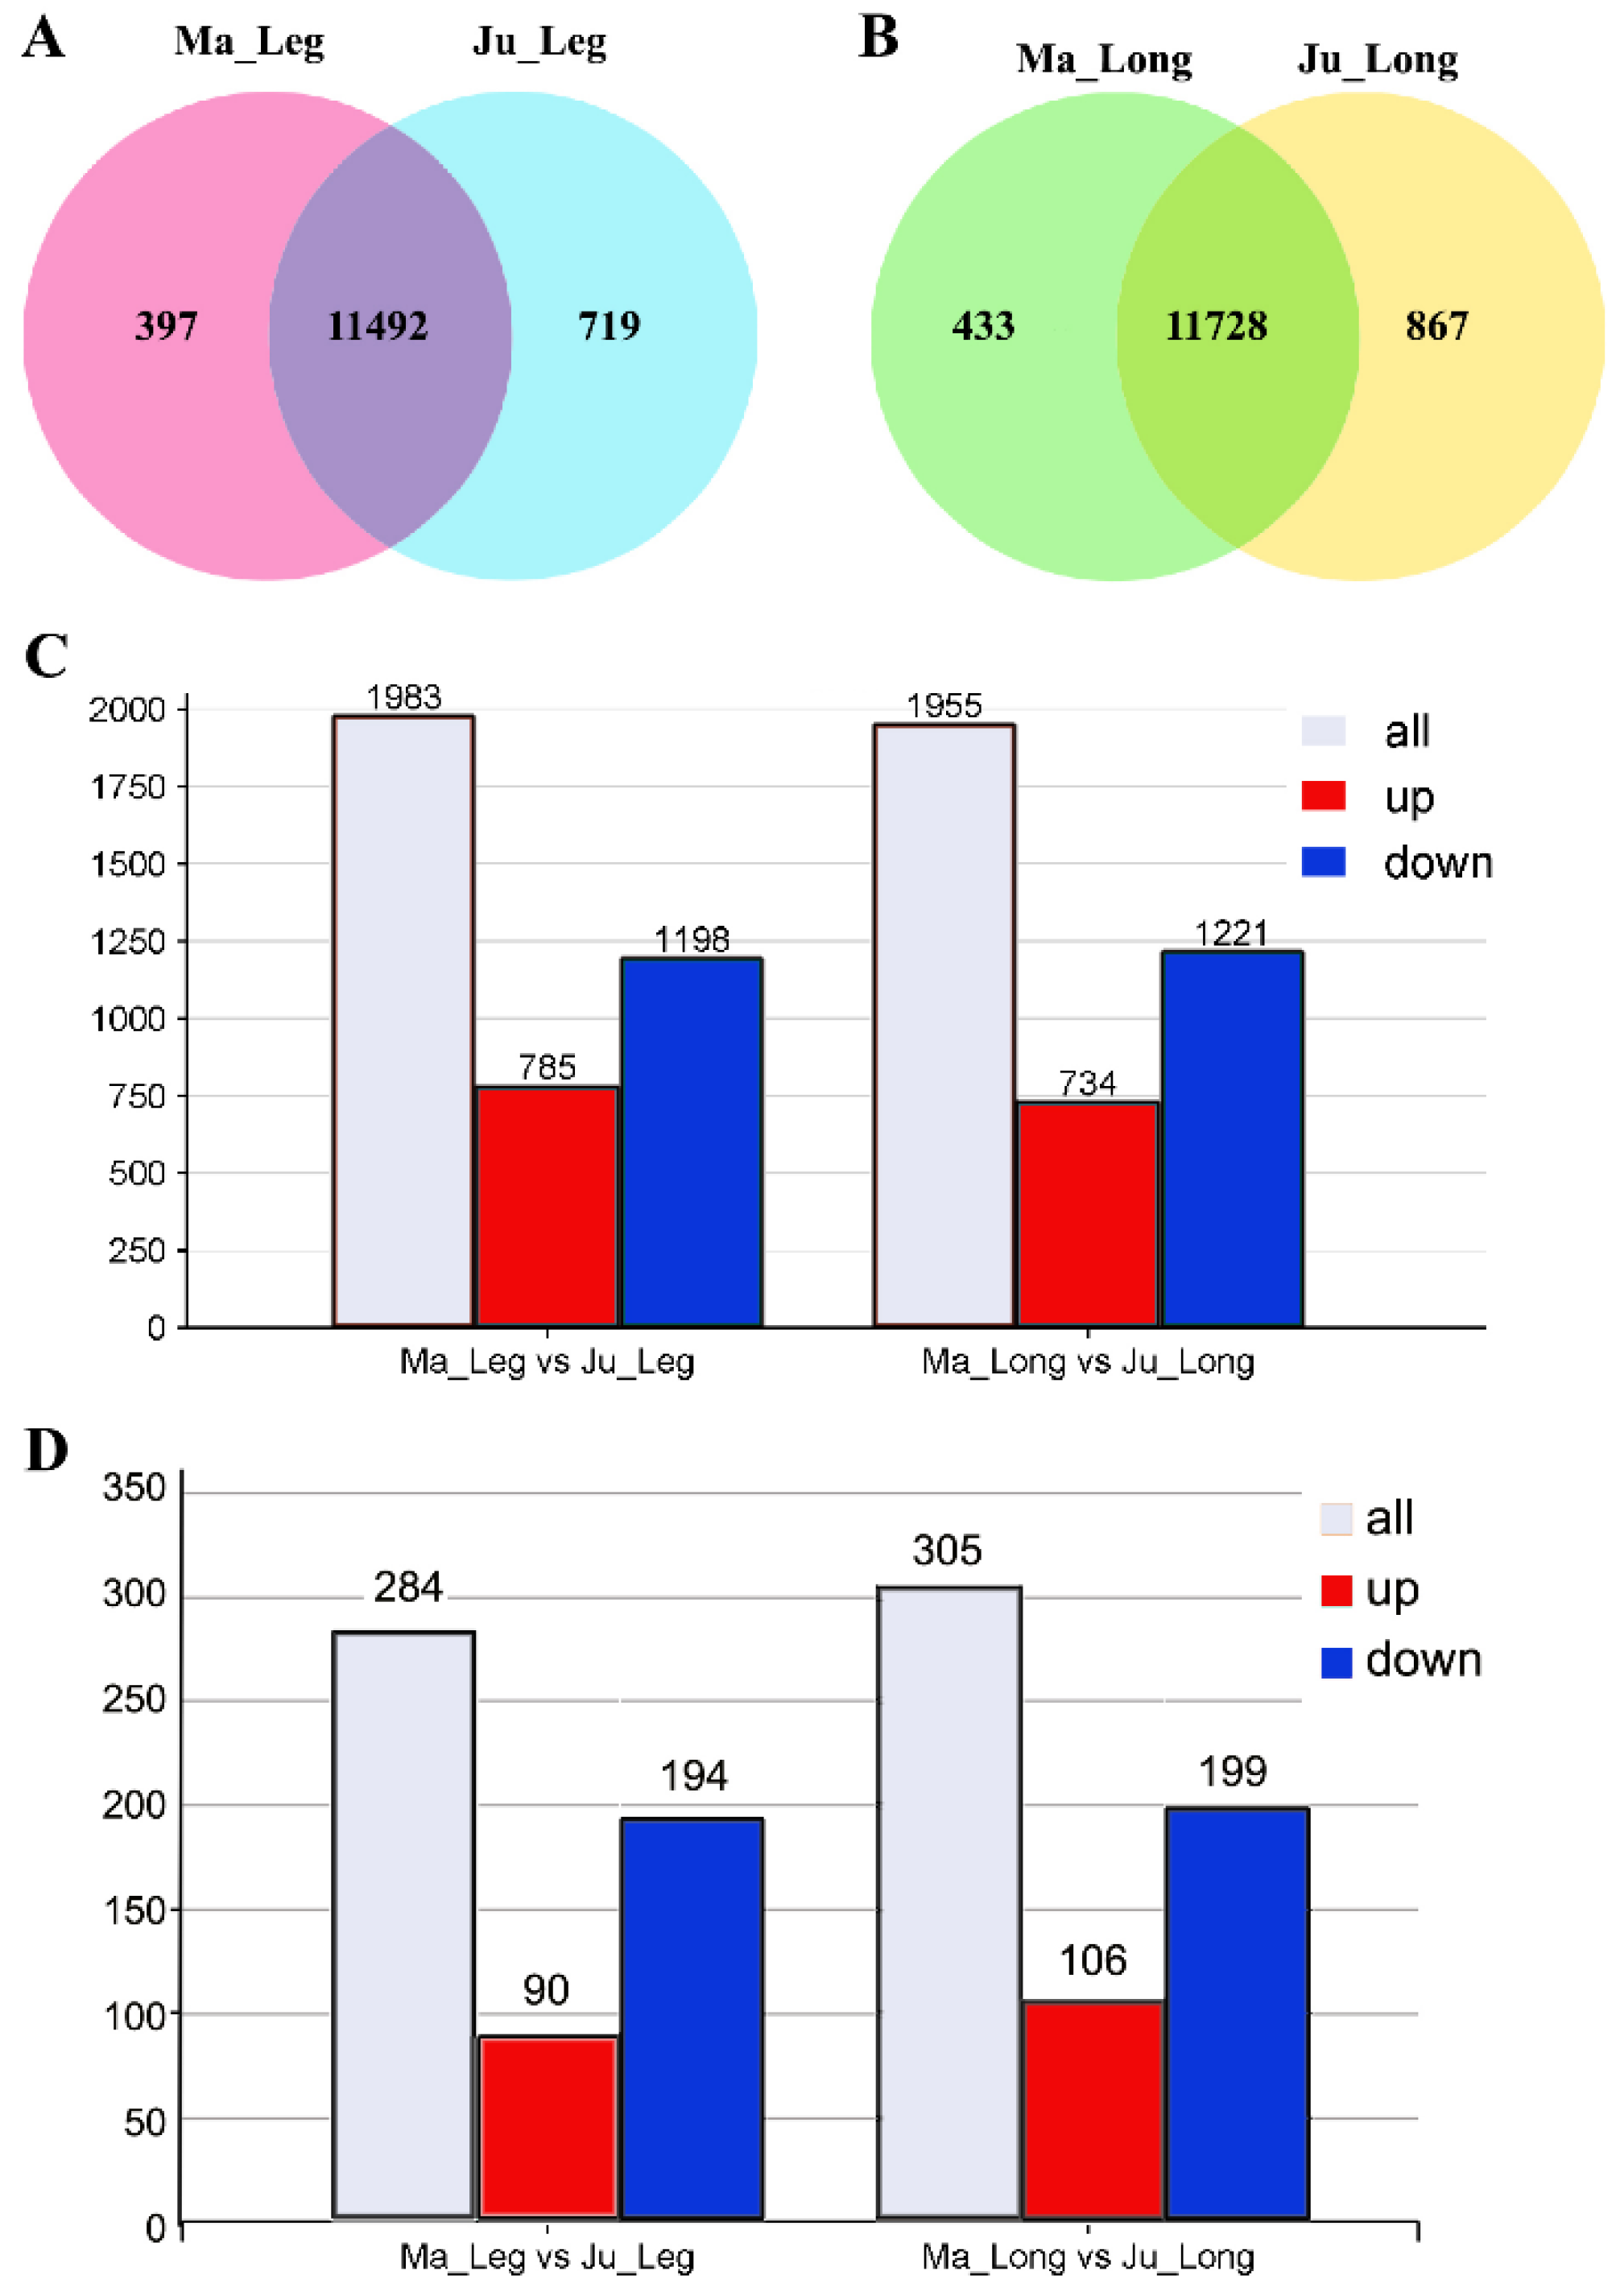
Figure 4.
GO enrichment, KEGG pathway and PPI of DEGs in thigh and longissimus dorsi muscle. GO enrichment (A), KEGG (B) and PPI (C) analysis of DEGs in the thigh muscle; GO enrichment (D), KEGG (E) and PPI (F) analysis of DEGs in the longissimus dorsi muscle.
Figure 4.
GO enrichment, KEGG pathway and PPI of DEGs in thigh and longissimus dorsi muscle. GO enrichment (A), KEGG (B) and PPI (C) analysis of DEGs in the thigh muscle; GO enrichment (D), KEGG (E) and PPI (F) analysis of DEGs in the longissimus dorsi muscle.
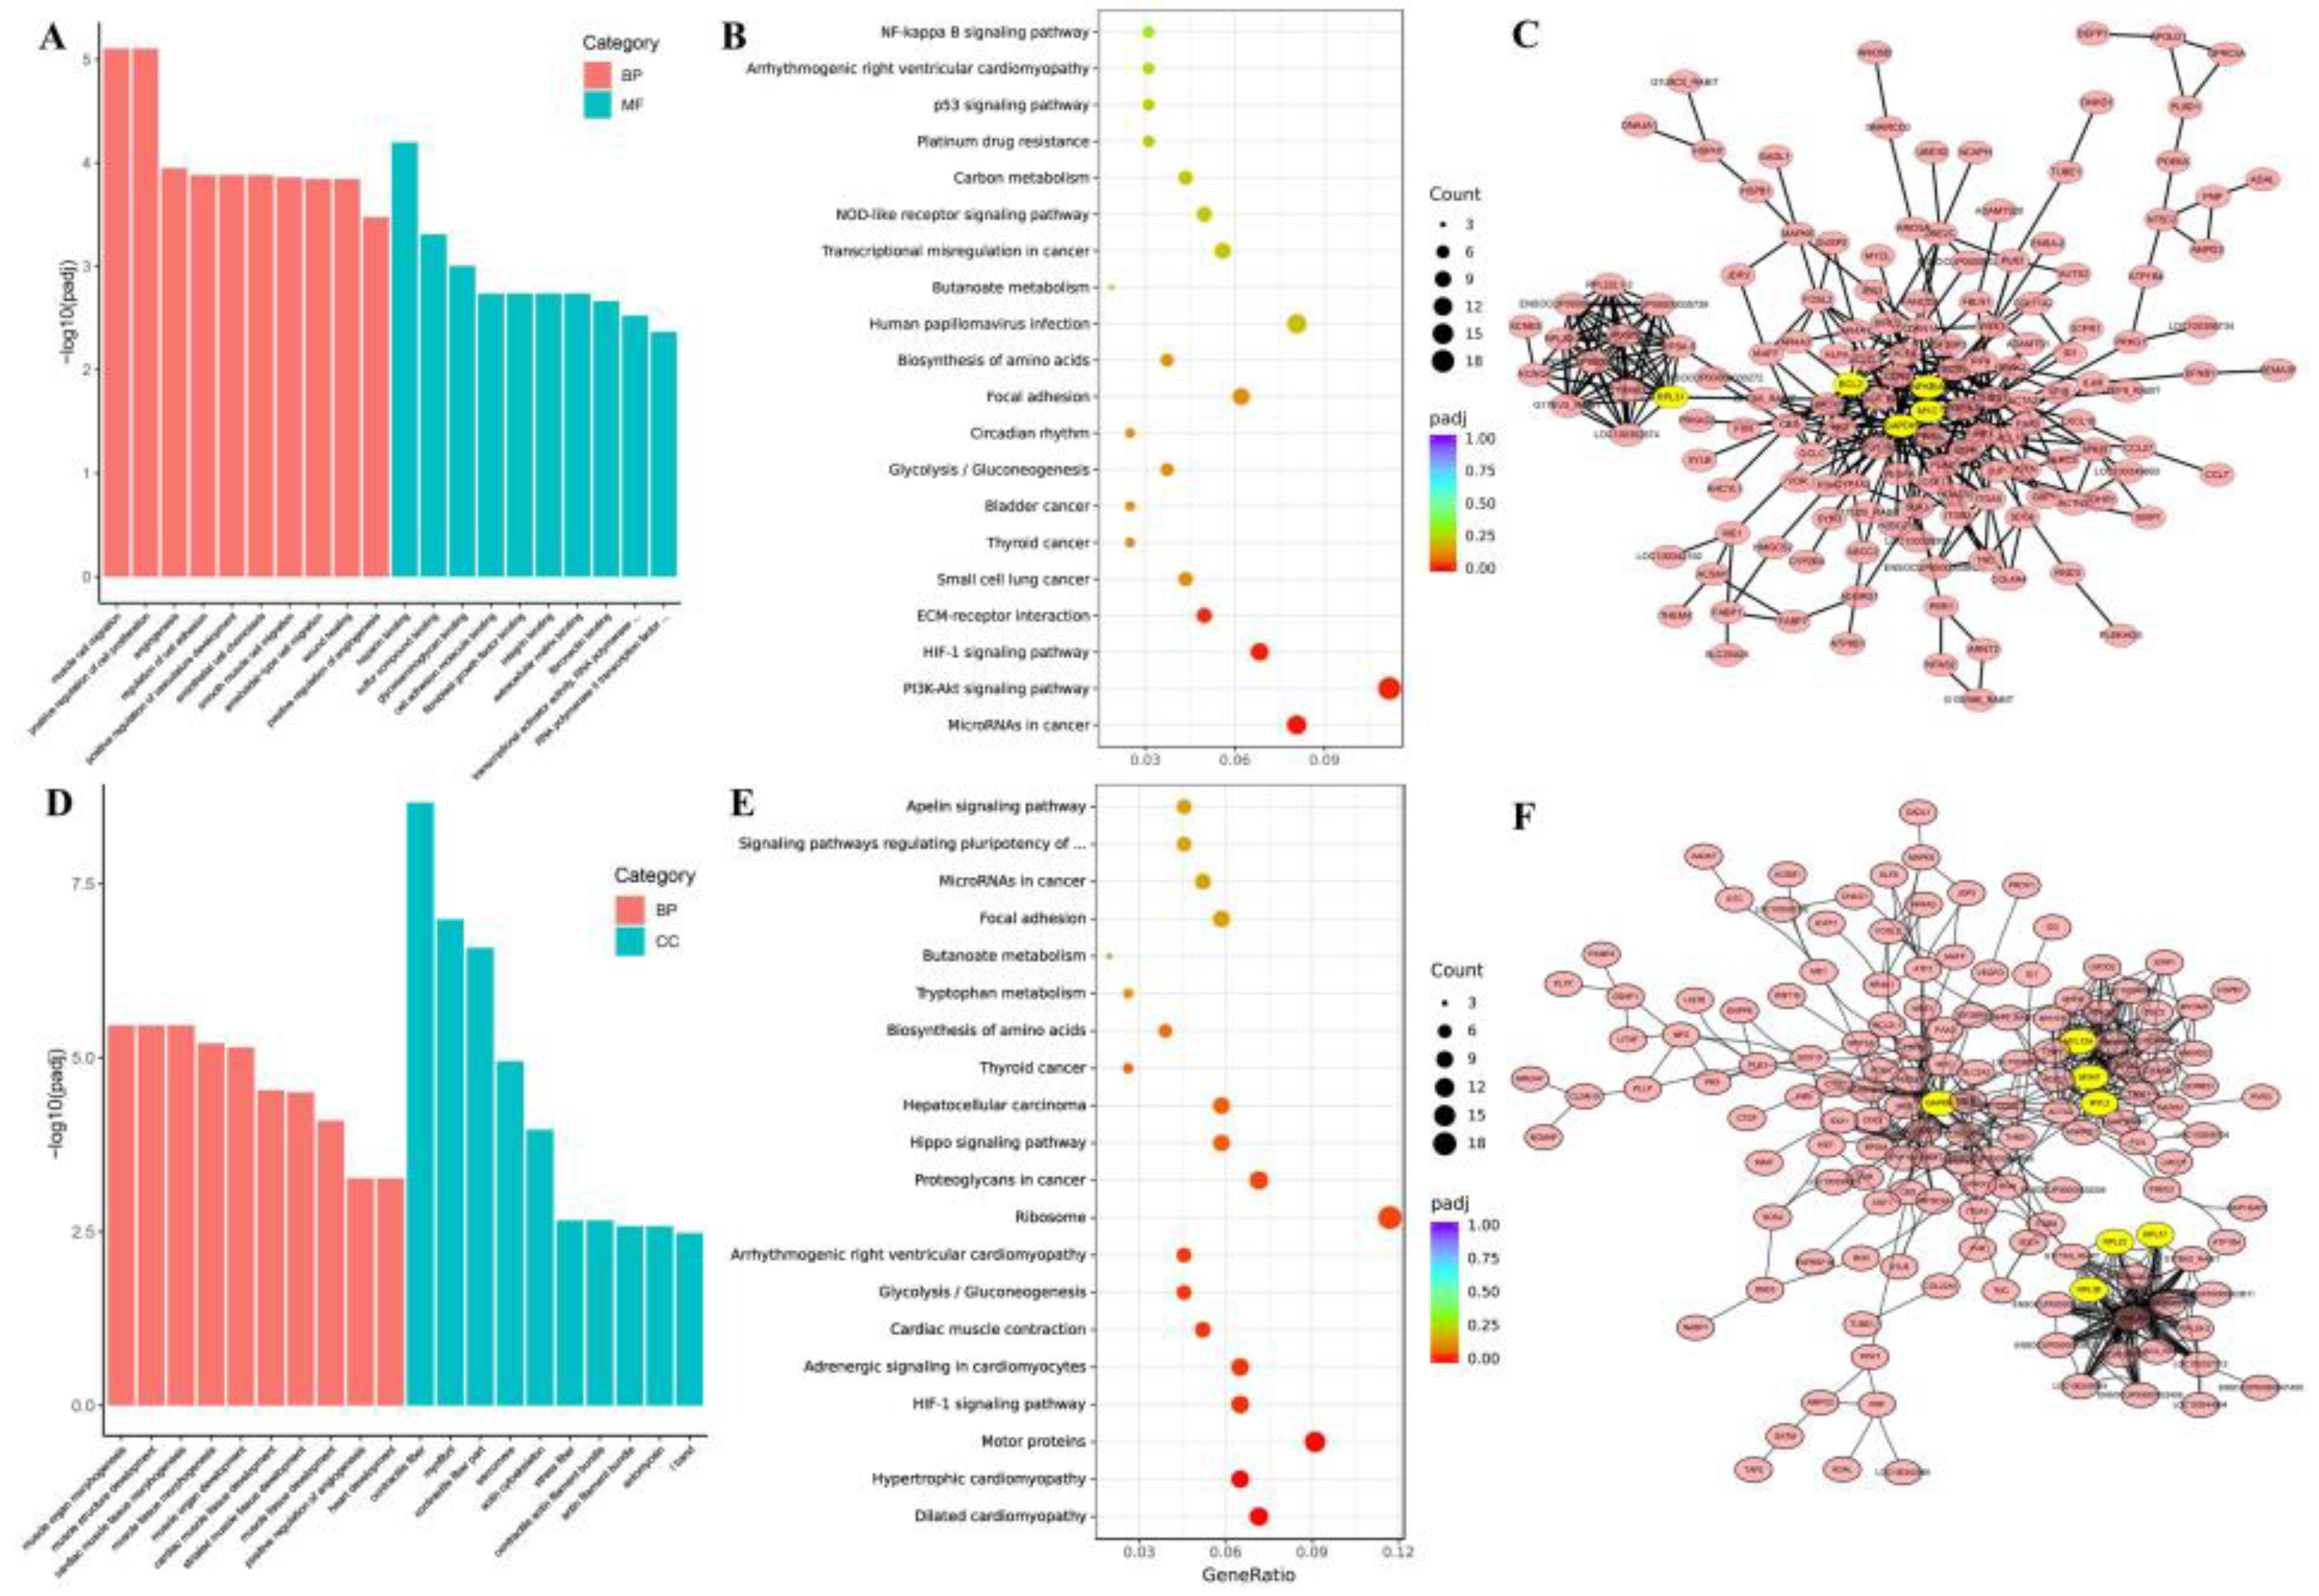
Figure 5.
Co-expressive and Tissue-specific expressive DEGs in thigh and longissimus dorsi muscle. A: the Venn digram of DEGs (Ma vs Ju) in thigh and longissimus dorsi muscle. B:GO analysis of the longissimus dorsi muscle-specific expresive DEGs; C: PPI of the longissimus dorsi muscle-specific expresive DEGs; D: GO analysis of co-expressive DEGs in thigh and longissimus dorsi muscle; E: PPI of co-expressive DEGs in thigh and longissimus dorsi muscle; F: GO analysis of the thigh muscle-specific expresive DEGs; G: PPI of the thigh muscle-specific expresive DEGs.
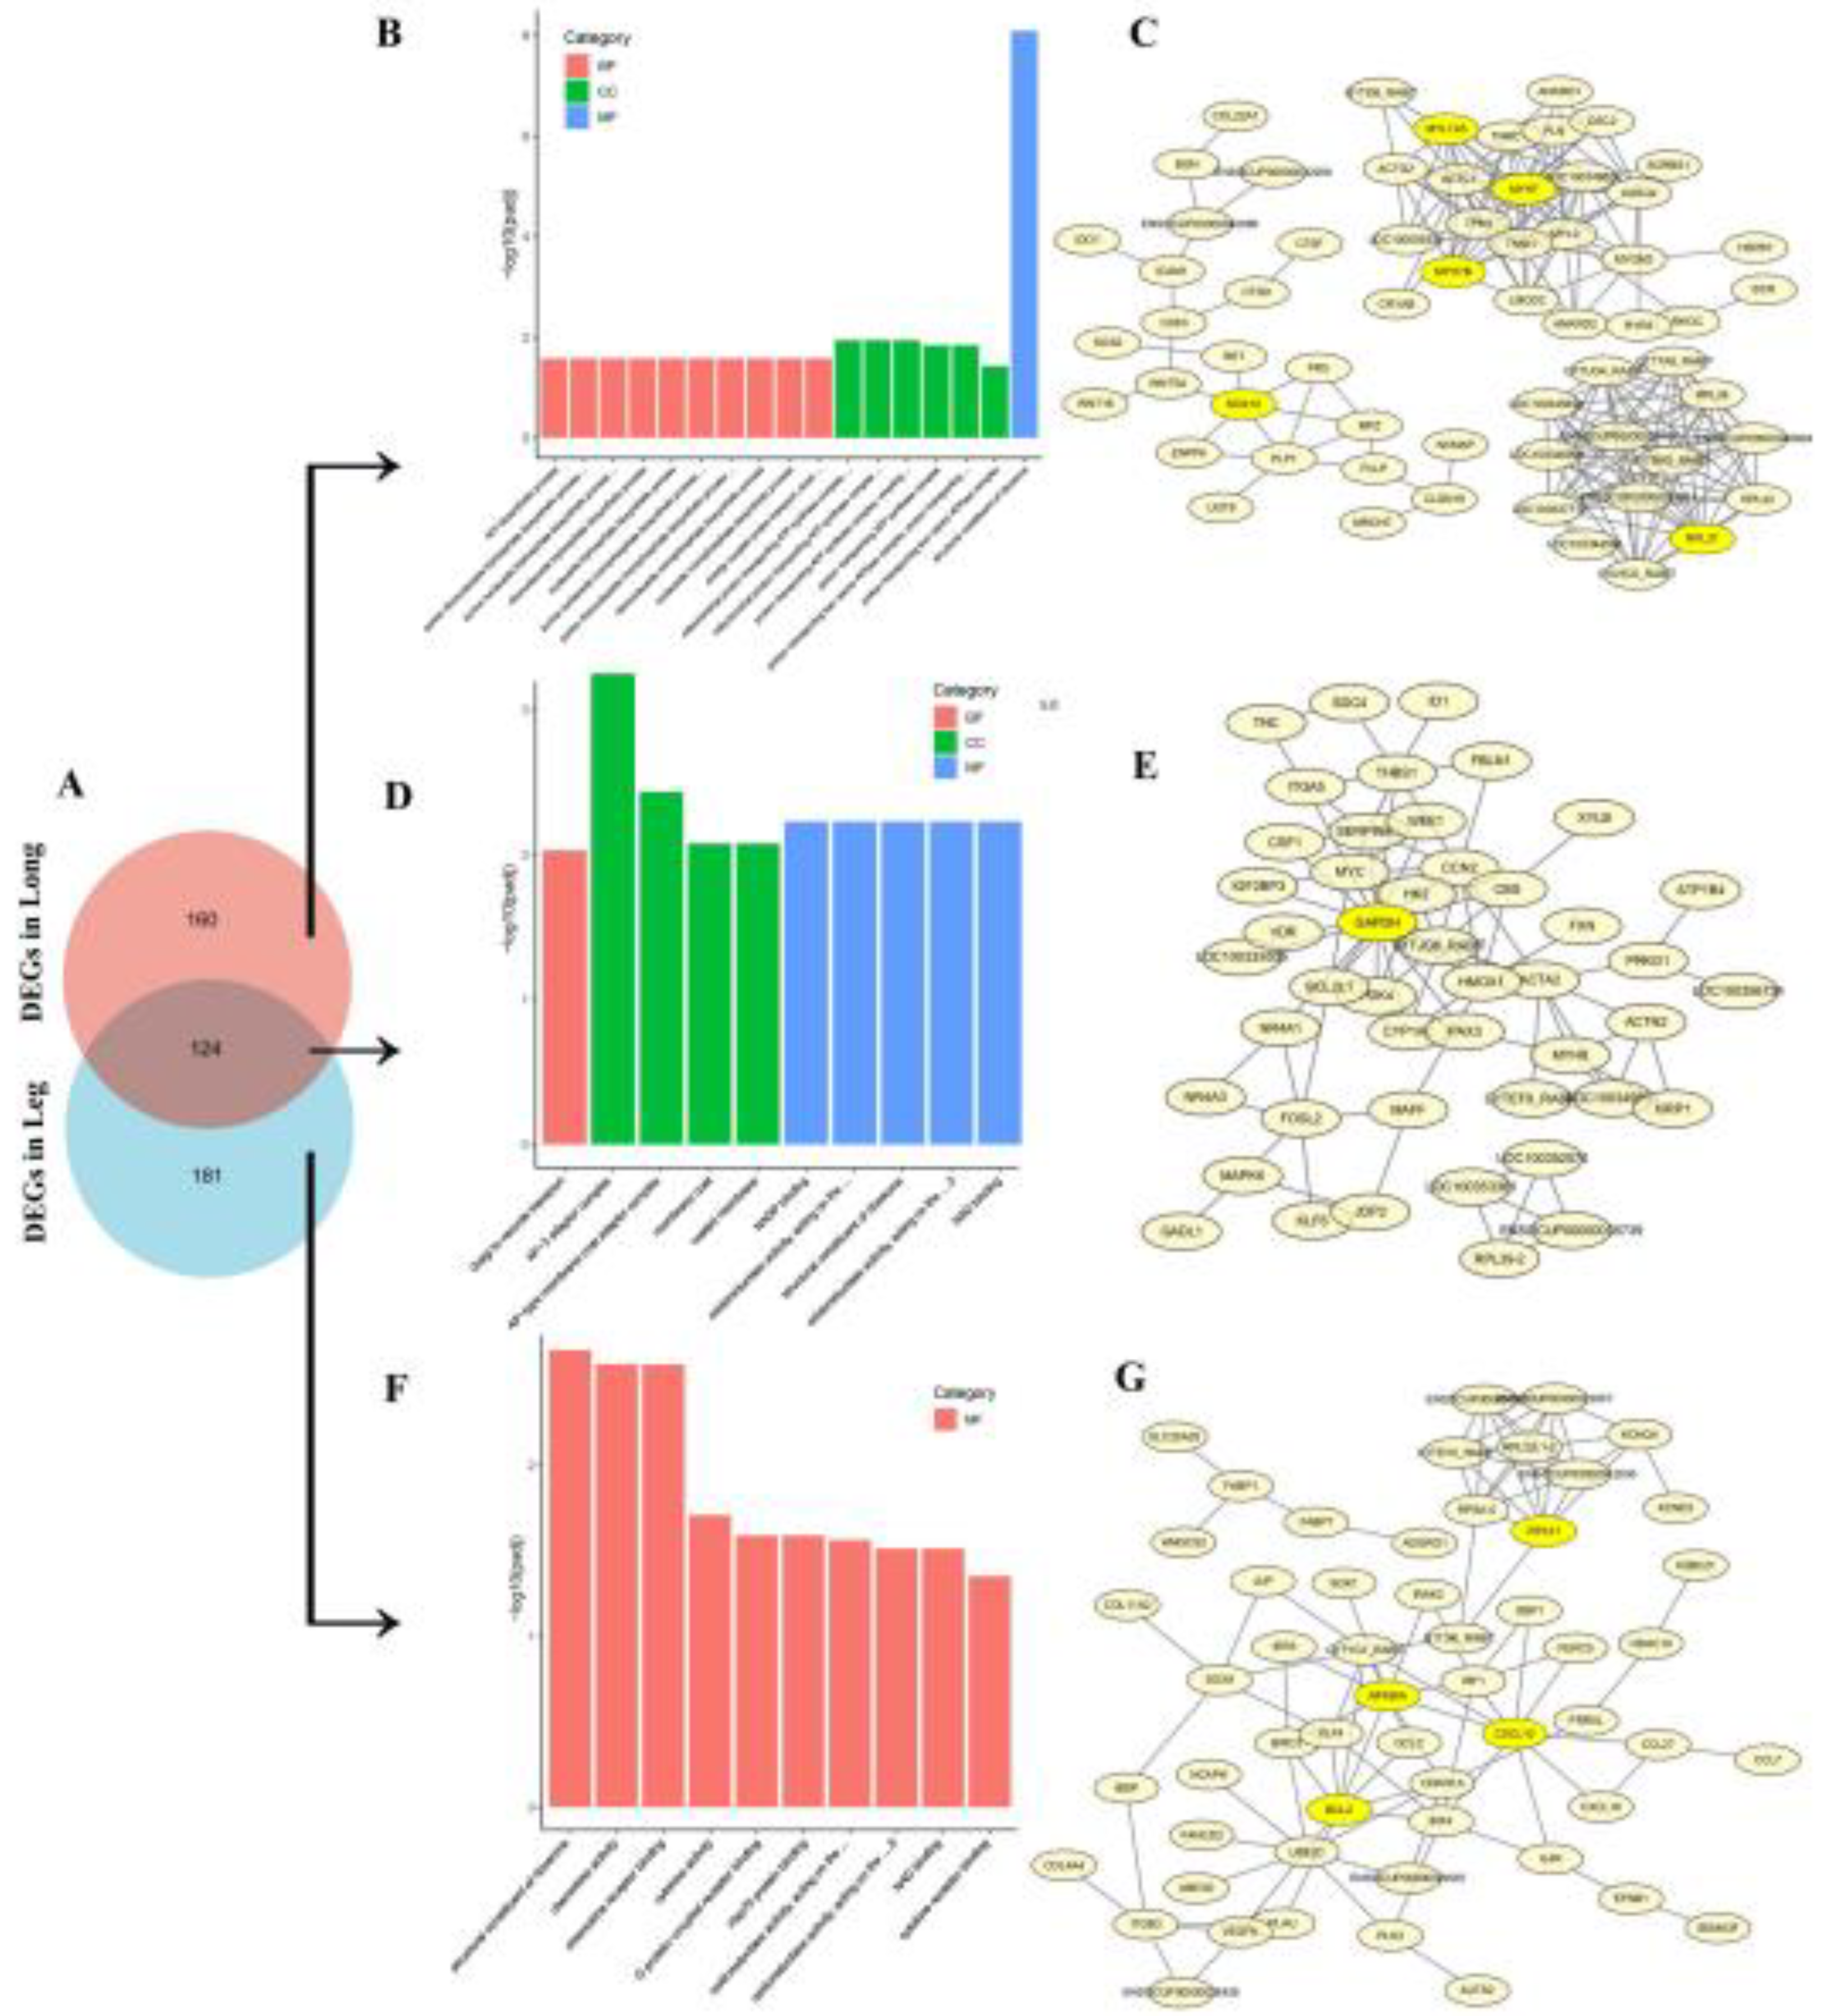

Table 1.
Ingredient composition of experimental diets (%, as fed basis).
| Ingredient | Content (%) |
|---|---|
| Alfalfa meal | 34.4 |
| Corn | 21.5 |
| Soya bean meal | 13.5 |
| Bran | 22.5 |
| Wheat | 5 |
| Calcium hydrogen phosphate | 0.9 |
| Mountain flour | 0.7 |
| NaCl | 0.5 |
| The vitamin premix 1 | 0.5 |
| The mineral Premix 2 | 0.5 |
| Total | 100.00 |
| Nutrient level 3 | Content |
| Digestible energy, Mcal/kg | 10.45 |
| Crude protein, % | 17.07 |
| Crude fibre, % | 10.92 |
| Lysine, % | 0.84 |
| Methionine + Cystine, % | 0.62 |
| Calcium, % | 1.01 |
| Phosphorus, % | 0.65 |
| Neutral detergent fiber, % | 27.22 |
| Acid detergent fiber, % | 14.29 |
1 The vitamin premix provides the following per kilogram of diet: VA 18000 IU; VD3 6000 IU; VE 48 IU; VK3 6 mg; VB1 6 mg; VB2 15 mg; VB6 7.2 mg; VB12 720 μg; D-pantothenic acid 30 mg; nicotinic acid 60 mg; folic acid 3 mg; biotin 3 mg. 2 The mineral premix provides the following per kilogram of diet: copper (CuSO4.5H2O) 6 mg; iron (FeSO4.H2O) 100 mg; zinc (ZnSO4.H2O) 100 mg; manganese (MnSO4.H2O) 4 mg; iodine (KI) 0.14 mg; selenium (Na2SeO3) 0.3 mg. 3 Nutrient levels are calculated values.
Table 2.
Sample sequencing data quality summary and reference genome comparison.
| Sample | Clean Reads | Clean Bases | Mapped ratio | Uni-mapped | Q30 | GC(%) |
|---|---|---|---|---|---|---|
| Ma_Leg_1 | 42394110 | 6.36G | 88.86% | 84.39% | 94.47 | 54.55 |
| Ma_Leg_2 | 41266572 | 6.19G | 90.21% | 85.58% | 93.77 | 53.29 |
| Ma_Leg_3 | 42051878 | 6.31G | 89.78% | 85.37% | 94.02 | 53.67 |
| Ju_Leg_1 | 42406862 | 6.36G | 87.94% | 83.85% | 94.08 | 55.13 |
| Ju_Leg_2 | 41415140 | 6.21G | 89.51% | 85.25% | 95.2 | 54.2 |
| Ju_Leg_3 | 41681174 | 6.25G | 89.35% | 84.76% | 94.13 | 53.93 |
| Ma_Long_1 | 46907154 | 7.04G | 84.05% | 79.4% | 94.66 | 54.42 |
| Ma_Long_2 | 43304158 | 6.5G | 86.49% | 82.52% | 93.74 | 55.95 |
| Ma_Long_3 | 39350026 | 5.9G | 87.75% | 83.68% | 93.9 | 55.46 |
| Ju_Long_1 | 44311234 | 6.65G | 87.66% | 83.11% | 95.35 | 54.63 |
| Ju_Long_2 | 42472108 | 6.37G | 82.41% | 78.17% | 95.71 | 57.76 |
| Ju_Long_3 | 42970742 | 6.45G | 87.9% | 83.47% | 95.88 | 55.27 |
| average | 42544263.17 | 6.51G | 87.66% | 94.58 | 54.86 |
Table 3.
GO and KEGG of DEGs related to muscle development in thigh muscle.
| Category | GOID | Description |
|---|---|---|
| BP | GO:0014812 | muscle cell migration |
| BP | GO:0043069 | negative regulation of programmed cell death |
| BP | GO:0014909 | smooth muscle cell migration |
| CC | GO:0030017 | sarcomere |
| CC | GO:0030016 | myofibril |
| CC | GO:0032432 | actin filament bundle |
| MF | GO:0043177 | organic acid binding |
| MF | GO:0005516 | calmodulin binding |
| MF | GO:0050661 | NADP binding |
| MF | GO:0005509 | calcium ion binding |
| KEGG | KEGGID | Description |
| ocu00010 | Glycolysis / Gluconeogenesis | |
| ocu04066 | HIF-1 signaling pathway | |
| ocu04151 | PI3K-Akt signaling pathway | |
| ocu04068 | FoxO signaling pathway | |
| ocu04010 | MAPK signaling pathway |
Table 4.
GO and KEGG of DEGs related to muscle development in longissimus dorsi muscles.
| Category | GOID | Description |
|---|---|---|
| BP | GO:0014812 | muscle cell migration |
| BP | GO:0006954 | inflammatory response |
| BP | GO:0014909 | smooth muscle cell migration |
| BP | GO:0061061 | muscle structure development |
| CC | GO:0015629 | actin cytoskeleton |
| CC | GO:0043292 | contractile fiber |
| CC | GO:0030016 | myofibril |
| CC | GO:0016459 | myosin complex |
| MF | GO:0005509 | calcium ion binding |
| MF | GO:0001968 | fibronectin binding |
| MF | GO:0051015 | actin filament binding |
| KEGG | KEGGID | Description |
| ocu04066 | HIF-1 signaling pathway | |
| ocu00010 | Glycolysis / Gluconeogenesis | |
| ocu04810 | Regulation of actin cytoskeleton | |
| ocu03320 | PPAR signaling pathway |
Disclaimer/Publisher’s Note: The statements, opinions and data contained in all publications are solely those of the individual author(s) and contributor(s) and not of MDPI and/or the editor(s). MDPI and/or the editor(s) disclaim responsibility for any injury to people or property resulting from any ideas, methods, instructions or products referred to in the content. |
© 2025 by the authors. Licensee MDPI, Basel, Switzerland. This article is an open access article distributed under the terms and conditions of the Creative Commons Attribution (CC BY) license (http://creativecommons.org/licenses/by/4.0/).
Copyright: This open access article is published under a Creative Commons CC BY 4.0 license, which permit the free download, distribution, and reuse, provided that the author and preprint are cited in any reuse.


