
Submitted:
18 March 2025
Posted:
20 March 2025
You are already at the latest version
Abstract
This work presents an optimized and sustainable chemical recycling method for epoxy resin matrices, which uses microwave-assisted reactions to achieve complete recovery of the matrix without generating waste byproducts. The proposed method employs a green chemistry approach, with hydrogen peroxide (H2O2) and tartaric acid (TA) as eco-friendly reagents. Microwaves are used to activate the chemical reaction, ensuring localized heating, reduced energy consumption and shorter processing times compared to conventional thermal methods. Unlike most existing recycling processes, which focus on fiber recovery, this study emphasizes the recovery and reuse of the matrix, transforming it into a valuable resource for producing new thermosetting materials. The recovered matrix was characterized using FTIR and H-NMR analyses, confirming the presence of reactive functional groups that enable its reintegration into new composite matrices formulations. The process has demonstrated environmental benefits and economic advantages also due to the absence of any waste and the reduced need for virgin raw materials. This method addresses a critical gap in composite material recycling, paving the way for a circular lifecycle and advancing the principles of sustainability in materials engineering.
Keywords:
microwave
; chemical recycling
; epoxy resin
; composites
; green chemistry
; zero waste
; reuse
1. Introduction
Epoxy resins have emerged as a cornerstone material in the production of fiber-reinforced composites due to their unique combination of mechanical strength, lightweight properties, corrosion resistance, and excellent adhesion. These attributes make epoxy-based composites indispensable in diverse applications, ranging from high-volume sectors like wind turbine blades [5] and shipbuilding, primarily using glass fibers, to high-performance domains such as aerospace, where carbon fibers dominate [1,9,11,14,27]. Furthermore, their versatility extends to coatings, adhesives, and electronics, generating significant amounts of epoxy resin waste across various industries.
The increasing demand for composites made from epoxy resins (glass fiber reinforced polymer GFRP and carbon fiber reinforced polymer CFRP) is projected to grow steadily due to their expanding applications [3,25,26,31]. However, this growth highlights a critical challenge: the lack of efficient strategies for recycling or reusing thermoset composite waste [16]. Unlike thermoplastics, thermosetting resins like epoxy cannot be remolded once cured, complicating their end-of-life management. Consequently, the decommissioning of composite materials, particularly wind turbine blades, has brought this issue into sharp focus [6,10,12,17,23,29].
Existing recycling processes for thermoset composites can be broadly categorized into mechanical, thermal, and chemical methods [31]. Mechanical recycling involves grinding the composite material into filler powders, which often suffer from a loss of fiber strength and aspect ratio, reducing their usability in high-performance applications [28]. Thermal recycling, including pyrolysis and fluidized bed reactors, primarily focuses on recovering fibers. However, these methods often require high energy inputs, generate toxic byproducts, and lead to significant degradation of fiber properties [15]. Chemical recycling has gained attention as a more sustainable alternative, with various approaches utilizing supercritical fluids or acid-based reactions to recover fibers. However, these methods often involve harsh chemicals or high-temperature conditions, making them less environmentally friendly [2,13,28].
Despite progress in recycling technologies, most efforts have prioritized fiber recovery over matrix recovery. Matrix materials, particularly epoxy resins, have been largely neglected, leaving significant potential untapped. While some studies have explored resin recovery, the approaches are limited in scope or efficiency: low percentage of resin recovered in the new proposed material, use of dangerous substances, production of wastes [4,8,14,30]. Notably, microwaves have been employed in recycling processes to achieve localized heating, improve energy efficiency, and reduce processing times. For instance, microwave-assisted pyrolysis has been shown to decrease waste volume by 73% [26], and fiber detachment has been achieved with minimal property loss [21]. However, the reported works only focus on carbon fiber recovery, which is mainly driven from economic issues, whereas comprehensive strategies that address matrix recovery, while adhering to principles of green chemistry, remain scarce. Therefore, this study is aimed at optimizing the eco-friendly microwave-assisted chemical recycling process proposed by Zabihi [28], for the recovery of epoxy matrix, which is also crucial in the circular economy framework. The recovered resin residue is characterized and evaluated for its potential reuse in producing new thermosetting matrices, paving the way for a more sustainable lifecycle of composite materials.
2. Materials and Methods
2.1. Materials
Hydrogen peroxide (H2O2, 35 wt%, 130 volumes) and pure L-Tartaric Acid (TA, food additive E334) were purchased from Sigma Aldrich. Yeast (food grade) was produced by Cameo s.p.a. (Brescia, Italy). An epoxy resin based on Diglycidyl Ether of Bisphenol-A, Polar Bear provided by R*Concept (Barcelona, Spain), and characterized by a biocarbon content of 28% deriving from pine oils, was used. It is liquid at room temperature, hence making easy mechanical mixing process with the curing agent [22]. Isophorone diamine (IPDA), a common hardener promoting curing at room and medium temperatures in several applications (Sigma Aldrich) was used.
2.2. Methods
2.2.1. Preparation of Samples
Virgin epoxy resin (VIR) was produced by mixing epoxy monomer with 22 phr of IPDA (stoichiometric ratio), then pouring it in a mould (35 × 10 x 2 mm) and finally curing was performed in forced convection oven at 80°C for 2 hours followed by post-curing at 120°C for 1 hour. The chemical residue (CR), obtained from recycling the VIR sample, as described in the following section, was used for the production of new samples. This was done by manually mixing CR and VIR in different ratios, as reported in Table 1. Then, 22 phr of IPDA, calculated on the amount of VIR used, were added to the mixture [22]. The cure and post-cure cycles were the same used for the virgin resin.
In order to compare the chemical recycling approach to mechanical recycling, samples were produced with the same composition as the previous ones, but cured virgin resin was ground (Ground Resin, GR) and mixed with uncured resin (as reported in Table 1). Afterwards, samples made of liquid and solid resin was mixed with IPDA and cured following the same procedure used for virgin resin.

Table 1.
Composition of samples containing the chemical residue (CR) or the ground virgin epoxy resin (GR).
Table 1.
Composition of samples containing the chemical residue (CR) or the ground virgin epoxy resin (GR).
| SAMPLES | VIR [wt%] |
CR/GR [wt%] |
IPDA [phr on VIR] |
|---|---|---|---|
| VIR_CR_1 | 90 | 10 | 22 |
| VIR_CR_2 | 80 | 20 | 22 |
| VIR_CR_3 | 70 | 30 | 22 |
| VIR_CR_4 | 60 | 40 | 22 |
| VIR_GR_1 | 90 | 10 | 22 |
| VIR_GR_2 | 80 | 20 | 22 |
| VIR_GR_3 | 70 | 30 | 22 |
| VIR_GR_4 | 60 | 40 | 22 |
2.2.2. Optimization of Recycling Process
The solution used for the recycling process was prepared by mixing, 35 wt% hydrogen peroxide and tartaric acid (3:1 weight ratio [28]), at room temperature, using a magnetic stirrer at 3,000 rpm for 30 minutes. A resin sample of 0.81 g was immersed in 9 g of solution (corresponding to 1:11 weight ratio), then the mixture was mixed gently and placed in the microwave oven (Sharp Corporation, Japan – max power 800 W). Recycling cycles were run in sequence, and in each cycle the solution completely evaporated, which required its replacement at the beginning of each cycle. In order to evaluate the weight loss that occurred, the resin sample was recovered at the end of the cycles, washed in distilled water and dried for 24 hours at 50°C.
The sample weight loss (WL) was calculated by measuring the weight of the sample after the recycling test (RW) made up of three cycles in relation with the initial weight of the virgin one (IW):
WL % = (RW/IW) * 100
The microwave power was tailored in order to reduce energy consumption and the number of process cycles, and to avoid too fast evaporation of the hydrogen peroxide. Some tests were performed at 160, 240, 320 and 400 W. By reducing the power of the microwave oven, the dissociation reaction of the hydrogen peroxide would start later (increasing the process time); therefore, in order to speed up the reaction a food grade yeast, as natural catalyst, was added to the mixture. The yeast allows shortening the reaction time, thus promoting the dissociation of the hydrogen peroxide which would otherwise only occur through thermal activation (when approximately 80°C are reached). The yeast (1.5 wt% solution) was therefore added to the recycling solution, mixing it gently before placing the mixture in the microwave oven. The reaction progress is evidenced by a rapid evolution of O2 and CO2 as bubbles.
Furthermore, a comparison between microwave and conventional oven was also performed. Tests were carried out at different temperatures (150°C - 100°C) using a vented oven (Carbolite – max power 3,000 W). The duration of each cycle at 150°C is 15 minutes, at 100°C 30 minutes; at the end of each cycle weight loss was calculated.
All the tests were performed on as-produced resin samples (35 x 10 x 2 mm) have not been previously ground, since this would allow, when recycling the whole composite, to preserve the physical and geometrical characteristics of the fibers [19].
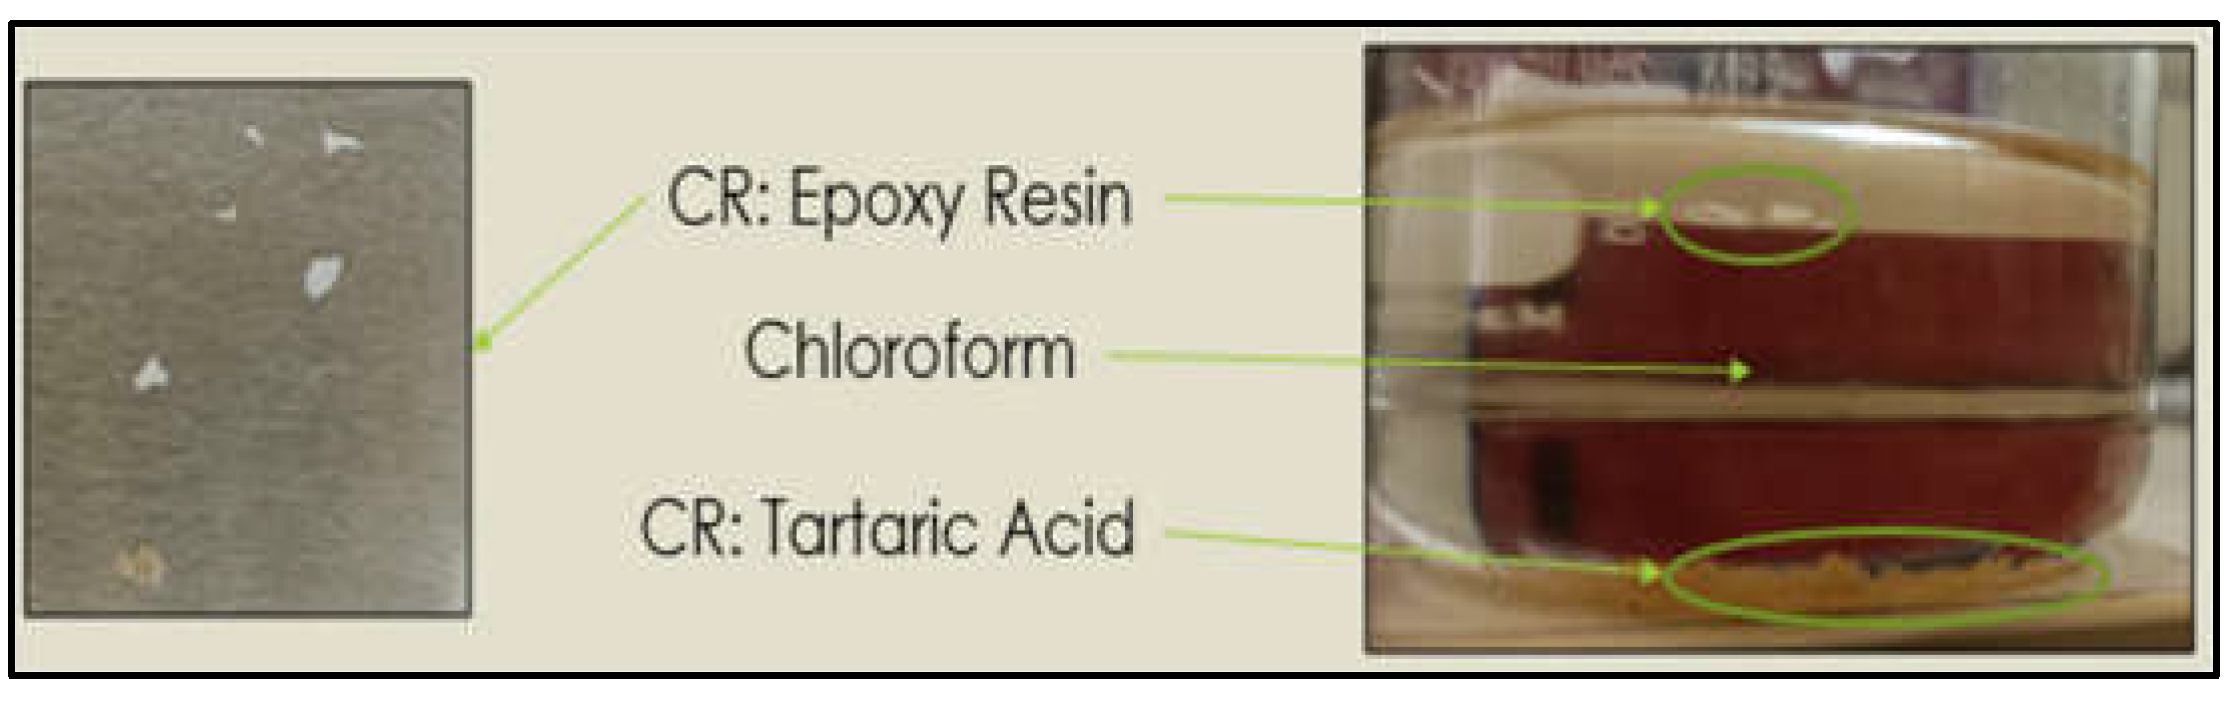
As a further step for improving the recycling process, the chemical residue (CR), which is made by resin and tartaric acid, was further separated in chloroform: the CR collected from the recycling process was immersed in chloroform for 24 hours. The depolymerized resin (DR) that separated from the tartaric acid was collected, dried at 50°C for 24 hours and subsequently analysed.
Figure 1.
Separation process of CR in chloroform.
2.2.3. Testing Methods
Fourier transform infrared spectroscopy (FT-IR) analysis, performed with a Jasco 6300 FT-IR spectrometer (JASCO Corporation, Tokyo, Japan), was used to characterize all the samples and the products of recycling process. Infrared spectra were recorded in the wavelength range between 700 and 3,500 cm-1, 50 scans, and 4 cm-1 of resolution, by using ATR Pro One X with ZnSe crystal.
H-NMR analysis was performed with Bruker Avance III spectrometer (Bruker, Karlsruhe, Germany), operating at 400.13 MHz for 1H observation and a temperature of 300.0 K, equipped with a BBI 5 mm inverse detection probe incorporating a z-axis gradient coil. The sample was dissolved in deuterated methanol.
Differential scanning calorimetry (DSC) analysis was performed using a Mettler Toledo 822 (Mettler Toledo, Greifensee, Switzerland). The samples are first heated from 0°C to 150/200°C (at 10°C/min) followed by a two-minute temperature hold and then cooled at 10°C/min back to starting temperature. A second heating scan, again performed at 10°C/min, was used to measure the glass transition temperature of cured samples.
The flexural properties of each cured sample were measured using a dynamometer, Lloyd LR5K, according to ASTM D790 (ASTM D790-17, 2017) (three-points bending). Four replicates were performed on each sample.
3. Results and Discussion
3.1. Optimization of Recycling Process
For each microwave power, the holding time of the solution was limited by its complete evaporation, which was achieved after 11.5, 5.5, 3.3 and 2.6 minutes for the microwave powers of 160, 240, 320 and 400 W, so each cycle in the microwave oven was set equal to the time for evaporation. In order to obtain complete dissolution of the matrix, the number of required cycles, for any microwave power except 400 W, is equal to 10. When using a microwave power of 400 W, the very short holding time (i.e. 2.6 min) required an additional cycle to achieve complete sample dissolution. The effect of yeast addition was assessed for a microwave power of 320 W. As it can be observed in Table 2, the yeast allowed to save about 10% of time for complete dissolution of the matrix. The time for complete dissolution of the matrix is reported for different microwave powers.
After each cycle the solution was refilled to compensate its evaporation: for even cycles (2, 4, 6, 8 and 10) only hydrogen peroxide was added. For odd cycles, the complete solution, including TA and yeast, was added. This was done in order to reduce the amount of tartaric acid residues in degraded compounds.
Table 2.
Total process time (with yeast) and number of cycle as a function of microwave power.
| Microwave Power [W] |
Total process time [min] |
Number of cycles |
|---|---|---|
| 160 | 115 | 10 |
| 240 | 55.5 | 10 |
| 320 320 |
36.2 (no yeast) 33 |
10 10 |
| 400 | 28.5 | 11 |
From the data reported in Table 2, 320 W was chosen as the optimal power, because it allowed to reduce the process time required to obtain complete degradation of the resin (with the same number of cycles) and therefore the consumption of hydrogen peroxide, TA and yeast.
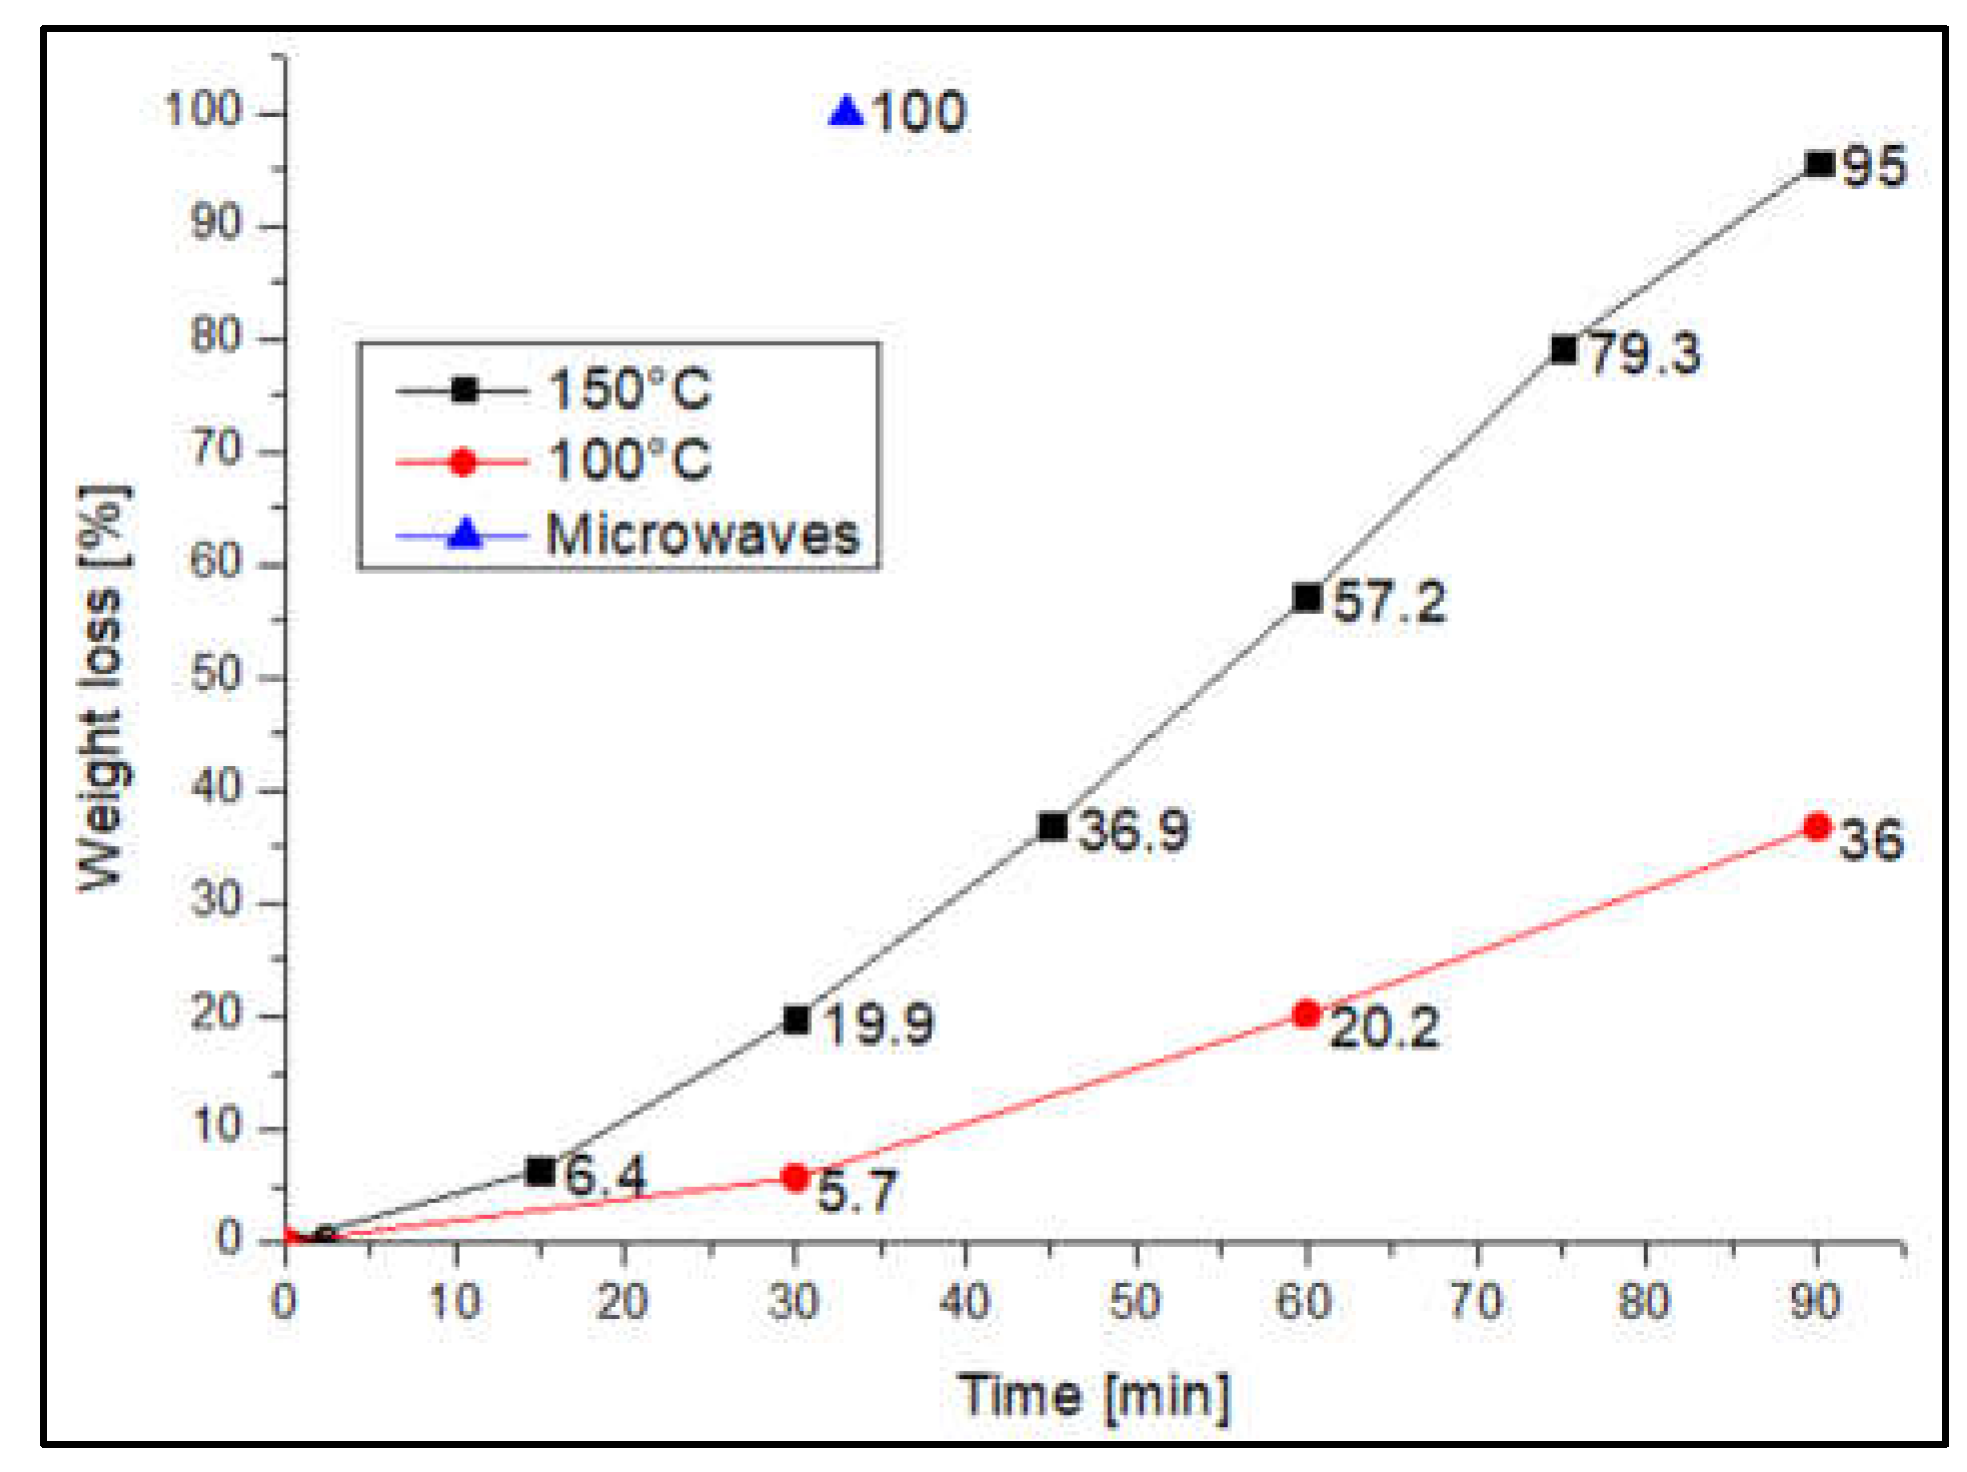
A comparison between microwaves and conventional heating was performed repeating, the same procedures in a vented oven: at 150°C almost complete degradation of the resin is achieved after 90 minutes (weight loss = 95.7%), while at 100°C with the same processing time, a weight loss of 36.8% was observed.
Figure 2 shows that, in 33 minutes, the time required to achieve complete dissolution of the resin by microwave at 320W, only 25% weight loss is achieved by heating in the oven at 150 °C. This clearly indicate that better performances are achieved when microwave heating is used.
Figure 2.
Weight loss trend of the resin during the test with conventional heating compared to the results obtained using microwave heating at 320 W.
Figure 2.
Weight loss trend of the resin during the test with conventional heating compared to the results obtained using microwave heating at 320 W.
3.2. FTIR and H-NMR Analysis
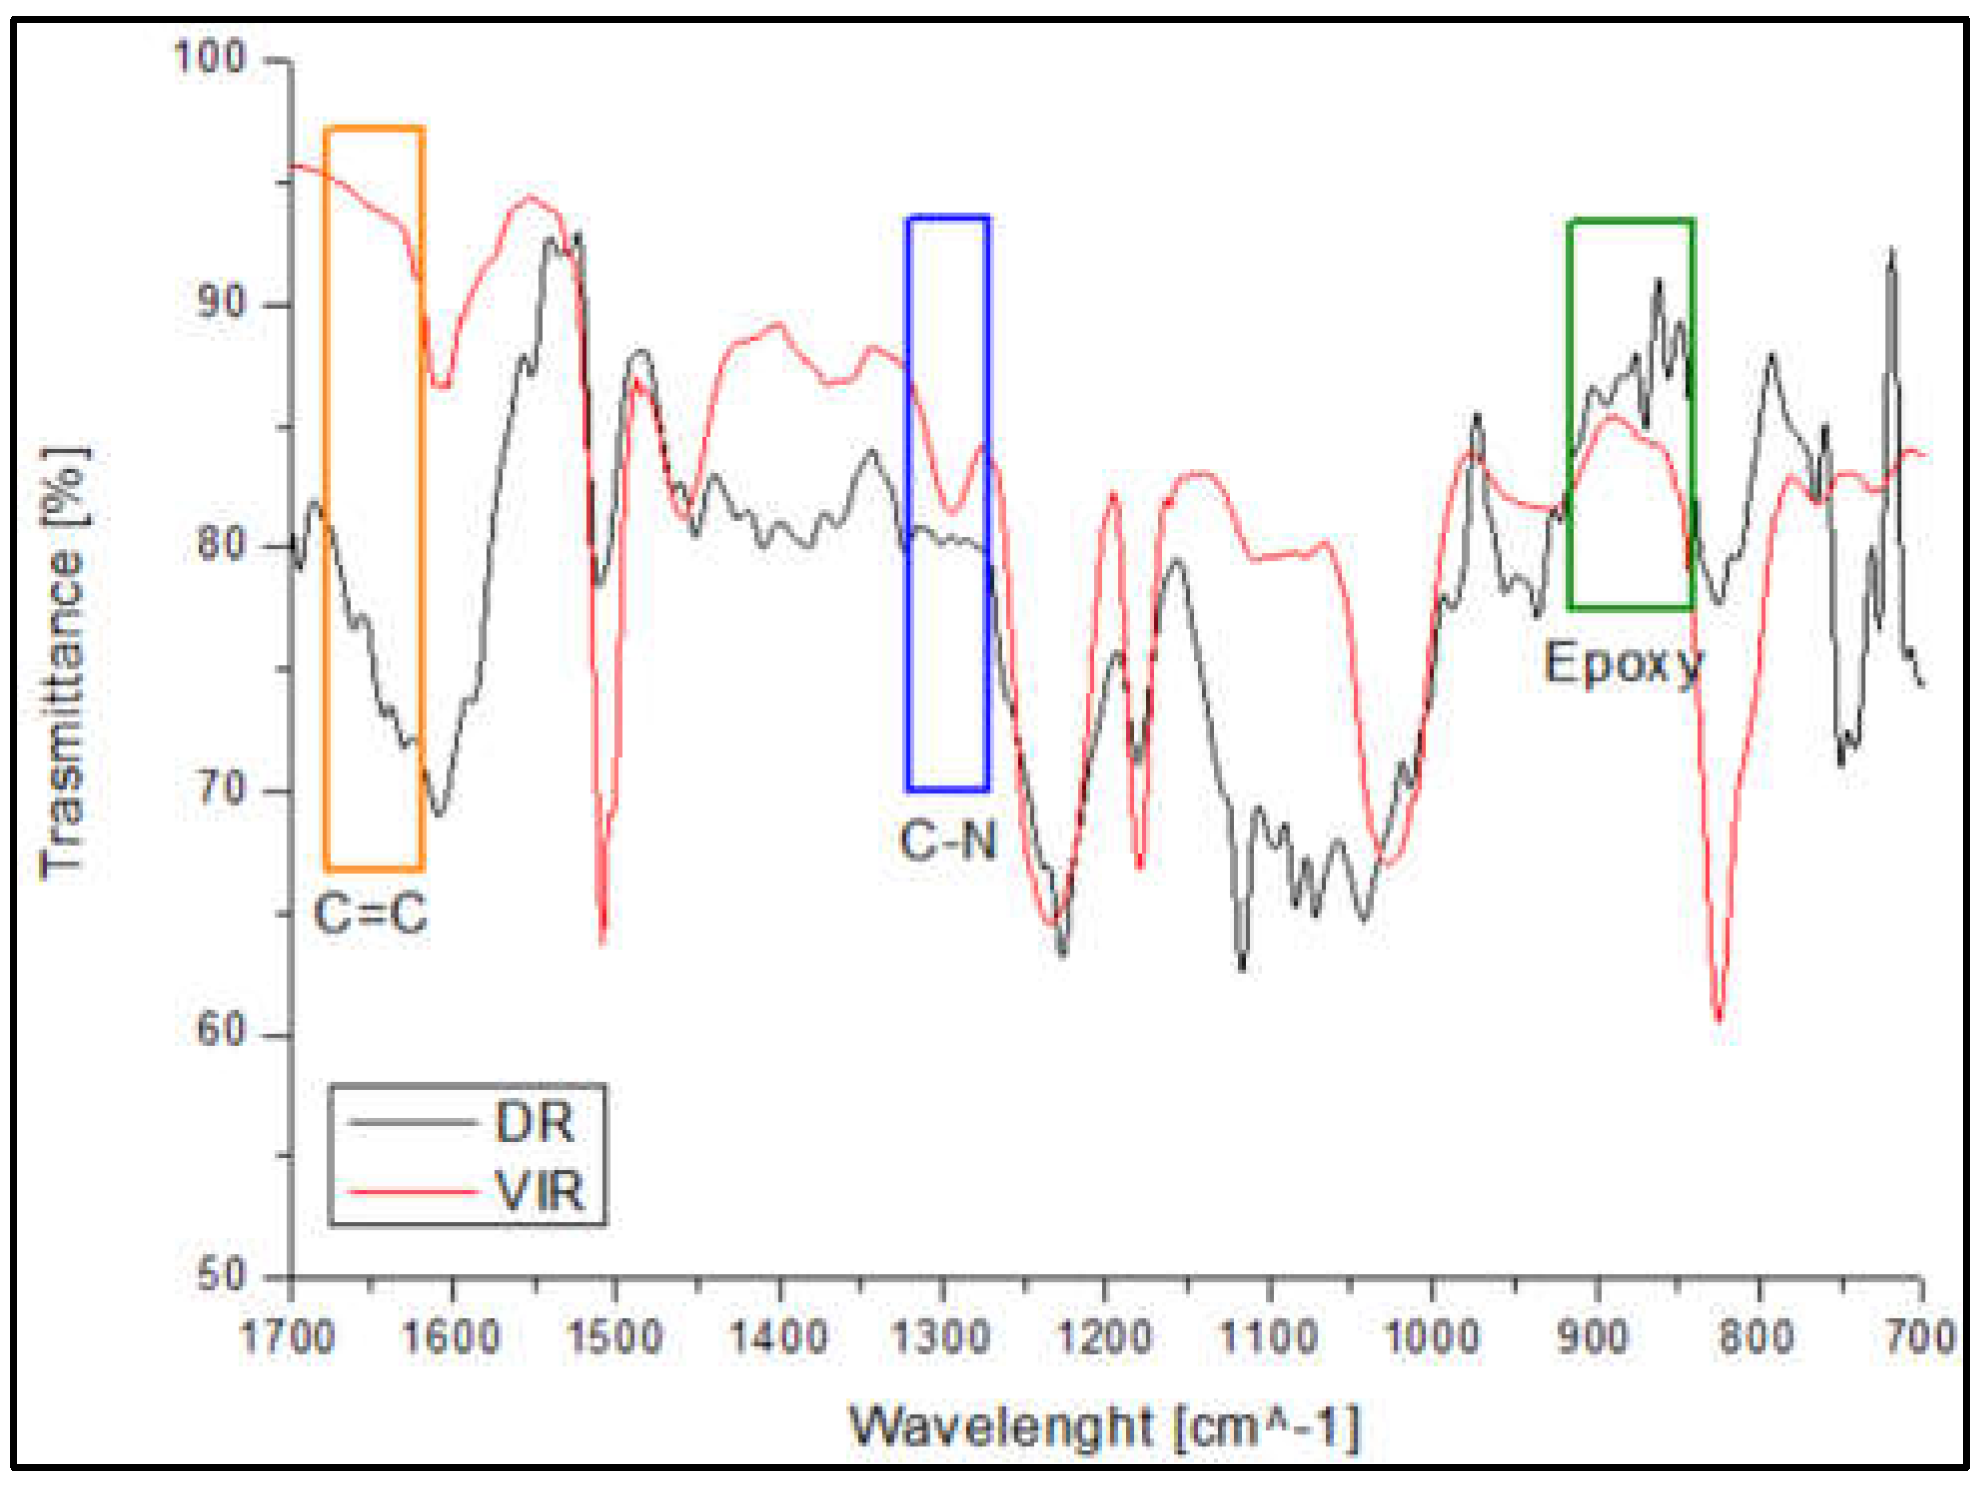
Figure 3 shows the spectrum of the DR, obtained after separation of TA from the recovered matrix, compared with that of VIR sample. The peak around 1300 cm-1 (blue area in Figure 3), attributed to the C-N bond [24] is well evident in the VIR sample, but disappears on sample DR. In addition, the epoxy peaks are well evident on the DR spectrum (green area in Figure 3) in the range 840-910 cm-1. Similarly, a barely visible peak is observed on DR around 1650 cm-1, relative to C=C. Both observations demonstrate that the chemical recycling mainly causes cleaving of the C-N bonds, and re-generation of epoxy and C=C bonds, making the DR material suitable for a further curing in presence of amine or by radical chain polymerization.
Figure 3.
Comparison between FT-IR spectra of VIR and DR.
However, the developed approach for TA/DR separation at the moment is not in line with the principles of green chemistry, since it requires solvents and is very time-consuming. In addition, the presence of TA in the chemical residue is believed to potentially contribute and accelerate the curing reaction of the epoxies [18]. Therefore, for the following thermal and mechanical characterization, the VIR epoxy was mixed with CR, which is made by depolymerized resin and TA. The chemical residue was collected, dried (24h at 50°C) and analysed by FTIR and H-NMR. No waste products were eliminated.
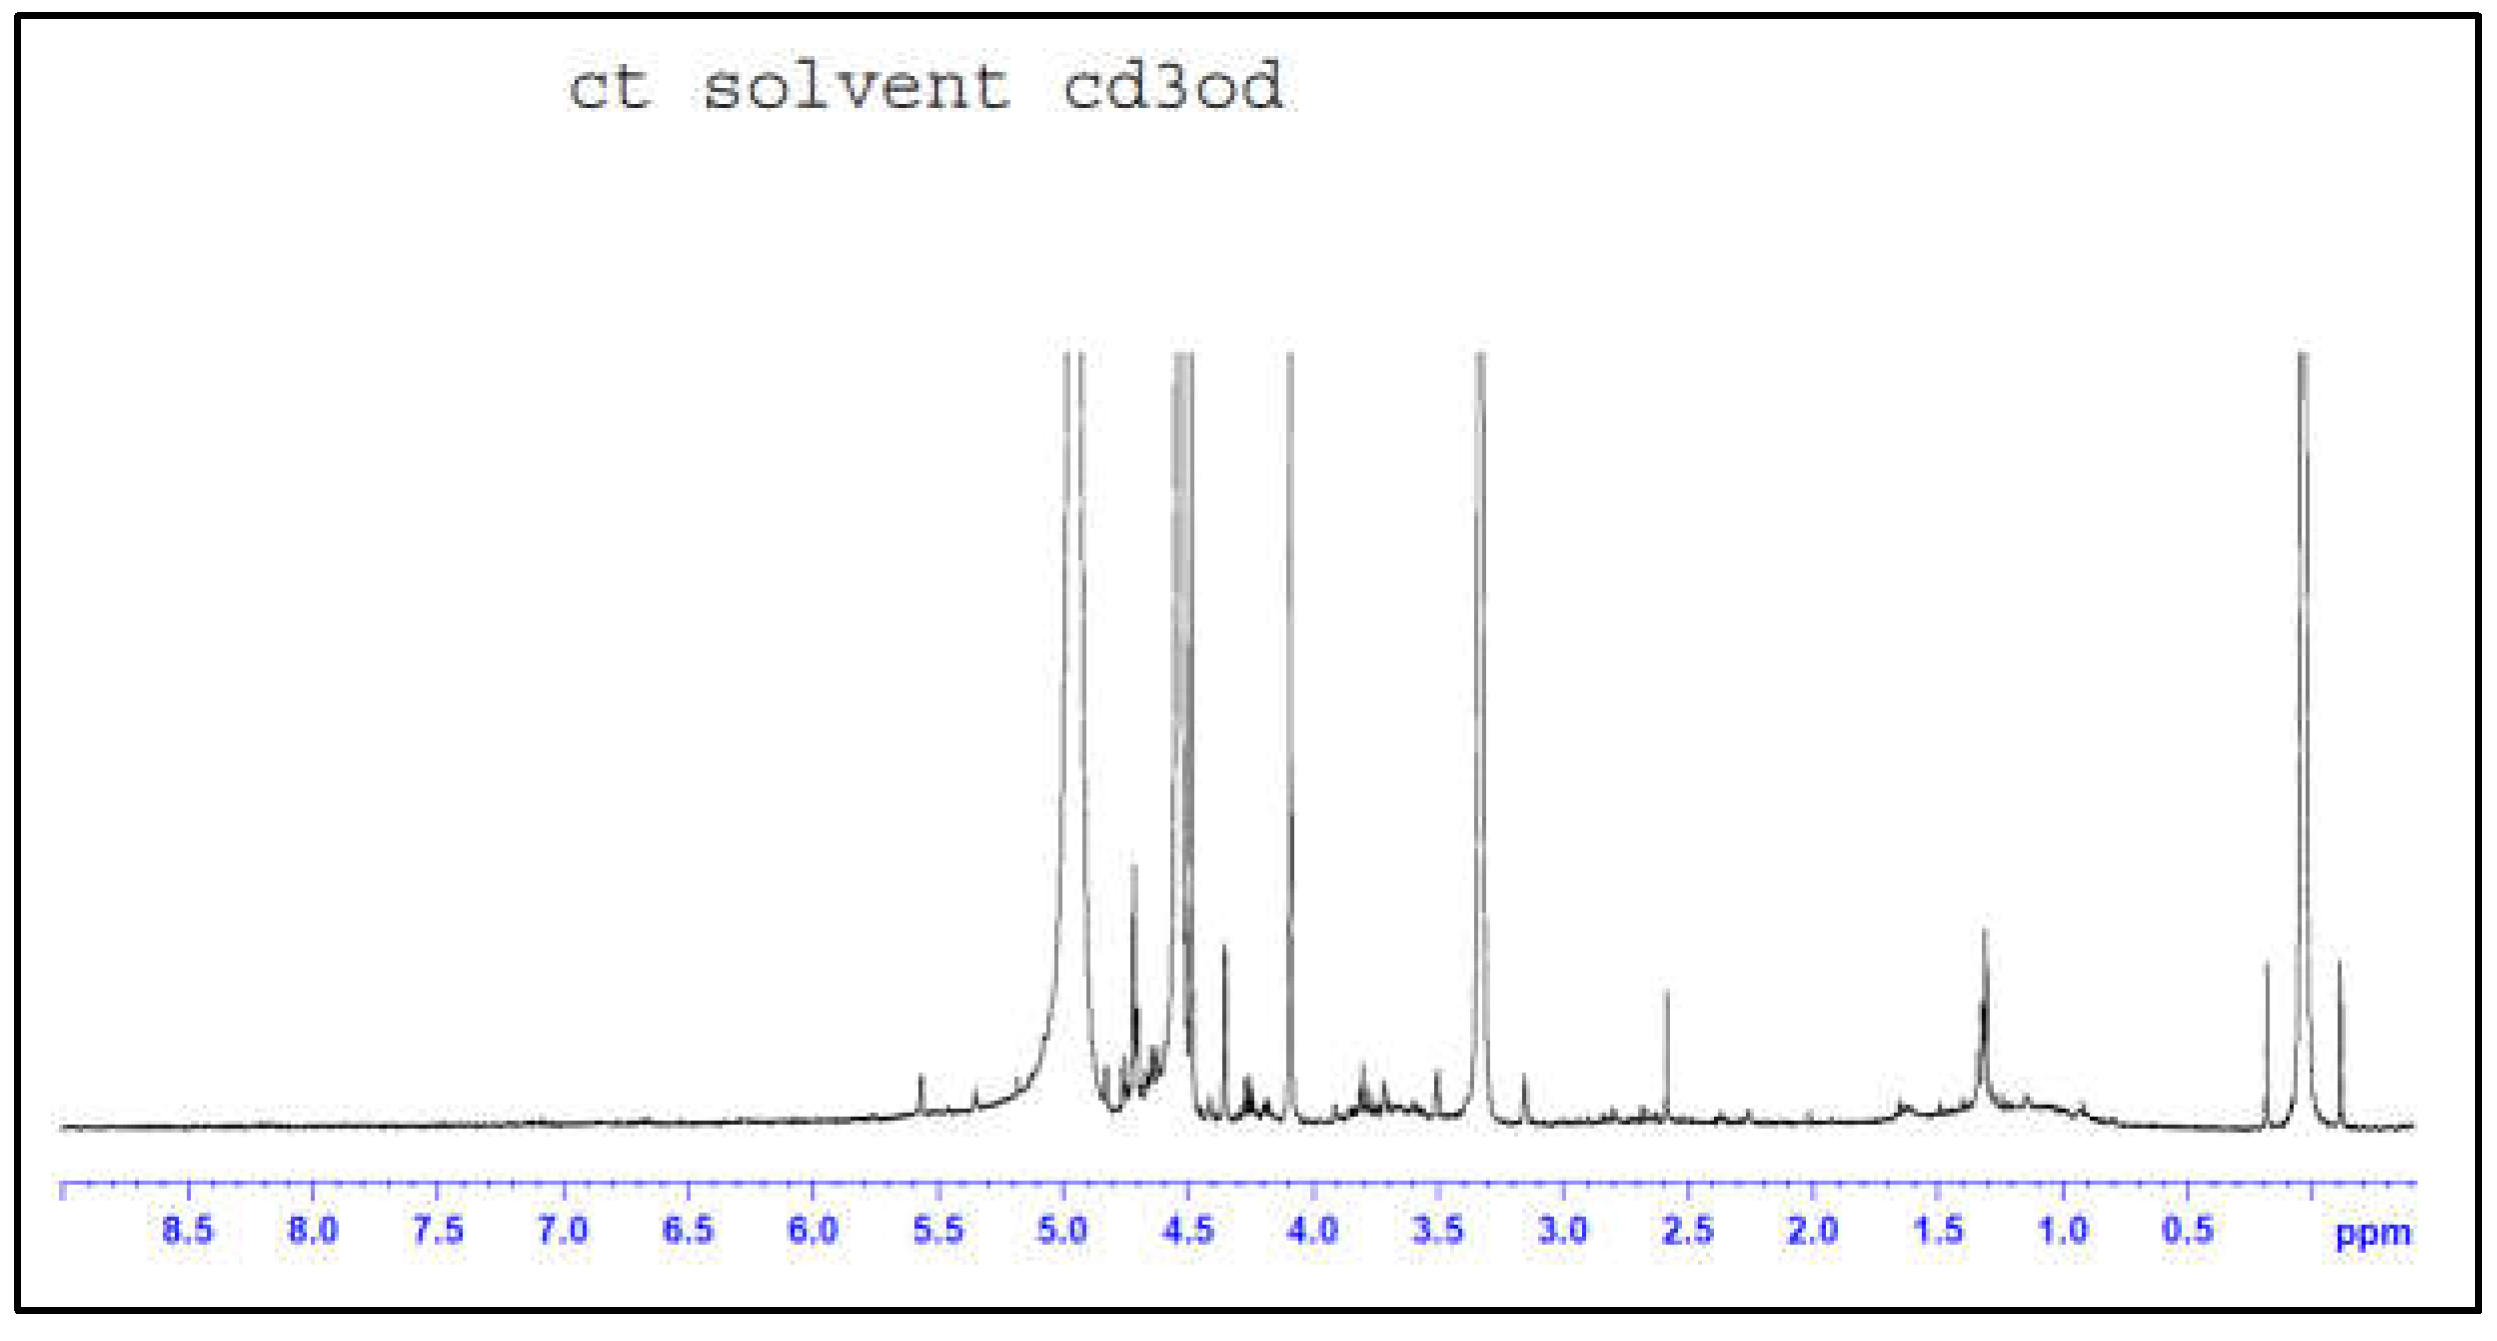
The presence of epoxy rings on CR was confirmed by H-NMR analysis reported in Figure 4, showing the typical signal at δ = 2.6 ppm. Also, the chemical shift related to methylene groups adjacent to these epoxies is evident at δ = 1.4 ppm. Finally, double bonds (C=C) are observed at δ = 5 ppm, which confirm the results from FTIR analysis, highlighting the further reactivity of CR.
Figure 4.
H-NMR spectrum of CR.
The FTIR spectra of the cured samples consisting of 10% CR and virgin resin (VIR_CR_1) is compared to the spectrum of the chemical residue (Figures S1–S3). The main differences between the two samples are observed in the 920 and 840 cm-1, range: the peaks in the CR spectra, attributed to the epoxy rings, disappear in the VIR_CR_1 spectra, indicating that CR participates in the reaction.
On the other hand, the peaks relative to N-H bending at 1600 cm-1, N-O stretching at 1500 cm-1 and C-N at 1300 cm-1 are only visible on VIR_CR_1. Relevantly, the C-N bond is formed as a consequence of epoxy ring reaction, as already discussed for Figure 3.
Finally, the spectra of VIR_GR_1 and VIR (Figures S2 and S3) are almost perfectly overlapping, indicating that, differently from CR, GR acts as an inert filler during epoxy curing.
3.3. Thermal Characterization
Initially, due to the presence of epoxy rings, the as-separated CR was used for the production of solid samples after curing with IPDA. However, DSC analysis performed on the cured CR, highlighted a very low Tg value (around 32.6 °C, as reported in Table 3), which makes the material unsuitable for its use as composite matrix. The Tg of sample DR, after curing in presence of amine, is around 82.5 °C. The difference in Tg between the two materials demonstrates that the tartaric acid present inside CR negatively affects the thermal properties of cured systems, which required mixing of the CR with the virgin resin, in order to obtain a material with higher Tg.
All cured CR/VIR samples show a decrease in the glass transition temperature in comparison to VIR. In addition, Tg decreases with increasing CR content (Table 3). However, the glass transition temperature measured for the composition with 40% of CR is still high enough (about 82°C) for its further use as a composite matrix in non-critical structures such as in automotive and aircraft interiors applications [20].
The glass transition temperatures of the samples containing GR are lower than that of the VIR sample but increase as the GR content increases.
Table 3.
Tg values found with DSC analysis.
| SAMPLES | Tg [°C] |
|---|---|
| CR | 32.6 |
| VIR | 157.2 |
| DR | 82.5 |
| VIR_CR_1 | 110.3 |
| VIR_CR_2 | 91.5 |
| VIR_CR_3 | 85.1 |
| VIR_CR_4 | 82.3 |
| VIR_GR_1 | 132.6 |
| VIR_GR_2 | 139.6 |
| VIR_GR_3 | 141.7 |
| VIR_GR_4 | 142.5 |
3.4. Mechanical Characterization
Finally, the cured samples were tested by three-point bending test. Figure 5 shows the average values of flexural strength (a) and modulus (b) versus CR and GR contents.
Also in view of the error bars associated to the measurements, two-ways analysis of variance (ANOVA) was performed, by considering type of recyclate (CR or GR) and amount of recyclate as the sources of variations. The significance of each factor was tested by calculating the F value, as the ratio of the variance between the means to the variance of the experimental error. The F value was then used in order to calculate the corresponding p value, which was then compared with the confidence level, α=0.05. According to ANOVA, p>α, corresponds to the null hypothesis (equivalence of the means), whereas p<α indicates that the population means are significantly different [7].
For the flexural strength, the results from ANOVA, summarized in Table 4a, highlight that for both Factor 1 and Factor 2 p<α, indicates that the effect of recyclate type and amount on the flexural strength is statistically significant. In particular, results reported in Figure 5 show that the flexural strength of samples containing CR is higher than that of samples containing GR, and that for both type of recyclates the flexural strength decreases with amount of recyclate. Also, the p value calculated for the interaction between factors is lower than α, indicating that the amount of recyclate has a specific effect for different recyclate types. In particular the results reported in Figure 5 indicate that the effect of the amount of recyclate is more significant for GR compared to CR.
For the flexural modulus, the results from ANOVA, summarized in Table 4b, highlight that for Factor 1, p>α, indicates that the effect of recyclate type on the flexural modulus is not statistically significant. In contrast, for Factor 2, p<α indicates that the amount of recyclate has statistically significant effect on flexural modulus. Also, the p value calculated for the interaction between factors is lower than α, indicating that the amount of recyclate has a specific effect for different recyclate types. In particular the results reported in Figure 5 coupled with ANOVA indicate that for CR, the modulus is substantially independent on amount of recyclate, whereas for GR, the modulus significantly decreases with amount of recyclate.
Figure 5.
(a-b) Trend of flexural strength and flexural modulus versus CR and GR contents, (c) Correlation between flexural strength and Tg, (d) Samples after flexural test (to the left: VIR, VIR_CR_1, VIR_CR_2, T VIR_CR_3, VIR_CR_4).
Figure 5.
(a-b) Trend of flexural strength and flexural modulus versus CR and GR contents, (c) Correlation between flexural strength and Tg, (d) Samples after flexural test (to the left: VIR, VIR_CR_1, VIR_CR_2, T VIR_CR_3, VIR_CR_4).
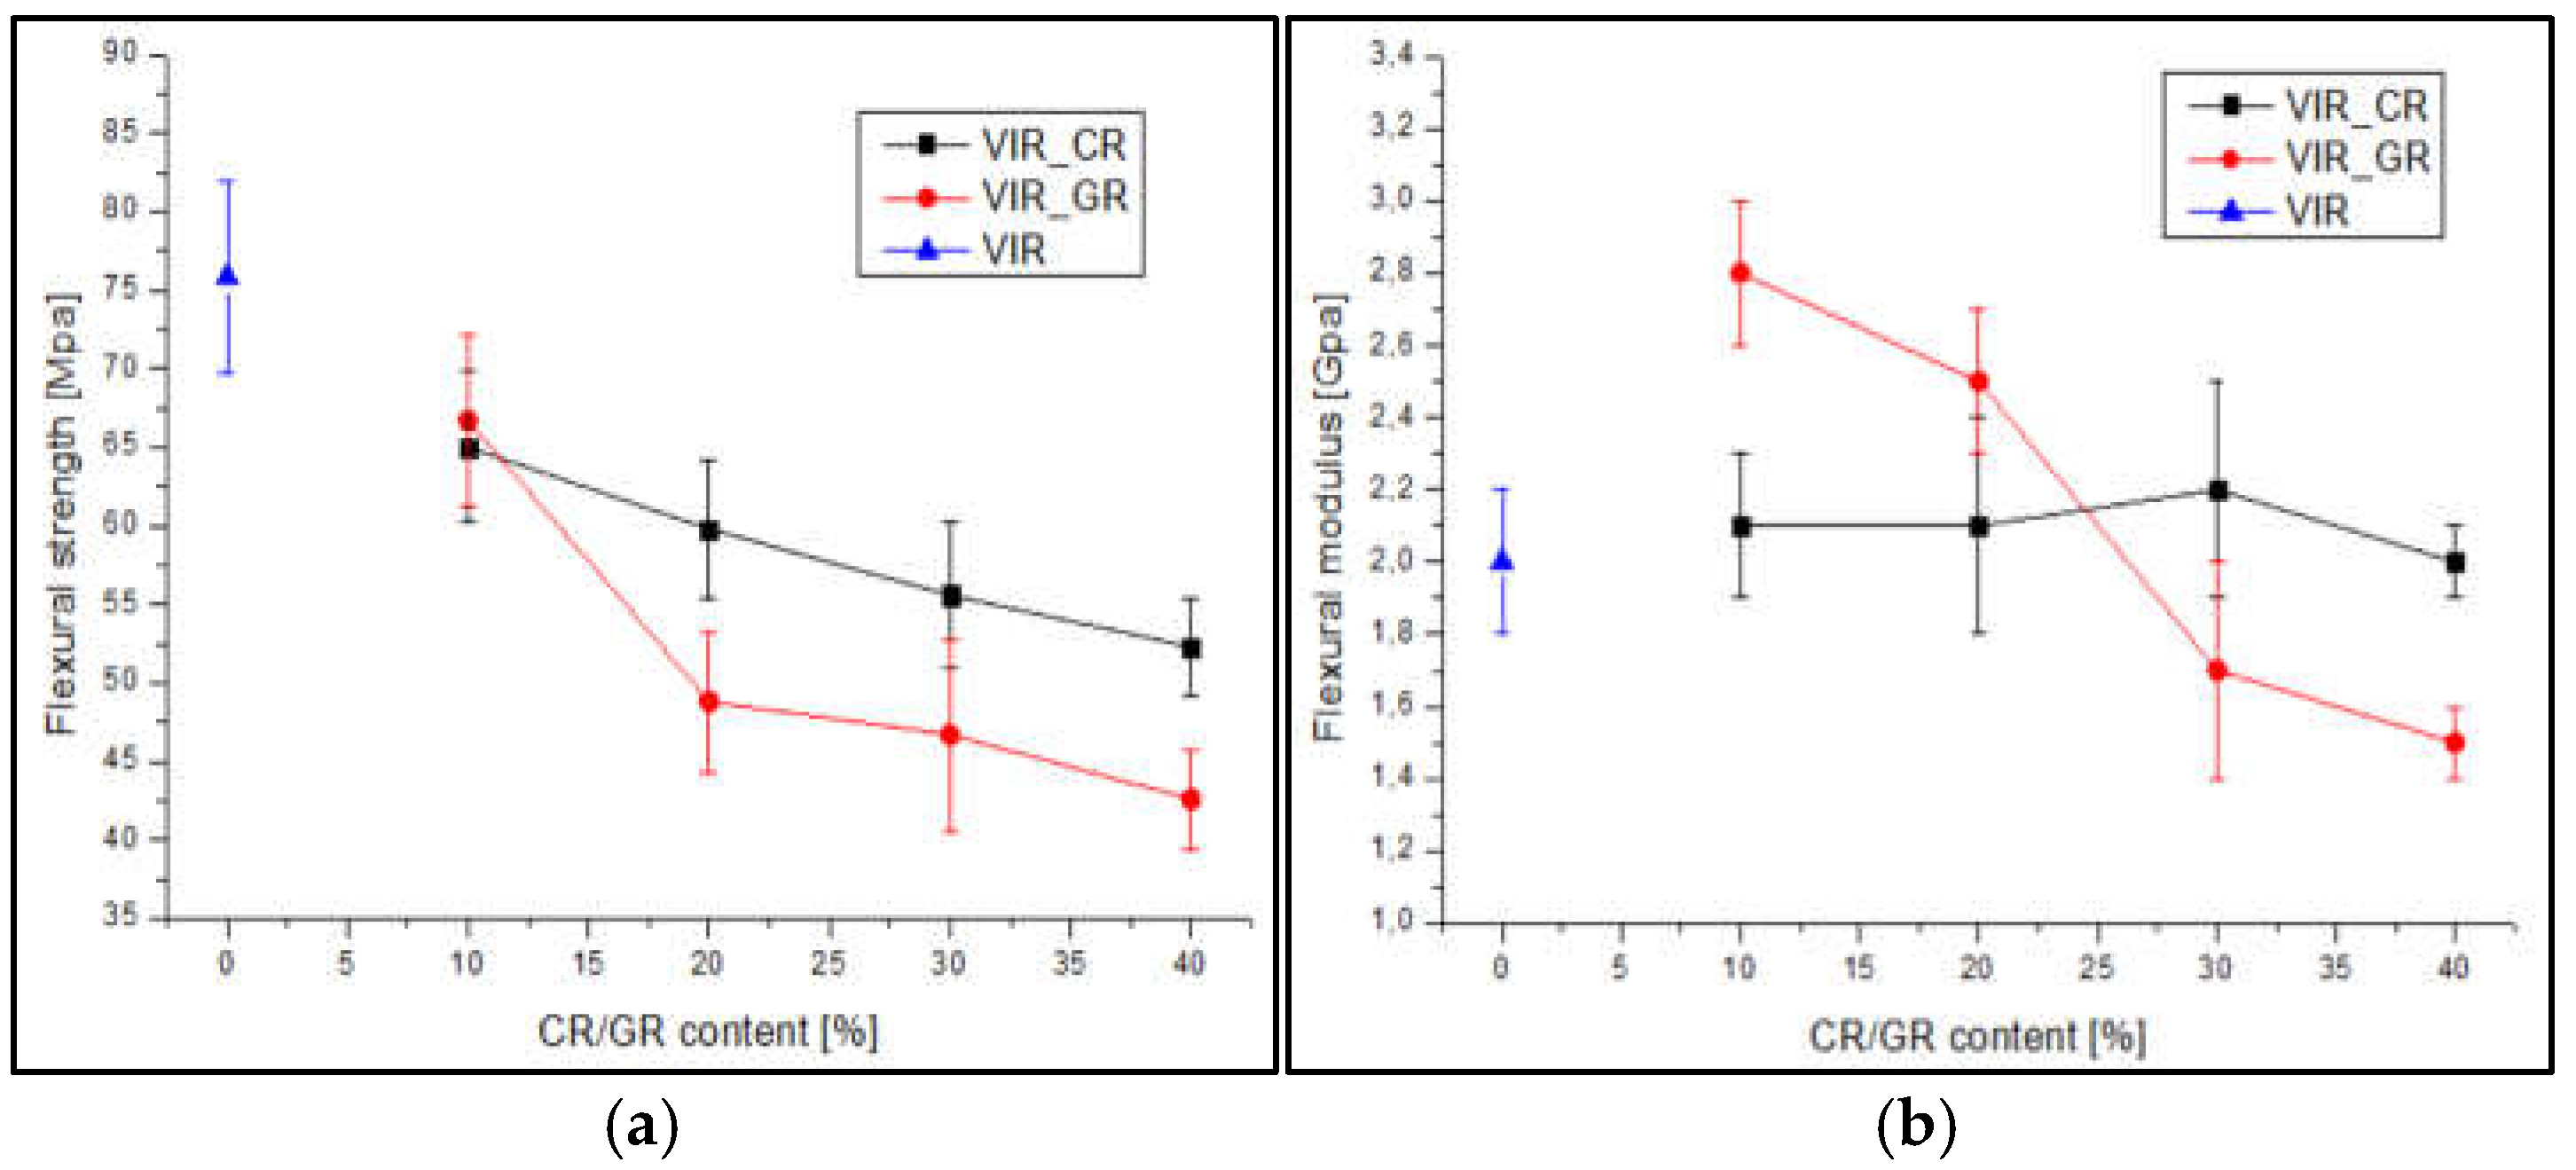
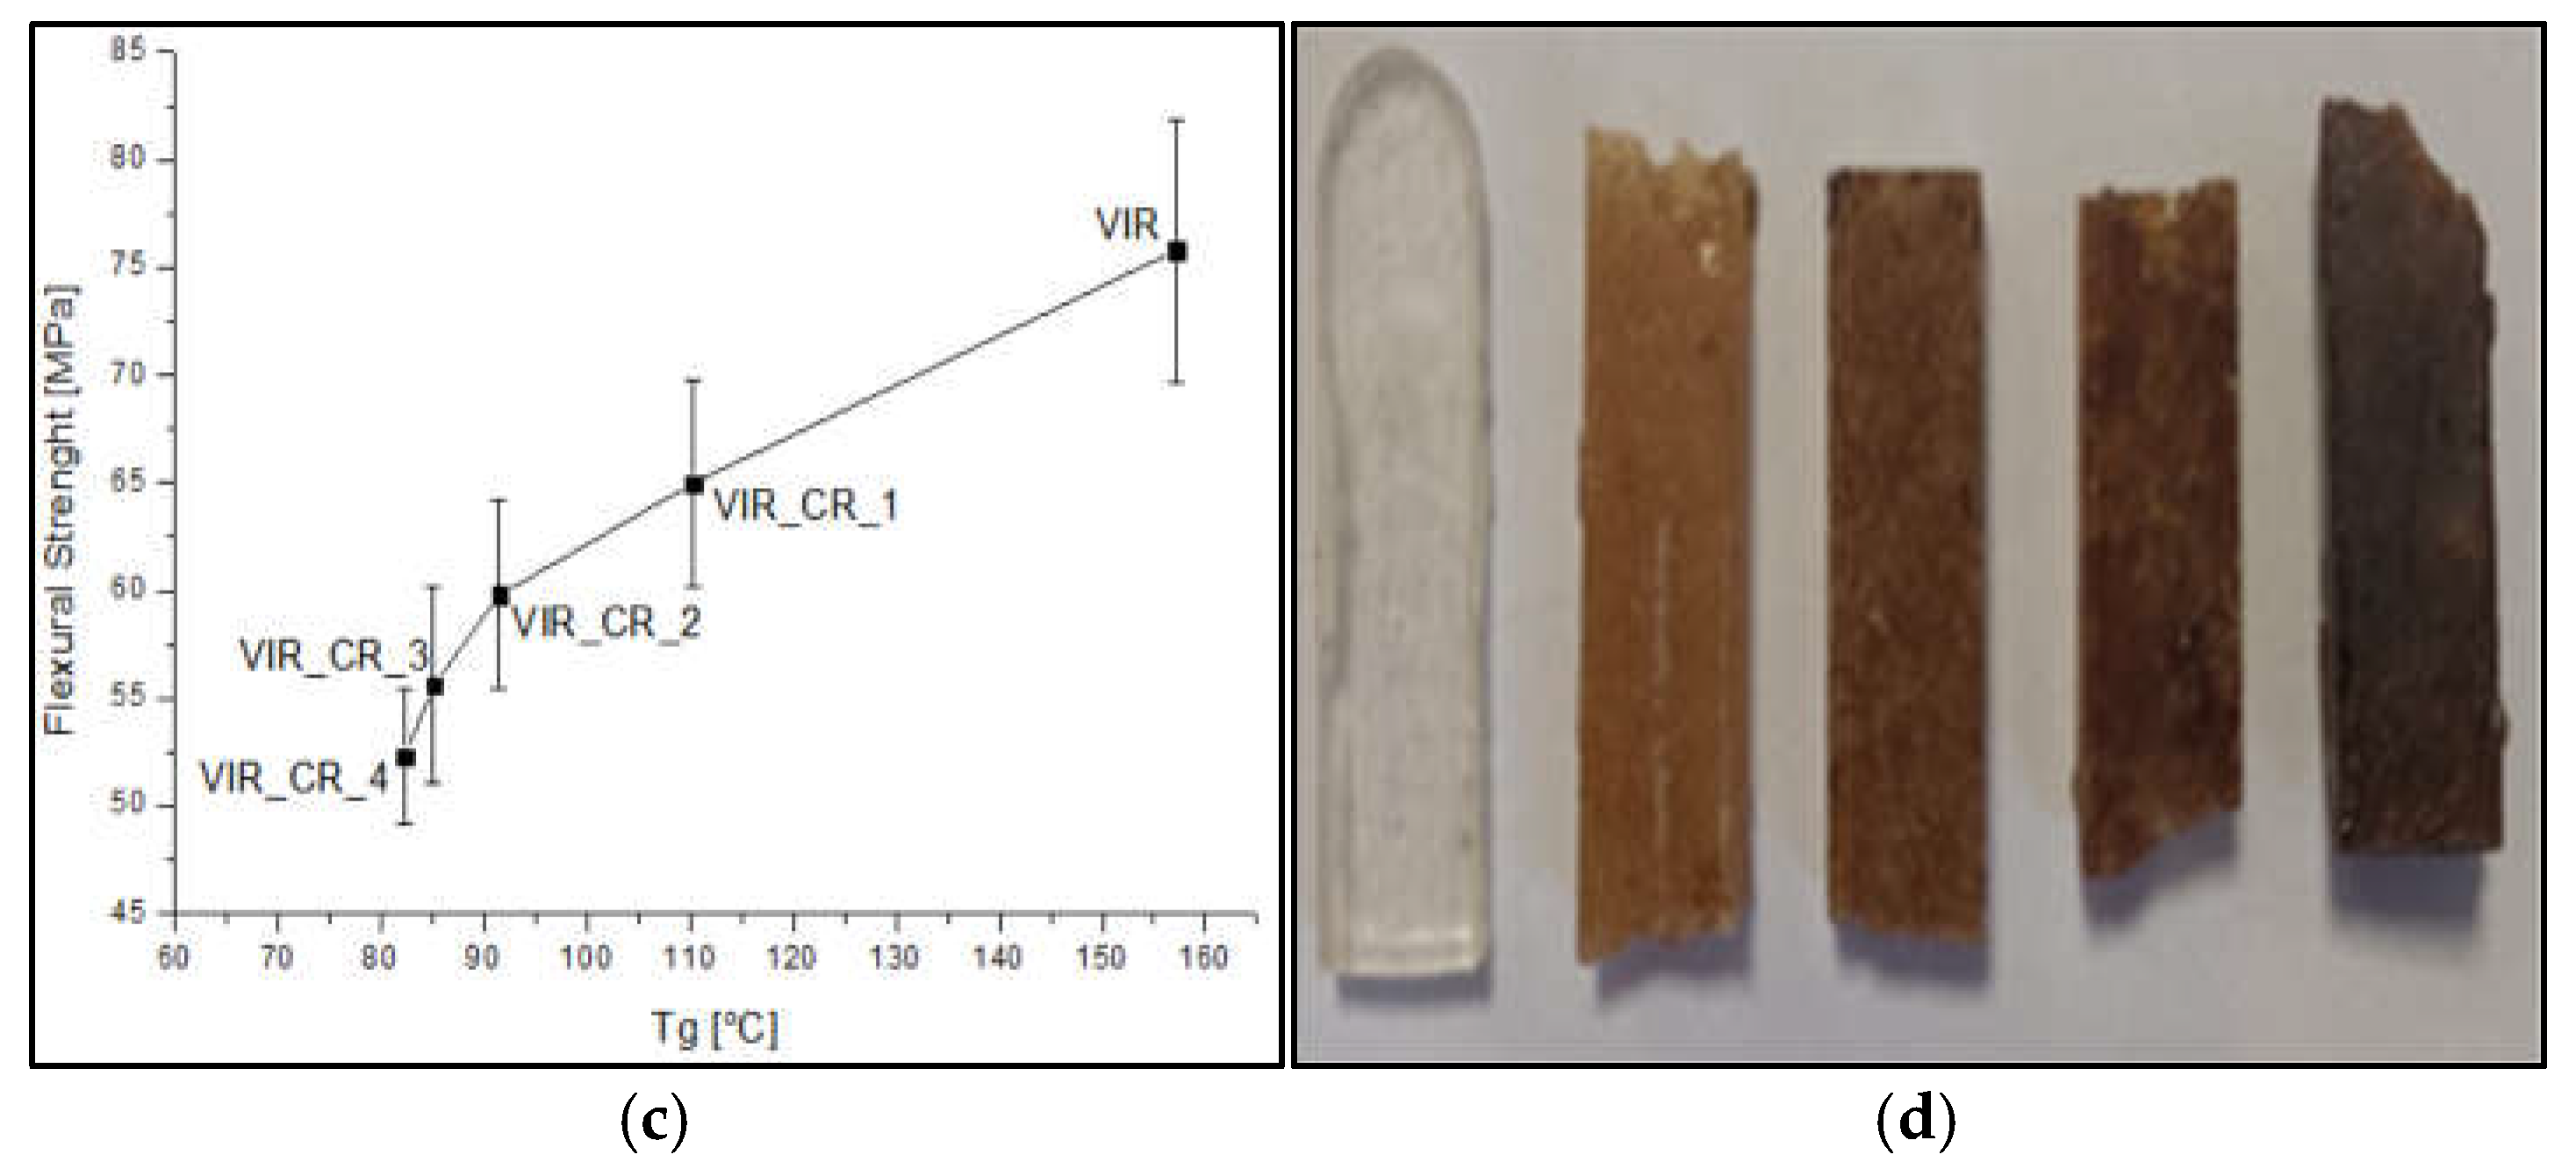
Table 4.
(a) two ways ANOVA analysis results for flexural strength, (b) two ways ANOVA analysis results for flexural modulus.
Table 4.
(a) two ways ANOVA analysis results for flexural strength, (b) two ways ANOVA analysis results for flexural modulus.
| (a) | Degrees of freedom | Mean square | P |
| Factor 1 (type of recyclate) | 1 | 389 | 2.74*10−4 |
| Factor 2 (amount of recyclate) | 4 | 1370 | 2.74*10−16 |
| Interaction | 4 | 88.4 | 1.31*10−2 |
| Error | 40 | 24.2 | |
| (b) | Degrees of freedom | Mean square | P |
| Factor 1 (type of recyclate) | 1 | 5*10−3 | 0.75 |
| Factor 2 (amount of recyclate) | 4 | 7.9*10−1 | 4.84*10−8 |
| Interaction | 4 | 7.2*10−1 | 1.57*10−7 |
| Error | 40 | 4.8*10−2 |
Very interestingly, as highlighted by Figure 5c, a strong correlation exists between the flexural strength and Tg, which is in turn strictly dependent on the degree of crosslinking of the polymer. Therefore, the embrittlement observed, due to the addition of CR, can be mainly attributed to a reduction of the degree of crosslinking as the amount of CR increases.
4. Conclusions
This work assessed an innovative method for the recovery of epoxy matrix from GF or CF composites. The method, previously developed for recovery of CF, was optimized in order to maximize the yield and minimize the recycling time and the energy consumption in view of a complete reuse of the epoxy matrix. The best recycling conditions were obtained with the use of a solution (3:1 weight ratio) of 35 wt% hydrogen peroxide (H2O2) as a green oxidiser, and tartaric acid (TA), catalysed by yeast (1.5 wt%) and activated by microwave radiation (320 W). The chemical residue of the recycling process, was characterized by FTIR and H-NMR analyses, which revealed the presence of epoxy and C=C reactive groups. As demonstrated by FTIR and DSC analyses, the CR takes part in the reaction in presence of an amine hardener. In order to achieve adequate thermal properties, the chemical residue was cured in presence of different amounts of virgin resin. Results revealed that addition of CR involved a reduction of glass transition and flexural strength, but which in any case allows a potential use for the production of glass fiber reinforced composites to be used in the automotive sector or non-structural components in plastic material. In any case, the proposed approach showed to be more efficient than conventional mechanical recycling in view of a potential use in blends with virgin resin. On the other hand, reduction of thermal and mechanical properties is attributed to a decrease of the degree of crosslinking as the CR is added to the curing reaction. Some preliminary tests also showed that an improvement of thermal properties, and therefore a potential improvement of mechanical properties, can be achieved by further separating the chemical residue from tartaric acid, to obtain the depolymerized epoxy. Next work will therefore be focused on optimization of the last separation step, which is believed to potentially lead to closed-loop recycling of epoxies in high performance applications.
Supplementary Materials
The following supporting information can be downloaded at the website of this paper posted on Preprints.org, Figure S1: FTIR of CR - VIR_CR_1; Figure S2: FTIR of VIR - VIR_GR_1; Figure S3: FTIR of CR - VIR_CR_1 - VIR - VIR_GR_1.
Author Contributions
Conceptualization, F.C. and A.G.; chemical recycling procedure, F.C., F.F. and G.A.C.; thermo-mechanical and chemical characterizations, F.C. and F.F.; data curation, F.C. and A.G.; writing—original draft preparation, F.C., F.F. and A.G.; writing—review and editing, A.G. and A.M.; supervision, A.G. and A.M. All authors have read and agreed to the published version of the manuscript.
Funding
This research received no external funding.
Data Availability Statement
Data are available on request.
Conflicts of Interest
The authors declare no conflicts of interest.
References
- Al-Lami, A. , Hilmer P., Sinapius M. Aerospace Science and Technology 79 (2018) 669–678. [CrossRef]
- Anastas, P. , Eghbali N. , Chemical Society Reviews, 2010, 39, 301–312. [Google Scholar] [CrossRef] [PubMed]
- Chen P.Y., Feng R., Xu Y., Zhu J.H. Polymers 2023, 15, 3508. [CrossRef]
- Das, M. , Chacko R., Varughese S., ACS Sustainable Chem. Eng. 2018, 6, 1564−1571. [Google Scholar] [CrossRef]
- Deng, J. , Xu L., Liu J., Peng J., Han Z., Shen Z., Guo S., Polymer Degradation and Stability 182 (2020) 109419. [CrossRef]
- Garcia J.M, Robertson M.L., Science, 2017, 358, 870–872. [CrossRef]
- Greco, A. , Ferrari F., Maffezzoli A., Journal of Cellular Plastics, Volume 56, Issue 5 (2020), 515-530.
- Huang, K. , Zheng J., Yuan W., Wang X., Song Q., Li Y., Crittenden J.C., Wang L., Wang J., Waste Management 124 (2021) 8–16. [CrossRef]
- Jin, F.L. , Li X., Park S.J., Journal of Industrial and Engineering Chemistry 29 (2015) 1–11. [CrossRef]
- Karuppannan Gopalraj, S. , Kärki T., SN Applied Sciences (2020) 2:433. [CrossRef]
- Klose L., Meyer-Heydecke N., Wongwattanarat S., Chow J., Pérez García P., Carré C., Streit W., Antranikian G., Romero A.M., Liese A. Polymers 2023, 15, 2653. [CrossRef]
- Kumar, S. , Krishnan S., Chemical Papers (2020) 74:3785–3807. [CrossRef]
- La Rosa, A.D. , Banatao D.R., Pastine S.J., Latteri A., Cicala G., Composites Part B 104 (2016) 17-25. [CrossRef]
- Long Y., Tian F., Bai L., An W., Zhao X., Du R., Liu X., Zhou X., Xu S., Wang Y.Z., Green Chemistry, 2022, 24, 7082. [CrossRef]
- Naqvi, S. R, Mysore Prabhakara H., Bramer E.A., Dierkes W., Akkerman R., Brem G., Resources, Conservation & Recycling 136 (2018) 118-129. [CrossRef]
- Navarro C.A., Kedzie E.A., Ma Y., Michael K.H., Nutt S.R., Williams T.J., Topics in Catalysis (2018) 61:704–709. [CrossRef]
- Navarro C.A., Giffin C. R., Zhang B., Yu Z., Nutt S.R., Williams T.J., Materials Horizons, 2020, 7, 2479. [CrossRef]
- Pawar, M.; et al. , Industrial Crops and Products, 2016, 89, 434–447. [CrossRef]
- Pegoretti, A. , Advanced Industrial and Engineering Polymer Research 4 (2021) 105-115. [CrossRef]
- Pimenta, S.; et al. , Waste Management 31 (2011) 378–392. [CrossRef]
- Rani, M. , Choudhary P., Krishnan V., Zafar S., Resources, Conservation & Recycling 179 (2022) 106107. [CrossRef]
- Saitta L., Rizzo G., Tosto C., Cicala G., Blanco I., Pergolizzi E., Ciobanu R., Recca G., Polymers 2023, 15, 2809. [CrossRef]
- Shen, M. , Cao H., Robertson M.L., Annu. Rev. Chem. Biomol. Eng. 2020. 11:183–201. [CrossRef]
- Silverstein R.M. et al., Spectrometric identification of organic compounds, 5th edition, John Wiley & Sons, 1991.
- Sokoli, H.U. , Simonsen M.E., Nielsen P.R., Arturi K.R., Sogaard E.G. – Fuel Processing Technology 149 (2016) 29–39. [CrossRef]
- Tavares de Moraes, V. , Jermoloviciusb L.A., Soares Tenórioc J.A., Marraccini Giampietri Lebrãoa S., Wolf Lebrão G., Materials Research 2020; 22(suppl. 1): e20190389. [CrossRef]
- Yang, K. , Wu S., Guan J., Shao Z., Ritchie R.O., Scientific Reports, 2017, 7: 11939. [CrossRef]
- Zabihi, O. , Ahmadi M., Liu C., Mahmoodi R., Li Q., Naebe M., Composites Part B 184 (2020) 107750. [CrossRef]
- Zhang J., Chevali V.S., Wang H., Wang C.H., Composites, Part B, 2020, 193, 108053–108067. [CrossRef]
- Zhao X., Wang X.L., Tian F., An W.L., Xu S., Wang Y.Z., Green Chemistry, 2019, 21, 2487. [CrossRef]
- Zhu J.H., Chen P.Y., Su M.N., Pei C., Xing F., Green Chemistry, 2019, 21, 1635. [CrossRef]
Disclaimer/Publisher’s Note: The statements, opinions and data contained in all publications are solely those of the individual author(s) and contributor(s) and not of MDPI and/or the editor(s). MDPI and/or the editor(s) disclaim responsibility for any injury to people or property resulting from any ideas, methods, instructions or products referred to in the content. |
© 2025 by the authors. Licensee MDPI, Basel, Switzerland. This article is an open access article distributed under the terms and conditions of the Creative Commons Attribution (CC BY) license (https://creativecommons.org/licenses/by/4.0/).
Copyright: This open access article is published under a Creative Commons CC BY 4.0 license, which permit the free download, distribution, and reuse, provided that the author and preprint are cited in any reuse.


