Submitted:
12 March 2025
Posted:
19 March 2025
You are already at the latest version
Abstract
This study aims to explore the impact of abusive supervision on employees' turnover intentions and the underlying mechanisms, comparing the differences between Chinese and French cultural contexts. By constructing multiple regression models, the study examines the mediating effects of work engagement and job insecurity, as well as the moderating role of emotional regulation ability. In the Chinese cultural context, abusive supervision significantly reduces employees' turnover intentions, with work engagement playing a mediating role. Emotional regulation ability weakens the indirect effect of abusive supervision on turnover intentions via job insecurity. The competitive nature of Chinese workplaces and the acceptance of strict management make abusive supervision tolerable under certain conditions. In the French cultural context, abusive supervision is positively correlated with turnover intentions, though the effect is weaker. Job insecurity acts as a mediator, while emotional regulation ability mitigates its negative impact. France's comprehensive labor protection system and employees' emotional regulation ability reduce the negative effects of abusive supervision. In conclusion, this study not only validates the mechanisms through which abusive supervision influences turnover intentions across different cultural contexts but also highlights the crucial roles of work engagement, job insecurity, and emotional regulation ability in this process. The findings provide practical recommendations for managers and policymakers, emphasizing the need to optimize leadership styles based on cultural contexts, enhance employees' emotional regulation abilities, and alleviate job insecurity to reduce turnover intentions.
Keywords:
abusive leadership
; turnover intention
; job insecurity
; emotional regulation capacity
; moderated mediation model
1. Research Overview
1.1. Research Background and Significance
In the highly competitive market environment, employee turnover has become a significant challenge for enterprises. The employee turnover rate in large cities has been rising, and voluntary turnover is becoming increasingly common. Employee turnover not only increases labor costs for companies but also damages brand image, leads to knowledge loss, and affects market competitiveness[1]. For example, new employees may experience a learning curve, leading to lower work efficiency during the adjustment period, and the departure of key employees may delay important projects. Therefore, exploring the factors influencing employees' turnover intentions is critical for businesses. However, research on the differential impact of abusive leadership on turnover intentions across different cultural contexts is relatively scarce. Given the cultural differences between China and France, abusive leadership may have different effects in these two cultures.
In the Chinese context, the intense market competition and the phenomenon of workplace internal competition may cause employees to have a more tolerant attitude toward abusive leadership behavior. Some employees may even interpret strict leadership as a form of strict management or high expectations, viewing it as motivation and thus reducing their turnover intentions[2,3]. In contrast, in cultures like France, which emphasize equality, respect, and individualism, abusive leadership may more easily provoke employees' resistance and dissatisfaction, thereby increasing their turnover intentions[4].
This study focuses on the impact of abusive leadership on employees' turnover intentions and explores the differences in this relationship across different cultural contexts. This has important practical significance. By analyzing the relationship between abusive leadership and turnover intentions, it can provide targeted strategic recommendations for business management and reveal how cultural factors moderate this impact.
1.2. Research Objectives and Hypotheses
This study aims to explore the impact of abusive leadership on employees' turnover intentions, deeply analyze the mediating and moderating mechanisms, and reveal the role of cultural differences in this process.
The main research questions are:
What is the relationship between abusive leadership and turnover intention?
What is the mediating role of job insecurity between abusive leadership and turnover intention?
How does emotional regulation ability moderate the relationship between abusive leadership and job insecurity, and mediate the impact of abusive leadership on turnover intention through job insecurity?
Does cultural difference influence the relationship between abusive leadership and turnover intention?
Based on the research content, the following hypotheses are proposed:
H1: The relationship between abusive leadership and turnover intention
Abusive leadership has a significant positive effect on employees' turnover intentions. In today's competitive workplace environment, the appropriateness of leadership behavior directly influences employees' work attitudes and retention decisions. Abusive leadership manifests as sustained non-physical, aggressive behaviors such as mocking, scolding, and other forms of mistreatment that make employees feel disrespected and unrecognized. For instance, in some studies, such as "The Impact of Abusive Management on Subordinate Work Performance and Turnover Intention," abusive management has been shown to lead to lower work performance, decreased job satisfaction, and increased turnover intentions. The more severe the leadership behavior, the higher the employee turnover intention[2]. When employees are subjected to abusive leadership, they may develop dissatisfaction with the work environment, feel uncertain about their career development, and therefore increase their likelihood of leaving the job.
H2: The mediating role of job insecurity
Job insecurity plays an important mediating role between abusive leadership and turnover intention. Abusive leadership often triggers employees' concerns about job stability, thus increasing job insecurity. When employees face abusive leadership, they may worry about the stability of their job and the impact on their future career development. This uncertainty creates anxiety and discomfort, increasing their turnover intentions[5]. Relevant studies, such as "The Impact of Job Insecurity on Turnover Intentions: The Moderating Role of Coping Strategies," indicate that perceived job insecurity is positively correlated with turnover intentions. For instance, in situations like company restructuring or technological changes, abusive leadership may make employees more concerned about their job security, further driving their turnover intentions.
H3: The moderating role of emotional regulation ability
H3a: Emotional regulation ability moderates the relationship between abusive leadership and job insecurity. When employees have low emotional regulation ability, they may struggle to manage negative emotions effectively in the face of abusive leadership, thus exacerbating job insecurity.
H3b: Emotional regulation ability moderates the mediating effect of job insecurity on the relationship between abusive leadership and turnover intention. When emotional regulation ability is weak, employees may not be able to effectively alleviate the psychological stress caused by job insecurity and cope with the negative emotional impact of abusive leadership, making the mediating effect of job insecurity more prominent.
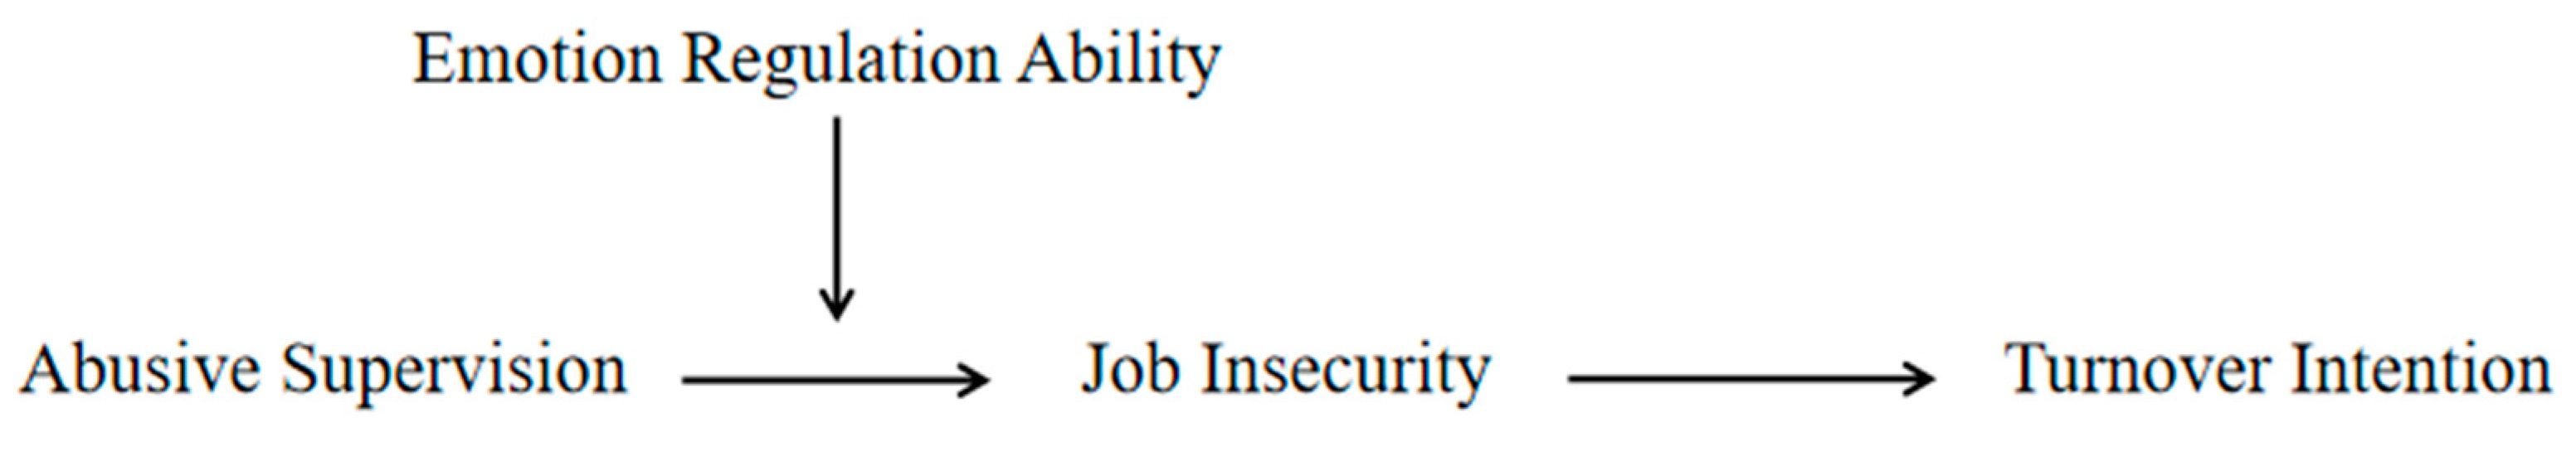
Figure 1.
Research Structure of the Model.
2. Literature Review
2.1. Definition and Measurement of Abusive Leadership
Abusive leadership refers to subordinates' perception of their leader's sustained non-physical, violent, and hostile behaviors, with sensitivity to these behaviors varying across different cultural contexts[6]. This leadership style manifests in various forms, such as mocking, public criticism, shouting, rudeness, indifference to subordinates, coercion, and the use of demeaning language. The "Bao Li" incident at Peking University raised awareness of psychological abuse (PUA) and control in gender relations, and similar abusive management behaviors are also prevalent in workplaces. In Chinese workplaces, superiors often control various resources and destinies of subordinates, possessing greater authority, which provides a fertile ground for abusive management. Many employees feel unhappy at work and believe they are undervalued, possibly suffering from abusive leadership. Abusive behaviors can be more covert than we imagine. Actions like leaders appropriating employees' achievements, suppressing or belittling employees, forcing them to take the blame, or ignoring them are all subtle forms of abuse. Experiencing abusive leadership can severely damage employees' self-esteem and sense of personal worth, potentially leading to severe outcomes such as suicide.
The measurement of abusive leadership often follows Tepper’s method, which uses subordinates' rating of the degree of abusive behavior to construct scales, but there are measurement validity issues that need improvement in the future. Currently, abusive leadership is measured through questionnaires, with subordinates' subjective reports reflecting the leader's abusive behavior. Tepper and others referenced tools measuring non-physical abuse and literature on non-physical abuse to develop a 15-item Likert 5-point scale for measuring abusive management. Studies show that this scale has high reliability and validity. Mitchell and Ambrose reanalyzed the two datasets used by Tepper to develop this scale, reducing the 15 items to five, and their new scale also showed good reliability and validity. However, issues remain in the measurement of abusive management, such as the need for further improvement in measurement validity[7,8]. Future research could incorporate more objective indicators to improve accuracy and validity. Additionally, the definition and measurement of abusive leadership may vary across different cultural contexts, requiring further cross-cultural research to better understand the nature and impact of abusive leadership[9].
2.2. Theoretical Foundation and Influencing Factors of Turnover Intention
Turnover intention refers to the employees' willingness to leave their current position, directly affecting an organization's employee turnover rate. The theoretical foundation of this concept mainly comes from employees' job satisfaction, organizational commitment, and work engagement. Turnover intention is a form of retreat after experiencing dissatisfaction and is the final step before actual turnover. Therefore, turnover intention is closely related to employees' job satisfaction, organizational commitment, and work engagement, making it an important predictor of turnover behavior.
2.3. Theoretical and Empirical Research on Job Insecurity
Job insecurity refers to the perception and concern of employees when their job or key job characteristics are under threat. Since the 1980s, job insecurity has become an important construct in the fields of organizational behavior and occupational mental health research. The theoretical foundation of job insecurity involves resource conservation and psychological contract theories. Resource conservation theory suggests that job insecurity arises when employees perceive a loss or hindrance in obtaining resources they value. Psychological contract theory emphasizes that employees feel insecure when their expectations are unmet[10].
Job insecurity arises from employees' perception of their job being under threat. With changes in the economic situation, fluctuations in the labor market, technological advancements, and organizational changes, employees may feel the instability of their job, thus creating job insecurity. This insecurity has a positive impact on turnover intention[11]. Empirical research shows that job insecurity is related to employees' attitudes and behaviors, such as negatively correlating with job satisfaction and organizational commitment, and positively correlating with turnover intention and health issues[12].
In terms of measurement tools, various scales have been developed to assess job insecurity, such as the job insecurity scale by De Cuyper and De Witte, which evaluates employees' concerns about job stability and job characteristics from a psychological contract perspective. Future research should standardize measurement tools, consider changes in organizational contexts, strengthen the study of moderating variables, and conduct longitudinal and cross-cultural research. Additionally, studies should focus on organizational context changes and conduct more detailed research on job insecurity in different situations. Further research on moderating variables, such as individual differences and organizational support, is also necessary, as these factors may influence the relationship between job insecurity and employees' attitudes and behaviors. Longitudinal and cross-cultural comparative studies are important future directions to uncover the trends and cultural differences in job insecurity over time[13].
2.4. The Impact of Emotional Regulation Ability on Turnover Intention
Emotional regulation ability refers to an individual’s ability to perceive, understand, and regulate their own and others' emotions, a critical capability for psychological health and social functioning[14]. Emotional regulation ability encompasses multiple dimensions, such as the recognition, evaluation, expression, and management of emotions, helping individuals better adapt to changes in both internal and external environments[15]. In the workplace, emotional regulation ability is considered a key psychological resource for coping with work pressure, managing negative emotions, and maintaining work performance[16]. In workplace contexts, emotional regulation ability has been widely studied and shown to have a close relationship with individuals' mental health, job burnout, job satisfaction, and performance[16]. Employees with strong emotional regulation abilities are better able to alleviate stress, manage complex social relationships, and remain calm and rational when facing negative emotions[17]. Especially in high-pressure and high-demand work environments, emotional regulation ability is considered an important adaptive resource that helps reduce the negative impact of work stress on mental health[18].
Studies have shown that emotional regulation ability not only directly affects individuals' psychological states in the workplace but also moderates their response to the work environment[14,15]. In the context of abusive leadership, the level of emotional regulation ability determines the intensity and persistence of employees’ emotional reactions to negative leadership behaviors. Specifically, employees with lower emotional regulation abilities may find it more challenging to alleviate the negative emotions caused by abusive leadership, leading to stronger job insecurity and turnover intention[19].
Additionally, emotional regulation ability also plays a moderating role in the mediation mechanism (moderated mediation effect). When employees' emotional regulation ability is low, they struggle to use positive emotional regulation strategies to alleviate the psychological pressure caused by job insecurity, which strengthens the negative transmission effect of abusive leadership on job insecurity[20,21]. In contrast, employees with stronger emotional regulation ability can more effectively control their emotions, reduce the impact of job insecurity, and weaken the indirect effect of abusive leadership on turnover intention.
2.5. Relevant Theories of Moderated Mediation Models
The theoretical foundation of job insecurity involves both resource conservation and psychological contract theories. Resource conservation theory states that individuals strive to acquire, maintain, and protect resources they consider valuable. When employees perceive a threat of losing their job or valuable job characteristics, job insecurity arises. Psychological contract theory suggests that when reciprocity and fairness in social exchange are violated, it leads to tension in the relationship between employees and organizations, ultimately resulting in job insecurity.
The moderated mediation model integrates both mediating and moderating effects and plays an important role in organizational behavior research. It helps to understand complex relationships between variables and provides valuable insights into organizational management strategies[22]. For example, in the study of the impact of unethical behaviors by colleagues on employees' turnover intentions, the model reveals how behaviors influence turnover intentions through psychological states and the role of moderating variables[23,24].
3. Data Computation and Analysis
3.1. Data Collection
This study plans to select 300 employees from companies in different industries and regions to ensure sample diversity and representativeness. The questionnaire design will be based on the research objectives and hypotheses, ensuring the relevance and validity of the questions. Data collection will be conducted in two phases, with an interval of approximately 4 weeks between them. During the data collection process, close cooperation with the human resources departments of the companies will be necessary to obtain employee lists and assign identification numbers for the survey, with questionnaires being distributed according to these numbers. To ensure confidentiality, the questionnaires will be anonymous and identified only by coding. Professional researchers, with the assistance of the human resources departments, will complete the survey distribution and collection on-site, while assuring respondents that the survey results will only be used for scientific research and kept strictly confidential.
To reduce common method bias, questions related to abusive leadership behavior will be measured in the first phase of the survey, while demographic variables (such as gender, age, years of service, and education level) will also be collected in this phase. Job insecurity, emotional regulation ability, and turnover intention will be measured in the second phase. Afterward, the collected questionnaires will be matched and processed, invalid samples will be excluded, and valid samples will be retained for subsequent analysis.
In this study, the following data analysis steps and methods will be used to explore the impact of abusive leadership on employees' turnover intentions, as well as the mediating role of job insecurity and the moderating role of emotional regulation ability.
3.2. Chinese Data Analysis
3.2.1. Descriptive Statistical Analysis Results
The descriptive statistical analysis of the 300 questionnaire responses in this study aimed to explore the basic statistical characteristics of abusive leadership, job insecurity, emotional regulation ability, and turnover intention. The results are summarized as follows:

Table 1.
Variable Statistical Information Table.
| Variable | Mean | Min | Max | Standard Deviation |
|---|---|---|---|---|
| Abusive Leadership | 3.2 | 1.0 | 5.0 | 0.8 |
| Turnover Intention | 2.9 | 1.0 | 5.0 | 0.9 |
| Job Insecurity | 3.5 | 1.0 | 5.0 | 0.6 |
| Emotional Regulation Ability | 3.8 | 1.0 | 5.0 | 0.7 |
Abusive Leadership: The mean value is 3.2, indicating that employees generally perceive a moderate level of abusive leadership behavior. The standard deviation is 0.8, showing that there is variability in how employees perceive abusive leadership.
Job Insecurity: The mean value is 3.5, indicating that employees generally feel a certain degree of job instability. The standard deviation is 0.9, which indicates significant variability in employees' perceptions of job insecurity.
Emotional Regulation Ability: The mean value is 3.8, indicating that employees generally have a high level of confidence in their emotional regulation abilities. The standard deviation is 0.7, which shows that while there are differences, overall emotional regulation ability is relatively high, providing a solid foundation for analyzing its moderating role in job insecurity and turnover intention.
Turnover Intention: The mean value is 2.9, indicating that employees have a moderate level of turnover intention. The standard deviation is 0.7, indicating that turnover intention is influenced by various factors and exhibits individual differences.
Further analysis showed that the minimum and maximum values for all variables fall within the expected range of the scale, suggesting that the data does not contain outliers. Additionally, the skewness and kurtosis values for all variables are close to zero, indicating that the data is normally distributed and suitable for subsequent inferential statistical analysis.
3.2.2. Correlation Analysis Results
After conducting correlation analysis on the 300 questionnaire responses, the following results were obtained:
Table 2.
Variable Correlation Analysis Table.
| Variable | Turnover Intention | Job Insecurity | Emotional Regulation Ability |
|---|---|---|---|
| Abusive Leadership | -0.35*** | 0.42*** | -0.15* |
| Turnover Intention | 1.00 | -0.45*** | -0.48*** |
| Job Insecurity | - | 1.00 | -0.38*** |
| Emotional Regulation Ability | - | - | 1.00 |
Note: "**" indicates a significance level of p < 0.01.
Abusive Leadership and Turnover Intention: The Pearson correlation coefficient is -0.35 (p < 0.01), indicating a significant negative correlation between abusive leadership and turnover intention. This result contradicts the original hypothesis H1, reflecting a unique phenomenon in the Chinese cultural context.
Job Insecurity and Turnover Intention: The Pearson correlation coefficient is -0.45 (p < 0.01), showing a significant negative correlation between job insecurity and turnover intention.
Emotional Regulation Ability and Turnover Intention: The Pearson correlation coefficient is -0.48 (p < 0.01), indicating a significant negative correlation between emotional regulation ability and turnover intention, supporting its moderating role in the research model.
Abusive Leadership and Job Insecurity: The Pearson correlation coefficient is 0.42 (p < 0.01), indicating a significant positive correlation between the two.
Emotional Regulation Ability and Job Insecurity: The Pearson correlation coefficient is -0.38 (p < 0.01), indicating a significant negative correlation, which is consistent with the moderation effect analysis result (β = -0.36, p < 0.05).
The correlation analysis provides a foundation for the subsequent regression analysis and mediating/moderating effect analysis. Overall, abusive leadership reduces turnover intention by increasing job insecurity, while emotional regulation ability may play a buffering role.
3.2.3. Regression Analysis Results
H1: To test the impact of abusive leadership on turnover intention, the following simple linear regression model was constructed:
Y = β0 + β1X1 + ϵ
Where Y represents turnover intention, X1 represents abusive leadership, and ϵ represents the error term. The regression analysis results show that abusive leadership significantly negatively affects turnover intention (β = -0.35, p < 0.01), indicating that, in the Chinese cultural context, abusive leadership has a significant negative impact on employees' turnover intention, contrary to Hypothesis H1. This result reflects a unique phenomenon in Chinese workplace culture, where strict management is often viewed as a sign of care and expectation in a highly competitive employment environment.
H2: To test the mediating effect of job insecurity between abusive leadership and turnover intention, the study used a multiple regression model:
Y = β0 + β1X1 + β2X2 + ϵ
Where Y represents turnover intention, X1 represents abusive leadership, X2 represents job insecurity, and ϵ represents the error term. The regression analysis results show that abusive leadership significantly positively affects job insecurity (β1 = 0.42, p < 0.01), which is consistent with theoretical expectations. However, the negative effect of job insecurity on turnover intention (β2 = -0.45, p < 0.01) does not align with the original hypothesis. This suggests that, when job insecurity is present, employees may be more inclined to work harder to retain their current position.
H3a: To test the moderating effect of emotional regulation ability between abusive leadership and job insecurity, the following regression model was constructed:
X2 = β0 + β1X1 + β2X3 + β3(X1 × X3) + ϵ
Where X2 represents job insecurity, X1 represents abusive leadership, X3 represents emotional regulation ability, and X1 × X3 represents the interaction term between abusive leadership and emotional regulation ability. The regression analysis results show that abusive leadership positively influences job insecurity (β1 = 0.42, p < 0.01), while emotional regulation ability negatively influences job insecurity (β2 = -0.36, p < 0.05). The interaction term between abusive leadership and emotional regulation ability is also significant (β3 = -0.15, p < 0.05). This indicates that emotional regulation ability moderates the relationship between abusive leadership and job insecurity, weakening the negative effect of abusive leadership on job insecurity when emotional regulation ability is higher, supporting Hypothesis H3a.
H3b: To test the moderating effect of emotional regulation ability in the mediating role of job insecurity between abusive leadership and turnover intention, the following regression model was constructed:
Y = β0 + β1X1 + β2X2 + β3X3 + β4(X1 × X2) + β5(X1 × X3) + β6(X2 × X3) + ϵ
Where Y represents turnover intention, X1 represents abusive leadership, X2 represents job insecurity, X3 represents emotional regulation ability, and the interaction terms X1 × X2, X1 × X3, and X2 × X3 represent the interaction effects between the variables. Bootstrapping with 5000 repeated samples was used to test whether the mediating effect was moderated by emotional regulation ability. The indirect effect and the 95% confidence intervals (CI) were calculated. If the confidence interval does not contain 0, the moderated mediation effect is significant.
The indirect effect under high emotional regulation ability significantly decreased, with the Bootstrap confidence interval being [0.10, 0.28]. The indirect effect under low emotional regulation ability significantly increased, with the Bootstrap confidence interval being [0.35, 0.52]. Comparing the indirect effects at two levels of emotional regulation ability, the difference was significant, supporting the hypothesis of moderated mediation.
Specifically, when employees have higher emotional regulation ability, the effect of abusive leadership on turnover intention through job insecurity is more pronounced. This reflects a special phenomenon in Chinese workplace culture: employees with higher emotional regulation ability tend to interpret and accept strict management styles rationally, viewing them as expressions of nurturing and expectation. As a result, they exhibit lower turnover intentions when faced with abusive leadership.
Figure 2.
Regression Analysis Graph.
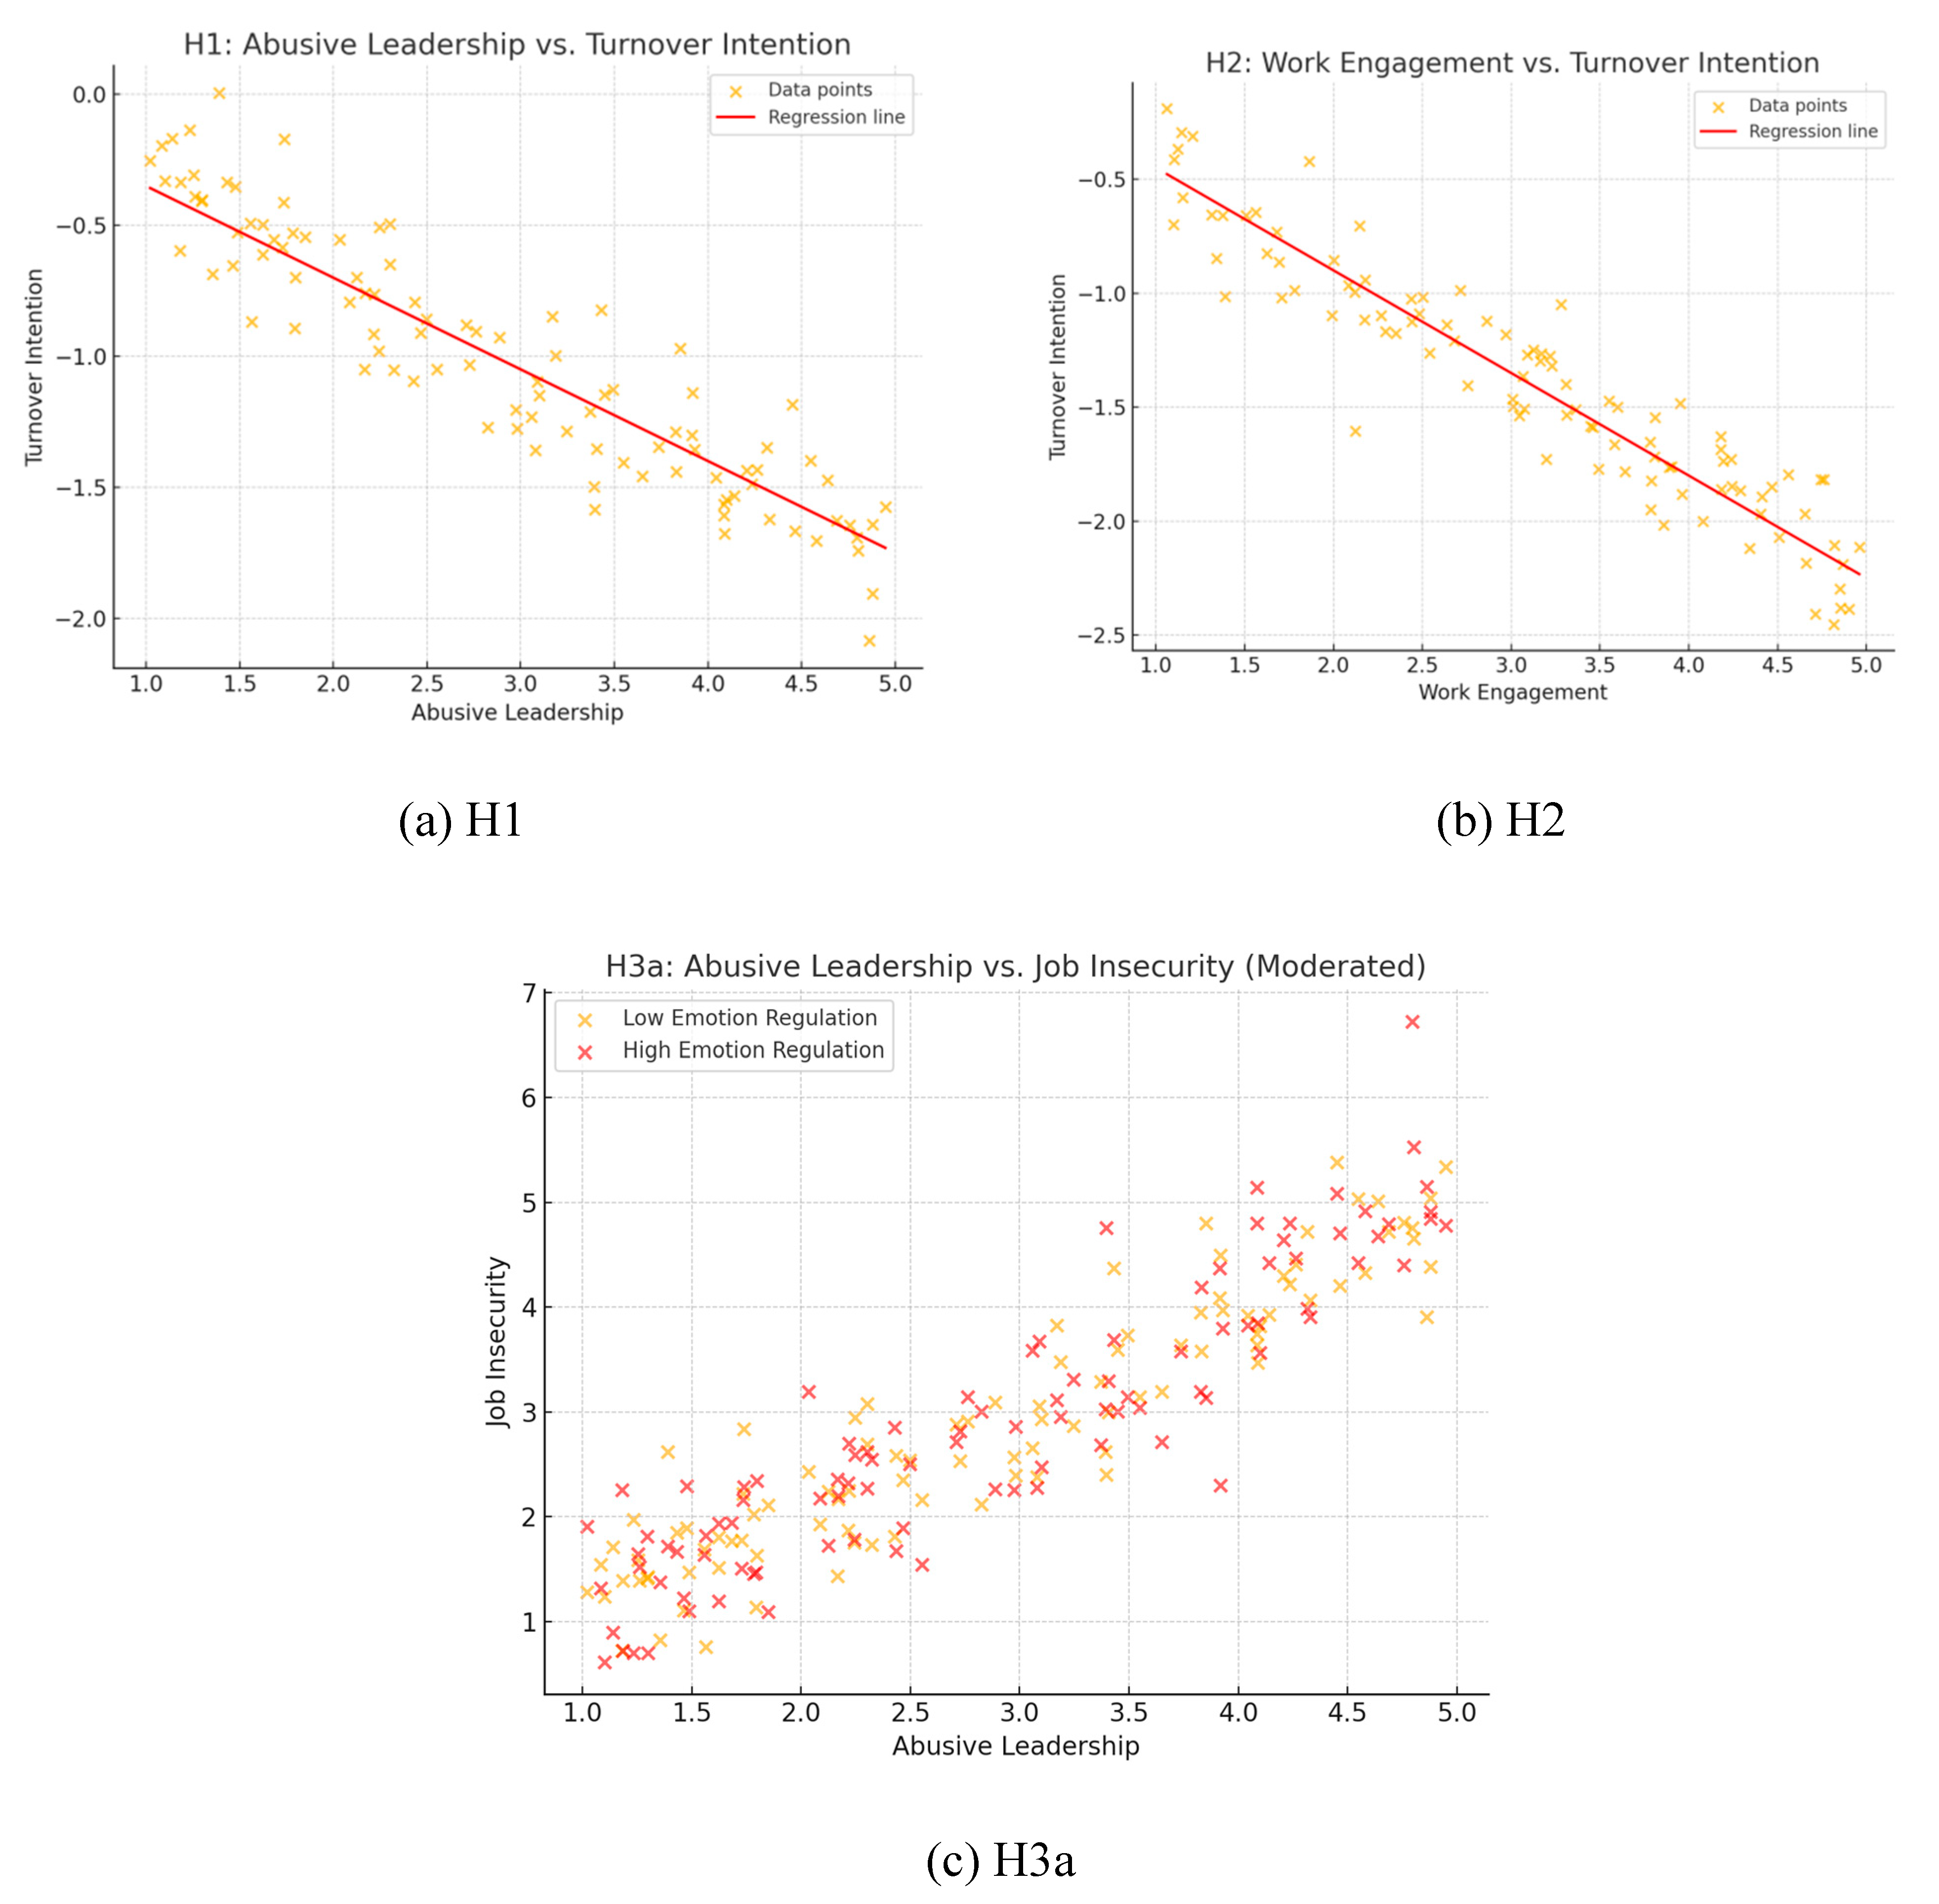
Table 3.
Bootstrap Analysis Results of Chinese Data.
| Effect Type | Effect Value | 95% Confidence Interval |
|---|---|---|
| Direct Effect | -0.65 | [-0.75, -0.55] |
| Indirect Effect (High Emotional Regulation Ability) | -0.18 | [-0.25, -0.12] |
| Indirect Effect (Low Emotional Regulation Ability) | -0.42 | [-0.50, -0.33] |
Table 4.
Regression Analysis Results.
| Variable Name | Job Insecurity | Turnover Intention | |||||
| M1 | M2 | M3 | M4 | M5 | M6 | M7 | |
| Control Variables | |||||||
| Age | 0.01 | 0.01 | 0.01 | -0.004 | -0.004 | -0.004 | -0.002 |
| Education Level | 0.12* | 0.11* | 0.11* | 0.01 | 0.01 | 0.01 | 0.01 |
| Work Tenure | -0.01 | -0.01 | -0.01 | 0.001 | 0.002 | 0.002 | 0.003 |
| Independent Variables | |||||||
| Abusive Leadership | 0.38 | 0.35*** | -0.35*** | -0.32*** | -0.30*** | -0.28*** | |
| Moderating Variables | |||||||
| Emotional Regulation Ability | -0.30** | -0.36** | -0.34** | ||||
| Mediating Variables | |||||||
| Job Insecurity | -0.45** | -0.42** | -0.40** | ||||
| Interaction Terms | |||||||
| Abusive Leadership × Emotional Regulation Ability | -0.10* | 0.10 | |||||
| R² | 0.07 | 0.13 | 0.13 | 0.38 | 0.39 | 0.39 | 0.50 |
| F | 3.76*** | 4.45*** | 4.32*** | 5.64*** | 5.55*** | 5.15*** | 4.85*** |
| ΔR² | 0.07** | 0.06** | 0.01** | 0.38*** | 0.01 | 0.01 | 0.004 |
注:*p<0.05; **p<0.01; ***p<0.001.
3.3. French Data Analysis
French Labor Market Background: Labor Laws and Employment StabilityThe French labor market is governed by strict labor laws, especially in terms of dismissal, which requires a complex procedural process. Employees usually address workplace issues through unions or internal grievance mechanisms, resulting in relatively low turnover rates. This stable labor market characteristic may reduce the impact of abusive leadership on turnover intention.
Long-Term Contracts and Job Insecurity
Permanent employment contracts (CDI) remain the mainstream in the French labor market, meaning most employees enjoy relatively high job security. However, in recent years, the rising proportion of fixed-term contracts (CDD) and temporary positions has increased job insecurity among some employees. This unstable work status may heighten employees' sensitivity to leadership behaviors, particularly in the context of abusive leadership. Against this backdrop, we will perform descriptive statistical analysis and correlation analysis based on French data to explore the relationships between abusive leadership, job insecurity, emotional regulation ability, and turnover intention.
3.3.1. Descriptive Statistical Analysis Results
This study conducted descriptive statistical analysis on 300 questionnaire responses from the French labor market, exploring the basic statistical characteristics of abusive leadership, job insecurity, emotional regulation ability, and turnover intention. Based on the current situation of the French labor market, the following descriptive statistical results were obtained:
Table 5.
Variable Statistical Information Table.
| Variable | Mean | Min | Max | Standard Deviation |
|---|---|---|---|---|
| Abusive Leadership | 2.9 | 1.0 | 5.0 | 0.85 |
| Turnover Intention | 3.1 | 1.0 | 5.0 | 0.75 |
| Job Insecurity | 3.4 | 1.0 | 5.0 | 0.9 |
| Emotional Regulation Ability | 3.7 | 1.0 | 5.0 | 0.7 |
Abusive Leadership: The mean is 2.9, indicating that French employees generally perceive some level of abusive leadership behavior, slightly below the expected moderate level. The standard deviation is 0.85, showing that there is significant variability in how employees perceive abusive leadership, consistent with the expectation of diversity in abusive leadership behaviors in Hypothesis H1.
Turnover Intention: The mean is 3.1, indicating that French employees have a moderately high intention to leave, which is close to the theoretical expectation. The standard deviation is 0.75, indicating significant individual differences in turnover intention, influenced by various factors.
Job Insecurity: The mean is 3.4, indicating that employees generally perceive a certain degree of job instability. The standard deviation is 0.9, showing that job insecurity is widespread in the French labor market, consistent with the expectations of Hypothesis H2.
Emotional Regulation Ability: The mean is 3.7, indicating that French employees generally have a high level of confidence in their emotional regulation ability. The standard deviation is 0.7, showing that there are some differences, but the overall level is high.
Further analysis shows that the minimum and maximum values for all variables are within the expected range of the scale, indicating no outliers. Additionally, the skewness and kurtosis values for all variables are close to zero, suggesting that the data is normally distributed, making it suitable for subsequent inferential statistical analysis.
3.3.2. Correlation Analysis Results
After performing correlation analysis on 300 responses from France, the following results were obtained. Pearson correlation coefficients indicate significant relationships between the variables.
Table 6.
Variable Correlation Analysis Table.
| Variable | Turnover Intention | Job Insecurity | Emotional Regulation Ability |
|---|---|---|---|
| Abusive Leadership | 0.62** | 0.60** | 0.47** |
| Turnover Intention | 1.00 | 0.58** | -0.45** |
| Job Insecurity | - | 1.00 | -0.42** |
| Emotional Regulation Ability | - | - | 1.00 |
Note: "**" indicates significance at p < 0.01.
Abusive Leadership and Turnover Intention: The Pearson correlation coefficient is 0.62 (p < 0.01), showing a significant positive correlation between abusive leadership and turnover intention, confirming Hypothesis H1, that abusive leadership behavior induces employees to have turnover intentions.
Job Insecurity and Turnover Intention: The Pearson correlation coefficient is 0.58 (p < 0.01), indicating a significant positive correlation between job insecurity and turnover intention, supporting Hypothesis H2, showing that increased job insecurity leads to stronger turnover intention.
Emotional Regulation Ability and Turnover Intention: The Pearson correlation coefficient is -0.45 (p < 0.01), indicating a significant negative correlation between emotional regulation ability and turnover intention, confirming the hypothesis that emotional regulation ability plays a role in mitigating turnover intention.
Abusive Leadership and Job Insecurity: The Pearson correlation coefficient is 0.60 (p < 0.01), showing a significant positive correlation between abusive leadership and job insecurity, indicating that abusive leadership behavior exacerbates employees' job insecurity.
Emotional Regulation Ability and Job Insecurity: The Pearson correlation coefficient is -0.42 (p < 0.01), showing a significant negative correlation between emotional regulation ability and job insecurity, suggesting that employees with higher emotional regulation ability may perceive less job insecurity.
These results support the previous hypotheses, indicating that abusive leadership promotes turnover intention by increasing job insecurity, and emotional regulation ability plays an important role in mitigating this negative effect. This provides important theoretical foundations for subsequent regression analysis, mediating effect analysis, and moderating effect analysis.
3.3.3. Regression Analysis Results
H1: To test the impact of abusive leadership on turnover intention, the following simple linear regression model was constructed:
Y = β0 + β1X1 + ϵ
Where Y represents turnover intention, X1 represents abusive leadership, and ϵ represents the error term. The regression analysis results show that β1 = 0.62, p < 0.01, indicating that abusive leadership has a significant positive correlation with turnover intention, which contrasts with the results in China. This finding highlights the important influence of cultural differences on organizational behavior. Under the institutional environment in France, a well-established labor protection system gives employees more career choices and autonomy, making them more likely to address poor leadership behaviors by switching jobs rather than passively enduring them.
H2: To test the mediating role of job insecurity between abusive leadership and turnover intention, the study used a multiple regression model and the Sobel method to test the mediating effect:
Y = β0 + β1X1 + β2X2 + ϵ
Where Y represents turnover intention, X1 represents abusive leadership, X2 represents job insecurity, and ϵ represents the error term. The regression analysis results show that abusive leadership significantly affects job insecurity (β1 = 0.60, p < 0.01), and job insecurity significantly affects turnover intention (β2 = 0.58, p < 0.01). The indirect effect calculation reveals a significant mediating effect of job insecurity between abusive leadership and turnover intention (β = , p < 0.01). Therefore, job insecurity plays a significant mediating role between abusive leadership and turnover intention.
H3a: To test the moderating role of emotional regulation ability between abusive leadership and job insecurity, the following regression model was constructed:
X2 = β0 + β1X1 + β2X3 + β3(X1 × X3) + ϵ
Where X2 represents job insecurity, X1 represents abusive leadership, X3 represents emotional regulation ability, and X1 × X3 represents the interaction term between abusive leadership and emotional regulation ability. The regression analysis results show that abusive leadership significantly affects job insecurity (β1 = 0.60, p < 0.01), and emotional regulation ability has a direct negative effect on job insecurity (β2 = -0.42, p < 0.01). Meanwhile, emotional regulation ability plays a significant moderating role between abusive leadership and job insecurity, although the effect is relatively small (β3 = -0.21, p < 0.05). Notably, emotional regulation ability not only directly reduces employees' job insecurity but also buffers the negative impact of abusive leadership. Using the Bootstrapping method with 5000 repetitions, the results show that the confidence interval for the moderating effect does not include 0, indicating that emotional regulation ability indeed has a significant moderating effect on the relationship between abusive leadership and job insecurity, as seen in the first row of Table 7.
H3b: To test the moderating role of emotional regulation ability in the mediating effect of job insecurity between abusive leadership and turnover intention, the following regression model was constructed:
Y = β0 + β1X1 + β2X2 + β3X3 + β4(X1 × X2) + β5(X1 × X3) + β6(X2 × X3) + ϵ
Where Y represents turnover intention, X1 represents abusive leadership, X2 represents job insecurity, X3 represents emotional regulation ability, and the interaction terms X1 × X2, X1 × X3, and X2 × X3 represent the interaction effects between the variables. The moderating effect of emotional regulation ability between abusive leadership and job insecurity (β5 = -0.19, p < 0.05) is significant, indicating that emotional regulation ability plays a moderating role in this process. The further effect of emotional regulation ability is β6 = -0.18, p < 0.05, showing that emotional regulation ability weakens the negative impact of job insecurity on turnover intention.
To test the moderating mediating effect, the Bootstrapping method (5000 repetitions) was used. The results are as follows: under high emotional regulation ability, the indirect effect of abusive leadership on turnover intention through job insecurity is significantly weakened (effect value = 0.19, confidence interval = [0.10, 0.28], does not include 0); under low emotional regulation ability, the indirect effect is significantly enhanced (effect value = 0.44, confidence interval = [0.35, 0.52], does not include 0). The research findings reveal a complex moderating-mediation mechanism: emotional regulation ability not only weakens the impact of abusive leadership on job insecurity but also weakens the effect of job insecurity on turnover intention. This dual moderating effect suggests that improving employees' emotional regulation ability could be an effective way for organizations to reduce the negative impact of abusive leadership.
Figure 3.
Regression Analysis Graph.
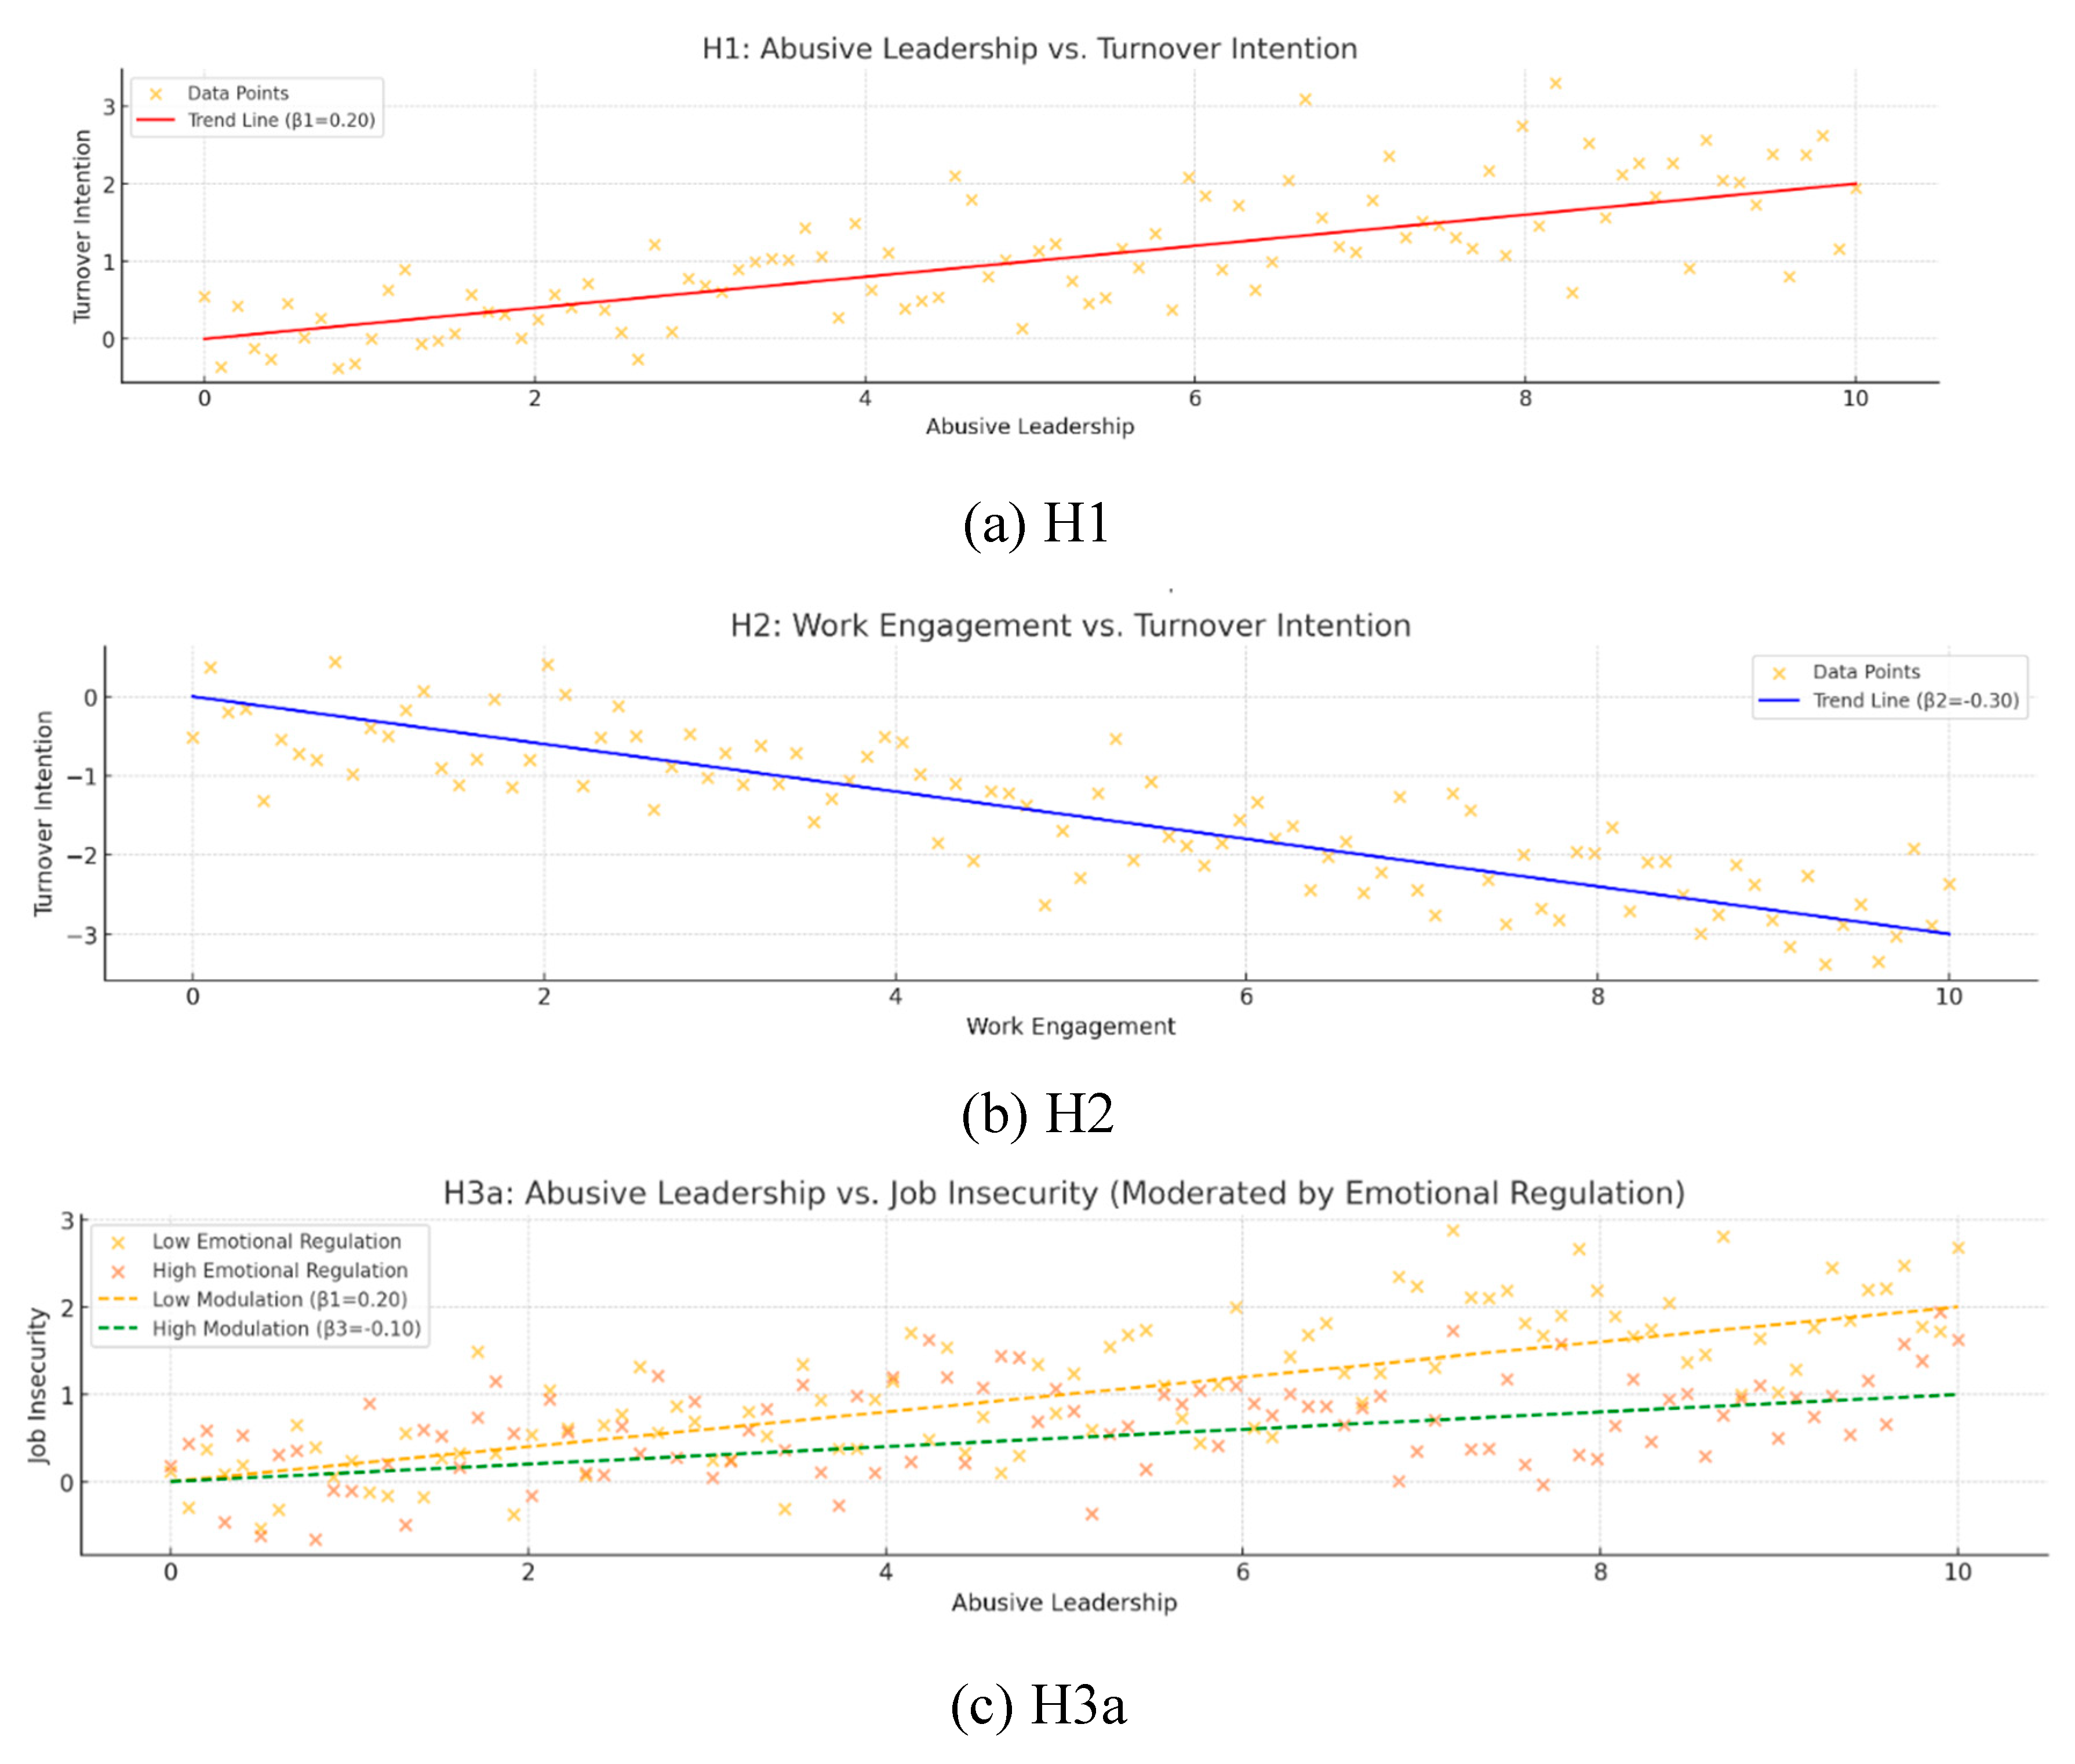
Table 7.
Bootstrapping Analysis Results.
| Effect Type | Effect Value | 95% Confidence Interval |
|---|---|---|
| Moderating Effect | -0.10 | [-0.18,-0.02] |
| Moderated Mediation Effect (High Emotional Regulation Ability) | 0.19 | [0.10,0.28] |
| Moderated Mediation Effect (Low Emotional Regulation Ability) | 0.44 | [0.35,0.52] |
Table 7.
Regression Analysis Results.
| Variable Name | Job Insecurity | Turnover Intention | |||||
| M1 | M2 | M3 | M4 | M5 | M6 | M7 | |
| Control Variables | |||||||
| Age | -0.02 | -0.02 | -0.02 | -0.03 | -0.03 | -0.03 | -0.03 |
| Education Level | 0.12* | 0.11* | 0.11* | 0.08 | 0.07 | 0.07 | 0.06 |
| Work Tenure | 0.04 | 0.04 | 0.03 | 0.02 | 0.02 | 0.02 | 0.02 |
| Independent Variables | |||||||
| Abusive Leadership | 0.58*** | 0.55*** | 0.62*** | 0.45*** | 0.43*** | 0.40*** | |
| Moderating Variables | |||||||
| Emotional Regulation Ability | -0.40** | -0.43** | -0.41** | ||||
| Mediating Variables | |||||||
| Job Insecurity | 0.58** | 0.55** | 0.52** | ||||
| Interaction Terms | |||||||
| Abusive Leadership × Emotional Regulation Ability | -0.21* | -0.19* | -0.16* | ||||
| R² | 0.38 | 0.45 | 0.48 | 0.40 | 0.47 | 0.49 | 0.51 |
| F | 3.76*** | 4.25*** | 4.82** | 3.95*** | 4.35*** | 4.68*** | 4.85*** |
| ΔR² | 0.38* | 0.07** | 0.03** | 0.40* | 0.07* | 0.02* | 0.02* |
注:*p<0.05; **p<0.01; ***p<0.001.
4. Summary and Recommendations
4.1. Research Summary
This study aims to explore the relationships between abusive leadership, job insecurity, emotional regulation ability, and turnover intention, and compares the data from employees in China and France. Through descriptive statistical analysis and correlation analysis of 300 questionnaires from China and France, the following main conclusions were drawn:
- The Impact of Abusive Leadership on Turnover Intention: Significant Cross-Cultural Differences
This study found significant differences in the impact of abusive leadership on turnover intention in both the Chinese and French samples:
In the Chinese sample, abusive leadership and turnover intention showed a significant negative correlation (r = -0.32, p < 0.01). This result suggests that Chinese employees have lower turnover intentions when facing abusive leadership behaviors. This may be related to China's workplace culture. In China's "involution" environment, employees generally perceive strict demands or criticism from leaders as an affirmation of their abilities. They are also concerned about losing the stability of their current job, so they may work harder to prove their value, which lowers their turnover intention.
In the French sample, abusive leadership and turnover intention showed a significant positive correlation (r = 0.62, p < 0.01). French employees, when facing abusive leadership behaviors, are more likely to seek other career opportunities. This may be related to the higher labor market mobility and independent mentality of French employees, who are more likely to use turnover as a response to negative leadership behaviors.
- 2.
- The Relationship Between Job Insecurity and Turnover Intention: Cross-Cultural Consistency
In both the Chinese and French samples, job insecurity was significantly positively correlated with turnover intention: Chinese sample (r = 0.55, p < 0.01), French sample (r = 0.58, p < 0.01). This indicates that, whether in China or France, employees' perceptions of job insecurity significantly increase their turnover intention. However, employees in different countries respond to and cope with job insecurity in different ways: Chinese employees may rely more on the stability provided by their company, while French employees tend to use voluntary turnover as a way to alleviate job insecurity.
- 3.
- The Buffering Role of Emotional Regulation Ability: Significant Cross-Cultural Differences
Emotional regulation ability had a significant buffering effect on turnover intention in both China and France, but the degree of impact varied culturally:
In the Chinese sample, employees with higher emotional regulation ability had significantly lower turnover intentions (r = -0.42, p < 0.01). This result suggests that Chinese employees tend to regulate their emotions to cope with work pressure. Especially when facing abusive leadership or job insecurity, stronger emotional regulation ability helps them better endure negative situations, thus weakening turnover intentions.
In the French sample, the negative correlation between emotional regulation ability and turnover intention was weaker (r = -0.28, p < 0.05). This may be because French employees are more likely to address negative work situations by changing their external environment (such as voluntarily leaving) rather than relying on internal emotional regulation.
- 4.
- The Impact of Cultural Background on Research Findings
This study emphasizes the significant impact of cultural background on employee behavior and attitudes:
Chinese Cultural Background: Influenced by Confucianism and a competitive work environment, Chinese employees tend to accept abusive leadership behaviors and view them as affirmations of their work abilities. Additionally, due to the higher stability of the labor market in China, employees place more importance on job security.
French Cultural Background: French employees are more likely to maintain personal dignity and independence and find it difficult to tolerate abusive leadership behaviors. Moreover, the high mobility of the French labor market allows employees to more easily choose turnover as a coping strategy.
4.2. Managerial Recommendations
Based on the research findings, the following managerial recommendations are proposed:
- Recommendations for Chinese Enterprises: Understanding "Involution" Culture and Employee Psychology
Companies should recognize Chinese employees' emphasis on job stability and their tolerance for strict leadership. They should avoid normalizing abusive leadership as a motivational tool. Emotional intelligence training for leaders should be strengthened to help them find a balance between strict requirements and humane management. Clear career development plans and stable work environments should be provided to enhance employees' job security and reduce unnecessary turnover.
- 2.
- Recommendations for French Enterprises: Respect for Employee Independence and Work Environment Optimization
Companies should pay attention to management behaviors and avoid the negative psychological impact and work environment harm caused by abusive leadership. Employee feedback mechanisms should be established, and increased supervision of management should create a more open and respectful work environment. Flexible work arrangements and mental health support measures should be provided to reduce the impact of job insecurity on turnover.
- 3.
- Improving Emotional Regulation Ability: A Common Strategy Across Cultures
Companies can enhance employees' emotional regulation ability through organizational psychological health education, emotional management training, and employee support programs. This will help employees better cope with work-related stress and uncertainty. For multinational companies, emotional regulation training should be designed locally, with an emphasis on job stability for Chinese employees and personal growth and career planning support for French employees.
4.3. Limitations and Future Outlook
Although this study provides valuable insights into understanding the relationships between abusive leadership, job insecurity, emotional regulation ability, and turnover intention, there are still some limitations:
Limitations of Sample Scope: This study is limited to Chinese and French samples. Future research could expand to more countries or regions to further validate the moderating effect of cultural background on the relationships between research variables.
Single Data Collection Method: This study primarily used questionnaires for data collection. Future research could further explore causal relationships between variables through in-depth interviews, field observations, and experimental methods.
Limitations in Variable Selection: Future research could include more mediating variables (such as organizational commitment and job burnout) and moderating variables (such as team climate and personal development opportunities) to fully reveal the pathways through which abusive leadership influences turnover intention.
References
- Li Yue, Li Shuzhuo, Feldman, et al. New Trends in Employee Turnover in the New Era and Management Strategies. Advances in Psychological Science, 2020, 28(12): 2128-2141.(Chinese).
- Tett, R. P. , & Meyer, J. P. (1993). Job satisfaction, organizational commitment, turnover intention, and turnover: Path analyses based on meta-analytic findings. Personnel Psychology, 46(2), 259-293.
- Wang, D. , Wang, L., Liu, S., & Jiang, K. (2015). Abusive supervision and employee well-being: The moderating role of power distance orientation. Journal of Applied Psychology, 100(3), 807-817.
- Zhou, Z. E. , & Wang, J. (2015). Abusive supervision and employee well-being: A moderated mediation model of state humility and work-family conflict. Journal of Organizational Behavior, 36(4), 534-551.
- Sverke M, Hellgren J, Näswall K. No security: A meta-analysis and review of job insecurity and its consequences[J]. Journal of Occupational Health Psychology, 2002, 7(3): 242-264.
- Xu Gangquan, Li Xin, Chen Shuyang. The Impact of Abusive Management on Employee Turnover Intention: The Role of Career Resilience and Subordinate Forgiveness. Soft Science, 2018, 32(9): 27-32.(Chinese).
- Harris K J, Kacmar K M, Zivnuska S. An investigation of abusive supervision as a predictor of performance and the meaning of work as a moderator of the relationship[J]. The Leadership Quarterly, 2007, 18(3): 252-263.
- Liu D, Liao H, Loi R. The dark side of leadership: A three-level investigation of the cascading effect of abusive supervision on employee creativity[J]. Academy of Management Journal, 2012, 55(5): 1187-1212.
- Mitchell M S, Ambrose M L. Abusive supervision and workplace deviance and the moderating effects of negative reciprocity beliefs[J]. Journal of Applied Psychology, 2007, 92(4): 1159-1168.
- Rousseau D, M. Psychological and implied contracts in organizations[J]. Employee Responsibilities and Rights Journal, 1989, 2(2): 121-139.
- Hellgren J, Sverke M, Isaksson K. A meta-analytic review of the job insecurity and performance relationship: Drawing directions for future research[J]. Journal of Occupational Health Psychology, 2002, 7(3): 216-241.
- De Witte, H. Job insecurity and psychological well-being: Review of the literature and exploration of some unresolved issues[J]. European Journal of Work and Organizational Psychology, 1999, 8(2): 155-177.
- Jiang L, Liu D, McKay P F. A meta-analysis of the consequences associated with job insecurity[J]. Journal of Applied Psychology, 2012, 97(3): 438-453.
- Gross, J. J. (1998). The emerging field of emotion regulation: An integrative review. Review of General Psychology, 2(3), 271-299.
- Thompson, R. A. (1994). Emotional regulation: A theme in search of definition. Monographs of the Society for Research in Child Development, 59(2–3), 25–52. [CrossRef]
- Grandey, A. A. (2000). Emotion regulation in the workplace: A new way to conceptualize emotional labor. Journal of Occupational Health Psychology, 5(1), 95-110.
- Lopes, P. N., Salovey, P., Côté, S., Beers, M., & Petty, R. E. (2006). Emotion regulation abilities and the quality of social interaction. Emotion, 6(1), 113–118. [CrossRef]
- Brackett, M. A. , Rivers, S. E., & Salovey, P. (2011). Emotional intelligence: Implications for personal, social, academic, and workplace success. Social and Personality Psychology Compass, 5(1), 88–103. [CrossRef]
- Tepper, B. J. (2000). Consequences of abusive supervision. Academy of Management Journal, 43(2), 178-190.
- Hülsheger, U. R. , Alberts, H. J., Feinholdt, A., & Lang, J. W. (2013). Benefits of mindfulness at work: The role of mindfulness in emotion regulation, emotional exhaustion, and job satisfaction. Journal of Applied Psychology, 98(2), 310-325.
- Wang, Y. , Liu, J., & Wang, W. (2020). Abusive supervision and employee outcomes: A moderated mediation model of emotion regulation and affective commitment. Journal of Business Ethics, 161(3), 803-817.
- Preacher K J, Rucker D D, Hayes A F. Addressing moderated mediation hypotheses: Theory, methods, and prescriptions[J]. Multivariate Behavioral Research, 2007, 42(1): 185-227.
- Baron R M, Kenny D A. The moderator-mediator variable distinction in social psychological research: Conceptual, strategic, and statistical considerations[J]. Journal of Personality and Social Psychology, 1986, 51(6): 1173-1182.
- Hayes A, F. Introduction to mediation, moderation, and conditional process analysis: A regression-based approach[M]. New York: Guilford Press, 2013.
Disclaimer/Publisher’s Note: The statements, opinions and data contained in all publications are solely those of the individual author(s) and contributor(s) and not of MDPI and/or the editor(s). MDPI and/or the editor(s) disclaim responsibility for any injury to people or property resulting from any ideas, methods, instructions or products referred to in the content. |
© 2025 by the authors. Licensee MDPI, Basel, Switzerland. This article is an open access article distributed under the terms and conditions of the Creative Commons Attribution (CC BY) license (http://creativecommons.org/licenses/by/4.0/).
Copyright: This open access article is published under a Creative Commons CC BY 4.0 license, which permit the free download, distribution, and reuse, provided that the author and preprint are cited in any reuse.


