
Submitted:
14 March 2025
Posted:
17 March 2025
You are already at the latest version
Abstract
The need for renewable and biodegradable materials for packaging applications has grown significantly in recent years. Growing environmental worries over the widespread using of synthetic and non-biodegradable polymeric packaging, particularly polyethylene linked to this increase in demand. This work focuses on the degradation of the low-de,nsity polyethylene LDPE properties which is basically widely used in the packaging, after adding different natural fillers, which is sustainable, compatible, and biodegradable natural polymers .The LDPE was mixed with (2.5, 5, and 10) wt% of each (sawdust, powder cellulose, and Nano crystalline cellulose CNC). The composites melted and mixed using a twin-screw extruder machine with a screw speed of 50 rpm at 190 C, to produce sheets through a specific die. These sheets used to prepare samples for rheological test through viscosity curve, flow curve and non-Newtonian mathematical model using capillary rheometer at 170, 190,and 210oC. X-ray diffraction and degradation tests at short period carried out in soil with a pH of 6.5 and 50% humidity at 27°C. The results showed that the composites melts were non-Newtonian and the shear thinning behavior dominant during viscosity curves. The shear viscosity increases with the different cellulose additives increasing. The 5% ratio indicated higher viscosity for all composites melts and the LDPE\CNC melts showed higher viscosity at different temperatures. The curve fitting was proved that the suitable model for all flows of the composites melts was power law .The LDPE\ sawdust and powder cellulose melts showed higher flow index n and lower viscosity consistency k compared with the LDPE\CNC melt at different temperatures. The sawdust and powder composites indicate higher weight loss compared with the CNC/LDPE composites, these results supported by digital images after 30 day. The degradation test and weight loss illustrate stronger relation with the viscosity values at low shear rate. The higher the shear viscosity the lower the degradation and vice versa.
Keywords:
biodegradability
; LDPE/Cellulose
; rheology
; packaging
1. Introduction
Most products on the market are packaged for a variety of uses, including presentation, preservation, storage, transit, and protection. Both the food and non-food sectors use a lot of packaging. Glass, paper, and petroleum-based polymers are just a few of the many materials that can be utilized for packaging. Petroleum-based polymers have been widely employed for a variety of uses due to their exceptional qualities and versatility. However, because plastics are non-biodegradable and recycling or reusing them is extremely difficult, they can only be used once before being discarded, which results in the production of a significant volume of non-biodegradable garbage [1,2].
One of the main issues from an environmental point of view is the accumulation of garbage in the environment. As a result, there is a continuous rise in demand for environmentally friendly items. The phrase "eco-friendly" describes a technology or product that does not negatively affect the environment or wildlife, yet it does not imply that the product must be fully biodegradable. There are two methods for creating eco-friendly polymers: (a) making bio-based polymers [3,4] from renewable resources, and (b] making biodegradable plastics [5]. Currently, there are significant efforts to integrate these two factors. Natural organic fillers, or fillers derived from renewable resources and biodegradable, are becoming more and more popular in polymer composites due to growing environmental concerns and the demand for more adaptable polymer-based products [6]. Numerous issues occur, including decreased ductility and lower processability. In general, bacteria do not attack hydrophobic polymers, such as polyolefins. Fillers like starch, cellulose, and lignin are added to the polymer mixture to make them biodegradable. Natural fibers and wood flour are highly intriguing due to their low cost, dimensional stability, elastic modulus, and degradability [7].
Cellulose, a naturally occurring hydrophilic polymer made up of poly (1,4-danhydroglucopyranose) units, is the main constituent of plant fibers. Because of the hydroxyl groups in these units, cellulose can form robust hydrogen bonds. Wood is often the most widely used commercial natural resource including cellulose. A significant percentage of cellulose is also included in a few natural fibers, including cotton, flax, hemp, jute, and sisal [8].
Following the digestion of the cellulose fibers by a regulated acid hydrolysis process, nanocrystals of cellulose CNC can be recovered from cellulose sources. The crystalline rod-like particle known as CNC is produced as a stable aqueous colloidal solution [9,10].CNC has been shown to be a more effective nucleating agent than micro-sized cellulose fibers for improving the crystallization characteristics of the polymer matrix [11]. To facilitate a reduction in the free energy barrier and speed up the crystallization rate, CNC enables a heterogeneous nucleation process [12,13]. Adding CNC may potentially result in a higher nucleation density, which would reduce the size of the crystal and increase the number of nucleation sites [14].
The main obstacle for the composites, which are made of hydrophobic polyolefins and hydrophilic cellulose is their incompatibility. Because of the low interfacial adhesion inside the composite, the cellulose has very poor dispersion, which leads to the cellulose's tendency to aggregate and produce poor material properties. Many strategies have been tried to solve this issue, however, compatibilizers or coupling agents, are particularly appealing since these frequently polymeric molecules can be accurately created and adjusted in a controlled manner, allowing for a close examination and optimization of the effects of the molecular structure on the dispersion of cellulose. The Low-density polyethylene-grafting- Maleic anhydride LDPEgMA is a popular compatibilizer between LDPE and cellulose that has been used extensively. When peroxides are present, maleic anhydride (MA) can be grafted onto LDPE chains to create reactive sites where MA can graft, resulting in LDPEgMA [15,16].
The relationship between rheology and degradation in polymers is crucial in many industrial applications such as packaging, where rheology studies help monitor changes in the physical properties of a polymer as it degrades. It is possible to enhance production procedures and guarantee the sustainability of polymeric products in challenging environmental circumstances by forecasting how degradation influences a material's behavior [17]. Since viscosity is highly dependent on the distribution of molecular weight, rheological tests are a very effective method of analysis for assessing deterioration. Numerous studies have investigated the connection between rheology and polymer degradation in recent years [18,19,20].
In this study composites of LDPE\cellulose with content of 2.5, 5, and 10 wt.% of each of sawdust, cellulose powder, and CNC were mixed and melted using a twin screw extruder at 50 rpm and 190 °C to prepare samples for suggested tests. LDPEgMA was added as a coupling agent to improve the dispersion between LDPE and cellulose additives. The relation between rheological properties at 170,190,210 °C, XRD, and degradation was investigated. This study establishes a direct link between shear viscosity and biodegradation, a relationship that has not been widely explored, offering potential alternatives to purely synthetic polymers in packaging applications.
2. Materials and Methods
2.1. Research Materials
The materials used in this work are as follows: Sawdust obtained from sawmills and lumber markets, from poplar wood of Russian origin, using sieved with apertures of 180 µm, ρ = 250 kg/m^3. Cellulose powder was purchased from Himedia company, India. Particle size=18.24 µm. ρ=1.5 g/cm^3.Cellulose nanocrystal CNC was purchased from Nanografi company, Turkey, with the following characteristics: ρ = 1.49g/cm^3, crystallinity =92%, particle size (10 to 20 nm (wide), 300 to 900 nm (length)). LDPE used as a matrix, was provided by Saudi Basic Industries Corporation (SABIC) and had the following characteristics: M,FI (190 °C /2.16 kg; I,SO 1133-1) =2.1g/10 min, ρ = 0.91 g/cm^3, Tm=112 °C. Maleic anhydride-grafted-polyethylene LDPEgMA,(ρ = 0.92 g/cm^3, Tm=105 °C ) as a coupling agent was purchased from Coace chemical company limited _China.
2.2. Preparation of Composites
Prior to processing, cellulose powder and sawdust were vacuum-dried in an oven at 60 °C for two hours and then sieved using a standard sieve (H-47325, U. S. A) with apertures of 180µm. The cellulose additives (CNC, sawdust, powder cellulose) were mixed with (30ml) distilled water and dispersed for 20 minutes at room temperature using Ultrasonic (SJIA-1200W MTI) . The samples produced have been dried and then mixed with LDPE granules and LDPEgMA coupling agents according to the proportions in Table 1. The obtained samples were melted using a twin-screw extruder
The films were prepared using a twin-screw extruder, (SLJ-30A.chine). Details of preparation, including formulations, operating parameters adopted, the proportion of materials used, and final thicknesses of the films are listed in Table 1. L1, L2, and L3 mean LDPE.
2.3. Characterization
2.3.1. Rheology Test
An improved single-bore capillary rheometer, the SR20, was used in this investigation. The polymeric substance was dried before being put into the barrel for each test. Hardened steel, tungsten carbide, and stellite were used to make the barrels, with dies held up at the bottom to preserve geometric integrity. In this case, the die's length-to-diameter ratio was 20:10. For each of the shear rates, a piston with a diameter of 15 mm was seeded to propel the polymer melt through the die at varying velocities. In order to make the polymer soft and flow in the die, [21] the preheating time is equal to 150 s. The pressures at the die's openings were measured at each test using suitable pressure transducers (500 bar). The tests were conducted at temperatures of 170, 190, and 210 °C and within the apparent shear rate range of 10 to 1000) s-1 to produce the viscosity curves.
2.3.2. XRD Test
X-ray diffraction (XRD) profiles were used to examine the crystallinity index (CrI) of composites. An X-ray diffractometer (Rigaku Diffract meter) fitted with nickel-filtered Cu Kα radiation (0.1542 nm = 0.1542) was used to measure it. At 40 kV, 30 mA, and a scan rate of 2◦ min−1, the X-ray pattern was captured in the 2θ range of 10–70◦. CrI was determined using equation (1).
CrI = [(I200 – I110)/I200] × 100%
Where I110 was the intensity of the diffraction peak of (110) at 2θ = 20.94◦ I200 refers to the intensity at about 2θ = 23.1◦ [22].
2.3.3. Degradation Test
Pure LDPE and LDPE\cellulose composites underwent biodegradation at 27 °C in soil with a pH of 6.5 and 50 % humidity. With an initial weight of roughly 2 mg, the dried samples were divided into tiny pieces (1 × 1 cm²). For 30 days, each sample was positioned in soil containers at depths of 3 cm and 5 cm. The samples were cleaned using distilled water at regular intervals and then dried for a full day in a vacuum oven. Ultimately, the samples were weighed, and the mass loss was calculated using the methodology outlined in [23].
Mloss = [Mdry,0 − Mdry,t\Mdry,0 ]× 100 %
Digital microscope model AM4815T Dino-Lite edge made in Kyoto Japan, with zoom , average (20x-220x) using optics and digital camera to output an image for the surface of samples.
3. Results
3.1. XRD
The crystal structure of the samples was examined using X-ray diffraction (XRD). The XRD spectra of LDPE and LDPE\5 wt. % CNC samples are shown in Figure 4. The general XRD patterns of both samples were similar and comparable to those of sawdust and powdered cellulose, as reported in [24]. The 2θ peaks appeared at 20.94° (110) and 23.1° (200), which are characteristic diffraction peaks of low-density polyethylene (LDPE) [25]. Furthermore, with the addition of CNC, the crystallinity of LDPE and LDPE\CNC composites remained in an orthorhombic structure. The crystallinity index of the samples was determined and is listed in Table 3 based on XRD data. The results indicate that the crystallinity of LDPE composites increased with the incorporation of cellulose. This increase is attributed to the role of cellulose as a nucleating agent, which enhanced the crystallinity index and improved the crystallization of LDPE\CNC composites [26]. Cellulose exhibited behavior consistent with a more amorphous material, which became increasingly organized and crystalline upon incorporation into LDPE. The crystalline nature of cellulose contributes to the formation of packaging materials with a more structured and ordered morphology. This, in turn, influences the physical and chemical properties of the final composite material.
3.2. Rheol,ogy
The addition of cellulose, depending on dispersion and interaction with LDPE, may increase or decrease viscosity, affecting processability and long-term stability. In Figure 1, shear thinning behavior is dominant on the viscosity curves of all composites. This means that the cellulose additives had no effect on the usual flow behavior of LDPE. The shear viscosity of all composite melts was exponentially increased with the ratio of the additive increasing especially at a low shear rate zone (0-50 1/s), while slight increases were observed from 50 up to 450 1/s.The arrangement of viscosity from higher to lower value at the low shear rate was 5, 10, and 2.5% ratio of all cellulose additives at 170,190,210 oC. In the other hand, the arrangement of shear viscosity at low shear rate from higher to lower value according to the cellulose type was 9918,8947, and 7975 Pa.s at 170 °C, 8700, 8300, and 8000 Pa.s at 190 °C and 85100,7540, and 7070 at 210 °C for CNC, sawdust, and powder respectively. The higher viscosity (due to higher polymer molecular weight or strong interactions with cellulose) can indicate a more stable structure that resists degradation, while Lower viscosity may suggest polymer chain scission or thermal degradation during processing, leading to faster breakdown. Higher viscosity induces fewer biofilm attachment sites which reduces microbial colonization and slower hydrolysis of cellulose due to the limited water penetration. Molecular entanglement increases and free volume decreases in the polymer matrix in addition to the stronger hydrogen bonding between cellulose hydroxyl groups (-OH) and LDPE chains reduces hydrolytic and microbial degradation.
Figure 2, Shows the viscosity behavior of different LDPE\Cellulose melts at different ratios and different temperatures.
The LDPE\CNC melts indicate higher viscosity at the low shear rate for all ratios compared with the other melts.
3.2.1. Rheological Model
The flow index n and viscosity consistency K of all melts were determined by using the Rheology App (Rheology lite of window, an app for rheological analysis of flow behavior of materials). program utilizing the Power law, correct Herschel Buckley, Caisson, and Bingham. The flow behavior of all composite melts matched with the power law mathematical model where the flow index (n) is less than (1) as shown in Figure 3.
Power law model
𝜂 = k (𝛾)n -1
𝜏 = k (𝛾)n
Where η is viscosity (Pa. s), τ is the shear stress (Pa), γ is the shear rate (1/s), n is flow index, and K is viscosity consistency.
Figure 3.
Non-Newtonian Flow Mathematical Models for Various LDPE\Cellulose Composite Melts Using the Rheology App Program for 5% Cellulose Additives at Different Temperatures.
Figure 3.
Non-Newtonian Flow Mathematical Models for Various LDPE\Cellulose Composite Melts Using the Rheology App Program for 5% Cellulose Additives at Different Temperatures.
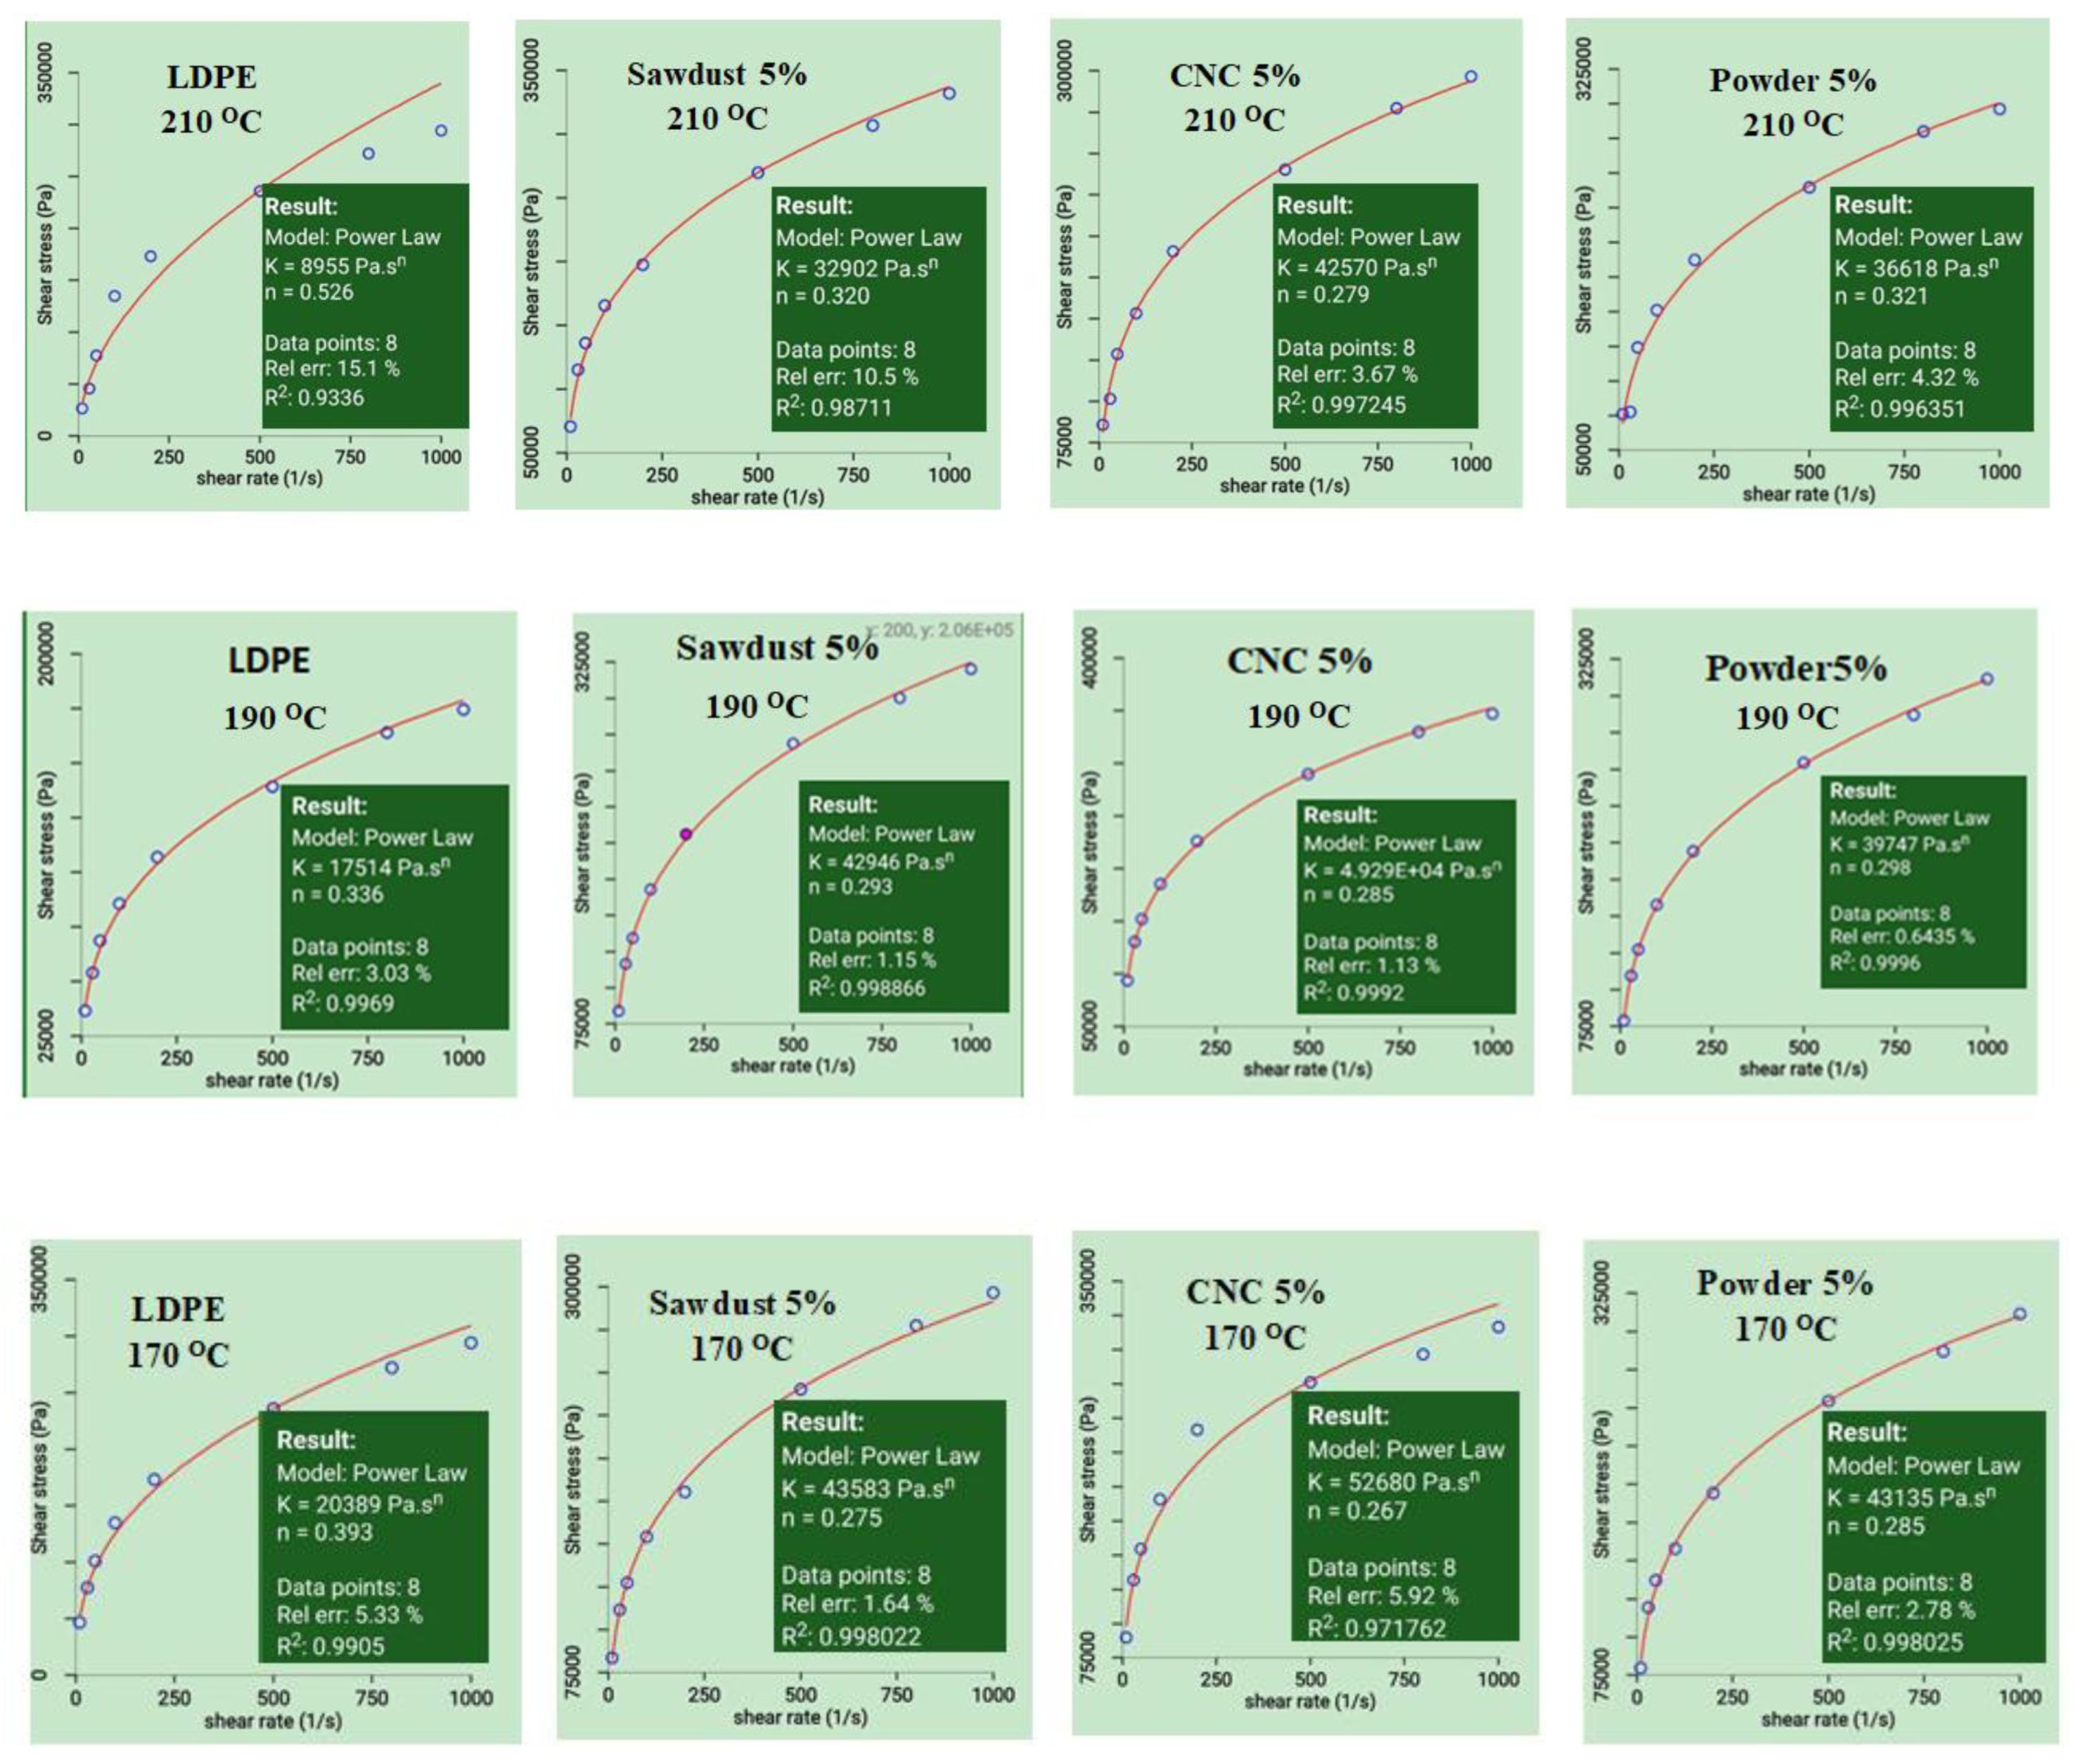
Figure 4.
X-ray diffraction patterns of LDPE and LDPE\5 wt. % CNC.
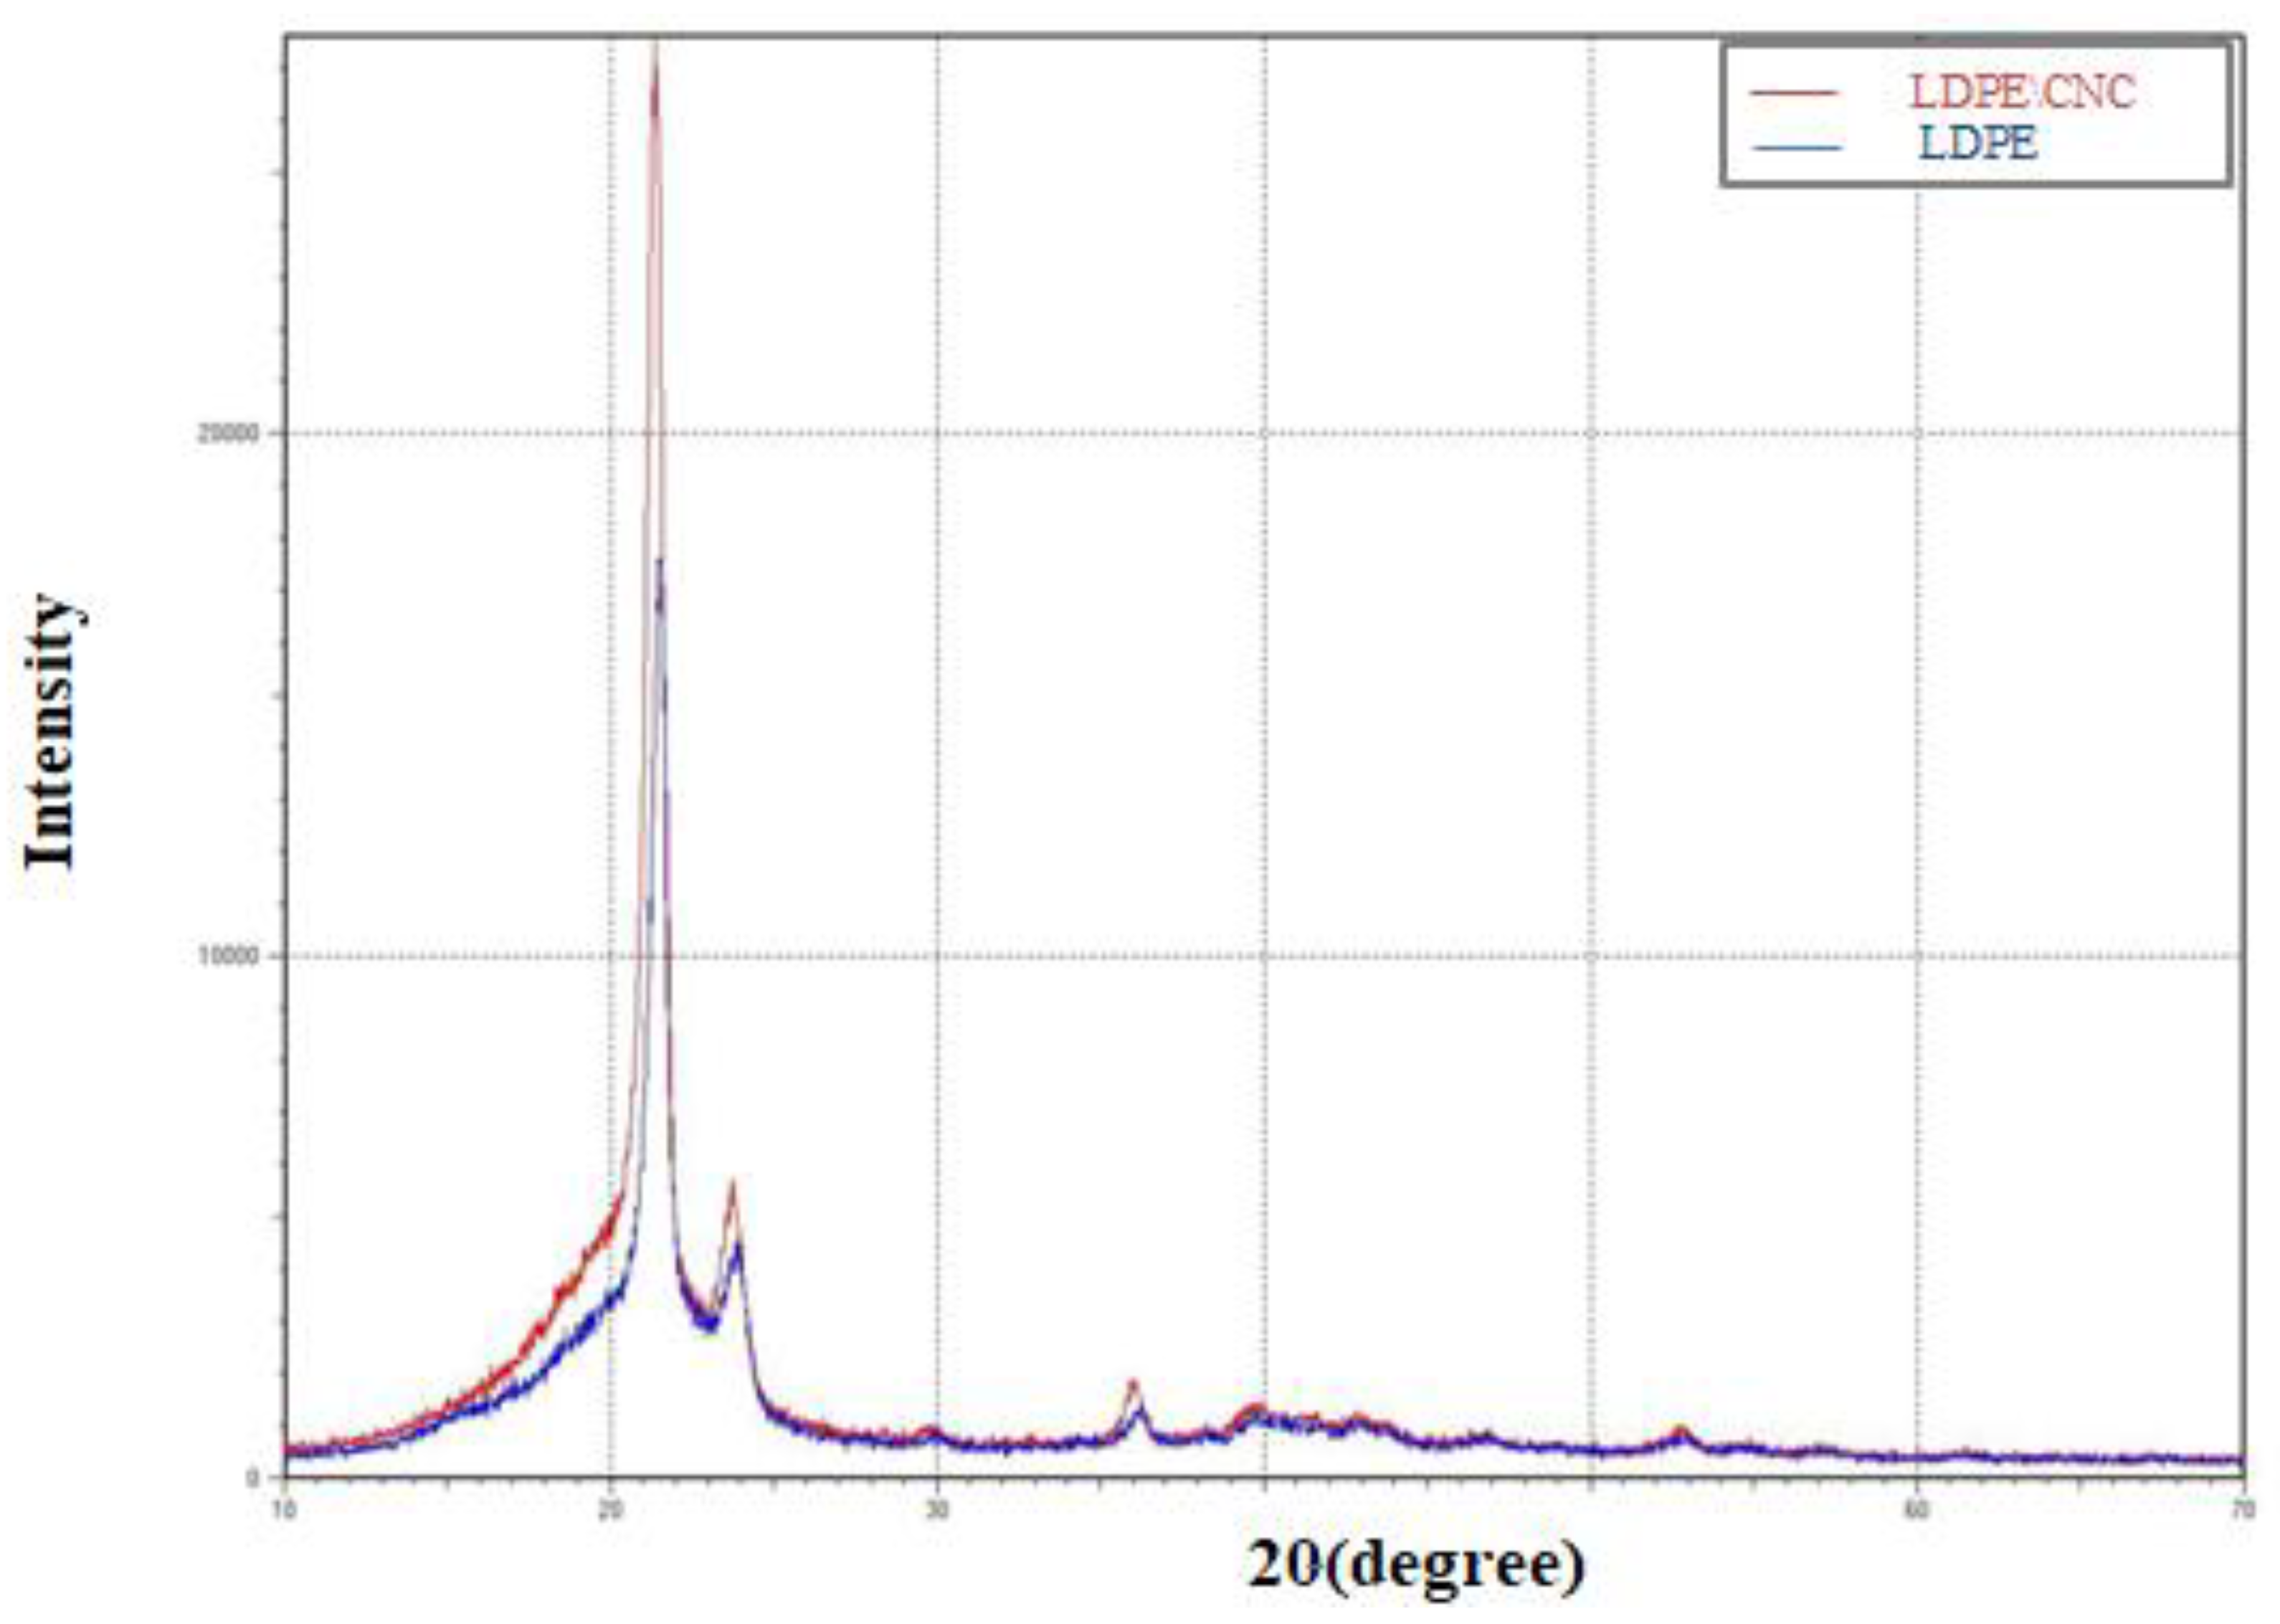

Table 2.
Flow index(n) and viscosity consistency (LDPE K) for and LDPE \5%Cellulose additives melt at different temperatures.
Table 2.
Flow index(n) and viscosity consistency (LDPE K) for and LDPE \5%Cellulose additives melt at different temperatures.
| Sample | Flowindex (n) | Consistency index (K ) |
|---|---|---|
| LDPE (170oC) LDPE (190oC) LDPE (210oC) |
0.393 0.336 0.526 |
20389 17514 8955 |
| Sawdust (170oC) Sawdust (190oC) Sawdust (210oC) |
0.275 0.293 0.320 |
43583 42946 32902 |
| CNC (170oC) CNC (190oC) CNC (210oC) |
0.267 0.285 0.279 |
52680 49290 42570 |
| Powder (170oC) Powder (190oC) Powder (210oC) |
0.285 0.298 0.321 |
43135 39747 36618 |
Table 3.
The crystallinity index of the LDPE and LDPE\5 wt.% CNC.
| Sample | 2θ(200) | 2θ(110) | CrI% |
|---|---|---|---|
| LDPE | 23.1 | 20.49 | 75 |
| LDPE\5 wt.% CNC | 23.1 | 20.5 | 83.3 |
The flow index n level describes the melting behavior of compounds during polymer extruding, while the viscosity consistency K describes the melting behavior and melting force near the end of the process. The flow index (n) indicates a lower than one value at 5% of all cellulose additions due to shear thinning behavior. The stability of the melt depends on the viscosity consistency K which represents the viscosity and molecular weight of the composite melts at low shear rates for 170,190, and 210 °C.
Decreasing the flow index n less than one leads to better dispersion of cellulose and increased surface exposure to microbes and moisture. A lower n value (stronger shear thinning behavior) can lead to a higher degradation rate, as cellulose is more exposed and microbial colonization is enhanced. K represents the viscosity at low shear rates and depends on molecular weight and interactions within the polymer matrix. A higher K value means higher viscosity at low shear, which indicates stronger polymer-cellulose interactions and a more resistant structure to microbial attack. A lower K suggests that the composite is more prone to degradation, as water and microbes can diffuse more easily. Lower n and higher K produce more structured matrixes, resisting microbial breakdown. Higher n and lower K lead to more cellulose exposure, accelerating microbial colonization and biodegradation.
Figure 3, and Table 2. show that the higher n and lower K values obtained in powder and sawdust cellulose composites fit the curve according to the power law model finding, while lower n and higher K are indicated for CNC composites. This is confirmed by the degradation results for the same composites.
3.2.2. Degradation
The biodegradable properties of LDPE\Cellulose additives can be determined by soil burial testing. As can be seen in Figure 5, the degradation started due to water absorption from the soil, and after 30 days the weight loss of all compounds increased. The weight loss percentage in LDPE was much lower than that of LDPE\Cellulose additives as the water absorption was higher for the composites due to the hydrophilic nature of cellulose. Therefore, adding Cellulose additives (sawdust, CNC and powder cellulose) to LDPE increased the biodegradability of all LDPE\cellulose composites compared to LDPE at a depth of 3 and 5 cm. Furthermore, sawdust and powdered cellulose showed a higher rate of weight loss than CNC. This is attributed to the highly crystallinity nature of CNC compared to sawdust and powdered cellulose, which results in stronger strength and a denser structure with less porosity and voids, leading to reduced water diffusion. Swelling and slow attack by microorganisms reduce hydrolysis and biodegradation and are compatible with the rheological findings. The burial depth did not appear as an important role in biodegradation, environmental factors such as temperature, humidity, and biological activity will affect the rate of degradation.
Figure 6 presents microscope images of LDPE and LDPE/cellulose additive composites with a thickness of 3 mm containing 2.5, 5, and 10 wt.% cellulose. The samples containing cellulose appeared transparent with a uniform surface. Following soil burial, slight brown spots emerged on the surface, becoming more prominent as the cellulose content increased. The surface changes in LDPE\CNC cellulose composites were notably less distinct than those observed in sawdust and powdered cellulose composites. This behavior aligns with the data from rheological and mathematical models.
4. Conclusions
The degradation of LDPE/Cellulose additive composite packaging is significantly influenced by extrusion process conditions, including temperature, screw speed, extruder specifications, and material ratios. In soil burial testing, weight loss measurements of 2.5, 5, and 10 wt.% for each of CNC, powder cellulose, and sawdust in LDPE composites were used as indicators of degradation. Weight loss increased with higher additive ratios, with powder-sawdust/LDPE samples exhibiting greater losses over 30 days compared to the LDPE/CNC sample. Digital images at 1600x magnification revealed more pronounced pitting on the surface of powder-sawdust/LDPE samples after 30 days than on the LDPE/CNC sample. The crystalline nature of cellulose plays a key role in creating packaging materials with a more structured and organized morphology.
The viscosity curves of LDPE/cellulose melts exhibited non-Newtonian shear-thinning behavior. The power law model provided the best fit for describing these flows. The powder-sawdust/LDPE samples demonstrated a higher flow index (n) and lower viscosity consistency (K) across different temperatures compared to the LDPE\CNC sample.. The 5% ratio samples exhibited higher viscosity at low shear rates across all tested samples, while the LDPE/CNC samples demonstrated higher viscosity at various temperatures. Viscosity at lower shear rates is directly proportional to molecular weight and cohesive structure. Lower viscosity, molecular weight, and consistency index (K) were associated with increased degradation through weight loss, and vice versa. The findings reveal a strong correlation between weight loss and viscosity at low shear rates across all samples.
Funding
This research received no external funding.
Institutional Review Board Statement
Not applicable.
Informed Consent Statement
Not applicable.
Data Availability Statement
Data are contained within the article.
Acknowledgments
The authors would like to express their gratitude to the dept. pf polymer and petrochemical industries engineering\College of materials engineering.
Conflicts of Interest
The authors declare no conflict of interest.
References
- Shazleen, S. S., Foong Ng, L. Y., Ibrahim, N. A., Hassan, M. A., & Ariffin, H. Combined effects of cellulose nanofiber nucleation and maleated polylactic acid compatibilization on the crystallization kinetic and mechanical properties of polylactic acid nanocomposite. Polymers. (2021), 13(19), 3226.. [CrossRef]
- Sun, J., Li, Y., Cao, X., Yao, F., Shi, L., & Liu, Y. A film of chitosan blended with ginseng residue polysaccharides as an antioxidant packaging for prolonging the shelf life of fresh-cut melon. Coatings. (2022), 12(4), 468.. [CrossRef]
- Kalambur S, Rizvi SSH. An overview of starch-based plastics blends from reactive extrusion. J Plast Film Sheet. (2006);22:39. [CrossRef]
- Ahari, H., Anvar, A. A., Ataee, M., & Naeimabadi, M. Employing nanosilver, nanocopper, and nanoclays in food packaging production: A systematic review. Coatings. (2021), 11(5), 509. [CrossRef]
- Pucciaviello R, Villani V, Belviso S, Gorrasi G, Tortora M, Vittoriam V. Phase behavior of modified montmorillonite poly(e-caprolactone) nanocomposites. J Polym Sci Polym Phys Ed 2004;42:1321.
- La Mantia FP, Morreale M. Green composites: a brief review. Composites Part A .(2011);42:579–88. [CrossRef]
- Taj S, Munawar MA, Khan SU. Natural fiber-reinforced polymer composites. Proc Pakistan Acad Sci (2007);44(2):129–44.
- Sheltami, R. M., Abdullah, I., Ahmad, I., Dufresne, A., & Kargarzadeh, H. Extraction of cellulose nanocrystals from mengkuang leaves (Pandanus tectorius). Carbohydrate Polymers. (2012), 88(2), 772-779. [CrossRef]
- Khan, A., Khan, R. A., Salmieri, S., Le Tien, C., Riedl, B., Bouchard, J., ... & Lacroix, M. Mechanical and barrier properties of nanocrystalline cellulose reinforced chitosan based nanocomposite films. Carbohydrate polymers. (2012), 90(4), 1601-1608. [CrossRef]
- Zielińska, D., Rydzkowski, T., Thakur, V. K., & Borysiak, S. Enzymatic engineering of nanometric cellulose for sustainable polypropylene nanocomposites. Industrial Crops and Products. (2021), 161, 113188. [CrossRef]
- Kose, R.; Kondo, T. Size effects of cellulose nanofibers for enhancing the crystallization of poly(lactic acid). J. Appl. Polym. Sci. (2013), 128, 1200–1205. [CrossRef]
- Frone, A.N.; Berlioz, S.; Chailan, J.-F.; Panaitescu, D.M. Morphology and thermal properties of PLA—Cellulose nanofibers composites. Carbohydr. Polym. (2013), 91, 377–384. [CrossRef]
- Odalanowska, M., Cofta, G., Woźniak, M., Ratajczak, I., Rydzkowski, T., & Borysiak, S. Bioactive Propolis-Silane System as Antifungal Agent in Lignocellulosic-Polymer Composites. Materials. (2022), 15(10), 3435. [CrossRef]
- Song, Y.; Tashiro, K.; Xu, D.; Liu, J.; Bin, Y. Crystallization behavior of poly (lacticacid)/microfibrillated cellulose composite. Polymer (2013), 54, 3417–3425.
- Shazleen, S. S., Foong Ng, L. Y., Ibrahim, N. A., Hassan, M. A., & Ariffin, H. Combined effects of cellulose nanofiber nucleation and maleated polylactic acid compatibilization on the crystallization kinetic and mechanical properties of polylactic acid nanocomposite. Polymers. (2021), 13(19), 3226. [CrossRef]
- Scholten, P. B. V., Özen, M. B., Söyler, Z., Thomassin, J. M., Wilhelm, M., Detrembleur, C., & Meier, M. A. R. Rheological and mechanical properties of cellulose\LDPE composites using sustainable and fully renewable compatibilisers. Journal of Applied Polymer Science. (2020), 137(22), 48744. [CrossRef]
- Salehiyan, R., & Soleymani Eil Bakhtiari, S. A review on rheological approaches as a perfect tool to monitor thermal degradation of biodegradable polymers. Korea-Australia Rheology Journal. (2024), 1-23. [CrossRef]
- Partini, M., Argenio, O., Coccorullo, I., & Pantani, R. (2009). Degradation kinetics and rheology of biodegradable polymers. Journal of thermal analysis and calorimetry. (2009), 98(3), 645-653. [CrossRef]
- Conrad, J. D. The rheology, degradation, processing, and characterization of renewable resource polymers (Doctoral dissertation, Clemson University).(2009).
- Mansourieh, M., Farshbaf Taghinezhad, S., Abbasi, A., Chen, Y., & Devine, D. A Study on the Degradability and Mechanical–Rheological Correlations of PLA/Silk Composites. Journal of Composites Science. (2024), 8(10), 428. [CrossRef]
- Hadi, N. J., Abd Alhussein, M. M., & Rydzkowski, T. L. EXPERIMENTAL AND NUMERICAL SIMULATUON OF NON-NEWTONIAN IN CAPILLARY RHEOMETER.>.
- Whba, F., Mohamed, F., Idris, M. I., & Yahya, M. S. Surface modification of cellulose nanocrystals (CNCs) to form a biocompatible, stable, and hydrophilic substrate for MRI. Applied Sciences. (2023), 13(10), 6316. [CrossRef]
- Scaffaro, R., Maio, A., Gulino, E. F., Morreale, M., & La Mantia, F. P. The effects of nanoclay on the mechanical properties, carvacrol release and degradation of a PLA/PBAT blend. Materials. (2020), 13(4), 983. [CrossRef]
- Whba, F., Mohamed, F., Idris, M. I., & Yahya, M. S. Surface modification of cellulose nanocrystals (CNCs) to form a biocompatible, stable, and hydrophilic substrate for MRI. Applied Sciences. (2023), 13(10), 6316. [CrossRef]
- Bouafif, H., Koubaa, A., Perré, P., Cloutier, A., & Riedl, B. Wood particle/high-density polyethylene composites: Thermal sensitivity and nucleating ability of wood particles. Journal of Applied Polymer Science(2009), 113(1), 593-600. [CrossRef]
- Díaz-Cruz, C. A., Caicedo, C., Jiménez-Regalado, E. J., Díaz de León, R., López-González, R., & Aguirre-Loredo, R. Y. Evaluation of the antimicrobial, thermal, mechanical, and barrier properties of corn starch–chitosan biodegradable films reinforced with cellulose nanocrystals. Polymers.(2022), 14(11), 2166.
Figure 1.
Apparent Viscosity vs. Shear Rate for LDPE and LDPE/Cellulose Additives at 170°C, 190°C, and 210°C with Various Concentrations (2.5, 5, and 10 wt.%) of Sawdust, CNC, and Powder.
Figure 1.
Apparent Viscosity vs. Shear Rate for LDPE and LDPE/Cellulose Additives at 170°C, 190°C, and 210°C with Various Concentrations (2.5, 5, and 10 wt.%) of Sawdust, CNC, and Powder.
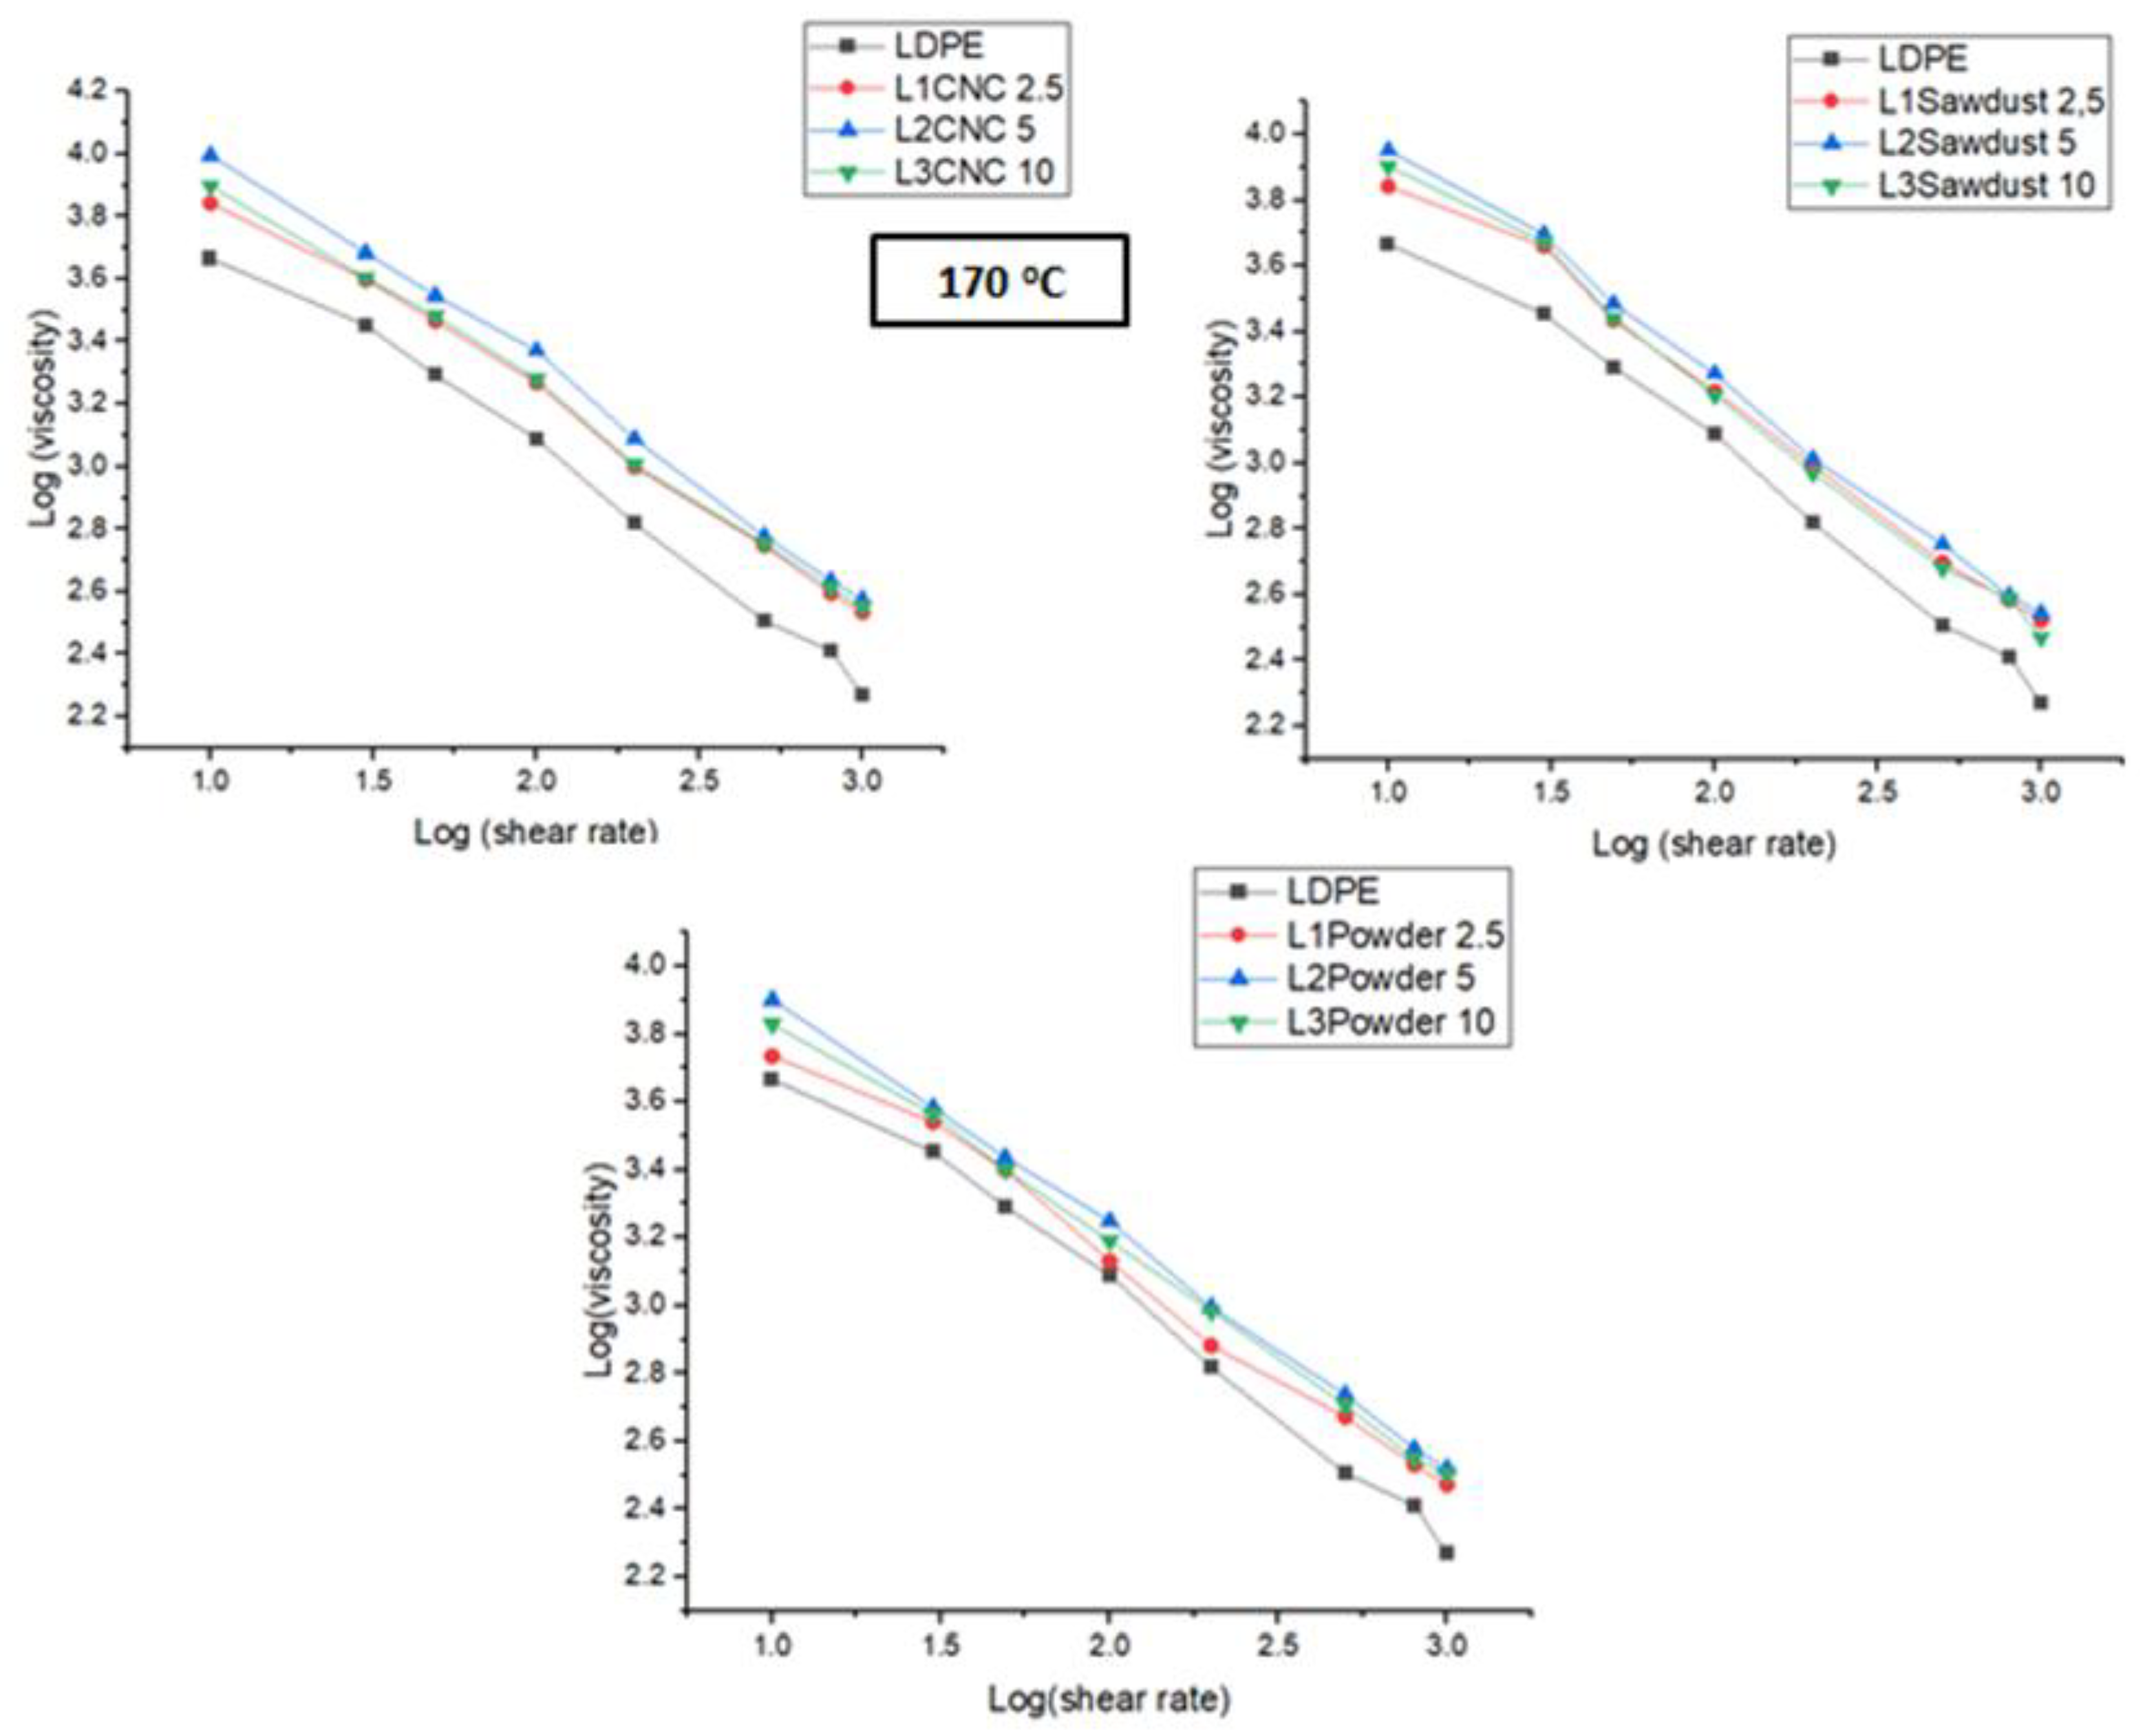
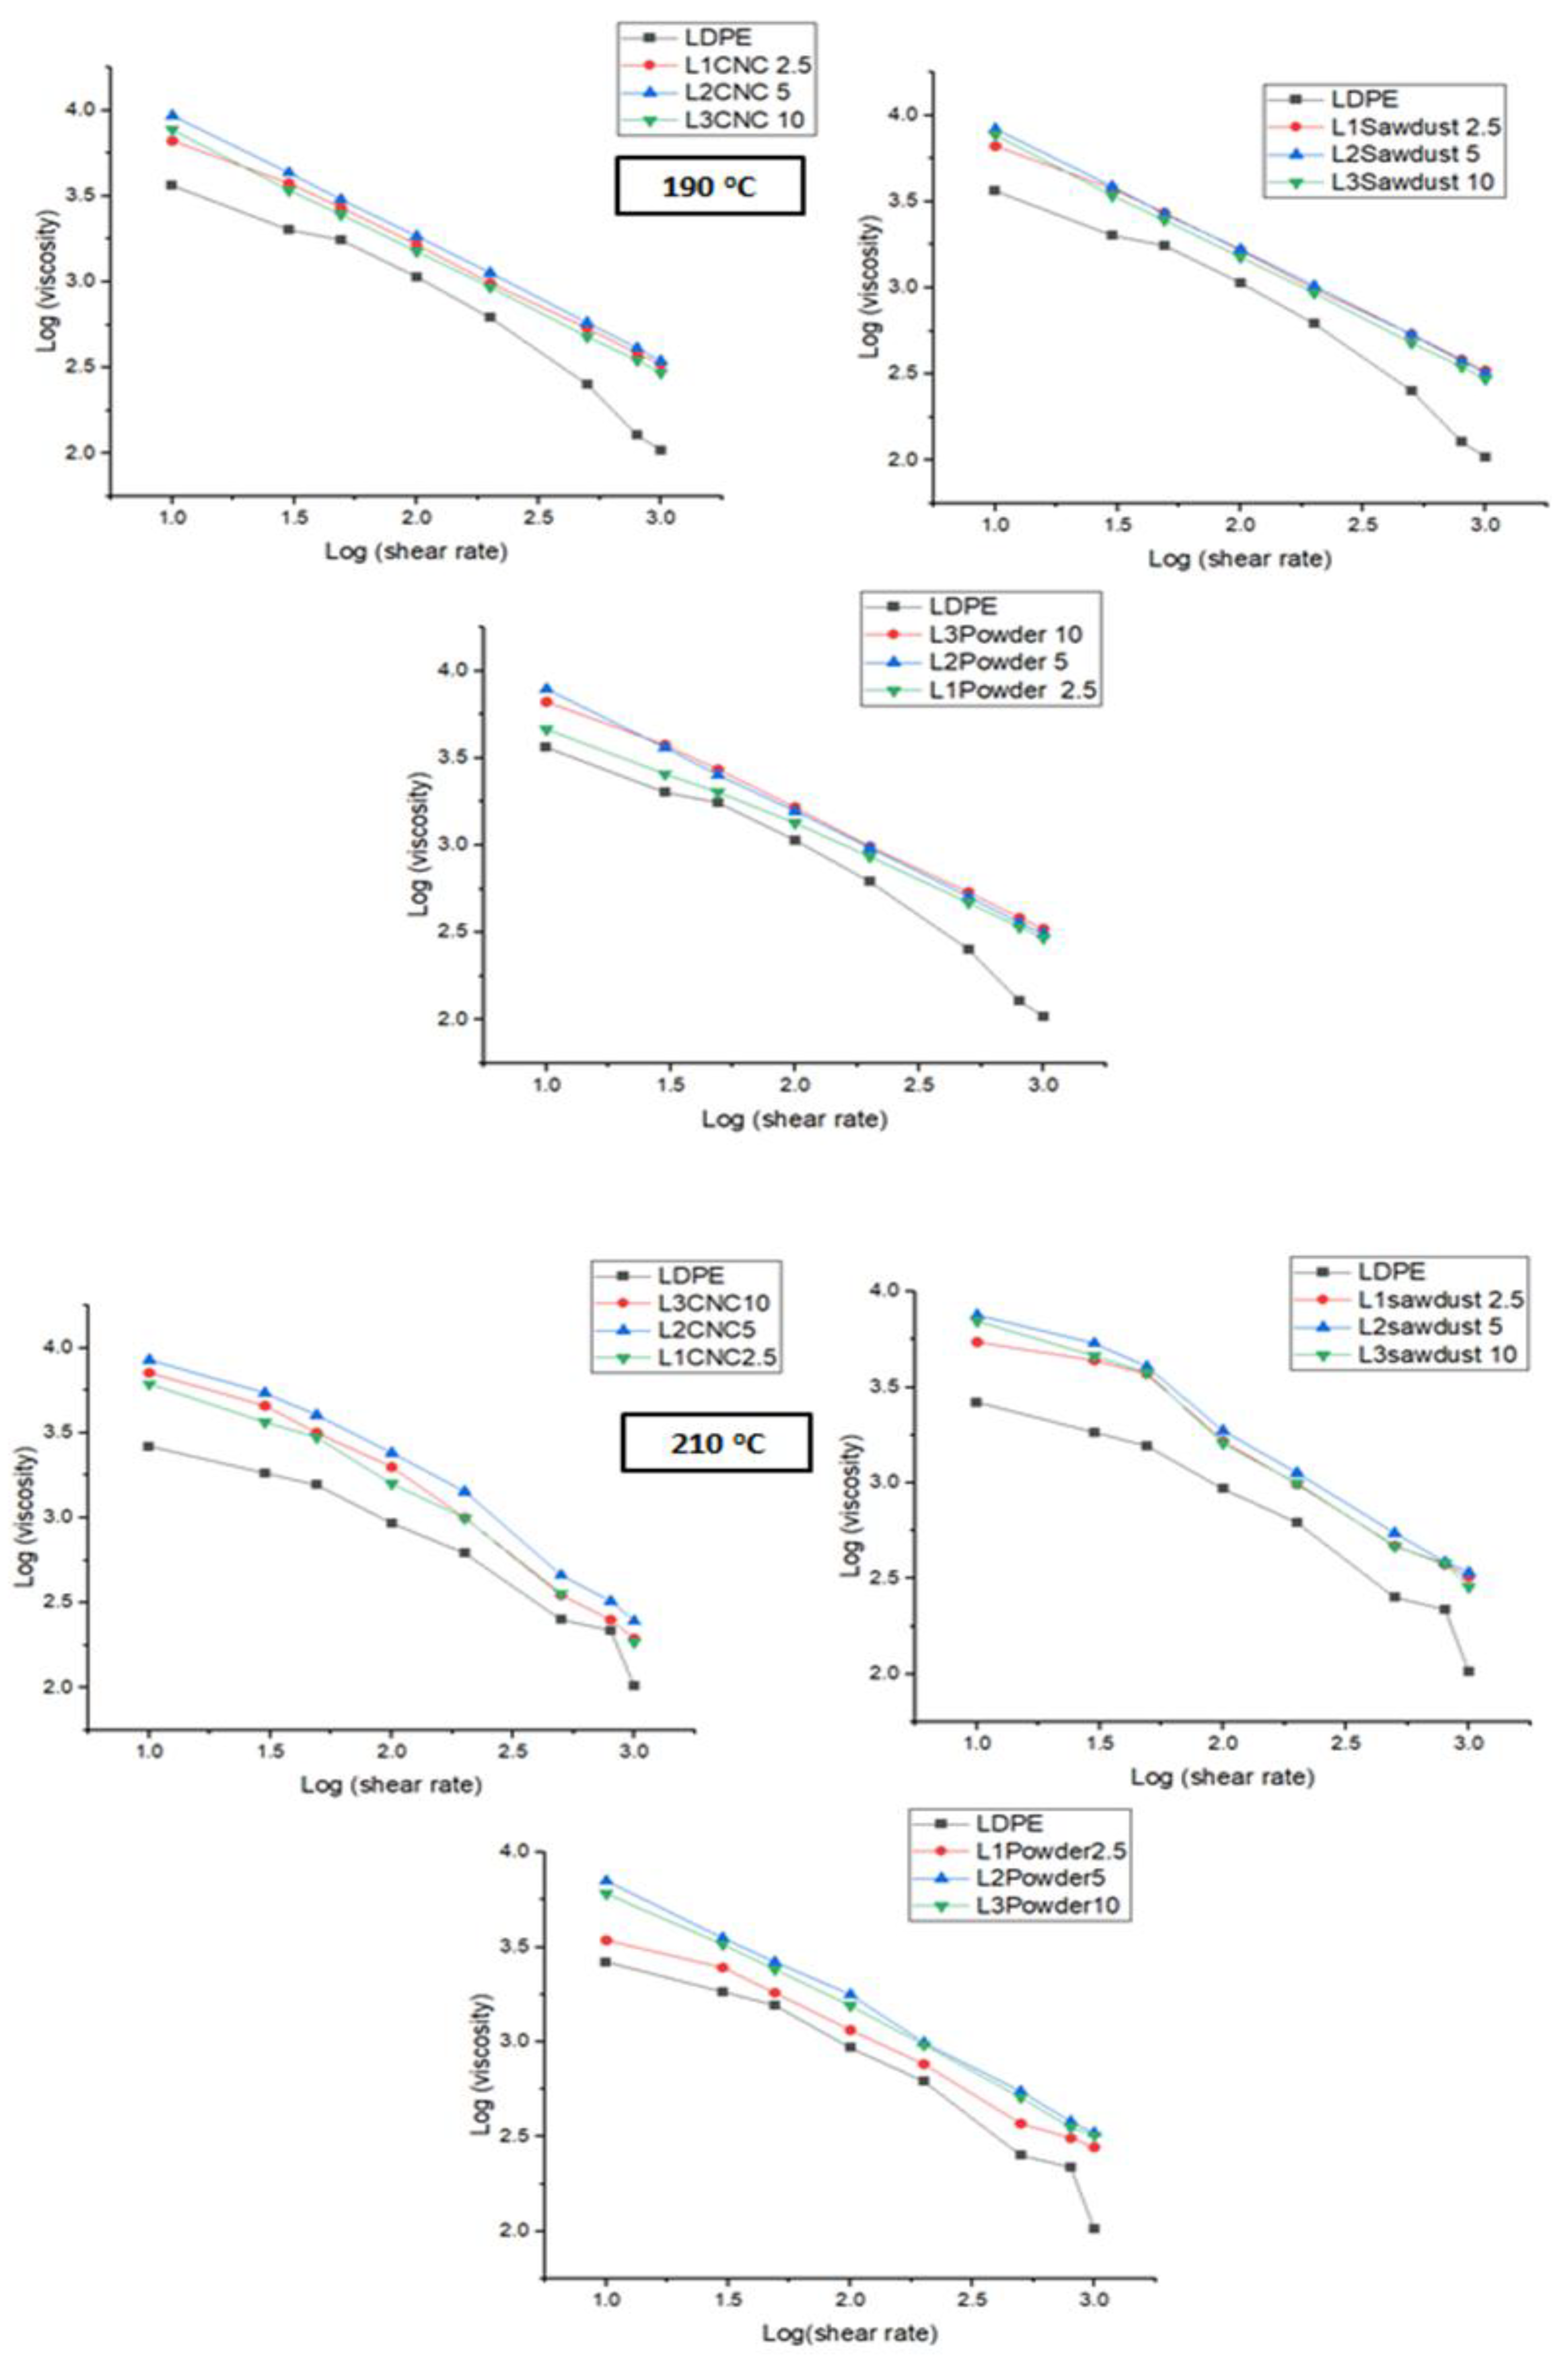
Figure 2.
Viscosity of LDPE/Cellulose Additives at 10 Shear Rates Across Different Temperatures.
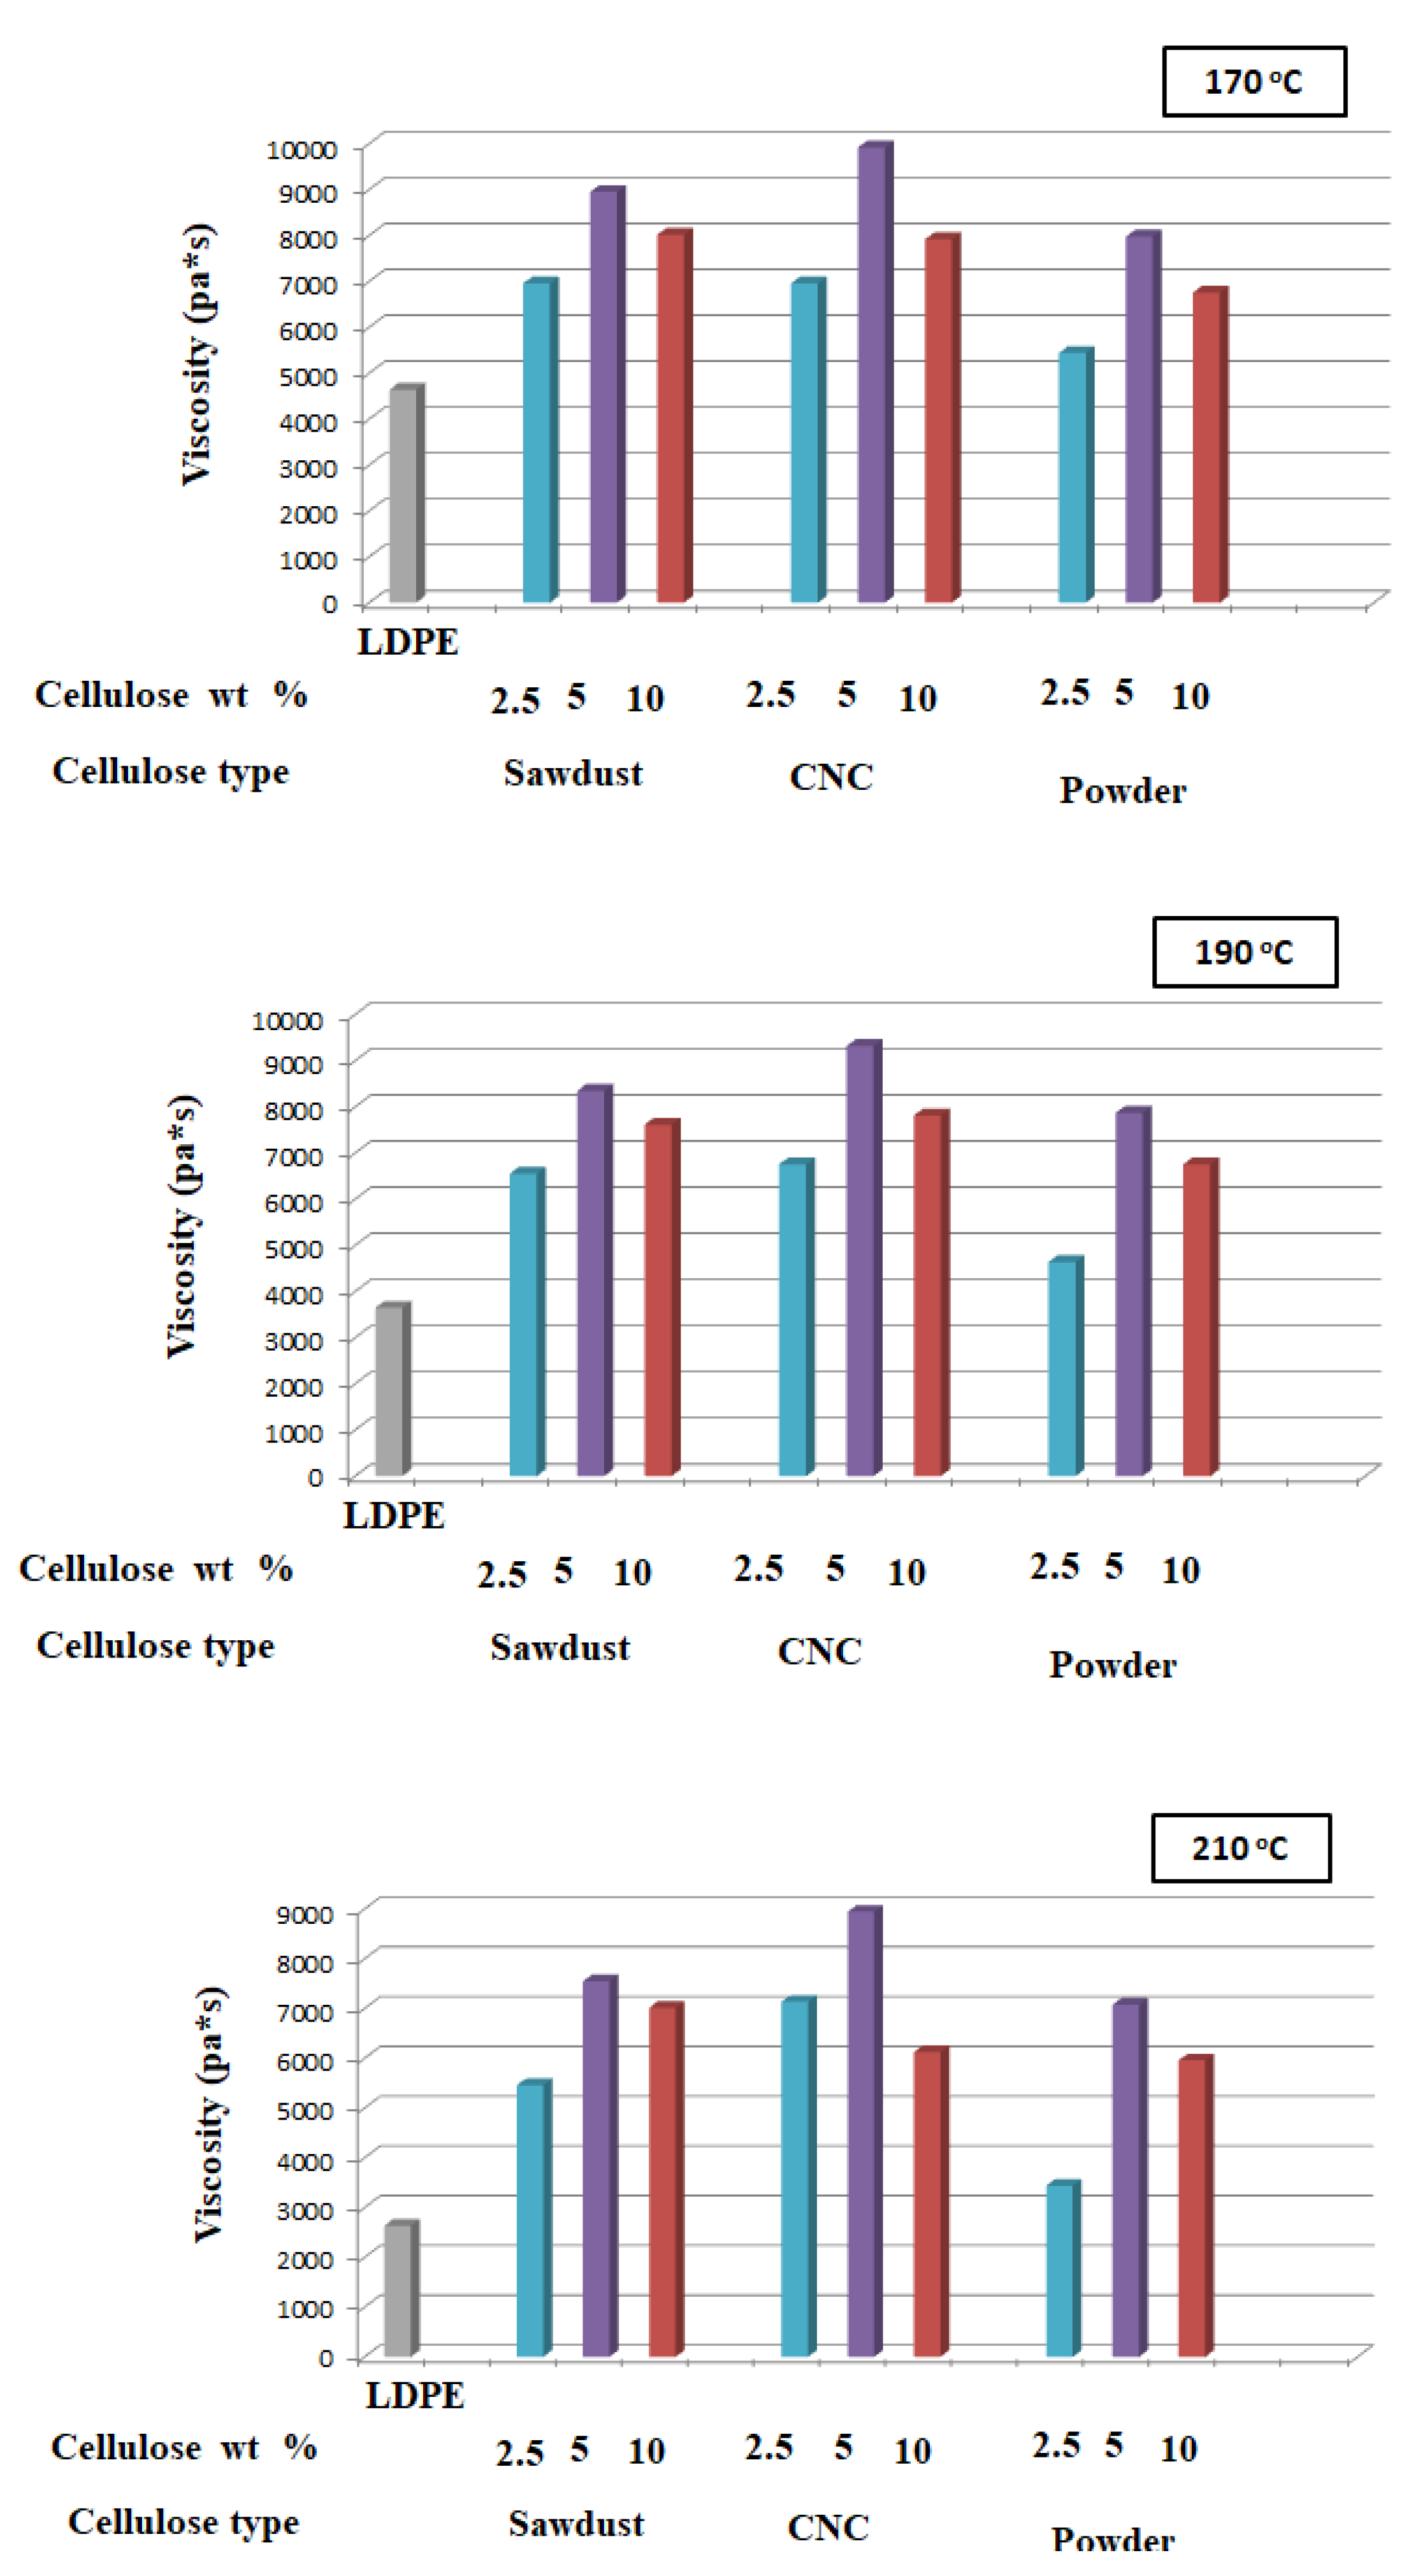
Figure 5.
Weight loss of LDPE and LDPE/cellulose additive composites after 30 days of soil burial at depths of 3 cm and 5 cm.
Figure 5.
Weight loss of LDPE and LDPE/cellulose additive composites after 30 days of soil burial at depths of 3 cm and 5 cm.
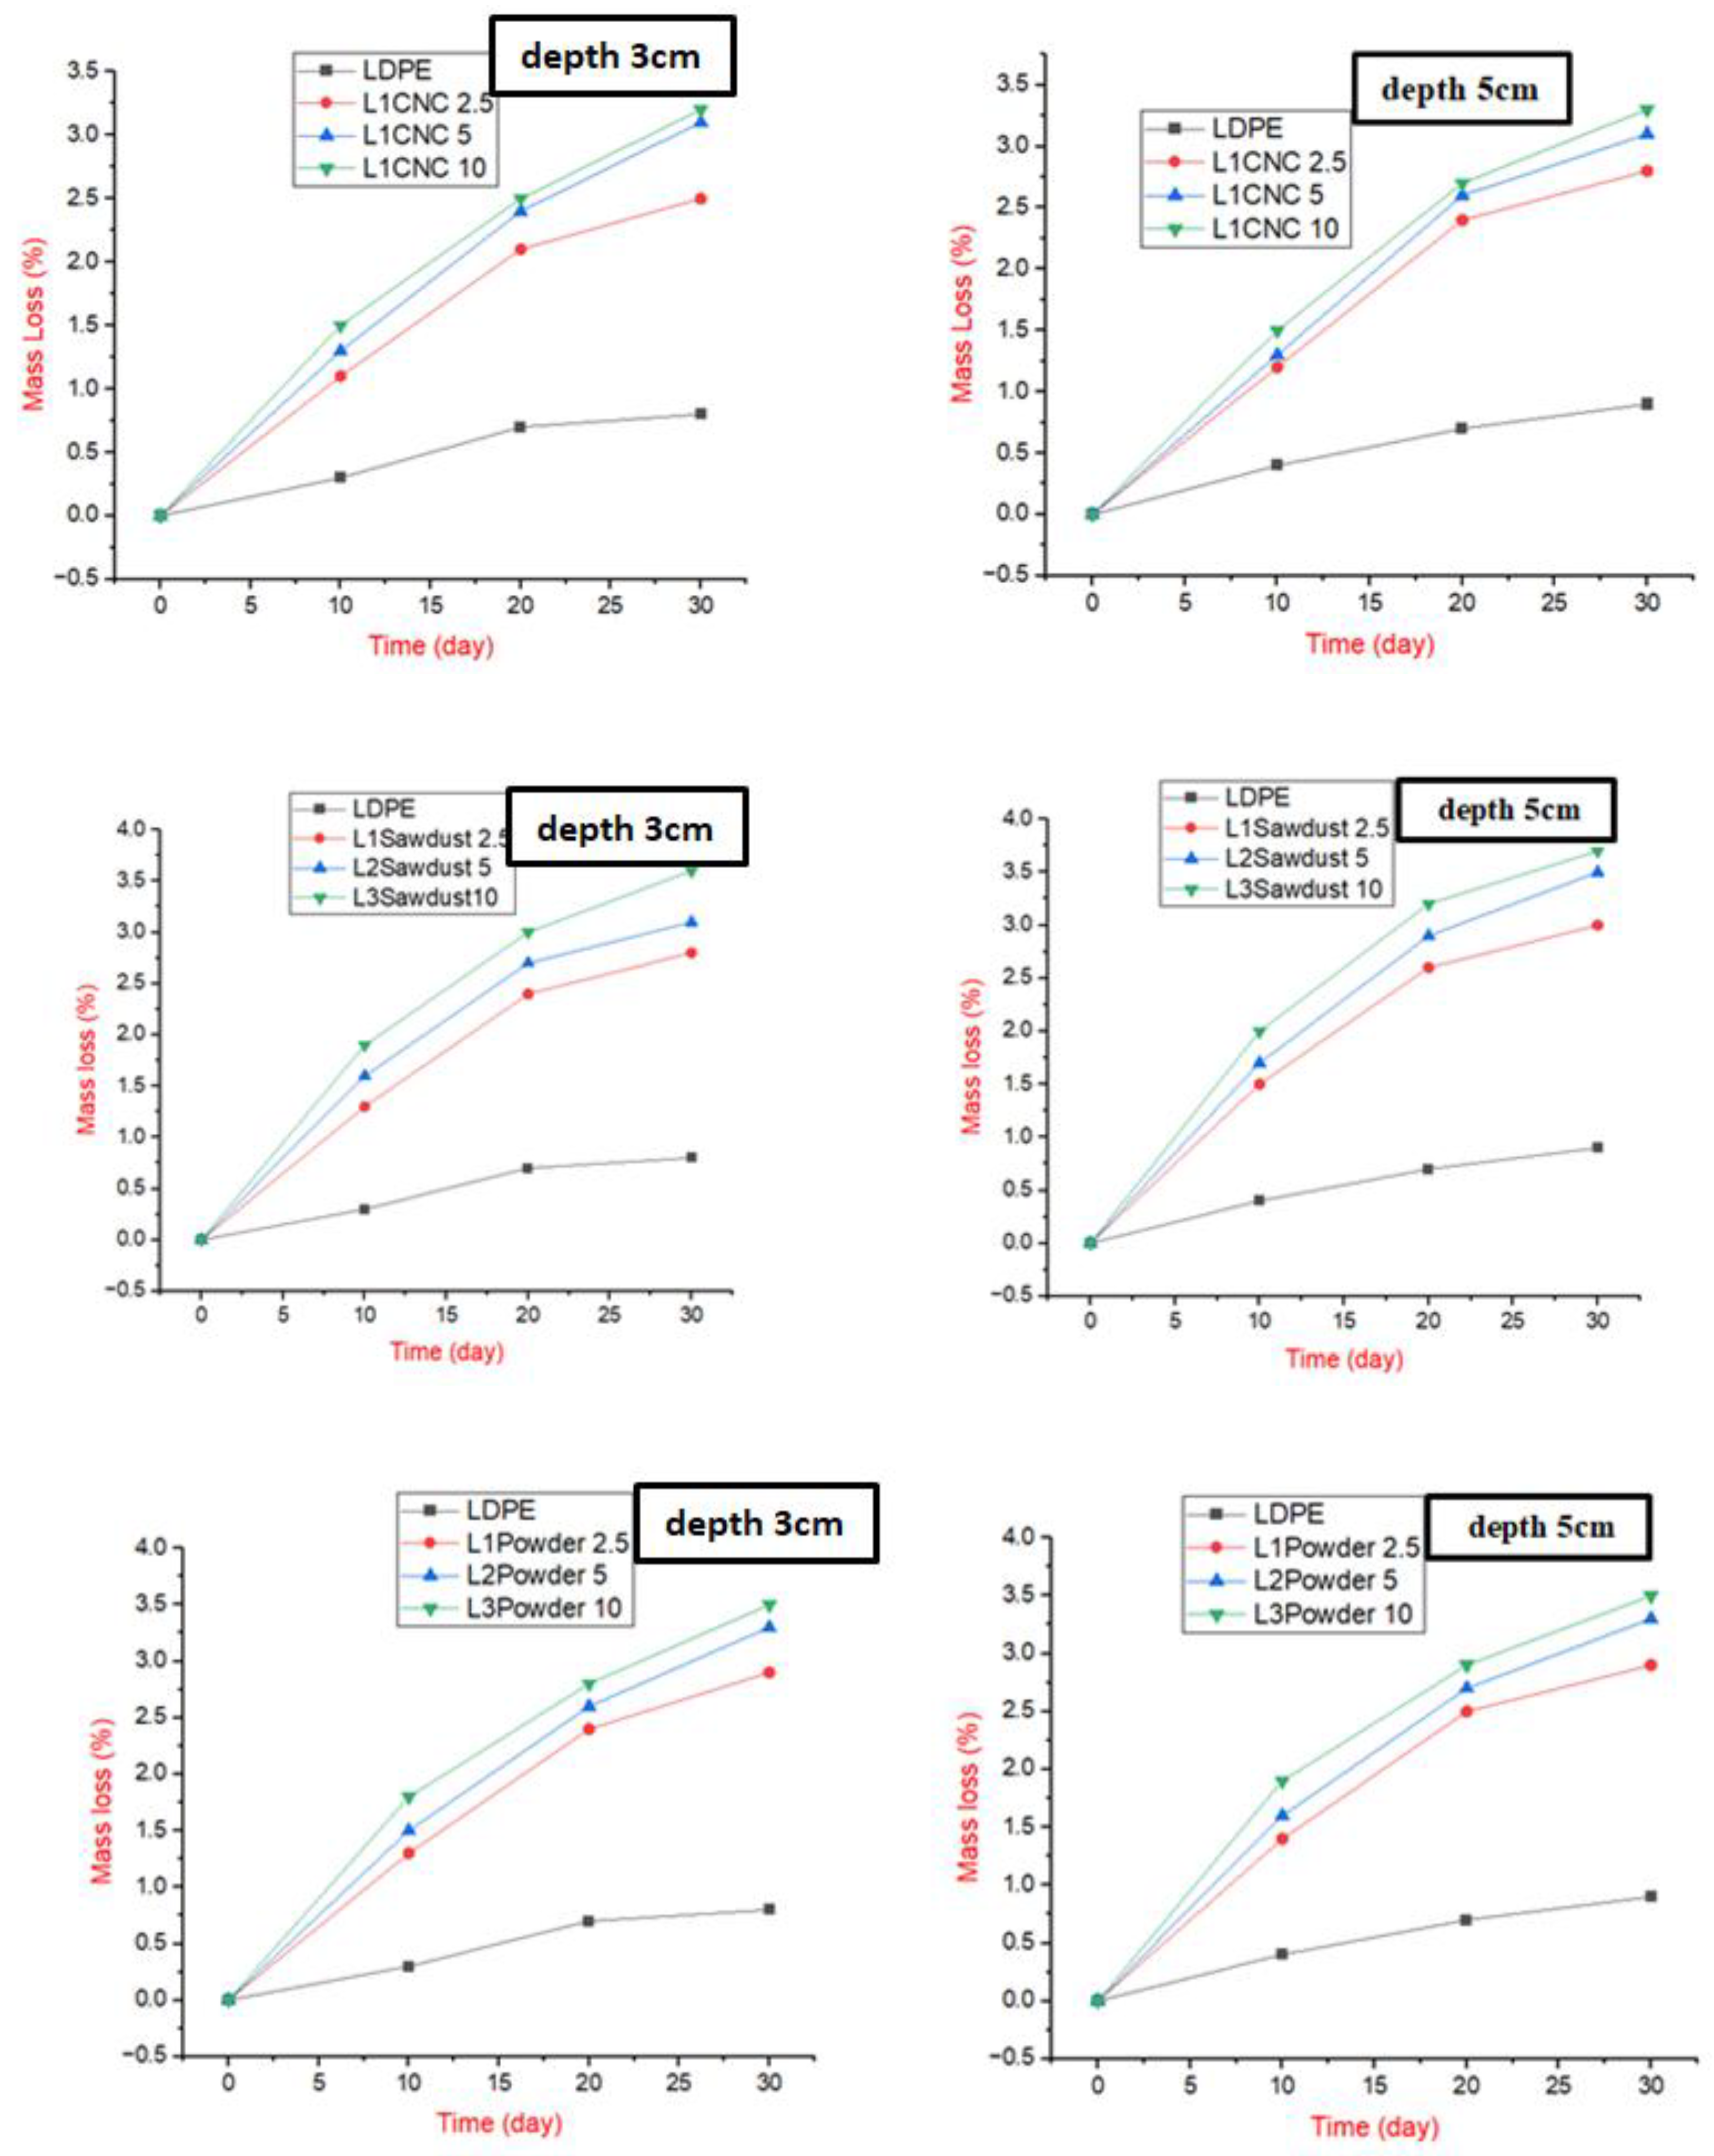
Figure 6.
Microscopic surface images at 1600x of pure LDPE and LDPE/Cellulose composites before and after burial at a 5 cm depth in the degradation test conducted over 30 days.
Figure 6.
Microscopic surface images at 1600x of pure LDPE and LDPE/Cellulose composites before and after burial at a 5 cm depth in the degradation test conducted over 30 days.
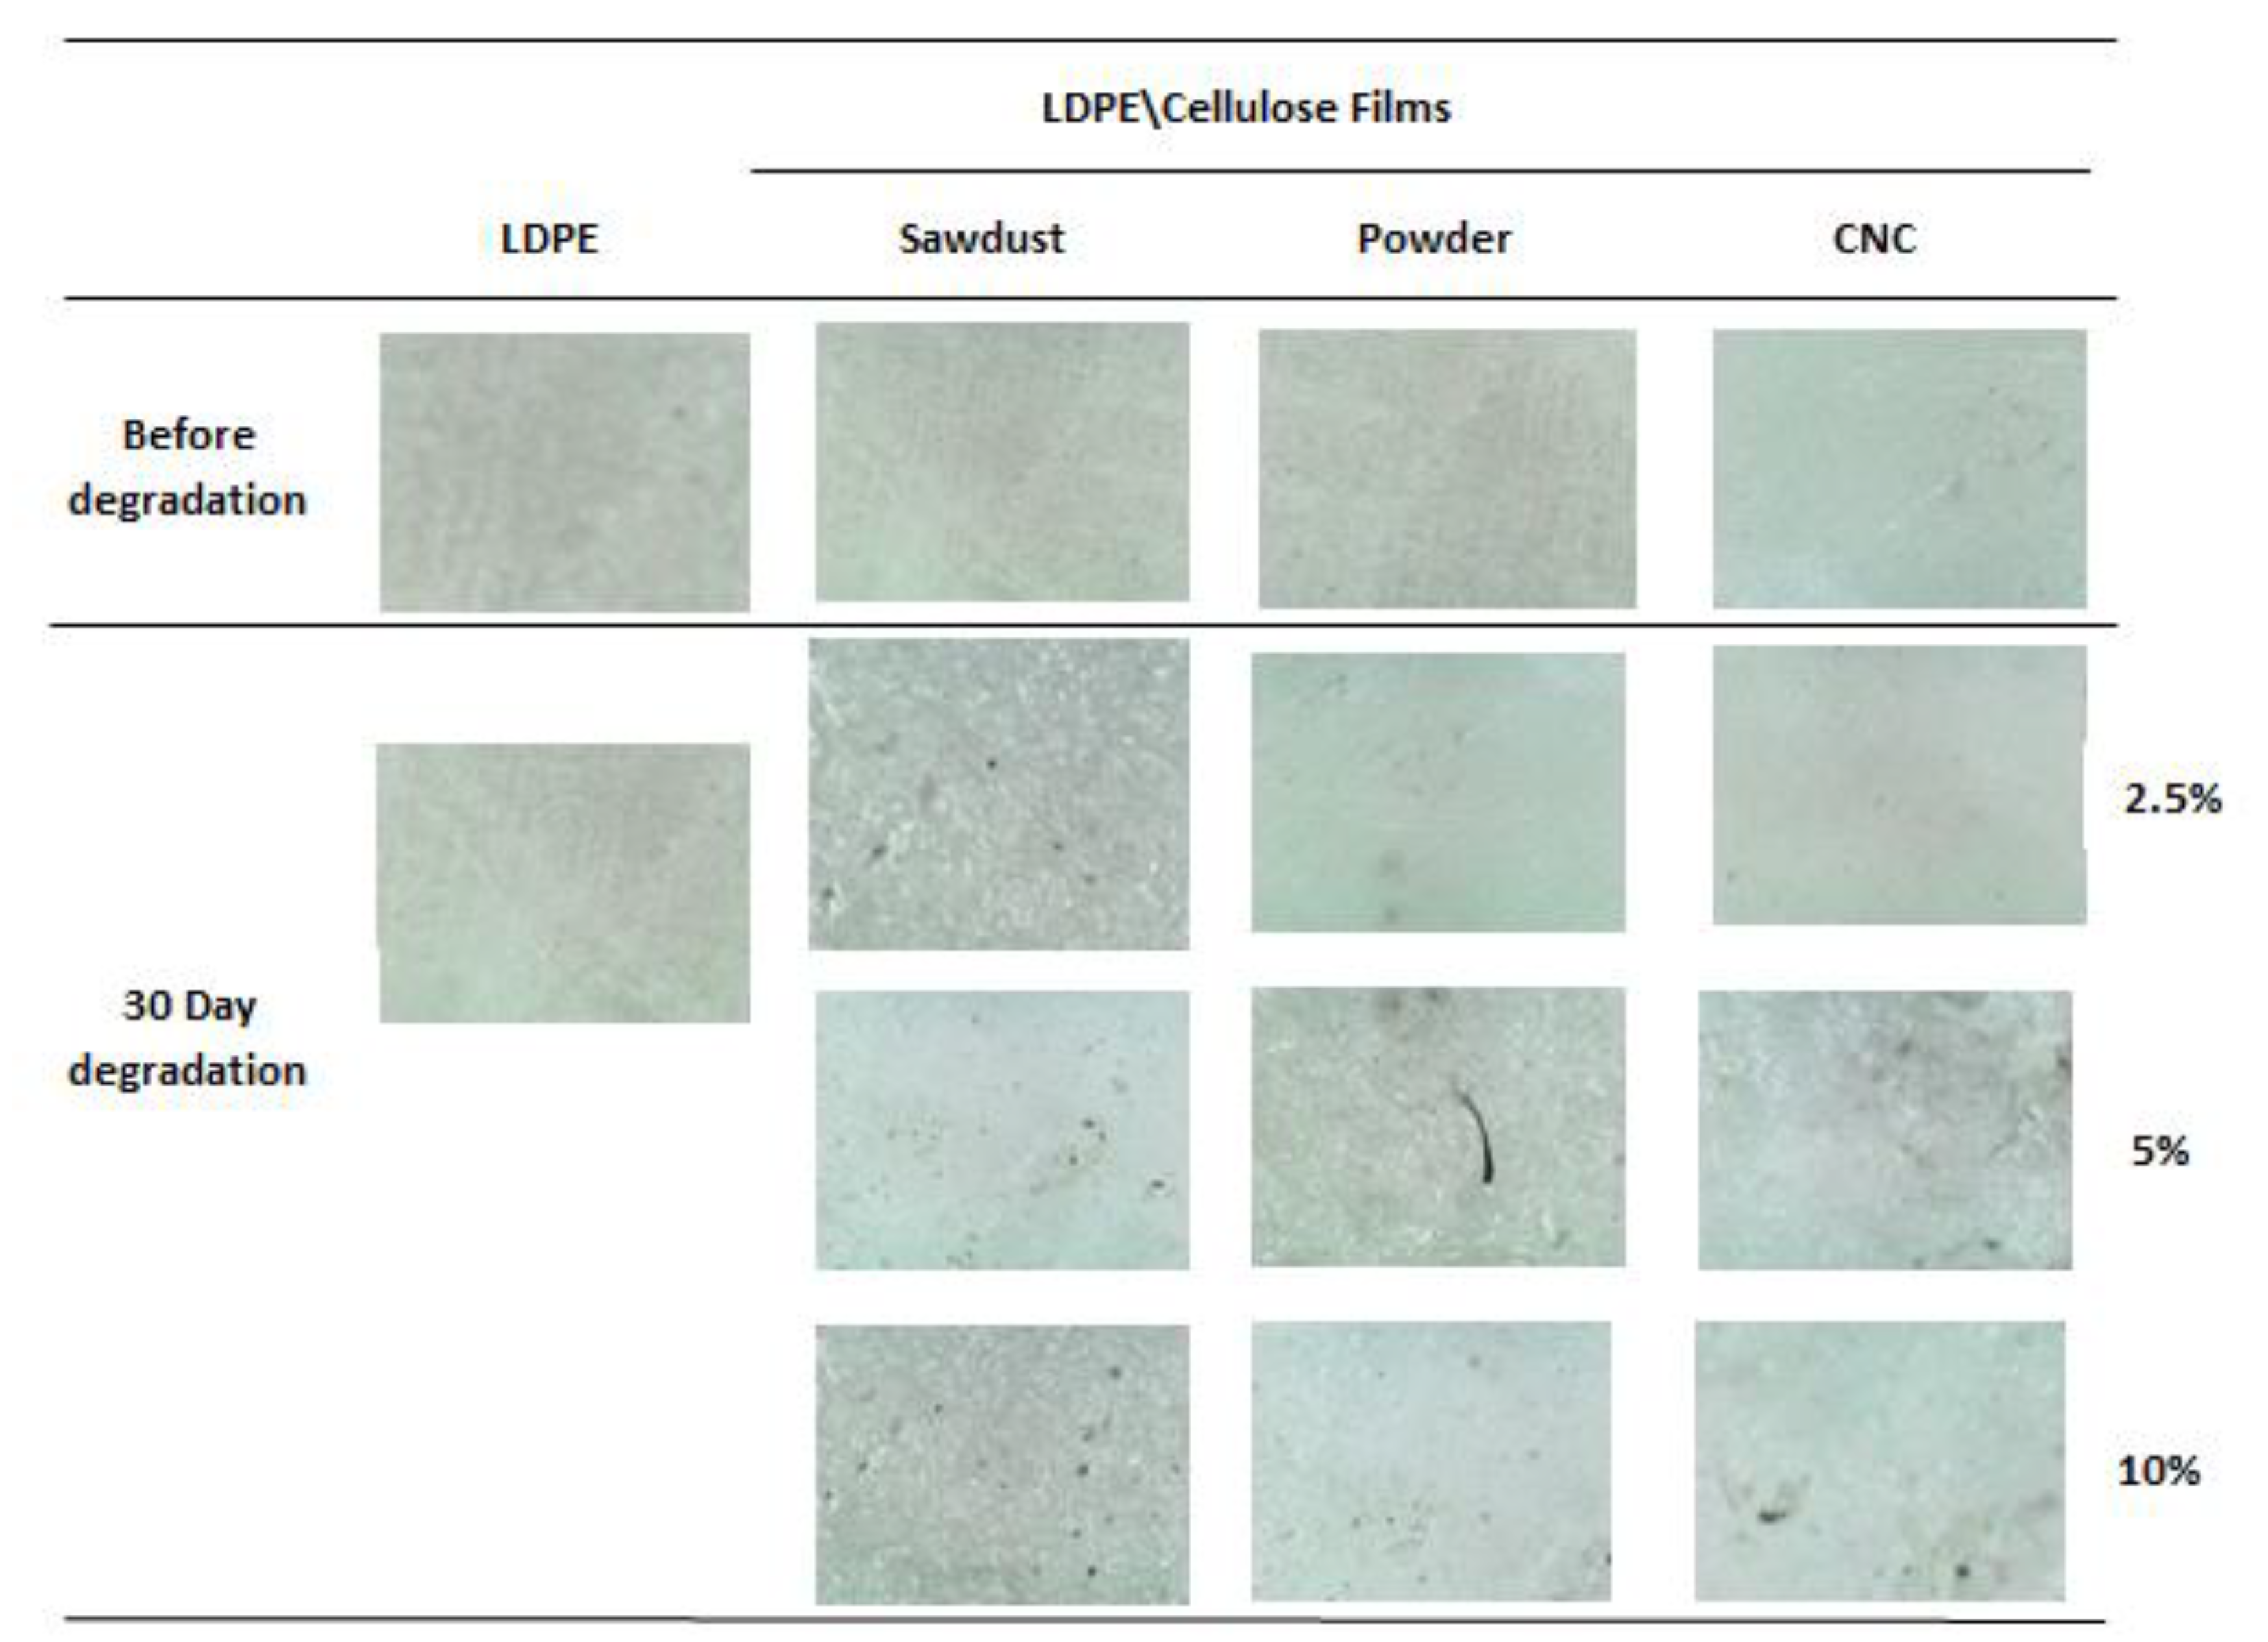
Table 1.
The value of screw speed, temperature, thickness and proportions of cellulose, LDPEgMA, and LDPE in different LDPE\ Cellulose additives (wt. %).
Table 1.
The value of screw speed, temperature, thickness and proportions of cellulose, LDPEgMA, and LDPE in different LDPE\ Cellulose additives (wt. %).
| Sample code | Cellulose wt.% | LDPE wt% | LDPEgMA wt. % | Screw Speed (rpm) | Temperature (◦C) | Thickness (µm) | |||||||
|---|---|---|---|---|---|---|---|---|---|---|---|---|---|
| LDPE | 0 | 98 | 2 | 50 | 190 | 25 | |||||||
| L1Sawdust 2.5 L1CNC 2.5 L1Powder 2.5 |
2.5 |
95.5 |
2 |
50 |
190 |
27 |
|||||||
| L2Sawdust 5 L2Powder 5 L2 CNC 5 |
5 |
93 |
2 |
50 |
190 |
28 |
|||||||
| L3Sawdust 10 L3Powder 10 L3CNC 10 |
10 |
88 |
2 |
50 |
190 |
25 |
|||||||
Disclaimer/Publisher’s Note: The statements, opinions and data contained in all publications are solely those of the individual author(s) and contributor(s) and not of MDPI and/or the editor(s). MDPI and/or the editor(s) disclaim responsibility for any injury to people or property resulting from any ideas, methods, instructions or products referred to in the content. |
© 2025 by the authors. Licensee MDPI, Basel, Switzerland. This article is an open access article distributed under the terms and conditions of the Creative Commons Attribution (CC BY) license (http://creativecommons.org/licenses/by/4.0/).
Copyright: This open access article is published under a Creative Commons CC BY 4.0 license, which permit the free download, distribution, and reuse, provided that the author and preprint are cited in any reuse.


