
Submitted:
13 March 2025
Posted:
14 March 2025
You are already at the latest version
Abstract
Upcycling horticulture residues offers a sustainable solution to reduce environmental impact, maximize resource utilization, mitigate climate change, and contribute to the circular economy. We synthesized and characterized fourteen natural deep eutectic solvents (NADESs) and applied them to upcycle horticulture residues offering an innovative valorization approach. With initial many factors at a time (MFAT) screening followed by a rotatable central composite response surface methodology (RCCRSM) for optimization, quadratic models fitted the response data for all the synthesized NADESs given: TPC (R2 = 0.984, p < 0.0001), TFC (R2= 0.9999, p < 0.0001), and AA- CUPRAC (R2 = 0.918, p < 0.0001), FRAP (R2 =1.000, P < 0001), and DPPH (R2 = 0.9992, p < 0.0001). Ultrasound temperature 45°C, extraction time 5 min, solvent volume 25 mL, and solvent concentration 90% (v/v) were considered the optimal conditions for maximum desirability (0.9936) of TPC yield; 30°C, 5 min, 25 ml, and 90% (v/v) for maximum desirability (0.9003) for TFC and CUPRAC with maximum desirability (1.00). The maximum desirability for FRAP was (0.9605) at conditions of 45°C, 25 min, 25 ml, and 50%, while DPPH with maximum desirability of (0.9313) had 50°C, 15 min, 15 mL, and 70% (v/v) as the optimized conditions respectively.
Keywords:
NADES
; antioxidants
; antiradical scavenging activity
; horticulture residues
; green solvents
; waste management
; environmental impacts
; innovative valorization approach
; climate change mitigation
; sustainability
; circular economy
1. Introduction
The growing concern over environmental sustainability has driven the need for innovative strategies to manage waste, particularly in industries such as horticulture, where large quantities of plant residues are produced annually[1]. Traditionally, these horticultural by-products, including leaves, stems, trimmings, stalks, and peels, are discarded, contributing to landfills and environmental degradation[2]. However, recent advances in green chemistry have introduced promising solutions, one of the most notable being the use of Natural Deep Eutectic Solvents (NADESs) for the valorization agrifood wastes including horticulture residues[3]. NADESs, a class of environmentally benign solvents, are composed of natural, biodegradable, and non-toxic components such as sugars, amino acids, organic acids, and salts[4]. These solvents exhibit remarkable properties, including tunable solubility, low toxicity, and the ability to dissolve a wide range of biomolecules, making them ideal candidates for efficient extraction processes[5].
The application of NADESs for upcycling horticultural residues represents a groundbreaking approach to valorizing plant waste. By harnessing the unique solvent properties of NADESs, valuable bioactive compounds, such as antioxidants, phenolic acids, essential oils and polysaccharides, can be extracted from horticultural waste with minimal environmental impact. This sustainable method not only mitigates the disposal of agricultural waste but also opens new avenues to produce bio-based products in sectors such as food, cosmetics, and pharmaceuticals. Moreover, the versatility of NADESs, coupled with their low environmental footprint, makes them a crucial tool in the development of a circular economy, where waste is transformed into valuable resources, reducing dependency on synthetic chemicals and promoting eco-friendly industrial processes.
In the present study, we synthesized fourteen different novel deep eutectic solvents (NADESs) using citric acid as hydrogen bond acceptor (HBA) and sucrose, fructose, glucose, glycerol, glycine, and xylitol as hydrogen bond donors (HBDs), and applied the NADESs in upcycling horticultural residues, exploring their potential to revolutionize waste management, enhance resource recovery, and contribute to a sustainable, green future. By integrating NADESs into the upcycling process, we can not only address the growing issues of horticultural waste but also create high-value products that benefit both the environment and society.
2. Materials and Methods
2.1. Materials
2.1.1. Chemicals
All the chemicals and solvents used were of analytical grade and standard grade. Citric acid monohydrate (≤ 100% purity), sucrose (99.8% purity), glucose monohydrate (99.0% purity), fructose (98.5-101.2% purity), xylitol (99% purity), glycerol (99-101% purity), sodium carbonate (99% purity), sodium acetate (99% purity), potassium acetate (99% purity), iron (iii) chloride hexahydrate (99% purity), and 2,2-Diphenyl-1-picrylhydrazyl (DPPH) (99% purity) were supplied by (Sigma‒Aldrich, Germany), Glycine (99% purity), and potassium persulfate (≥ 99% purity) were supplied by (Fluka Analytica, Germany), methanol (HPLC grade) (≥ 99.9% purity) was supplied by (Sigma‒Aldrich, France), ethanol (96% purity) was purchased from (Fillab, Bulgaria), ammonium acetate (≥ 98% purity) was supplied by (Sigma‒Aldrich, Netherlands), 2,4,6-tris(2-pyridyl)-s-triazine (TPTZ) (≥ 99% purity), and Folin-Ciocalteu’s phenol reagent were supplied by (Sigma‒Aldrich Switzerland), copper (ii) chloride (99% purity) was bought from (Sigma‒Aldrich United Kingdom), aluminum (iii) nitrate nonahydrate (98.5% purity) was purchased from (Chem-Lab NV Belgium), Neocuprine (99.9% purity) was supplied by (Sigma‒Aldrich Austria), (±)-6-hydroxy-2,5,7,8-tetramethylchromane-2-carboxylic acid (Trolox) (≥ 99% purity), 3,4,5-trihydroxybenzoic acid (Gallic acid) (99% purity) were purchased from (Sigma‒Aldrich Milan, Italy). Water was purified using a Milli-Q Plus 185 system from Millipore (Milford, MA, USA).
2.1.2. Horticulture Residue
The horticulture residue used in this study is the peels from dried seeds of African Nutmeg (Monodora myristica (Gaertn.) fruit from the 2022 harvest, which were purchased from Zuba Fruit Market, Abuja, Nigeria. The seeds were cleaned, packed under vacuum following WTO guidelines on sanitary and phytosanitary measures as provided by the Standards Organisation of Nigeria through (https://epingalert.org/), and brought to the Biotechnology Laboratory at the University of Food Technologies, Plovdiv, Bulgaria. In the laboratory, the seeds were peeled, and the peels were collected and ground with an electric coffee grinder. The ground peels were vacuum sealed and stored in a desiccator until further use[6].
2.2. Methodology
2.2.1. Preparation of Natural Deep Eutectic Solvents (NADESs)
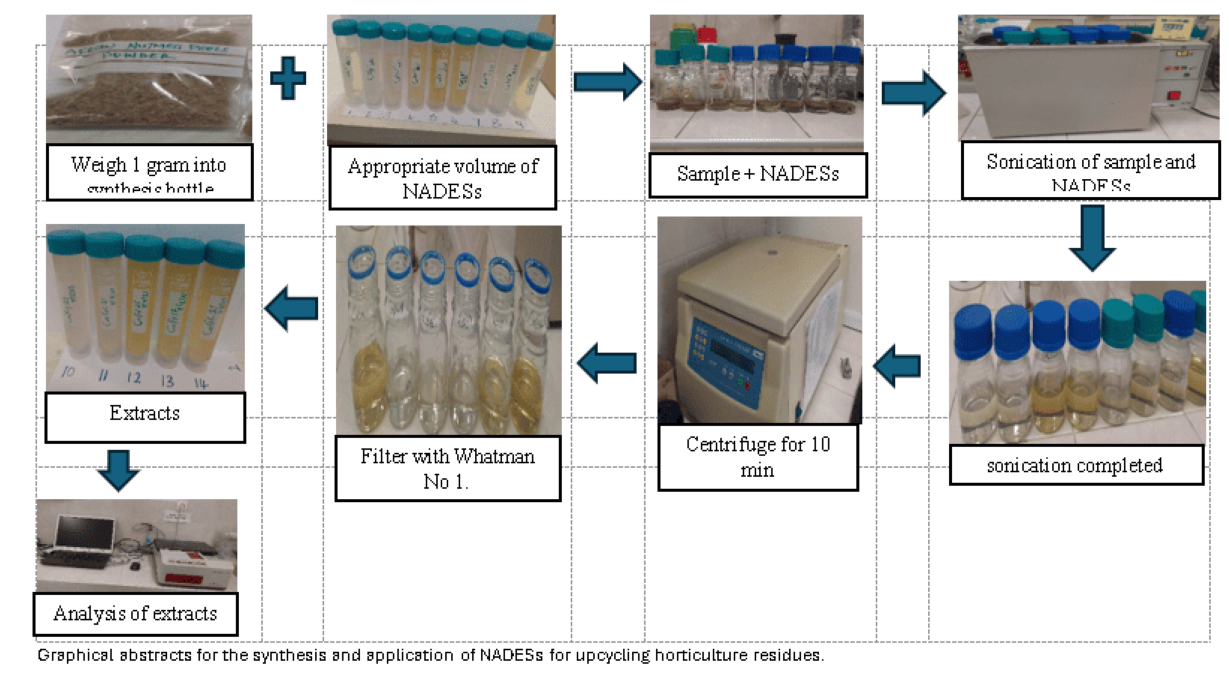
An ultrasound-assisted technique for the synthesis NADESs was first screened with a general factorial experimental design with three factors at three levels to obtain a total of 27 experimental runs as shown in Table 1 for coded and uncoded display. The NADESs were synthesized by weighing into synthesis bottles the designated mole ratios of the HBA and HBD (1:1, 1:2, 2:1), then 5 ml of water was added to moisten the two materials. The bottle was vigorously shaken to mix them into a homogenous mixture before sonicating in an ultrasonic bath operated at a frequency of 35kHz with maximum input power of 240 w (USTS 5.7150 Siel, Gabrovo, Bulgaria) at three designed temperatures (50, 70, 90 °C) and three designated times (60, 90, 120 min) with intermittent vigorous stirring to achieve uniformity. The three sonication temperatures, and three sonication times were selected for the synthesis based on information found in the literature for the synthesis of NADESs using heating and stirring (3-6 h)[7,8,9,10]; rotary evaporation (1-3 h)[11,12]; freeze-drying (24-48 h)[11]; and microwave radiation (0.25-0.75 h)[13,14]. At the end of each synthesis time using the corresponding temperature, the solvent was observed for proper and complete solvation. Those that didn’t solvate incomplete were further sonicated for a quarter of the experimental time at that temperature. After the extra sonication, those that failed to form clear solvents were discarded. The synthesis was taken to be successful when clear solutions were obtained after 24 h of sonication, cooling and storing in a desiccator to minimize moisture absorption. The temperature and time values that were appropriate from the screening study were then applied to different HBA:HBD ratios following the same steps. Using an infrared drier, the water contents in the solvents were measured depending on the molar ratio and the type of HBD used.
2.2.2. Characterization of NADESs
The synthesized NADESs were characterizing to understand their physical, chemical, and thermodynamic properties, which can vary significantly depending on their components and composition. Specifically, the density, viscosity, water activity, pH, and the molecular interactions within the NADESs were measured to properly characterize the solvents.
2.2.2.1. Density
Density measurements help in understanding the intermolecular interactions within the NADES and how the components' molecular weights and structure impact the overall density of the solvent. This information is valuable for calculating the solvent's potential to dissolve various solutes. In this study, the density of the samples was measured at 25°C in triplicate using a glass pycnometer following equation (1):
where:
ρs = density of sample; d = relative density of the sample to water = ms/mw; ρw = 0.997 at 25°C taken from appropriate table.
2.2.2.2. Water Activity
A digital water activity meter AMTAST WA-60A (China) was used to measure the water activity of the samples in triplicate at 25°C.
2.2.2.3. Viscosity
The viscosity of NADESs is a critical property for their performance in various applications, such as extraction and catalysis. Viscosity measurements, typically conducted using rheometers or viscometers, reveal how the molecular structure and the ratio of components influence the flow behavior. The viscosity of the samples at 25°C was measured in triplicate using a glass pycnometer and calculated using equation (2):
where:
ɳs = viscosity of sample in [pa. s]; ts = average time for which the sample flows out (s); ɳw = viscosity of distilled water obtained from table (0.89 mpa. s at 25°C); ρw = density of distilled water obtained from table (0.997 kg/m3 at 25°C); tw = average time for which the water flows out (s).
2.2.2.4. pH
An Orion 2 digital pH meter Thermo Scientific (Germany) was used to measure the pH of the synthesized NADESs in triplicates at 25°C.
2.2.2.5. Spectroscopic Technique
Infrared spectroscopy (FTIR) was used to investigate the molecular interactions within the NADESs. This technique helps to identify the nature of solute-solvent interactions, the presence of any functional groups in the solvent mixture, and the hydrogen bonding which is a principal characteristic of NADES structure.
2.3. Application of NADESs for Bioactive Molecule Extraction
2.3.1. Experimental Design
A many factor at a time (MFAT) screening design with 24 fractional factorial experiment (FFE) of eight (8) corners and two (2) central points was carried out to study the effects of the extraction conditions on the phenolic content and the antioxidant activity of the African nutmeg peels (ANP) extracts (Table 2), and the process further developed with a rotatable central composite response surface methodology (RCCRSM) with four factors at five levels, following the desirability function where maximal extraction and antiradical activities were the desired outcomes. The RCCRSM design is presented in Table 3. The extraction yield was calculated with equation (3), with equation 4 used to determine the level of the independent factors.
The independent variables chosen are temperature (UT), time (ET), volume (SV), and concentration (SC), while the dependent variables are total phenolic content (TPC), total flavonoid content (TFC), cupric ion reducing antioxidant capacity (CUPRAC), ferric reducing antioxidant power (FRAP) and 2,2-Diphenyl-2-picrylhydrazyl (DPPH) inhibition. A total of ninety experimental runs with forty-eight cube points, eighteen center points (twelve on cube, and six on axial), and twenty-four axial points were performed based on rotatable central composite design of thirty base experiments replicated three times. The RCCRSM was chosen because orthogonality was absent among the models from our prior investigations [[3]], leading us to select the RCCRSM for its efficiency in optimization experiments under such conditions, as described by Montgomery[15].
Where:
βo is the intercept, βi is the linear slope, βii is the quadratic slope and βij is the interaction slope, all relative to the dependent variable Y. Xi and Xj are the levels of the independent variables coded according to equation (4)
Where:
xi and Xi represents the real and coded values of the independent variables i respectively, xmi represents the value of the independent variable i at the central point and Δxi refers to the step change of the independent variable i.
2.3.2. Optimization
To optimize the operational parameters involved in the extraction process, the desirability function methodology[16,17] was used. The main concept of this method is to calculate a desirability value for each of the k responses as an indicator of how closely the fitted value aligns with the desired value at the optimal factor settings. These individual desirability values are then combined to create an overall desirability for a set of k response variables. The desirability function operates on a scale ranging from zero, representing a completely undesirable response, to one, indicating a fully desired outcome.
In the present study, the optimization objective is to simultaneously maximize the responses of TPC, TFC, and AA measured by CUPRAC and FRAP, with respect to the independent variables: UT, ET, SV, and SC. For each of the three responses, the minimum and maximum acceptable values correspond to the minimum and maximum experimental values obtained from the extraction experiments. Predicted values obtained from the model of the response k (yk) were converted to individual desirability values (dk) with equation (5):
Where:
ykmin and ykmax are the minimum and maximum acceptable values of the response k, respectively. The overall desirability function (D) is defined as the geometric mean of the three individual desirability functions (d1, d2 and d3), given by equation (6):
2.4. Extraction Procedure
Ground ANP (1.0 g) were weighed into synthesis bottles, and an appropriate volume of appropriate solvent (NADES) diluted with distilled water to achieve the appropriate concentration was added. The samples were irradiated at the designed temperature and time using an ultrasonic bath operated at a frequency of 35 kHz with a maximum input power of 240 W (USTS 5.7-150 Siel, Gabrovo, Bulgaria) with automatic temperature control. At the end of each extraction, the bottles were removed from the bath, contents transferred to centrifuge tubes and centrifuged at 4500 rpm for 10 minutes (centrifuge MPW-260R Labtech, Germany). The supernatants were further filtered into solvent bottles using Whatman No.1 filter paper (11 µm pore size). The bottles were sealed and kept in a refrigerator at -4°C until further analysis.
2.5. Antioxidant Power
2.5.1. Total Phenolic Content (TPC)
The TPC assay was performed spectrophotometrically by modifying the Folin–Ciocalteu’s (F-C) reagent method presented in Ianni et al., [18]. In a reaction tube, 0.1 mL of extract samples were mixed with 0.5 ml of F-C reagent. After approximately 1 min, 0.4 mL of 7.5% Na2CO3 was added, the mixture was incubated at 50°C for 5 min, and the absorbance was measured in a microplate reader (SPECTROstar Nano Microplate Reader, BMG LABTECH, Ortenberg, Germany) at 765 nm against appropriate blank sample, and the TPC evaluated using a gallic acid standard curve and reported in mgGAE/g dry weight of sample using Equation (7):
Where:
Y = Area of standard curve measured at 765 nm; B = Weight of sample used in the extraction; C = Volume of solvent used in the extraction; D = Dilution factor (where applicable); DW= Dry weight of sample
2.5.2. Total Flavonoid Content (TFC)
The TFC was evaluated according to the method described in Kivrak et al., with minor adjustments [19]. In Eppendorf tubes (2 mL), aliquots of 0.25 mL of the extracts were added to 0.025 mL of 10% Al(NO2)3, 0.025 mL of 1 M CH3COOK, and 0.95 mL of ethanol. The mixture was incubated at room temperature (RT) for 40 min, after which the absorbance was read at 415 nm in a microplate reader (SPECTROstar Nano Microplate Reader, BMG LABTECH, Ortenberg, Germany) against the designated blank control. The TFC calibration curve was determined by relying on the quercetin equivalence (QE) and was used as a standard to calibrate and standardize the spectrophotometric measurements.
Equation 8 was used to determine and express the TFC in microgram equivalent of quercetin per gram of dry sample (µgQE/g, DW):
Where:
Y = Area of the standard curve measured at 415 nm; B = Weight of sample used in the extraction; C = Volume of solvent used in the extraction; D = Dilution factor (where applicable)
2.6. Antiradical scavenging activities
2.6.1. Ferric Reducing Antioxidant Power (FRAP)
The FRAP assay was carried out according to the procedure of Benzie and Strain as slightly modified in subsequent studies[20,21]. The FRAP reagent was prepared fresh each day and warmed up to 37°C before use. The FRAP reagent consists of (1) 300 mM acetate buffer (pH 3.6), (2) TPTZ (10 mM in 40 mM HCl), and (3) (FeCl3.6H2O, 20 mM). Solutions (1), (2), and (3) were mixed at a ratio of 10:1:1 to form the FRAP reagent. In a 15 mL tube, 2.85 mL of freshly prepared and warmed FRAP reagent was blended with 0.15 mL of sample and incubated at 37°C for 4 min, after which the absorbance was measured at 593 nm in a microplate reader (SPECTROstar Nano Microplate Reader, BMG LABTECH, Ortenberg, Germany) against the appropriate blank. The result is expressed as µMTE/g dry sample derived from Equation (9):
Where:
Y = Area of standard curve measurement at 593 nm; B = Weight of sample used in the extraction; C = Volume of solvent used in the extraction; D = Dilution factor where applicable.
2.6.2. Cupric Ion Reducing Antioxidant Capacity (CUPRAC) Assay
The CUPRAC assay was performed according to the procedure of Apak et al., as described in Akyuz et al.[22,23] with slight modifications. Briefly, 0.25 mL of 1.0 × 10⁻² M copper (II) chloride solution, 7.5 × 10⁻³ M Neocuprine (Nc), 1 M CH2COONH4 buffer (pH 7.0) solution, and distilled water were mixed in a 2 mL Eppendorf tube, after which 0.025 mL sample was added and mixed. The resultant mixtures were allowed to stand at RT for 30 min to incubate. At the end of the incubation period, the absorbance was measured at 450 nm against the blank using a microplate reader (SPECTROstar Nano Microplate Reader, BMG LABTECH, Ortenberg, Germany). Trolox was used to prepare a standard curve, and the total antioxidant capacities of the samples were calculated following Equations (10) and are expressed as μMTE/g dry weight (DW):
Where:
Y = Area of the standard curve measured at 450 nm; B = Weight of sample used in the extraction; C = Volume of solvent used in the extraction; D = Dilution factor where applicable
2.6.3. 2,2-Diphenyl-2-Picrylhydrazyl (DPPH) Assay
The antiradical scavenging activity of the extracts was performed by using 2,2-diphenyl-2-picrylhydrazyl (DPPH) based on the method of Brands-Williams et al. [24] with adjustments for specificity to our samples. To prepare the DPPH stock solution, we dissolved 24 mg of DPPH in 100 mL of methanol. This solution was then diluted to achieve the absorbance of 1 ± 0.02 using the spectrophotometer (SPECTROstar Nano Microplate Reader, BMG LABTECH, Ortenberg, Germany). For the assay, we combined forty microliters of extract with 3 mL of the prepared DPPH working solution and kept in the dark for 30 min at room temperature. Subsequently, we measured the absorbance at 515 nm using a spectrophotometer (SPECTROstar Nano Microplate Reader, BMG LABTECH, Ortenberg, Germany), to assess the reduction in DPPH concentration, indicative of the antiradical activity (ARA) utilizing equation (11):
Where:
ARA (%) = Antiradical activity; AC = absorbance of control; AS = absorbance of sample.
2.7. Statistical Analysis
The analysis of variance technique was used to calculate the RCCRSD statistical parameters. For building the model, calculating the predicted values and optimal desirability for each of the solvents, plotting three-dimensional surface graphs to show the effects of independent variables on the response factors, calculating regression equations for the best-fitted model having non-significant lack of fit with effect to pure error, the response optimizer, and every other data analysis, Minitab statistical software 21.4.0 (Minitab LLC, Penn, USA) was used. The Fisher least significant difference (LSD) test value (F-value), coefficient of determination R2, and lack of fit were used to determine the quality and adequacy of the model at (p > 0.05).
3. Results
3.1. Synthesis of NADESs
The NADESs were synthesized with citric acid as HBA and sucrose, fructose, xylitol, glycerol, glycine, and glucose as HBDs at three different molar ratios: 1:1, 1:2, and 2:1 respectively. Based on the preliminary studies other molar ratios were eliminated from the study. In the preliminary investigation, three ultrasonic temperature ranges (50°C, 70°C, and 90°C), three-time intervals (60 min, 45 min, and 30 min), and six molar ratios of HBA and HBD (1:1, 1:2, 1:3, 2:1, 2:3, 3:1) were tested before selecting the promising molar ratios and operating temperature and time. Table 4 shows the fourteen NADESs that were successfully synthesized from the study.
3.2. Characterization of NADESs
3.2.1. Physical Properties
The physical properties (density, water activity, viscosity, & pH) of the synthesized NADESs were measured in triplicates and analyzed using a one-way analysis of variance and Fisher’s least significant difference (LSD) to compare and separate the NADESs into groups to further investigate if similarity in the physical properties could lead to similarity in performance of the solvents during application. The physical properties of the synthesized NADESs are shown in Table 5.
3.2.2. Molecular Properties
FT-IR spectroscopy was employed to identify the chemical structure of the NADES and validate the presence of bonds between hydrogen bond donor and acceptor in NADES molecules. FTIR analysis has been used to identify chemical structures and confirm the existence of intermolecular bonds among the individual components of mixtures. In this study, Citric acid was used as the hydrogen bond acceptor, while sucrose, fructose, xylitol, glycerol, glycine, and glucose were applied as hydrogen bond donors respectively. The synthesized NADESs show the presence of the following prominent characteristic functional groups in the FTIR peaks: OH (3400−3200 cm-1), CH (3000-2800 cm-1), and so on, and are presented in Table 6.
3.3. Application of NADESs for Extraction
3.3.1. Extraction Yields
A multifactorial (MFAT) model was first designed to investigate the effects of conditions on the capacity of the synthesized NADESs in extracting bioactive compounds from ANP. The antioxidant and antiradical scavenging activities of the extracts at the applied conditions were also investigated. The use of MFAT model in NADES-UAE study highlights an innovative approach, bridging the gap between traditional extraction methods and modern, sustainable techniques. The antioxidant capacity was measured in terms of total polyphenol content (TPC) and total flavonoid content (TFC) via spectrophotometric methods. The antiradical scavenging power of the extracts were analyzed via the cupric ion reducing antioxidant capacity (CUPRAC) assay and the ferric reducing antioxidant power (FRAP) assay. The result of the MFAT modeling is presented in Table 7.
3.3.2. Effects of Extraction Conditions on Antioxidant Yield
Different factors affecting the efficiency of NADES-UAE extraction include the temperature (UT), time (ET), volume (SV), and concentration (SC) were studied together on the yield of the antioxidants using an MFAT model.
3.3.2.1. Effects of Extraction Conditions on TPC
Figure 1 shows the TPC of extracts from ANP using the synthesized NADESs. Extraction efficiency of all the synthesized NADESs differ significantly based on extraction conditions. CaFr12 and CaFr11 (908 mg GAE/g DW and 860 mg GAE/g DW, respectively showed superior TPC extraction efficiency at conditions of UT 40°C, ET 20 min, SV 20 ml, and SC60%, while the least efficient TPC extraction conditions were UT 40°c, ET 10 min, SV 20 ml, and SC80% respectively which yielded less than 100 mg GAE/g DW across most of the synthesized NADESs.
In relation to the influence of the HBD and/or HBA:HBD ratios used to prepare the NADES on TPC extraction, the use of fructose shows the best among the HBDs used while the ratios of 1:1 and 1:2 of HBA: HBD is a good combination.
3.3.2.2. Effects of Extraction Conditions of TFC
The effects of extraction conditions on TFC of ANP is presented in Figure 2. In terms of TFC, the most efficient conditions for extraction were UT 40°C, ET 10 min, SV 20 ml, and SC80% respectively. Moreover, NADESs synthesized with different HBDs showed outstanding efficiency at the above conditions for TFC extraction as can be seen with CaFr11, Caxy12, CaGc11, and CaGc21, yielding above 800 µg/g QE DW respectively. However, the best performing NADES for TFC extraction is CaGc11 which yields more than 1200 µg/g QE DW.
3.3.3. Effects of Extraction Conditions on Antiradical Scavenging Activity
Effects of the various extraction conditions on antiradical scavenging activity of the extracts were equally elucidated using the same MFAT model.
3.3.3.1. Effects of Extraction Conditions on FRAP
High antiradical scavenging activity across the synthesized NADESs as measured with FRAP was observed with extraction condition of UT 40°C, ET 20 min, SV 20 ml, and SC60% and extracts from CaXy11 having the highest antiradical scavenging activity of 14 μmol/gTE db of sample at that condition. The antiradical scavenging activity measured by FRAP method is presented in Figure 3.
3.3.3.2. Effects of Extraction Conditions on CUPRAC
The antiradical scavenging activity of extracts from ANP at different NADES-UAE extraction conditions measured with CUPRAC method showed UT 40°C, ET 10 min, SV 20, and SC 80% respectively as the best conditions for efficient antiradical scavenging. CaFr11 showed to have the highest radical activity of 12 μmol/g TE db of extracts at those conditions. The CUPRAC result is presented in Figure 4.
3.4. Rotatable Central Composite Response Surface Methodology (RCCRSM)
A rotatable central composite RSM design was used to model the extraction process and validate the effects of extraction conditions (UT, ET, SV, and SC) on the response variables TPC, TFC, and antiradical scavenging activity (CUPRAC, FRAP, and DPPH) of ANP by NADES-UAE extraction technique. From the MFAT screening experiments, the conditions responsible for the extraction and antiradical scavenging were established. However, an RCCRSM design was carried out to fully study and understand the experiment’s directional focus, and effects of every interaction of the factors to fully model and optimize the process. The result of the RCCRSM experiments is presented in Table 8, using CaFr12 to represent all the synthesized NADESs. From Table 8, TPC varied from 100±1.47 mg GAE/g DW to 695.42±2.83 mg GAE/g DW, TFC varied from 60.026±1.19 µg QE/g DW to 1313±3.61 µg QE/g DW. Antiradical scavenging activity measured with CUPRAC varied from 3.0895±0.01 µmol TE/g DW to 15.4877±0.14 µmol TE/g DW, antiradical scavenging activity measured with FRAP varied from 0.521±0.346 µmol TE/g DW to 10.267±0.018 µmol TE/g DW, and antiradical scavenging activity measured with DPPH varied from 1.51±0.1% DW to 89.6±0.1% DW respectively. Table 9 presents the summary of ANOVA results for the five response variables. On the one hand, the five models (one for each of the response variables) showed p-values lower than 0.0001 which means that the models are highly significant. On the other hand, the insignificant lack of fit values (p > 0.05) indicates that each of the models are adequate to predict the corresponding response. Table 10 shows the regression coefficients (in coded variables) and the coefficients of determination for the TPC, TFC, CUPRAC, FRAP, and DPPH models for all significant terms (p < 0.05). The five models indicate high values of coefficient of determination (R2) and adjusted coefficient of determination (R2adj). The values of the predicted coefficient of determination (R2pred) were in good agreement with (R2adj). This indicates a high degree of correlation between experimental and predicted values for the five models.
As can be seen from Table 10, TPC was positively influenced by all main factors, the squares of temperature, time, and concentration, but negatively influenced by a quadratic volume, and all factor interaction. TFC was positively influenced by time, volume, & concentration; quadratic temperature & time; interactions between temperature with volume, temperature with concentration, and volume with concentration, but negatively influenced by temperature; squared volume, and concentration; interactions of temperature with time, time with volume, and volume with concentration. All squared factors; interactions of temperature with concentration, and volume with concentration positively influenced the efficiency of CUPRAC. However, all main factors; interaction of temperature with time, temperature with volume, time with volume, and time with concentration exerted negative influence on CUPRAC efficiency. In the case of FRAP, time, volume, all squared factors, interaction of temperature with concentration and time with volume had positive effects, while temperature, concentration, interaction of temperature with time, temperature with volume, time with concentration, and volume with concentration all had negative effects on FRAP efficacy. Antiradical activity measured by DPPH showed all main factors to positively influence its efficiency, while all squared factors, interactions of temperature with time, temperature with volume, and temperature with concentration had negative effects on the antiradical potential of extracts measured by DPPH method.
The model equations for the five response variables coded as Y1-Y5 are presented as equations 12-16. Where Y1 is TPC, Y2 is TFC, Y3 is CUPRAC, Y4 is FRAP, and Y5 is DPPH respectively.
3.5. Optimization of the Extraction Conditions and Validation of the Models
Numeric optimization of responses was carried out by desirability function following equations (5) and (6) as already described in the methodology section. Optimization was carried out with the goal set to maximize the total phenolic content, total flavonoid content, and the antiradical scavenging activity using the independent variables of UT, ET, SV, and SC in the ranges that were used in the rotatable central composite response surface experiments. Five different solutions were calculated by Minitab software with different levels of independent variables with good desirability. To verify the models obtained through RSM, nine extractions were performed under the conditions that predicted maximum desirability. Table 11 shows the maximum desirability for the five response variables as well as the experimental conditions to achieve the desired goal. In Table 12, the experimental results along with the values predicted by the models under the maximum desirability and optimal extraction conditions are presented. As can be seen, the experimental values of the five responses are within the confidence intervals of the values predicted by the models (with 95% confidence level), which indicates a good degree of prediction of the models obtained in this work under the extraction conditions tested. On the other hand, Table 12 presents the experimental data of TPC, TFC and antiradical scavenging activity using water (conventional solvent) under the same optimal extraction conditions used for the case of NADESs.
4. Discussions
4.1. Synthesis of NADESs
NADES, a homogeneous mixture that forms a superlattice when combined at a specific molar ratios using natural components. The joint superlattice melts at eutectic temperatures below the melting point of its components. DES formations have mostly been designed with ChCl as HBA. The formation of a transparent liquid at a certain molar ratio suggests the effects of hydrogen bond interaction between the HBA and the HBD[25]. The freezing point of DES is lowered due to hydrogen bonding between the HBA and the HBD, resulting in a liquid form[26].
In the study, the amount of citric acid was insufficient to form appropriate hydrogen bonding with sucrose, glycine, and glucose at molar ratio of 1:2 respectively. As a result, the formed solutions solidified into white mass on cooling. At 2:1 molar ratio, the NADES formed with sucrose was extremely viscous like a gel and could not be used for extraction application and was discarded. We therefore suggest that a critical factor in synthesizing citric acid-based NADES is to establish the ideal HBA to HBD molar ratio that will produce a stable liquid-phase mixture on standing.
Heating and stirring was the primary method used by most researchers in the synthesis of deep eutectic solvents (DESs) including NADES[7,9,13,27,28]. Due to high energy consumption, as well as longer duration of synthesis time (between 6-24 h) in heating and stirring (HS) technique, more novel approaches are being explored. For instance, microwave[13,14,30], freeze-drying[31,32,33], rotary evaporation[32], extrusion[13] and ultrasonication[34]. Application of ultrasound to the mixture caused acoustic cavitation by generating, growing, and eventually collapsing of the bubbles. As ultrasound waves were propagated, the bubbles oscillated and collapsed causing thermal, mechanical, and chemical effects. Mechanical effects include collapsed pressure, turbulence, and shear stresses, while the chemical effects include ionization of bonds and an increase in hydrogen bonding potentials to form. The locally produced alternating positive and negative pressures caused the expansion of the mixture resulting in bond rupture and realignment. Ultrasound causes hydrolysis of water inside the oscillating bubbles leading to the formation of H+ and OH- that were captured in the chemical reaction by the rearrangement of HBA and HBD to form the NADESs. When cavitation is generated, OH radicals are released, that is why chemical effect is obtained in the solution.
Temperature and time played significant roles in ultrasound-assisted synthesis of the NADESs. At 50°c temperature, the HBA and HBD were unable to form the desired solvent at different time intervals. At 90°c, the formed solvents with sugar based HBDs were very dark in colour which was suspected to be the effects of caramelization of the sugars. The caramelization effect was also observed when the temperature was 70°C and the time prolonged above 80 min. In their study with choline chloride based NADES, Hsieh et al[34] employed ultrasound-assisted technique with frequency of 40kHz, 300 W power, and synthesis time of 5h. The temperature was not controlled but measured to be 50°C at the end of the synthesis time. Based on their findings, 50°C could also be used for the synthesis of citric acid based NADESs but will require such a long period of time. Therefore, thermal effects in addition to the cavitation and mechanical effects, significantly influence ultrasound-assisted synthesis (UAS)[35] making temperature and time important UAS variables for NADESs production.
4.2. Characterization of NADES
4.2.1. Physical Properties of NADESs
The physical properties of the NADESs prepared using citric acids (Ca), sugars, amino acids, and sugar alcohols depicted excellent physicochemical properties like those synthesized using other hydrophilic hydrogen bond acceptors such as choline chloride. The basic physical properties of NADESs at 25°C were measured, including density, viscosity and pH, to provide reference for the application of the synthesized NADESs to extraction of bioactive compounds from horticulture materials. The results of the physical properties were shown in Table 5.
4.2.1.1. Density
The density of solvent is critical for its diffusion and miscibility with other liquids. The density of NADES is crucial in chemical processes involving extraction, fluid mechanics and mass transfer. The high density of NADES may be advantageous for phase separation, even though it may impact on handling and mixing processes. The densities of the synthesized NADESs at 25°C shows fructose-based has higher density than glucose-based irrespective of the molar ratios and may explain why the former has superior extraction efficiency than the later. The densities obtained in this study are similar with those obtained from choline chloride-based NADESs (1.00–1.35 g/cm3)[36,37,38], and glycolic acid based NADESs (1.3528-1.3741 g/cm3)[12]. NADESs have higher densities than water due to their varying degrees of hydrogen bonding in the formulation[39,40]. The arrangement and packing of NADES molecules significantly impact their density[41]. According to Abbott et al., DES mixtures like ionic liquid counterpart, contain holes whose size controls the density of the solvent[42]. NADESs formed from sugars (sucrose, fructose, and glucose) have hig
her densities than those formed from sugar alcohols (xylitol, and glycerol) indicating that the HBD functional groups substantially impacted the properties. Although the densities of DESs decreases dramatically as the chain length of HBDs increases in the case of choline chloride-based NADES[37,38], the contrary was observed in the present study.
4.2.1.2. Water Activity
Water activity is an important and critical thermodynamic property used to predict shelf-life of food products, microbial activity, microbial growth, solute to solute interactions, etc. It is defined as the ratio of the fugacity of water in a system at a given temperature to the fugacity of pure water at the same temperature. In food products, water activity can be manipulated by addition or reduction of electrolyte solution to achieve the desired goal[43]. Water activity also provide treasured data with respect to solute-to-solute and solute-to solvent interacts, an important factor for extraction processes[44]. In the present work, the water activity of the synthesized NADESs were measured with a digital water activity meter at 25°C. There is a paucity of information in the literature with regards to water activity of NADESs, however, it could be seen from data obtained about some ternary mixtures of choline chloride based NADESs with sugars and water that the present NADESs have lower water activity than those ternary mixtures. For example, Behboudi, et al., provided water activity data for choline chloride: urea + sucrose+ water, choline chloride: ethylene glycol + sucrose + water, and choline chloride: glycerol +sucrose+ water as 0.942-0.988, 0.949-0.974, and 0.98-0.982 respectively[45]. Those results were far too high to be compared with the results obtained in the current study: 0.71-0.83. The discrepancies in the results could be explained from the dilution effects of water on the ternary mixtures of water and NADESs as against the concentrated NADESs that we synthesized. In the present study, we discovered that water activity is influenced by the molar ratios of the HBD in the structure. The higher the ratio of the HBA in the NADESs structure, the lower the water activity, hence, CaFr11, CaXy11, CaGr11, and CaGl11 have higher water activities than CaFr21, CaXy21, CaGr21, and CaGl21 respectively. This observation could be used in tuning the NADESs for a given purpose, such as application in formulation of preservatives.
4.2.1.3. Viscosity
Dynamic viscosity measures the resistance of fluid to flow and the molecular bond strength of the fluid. The viscosities of the NADESs for all functional groups of HBD at different molar ratios are shown to range from 0.0131 pa.s to 0.3545 pa.s, and are similar to those obtained by Sazali et al., (0.235-0.453 pa.s, using choline chloride: glycerol; and 0.04-0.06 pa.s, using choline chloride: lactic acid)[46]; and Liu et al (0.207-2.66 pa.s using choline chloride: glycerol at the same molar ration)[47]. Similarly, Francisco et al., obtained choline chloride: lactic acid viscosities of 0.3–0.7 Pa.s at 1:1.3–1:5 mole ratios[48] and Kang et al, obtained similar viscosities for different molar ratios of glycolic acid: l-proline based NADESs[12]. Due to their dense hydrogen-bond networks, NADESs have higher viscosities than water, molten salts and other molecular solvents. This is due to inhibiting free mobility species within the NADES structure[49]. Higher viscosities are also caused by electrostatic interactions, van der Waals forces, ion sizes and void volumes. In this study, the role of HBD chemical structure and functional groups in the properties of NADESs is demonstrated. Carboxylic acid and hydroxyl groups, in addition to the alkyl chain length, affect viscosity, with more hydroxyl groups and longer hydrocarbon chains resulting in higher viscosities[50]. Alcalde et al., observed that water dilutes the hydrogen bonding between choline chloride and lactic acid, but only at concentrations greater than 10%, accordingly, increasing the HBD molar ratio will increase the viscosity[51].
4.2.1.4. pH
The pH of NADESs is very important for chemical analysis, extraction processes, catalysis, biological activity and metal treatment. The pH of NADES can affect process engineering, as it involves operational conditions and materials of construction[46,52]. The pH is dictated by the acidity and basicity of HBA and HBD and their combined acidity and basicity[53]. The pH values of the synthesized NADESs at 25°c are shown to be below pH 2 except CaGc11 and CaGc21 whose pH values are above pH 2. CaGc11 (citric acid: glycine, 1:1), CaGc21 (citric acid: glycine, 2:1) are the only NADES samples synthesized using amino acid as HBD. Amino acids have fewer hydroxyl groups in their molecular structure when compared to sugars and sugar alcohols hence the acidity in relation to others. The limited number of hydroxyl groups in the structure of Glycine as HBD may have influenced the resultant NADESs to be less acidic, that is higher pH value. There is significant difference between the pH of CaFr12 (citric acid and fructose, 1:2) and CaXy12 (citric acid: xylitol, 1:2). This may be explained by the similar numbers of hydroxyl groups in the respective molecules of fructose and xylitol.
The pH is also affected not only by the HBD groups but also by the molar ratio of HBA to HBD. For instance, the pH values of CaFr12 (citric acid: fructose, 1:2), CaXy12 (citric acid: xylitol, 1:2), and CaGr12 (citric acid: glycerol, 1:2) respectively were all higher than those of CaFr21 (citric acid: fructose, 2:1), CaXy21 (citric acid: xylitol, 2:1), and CaGr21 (citric acid: glycerol, 2:1) respectively. This may be explained using the hole theory of Abbott, et al.,[42]. In this case, there are more free hydrogen bond donating groups from two moles of fructose, xylitol, and glycerol that need to be accepted by the HBA but couldn’t because there were no free bonding sites from the one mole of the citric acid thereby creating a more acidic environment.
Overall, DES prepared using organic acids either as a HBA or HBD tend to have extremely high acidity because of HBA: HBD hydrogen bonding[41]. Skulcova et al [53] obtained pH values from 4.1- 4.5 using choline chloride and glycerol at 1:2 M ratio and at temperatures from 25°C to 60°C, however, the pH of DES synthesized with choline chloride and lactic acid was established to varied between 0.99 and 1.8 for molar ratios of 1:5 and 1:10 under similar conditions[53]. The pH of choline chloride: lactic acid DES and choline chloride: glycerol DES were significantly impacted by the type of HBD used, with the first DES containing an acid and the second containing an alcohol[52].
Lemaouni, et al suggested that the trend of pH with molar ratios caused by functional group addition to HBDs is not always correlated for some DESs, instead, molecular-level interactions between HBA and HBD significantly affect the pH of DESs[54].
4.3. Molecular Properties
The charge delocalization of HBA and HBD occurring through hydrogen bonding is responsible for the formation of DESs. The NADESs prepared by combining citric acid with glycine shows changes in the FTIR spectra indicated by a second peak following the OH peak when compared to others. This second peak is identified as amide stretching (3300-3200 cm-1). The FTIR spectra of the synthesized NADESs shows the absence of intensive OH stretching bands at wavenumber between 3800cm-1 and 3400 cm-1, indicating a very low water content solvent[55] (spectra not displayed in this manuscript). However, the NADESs FTIR spectra showed OH stretching bands at wavenumbers (3305; 3327; 3287; 3375; 3321; 3298; 3385; 3358; 3286; 3367; 3373; 3392; 3321; 3371 cm-1) for CaSu11; CaFr11; CaFr12; CaFr21; CaXy11; CaXy12; CaXy21; CaGr11; CaGr12; CaGr21; CaGc11; CaGc21; CaGl11; and CaGl21 respectively as presented in Table 5. According to the literature, changes in stretching vibration of NADES at the wavenumber of 3300 cm-1 are the main indication of hydrogen bonding formation between hydrogen bond acceptor, and hydrogen bond donor[55,56,57]. These results confirm the synthesis of NADES with the increase and strengthening of hydrogen bonds. The presence of characteristic functional groups indicated in FT-IR spectra were OH (3500–3200 cm-1), CH (3000–2500 cm-1), RCOOR (1710–1730 cm-1), C꞊C allyl stretching (1615–1682 cm-1), ꞊CH2 bending (1416–1485 cm-1), C–O (1112–1000 cm-1), C꞊C allyl wagging vibration and =CH2 wagging vibration (1000–727 cm-1), which further validate the synthesized solvents as natural deep eutectic solvents and not just mere solvents. The results obtained were in agreement with the result obtained by Silva et al.[57], and Rashid et al.[58] with choline chloride based NADESs. NADES prepared by a combination of individual components reveals alteration in the infra-red spectra when differentiated with the separate components. The broader peaks seen at 3000–3500 cm-1 accords to more O–H bond formation between individual components in NADES. According to[56] changes in the band stretching between 3000 and 3500 are the main evidence of hydrogen bond formation between the individual components, which confirms the synthesis of NADES. The FT-IR spectra of CaGc11 and CaGc21, show two distinct functional peaks at 3373 cm-1 to 3392 cm-1 indicating OH stretching from the citric acid and 3207 cm-1 to 3230 cm-1 indicating amide N-H bond from amino acid glycine, respectively. The number of bonds in each of the NADESs formed are indicated by the number of peaks in each individual solvent, however, the most important indication of the formation of eutectic solvent is the presence of H-bonds in the molecule. In the present study, the presence of H-bonds indicated by peaks feature prominently among all the synthesized solvents, an indication of the formation of NADES.
4.4. Application of NADESs for Extraction
4.4.1. Extraction Yields
While extraction studies utilizing the properties of ultrasonic waves exist in volumes, there is a dearth of knowledge on the use of ultrasonication for the preparation of NADES. However, It has been established that the practical application of extraction of bioactive compounds with NADES is more suitable than organic solvents for use in food and pharmaceutical products [58,59,60].Therefore, citric acid-based NADESs, were investigated for efficient extraction of phenolic compounds using a multifactorial modelling with a rotatable central composite response surface methodology as shown in our previous study [3]. The NADESs were found to be suitable solvents for extracting bioactive compounds from horticulture residue such as AFP. The affinity of phenolic compounds with more tendency towards acidic NADESs could explain the basis for increase extraction efficiency and antiradical scavenging potentials of the extracts[61]. Extraction with NADESs coupled to ultrasonication techniques have been reported by different authors[62,63,64,65,66]. Bertolo et al. prepared NADESs with choline chloride as HBA and glucose, sucrose, glycerol, lactic acid, and citric acid as HBDs and reported the most efficient for bioactive and phenolic compounds extraction from pomegranate to be the choline chloride-lactic acid (ChCl-LA)-based NADES coupled with ultrasonic bath[66]. In similar studies, Obluchinskaya et al., Olfat et al., and Koraqi et al. extracted bioactive compounds from brown seaweed, sea velvet, and damask rose by NADESs coupled with ultrasonication, respectively, and reported that NADESs based on lactic acid coupled with ultrasonic bath led to better extraction of phenolic and bioactive compounds [6,63,65]. In our study, we found similarity of efficiency between citric acid-fructose based NADESs to the ChCl-LA-based NADES in TPC extraction. Therefore, it may be appropriate to state that extraction efficiency of citric acid-based NADES performs better when citric acid is used as HBA rather than HBD when coupled to ultrasonication process.
4.4.2. Effects of Extraction Conditions on Antioxidants
In the presence of a solvent, the cavitation phenomenon occurs by exposing the samples to ultrasound waves. Cavitations are microbubbles formed by the application of ultrasonic waves due to the cycle of compression and rarefaction. The compression and rarefaction cause the formation, growth, and implosion of bubbles. As the bubbles explode, the tissue matrix of the sample collapses. The cycle of compression and rarefaction is directly related to the solvent volume, so that at higher volumes, the rate of cavitation will be higher. Therefore, as a result of increasing the solvent volume, the ultrasound cavitation increases leading to increased tissue disruption and ultimate increase in TPC extraction[67,68,69]. The two main steps on which the UAE process is based are the washing and the slow extraction mechanisms. In the washing stage, the soluble compounds on the surface or close to the surface are washed and extracted by solvent, which is accompanied by a rapid increase in the extraction slope, while during the slow extraction stage, soluble materials are slowly extracted from the sample matrix into the solvent by both diffusion and osmotic phenomena. At the slow extraction stage, temperature plays a role as it helps in diffusion and osmosis through increased molecular mobility. At this point, sufficient time to extract bioactive compounds from the target matrix is required[70]. Therefore, providing sufficient time will cause the most bioactive compounds to be extracted and thus increase the extraction efficiency. However, prolonging the time may lead to polyphenol degradation. The concentration of the solvent increases by reducing the amount of water added to the NADES. Increasing the solvent concentration causes the mass transfer more rapidly and the phenolic compounds in the samples to diffuse into the solvent [71]. This may be because higher solvent concentration means availability of more hydrogen bond species for interaction with the bioactive molecules leaving the sample matrix into the solvent. higher concentration of NADESs increases the content of hydrophilic compounds, because of the acidic nature of the solvents.
4.4.3. Efficiency of NADESs as Solvent for Polyphenol Extraction
Comparing the TPC and TFC compounds extracted by the UAE-NADESs method at optimized conditions with those extracted by UAE-Water (water is the greenest solvent) at the same optimized conditions, as shown in Table 10, all the synthesized NADESs showed superior TPC extraction to water extraction. In addition, the synthesized NADESs also showed superior TFC extraction efficiency to water except with CaF21 where water had superior extraction efficiency. The combination of ultrasonic process and eutectic solvent, probably due to its role in improving the mass transfer process of bioactive compounds from the sample caused more bioactive and phenolic compounds to be extracted hence increase in the total phenol content extracted[72]. The UAE-NADESs, due to their role in the stability of solutes, prevents the degradation of these compounds during the extraction process and thus increases the extraction efficiency. In the extraction process, due to the formation of strong hydrogen bonds between solutes and NADES molecules, the stability of the target compounds may increase against adverse extraction conditions (oxidative degradation)[73]. Also, during the UAE process, the high solubility of NADES may confer a significant advantage for the extraction and stability of bioactive compounds (polyphenols, flavonoids) at such shorter extraction time than conventional extraction processes[74]. Macchioni et al. reported similar results for extracting phenolic compounds from common hops using NADES and UAE[75], and found extraction efficiency of phenolic compounds by lactic acid-based eutectic solvents higher than the conventional extraction method using ethanol 80 %. They attributed this behavior to the improvement of the mass transfer process by the UAE method and the increase in the stability of phenolic compounds induced by eutectic solvents[75].
4.5. Effects of Extraction Conditions Antiradical Scavenging Activity
The antiradical scavenging activity of bioactive compounds extracted from ANP using UAE-NADESs method was compared with UAE-water extracts at the optimized conditions as shown in Table 10. The antiradical scavenging activity was determined with CUPRAC, FRAP, and DPPH methods and differences compared using Fisher’s least significant difference (LSD) test. The antiradical scavenging tests by DPPH inhibitions performed significantly better in all UAE-NADESs than in UAE-water (p < 0.05). Test by CUPRAC shows that all UAE-NADESs were significantly higher than UAE-water except in UAE-CaGc11 where there is no significant difference from that of UAE-water (p < 0.05). However, UAE-water performed significantly higher than UAE-CaGl11, UAE-CaGl21, and UAE-CaGc21 when the scavenging test was conducted using FRAP method, but significantly lower in all other UAE-NADESs studied (p < 0.05) (see Table 10). The free radical scavenging activity of DPPH, CUPRAC and FRAP of NADES-UAE extracts may probably be connected to the content of higher phenolic compounds extracted by the NADES-UAE methods. These bioactive (nutraceuticals) have various antioxidant and biological activities in food and biological systems due to their structural properties [76,77]. The hydrogen donating capability and reduction ability of phenolic compounds cause the oxidation chain reaction to be broken, and these compounds are referred to as potent antioxidants[6]. These findings are consistent with the results of other researchers. Mansinhos et al. studied the extraction of phenolic compounds from butterfly lavender with UAE and NADES, and found that the combination of UAE and NADES resulted in higher antioxidant activity compared to conventional methods[78].They stated that scavenging of DPPH free radicals by UAE-NADES methods was greater than those of extracts obtained by conventional methods, which attributed the higher antioxidant activity to the content of higher phenolic compounds in the UAE method[78].
5. Conclusions
In this study, we synthesized, characterized and applied fourteen natural deep eutectic solvents for extraction of bioactive compounds from horticulture residues. The extraction procedure was first screened with a multifactorial model and then optimized the extraction with a rotatable central composite response surface methodology. We had in our previous study [3] investigated the potentials of only one solvent and determined its effectiveness at extracting TPC and TFC from ANP and the radical scavenging potentials of the extracts. In the present study, we took a comprehensive investigation of all the synthesized NADESs, optimized the independent variables with the aim of obtaining maximum TPC and TFC extracts, as well as maximum antiradical scavenging activity. Optimal extraction parameters, yielding the highest measures of TPC were determined to be UT, ET, SV, and SC: 45°C, 5 min, 25 ml, 90%. Similarly, optimal conditions were identified for other parameters. These conditions resulted in maximal desirability indices and activity. Among the synthesized NADESs, CaFr11 emerged as the ultimate in terms of superior extraction efficiency. The antiradical scavenging activity of the extracts using the CUPRAC, FRAP, and DPPH methods show better results to extracts obtained with UAE-Water. Our solvents and methods also show similar or superior performance to the results obtained by other researchers from other plant materials using different NADES coupled to UAE[79,80,81,82]. The bioactive compounds extracted from our sample by UAE-NADESs exhibited volume and concentration dependency. The findings further give insights into the capacity of NADESs as powerful solvents for extraction applications. The lack of literature on extraction of bioactive compounds from ANP using NADESs coupled ultrasound techniques gives credence to the originality of the present work. Further research should be carried out to elucidate the individual constituents of the NADES-UAE extracts from ANP, and also to investigate if it is possible to directly apply the extracts obtained by the methodology used in this work to food, pharmaceutical, and cosmetic products, taking advantage of the fact that the components of NADESs (citric acid, sucrose, fructose, xylitol, glycerol, glycine, and glucose) are widely used as additives or food ingredients, pharmaceutical and cosmetic ingredients. Further research should also be carried out to consider if a previous stage of separation is necessary to obtain a purified extract of phenolic compounds with antiradical scavenging activity before the extracts obtained from this method could be utilized further.
Author Contributions
U.J.O- Conceptualization, data curation, formal analysis, investigation, methodology, project administration, validation, and writing original draft. M.M – Supervision and editing. D.M- Supervision, resources, writing review and editing. A.C- Supervision, editing, Funding acquisition All authors have read and agreed to the published version of the manuscript.
Funding
This research received no external funding
Data Availability Statement
Data generated and used in this research is available from the corresponding authors on reasonable requests.
Acknowledgments
UJO is very grateful to the University of Urbino Carlo Bo for providing a generous Ph.D. scholarship and to the University of Food Technologies, Plovdiv, hosting his six-months research stay in their facility.
Conflicts of Interest
The authors declare no conflicts of interest.
Abbreviations
The following abbreviations are used in this manuscript:
| NADESs | Natural Deep Eutectic Solvents |
| ANP | African nutmeg peels |
| UAE | Ultrasound assisted extraction |
| UAS | Ultrasound assisted synthesis |
| UT | Ultrasound (extraction) temperature |
| ET | Extraction time |
| SV | Solvent (NADES) volume |
| SC | Solvent (NADES) concentration |
| CUPRAC | Cupric Ion Reducing Antioxidant Capacity |
| FRAP | Ferric Reducing Antioxidant Power |
| DPPH | 2,2-Diphenyl-2-picrylhydrazyl |
| ARA | Antiradical activity |
| TPC | Total phenolic contents |
| TFC | Total flavonoid content |
| ChCl-LA | Choline chloride-lactic acid |
| HBA | Hydrogen bond acceptor |
| HBD | Hydrogen bond donor |
| MFAT | Many factors at a time |
| RCCRSM | Rotatable central composite response surface methodology |
| CHCL | Choline chloride |
| FTIR | Fourier transform infrared spectroscopy |
| LSD | Least significant difference |
References
- Sharma, A.; Soni, R.; Soni, S.K. From Waste to Wealth: Exploring Modern Composting Innovations and Compost Valorization. J Mater Cycles Waste Manag 2024, 26, 20–48. [CrossRef]
- Waqas, M.; Hashim, S.; Humphries, U.W.; Ahmad, S.; Noor, R.; Shoaib, M.; Naseem, A.; Hlaing, P.T.; Lin, H.A. Composting Processes for Agricultural Waste Management: A Comprehensive Review. Processes 2023, 11, 731. [CrossRef]
- Okeke, U.J.; Micucci, M.; Mihaylova, D.; Cappiello, A. The Effects of Experimental Conditions on Extraction of Polyphenols from African Nutmeg Peels Using NADESs-UAE: A Multifactorial Modelling Technique. Sci Rep 2025, 15, 4890. [CrossRef]
- Zhuang, B.; Dou, L.-L.; Li, P.; Liu, E.-H. Deep Eutectic Solvents as Green Media for Extraction of Flavonoid Glycosides and Aglycones from Platycladi Cacumen. Journal of Pharmaceutical and Biomedical Analysis 2017, 134, 214–219. [CrossRef]
- Yao, J.; Zeng, J.; Tang, H.; Cheng, Y.; Tan, J.; Li, T.; Li, X.; He, J.; Zhang, Y. Effect of Deep Eutectic Solvent Extraction on Auricularia Auricula Polysaccharide Solubilization and Antioxidant Potential. Sustainable Chemistry and Pharmacy 2023, 34, 101166. [CrossRef]
- Olfat, A.; Mostaghim, T.; Shahriari, S.; Salehifar, M. Extraction of Bioactive Compounds of Hypnea Flagelliformis by Ultrasound-Assisted Extraction Coupled with Natural Deep Eutectic Solvent and Enzyme Inhibitory Activity. Algal Research 2024, 78, 103388. [CrossRef]
- Florindo, C.; Oliveira, F.S.; Rebelo, L.P.N.; Fernandes, A.M.; Marrucho, I.M. Insights into the Synthesis and Properties of Deep Eutectic Solvents Based on Cholinium Chloride and Carboxylic Acids. ACS Sustainable Chem. Eng. 2014, 2, 2416–2425. [CrossRef]
- Crawford, D.E.; Wright, L.A.; James, S.L.; Abbott, A.P. Efficient Continuous Synthesis of High Purity Deep Eutectic Solvents by Twin Screw Extrusion. Chem. Commun. 2016, 52, 4215–4218. [CrossRef]
- Delgado-Mellado, N.; Larriba, M.; Navarro, P.; Rigual, V.; Ayuso, M.; García, J.; Rodríguez, F. Thermal Stability of Choline Chloride Deep Eutectic Solvents by TGA/FTIR-ATR Analysis. Journal of Molecular Liquids 2018, 260, 37–43. [CrossRef]
- Rodríguez-Martínez, B.; Ferreira-Santos, P.; Alfonso, I.M.; Martínez, S.; Genisheva, Z.; Gullón, B. Deep Eutectic Solvents as a Green Tool for the Extraction of Bioactive Phenolic Compounds from Avocado Peels. Molecules 2022, 27, 6646. [CrossRef]
- Zhang, M.; Tian, R.; Han, H.; Wu, K.; Wang, B.; Liu, Y.; Zhu, Y.; Lu, H.; Liang, B. Preparation Strategy and Stability of Deep Eutectic Solvents: A Case Study Based on Choline Chloride-Carboxylic Acid. Journal of Cleaner Production 2022, 345, 131028. [CrossRef]
- Kang, K.; Jia, X.; Zheng, K.; Wang, X.; Liu, B.; Hou, Y. Physical Properties of Natural Deep Eutectic Solvent and Its Application in Remediation of Heavy Metal Lead in Soil. Journal of Contaminant Hydrology 2023, 258, 104222. [CrossRef]
- Gomez, F.J.V.; Espino, M.; Fernández, M.A.; Silva, M.F. A Greener Approach to Prepare Natural Deep Eutectic Solvents. ChemistrySelect 2018, 3, 6122–6125. [CrossRef]
- Pelosi, C.; Gonzalez-Rivera, J.; Bernazzani, L.; Tiné, M.R.; Duce, C. Optimized Preparation, Thermal Characterization and Microwave Absorption Properties of Deep Eutectic Solvents Made by Choline Chloride and Hydrated Salts of Alkali Earth Metals. Journal of Molecular Liquids 2023, 371, 121104. [CrossRef]
- Montgomery, D.C. Design and Analysis of Experiments; Ninth edition.; John Wiley & Sons, Inc: Hoboken, NJ, 2017; ISBN 978-1-119-11347-8.
- Cabrera, L.; Xavier, L.; Zecchi, B. Extraction of Phenolic Compounds with Antioxidant Activity from Olive Pomace Using Natural Deep Eutectic Solvents: Modelling and Optimization by Response Surface Methodology. Discov Food 2024, 4, 29. [CrossRef]
- Alburquerque, J. Agrochemical Characterisation of “Alperujo”, a Solid by-Product of the Two-Phase Centrifugation Method for Olive Oil Extraction. Bioresource Technology 2004, 91, 195–200. [CrossRef]
- Ianni, F.; Scandar, S.; Mangiapelo, L.; Blasi, F.; Marcotullio, M.C.; Cossignani, L. NADES-Assisted Extraction of Polyphenols from Coriander Seeds: A Systematic Optimization Study. Antioxidants 2023, 12, 2048. [CrossRef]
- Kivrak, İ.; Duru, M.E.; Öztürk, M.; Mercan, N.; Harmandar, M.; Topçu, G. Antioxidant, Anticholinesterase and Antimicrobial Constituents from the Essential Oil and Ethanol Extract of Salvia Potentillifolia. Food Chemistry 2009, 116, 470–479. [CrossRef]
- Benzie, I.F.F.; Strain, J.J. [2] Ferric Reducing/Antioxidant Power Assay: Direct Measure of Total Antioxidant Activity of Biological Fluids and Modified Version for Simultaneous Measurement of Total Antioxidant Power and Ascorbic Acid Concentration. In Methods in Enzymology; Elsevier, 1999; Vol. 299, pp. 15–27 ISBN 978-0-12-182200-2.
- Lim, C.S.H.; Lim, S.L. Ferric Reducing Capacity Versus Ferric Reducing Antioxidant Power for Measuring Total Antioxidant Capacity. Lab Med 2013, 44, 51–55. [CrossRef]
- Apak, R.; Güçlü, K.; Özyürek, M.; Bektaşoğlu, B.; Bener, M. Cupric Ion Reducing Antioxidant Capacity Assay for Antioxidants in Human Serum and for Hydroxyl Radical Scavengers. In Advanced Protocols in Oxidative Stress II; Armstrong, D., Ed.; Methods in Molecular Biology; Humana Press: Totowa, NJ, 2010; Vol. 594, pp. 215–239 ISBN 978-1-60761-410-4.
- Akyüz, E.; Türkoğlu, S.; Sözgen Başkan, K.; Tütem, E.; Apak, M.R. Comparison of Antioxidant Capacities and Antioxidant Components of Commercial Bitter Melon (Momordicacharantia L.) Products. Turk J Chem 2020, 44, 1663–1673. [CrossRef]
- Brand-Williams, W.; Cuvelier, M.E.; Berset, C. Use of a Free Radical Method to Evaluate Antioxidant Activity. LWT - Food Science and Technology 1995, 28, 25–30. [CrossRef]
- Wang, H.; Tao, Y.; Masuku, M.V.; Cao, J.; Yang, J.; Huang, K.; Ge, Y.; Yu, Y.; Xiao, Z.; Kuang, Y.; et al. Effects of Deep Eutectic Solvents on the Biotransformation Efficiency of ω-Transaminase. Journal of Molecular Liquids 2023, 377, 121379. [CrossRef]
- Hayyan, M.; Mbous, Y.P.; Looi, C.Y.; Wong, W.F.; Hayyan, A.; Salleh, Z.; Mohd-Ali, O. Natural Deep Eutectic Solvents: Cytotoxic Profile. SpringerPlus 2016, 5, 913. [CrossRef]
- Zaman, S.U.; Mehdi, M.S.; Umar, M.; Rafiq, S.; Saif-ur-Rehman; Zaman, M.K.U.; Javed, M.D.; Waseem, M.A.; Tahir, N. Preparation of Ammonium Persulfate/Glycerol Based Novel Deep Eutectic Solvent under Controlled Conditions; Characterizations, Physical Properties. Journal of Molecular Structure 2023, 1283, 135265. [CrossRef]
- Yang, G.-Y.; Song, J.-N.; Chang, Y.-Q.; Wang, L.; Zheng, Y.-G.; Zhang, D.; Guo, L. Natural Deep Eutectic Solvents for the Extraction of Bioactive Steroidal Saponins from Dioscoreae Nipponicae Rhizoma. Molecules 2021, 26, 2079. [CrossRef]
- Rodriguez Rodriguez, N.; van den Bruinhorst, A.; Kollau, L.J.B.M.; Kroon, M.C.; Binnemans, K. Degradation of Deep-Eutectic Solvents Based on Choline Chloride and Carboxylic Acids. ACS Sustainable Chem. Eng. 2019, 7, 11521–11528. [CrossRef]
- Xu, F.-X.; Zhang, J.-Y.; Jin, J.; Li, Z.-G.; She, Y.-B.; Lee, M.-R. Microwave-Assisted Natural Deep Eutectic Solvents Pretreatment Followed by Hydrodistillation Coupled with GC-MS for Analysis of Essential Oil from Turmeric (Curcuma Longa L.). J. Oleo Sci. 2021, 70, 1481–1494. [CrossRef]
- Jeong, K.M.; Jin, Y.; Yoo, D.E.; Han, S.Y.; Kim, E.M.; Lee, J. One-Step Sample Preparation for Convenient Examination of Volatile Monoterpenes and Phenolic Compounds in Peppermint Leaves Using Deep Eutectic Solvents. Food Chemistry 2018, 251, 69–76. [CrossRef]
- Zhang, M.; Tian, R.; Han, H.; Wu, K.; Wang, B.; Liu, Y.; Zhu, Y.; Lu, H.; Liang, B. Preparation Strategy and Stability of Deep Eutectic Solvents: A Case Study Based on Choline Chloride-Carboxylic Acid. Journal of Cleaner Production 2022, 345, 131028. [CrossRef]
- Gutiérrez, M.C.; Ferrer, M.L.; Mateo, C.R.; Del Monte, F. Freeze-Drying of Aqueous Solutions of Deep Eutectic Solvents: A Suitable Approach to Deep Eutectic Suspensions of Self-Assembled Structures. Langmuir 2009, 25, 5509–5515. [CrossRef]
- Hsieh, Y.-H.; Li, Y.; Pan, Z.; Chen, Z.; Lu, J.; Yuan, J.; Zhu, Z.; Zhang, J. Ultrasonication-Assisted Synthesis of Alcohol-Based Deep Eutectic Solvents for Extraction of Active Compounds from Ginger. Ultrasonics Sonochemistry 2020, 63, 104915. [CrossRef]
- Wen, C.; Zhang, J.; Zhang, H.; Dzah, C.S.; Zandile, M.; Duan, Y.; Ma, H.; Luo, X. Advances in Ultrasound Assisted Extraction of Bioactive Compounds from Cash Crops – A Review. Ultrasonics Sonochemistry 2018, 48, 538–549. [CrossRef]
- Kalhor, P.; Ghandi, K. Deep Eutectic Solvents for Pretreatment, Extraction, and Catalysis of Biomass and Food Waste. Molecules 2019, 24, 4012. [CrossRef]
- Biernacki, K.; Souza, H.K.S.; Almeida, C.M.R.; Magalhães, A.L.; Gonçalves, M.P. Physicochemical Properties of Choline Chloride-Based Deep Eutectic Solvents with Polyols: An Experimental and Theoretical Investigation. ACS Sustainable Chem. Eng. 2020, 8, 18712–18728. [CrossRef]
- Moradi, H.; Farzi, N. Experimental and Computational Assessment of the Physicochemical Properties of Choline Chloride/ Ethylene Glycol Deep Eutectic Solvent in 1:2 and 1:3 Mole Fractions and 298.15–398.15 K. Journal of Molecular Liquids 2021, 339, 116669. [CrossRef]
- Dai, Y.; Witkamp, G.-J.; Verpoorte, R.; Choi, Y.H. Natural Deep Eutectic Solvents as a New Extraction Media for Phenolic Metabolites in Carthamus Tinctorius L. Anal. Chem. 2013, 85, 6272–6278. [CrossRef]
- Che Zain, M.S.; Yeoh, J.X.; Lee, S.Y.; Shaari, K. Physicochemical Properties of Choline Chloride-Based Natural Deep Eutectic Solvents (NaDES) and Their Applicability for Extracting Oil Palm Flavonoids. Sustainability 2021, 13, 12981. [CrossRef]
- Panić, M.; Radošević, K.; Radojčić Redovniković, I.; Zagajski Kučan, K.; Sander, A.; Halambek, J.; Prlić Kardum, J.; Mitar, A. Physicochemical Properties, Cytotoxicity, and Antioxidative Activity of Natural Deep Eutectic Solvents Containing Organic Acid. Chem. biochem. eng. q. (Online) 2019, 33, 1–18. [CrossRef]
- Abbott, A.P.; Harris, R.C.; Ryder, K.S. Application of Hole Theory to Define Ionic Liquids by Their Transport Properties. J. Phys. Chem. B 2007, 111, 4910–4913. [CrossRef]
- Neri, L.; Di Mattia, C.D.; Sacchetti, G.; Pittia, P.; Mastrocola, D. The Influence of Water Activity and Molecular Mobility on Pectinmethylesterase Activity in Salt and Glucose–Maltodextrin Model Systems. Food and Bioproducts Processing 2018, 107, 1–9. [CrossRef]
- Sato, Y.; Miyawaki, O. Analysis of Hydration Parameter for Sugars Determined from Viscosity and Its Relationship with Solution Parameters. Food Chemistry 2016, 190, 594–598. [CrossRef]
- Behboudi, E.; Shekaari, H.; Zafarani-Moattar, M.T. Water Activity in Aqueous Solution of Sucrose in the Presence of Some Deep Eutectic Solvents. J. Chem. Eng. Data 2021, 66, 1043–1054. [CrossRef]
- Sazali, A.L.; AlMasoud, N.; Amran, S.K.; Alomar, T.S.; Pa’ee, K.F.; El-Bahy, Z.M.; Yong, T.-L.K.; Dailin, D.J.; Chuah, L.F. Physicochemical and Thermal Characteristics of Choline Chloride-Based Deep Eutectic Solvents. Chemosphere 2023, 338, 139485. [CrossRef]
- Liu, C.; Fang, H.; Qiao, Y.; Zhao, J.; Rao, Z. Properties and Heat Transfer Mechanistic Study of Glycerol/Choline Chloride Deep Eutectic Solvents Based Nanofluids. International Journal of Heat and Mass Transfer 2019, 138, 690–698. [CrossRef]
- Francisco, M.; van den Bruinhorst, A.; Kroon, M.C. New Natural and Renewable Low Transition Temperature Mixtures (LTTMs): Screening as Solvents for Lignocellulosic Biomass Processing. Green Chem. 2012, 14, 2153. [CrossRef]
- AlOmar, M.K.; Hayyan, M.; Alsaadi, M.A.; Akib, S.; Hayyan, A.; Hashim, M.A. Glycerol-Based Deep Eutectic Solvents: Physical Properties. Journal of Molecular Liquids 2016, 215, 98–103. [CrossRef]
- Florindo, C.; Branco, L.C.; Marrucho, I.M. Development of Hydrophobic Deep Eutectic Solvents for Extraction of Pesticides from Aqueous Environments. Fluid Phase Equilibria 2017, 448, 135–142. [CrossRef]
- Alcalde, R.; Gutiérrez, A.; Atilhan, M.; Aparicio, S. An Experimental and Theoretical Investigation of the Physicochemical Properties on Choline Chloride – Lactic Acid Based Natural Deep Eutectic Solvent (NADES). Journal of Molecular Liquids 2019, 290, 110916. [CrossRef]
- Sazali, A.L.; AlMasoud, N.; Amran, S.K.; Alomar, T.S.; Pa’ee, K.F.; El-Bahy, Z.M.; Yong, T.-L.K.; Dailin, D.J.; Chuah, L.F. Physicochemical and Thermal Characteristics of Choline Chloride-Based Deep Eutectic Solvents. Chemosphere 2023, 338, 139485. [CrossRef]
- Skulcova, A.; Russ, A.; Jablonsky, M.; Sima, J. The pH Behavior of Seventeen Deep Eutectic Solvents. BioRes 2018, 13, 5042–5051. [CrossRef]
- Lemaoui, T.; Abu Hatab, F.; Darwish, A.S.; Attoui, A.; Hammoudi, N.E.H.; Almustafa, G.; Benaicha, M.; Benguerba, Y.; Alnashef, I.M. Molecular-Based Guide to Predict the pH of Eutectic Solvents: Promoting an Efficient Design Approach for New Green Solvents. ACS Sustainable Chem. Eng. 2021, 9, 5783–5808. [CrossRef]
- Ghaedi, H.; Ayoub, M.; Sufian, S.; Lal, B.; Uemura, Y. Thermal Stability and FT-IR Analysis of Phosphonium-Based Deep Eutectic Solvents with Different Hydrogen Bond Donors. Journal of Molecular Liquids 2017, 242, 395–403. [CrossRef]
- Ozturk, B.; Parkinson, C.; Gonzalez-Miquel, M. Extraction of Polyphenolic Antioxidants from Orange Peel Waste Using Deep Eutectic Solvents. Separation and Purification Technology 2018, 206, 1–13. [CrossRef]
- Silva, D.T.D.; Pauletto, R.; Cavalheiro, S.D.S.; Bochi, V.C.; Rodrigues, E.; Weber, J.; Silva, C.D.B.D.; Morisso, F.D.P.; Barcia, M.T.; Emanuelli, T. Natural Deep Eutectic Solvents as a Biocompatible Tool for the Extraction of Blueberry Anthocyanins. Journal of Food Composition and Analysis 2020, 89, 103470. [CrossRef]
- Rashid, R.; Mohd Wani, S.; Manzoor, S.; Masoodi, F.A.; Masarat Dar, M. Green Extraction of Bioactive Compounds from Apple Pomace by Ultrasound Assisted Natural Deep Eutectic Solvent Extraction: Optimisation, Comparison and Bioactivity. Food Chemistry 2023, 398, 133871. [CrossRef]
- Vo, T.P.; Phan, T.H.; Nguyen, T.H.P.; Nguyen, V.K.; Dang, T.C.T.; Nguyen, L.G.K.; Chung, T.Q.; Nguyen, H.Q.; Chau, P.T.T.; Thinh, L.D.A.; et al. Green Extraction of Phenolics and Terpenoids from Passion Fruit Peels Using Natural Deep Eutectic Solvents. J Food Process Engineering 2023, e14503. [CrossRef]
- Vanda, H.; Dai, Y.; Wilson, E.G.; Verpoorte, R.; Choi, Y.H. Green Solvents from Ionic Liquids and Deep Eutectic Solvents to Natural Deep Eutectic Solvents. Comptes Rendus Chimie 2018, 21, 628–638. [CrossRef]
- Zannou, O.; Pashazadeh, H.; Ghellam, M.; Ali Redha, A.; Koca, I. Enhanced Ultrasonically Assisted Extraction of Bitter Melon (Momordica Charantia) Leaf Phenolic Compounds Using Choline Chloride-Acetic Acid–Based Natural Deep Eutectic Solvent: An Optimization Approach and in Vitro Digestion. Biomass Conv. Bioref. 2022. [CrossRef]
- Olfat, A.; Mostaghim, T.; Shahriari, S.; Salehifar, M. Extraction of Bioactive Compounds of Hypnea Flagelliformis by Ultrasound-Assisted Extraction Coupled with Natural Deep Eutectic Solvent and Enzyme Inhibitory Activity. Algal Research 2024, 78, 103388. [CrossRef]
- Koraqi, H.; Aydar, A.Y.; Khalid, W.; Ercisli, S.; Rustagi, S.; Ramniwas, S.; Pandiselvam, R. Ultrasound-Assisted Extraction with Natural Deep Eutectic Solvent for Phenolic Compounds Recovery from Rosa Damascene Mill.: Experimental Design Optimization Using Central Composite Design. Microchemical Journal 2024, 196, 109585. [CrossRef]
- Jovanović, M.S.; Krgović, N.; Radan, M.; Ćujić-Nikolić, N.; Mudrić, J.; Lazarević, Z.; Šavikin, K. Natural Deep Eutectic Solvents Combined with Cyclodextrins: A Novel Strategy for Chokeberry Anthocyanins Extraction. Food Chemistry 2023, 405, 134816. [CrossRef]
- Obluchinskaya, E.; Pozharitskaya, O.; Shevyrin, V.; Kovaleva, E.; Flisyuk, E.; Shikov, A. Optimization of Extraction of Phlorotannins from the Arctic Fucus Vesiculosus Using Natural Deep Eutectic Solvents and Their HPLC Profiling with Tandem High-Resolution Mass Spectrometry. Marine Drugs 2023, 21, 263. [CrossRef]
- Bertolo, M.R.V.; Martins, V.C.A.; Plepis, A.M.G.; Bogusz, S. Utilization of Pomegranate Peel Waste: Natural Deep Eutectic Solvents as a Green Strategy to Recover Valuable Phenolic Compounds. Journal of Cleaner Production 2021, 327, 129471. [CrossRef]
- Al-Dhabi, N.A.; Ponmurugan, K.; Maran Jeganathan, P. Development and Validation of Ultrasound-Assisted Solid-Liquid Extraction of Phenolic Compounds from Waste Spent Coffee Grounds. Ultrasonics Sonochemistry 2017, 34, 206–213. [CrossRef]
- Maran, J.P.; Priya, B. Ultrasound-Assisted Extraction of Pectin from Sisal Waste. Carbohydrate Polymers 2015, 115, 732–738. [CrossRef]
- Luque-Garcı́a, J.L.; Luque De Castro, M.D. Ultrasound: A Powerful Tool for Leaching. TrAC Trends in Analytical Chemistry 2003, 22, 41–47. [CrossRef]
- Şahin, S.; Şamlı, R. Optimization of Olive Leaf Extract Obtained by Ultrasound-Assisted Extraction with Response Surface Methodology. Ultrasonics Sonochemistry 2013, 20, 595–602. [CrossRef]
- Zhang, Z.-S.; Wang, L.-J.; Li, D.; Jiao, S.-S.; Chen, X.D.; Mao, Z.-H. Ultrasound-Assisted Extraction of Oil from Flaxseed. Separation and Purification Technology 2008, 62, 192–198. [CrossRef]
- Mohammadpour, H.; Sadrameli, S.M.; Eslami, F.; Asoodeh, A. Optimization of Ultrasound-Assisted Extraction of Moringa Peregrina Oil with Response Surface Methodology and Comparison with Soxhlet Method. Industrial Crops and Products 2019, 131, 106–116. [CrossRef]
- Bener, M.; Şen, F.B.; Önem, A.N.; Bekdeşer, B.; Çelik, S.E.; Lalikoglu, M.; Aşçı, Y.S.; Capanoglu, E.; Apak, R. Microwave-Assisted Extraction of Antioxidant Compounds from by-Products of Turkish Hazelnut (Corylus Avellana L.) Using Natural Deep Eutectic Solvents: Modeling, Optimization and Phenolic Characterization. Food Chemistry 2022, 385, 132633. [CrossRef]
- Mišan, A.; Nađpal, J.; Stupar, A.; Pojić, M.; Mandić, A.; Verpoorte, R.; Choi, Y.H. The Perspectives of Natural Deep Eutectic Solvents in Agri-Food Sector. Critical Reviews in Food Science and Nutrition 2020, 60, 2564–2592. [CrossRef]
- Macchioni, V.; Carbone, K.; Cataldo, A.; Fraschini, R.; Bellucci, S. Lactic Acid-Based Deep Natural Eutectic Solvents for the Extraction of Bioactive Metabolites of Humulus Lupulus L.: Supramolecular Organization, Phytochemical Profiling and Biological Activity. Separation and Purification Technology 2021, 264, 118039. [CrossRef]
- Bus, K.; Szterk, A. Relationship between Structure and Biological Activity of Various Vitamin K Forms. Foods 2021, 10, 3136. [CrossRef]
- Teplova, V.V.; Isakova, E.P.; Klein, O.I.; Dergachova, D.I.; Gessler, N.N.; Deryabina, Y.I. Natural Polyphenols: Biological Activity, Pharmacological Potential, Means of Metabolic Engineering (Review). Appl Biochem Microbiol 2018, 54, 221–237. [CrossRef]
- Mansinhos, I.; Gonçalves, S.; Rodríguez-Solana, R.; Ordóñez-Díaz, J.L.; Moreno-Rojas, J.M.; Romano, A. Ultrasonic-Assisted Extraction and Natural Deep Eutectic Solvents Combination: A Green Strategy to Improve the Recovery of Phenolic Compounds from Lavandula Pedunculata Subsp. Lusitanica (Chaytor) Franco. Antioxidants 2021, 10, 582. [CrossRef]
- Wang, W.; An, M.; Zhao, G.; Wang, Y.; Yang, D.; Zhang, D.; Zhao, L.; Han, J.; Wu, G.; Bo, Y. Ultrasonic-Assisted Customized Natural Deep Eutectic Solvents Extraction of Polyphenols from Chaenomeles Speciosa. Microchemical Journal 2023, 193, 108952. [CrossRef]
- Rodríguez-Fernández, R.; Fernández-Gómez, Á.; Mejuto, J.C.; Astray, G. Modelling Polyphenol Extraction through Ultrasound-Assisted Extraction by Machine Learning in Olea Europaea Leaves. Foods 2023, 12, 4483. [CrossRef]
- Souza, O.A.; Ramalhão, V.G.D.S.; Trentin, L.D.M.; Funari, C.S.; Carneiro, R.L.; Bolzani, V.D.S.; Rinaldo, D. Combining Natural Deep Eutectic Solvent and Microwave Irradiation towards the Eco-Friendly and Optimized Extraction of Bioactive Phenolics from Eugenia Uniflora L. Sustainable Chemistry and Pharmacy 2022, 26, 100618. [CrossRef]
- Kutlu, N.; Kamiloğlu, A.; Abca, T.E.; Yilmaz, Ö. Ultrasound-assisted Deep Eutectic Solvent Extraction of Bioactive Compounds from Persimmon Calyx. Journal of Food Science 2023, 1750-3841.16849. [CrossRef]
Figure 1.
Effects of extraction conditions, HBD types, and HBA:HBD ratios on the extraction of TPC from ANP using NADES-UAE technique.
Figure 1.
Effects of extraction conditions, HBD types, and HBA:HBD ratios on the extraction of TPC from ANP using NADES-UAE technique.
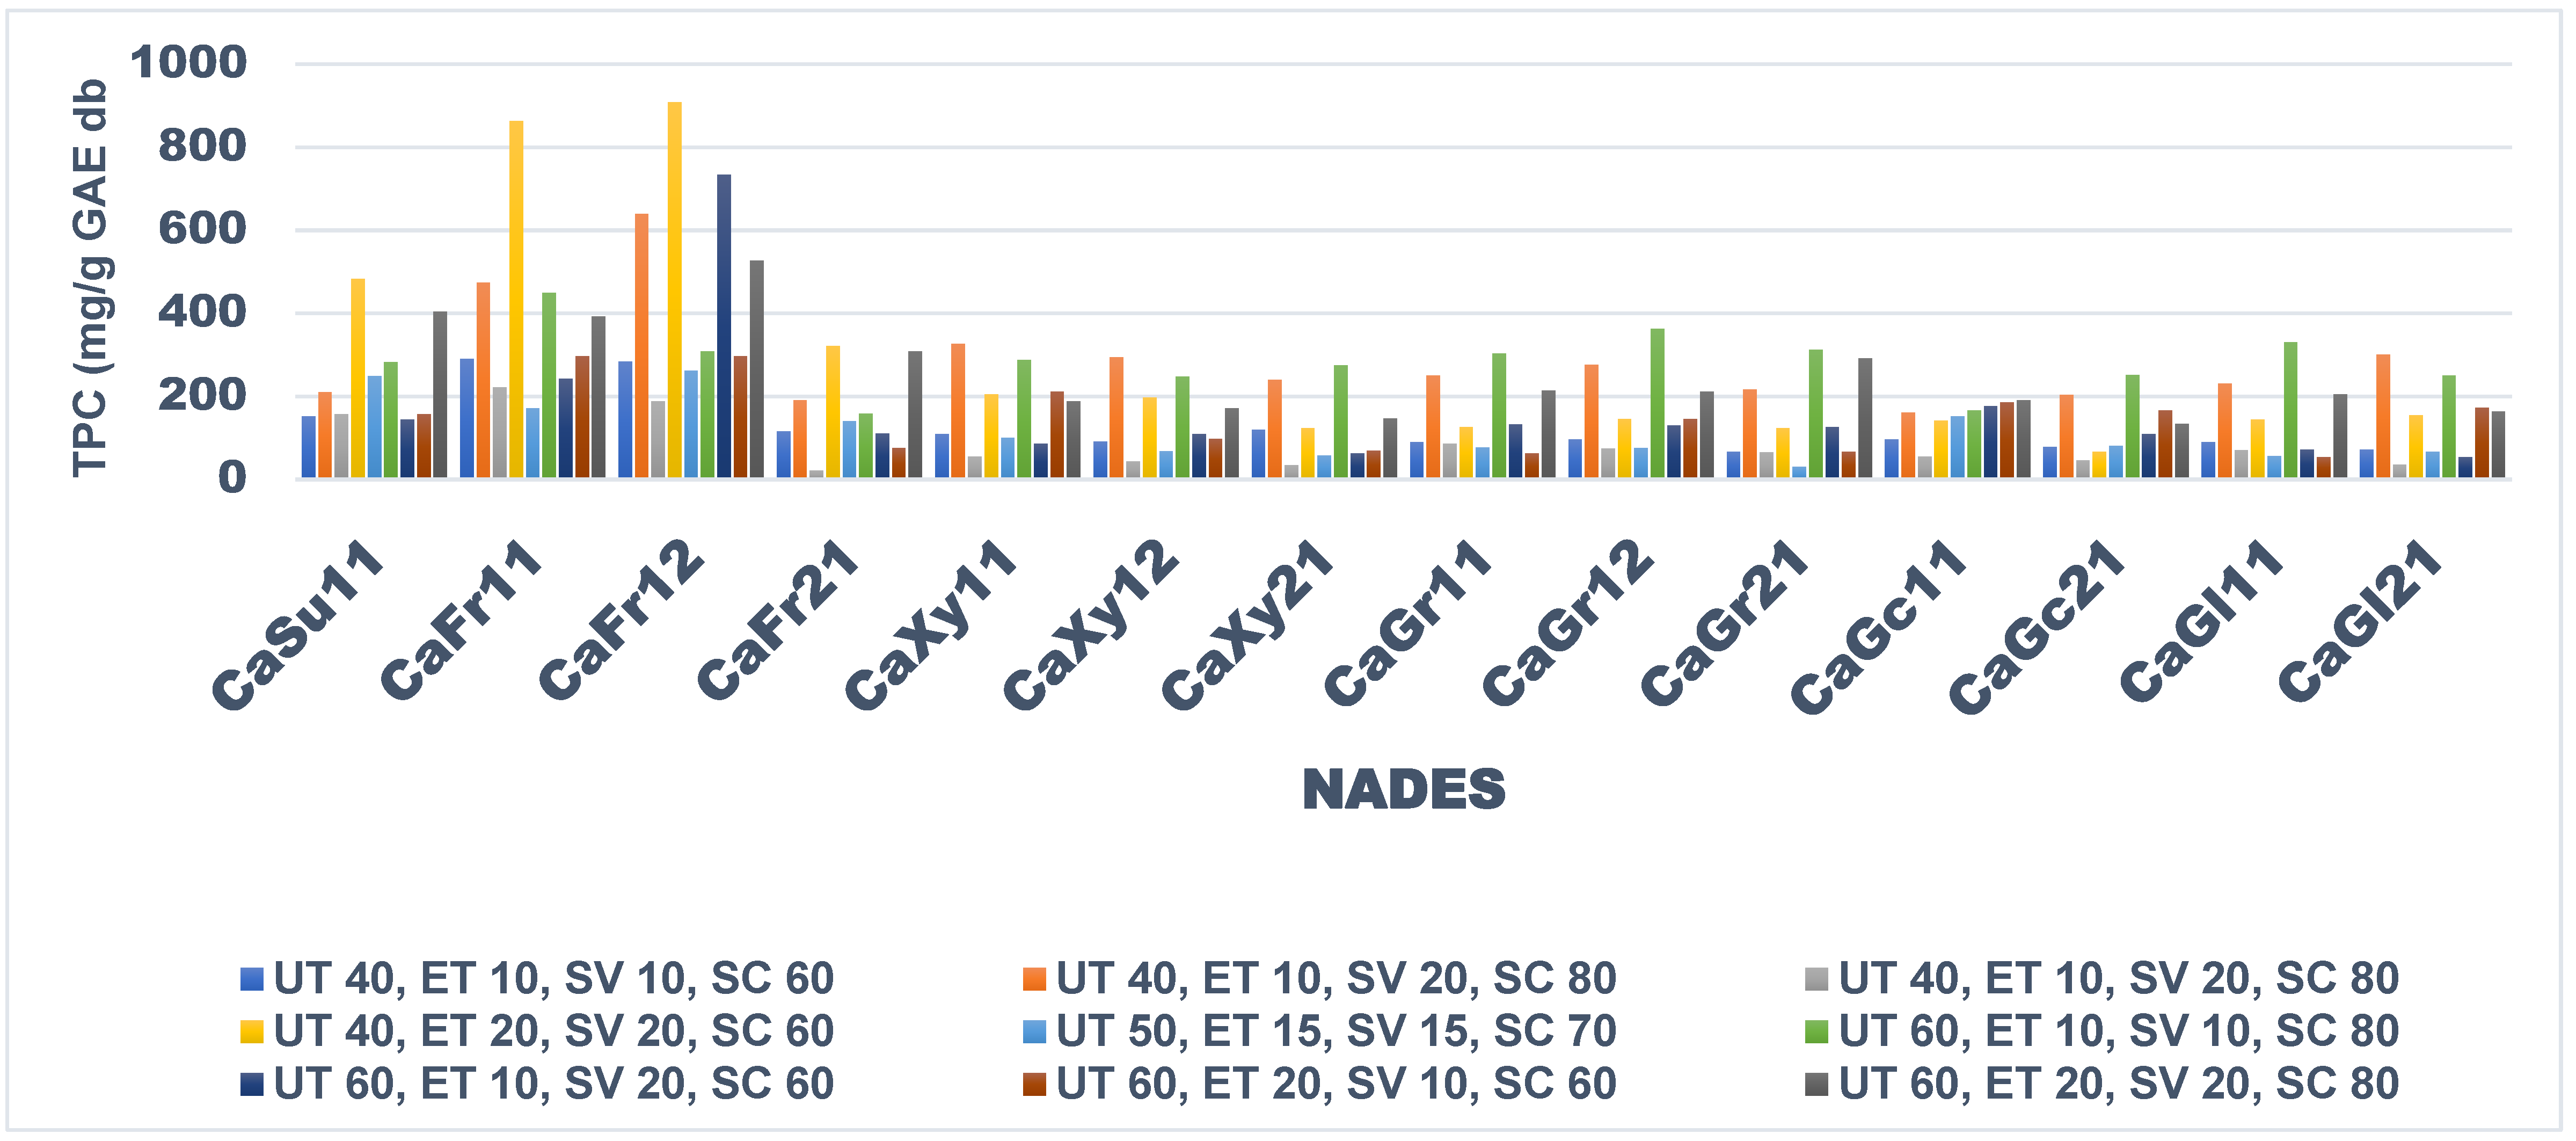
Figure 2.
Effects of extraction conditions, HBD types, and HBA:HBD ratios on the extraction of TPC from ANP using NADES-UAE technique.
Figure 2.
Effects of extraction conditions, HBD types, and HBA:HBD ratios on the extraction of TPC from ANP using NADES-UAE technique.
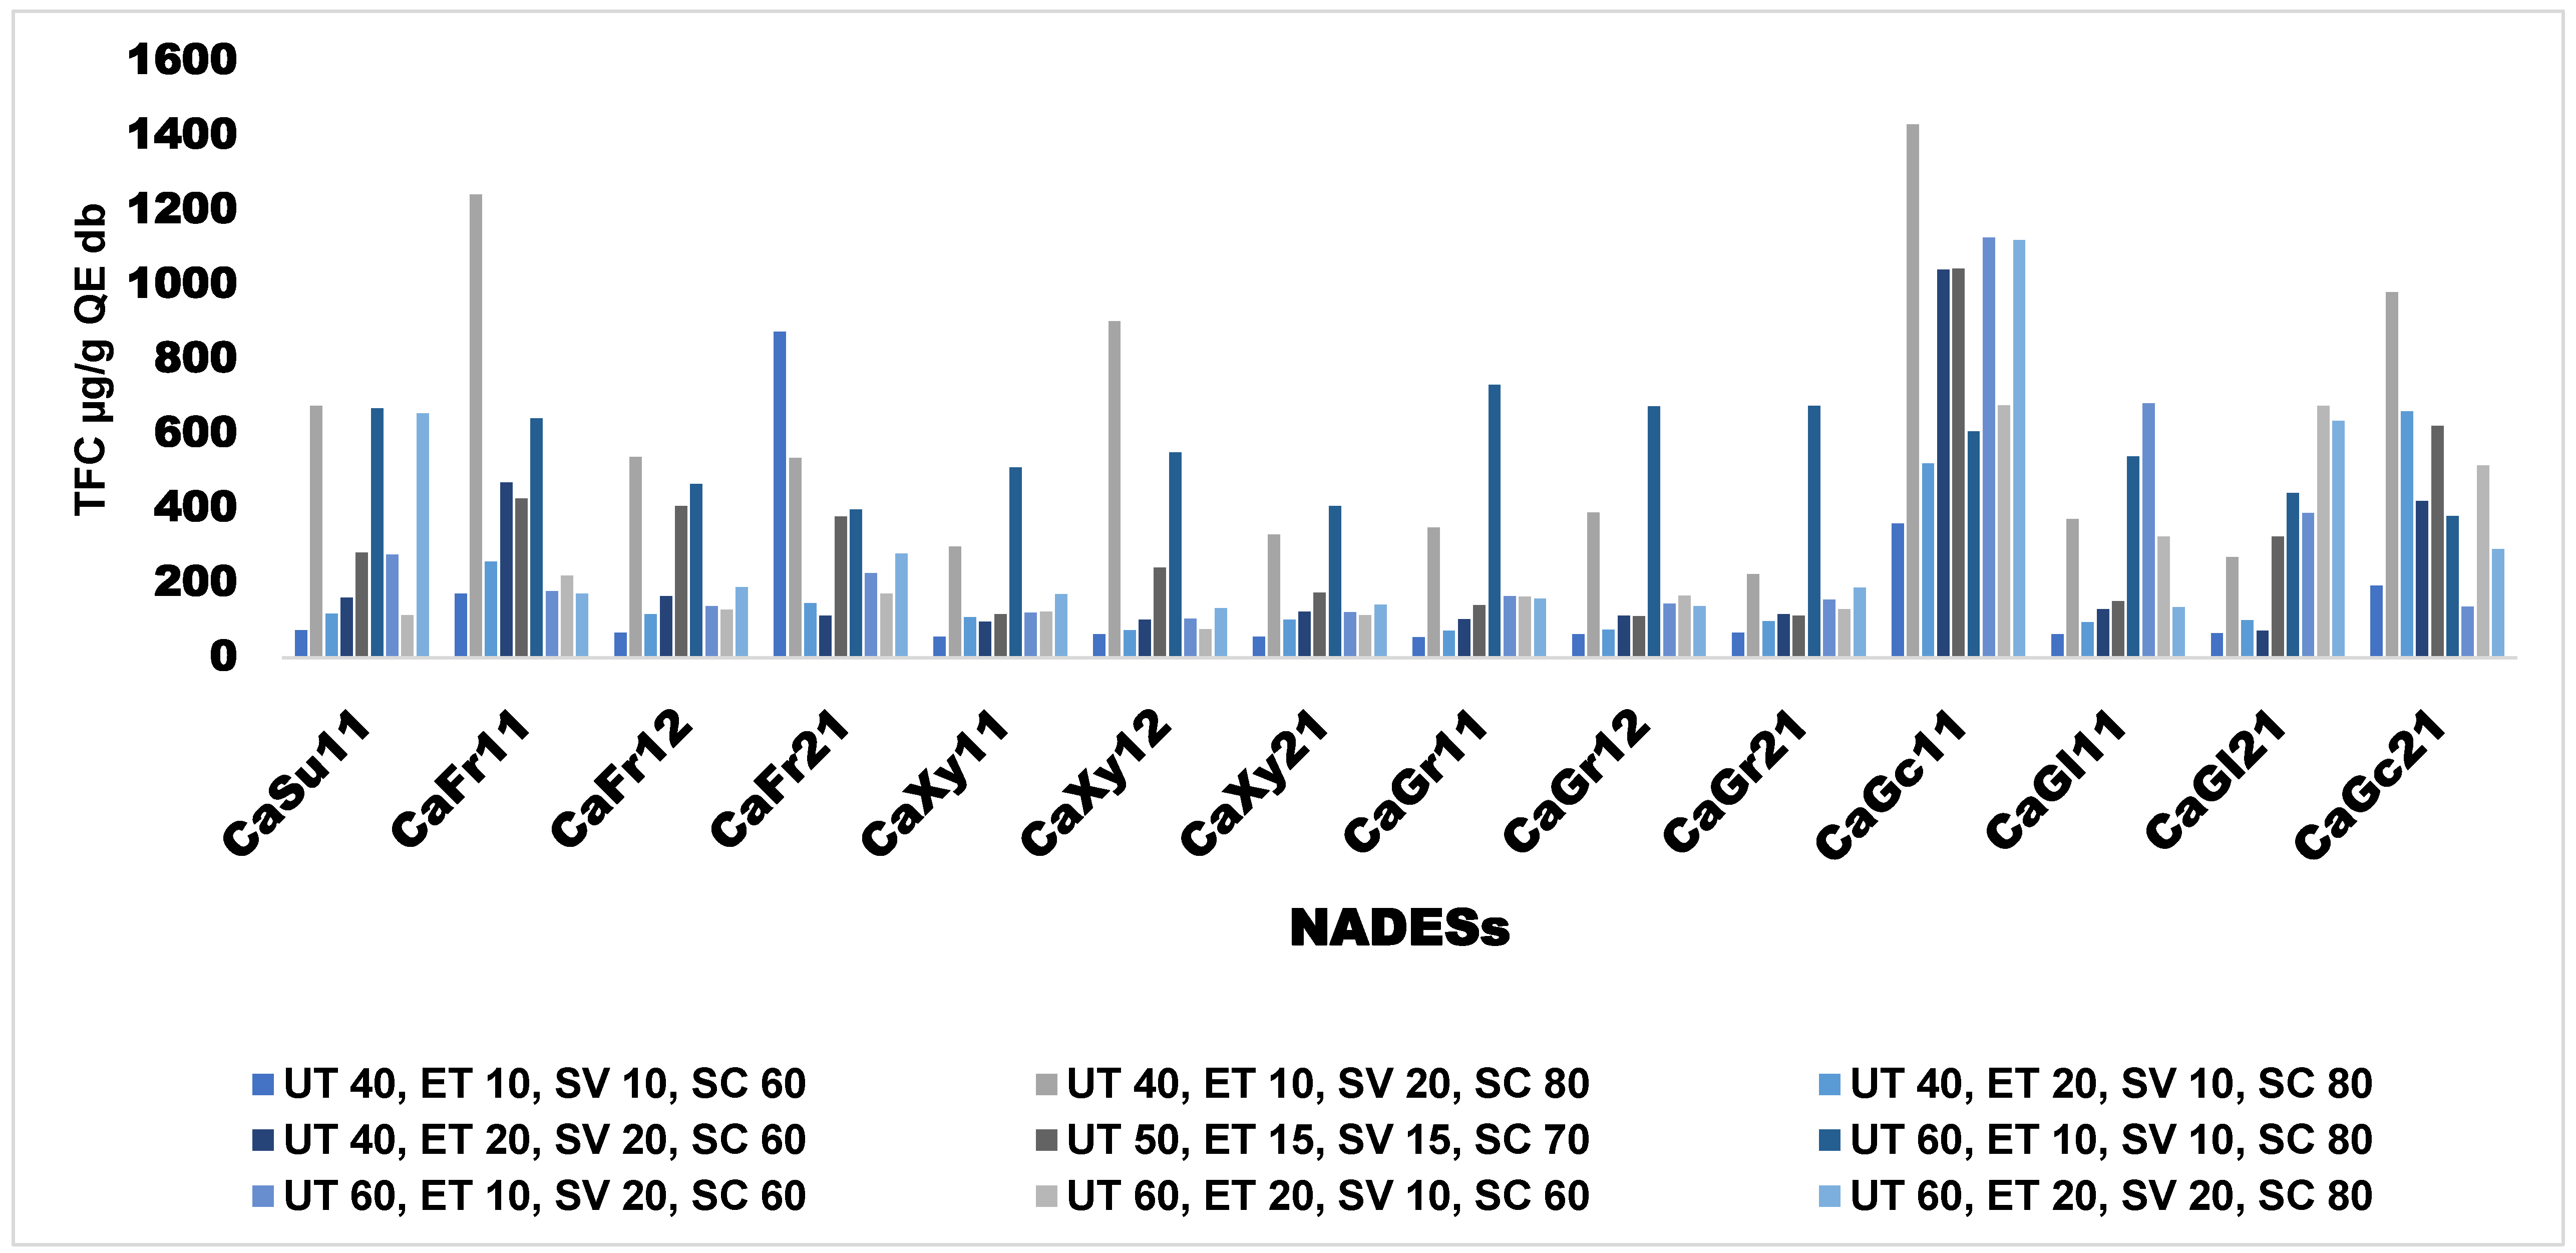
Figure 3.
Effects of extraction conditions, HBD types, and HBA:HBD ratios on FRAP antiradical activity of ANP extracts using NADES-UAE technique.
Figure 3.
Effects of extraction conditions, HBD types, and HBA:HBD ratios on FRAP antiradical activity of ANP extracts using NADES-UAE technique.
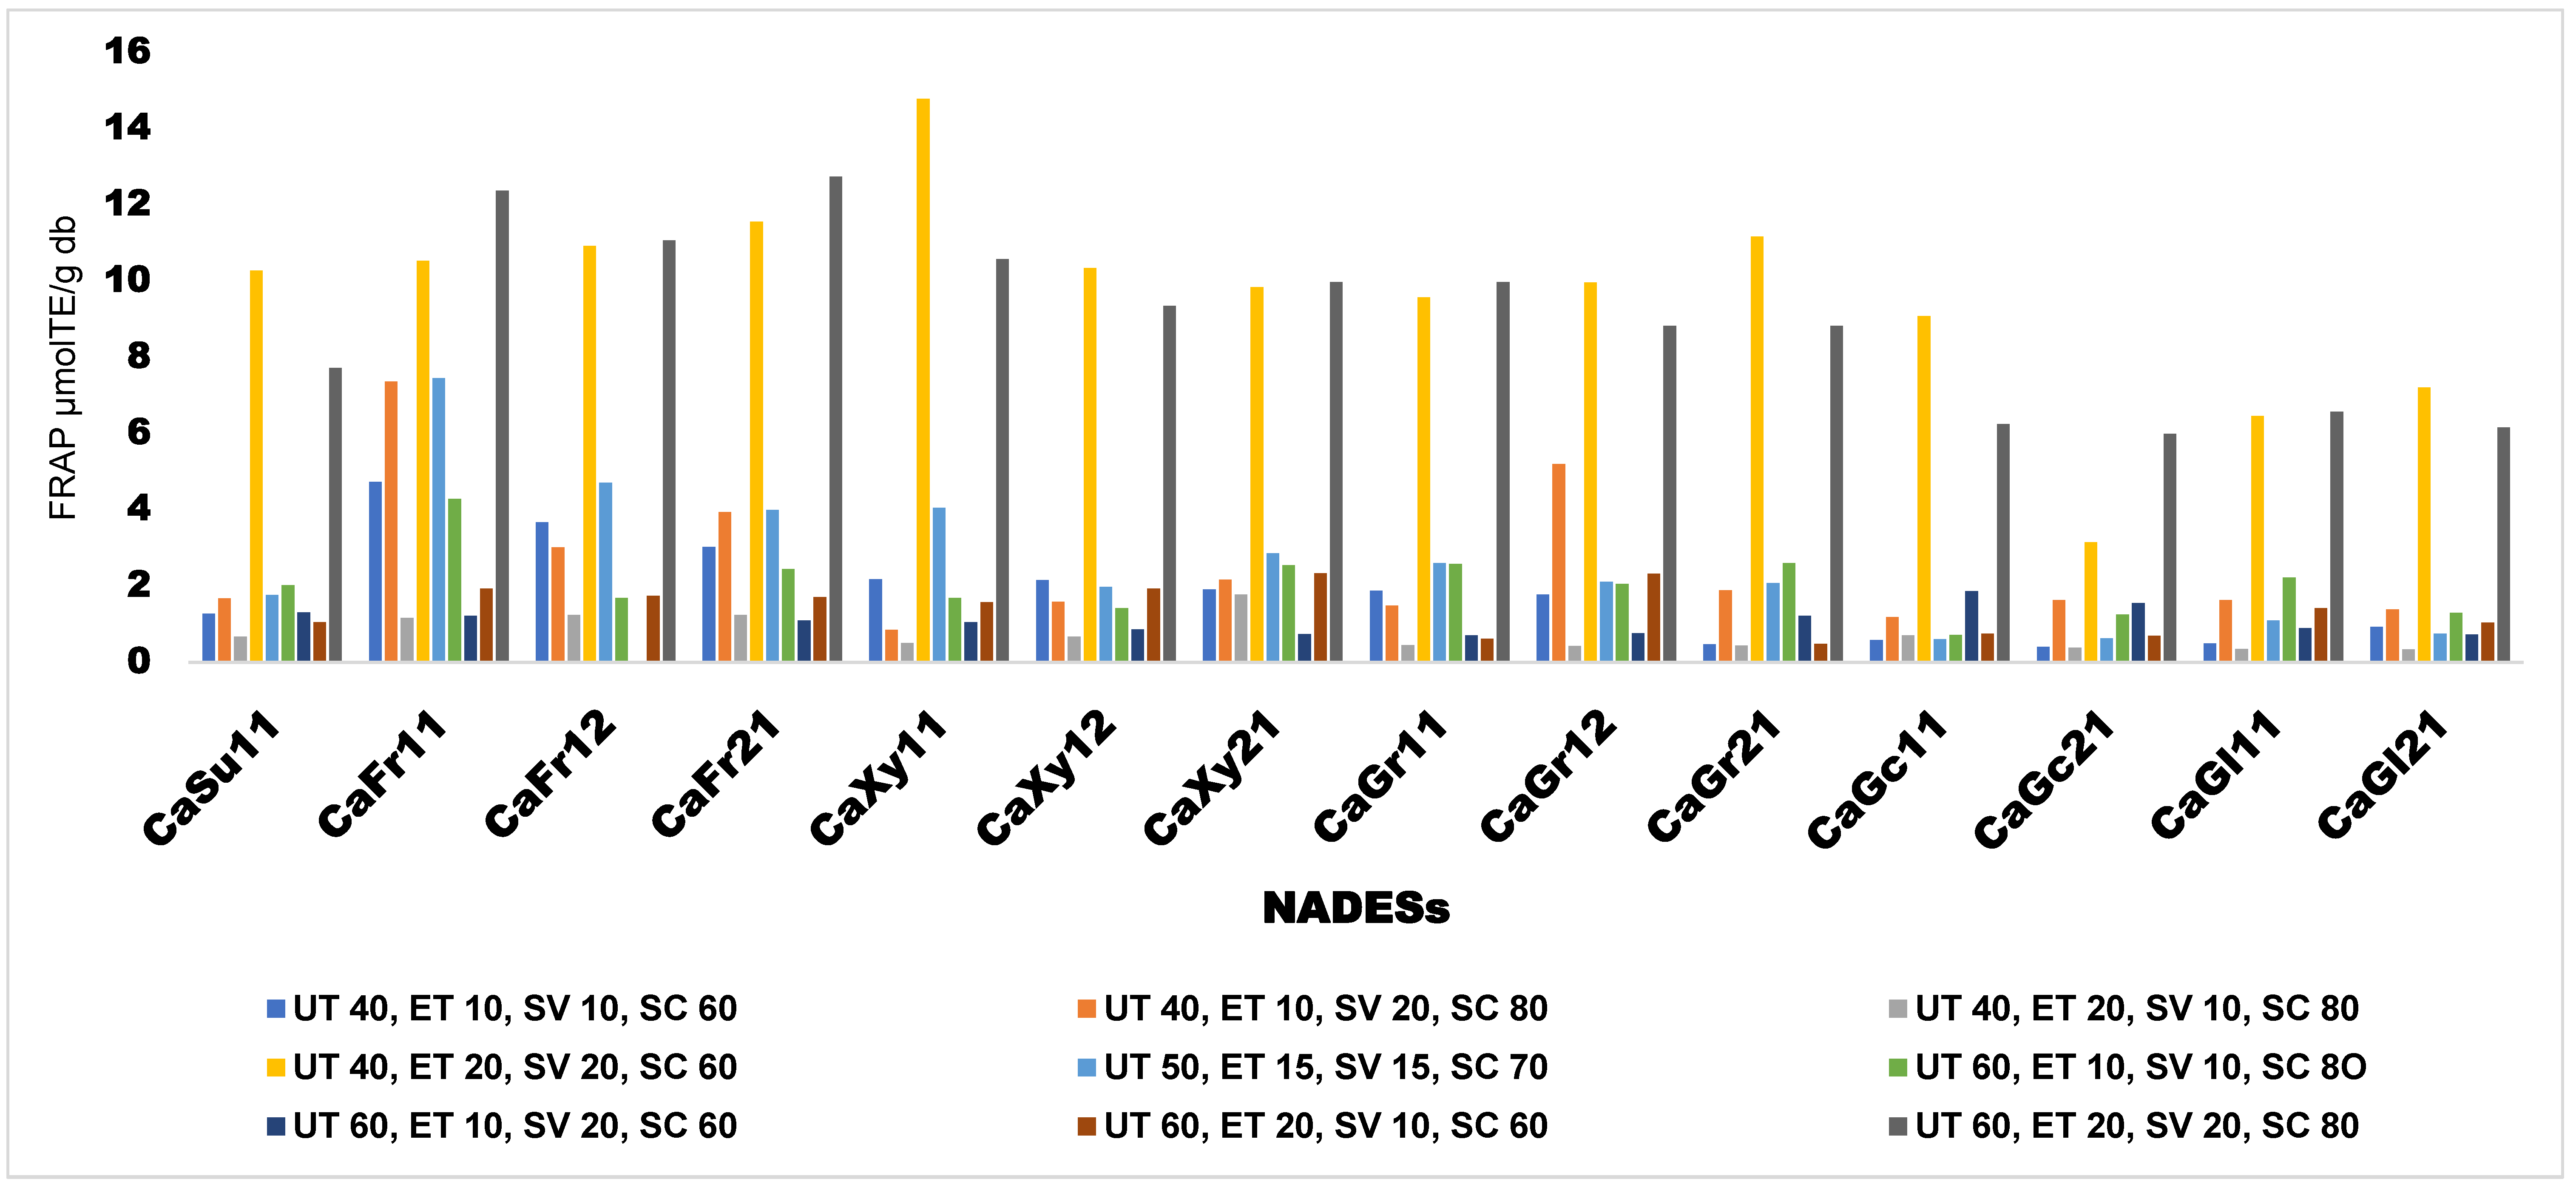
Figure 4.
Effects of extraction conditions, HBD types, and HBA:HBD ratios on CUPFRAC antiradical activity of ANP extracts using NADES-UAE technique
Figure 4.
Effects of extraction conditions, HBD types, and HBA:HBD ratios on CUPFRAC antiradical activity of ANP extracts using NADES-UAE technique


Table 1.
Screening experiment for ultrasound-assisted synthesis of NADESs.
| Run | A | B | C | Temperature (°C) | Time (h) | HBA:HBD ratio |
| 1 | 2 | 3 | 1 | 70 | 2.0 | 1:1 |
| 2 | 2 | 1 | 2 | 70 | 1.0 | 1:2 |
| 3 | 2 | 2 | 3 | 70 | 1.5 | 2:1 |
| 4 | 2 | 3 | 2 | 70 | 2.0 | 1:2 |
| 5 | 1 | 1 | 1 | 50 | 1.0 | 1:1 |
| 6 | 3 | 2 | 2 | 90 | 1.5 | 1:2 |
| 7 | 1 | 1 | 2 | 50 | 1.0 | 1:2 |
| 8 | 3 | 3 | 3 | 90 | 2.0 | 2:1 |
| 9 | 1 | 2 | 3 | 50 | 1.5 | 2:1 |
| 10 | 1 | 3 | 2 | 50 | 2.0 | 1:2 |
| 11 | 2 | 2 | 2 | 70 | 1.5 | 1:2 |
| 12 | 3 | 1 | 2 | 90 | 1.0 | 1:2 |
| 13 | 1 | 1 | 3 | 50 | 1.0 | 2:1 |
| 14 | 2 | 3 | 3 | 70 | 2.0 | 2:1 |
| 15 | 3 | 3 | 1 | 90 | 2.0 | 1:1 |
| 16 | 1 | 3 | 3 | 50 | 2.0 | 2:1 |
| 17 | 1 | 3 | 1 | 50 | 2.0 | 1:1 |
| 18 | 3 | 1 | 1 | 90 | 1.0 | 1:1 |
| 19 | 3 | 1 | 3 | 90 | 1.0 | 2:1 |
| 20 | 3 | 3 | 2 | 90 | 2.0 | 1:2 |
| 21 | 2 | 2 | 1 | 70 | 1.5 | 1:1 |
| 22 | 1 | 2 | 1 | 50 | 1.5 | 1:1 |
| 23 | 2 | 1 | 1 | 70 | 1.0 | 1:1 |
| 24 | 3 | 2 | 1 | 90 | 1.5 | 1:1 |
| 25 | 2 | 1 | 3 | 70 | 1.0 | 2.1 |
| 26 | 1 | 2 | 2 | 50 | 1.5 | 1:2 |
| 27 | 3 | 2 | 3 | 90 | 1.5 | 2:1 |
Table 2.
Two by four fraction factorial (MFAT) design with two center points for screening extraction of phenolic compounds from African nutmeg peels with NADES-UAE technique.
Table 2.
Two by four fraction factorial (MFAT) design with two center points for screening extraction of phenolic compounds from African nutmeg peels with NADES-UAE technique.
| Model ID | (A)Temperature (°C) | (B)Time (min) | (C)Volume (ml) | (D)Concentration (%) |
| (1) | - (40) | - (10) | - (10) | - (60) |
| c | - (40) | - (10) | + (20) | - (60) |
| ab | + (60) | + (20) | - (10) | - (60) |
| ac | +(60) | -(10) | +(20) | -(60) |
| ad | + (60) | - (10) | - (10) | + (80) |
| bc | -(40) | + (20) | + (20) | -(60) |
| cd | - (40) | - (10) | + (20) | + (80) |
| abcd | + (60) | + (20) | + (20) | + (80) |
| Ç | 0 (50) | 0 (15) | 0 (15) | 0 (70) |
| Ç | 0 (50) | 0 (15) | 0 (150 | 0 (70) |
Ç is the central point.
Table 3.
Central Composite Design of Response Surface Methodology for Optimization of extraction of Phenolic compounds from African nutmeg peels with NADES-UAE technique.
Table 3.
Central Composite Design of Response Surface Methodology for Optimization of extraction of Phenolic compounds from African nutmeg peels with NADES-UAE technique.
| Variables | Coded levels | ||||
| -α | -1 | 0 | +1 | +α | |
| Experimental Actual Values | |||||
| Ultrasound temperature (UT) (°C) | 30 | 40 | 50 | 60 | 70 |
| Extraction time (ET) (min) | 5 | 10 | 15 | 20 | 25 |
| Solvent volume (SV) (ml) | 5 | 10 | 15 | 20 | 25 |
| Solvent concentration (SC) (%) | 50 | 60 | 70 | 80 | 90 |
Table 4.
Natural deep eutectic solvents (NADESs), synthesis conditions, and physical appearance.
| S/No | Code | HBA | HBD |
HBA: HBD ratio |
Synthesis temperature (°C) |
Synthesis time (min) |
Physical Appearance |
| 1 | CaSu11 | Citric acid | Sucrose | 1:1 | 70 | 60 | Orange- yellow |
| 2 | CaFr11 | Citric acid | Fructose | 1:1 | 70 | 60 | Faintly- yellow |
| 3 | CaFr12 | Citric acid | Fructose | 1:2 | 70 | 60 | Yellow |
| 4 | CaFr21 | Citric acid | Fructose | 2:1 | 70 | 60 | Yellow |
| 5 | CaXy11 | Citric acid | Xylitol | 1:1 | 70 | 60 | Colourless |
| 6 | CaXy12 | Citric acid | Xylitol | 1:2 | 70 | 60 | Colourless |
| 7 | CaXy21 | Citric acid | Xylitol | 2:1 | 70 | 60 | Colourless |
| 8 | CaGr11 | Citric acid | Glycerol | 1:1 | 70 | 60 | Colourless |
| 9 | CaGr12 | Citric acid | Glycerol | 1:2 | 70 | 60 | Colourless |
| 10 | CaG21 | Citric acid | Glycerol | 2:1 | 70 | 60 | Colourless |
| 11 | CaGc11 | Citric acid | Glycine | 1:1 | 70 | 60 | Colourless |
| 12 | CaGc21 | Citric acid | Glycine | 2:1 | 70 | 60 | Colourless |
| 13 | CaGl11 | Citric acid | Glucose | 1:1 | 70 | 60 | Yellow |
| 14 | CaGl21 | Citric acid | Glucose | 2:1 | 70 | 60 | yellow |
Table 5.
Physical Properties of the synthesized NADESs.
| NADESs | HBA | HBD | Ratio | pH | Water activity | Viscosity (pa. s) | Density (g/cm3) |
| CaSu11 | Citric acid | sucrose | 1:1 | 1.92±0.00C | 0.73±0.010F | 0.3545±0.0003A | 1.3768±0.0002A |
| CaFr11 | Citric acid | fructose | 1:1 | 1.75±0.01H | 0.77±0.006DE | 0.0805±0.0001F | 1.3293±0.0003B |
| CaFr12 | Citric acid | fructose | 1:2 | 1.90±0.01C | 0.76±0.010E | 0.1797±0.0002B | 1.3768±0.0008A |
| CaFr21 | Citric acid | fructose | 2:1 | 1.84±0.00EF | 0.72±0.010FG | 0.1221±0.0001D | 1.3770±0.0000A |
| CaXy11 | Citric acid | xylitol | 1:1 | 1.85±0.05E | 0.78±0.010CD | 0.0269±0.0001J | 1.2818±0.0004C |
| CaXy12 | Citric acid | xylitol | 1:2 | 1.90±0.03C | 0.76±0.010E | 0.0806±0.0002F | 1.2818±0.0008C |
| CaXy21 | Citric acid | xylitol | 2:1 | 1.89±0.03CD | 0.72±0.006FG | 0.0871±0.0001E | 1.3293±0.0002B |
| CaGr11 | Citric acid | glycerol | 1:1 | 1.68±0.02I | 0.79±0.000C | 0.0131±0.0001M | 1.2344±0.0004D |
| CaGr12 | Citric acid | glycerol | 1:2 | 1.86±0.02DE | 0.77±0.010DE | 0.0191±0.0020L | 1.2344±0.0006D |
| CaGr21 | Citric acid | glycerol | 2:1 | 1.78±0.01GH | 0.77±0.010DE | 0.0525±0.0005H | 1.3293±0.0003B |
| CaGc11 | Citric acid | glycine | 1:1 | 2.61±0.04A | 0.83±0.010A | 0.0204±0.0000K | 1.3293±0.0004B |
| CaGc21 | Citric acid | glycine | 2:1 | 2.39±0.01B | 0.81±0.000B | 0.0760±0.0020G | 1.3293±0.0004B |
| CaGl11 | Citric acid | glucose | 1:1 | 1.81±0.01FG | 0.77±0.010DE | 0.0438±0.0001I | 1.2818±0.0004C |
| CaGl21 | Citric acid | glucose | 2:1 | 1.71±0.01I | 0.71±0.010G | 0.1313±0.0002C | 1.3293±0.0003B |
Means that do not share a letter are significantly different.
Table 6.
Prominent Characteristic functional groups in the FTIR peaks of the Synthesized NADESs.
|
NADESs |
PEAKS | |||||||||
| 1(OH) | 2(CH) | 3(RCOOR) | 4(C=C) | 5(=CH2) | 6 | 7 | 8 | 9(C-O) | 10(C=C; =CH2) | |
| CaSu11 | 3306 | 2936 | 1713 | 1639 | 1400 | 1333 | 1209 | 1101 | 1028 | 897 |
| CaFr11 | 3327 | 2941 | 1715 | 1655 | 1638 | 1398 | 1339 | 1217 | 1140 | 1101 |
| CaFr12 | 3288 | 2941 | 1717 | 1655 | 1647 | 1639 | 1398 | 1341 | 1217 | 1144 |
| CaFr21 | 3375 | 2943 | 1711 | 1638 | 1398 | 1319 | 1206 | 1130 | 1103 | 1057 |
| CaXy11 | 3321 | 2949 | 1713 | 1638 | 1398 | 1211 | 1126 | 1057 | 1001 | 876 |
| CaXy12 | 3298 | 2943 | 1713 | 1639 | 1398 | 1317 | 1211 | 1125 | 1096 | 1001 |
| CaXy21 | 3385 | 3246 | 2949 | 2565 | 1709 | 1632 | 1396 | 1204 | 1119 | 1043 |
| CaGr11 | 3358 | 2951 | 1713 | 1639 | 1396 | 1319 | 1211 | 1113 | 1042 | 991 |
| CaGr12 | 3287 | 2949 | 1717 | 1639 | 1396 | 1319 | 1209 | 1111 | 1040 | 991 |
| CaGr21 | 3368 | 2955 | 2581 | 1709 | 1638 | 1396 | 1317 | 1119 | 1043 | 989 |
| CaGc11 | 3374 | 3231 | 1711 | 1624 | 1508 | 1406 | 1319 | 1219 | 1125 | 1038 |
| CaGc21 | 3393 | 3208 | 2953 | 2615 | 1709 | 1624 | 1508 | 1398 | 1319 | 1209 |
| CaGl11 | 3321 | 2936 | 1713 | 1638 | 1398 | 1317 | 1213 | 1105 | 1076 | 1028 |
| CaGl21 | 3372 | 3218 | 2941 | 2585 | 1713 | 1636 | 1396 | 1315 | 1206 | 1109 |
Table 7.
Antioxidant and antiradical scavenging power of African nutmeg peels extracted with NADESs based on MFAT experimental design.
Table 7.
Antioxidant and antiradical scavenging power of African nutmeg peels extracted with NADESs based on MFAT experimental design.
| NADESs | Runs | TPC (mgGAE/g) |
TFC (µgQE/g) |
FRAP (µMTE/g) | CUPRAC (µMTE/g) |
| CaSu11 | 30 | 270.6B | 331.3BCD | 2.954BC | 3.147A |
| CaFr11 | 30 | 389.2A | 421.4BC | 5.848A | 4.718A |
| CaFr12 | 30 | 458.0A | 262.7CD | 4.278ABC | 4.341A |
| CaFr21 | 30 | 163.7C | 271.3CD | 4.571AB | 4.359A |
| CaXy11 | 30 | 174.3BC | 172.1D | 4.132ABC | 3.910A |
| CaXy12 | 30 | 136.7C | 249.2CD | 3.225ABC | 3.274A |
| CaXy21 | 30 | 125.3C | 175.0D | 3.696ABC | 3.934A |
| CaGr11 | 30 | 147.8C | 208.7D | 3.246ABC | 4.241A |
| CaGr12 | 30 | 167.6C | 199.0D | 3.552ABC | 4.101A |
| CaGr21 | 30 | 143.4C | 188.7D | 3.123ABC | 4.393A |
| CaGc11 | 30 | 146.93C | 897.3A | 2.236BC | 3.852A |
| CaGc21 | 30 | 123.0C | 482.6B | 1.641C | 3.790A |
| CaGl11 | 30 | 143.3C | 265.3CD | 2.222BC | 3.798A |
| CaGl21 | 30 | 139.0C | 330.1BCD | 2.057BC | 3.626A |
(Means that do not share a letter are significantly different.).
Table 8.
Experimental conditions and results for the extraction of phenolic compounds from, and antiradical scavenging activity of ANP using NADES-UAE techniques according to a central composite response surface design.
Table 8.
Experimental conditions and results for the extraction of phenolic compounds from, and antiradical scavenging activity of ANP using NADES-UAE techniques according to a central composite response surface design.
| Run | Exp. ID | Conditionsª | Responseɓ | |||||||
| X1 | X2 | X3 | X4 |
TPC (mgGAE/g) |
TFC (µgQE/g) |
CUPRAC (µMTE/g) |
FRAP (µMTE/g) |
DPPH (% | ||
| 1 | abd | 60 (1) | 20 (1) | 10 (-1) | 80 (1) | 179.09±0.75 | 61.328±0.78 | 3.1702±0.01 | 0.7490±0.01 | 26.7±0.1 |
| 2 | b | 40 (-1) | 20 (1) | 10 (-1) | 60 (-1) | 113.4±2.47 | 116.41±1.56 | 6.2274±0.03 | 0.7387±0.01 | 89.6±0.1 |
| 3 | 0 | 50 (0) | 15 (0) | 15 (0) | 70 (0) | 260.05±0.42 | 339.26±1.17 | 4.8886±0.04 | 1.0656±0.01 | 89.0±0.1 |
| 4 | (1) * | 40 (-1) | 10 (-1) | 10 (-1) | 60 (-1) | 164.05±1.58 | 60.026±1.19 | 3.1864±0.03 | 0.8105±0.016 | 53.6±0.1 |
| 5 | ab | 60 (1) | 20 (1) | 10 (-1) | 60 (-1) | 229.25±0.28 | 75.65±1.97 | 3.1702±0.03 | 1.7003±0.009 | 17.2±0.2 |
| 6 | d | 40 (-1) | 10 (-1) | 10 (-1) | 80 (1) | 168.63±0.98 | 546.61±1.8 | 6.3889±0.03 | 1.539±0.018 | 14.6±0.1 |
| 7 | cd | 40 (-1) | 10 (-1) | 20 (1) | 80 (1) | 635.29±1.96 | 457.03±10.9 | 8.0685±0.06 | 2.7236±0.009 | 18.4±0.1 |
| 8 | bc | 40 (-1) | 20 (1) | 20 (1) | 60 (-1) | 650.33±0.57 | 120.57±1.8 | 6.4212±0.03 | 10.267±0.018 | 10.5±0.4 |
| 9 | abc | 60 (1) | 20 (1) | 20 (1) | 60 (-1) | 221.24±1.13 | 414.32±1.8 | 6.292±0.11 | 1.9903±0.018 | 13.7±0.2 |
| 10 | ad | 60 (1) | 10 (-1) | 10 (-) | 80 (1) | 322.71±0.28 | 284.51±0.9 | 4.196±0.01 | 1.2618±0.009 | 7.33±0.6 |
| 11 | bd | 40 (-1) | 20 (10 | 10 (-) | 80 (1) | 183.5±1.02 | 61.59±1.8 | 3.2187±0.01 | 0.7413±0.009 | 19.2±0.1 |
| 12 | ac | 60 (1) | 10 (-1) | 20 (1) | 60 (-1) | 695.42±2.83 | 123.7±1.8 | 6.2435±0.03 | 1.4774±0.009 | 21.5±0.2 |
| 13 | abcd | 60 (1) | 20 (1) | 20 (1) | 80 (1) | 276.47±0.98 | 122.14±4.51 | 6.4212±0.06 | 1.4364±0.018 | 31.7±0.2 |
| 14 | a | 60 (1) | 10 (-1) | 10 (-) | 60 (-1) | 237.09±1.98 | 59.245±0.45 | 3.0895±0.01 | 0.7439±0.013 | 63.9±0.1 |
| 15 | c | 40 (-1) | 10 (-1) | 20 (1) | 60 (1-) | 379.09±1.13 | 831.77±3.61 | 12.6163±0.1 | 1.5441±0.009 | 1.51±0.1 |
| 16 | acd | 60 (1) | 10 (-1) | 20 (1) | 80 (1) | 406.54±3.01 | 1313.0±3.61 | 12.33±0.01 | 2.9344±0.018 | 24.9±0.1 |
| 17 | bcd | 40 (-1) | 20 (1) | 20 (1) | 80 (1) | 620.92±1.13 | 755.73±7.22 | 12.52±0.01 | 3.0164±0.018 | 74.7±0.1 |
| 18 | cα | 50 (0) | 15 (0) | 25 (α) | 70 (0) | 231.21±1.42 | 345.7±6.77 | 15.4877±0.14 | 3.7449±0.044 | 73.6±0.3 |
| 19 | aα | 70 (α) | 15 (0) | 15 (0) | 70 (0) | 370.74±1.95 | 91.99±4.06 | 4.6827±0.02 | 1.0735±0.007 | 20.6±0.2 |
| 20 | dα | 50 (0) | 15 (0) | 15 (0) | 90 (α) | 148.04±0.85 | 290.23±1.35 | 9.3653±0.04 | 2.3854±0.027 | 22.4±0.4 |
| 21 | bα | 50 (0) | 25 (α) | 15 (0) | 70 (0) | 409.31±3.06 | 347.27±5.41 | 9.3411±0.04 | 2.17±0.013 | 15.5±0.1 |
| 22 | -bα | 50 (0) | 5 (-α) | 15 (0) | 70 (0) | 302.45±2.25 | 311.33±5.41 | 9.2926±0.08 | 2.2623±0.013 | 17.9±0.2 |
| 23 | -aα | 30 (-α) | 15 (0) | 15 (0) | 70 (0) | 100±1.47 | 862.89±5.41 | 9.6318±0.04 | 2.1931±0.013 | 3.15±0.4 |
| 24 | -dα | 50 (0) | 15 (0) | 15 (0) | 50 (-α) | 332.84±1.12 | 130.27±0.68 | 4.8401±0.06 | 1.1273±0.02 | 20.2±0.3 |
| 25 | -cα | 50 (0) | 15 (0) | 5 (-α) | 70 (0) | 147.22±1.5 | 60.286±0.45 | 3.1379±0.01 | 0.521±0.346 | 62.1±0.1 |
ª X1: temperature (◦C); X2: time (min); X3: volume (mL); concentration (%). Actual and coded (in parenthesis) values. ɓ TPC (mg GAE/g db); TFC (µG QE/g db); CUPRAC and FRAP in (µmol TE/g db). Mean ±SD of 3 replicates.
Table 9.
Analysis of variance (ANOVA) summary statistics for response surface modelling of extraction of phenolic compounds and antiradical scavenging activity of ANP using CaFr12 NADES-UAE techniques.
Table 9.
Analysis of variance (ANOVA) summary statistics for response surface modelling of extraction of phenolic compounds and antiradical scavenging activity of ANP using CaFr12 NADES-UAE techniques.
| Model compª. | Response | |||||||||
| TPC | TFC | CUPRAC | FRAP | DPPH | ||||||
| F-value | p-value | F-value | p-value | F-value | p-value | F-value | p-value | F-value | P-value | |
| X1 | 0.25 | 0.618 | 10.83 | 0.002 | 18.64 | 0.000 | 16.18 | 0.000 | 0.21 | 0.650 |
| X2 | 1.09 | 0.301 | 9.18 | 0.003 | 3.17 | 0.079 | 6.95 | 0.010 | 10.18 | 0.003 |
| X3 | 63.61 | 0.000 | 30.93 | 0.000 | 148.55 | 0.000 | 65.15 | 0.000 | 3.80 | 0.058 |
| X4 | 0.75 | 0.390 | 11.72 | 0.001 | 13.75 | 0.000 | 2.68 | 0.106 | 0.46 | 0.500 |
| X12 | 0.39 | 0.536 | 3.15 | 0.080 | 3.02 | 0.086 | 1.62 | 0.208 | 62.54 | 0.000 |
| X22 | 11.16 | 0.001 | 0.06 | 0.811 | 21.31 | 0.000 | 6.74 | 0.011 | 54.39 | 0.000 |
| X32 | 0.02 | 0.896 | 1.14 | 0.289 | 21.26 | 0.000 | 5.32 | 0.024 | 3.21 | 0.081 |
| X42 | 0.88 | 0.353 | 0.99 | 0.324 | 2.78 | 0.100 | 8.02 | 0.006 | 47.25 | 0.000 |
| X1X2 | 15.10 | 0.000 | 0.28 | 0.601 | 1.59 | 0.212 | 14.28 | 0.000 | 80.73 | 0.000 |
| X1X3 | 16.61 | 0.000 | 0.05 | 0.825 | 1.46 | 0.231 | 20.22 | 0.000 | 1.50 | 0.227 |
| X1X4 | 3.59 | 0.051 | 0.68 | 0.413 | 2.01 | 0.161 | 6.39 | 0.014 | 1.00 | 0.323 |
| X2X3 | 0.41 | 0.526 | 1.79 | 0.184 | 2.36 | 0.129 | 13.53 | 0.000 | - | - |
| X2X4 | 0.00 | 0.963 | 6.14 | 0.015 | 18.64 | 0.000 | 30.21 | 0.000 | - | - |
| X3X4 | 0.22 | 0.643 | 1.04 | 0.312 | 3.17 | 0.079 | 5.65 | 0.020 | - | - |
| model | 10.24 | 0.000 | 73.67 | 0.000 | 38.4 | 0.000 | 19.934 | 0.000 | 35.512 | 0.000 |
| Lack of fit | 0.62 | 0.843 | 0.028 | 0.963 | 0.270 | 0.801 | 0.24 | 0.968 | 0.71 | 0.812 |
| Pure error | 0.84 | 0.49 | 0.65 | 0.18 | 0.92 | |||||
ª X1 temperature in °c, X2 time in min, X3 solvent volume in ml, X4 solvent concentration in %, X12; X22; X32, and X42 are the square factors corresponding quadratic functions, while X1X2; X1X3; X1X4; X2X3; X2X4; and X3X4 are the various factor interactions. P-values in bold are statistically significant.
Table 10.
Regression coefficients for full quadratic response surface models (in coded variables) for the study of extraction of phenolics and antiradical scavenging activity of ANP using CaFr12 as solvent with ultrasound-assisted extraction techniques.
Table 10.
Regression coefficients for full quadratic response surface models (in coded variables) for the study of extraction of phenolics and antiradical scavenging activity of ANP using CaFr12 as solvent with ultrasound-assisted extraction techniques.
| Coefficientsª | TPC | TFC | CUPRAC | FRAP | DPPH |
| (I) | -2111 | -930 | 38.1 | 0.5 | -1825 |
| X1 | 52.6 | -66.6 | -0.479 | -0.085 | 28.17 |
| X2 | 17.3 | 129 | -0.144 | 1.051 | 45.73 |
| X3 | 102.6 | 33 | -0.526 | 0.681 | 7.48 |
| X4 | 1.2 | 43.2 | -0.572 | -0.298 | 23.25 |
| X12 | 0.075 | 0.428 | 0.00326 | 0.0014 | -0.181 |
| X22 | 1.603 | 0.231 | 0.03465 | 0.01142 | -0.6751 |
| X32 | - 0.063 | -1.032 | 0.03461 | 0.01073 | -0.1639 |
| X42 | 0.112 | -0.24 | 0.00313 | 0.00312 | -0.1573 |
| X1X2 | -1.221 | -0.332 | -0.00645 | -0.01086 | -0.4851 |
| X1X3 | -1.28 | 0.14 | -0.00627 | -0.01292 | -0.0662 |
| X1X4 | -0.312 | 0.26 | 0.00363 | 0.00363 | -0.0270 |
| X2X3 | -0.4 | -1.69 | -0.0157 | 0.02114 | - |
| X2X4 | - 0.015 | -1.566 | -0.00587 | -0.0158 | - |
| X3X4 | -0.146 | 0.644 | 0.00778 | -0.00683 | - |
| R2 | 0.984 | 0.9999 | 0.918 | 1.00 | 0.9992 |
| R2adj | 0.9779 | 0.9998 | 0.887 | 1.00 | 0.9988 |
| R2Pred | 0.9767 | 0.9997 | 0.882 | 1.00 | 0.9981 |
ª (I) the constant (intercept), X1 is temperature in °C, X2 is time in min, X3 is solvent volume in ml, X4 is solvent concentration in %, X12; X22; X32, and X42 are the squares of the corresponding factors, while X1X2; X1X3; X1X4; X2X4; and X3X4 are the various factor interactions.
Table 11.
Maximum desirability and predicted conditions for numeric optimization of TPC, TFC, CUPRAC, FRAP, and DPPH of African nutmeg peels.
Table 11.
Maximum desirability and predicted conditions for numeric optimization of TPC, TFC, CUPRAC, FRAP, and DPPH of African nutmeg peels.
| Parameters | Predicted optimum Factors to achieve the desirabilitya | Maximum desirability | |||
| UT (ºC) | ET (min) | SV (ml) | SC (%) | ||
| TPC | 45 | 5 | 25 | 90 | 0.993634 |
| TFC | 30 | 5 | 25 | 90 | 0.900334 |
| CUPRAC | 30 | 5 | 25 | 90 | 1.000000 |
| FRAP | 45 | 25 | 25 | 50 | 0.960543 |
| DPPH | 50 | 15 | 15 | 70 | 0.931252 |
a predicted optimum factors were rounded up to the whole numbers in multiples of five based on instrument calibration.
Table 12.
Optimized antioxidant and antiradical scavenging properties of AFP extracts by UAE-NADESs techniques: predicted (fitted) and experimental values, UAE-Water.
Table 12.
Optimized antioxidant and antiradical scavenging properties of AFP extracts by UAE-NADESs techniques: predicted (fitted) and experimental values, UAE-Water.
| NADESs | TPC (mgGAE/g) | TFC (µgQE/g) | CUPRAC (µMTE/g) | FRAP (µMTE/g) | DPPH (%) | |||||
| Fitted | Experimental | Fitted | Experimental | Fitted | Experimental | Fitted | Experimental | Fitted | Experimental | |
| CaSu11 | 732±128 | 860.02±4.7B | 1061±373 | 1176.0±13F | 23.27±3.1 | 24.76±0.39H | 26.28±3.1 | 26.17±0.17A | 79.18±7.3 | 72.24±0.15J |
| CaFr11 | 1269±332 | 1290.9±5.6A | 2329±427 | 2398.7±23A | 38.03±4.4 | 38.46±0.44A | 26.05±3.3 | 26.15±0.11B | 86.40±11 | 73.55±0.24I |
| CaFr12 | 711±142 | 748.64±12C | 1449±338 | 1446.0±12C | 26.20±2.8 | 26.24±0.31F | 16.75±1.3 | 17.31±0.12G | 89.65±7.4 | 84.19±0.35F |
| CaFr21 | 272.9±56.8 | 281.05±18L | 437.5±84.3 | 442.13±8.7L | 27.71±3.1 | 25.15±0.34G | 18.07±1.3 | 18.45±0.08E | 87.68±6.0 | 84.26±0.36F |
| CaXy11 | 375.±39.7 | 365.20±11K | 607±124 | 618.27±10J | 28.34±2.8 | 24.71±0.49H | 18.12±1.5 | 19.21±0.13D | 81.81±4.2 | 64.78±0.25K |
| CaXy12 | 577.1±41.5 | 588.78±9.4F | 1694±237 | 1777.1±10B | 25.96±3.0 | 28.92±0.53E | 17.11±1.7 | 18.13±0.11F | 94.20±13 | 97.42±0.40A |
| CaXy21 | 294.8±38.9 | 289.76±6.7L | 551±112 | 584.85±19K | 28.58±3.1 | 29.53±0.55D | 15.82±1.4 | 16.19±0.11I | 85.25±6.9 | 64.19±0.33L |
| CaGr11 | 507.7±67.7 | 539.76±16G | 621±168 | 633.85±20I | 31.72±2.7 | 32.29±0.52B | 16.41±1.0 | 17.04±0.09H | 86.43±9.2 | 83.55±0.25G |
| CaGr12 | 748.5±90.5 | 754.63±7.1C | 828±130 | 869.57±12H | 29.92±2.9 | 29.89±0.32CD | 17.07±1.5 | 18.52±0.18E | 90.52±6.2 | 89.71±0.31C |
| CaGr21 | 393.6±56.8 | 396.24±9.7J | 681±220 | 632.60±10I | 31.45±3.0 | 29.92±0.37C | 26.59±3.3 | 26.21±0.12C | 86.42±7.8 | 80.93±0.20H |
| CaGc11 | 498.8±90.5 | 475.22±8.6I | 1330±417 | 1354.4±15D | 22.16±3.2 | 22.78±0.43J | 16.30±1.5 | 17.21±0.22G | 89.70±12 | 86.08±0.15E |
| CaGc21 | 499.3±63.9 | 502.72±7.5H | 1224±251 | 1341.4±8.8E | 24.02±2.9 | 23.89±0.50I | 7.92±1.0 | 7.59±0.14M | 95.98±5.4 | 90.05±0.23B |
| CaGl11 | 626.8±69.7 | 660.13±7.6E | 1224±149 | 1448.6±10C | 25.29±3.2 | 25.40±0.15G | 8.11±1.6 | 8.59±0.13L | 34.98±6.0 | 34.77±0.24M |
| CaGl21 | 649.6±52.0 | 688.45±7.8D | 1003±142 | 1025.4±9.4G | 25.99±3.0 | 25.50±0.52G | 10.64±2.7 | 11.59±0.14K | 89.29±7.2 | 86.49±0.27D |
| Water | - | 144.34±8.0M | - | 589.63±11K | - | 22.81±0.46J | - | 12.07±0.14J | - | 11.69±0.24N |
Values that do not share the same letter within the same response variable are significantly different.
Disclaimer/Publisher’s Note: The statements, opinions and data contained in all publications are solely those of the individual author(s) and contributor(s) and not of MDPI and/or the editor(s). MDPI and/or the editor(s) disclaim responsibility for any injury to people or property resulting from any ideas, methods, instructions or products referred to in the content. |
© 2025 by the authors. Licensee MDPI, Basel, Switzerland. This article is an open access article distributed under the terms and conditions of the Creative Commons Attribution (CC BY) license (http://creativecommons.org/licenses/by/4.0/).
Copyright: This open access article is published under a Creative Commons CC BY 4.0 license, which permit the free download, distribution, and reuse, provided that the author and preprint are cited in any reuse.


