
Submitted:
11 March 2025
Posted:
11 March 2025
You are already at the latest version
Abstract
Antimicrobial resistance (AMR) is a critical public health issue in Bangladesh, where antibiotic use is widespread but often unregulated. A nationwide study (2017–2020) analyzing data from 26 laboratories examined bacterial resistance trends across 232,329 isolates from various clinical specimens. Escherichia coli was the most common pathogen (32.48%), followed by Klebsiella spp. (15.50%) and Pseudomonas spp. (10.60%). Urine specimens comprised 50.3% of tested samples, while blood and soft tissue/body fluids accounted for 12.1% and 24.8%, respectively. Patients aged 55+ years represented the largest proportion (36.3%), highlighting their vulnerability to drug-resistant infections. Resistance to third-generation cephalosporins was alarmingly high in E. coli (62.89% resistant to ceftriaxone), whereas resistance to carbapenems remained relatively low (imipenem 5.31%, meropenem 6.81%). Klebsiella spp. exhibited widespread resistance, though carbapenems remained effective. In contrast, Salmonella spp. remained sensitive to third-generation cephalosporins. However, 42% of Staphylococcus aureus isolates were methicillin-resistant (MRSA). This study highlights the urgent need for improved antibiotic stewardship, enhanced diagnostic capacity, and strengthened AMR surveillance to mitigate resistance trends and preserve treatment options in Bangladesh. Immediate action is necessary to combat the growing threat of multidrug-resistant pathogens.
Keywords:
AMR Surveillance
; Trends
; Patterns
; Atibiogram
; WHONET
; QAAPT
1. Introduction
Antimicrobial resistance (AMR) is a global public health crisis which will claim 8.22 million lives annually by 2050 if left unchecked1. Low- and middle-income countries in Africa and South Asia bear a disproportionate burden of AMR2. For example, in Bangladesh, infections due to antibiotic-resistant microorganisms accounted for over 98800 deaths in 20192, 3 and are estimated to increase more than $500 million per year for AMR-related healthcare costs. Despite the recognition of AMR as a significant public health issue in Bangladesh, there remains a lack of comprehensive data on bacterial drug-resistance patterns in community-acquired infections over an extended period4.
Current AMR surveillance in Bangladesh primarily focuses on a limited number of patients based on specific case definitions, often overlooking findings from private laboratories5. This surveillance has 11 sentinel sites (all tertiary hospitals), with only one site from the private sector. This practice poses challenges in producing representative antibiograms and hinders evidence-based decision-making for AMR containment and developing clinical guidelines for infectious diseases. Furthermore, the absence of a centralised laboratory information-sharing system impedes effective antimicrobial surveillance. It compromises patient safety, particularly in a setting where most of the population lacks access to microbiology laboratory services6.
In response to these critical gaps, we conducted a nationwide cross-sectional study (26 laboratories) to assess the status of AMR in Bangladesh between 2017 and 2020. Data were collected from all available clinical samples obtained from microbiology laboratories, both public and private, across the country, and a comprehensive screening process (using the Rapid Laboratory Quality Assessment scoring method) [Supplement 1] for data quality was employed prior to downstream analysis. This nationwide data collection and analysis was undertaken to ensure the generation of high-quality microbiology data from these laboratories and derive reliable insights into the current landscape of AMR in Bangladesh.
2. Materials and Methods
Study design and setting: A retrospective cross-sectional study was conducted from 2020 to 2022, involving public and private microbiology laboratories across different regions of Bangladesh. The study aimed to obtain data on Antimicrobial Susceptibility Testing (AST) for three years between January 2017 and December 2020. The study was conducted in collaboration with the Communicable Disease Control (CDC) division of the Ministry of Health and Family Welfare (MoHFW) of Bangladesh, the Institute of Epidemiology Disease Control & Research (IEDCR) in Bangladesh, and the International Vaccine Institute (IVI) in South Korea and represented the activity of 'Capturing Data on Antimicrobial Resistance Patterns and Trends in Use in Regions of Asia (CAPTURA)' project, a regional initiative supported by the Fleming Fund7.
Inclusion, Exclusion criteria: To collect AST data, the Directorate General of Health Services (DGHS) and the CAPTURA consortium identified 46 public and private medical colleges, hospitals, and diagnostic centers across Bangladesh based on their capacity to perform antimicrobial susceptibility testing. A predesigned questionnaire, incorporating the RLQA tool, was used to assess the quality of microbiology testing at each facility. The RLQA evaluated seven key components: equipment, staffing, media, pathogen identification, Antimicrobial Susceptibility Testing (AST), Internal Quality Control (IQC), and External Quality Assurance (EQA).
This tool, developed specifically for the CAPTURA project, aimed to assess AST practices in microbiology laboratories. However, it is not a fully comprehensive or validated laboratory evaluation. A cutoff score of 60 was established for inclusion, based on discussions among the project team. Laboratories were excluded if they lacked adequate data storage or did not follow internationally recognized standards, such as those set by the Clinical & Laboratory Standards Institute (CLSI) or the European Committee for Antimicrobial Susceptibility Testing (EUCAST).
Data collection: Following the RLQA assessment, we observed significant variability in data collection practices and recording platforms across different laboratories. To address this inconsistency, we introduced a standardized method to unify data from multiple sources into a consistent format. Prior to data collection, we conducted over 32 in-person and virtual training sessions on AMR data collection, standardization, analysis, and reporting. These sessions engaged more than 160 microbiologists, technologists, software developers, and key decision-makers at the ministry and facility levels. A master trainer pool facilitated the training to ensure widespread adoption of best practices.
To streamline data management, we introduced WHONET [8], a widely used, free desktop software developed by the WHO Collaborating Center for Surveillance of Antimicrobial Resistance. This tool enabled laboratories to convert data from Excel spreadsheets and Laboratory Information Systems (LIS) using WHONET’s BacLink feature. Additionally, facilities relying on manual registers were able to input their data directly into WHONET, ensuring a standardized and structured format for all collected data.
Data management, data quality, and statistical analysis: Since the datasets were collected using different data management systems, a tailored approach for data curation was necessary. Beyond the cleaning via WHONET, each dataset required closer examination and hands-on curation conducted by the CAPTURA team. The team found additional outliers, incorrect organisms, null specimen dates, and incorrect AST results using the SQLite Database Browser software (Figure 2). Following this additional curation, a combined dataset was assembled using the WHONET data combination and encryption functionality. We utilized a combination of robust tools to process and analyze the data effectively. WHONET was employed for data unification, ensuring standardization and consistency across diverse datasets. For analytical preparation and visualization, we leveraged the Quick Analysis of Antimicrobial Patterns and Trends (QAAPT), a versatile free web-based and user-friendly platform specifically designed for AMR data analysis and reporting9. Additionally, R software, a powerful tool for statistical computing and data visualization, was employed to develop the country-level map10. Statistical analyses were performed using the WHONET, QAAPT, and R softwares.
3. Results
3.1. Findings from the Study
A total of 1037013 unique records were collected from 34 labs, excluding 11 facilities due to inadequate data storage platforms (manual or digital). Furthermore, data from 9 labs were excluded due to <60 RLQA score. We included data from all organisms with more than 200 isolates and excluded contaminants, normal flora, oral flora, and mixed material pathogens. For patients with multiple isolates from the same infection episode, only the first isolate was considered, following the CLSI M100 and M39 guidelines for calculating trends and resistance patterns. Most laboratories used the disc diffusion (DD) method for AST and maintained results in manual registers or electronic databases. However, some laboratories used VITEK 2, and data from these labs could not be analyzed due to frequent database erasures. Ultimately, 973278 records from 26 laboratories across eight divisions in Bangladesh were selected for downstream analysis (Figure 2).
3.1.1. Geographical, Temporal, and Demographic Distribution of Participants and Samples
Among these AST records, 715721 (73.53%) were clinical specimens with no microorganism growth, and 257557 (23.37%) were specimens with microbial growth in bacterial culture medium. After excluding data (25228; 9.8%) with missing information (gender, specimen identification, age, specimen date, organism), 232329 isolate records were selected for the final analysis (Figure 2). The laboratories were geographically distributed across the country; however, most were from Dhaka's capital (Figure 1). The majority (156117, 67.2%) of data was collected between 2018 and 2019. The monthly distribution of isolates indicates a decrease in culture positive cases during the winter (January-February) and an increase during the summer (July-September) season (Figure 3).
In terms of gender-wise distribution, 44.6% of samples out of 232329 positive isolates were from male patients and 55.4% were from females. The majority of the samples were from the 55 and above years age group (84296, 36.3%) in both genders (figure 4). Most of the samples were from urine specimens (50.3%), followed by soft tissue or body fluid specimens (24.8%) and blood specimens (12.10%).
Figure 1.
Locations of laboratories.
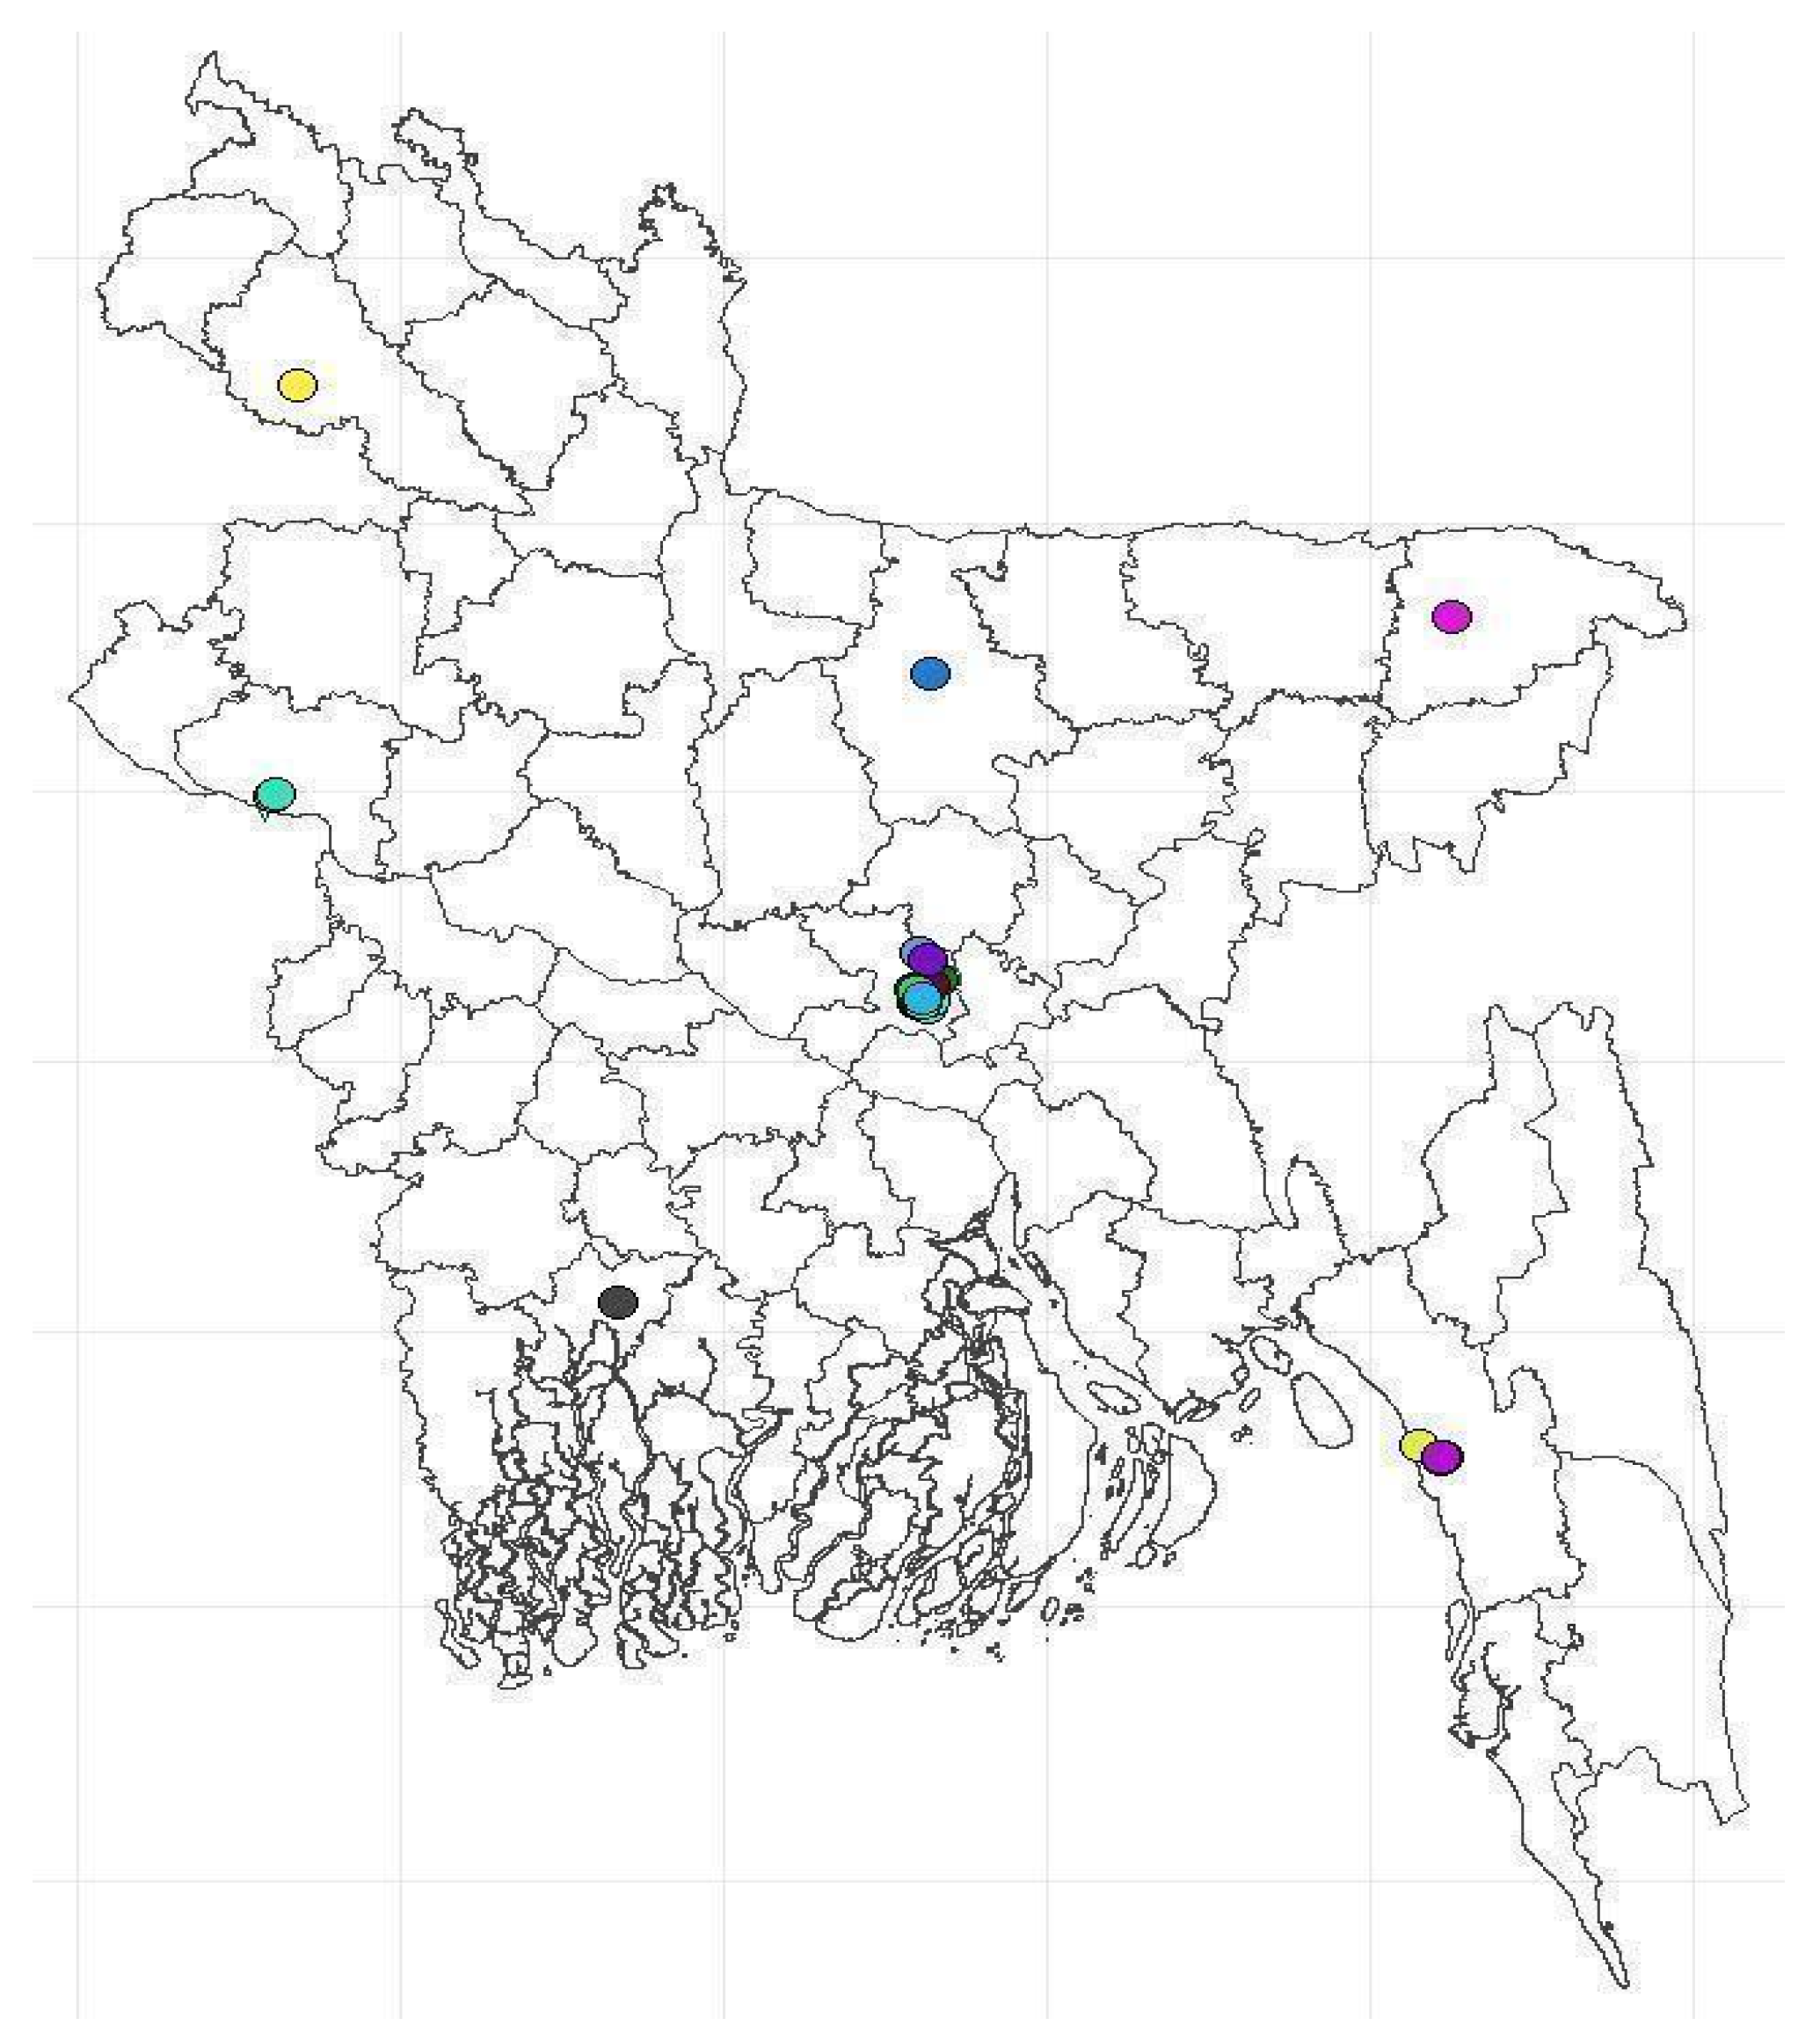
Figure 2.
Flow chart of facility identification with inclusion and exclusion of AST records.
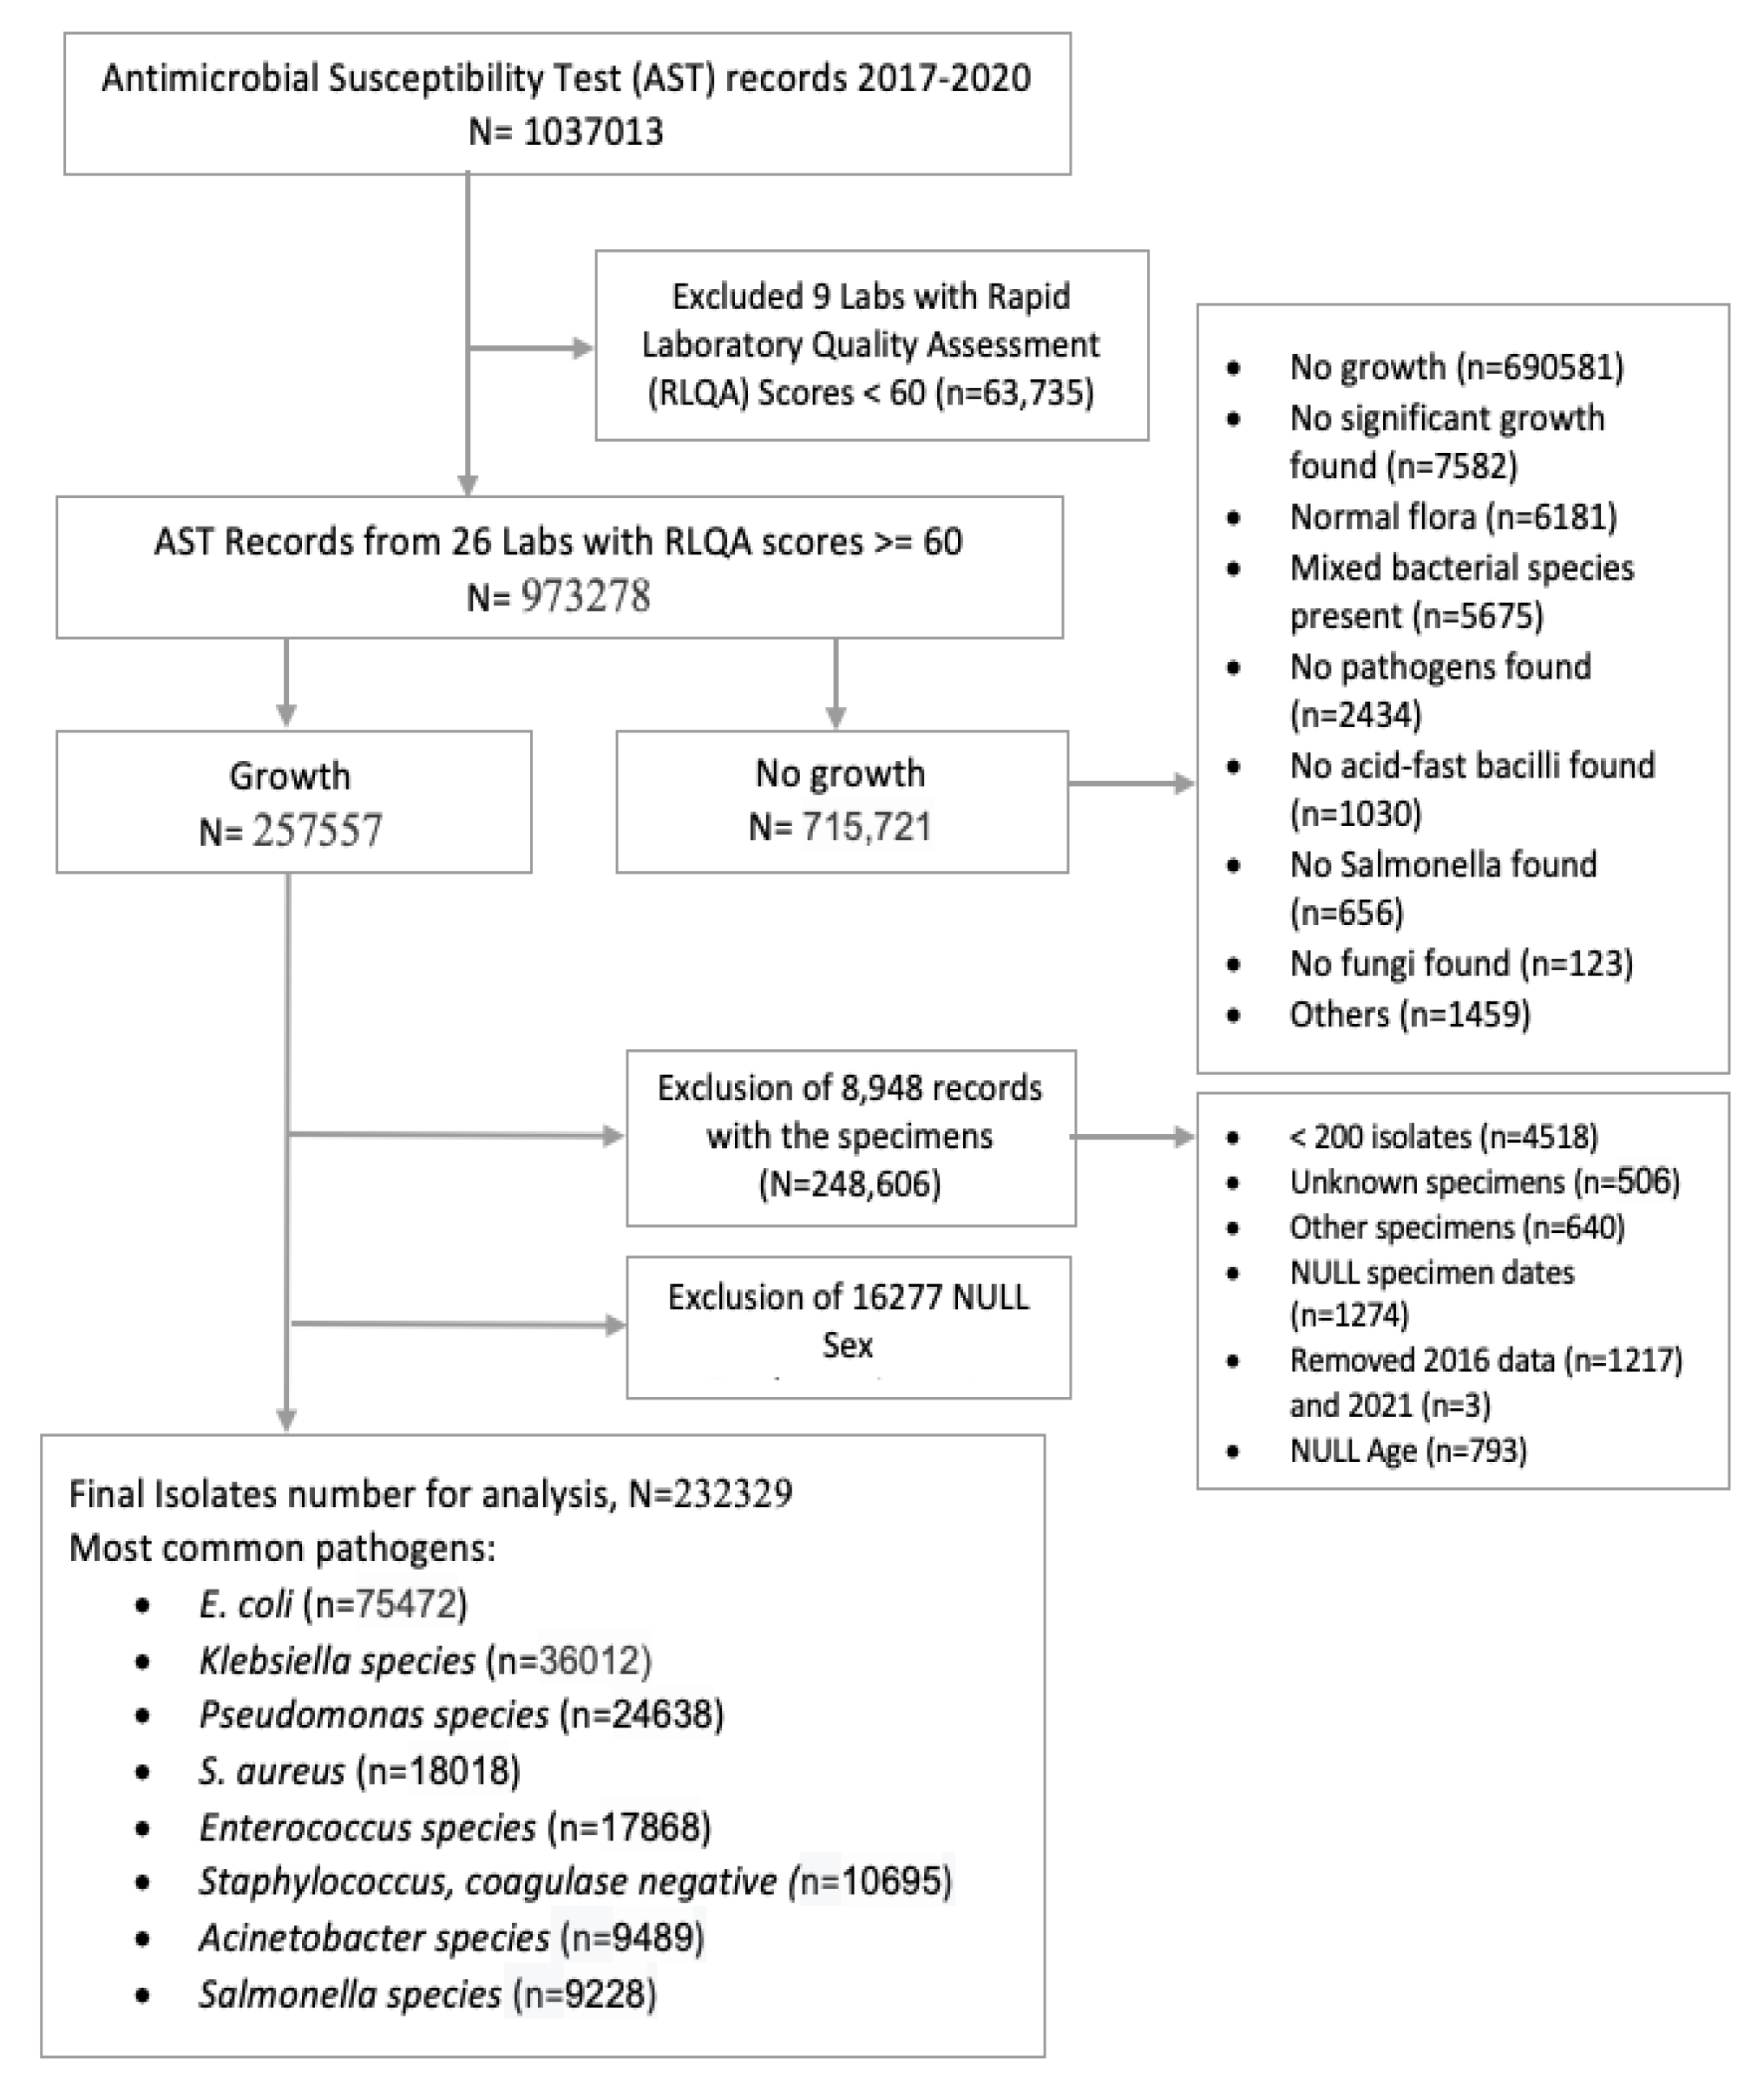
Figure 3.
Monthly distribution of the total number of samples submitted to the laboratory records.
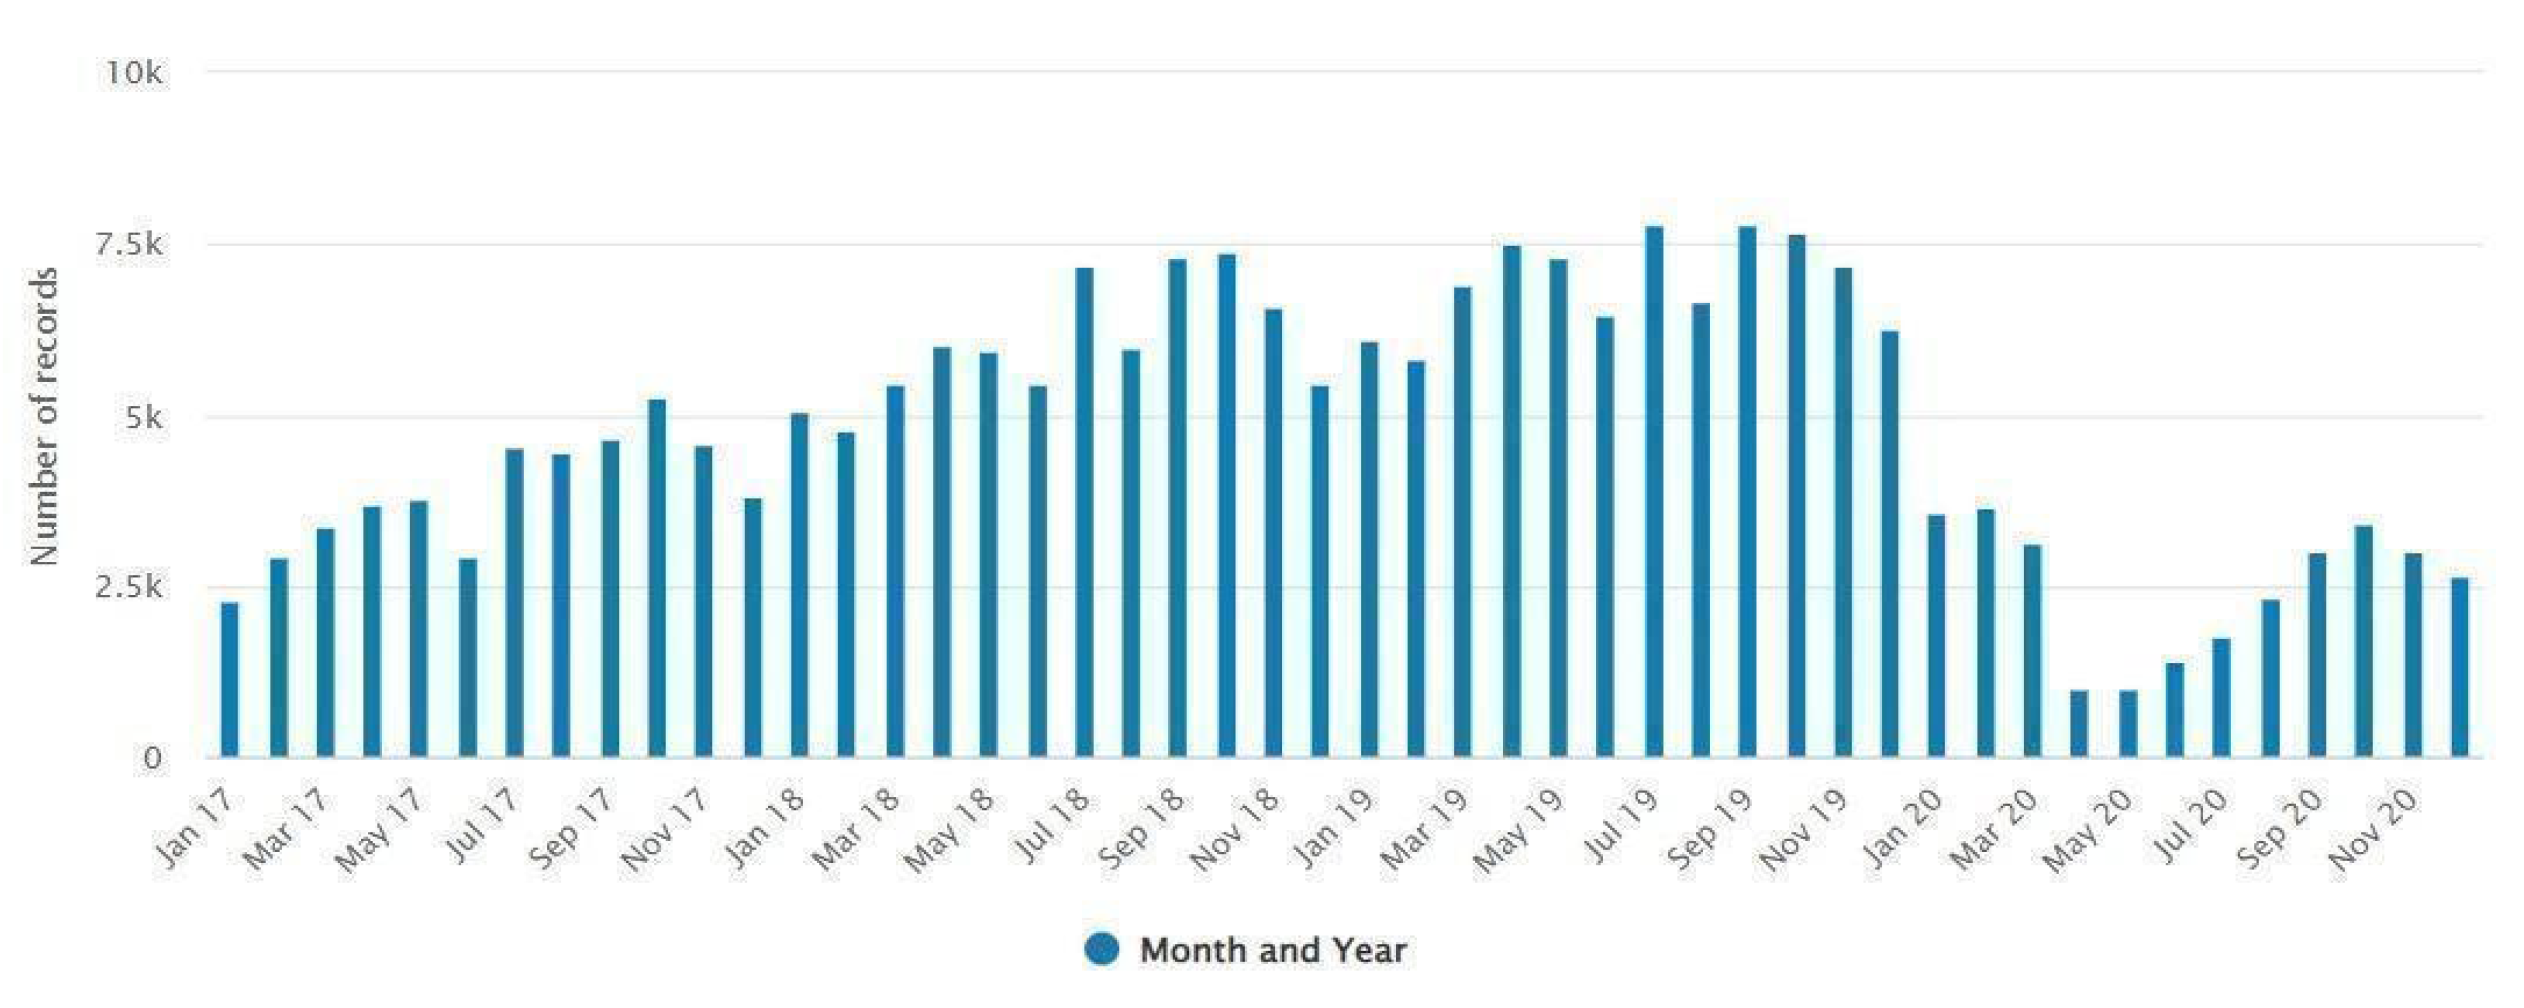
Figure 4.
Distribution of the number of records by sex and age group, including negative results.
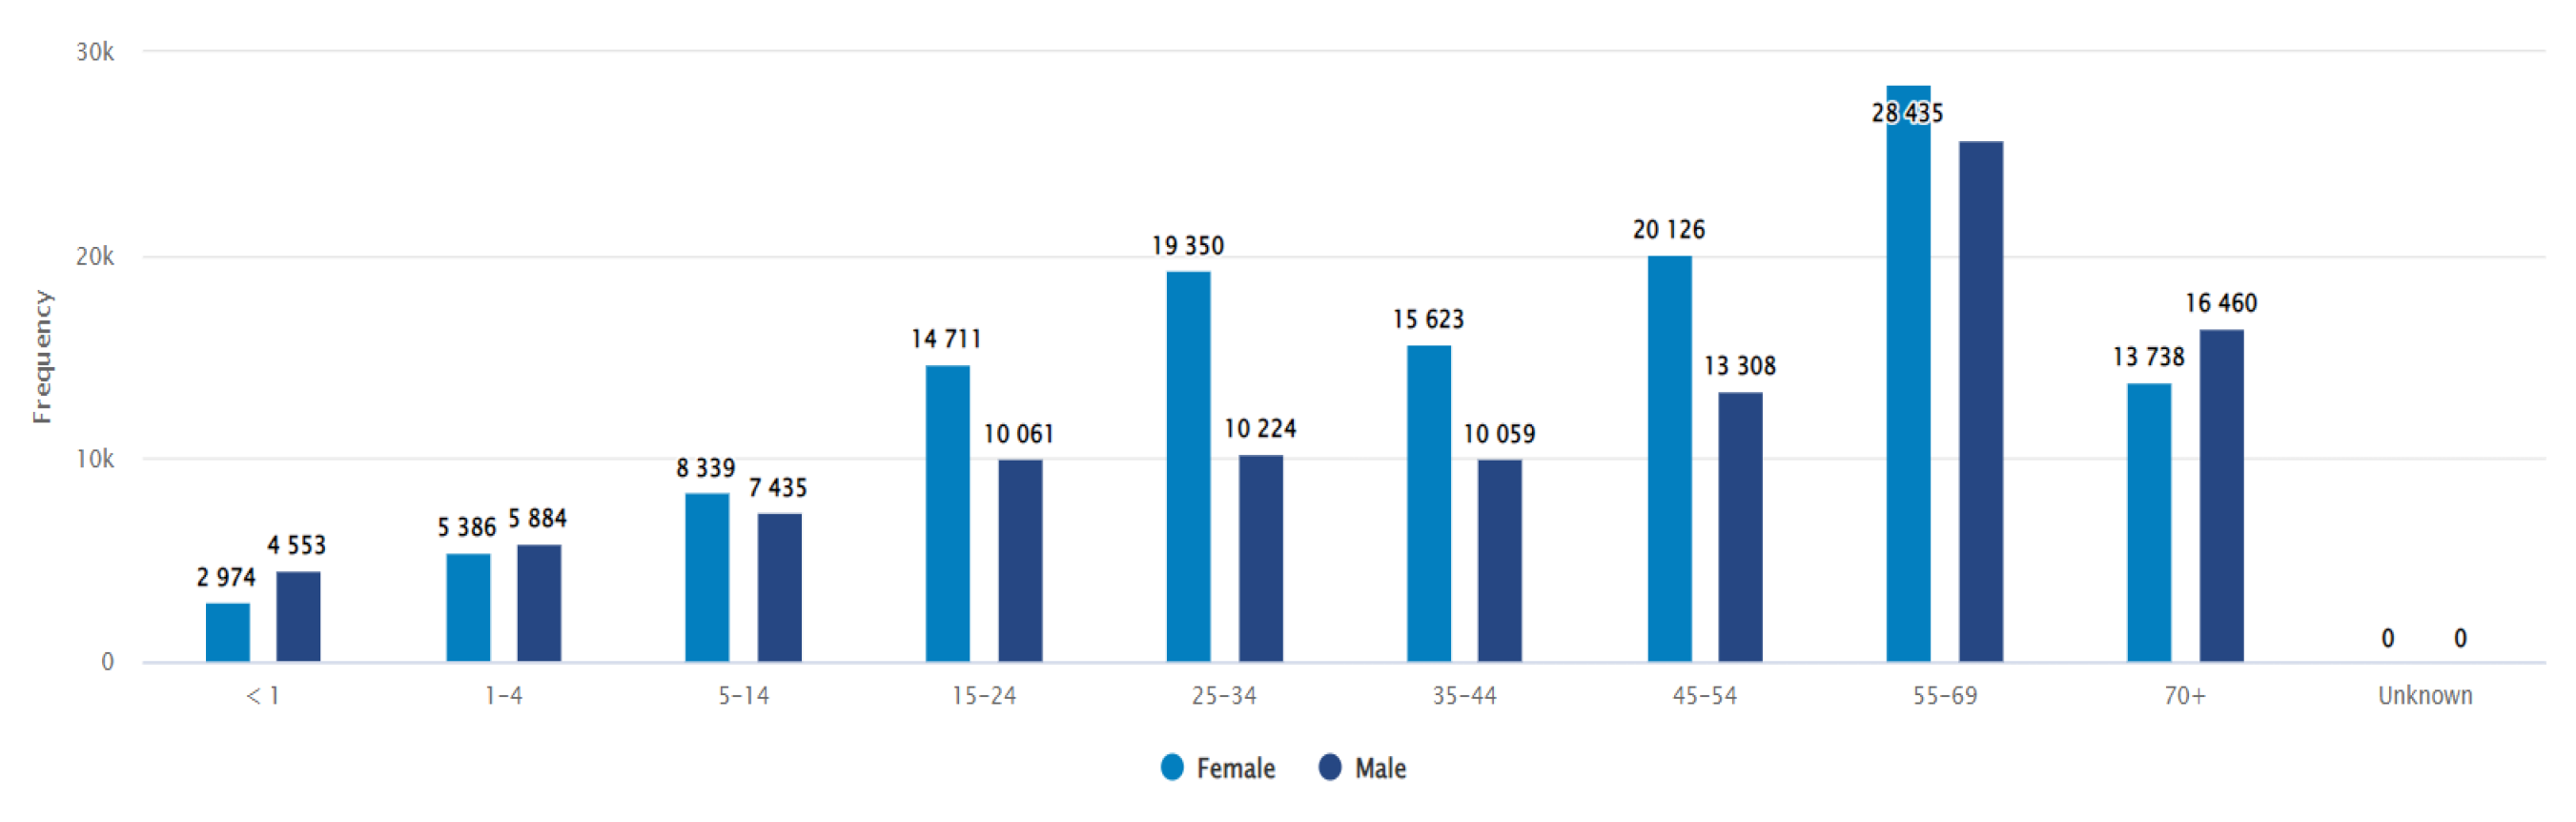
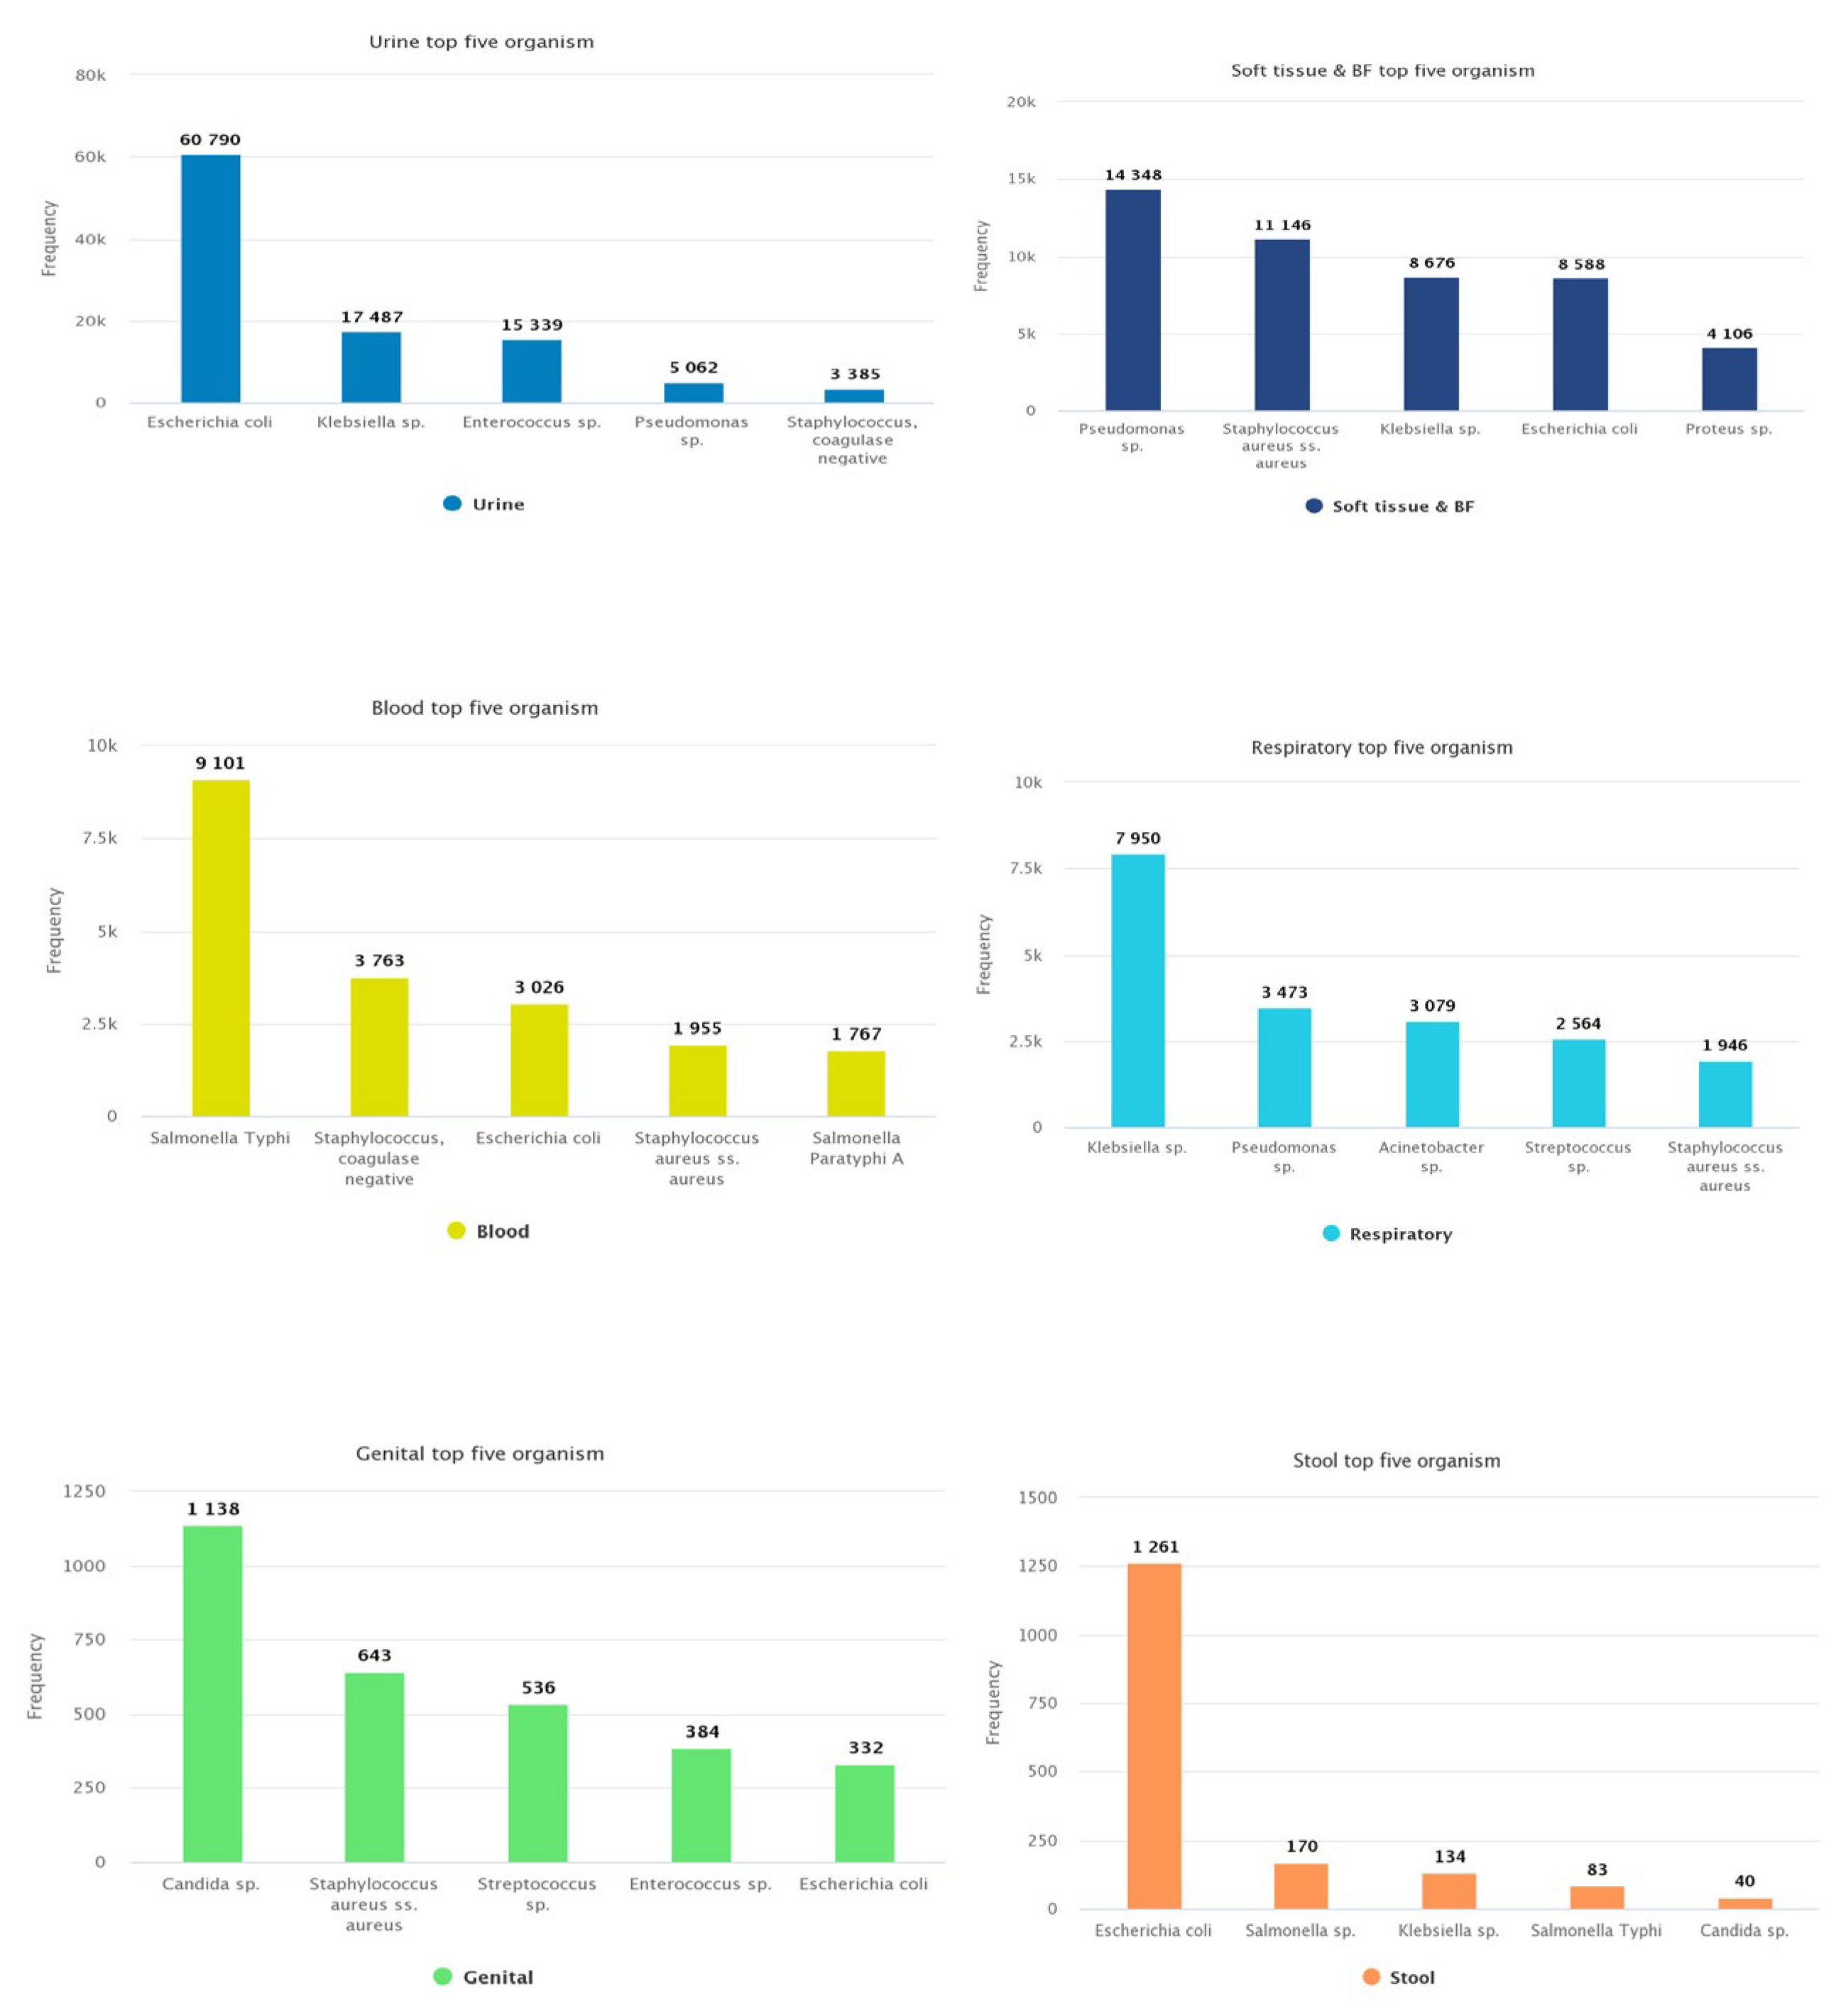
Figure 5.
Distribution of most common organisms according to specimen type .
3.1.2. Most Commonly Found Pathogens
The most frequently isolated organisms among all samples were Escherichia coli (32.48%), Klebsiella sp. (15.50%), Pseudomonas sp (10.60%), S. aureus (7.76%), and Enterococcus sp. (7.69%) respectively (Table 1). Figure 5 shows the distribution of the most common organisms according to specimen type.
Of the top five pathogens found in urine specimens, E. coli was frequently (n=60790, 52.03%) reported, followed by Klebsiella sp. (n=17487, 14.96%), Enterococcus sp. (n=15339, 13.13%), Pseudomonas sp. (n=5062, 4.33%), and Staphylococcus, coagulase negative (n=3385, 2.89%). Pseudomonas sp. (n=14348, 24.91%) and Staphylococcus aureus (n=11146, 19.35%) were the major isolated pathogens from soft tissue and body fluid samples, followed by other Gram-negative bacteria. The blood culture data showed Salmonella Typhi (n=9101, 32.50%) as the primary pathogen causing bloodstream infections (BSI). Other frequently reported pathogens from BSI included Staphylococcus, coagulase negative (n=3763, 13.44%), E. coli (n=3026, 10.81%), S. aureus (n=1955, 6.98%), and Salmonella paratyphi (n=1767, 6.31%). In respiratory tract infections, Klebsiella sp. (n=7950, 32.22%) was a commonly reported pathogen. Similarly, Candida spp (n=1138, 32.95%) predominated in genital specimens while E. coli (n=1261, 71.12%) was the most common in stool samples.
3.1.3. Trends and Patterns of Antibiotic Resistance Among Common Gram-Negative Bacteria
There were considerable variations in antibiotic susceptibility among different bacterial species. E. coli was relatively more susceptible to imipenem, meropenem, amikacin, netilmicin, nitrofurantoin and piperacillin-tazobactam (resistance proportion, 5.31%, 6.81%, 13.59%, 14.67%, 14.41% and 19.73% respectively) and commonly resistant to amoxicillin (84.6%) and ampicillin (91.49%). More than 50% of isolates of Klebsiella sp. were resistant to most antibiotics except amikacin (30.21%), gentamicin (35.58%), netilmicin (34.13%) and piperacillin-tazobactam (38.49%). Mecilliniam showed better susceptibility against both urinary isolates. Overall, compared to E. coli, Klebsiella sp. was more resistant to antibiotics. However, most isolates remain susceptible to meropenem and imipenem (Table 2).
Pseudomonas sp. exhibited alarming levels of resistance to a wide range of antibiotics, with the exception of imipenem (37.16%), meropenem (38.76%), and piperacillin-tazobactam (35.01%). In contrast, Salmonella sp. demonstrated lower resistance to most antibiotic groups, particularly third-generation cephalosporins such as ceftriaxone (1.41%) and cefixime (2.99%). A large majority (92.9%) of Salmonella sp. isolates were found to be resistant to nalidixic acid. Acinetobacter sp. displayed an extremely high level of resistance to most antibiotics, with only netilmicin and doxycycline showing susceptibility in 50% of the isolates. (Table 2).
3.1.4. The Pattern of Antibiotic Resistance Among Significant Gram-Positive Pathogens
The results indicate that S. aureus showed the least resistance to linezolid (5.29%) and gentamicin (20.23%), but high resistance to penicillin G (80.14%) and azithromycin (80.08%). Chloramphenicol (12.35%) was found to be more effective for the BSI isolates. Approximately 42% of the isolates were resistant to cefoxitin, indicating a high prevalence of MRSA. Enterococcus demonstrated the highest resistance to tetracycline (76.73%) and ciprofloxacin (71.37%), while showing the least resistance to linezolid (3.26%), penicillin (26.83%), and ampicillin (27.68%). Similarly, Streptococcus sp. was least resistant to linezolid (2.05%) and penicillin (7.83%), but most resistant to trimethoprim/sulfamethoxazole (69.71%), tetracycline (57.08%), and erythromycin (56.94%). Coagulase-negative Staphylococcus was least resistant to linezolid (6.44%) and gentamicin (34.59%), but most resistant to azithromycin (85.1%) and penicillin G (77.57%). In addition, urinary isolates of all four pathogens showed a better susceptibility to nitrofurantoin (Table 3).
4. Discussion
We analyzed 232329 antimicrobial susceptibility testing (AST) records from 26 public and private laboratories across Bangladesh, spanning the period from 2017 to 2020. These records were retrospectively collected from microbiology culture and AST datasets to assess resistance patterns and trends. The results highlighted significant antibiotic resistance among common bacterial species impacting the Bangladeshi population. Our analysis included samples from inpatient and outpatient records, and we implemented several measures to ensure the accuracy and quality of the data.
Most of our samples were collected in 2018 and 2019, with a noticeably lower number of samples from 2017, possibly due to many laboratories not retaining data older than three years. The period from April to June 2020 saw a significant reduction in bacteriological testing, which coincided with the onset of the COVID-19 pandemic, leading to a decline in data for that year. Regarding gender distribution, the number of samples from female patients was notably higher than that from male patients. This could be attributed to the fact that the majority of the samples were derived from urine specimens (50.29%) commonly submitted to rule out Urinary Tract Infection (UTI). Furthermore, across both genders, the largest proportion (36.3%) of samples came from patients aged 55 years and older. This observation was anticipated for several reasons. Elderly individuals may have compromised immune systems due to various underlying health conditions. Moreover, elderly patients may be more susceptible to hospital-acquired infections while receiving treatment for non-infectious conditions11.
The organisms frequently isolated among our samples (E. coli, Klebsiella sp, Pseudomonas sp, S. aureus, and Enterococcus sp) are commonly found pathogens in clinical samples such as urine, soft tissues, and body fluids4, 12, 13. The blood culture data identified Salmonella Typhi as the major pathogen causing bloodstream infections (BSI). This finding is consistent with the high incidence of Salmonella infections in Bangladesh and neighbouring countries14-16.
The antibiotic resistance patterns identified in our study closely mirror those found in similar studies conducted in Bangladesh. A recent systematic review analyzed resistance pattern data from 46 local studies and found a pattern that aligns with our findings4. E. coli was the most common causative organism and displayed high resistance to ampicillin, amoxicillin/clavulanic acid, trimethoprim/sulfamethoxazole, and third-generation cephalosporins. Our study also revealed a similar pattern in other organisms causing urinary tract infections, supporting the existing patterns. Enterococcus sp. exhibited high-level resistance to ceftriaxone, a finding consistent with our analysis. Additionally, our study found a comparable resistance level against ceftriaxone (2-3%) among Salmonella sp. samples, further validating the review's findings. The fact that our study predominantly involved hospital-admitted patients may account for some variations in the observed resistance values compared to the studies included in the review.
We also compared our results with the national AMR surveillance findings13. Since our database included data from the national AMR surveillance, we separated the two sources of data (surveillance vs non-surveillance data). We compared the resistance patterns of E. coli and S. aureus. We observed similar resistance patterns between the two databases, and that result was published in another paper5. Our study has allowed comparison with regional AMR pattern data as well. Our limited article search found no extensive laboratory data review of India or Pakistan's settings. However, we could compare our studies' results with those countries' national AMR surveillance system reports and systematic reviews (mainly of hospital data). In Pakistan, an alarming level of resistance in Salmonella species has been found17, which differs from our findings. Resistance among E. coli, S. aureus, and Acinetobacter sp were also a little higher than the result found in our study, which can be expected due to the nature of the sample origin (hospital setting). In India, a higher level of resistance compared to our findings was found among E. coli samples, especially against the carbapenem group of antibiotics18. Other organisms have shown a similar level of resistance to our results.
The CAPTURA study conducted in Nepal has allowed us to directly compare our results with theirs, as both studies followed a similar methodology19. In Nepal, similar to ours, urine samples were tested higher than other samples (51.3%). They also found E. coli (37.51% of positive records) as the most common bacteria isolated in the obtained data set, followed by Staphylococcus aureus, Klebsiella sp., Pseudomonas sp., Acinetobacter sp., coagulase-negative Staphylococci, and Enterococcus sp. (14.05%, 12.34%, 6.16%, 5.91%, 5.68%, 2.73% respectively). We observe a similar resistance pattern between the two countries for Klebsiella spp. and Salmonella sp. E. coli was more resistant to imipenem (22%) in Nepal; however, it had a similar resistance level against third-generation cephalosporins. Resistance against azithromycin and linezolid was higher in our S. aureus isolates than theirs.
Our study's main strength lies in the comprehensive nature of the dataset used for the antimicrobial susceptibility tests (AST). This dataset was gathered from a wide range of public and private laboratories across the country, providing a thorough and representative picture of antimicrobial resistance patterns in Bangladesh. We actively engaged with major stakeholders, including the Ministry of Health's Communicable Disease Control unit, and sought input from national experts to ensure that local issues in lab assessments and data collection were effectively addressed. We employed rigorous techniques for data collection and cleaning to ensure that the data was comparable and reliable. Importantly, our study included clinical samples from both hospital and community (doctors’ private chamber) patients, which is unique compared to other studies that tend to focus solely on hospital settings. This approach helped to prevent the skewing of resistance profiles. Furthermore, we adhered to the latest CLSI guidelines20 on antibiograms, which significantly enhanced the accuracy and relevance of our study.
Our study had several limitations that may have impacted the robustness of our findings. One significant constraint was the potential variation in data quality produced by different laboratories. Despite our efforts to ensure adherence to international standards, we anticipated variations in lab techniques and quality control practices. Furthermore, we observed disparities in the use of modern equipment among the participating laboratories. Most laboratories used disc diffusion methods for antimicrobial susceptibility testing (AST), but this approach has limitations in accurately reporting results for certain critical antibiotics, such as colistin and vancomycin. Another noteworthy limitation was the incomplete collection of patient information by some laboratories, which hindered further exploratory and comparative subgroup analysis. Additionally, it is important to note that many laboratories reported organisms only up to the genus level, which may have impacted the depth of our analysis. In addition to the above points, our analysis is subject to the inherent limitation of using routine data, including the lack of control over sampling practices.
5. Conclusions
This study provides a comprehensive analysis of antimicrobial resistance (AMR) patterns in Bangladesh from 2017 to 2020, revealing a high prevalence of multidrug-resistant bacterial pathogens in clinical settings. Our findings highlight significant resistance to third-generation cephalosporins among key bacterial species, underscoring the urgent need for strategic interventions. The increasing resistance trends limit treatment options and pose a major public health challenge, reinforcing the necessity for immediate action.
To effectively address AMR, a multifaceted approach is essential. Strengthening antimicrobial stewardship programs, enforcing stricter regulations on antibiotic use, and raising public awareness are critical steps in curbing resistance. Additionally, robust infection prevention and control (IPC) measures, improvements in water, sanitation, and hygiene (WASH) practices, and the integration of AMR data across healthcare sectors are crucial in mitigating the spread of resistant infections. Enhancing national surveillance systems will also play a pivotal role in tracking resistance trends and informing policy decisions.
By implementing these measures, Bangladesh can make significant progress in containing AMR and safeguarding the effectiveness of antibiotics for future generations. Sustained efforts and collaborative action at national and global levels are imperative to combat this growing threat to public health.
Supplementary Materials
The following supporting information can be downloaded at: Rapid Laboratory Quality Assurance (RLQA): https://drive.google.com/file/d/18tuuaWnqyrWShBy-bCYwuv2MrP6WD3sk/view?usp=sharing.
Author Contributions
AR contributed to the conceptualization of the paper, data interpretation, and summarizing the findings. MJS led the data collection, management, analysis, and the writing of the methods and results sections. SMSR provided interpretation of the findings. HTB and AH were responsible for data collection, periodical data cleaning, data digitization. HJ, PKD, SYK, JS, SGAS, MH, and FM reviewed the manuscript. NP oversaw the entire study.
Funding
The “Capturing Data on Antimicrobial Resistance Patterns and Trends in Use in Regions of Asia (CAPTURA)” and SAG-WHONET project funded by the Department of Health and Social Care’s Fleming Fund using UK aid. The views expressed in this publication are those of the authors and not necessarily those of the UK Department of Health and Social Care or its Management Agent, Mott MacDonald.
Institutional Review Board Statement
The CAPTURA project was exempt from ethical review by the Institutional Review Board (IRB) of the IVI because the project did not involve intervention or interaction with individuals and the information collected was not individually identifiable. This exemption is per the IVI IRB SOP D-RB-4-003. The CAPTURA project undertook the retrospective data collection and curation, and the authors used the digitized data to prepare this manuscript.
Informed Consent Statement
The CAPTURA consortium project obtained official approval in Bangladesh from the Communicable Disease Control (CDC), Directorate General of Health Services (DGHS) (Ref: DGHS/DC/ARC/2020/1708) and the Institutional Review Board (IRB) of the International Vaccine Institute (IVI) (SOP, D-RB-4-003). Before initiating data collection, a tri-party agreement was established between DGHS, the respective healthcare facility, and the CAPTURA consortium to ensure compliance with ethical and regulatory standards.
Data Availability Statement
The dataset will be shared upon request.
Acknowledgments
We would like to extend our heartfelt gratitude to the CAPTURA team, as well as the microbiologists, data entry operators, and laboratory technologists at the microbiology lab. We also acknowledge the invaluable support of the CAPTURA Phase One consortium, including the Public Health Surveillance Group (PHSG), Big Data Institute (BDI), and Brigham and Women’s Hospital, in the development and validation of this platform.
Conflicts of Interest
The authors declare no conflicts of interest.
Abbreviations
The following abbreviations are used in this manuscript:
| CAPTURA | Capturing Data on Antimicrobial Resistance Patterns and Trends in Use in Regions of Asia |
| IEDCR | Institute of Epidemiology Disease Control & Research |
| CDC | Communicable Disease Control |
| MoHFW | Ministry of Health and Family Welfare |
| QAAPT | Quick Analysis of Antimicrobial Patterns and Trends |
| PHSG | Public Health Surveillance Group |
| BDI | Big Data Institute |
| AST | Antimicrobial Susceptibility Testing |
| EQA | External Quality Assurance |
| IQC | Internal Quality Control |
| CLSI | Clinical & Laboratory Standards Institute |
| EUCAST | European Committee for Antimicrobial Susceptibility Testing |
References
- Naghavi M, Vollset SE, Ikuta KS, Swetschinski LR, Gray AP, Wool EE, et al. Global burden of bacterial antimicrobial resistance 1990–2021: a systematic analysis with forecasts to 2050. The Lancet. 2024;404(10459):1199-226.
- Murray CJ, Ikuta KS, Sharara F, Swetschinski L, Aguilar GR, Gray A, et al. Global burden of bacterial antimicrobial resistance in 2019: a systematic analysis. The Lancet. 2022;399(10325):629-55.
- Global Research on AntiMicrobial resistance, p. The burden of antimicrobial resistance (AMR) in Bangladesh. 2022.
- Ahmed I, Rabbi MB, Sultana S. Antibiotic resistance in Bangladesh: A systematic review. International Journal of Infectious Diseases. 2019;80:54-61.
- Sujan MJ, Habib ZH, Rahman A, Rizvi SMS, Barua HT, Aboushady AT, et al. Antimicrobial resistance surveillance methods in Bangladesh: present and way forward. Clinical Infectious Diseases. 2023;77(Supplement_7):S549-S59.
- Faiz MA, Basher A, editors. Antimicrobial resistance: Bangladesh experience. Regional Health Forum; 2011.
- Holm M, MacWright WR, Poudyal N, Shaw A, Joh HS, Gallagher P, et al. Capturing data on Antimicrobial resistance Patterns and Trends in Use in Regions of Asia (CAPTURA). Clinical Infectious Diseases. 2023;77(Supplement_7):S500-S6.
- WHONET. WHONET [Available from: https://whonet.org/.
- Sujan MJ, Gautam S, Aboushady AT, Clark A, Kwon S, Joh HS, Holm M, Stelling J, Marks F and Poudyal N (2025) QAAPT: an interoperable web-based open-source tool for antimicrobial resistance data analysis and visualisation. Front. Microbiol. 16:1513454. [CrossRef]
- Team, RC. A language and environment for statistical computing. R Foundation for Statistical Computing, Vienna (2016). 2016. p. 2013.
- Afroz H, Fakruddin M, Masud MR, Islam K. Incidence of and risk factors for hospital acquired infection in a tertiary care hospital of Dhaka, Bangladesh. Bangladesh Journal of Medical Science. 2017;16(3):358.
- Islam MA, Islam MR, Khan R, Amin MB, Rahman M, Hossain MI, et al. Prevalence, etiology and antibiotic resistance patterns of community-acquired urinary tract infections in Dhaka, Bangladesh. PloS one. 2022;17(9):e0274423-e.
- Sectoral Co-ordination Center for AMRS. Report on National Antimicrobial Resistance Surveillance, Bangladesh, 2016-2023. Dhaka; 2023.
- Akhtar S, Sarker MR, Jabeen K, Sattar A, Qamar A, Fasih N. Antimicrobial resistance in Salmonella enterica serovar typhi and paratyphi in South Asia-current status, issues and prospects. Critical reviews in microbiology. 2015;41(4):536-45.
- Afroz H, Hossain MM, Fakruddin M. A 6-year retrospective study of bloodstream Salmonella infection and antibiotic susceptibility of Salmonella enterica serovar Typhi and Paratyphi in a tertiary care hospital in Dhaka, Bangladesh. Tzu Chi Medical Journal. 2014;26(2):73-8.
- Ahmed D, Nahid MA, Sami AB, Halim F, Akter N, Sadique T, et al. Bacterial etiology of bloodstream infections and antimicrobial resistance in Dhaka, Bangladesh, 2005–2014. Antimicrobial resistance & infection control. 2017;6:1-11.
- Saeed DK, Farooqi J, Shakoor S, Hasan R. Antimicrobial resistance among GLASS priority pathogens from Pakistan: 2006–2018. BMC infectious diseases. 2021;21:1-16.
- Indian Council of Medical, R. Annual Report Antimicrobial Resistance Research and Surveillance Network. 2023.
- Nepal MoH. CAPTURA Country Report: Nepal. 2023.
- Simner PJ, Hindler JA, Bhowmick T, Das S, Johnson JK, Lubers BV, et al. What’s new in antibiograms? Updating CLSI M39 guidance with current trends. Journal of clinical microbiology. 2022;60(10):e02210-21.

Table 1.
Baseline characteristics of the isolates.
| Characteristics | Frequency N= 232329 | Percentage (%) |
| Gender | ||
| Male | 103647 | 44.62 |
| Female | 128682 | 55.38 |
| Age group | ||
| <1 | 7527 | 3.24 |
| 1-4 Years | 11270 | 4.85 |
| 5-14 Years | 15774 | 6.79 |
| 15-24 Years | 24772 | 10.66 |
| 25-34 Years | 29574 | 12.73 |
| 35-44 Years | 25682 | 11.05 |
| 45-54 Years | 33434 | 14.39 |
| 55-69 Years | 54098 | 23.29 |
| 70+ Years | 30198 | 13.00 |
| Number of AST records analyzed per year | ||
| 2017 | 46233 | 19.90 |
| 2018 | 72573 | 31.24 |
| 2019 | 83544 | 35.96 |
| 2020 | 29979 | 12.90 |
| Specimen type | ||
| Urine | 116837 | 50.29 |
| Soft tissue and body fluid | 57596 | 24.79 |
| Blood | 28002 | 12.05 |
| Respiratory | 24668 | 10.62 |
| Genital | 3453 | 1.49 |
| Stool | 1773 | 0.76 |
| Most common organism found (top seven) | ||
| Escherichia coli | 75472 | 32.48 |
| Klebsiella sp. | 36012 | 15.50 |
| Pseudomonas sp. | 24638 | 10.60 |
| Staphylococcus aureus | 18018 | 7.76 |
| Enterococcus sp. | 17868 | 7.69 |
| Staphylococcus, coagulase negative | 10695 | 4.60 |
| Acinetobacter sp. | 9489 | 4.08 |
Table 2.
Proportion of antimicrobial-resistant Gram-negative microorganisms.
| Antibiotics/ Organisms | Gram Negative | ||||
|
E. coli (%) |
Klebsiella sp. (%) |
Pseudomonas sp. (%) | Salmonella sp. (%) | Acinetobacter sp. (%) | |
| Amikacin | 13.59 (8690/63938) | 30.21 (9107/30143) | 52.16 (11466/21983) | - | 62.04 (4727/7619) |
| Amoxicillin | 84.60 (9691/11455) | - | - | 29.34 (1080/3681) | - - |
| Amoxicillin-Clavulanate | 58.14 (26484/45552) | 66.08 (16703/25276) | 90.62 (7427/8196) | - | 92.33 (4406/4772) |
| Ampicillin | 91.49 (4687/5123) | - | - | 22.41 (1207/5387) | - |
| Aztreonam | 56.88 (18743/32949) | 55.33 (8797/15899) | 61.27 (1082/1766) | - | - |
| Azithromycin | - | - | - | 28.75 (2516/8751) | - |
| Cefepime | 43.13 (15683/36359) | 44.66 (6549/14663) | 92.21 (3478/3772) | - | 65.07 (3216/4942) |
| Ceftazidime | 53.82 (28949/53787) | 53.47 (12850/24030) | 53.72 (9166/17062) | - | 78.24 (6226/7958) |
| Ceftriaxone | 62.89 (41573/66106) | 59.24 (18142/30626) | - | 1.41 (155/10968) | 82.55 (5833/7066) |
| Cefoxitin | 31.08 (1157/3723) | 50.08 (663/1324) | - | - | - |
| Cefuroxime | 68.13 (32081/47085) | 65.22 (11810/18107) | - | - | - |
| Chloramphenicol | - | - | - | 17.53 (1055/6019) | - |
| Ciprofloxacin | 65.59 (43970/67037) | 52.42 (16469/31417) | 58.90 (12345/20958) | 28.67 (3175/11074) | 72.12 (5818/8067) |
| Doxycycline | 56.84 (11117/19559) | 48.70 (2817/5784) | - | - | 48.40 (1105/2283) |
| Gentamicin | 24.41 (16440/67358) | 35.58 (11295/31748) | 57.92 (12994/22435) | - | 66.95 (5838/8720) |
| Imipenem | 5.31 (2661/50154) | 20.28 (4482/22097) | 37.16 (5310/14289) | - | 57.41 (3744/6521) |
| Mecillinam (only Urine) | 22.13 (3225/14570) | 33.12 (1250/3774) | - | - | - |
| Meropenem | 6.81 (3384/49699) | 21.69 (4781/22047) | 38.76 (4863/12545) | - | 55.78 (3320/5952) |
| Nalidixic acid | - | - | - | 92.90 (8335/8972) | - |
| Netilmycin | 14.67 (4637/31602) | 34.13 (5358/15700) | 56.18 (7935/14124) | - | 47.49 (2610/5496) |
| Nitrofurantoin (only urine) | 14.41 (8209/56957) | 40.82 (6568/16090) | - | - | 64.89 (998/1538) |
| Piperacillin-Tazobactam | 19.73 (6847/34698) | 38.49 (7811/20291) | 35.01 (6887/19671) | - | 68.89 (5092/7392) |
| Tetracycline | 52.23 (1603/3069) | 54.96 (16724/30430) | - | - | - |
| Sulfamethoxazole- Trimethoprim | 53.87 (34493/64028) | 50.77 (1515/2984) | - | ? | 58.62 (4928/8406) |
* The percentages in the table indicate the proportion of isolates from each bacterial strain resistant to each antibiotic. The dash (-) within the table indicates either not recommended or not tested antibiotics for the specific pathogen.
Table 3.
Antimicrobial resistance pattern for gram positive organisms.
| Antibiotics | Gram-Positive | |||
| S. aureus | Enterococcus sp. | Streptococcus sp. | CoNS | |
| Ampicillin | - | 27.68 (2377/8588) | - | - |
| Azithromycin | 80.08 (4338/5417) | - | - | 85.1 (2318/2724) |
| Cefoxitin | 41.70 (2017/4837) | - | - | - |
| Chloramphenicol ( blood) | 12.35 (213/1725) | - | 9.34 (54/578) | - |
| Ciprofloxacin | 62.22 (8949/14382) | 71.37 (11988/16796) | - | - |
| Doxycycline | 27.24 (1564/5742) | 59.01 (3640/6168) | 28.33 (100/353) | 34.59 (1122/3244) |
| Erythromycin | - | - | 56.94 (1222/2146) | - |
| Gentamicin | 20.23 (3380/16708) | - | - | 32.12 (2725/8485) |
| Linezolid | 5.29 (476/8999) | 3.26 (329/10082) | 2.05 (70/3414) | 6.44 (310/4817) |
| Nitrofurantoin (Urine) | 14.79 (549/3712) | 10.97 (1599/14575) | 5.63 (95/1688) | 16.62 (531/3194) |
| Oxacillin | 35.45 (2134/6019) | - | - | - |
| Penicillin G | 80.14 (2708/3379) | 26.83 (2686/10011) | 7.83 (191/2439) | 77.57 (2953/3807) |
| Tetracycline | 21.78 (748/3435) | 76.73 (1629/2123) | 57.08 (887/1554) | 26.91 (831/3088) |
| Trimethoprim/Sulfamethoxazole | 37.61 (5786/15384) | - | 69.91 (2351/3363) | 43.31 (3504/8090) |
Disclaimer/Publisher’s Note: The statements, opinions and data contained in all publications are solely those of the individual author(s) and contributor(s) and not of MDPI and/or the editor(s). MDPI and/or the editor(s) disclaim responsibility for any injury to people or property resulting from any ideas, methods, instructions or products referred to in the content. |
© 2025 by the authors. Licensee MDPI, Basel, Switzerland. This article is an open access article distributed under the terms and conditions of the Creative Commons Attribution (CC BY) license (http://creativecommons.org/licenses/by/4.0/).
Copyright: This open access article is published under a Creative Commons CC BY 4.0 license, which permit the free download, distribution, and reuse, provided that the author and preprint are cited in any reuse.


