Submitted:
06 March 2025
Posted:
07 March 2025
You are already at the latest version
Abstract
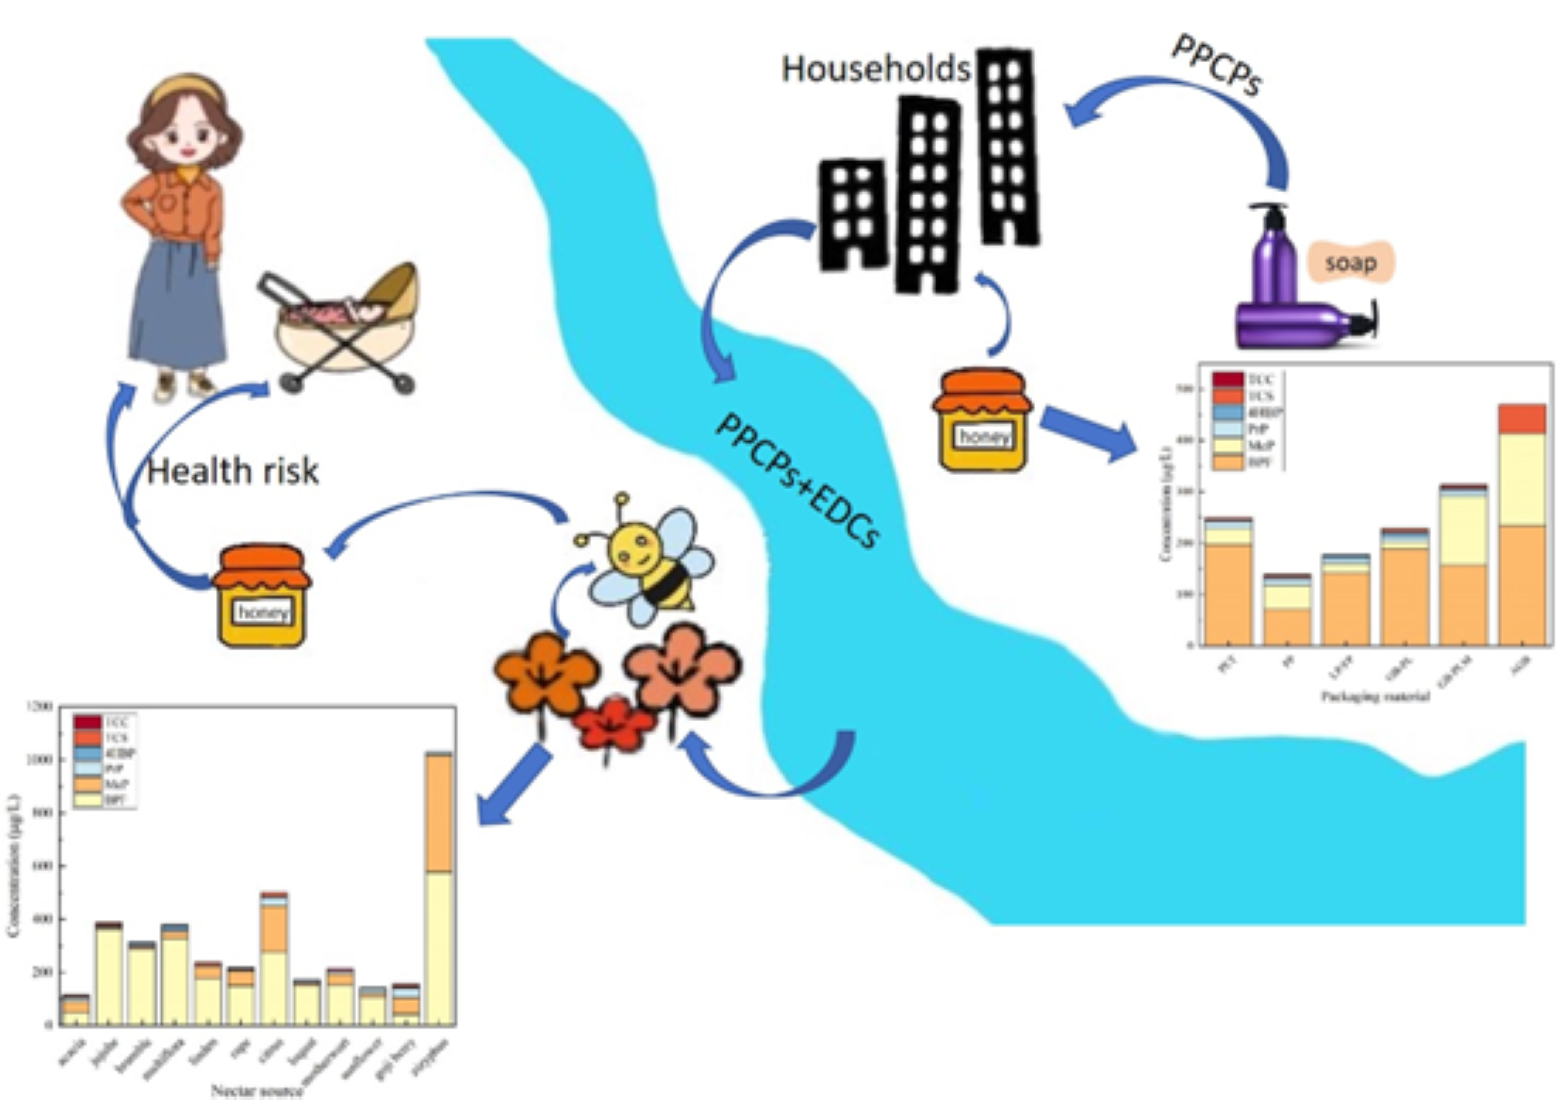
The detection of endocrine disruptors in the environment suggests that human health will be adversely affected by them, and the presence of endocrine disruptors in food is even more hazardous to health.There is a wide range of endocrine disruptors, including antimicrobials, preservatives, plastic additives and photoinitiators.The level of endocrine disruptor contamination in honey, a widely used everyday food, is closely related to human health.In this study, a method for the simultaneous determination of seven typical endocrine disruptors (triclosan (TCS), triclocarban (TCC), methyltriclosan (MTCS), methylparaben (MeP), propylparaben (PrP), bisphenol F (BPF), and 4-hydroxybenzophenone (4HBP)) in honey by ultrasonication-assisted dispersive liquid-liquid microextraction (UALLME) coupled with high-performance liquid chromatography (HPLC) was developed.The actual sample spiked recoveries were 89.70-102.2% with RSD values of 1.1-3.9%, and intra-day precision was in the range of 0.6-1.6% and inter-day precision was in the range of 0.2-1.2%.It also tested 47 honey samples from 7 countries, 12 nectar sources and 5 materials of packaging.The results showed that the total detection rates of TCS and TCC were 29.79% and 19.15%, respectively, the maximum detected concentration of TCS was 144.6 g/kg, the detected concentrations of TCC were below the limit of quantification (LOQ), and MTCS was not detected.The total detection rates of BPF, 4HBP, MeP and PrP in honey samples were 97.87%, 36.17%, 82.98% and 80.85%, respectively, and the maximum detected concentrations were 1194 g/kg, 294.9 g/kg, 439.5 g/kg and 136.7 g/kg, respectively. TCS in citrus nectar, TCC in motherwort nectar, and 4HBP in multifloral nectar were the most frequently detected, and BPF, MeP, and PrP were detected in all nectar sources.Foreign honey samples had a wider range of TCS, BPF, 4HBP and MeP contamination than domestic samples.The concentrations of TCS, BPF, MeP and PrP in honey packed in PET were the highest among all materials.Seven typical endocrine disruptors in honey were found to pose a low risk to adult health through a health risk assessment.However, the health risk of BPAF exposure through honey consumption is high for infants one year of age and younger.Therefore, it is recommended that infants should avoid honey foods and that contamination and monitoring of typical endocrine disruptors during food processing should be enhanced.
Keywords:
typical endocrine disruptors
; honey
; detection
; risk assessment
1. Introduction
Endocrine disruptors currently comprise more than 800 different compounds that have been found in air, land, drinking water, plant and animal foods, consumer and personal care product, fuels, pharmaceuticals and synthetic hormones[1,2,3]. There are several classes of chemicals that are categorized as typical endocrine disruptors. Include the antimicrobial agent triclosan which is commonly used in food and personal care products(PPCPs). The xenoestrogenic bisphenols (BPs) which are produced in industry. The ultraviolet filter benzophenones (BzPs), and parabens (PBs) which are substances used as preservatives. Triclosan (TCS) and triclocarban (TCC) are antimicrobial agents commonly used in many daily products. Methyl-triclosan (MTCS), a derivative of TCS, is a possible endocrine disruptor that is also currently reported. These chemicals, when in contact with the body for prolonged periods of time, can affect normal endocrine functions, such as affecting the reproductive system, the nervous system, the immune system, causing genetic mutations and carcinogenic effects[4]. TCS has endocrine disruptive capabilities,Gee, R. H. et al. demonstrated that TCS has estrogenic and androgenic activity[5]. In addition, exposure to TCS is associated with reproductive and developmental toxicity. Oral administration of TCS to pregnant mice (gestation days 1-16) has been shown to result in maternal and fetal toxicity, as evidenced by maternal mortality, reduced litter size, and reduced pup weights[6]. TCC may inhibit soluble epoxide hydrolase in vivo, leading to methemoglobinemia, upregulate gene expression associated with estrogen and androgen receptor responses, and disrupt neonatal birth weight, gestation, and body length[7]. There are few studies of BPF toxicity in vivo, and the main studies in the literature so far have been in rats and zebrafish. The study concluded that BPF has estrogenic, androgenic and thyroid hormone activity. In 2007, Higashihara et al[8] found that BPF triggered an increase in thyroid mass in male rats. A number of in vitro studies on the toxicity of BPF have concluded that BPF has estrogenic and antiandrogenic activity, and its endocrine disrupting activity is comparable to that of BPA[9]. In addition, BPF may have genotoxicity, causing genetic damage by interfering with the DNA replication process[10]. Studies have shown that PBs have estrogenic activity[11], BuP has the highest estrogenic potency of any substance in its class[12]. In animal studies, PBs exhibit weak estrogenic and thyrotoxic activities [13] as well as anti-androgenic properties[14]. Studies have shown that endocrine disruptors present in the aquatic environment can contaminate drinking water, soil and aquatic organisms, etc., and then enter the human body through the food chain, thus causing adverse effects on human health.
Food may be contaminated with EDCs through soil, water, and air, as well as during storage and processing, because contaminants are lipid-soluble and therefore easily accumulate in human tissues[15].EDCs had been detected in several types of food samples. Xuedong Wang et al. [16] detected TCS in milk samples at 1.04 μg/kg. Yao Li et al [17] collected fish bile samples in the Yangtze River Basin, China, and detected four parabens and two antimicrobial agents. Methyl p-hydroxybenzoate (MeP) was detected in the range of 8.17–21.9 ng/mL, Ethyl p-hydroxybenzoate (EtP) in the range of 0–31.6 ng/mL, Propyl p-hydroxybenzoate (PrP) in the range of 2.19–112 ng/mL, and Propyl 4-hydroxybenzoate (PrP) in the range of 2.19–112 ng/mL.–31.6 ng/mL, Propyl p-hydroxybenzoate (PrP) in the range of 2.19–112 ng/mL, and Butyl p-hydroxybenzoate (BuP) in the range of 0–4.42 ng/mL. (Butyl p-hydroxybenzoate, BuP) in the range of 0–4.42 ng/mL, TCS in the range of 7.84–460 ng/mL, and TCC in the range of 0–14.2 ng/mL. Hong Wu et al [18] examined phthalate esters (Phthalates), BPs, PBs, BzPs and TCS in beverage samples collected from the market in South China. The results showed that all of the above endocrine disruptors were detected to varying degrees. Natalia I. Zapata et al [19] detected TCS in the muscle tissue of fish from rivers in the District of Columbia.
To date, endocrine disruptors in food matrices have been determined by chromatographic techniques, especially gas chromatography or high performance liquid chromatography coupled to mass spectrometry. Gas chromatography is an effective choice for quantifying EDCs with good separation efficiency and high throughput [20]. This technique is most often used in conjunction with single-quadrupole (GC-MS) or triple-quadrupole mass spectrometry (GC-MS/MS) for the detection of EDCs. The analytes are usually derivatized to increase sensitivity, avoid false positives, and protect the column[21,22]。High performance liquid chromatography coupled with triple quadrupole mass spectrometry (HPLC-MS/MS) is a commonly used option for the determination of residues of EDCs due to its high sensitivity and selectivit[23,24]. However, due to the complexity of food matrices, which require appropriate pre-treatment to obtain accurate results. Commonly used pretreatment methods include solid phase extraction (SPE) [25,26,27,28], liquid extraction (LE)[24], dispersive liquid–liquid microextraction (Dispersive liquid—liquid microextraction,DLLME)[28]、and QuEChERS method[19,21,23].
Due to the widespread use of honey in daily life and the simplicity of its processing, researchers have conducted fewer studies on its possible contamination with EDCs in terms of origin, source of honey, packaging materials, and processing. In particular, no previous studies have reported the contamination of EDCs such as TCS, TCC and MTCS in honey. In addition, in the post-coronavirus pandemic era, which has seen an increase in the use of cleaning products[29], an increase in the consumption of fast food and snacks [30] , and a sharp increase in the use of antimicrobials, there is the potential for EDCs to contaminate honey, either through ecological cycling or during processing. It is necessary to study the contamination of honey with typical endocrine disruptors and to assess the risk of exposure to typical endocrine disruptors through honey in adults as well as infants. Therefore, the aim of this study was to evaluate the current status of TCS, TCC, MTCS, MeP, PrP, BPF and 4HBP in different packaged honeys from different nectar sources in China and abroad and to assess their associated health risks.
2. Experimental
2.1. Reagents and Chemicals
Triclosan (purity ≥99%), triclocarban standard (purity ≥98%), methyl p-hydroxybenzoate (purity ≥98%) and propyl p-hydroxybenzoate (purity ≥98%) were purchased from Shanghai Yuanye Biotechnology Co. Methyl triclosan standard (purity ≥98%), 4-hydroxybenzophenone (purity ≥98%) were purchased from Sigma-Aldrich Co. Bisphenol F (purity ≥98%), sodium sulfate (AR), anhydrous calcium chloride (purity ≥96%) purchased from Beijing Huawei Ruike Chemical Co. Methanol (HPLC/ACS grade), sodium hydroxide (purity ≥98%), aluminum chloride hexahydrate (purity ≥99%) were purchased from Beijing Bailing Wei Technology Co. N-octanol (AR, purity ≥99%), n-butanol (ACS, purity ≥99.4%), n-pentanol (ACS grade), the above reagents were purchased from Shanghai Aladdin Biochemical Science and Technology Co. n-Hexanol (HPLC, purity ≥99.5%) was purchased from Beijing Myriad Technology Co. Sodium nitrate (purity ≥98%) was purchased from Beijing Honghu United Chemical Products Co. Ammonium chloride (purity ≥99.5%) was purchased from Beijing Tongguang Fine Chemical Company (Beijing, China). Sodium chloride (purity ≥99%), potassium chloride (purity ≥99%) were purchased from Sangong Bioengineering Company Limited (Shanghai, China). Ultrapure water is made in the laboratory.
2.2. Samples Collection and Preparation
A total of 47 honey samples were purchased from different suppliers, including 40 domestic honeys and 7 foreign (Russia, Spain, France, Cuba, New Zealand, Germany) honeys, covering 12 different honey sources (acacia, jujube, vitex, multiflora, linden, rape, citrus, loquat, motherwort, sunflower, wolfberry, and milkvetch). Packaging for honey includes plastic containers (PET, PP), laminated polymer/foil bags, glass bottles with plastic lids, glass bottles with polymer-lined metal lids, and all-glass packages.15g of honey was taken and homogenized by stirring for 3min at 40°C in a water bath. Subsequently, 10g of homogenized honey was taken and diluted with 100mL of ultrapure water to make the sample solution to be tested.
2.3. Instrumentation
In this study, TCS, TCC, MTCS, BPF, 4HBP, MeP, and PrP were detected using high performance liquid chromatography and diode array detector (HPLC-DAD). The separation was carried out on a Diamonsil Plus C18 column (250 × 4.6 mm, 5 μm). The column temperature was maintained at 45°C. The mobile phase was methanol and water. Injection volume of 10mL. The flow rate was 1.0 mL/min. A binary high-pressure gradient elution program was used: 0-4min, methanol-water (60/40, v/v),4-18min, methanol-water (80/20, v/v),18-23min, methanol-water (100/0, v/v),23-28min, methanol-water (60/40, v/v). 281nm was used to detect TCS and MTCS, 263nm to detect TCC, 256nm to detect MeP and PrP, 277nm to detect BPF, and 293nm to detect 4HBP, respectively. The experimental data were processed by LC solution Lite workstation.
2.4. DLLME Procedure
The sample to be measured (10mL, pH 7) was placed in a 15mL glass centrifuge tube. 0.3 g NaCl was added and shaken, followed by the addition of 600 μL n-octanol. After manual shaking, it was sonicated at 20°C for 5 min to facilitate the extraction process. The sample solution was centrifuged at 3500 rpm for 8 min to achieve phase separation. The upper organic phase was collected using a syringe, and the volume was fixed to 1 mL. After filtration with 0.45μm organic membrane, HPLC-DAD analysis was performed.
2.5. Calculations and Data Processing
The amount of each endocrine disruptor in the honey samples was calculated according to equation (1).
C (ng/g) is the amount of the target analyte detected in honey. CS (ng/mL) is based on the detected peak area. Concentration of the target analyte in the sample solution calculated from the standard curve. VS (mL) is the volume of sample solution. mS (g) is the honey sample mass.
Estimated daily intake (EDI) of each analyte in honey was assessed according to equation (2).
C (ng/g) is the amount of the target analyte detected in honey. V (g/day) is the daily intake of honey. B (kg) is adult weight (50 kg) or infant weight. Infant weight based on the average weight of infants from the Fifth National Survey of Chinese Children [31]
Health risk assessment is based on the Hazard Quotient (HQ) approach as in equation (3)[32]。The reference dose (RfD, ng/kg bw/day) for each analyte is shown in Table 5. The European Food Safety Authority (2004) [33] recommends an Acceptable Daily Intake (ADI) of 0-107 ng/kg bw/day to limit the total intake of MeP and EtP and their sodium salts, and this value was used as a reference measure (Reference Dose, RfD) for MeP in this study. The human chronic reference values for TCS, TCC, BPF, 4HBP and PrP are still under review by authoritative bodies. Therefore, alternative reference values (No Observed Adverse Effect Level (NOAEL) from in vivo experiments) were used to derive human RfD. In this step, the traditional RfD derivation is based on NOAEL divided by intraspecies and interspecies uncertainty and database uncertainty, whereas the U.S. Environmental Protection Agency proposes to incorporate human equivalence measures (HEDs) into the oral RfD calculations for the contaminants under review[34]. Considering the reduction of interspecies uncertainty, HED was extrapolated from NOAEL by 3/4th of body weight anisotropy measurements[35].
The HED in equation (4) is derived from the NOAEL for mice or rats. That is 2.5 × 10⁷ ng/kg bw/day for TCS[36], 2.5 × 10⁷ ng/kg bw/day for TCC[35,37],2×107 ng/kg bw/day for BPF[8],1×108 ng/kg bw/day for 4HBP[38] and 6.5 × 10⁶ ng/kg bw/day for PrP[39,40]. The RfD and related parameters were calculated by dividing with the relative dose adjustment factor. Since the RfD value for PrP was derived from immature mice, the RfD value for PrP was additionally adjusted to an Uncertainty factor (UF) of 10.
3. Results and Discussion
3.1. Optimization of DLLME Operation Parameters
The extraction parameters of DLLME include: type and amount of extractant, sonication time and sonication temperature, type and amount of inorganic salt, sample pH, and centrifugal speed and centrifugal duration for optimization of experimental conditions. Maintain the single variable principle during the inquiry process.
3.1.1. Selection of Extractant Type and Dosage
600μL of n-pentanol, n-hexanol, n-heptanol and n-octanol were selected as extractants to investigate the effect of extractant type on the extraction efficiency of target analytes. As shown in Figure 1, n-octanol showed the highest extraction efficiency for TCS, MTCS, BPF, 4HBP, MeP, and PrP, and n-heptanol showed the highest extraction efficiency for TCC, but the extraction efficiencies for the other target analytes were low. Therefore, n-octanol was finally selected as the extractant.
The dosage of extractant has a large impact on the experiment, affecting the rate and amount of mass transfer of the target substance, which in turn affects the final extraction efficiency. Therefore the effect of 100-700 μL octanol on the extraction efficiency of TCS, TCC, MTCS, BPF, 4HBP, MeP and PrP was explored. As shown in Figure 2, the extraction efficiencies of TCS, TCC, MTCS, BPS, and 4HBP did not differ much at 600 μL and 800 μL, while the extraction efficiencies of MeP and PrP were not much improved. According to the principle of making each target analyte have high extraction rate while using as little extractant as possible, 600 μL of n-octanol was finally selected as the optimal extractant dosage.
3.1.2. Selection of Extraction Time and Extraction Temperature
In this study, ultrasound was used as a means of dispersion instead of dispersant, which means that the dispersant solvent can be omitted from the extraction procedure, which is more friendly to the environment. Ultrasound promotes the formation of a fine turbid state during the extraction process, accelerates mass transfer between the two immiscible phases, and reduces equilibrium time, thus contributing to the extraction efficiency. The extraction time in this paper is the sonication time. The sonication time of 0-7 min was chosen for the investigation and other experimental parameters were kept constant. As shown in Figure 3, the extraction efficiencies of TCS, MTCS, BPF, 4HBP and PrP increased and then stabilized when the ultrasonication time was 0-5 min. The extraction efficiency of TCC gradually decreased at 3-7 min. The extraction efficiency of MeP reached the maximum at 5 min. The ultrasound duration of 5 min was finally chosen for subsequent experiments.
The effect of extraction temperature on the extraction efficiency of target substances at 10°C, 20°C and 50°C was investigated. As shown in Figure 4, the extraction efficiency is optimal at 20°C. At lower temperatures, the mass transfer process cannot proceed quickly and adequately, and higher temperatures increase the solubility of the target analyte in water, which in turn leads to lower extraction efficiency. Finally, 20°C was selected as the optimal sonication temperature.
3.1.3. Selection of Inorganic Salt Type and Dosage
The salt effect reduces the solubility of the extractant and the target substance in water and improves the extraction efficiency. Na+、K+、NH4+、Ca2+和Al3+ were selected as the cations to explore and Cl-、SO42-、NO3- were selected as theanions to explore based on their valence and species.As shown in Figure 5, the improvement of Na+ on the extraction efficiency of MTCS, BPF, MeP and PrP was more obvious when the amount of salt as well as the anionic species were the same, resulting in a more balanced extraction efficiency of the seven target analytes. So Na+ was finally chosen as the best cation. The extraction efficiency of TCC, MTCS, 4HBP and BPF was significantly improved by Cl- under the condition of salt dosage and cation Na+. Therefore, NaCl was finally selected as the best inorganic salt species for the optimization of subsequent experiments.
The amount of salt used affects the magnitude of the ionic strength. By appropriately increasing the ionic strength, the salting out effect can reduce the solubility of the target analyte in water and improve the extraction efficiency. Excessive ionic strength causes an electrostatic effect that prevents the target analyte from entering the extractant, thereby reducing extraction efficiency. Therefore, the effects of different additions of NaCl on the extraction efficiency of the seven targets were compared. As shown in Figure 6, the solubility of the target analyte in the extractant increased when NaCl was added at a mass fraction of 0-3%, which led to an increase in the extraction efficiency. The extraction efficiency of the seven target analytes showed a decreasing trend when the addition of NaCl was increased from 5% to 20% mass fraction. Therefore, a mass fraction of 3% was selected as the optimum amount of NaCl for subsequent experiments.
3.1.4. pH
The pH of the system was adjusted to 3, 5, 7, 9 and 11 to investigate the effects of different pH on the extraction efficiency of the seven target analytes. The experimental results showed that the extraction rate under acidic conditions was overall higher than that under alkaline conditions. The main possible reason for this is that the target analytes under acidic conditions are mainly in the form of un-ionized molecules, which facilitates their partitioning in the organic phase. Under neutral and alkaline conditions, the distribution coefficient of the ionic form of the target analyte gradually increases, and the solubility in water gradually increases, which is unfavorable to its dissolution in the organic phase. As shown in Figure 7, the highest extraction efficiencies for the seven target analytes were achieved under neutral conditions. Ultimately, pH 7 was chosen for subsequent experiments.
3.1.5. Selection of Centrifugal Speed and Duration
Centrifugation favors the stratification of the organic and aqueous phases, so the optimal centrifugation speed and duration were explored. At lower rotational speeds, the organic and aqueous phases cannot be completely separated, leading to low extraction efficiency. As shown in Figure 8, the extraction efficiency of the seven targets was optimized at a centrifugal speed of 3500 rpm. Therefore, 3500 rpm was chosen as the optimal centrifugal speed and the optimal centrifugal duration was explored on this basis. As shown in Figure 9, the extraction efficiency of the target was enhanced when the centrifugation duration was increased from 2 min to 7 min. The overall extraction efficiencies of TCS, TCC, MTCS, BPF, 4HBP and PrP were high and stable at 8 min. In order to ensure the stability of the experimental results, 8 min was finally selected as the optimal centrifugation duration.
3.2. Method Validation
The proposed method was validated in terms of sensitivity, linearity, accuracy and precision. In order to ensure the accuracy and precision of honey sample detection, each compound in the sample was spiked at low, medium and high levels. The low level spiked concentrations of TCS, TCC, MTCS, BPF, 4HBP, MeP, and PrP were 20, 5, 50, 20, 5, 5, and 5 μg/L, respectively. The medium level spiked concentrations of TCS, TCC, MTCS, BPF, 4HBP, MeP, and PrP were 60, 20, 150, 100, 30, 30, and 30 μg/L, respectively. The high level spiked concentrations of TCS, TCC, MTCS, BPF, 4HBP, MeP, and PrP were 150, 40, 300, 200, 60, 100, and 60 μg/L, respectively.
A UALLME-HPLC-DAD method for the simultaneous determination of TCS, TCC, MTCS, BPF, 4HBP, MeP and PrP in honey was finally developed and evaluated for sensitivity, linearity, accuracy and precision. The accuracy of the optimized method was evaluated by recovery experiments, as shown in Table 1, the actual sample spiking recoveries were in the range of 89.70-102.2%, RSD values were in the range of 1.1-3.9%, and intra-day precision was in the range of 0.6-1.6% and inter-day precision was in the range of 0.2-1.2%.
3.3. Real Sample Analysis
3.3.1. Analysis of the Distribution of EDCs in Honey from Different Nectar Sources
The honey types tested in this study included seven types of honey for which relevant databases have been established: acacia honey, jujube honey, vitex honey, linden honey, rape flower honey, citrus honey, and sunflower honey, as well as multifloral honey, loquat honey, motherwort honey, wolfberry honey, and milk vetch honey, which are commonly found on the market, for a total of 12 types of honey sources and 47 samples. TCS, TCC, BPF, 4HBP, MeP and PrP were detected in honey samples at different concentrations and MTCS was not detected in all honey samples. TCS was detected in 14 honey samples and TCC was detected in 9 honey samples. As shown in Table 2, TCS was detected in honey samples from acacia, jujube, linden, rape, citrus, multifloral, and wolfberry sources, with a total detection rate of 29.79%.The greatest frequency of detection of TCS was found in citrus honey, with a frequency of 66.67%. The maximum concentration of TCS was found in linden honey at 144.6 μg/kg.
As shown in Table 3, TCC was detected in honey samples from the sources of acacia, jujube, multiflora, sunflower, motherwort, and wolfberry, with a total detection rate of 19.15%.TCC was detected with the greatest frequency in the motherwort honey, with a frequency of 100%, but was detected at concentrations lower than the LOQ.
BPF had the highest detection rate among the seven typical endocrine disruptors. As shown in Table 4, BPF was detected in honey from all honey types with a total detection rate of 97.87%. It was detected in 88.89% of acacia honey samples and 100% of honey samples from other honey sources. The maximum detectable concentration was found in multifloral honey with a concentration of 1193 μg/kg.
As shown in Table 5, 4HBP was not detected in honey samples from the sources of linden, loquat, motherwort and zoysia japonica, with a total detection rate of 36.17%. 4HBP was detected most frequently in multifloral honey with a concentration of 69.23%, and the maximum detection concentration occurred in multifloral honey at 294.9 μg/kg.

Table 5.
Detection of 4HBP in honey from different sources.
| Nectar source | Detection rate(%) | Range(μg/kg) | |
| 4HBP | acacia honey | 22.22(2/9) | ND-50.62 |
| jujube honey | 25(1/4) | ND-<LOQ | |
| vitex honey | 33.33(1/3) | ND-172.3 | |
| linden flower | 0(0/4) | ND | |
| rape flower honey | 33.33(1/3) | ND-<LOQ | |
| citrus honey | 33.33(1/3) | ND-94.43 | |
| loquat honey | 0(0/1) | ND | |
| multifloral honey | 69.23(9/13) | ND-294.9 | |
| sunflower honey | 33.33(1/3) | ND-<LOQ | |
| motherwort honey | 0(0/1) | ND | |
| wolfberry honey | 50(1/2) | ND-<LOQ | |
| milk vetch honey | 0(0/1) | ND |
The results showed that MeP and PrP were detected in honey samples from 12 honey sources, despite the fact that the Chinese national standard GB2760-2011 stipulates that the addition of propylparaben and its sodium salt is not allowed in food. As shown in Table 6, the total detection rate of MeP was 82.98%. The greatest frequency of detection was found in acacia honey, bramble honey, rape honey, citrus honey, loquat honey, motherwort honey, wolfberry honey and milk vetch honey, all with 100% detection concentration. The maximum detected concentration was 439.5 μg/kg in milk vetch honey. The total detection rate of PrP in honey samples was 80.85%. The highest detection frequency of 100% was found in acacia honey, citrus honey, loquat honey, sunflower honey, motherwort honey, wolfberry honey and milk vetch honey. The maximum detected concentration was found in multifloral honey, which was 136.7 μg/kg.
As shown in Figure 10, the experimental results indicated that the total detection rate of TCS was 29.79% in the above 12 honey sources. The highest detection frequency of TCS was 66.67% in citrus honey, followed by date honey(50%), linden honey(50%) and wolfberry honey(50%). TCS was the most contaminated in linden honey with a concentration of 144.6 μg/kg, followed by rape honey with a concentration of 121 μg/kg. The total detection rate of TCC in honey was 19.15%.The highest detection frequency of TCC was found in motherwort honey with 100%, followed by wolfberry honey(50%). The overall contamination of TCC in honey was low, with all detected concentrations lower than the LOQ. In the honey samples, BPF was detected with high frequency and high level of contamination, with a total detection frequency of 97.87%.The detection rate of BPF was 100% in jujube honey, vitex honey, linden honey, rape honey, citrus honey, loquat honey, multifloral honey, sunflower honey, motherwort honey, wolfberry honey, and milk vetch honey, and the lowest detection rate was 88.89% in acacia honey. The maximum detected concentration of BPF occurred in multifloral honey, which was 1194 μg/kg and needs to be emphasized. The total detection rate of 4HBP in honey was 36.17%. 4HBP was detected most frequently in multifloral honey with 69.23%, followed by wolfberry honey(50%). The highest concentration of 4HBP was detected in multifloral honey, with a detection concentration of 294.9 μg/kg, indicating a wide range and high degree of 4HBP contamination in multifloral honey. MeP and PrP were detected in all honey sources with high frequency, indicating a wide range and high degree of contamination of MeP and PrP in honey. The total detection rate of MeP was 83%, and the detection frequency of MeP in acacia honey, bramble honey, rape honey, citrus honey, loquat honey, motherwort honey, wolfberry honey, and milk vetch honey was 100%, followed by linden honey(75%). MeP was detected at the maximum concentration of 439.5 μg/kg in milk vetch honey. The total detection rate of PrP was 87%.PrP was detected at 100% in acacia honey, citrus honey, loquat honey, sunflower honey, motherwort honey, wolfberry honey and milk vetch honey, followed by jujube honey(75%) and linden honey(75%). Among them, PrP was detected in multifloral honey at the highest concentration of 136.7 μg/kg.
MTCS was not detected in any of the honeys from the above 12 honey sources. The largest number of typical endocrine disruptors were detected in acacia honey, jujube honey, multifloral honey and wolfberry honey, with a total of six typical endocrine disruptors detected, including TCS, TCC, BPF, 4HBP, MeP and PrP. A total of 5 typical endocrine disruptors including TCS, BPF, 4HBP, MeP and PrP were detected in rape and citrus honey.5 typical endocrine disruptors including TCC, BPF, 4HBP, MeP and PrP were detected in sunflower honey.4 typical endocrine disruptors including BPF, 4HBP, MeP and PrP were detected in vitex honey.3 typical endocrine disruptors including TCC, BPF, 4HBP, MeP and PrP were detected in vitex honey.3 typical endocrine disruptors including TCC, 4HBP, MeP and PrP were detected in sunflower honey.3 typical endocrine disruptors including TCC, 4HBP, MeP and PrP were detected in vitex honey. 4 typical endocrine disruptors including TCS, BPF, MeP and PrP were detected in linden honey. 4 typical endocrine disruptors including TCC, BPF, MeP and PrP were detected in motherwort honey. 3 typical endocrine disruptors including BPF, MeP and PrP were detected in loquat honey and zi yun ying honey. The maximum detected concentrations of BPF, 4HBP and PrP were from multifloral honey, with concentrations of 1193 μg/kg, 294.9 μg/kg and 136.7 μg/kg, respectively. The maximum detected concentration of TCS was from citrus honey, with a concentration of 144.6 μg/kg. The maximum detected concentration of MeP was derived from the honey of milk vetch with a concentration of 439.5 μg/kg.
3.3.2. Analysis of Honey Contamination by EDCs in Packaging Made of Different Materials
There were five types of honey packaging involved in this study, including plastic containers (PET, PP), laminated polymer/foil pouches, glass bottles with plastic lids, glass bottles with polymer-lined metal lids, and all-glass bottle packaging. The results showed that TCC, BPF, 4HBP, MeP and PrP were detected in honey samples from all five packaging materials.
For the triclosan group, as shown in Table 7, the total detection rate of TCS in honey samples from the five packaging materials was 29.79%. Among them, TCS was not detected in honey samples packaged in laminated polymer/foil pouches, the highest detection rate was found in the packaging of glass bottles with plastic lids with a detection frequency of 42.86%, and the highest concentration of TCS was detected in PET packaging with a concentration of 144.6 μg/kg. The total detection of TCC in honey samples of 5 different packaging materials was 19.15%. The highest detection rate of 33.33% was found in honey samples packaged in PP and glass bottles with polymer-lined metal lids.TCC was detected at lower concentrations than the LOQ in honey samples of different packaging materials.
The total detection rate of BPF in honey samples of five different packaging materials was 97.87%. As shown in Table 8, BPF was detected in 96.43% of the honey samples packed in PET and 100% of the honey samples packed in all other packaging materials, and the maximum concentration of BPF was detected in the honey samples packed in PET, which was 1,193 μg/kg.
The total detection rate of 4HBP in honey samples from the five packaging materials was 36.17%. As shown in Table 9, 4HBP had the highest detection rate of 57.14% in honey samples packaged in glass bottles with plastic lids and the highest concentration of 294.9 μg/kg in honey samples packaged in laminated polymer/foil bags.
For parabens, MeP was detected in 82.98% of honey samples in all five packaging materials, and PrP was detected in 80.85% of honey samples in all five packaging materials. As shown in Table 10, MeP had the highest detection rate of 100% in honey samples packed in PP packaging, glass bottles with polymer-lined metal lids, and all-glass packaging, with the highest concentration of MeP in honey samples packed in PET, with a detection concentration of 439.5 μg/kg. For PrP, the maximum detection was found in honey samples packaged in glass bottles with polymer-lined metal lids at 100%, and the highest detected concentration was found in honey samples packaged in PET at 136.7 μg/kg.
As shown in Figure 11, the experimental results indicated that the highest detected concentrations of TCS, BPF, MeP and PrP were found in PET-packed honey, with the detected concentrations of 144.6 μg/kg, 1193 μg/kg, 439.5 μg/kg and 136.7 μg/kg respectively, indicating that TCS, BPF, MeP and PrP were more seriously contaminated in PET-packed honey. The maximum detection frequencies of TCS and 4HBP were found in honey packed in glass bottles with plastic lids, with detection frequencies of 42.86% and 57.14%, respectively, indicating that the contamination range of TCS and 4HBP in honey packed in glass bottles with plastic lids was wide.The maximum detection frequency of TCC was found in honey packed in PP and glass bottles with polymer lined metal lids, with detection frequencies of 33.33%, indicating a wide range of TCC contamination in the above 2 types of packaged honey. The highest detection frequency of MeP was found in honey packaged in PP, glass bottles with polymer-lined metal lids, and all-glass packages, all with 100% detection rates, indicating a wide range of MeP contamination in these three types of packaged honey. BPF was detected in 96.43% of the honey packed in PET and 100% of the honey packed in the other 4 materials. This indicates that BPF has a wide range of contamination in honey packaged in all materials.The highest detection frequency of PrP was found in honey packaged in glass bottles with polymer lined metal lids, with a detection frequency of 100%, which indicates that the range of contamination of PrP is wide in this package.
TCS and TCC were detected in honey samples, although the number of samples detected was small (29.79% for TCS and 19.15% for TCC) and the concentrations were low (the maximum detected concentration was 144.6 μg/kg for TCS, and the concentrations for TCC were below the LOQs), they still indicate that TCS and TCC have been contaminated to the honey. BPF (97.87%), MeP (82.98%) and PrP (80.85%) were detected in almost all honey samples, and 4HBP (36.17%) was detected in a larger number of samples. This reflects the widespread use of benzophenones, parabens and bisphenols. For benzophenones, Japan and Italy stipulate that the maximum amount should not exceed 0.3% when used in contact with food products. For BPF, China and Korea stipulate that its specific migration level in food contact materials should not be higher than 50 μg/kg, but in this study, BPF was detected in concentrations up to 1193 μg/kg. For parabens, the Chinese national standard GB2760-2014 specifies the total amount of MeP and EtP and their sodium salts in various foods, with maximum limits ranging from 12 ng/g (for fresh fruits or vegetables) to 500 ng/g (for fillings and batters of baked goods). However, PrP has not yet entered the regulatory list in food, despite the reproductive toxicity of PrP reported in animal and in vitro studies, and the Chinese national standard GB2760-2011, which states that applications for production licenses for PrP and its sodium salt as food additives are not being entertained.
3.3.3. Comparison of Contamination of Honey at Home and Abroad
As shown in Table 11, BPF, PrP, MeP, 4HBP, TCS, and TCC were detected in 97.5%, 85%, 82.5%, 32.5%, 27.5%, and 20% of honey samples originating from China, respectively, and MTCS was not detected. In honey samples of foreign origin, BPF, MeP, 4HBP, PrP, TCS, and TCC were detected at frequencies of 100%, 85.71%, 57.17%, 57.14%, 42.86%, and 14.28%, respectively, and MTCS was not detected. The highest concentrations of TCS, 4HBP and MeP in honey samples were found in samples from China, with concentrations of 144.6 μg/kg, 294.9 μg/kg and 439.5 μg/kg, respectively. μg/kg. The highest concentrations of BPF and PrP in honey samples were found in foreign samples, with the concentrations of 1193 μg/kg and 136.7 μg/kg. The maximum detected concentration of TCC in both domestic and foreign honey samples was lower than that of LOQ.This shows that for TCS, BPF, 4HBP and MeP, the contamination range of foreign samples is wider than that of domestic samples, and for TCC and PrP, the contamination range of domestic samples is wider.
As shown in Figure 12, for the geometric mean concentrations of TCS, BPF, 4HBP, MeP and PrP, foreign honey samples were higher than Chinese honey samples. The geometric mean concentrations of TCC were comparable in both domestic and foreign samples. It can be seen that the contamination of typical endocrine disruptors in foreign honey samples was more serious than domestic ones. Among them, BPF had the highest level of contamination with a geometric mean concentration of 527.1 μg/kg, followed by MeP with a geometric mean concentration of 56.19 μg/kg.
3.4. Daily Intake and Health Risk Assessment
3.4.1. Daily Intake and Health Risk Assessment for Adults
Adult EDI and RfD for TCS, TCC, BPF, 4HBP, MeP, and PrP are shown in Table 12. The EDI was calculated as the maximum detected concentration of EDCs in the honey samples, and LOD was used for detected concentrations below the LOQ. The highest EDIs for a single intake of TCS, TCC, BPF, 4HBP, MeP, and PrP were 28.92, 1.60, 238.6, 58.98, 87.90, and 27.34 ng/kg bw/d, respectively, which were all lower than the calculated RfD, when calculated for a 50-kg adult consuming 10 g of honey per day. It suggests that none of the six typical endocrine disruptors mentioned above ingested through honey in adults pose a significant risk to human health if 10 g of honey has been consumed daily. The lower thresholds were chosen for this study and adjusted for possible uncertainties (Table 12 and Table 13). Considering that there are a number of uncertainties in the risk assessment, including the RfD that found that TCS produces a more severe health damage endpoint (i.e., liver injury) [36]. RfD levels are lower on the more sensitive endpoint of hormone reduction due to intraspecific and interspecific uncertainty [36].
HQ has been used to evaluate the non-carcinogenic health risk of a pollutant and have a specific threshold value. Significant health risks exist when HQ > 1. This study incorporated the human equivalent dose into the risk assessment (Table 12). The HQ of TCS, TCC, BPF, 4HBP, MeP and PrP ingestion from honey in adults were 2.2×10⁻³, 1.2×10⁻⁴, 2.2×10⁻², 1.1×10⁻³, 8.79×10⁻⁶ and 0.15, respectively. Although the HQ of all six EDCs was less than 1,PrP having the highest HQ of 0.15, it still needs to be a cause for concern. Although PrP is one of the most commonly used parabens in food and cosmetics and is approved for use in several over-the-counter drugs [11,41]. However, PrP produces higher toxicity than MeP by inducing stress and inflammation, DNA damage, and fatty acid metabolism, and its weak estrogenic and antiandrogenic effects may disrupt normal reproductive functions [42]. Reproductive toxicity of PrP has been reported in male and female rats [43].
3.4.2. Daily Intake and Health Risk Assessment for Infants
The EDIs and RfDs of infants exposed to TCS, TCC, BPF, 4HBP, MeP, and PrP through ingestion of honey are shown in Table 13. The EDI was calculated as the maximum detected concentration of EDCs in the honey samples, and LOD was used for detected concentrations below the LOQ. Infant weight was based on the average weight of infants from the Fifth National Survey of Chinese Children. Based on a daily intake of 10 g of honey, the EDIs of TCS, TCC, BPF, 4HBP, MeP, and PrP for infants of different ages ingested at one time peaked at 0-1 month. It indicates that infants aged 0-1 month have the highest risk of exposure to TCS, TCC, BPF, 4HBP, MeP and PrP through honey consumption. None of the EDIs for TCS, TCC, 4HBP, MeP and PrP exceeded the calculated RfD, but the EDI for BPF exceeded the calculated RfD.
By calculating the HQ values (Table 14), it can be concluded that the HQ values of TCS, TCC, 4HBP, MeP, and PrP are less than 1. It was shown that by consuming honey, infants are at less risk of being exposed to the five typical endocrine disruptors mentioned above. BPF had the highest HQ values, with infants aged 0-12 months exposed to BPF through honey having HQ values greater than or equal to 1. It was indicated that honey is a high-risk substance for BPF exposure in infants one year of age and younger. In addition, HQ values of TCS, TCC, BPF, 4HBP, MeP, and PrP exposed through honey peaked at 0-1 month, followed by a decreasing trend with age. Therefore, it is recommended that infants aged one year and below should reduce their intake of honey-based foods.
Several uncertainties about the study remain to be resolved. Firstly, the generalizability of the findings was limited to adults and infants under 3 years of age. Secondly, the dietary route constitutes only one component of total exposure for adults and infants. In fact, dermal contact has been reported to be the primary route of human exposure to preservatives and antimicrobials[45]. Parabens and TCS have also been detected in textiles, which are often in contact with adults and infants[46]. Therefore, other important routes of exposure to these antimicrobial additives for adults and infants may include contact with clothing as well as through dermal absorption and hand-to-mouth contact such as the use of disinfectant soaps, sanitizers, and cosmetics. However, the effect of each pathway on total exposure is unknown. The effects of PrP, TCS and TCC on reproductive and neurobehavioral function and bacterial resistance have been identified in recent years, and many of the associated RfDs are from more serious endpoints. Therefore, the need for sensitive end systems toxicology tests are carried out, such as reproductive hormones and the destruction of the microbiota and the change of the nervous system. However, the available evidence is still too limited to draw conclusions about these emerging contaminants. These results emphasize the importance of in-depth toxicological testing of parabens, TCS and TCC, and further biomonitoring of exposure levels in adults as well as infants.
4. Conclusions
In this study, a method for the simultaneous determination of seven typical endocrine disruptors (TCS, TCC, MTCS, BPF, 4HBP, MeP and PrP) in honey by ultrasound-assisted dispersive liquid-liquid microextraction coupled with high performance liquid chromatography (HPLC) was developed. Actual samples were also tested on a total of 47 honey samples from 7 countries, 5 different packaging materials and 12 honey sources. The results showed that 6 EDCs including TCS, TCC, BPF, 4HBP, MeP and PrP were detected in honey samples except MTCS. BPF, MeP and PrP were detected in all honey sources. The total detection rates of 4HBP, TCS and TCC in honey samples were 36.17%, 29.79% and 19.15%, respectively. The maximum detected concentration of BPF was 1194 μg/kg, which originated from multifloral honey packed in PET in foreign countries.The maximum detected concentration of MeP was 439.5 μg/kg, which originated from milk vetch honey packed in PET in China. The maximum detected concentration of 4HBP was 294.9 μg/kg, which originated from domestic multifloral honey packaged in laminated polymer/foil pouches.The maximum detected concentration of TCS was 144.6 μg/kg, which originated from domestic linden honey packaged in PET. The maximum detected concentration of PrP was 136.7 μg/kg, which originated from foreign multifloral honey packaged in PET.TCC was lower than LOQ in all honey samples. 136.7 μg/kg, derived from polyfloral honey packaged in foreign PET. TCC was detected at lower concentrations than LOQ in all honey samples. The contamination of TCS, BPF, 4HBP and MeP in foreign honey samples was wider than domestic. The contamination of TCS, 4HBP and MeP in domestic honey samples was more extensive than that in foreign countries, and the contamination of BPF and PrP in foreign honey samples was more extensive than that in domestic countries. The health risk assessment revealed that the seven typical endocrine disruptors in honey posed a low health risk to adults, but infants and children one year of age and younger were exposed to a high health risk of Bisphenol F through honey consumption. Therefore, it is recommended that infants should avoid honey foods and that contamination and monitoring of typical endocrine disruptors during food processing should be enhanced.
References
- SCOGNAMIGLIO V, ANTONACCI A, PATROLECCO L, et al. Analytical tools monitoring endocrine disrupting chemicals [J]. TrAC Trends in Analytical Chemistry, 2016, 80: 555-67.
- DE COSTER S, VAN LAREBEKE N. Endocrine-disrupting chemicals: associated disorders and mechanisms of action [J]. J Environ Public Health, 2012, 2012: 713696.
- AZZOUZ A, KAILASA S K, KUMAR P, et al. Advances in functional nanomaterial-based electrochemical techniques for screening of endocrine disrupting chemicals in various sample matrices [J]. TrAC Trends in Analytical Chemistry, 2019, 113: 256-79.
- BOCATO M Z, CESILA C A, LATARO B F, et al. A fast-multiclass method for the determination of 21 endocrine disruptors in human urine by using vortex-assisted dispersive liquid-liquid microextraction (VADLLME) and LC-MS/MS [J]. Environ Res, 2020, 189: 109883.
- GEE R H, CHARLES A, TAYLOR N, et al. Oestrogenic and androgenic activity of triclosan in breast cancer cells [J]. J Appl Toxicol, 2008, 28(1): 78-91.
- FANG J L, STINGLEY R L, BELAND F A, et al. Occurrence, efficacy, metabolism, and toxicity of triclosan [J]. J Environ Sci Health C Environ Carcinog Ecotoxicol Rev, 2010, 28(3): 147-71.
- GEER L A, PYCKE B F G, WAXENBAUM J, et al. Association of birth outcomes with fetal exposure to parabens, triclosan and triclocarban in an immigrant population in Brooklyn, New York [J]. J Hazard Mater, 2017, 323(Pt A): 177-83.
- HIGASHIHARA N, SHIRAISHI K, MIYATA K, et al. Subacute oral toxicity study of bisphenol F based on the draft protocol for the “Enhanced OECD Test Guideline no. 407” [J]. Archives of Toxicology, 2007, 81(12): 825-32.
- ROCHESTER J R, BOLDEN A L. Bisphenol S and F: A Systematic Review and Comparison of the Hormonal Activity of Bisphenol A Substitutes [J]. Environmental Health Perspectives, 2015, 123(7): 643-50.
- LEE S, LIU X, TAKEDA S, et al. Genotoxic potentials and related mechanisms of bisphenol A and other bisphenol compounds: A comparison study employing chicken DT40 cells [J]. Chemosphere, 2013, 93(2): 434-40.
- SONI M G, CARABIN I G, BURDOCK G A. Safety assessment of esters of p-hydroxybenzoic acid (parabens) [J]. Food Chem Toxicol, 2005, 43(7): 985-1015.
- WITORSCH R J, THOMAS J A. Personal care products and endocrine disruption: A critical review of the literature [J]. Crit Rev Toxicol, 2010, 40 Suppl 3: 1-30.
- VO T T, YOO Y M, CHOI K C, et al. Potential estrogenic effect(s) of parabens at the prepubertal stage of a postnatal female rat model [J]. Reprod Toxicol, 2010, 29(3): 306-16.
- CHEN J, AHN K C, GEE N A, et al. Antiandrogenic properties of parabens and other phenolic containing small molecules in personal care products [J]. Toxicol Appl Pharmacol, 2007, 221(3): 278-84.
- SHARIATIFAR N, DADGAR M, FAKHRI Y, et al. Levels of polycyclic aromatic hydrocarbons in milk and milk powder samples and their likely risk assessment in Iranian population [J]. Journal of Food Composition and Analysis, 2020, 85.
- WANG X, WANG M, WANG X, et al. A novel naphthalene carboxylic acid-based ionic liquid mixed disperser combined with ultrasonic-enhanced in-situ metathesis reaction for preconcentration of triclosan and methyltriclosan in milk and eggs [J]. Ultrason Sonochem, 2018, 47: 57-67.
- YAO L, LV Y Z, ZHANG L J, et al. Determination of 24 personal care products in fish bile using hybrid solvent precipitation and dispersive solid phase extraction cleanup with ultrahigh performance liquid chromatography-tandem mass spectrometry and gas chromatography-mass spectrometry [J]. J Chromatogr A, 2018, 1551: 29-40.
- WU H, WU L H, WANG F, et al. Several environmental endocrine disruptors in beverages from South China: occurrence and human exposure [J]. Environ Sci Pollut Res Int, 2019, 26(6): 5873-84.
- ZAPATA N I, PEñUELA G A. Modified QuEChERS/UPLC-MS/MS method to monitor triclosan, ibuprofen, and diclofenac in fish Pseudoplatystoma magdaleniatum [J]. Food Analytical Methods, 2021, 14(6): 1289-304.
- GENTILI A, MARCHESE S, PERRET D. MS techniques for analyzing phenols, their metabolites and transformation products of environmental interest [J]. TrAC Trends in Analytical Chemistry, 2008, 27(10): 888-903.
- MANAV Ö G, DINç-ZOR Ş, ALPDOĞAN G. Optimization of a modified QuEChERS method by means of experimental design for multiresidue determination of pesticides in milk and dairy products by GC–MS [J]. Microchemical Journal, 2019, 144: 124-9.
- BEMRAH N, JEAN J, RIVIERE G, et al. Assessment of dietary exposure to bisphenol A in the French population with a special focus on risk characterisation for pregnant French women [J]. Food Chem Toxicol, 2014, 72: 90-7.
- HAN L, MATARRITA J, SAPOZHNIKOVA Y, et al. Evaluation of a recent product to remove lipids and other matrix co-extractives in the analysis of pesticide residues and environmental contaminants in foods [J]. J Chromatogr A, 2016, 1449: 17-29.
- FISHER M, MACPHERSON S, BRAUN J M, et al. Paraben Concentrations in Maternal Urine and Breast Milk and Its Association with Personal Care Product Use [J]. Environ Sci Technol, 2017, 51(7): 4009-17.
- MADEJ K, KALENIK T K, PIEKOSZEWSKI W. Sample preparation and determination of pesticides in fat-containing foods [J]. Food Chem, 2018, 269: 527-41.
- YANG Y, LU L, ZHANG J, et al. Simultaneous determination of seven bisphenols in environmental water and solid samples by liquid chromatography-electrospray tandem mass spectrometry [J]. J Chromatogr A, 2014, 1328: 26-34.
- AZZOUZ A, RASCON A J, BALLESTEROS E. Simultaneous determination of parabens, alkylphenols, phenylphenols, bisphenol A and triclosan in human urine, blood and breast milk by continuous solid-phase extraction and gas chromatography-mass spectrometry [J]. J Pharm Biomed Anal, 2016, 119: 16-26.
- SHAMSIPUR M, YAZDANFAR N, GHAMBARIAN M. Combination of solid-phase extraction with dispersive liquid-liquid microextraction followed by GC-MS for determination of pesticide residues from water, milk, honey and fruit juice [J]. Food Chem, 2016, 204: 289-97.
- CHIRANI M R, KOWSARI E, TEYMOURIAN T, et al. Environmental impact of increased soap consumption during COVID-19 pandemic: Biodegradable soap production and sustainable packaging [J]. Science of The Total Environment, 2021, 796.
- SIDOR A, RZYMSKI P. Dietary Choices and Habits during COVID-19 Lockdown: Experience from Poland [J]. Nutrients, 2020, 12(6).
- ZHANG Y Q, LI H, WU H H, et al. The 5th national survey on the physical growth and development of children in the nine cities of China: Anthropometric measurements of Chinese children under 7 years in 2015 [J]. American Journal of Physical Anthropology, 2017, 163(3): 497-509.
- ENVIRONMENTAL PROTECTION AGENCY. Human health risk assessment protocol, chapter 7:characterizing risk and hazard. US EPA archive document [J].
- Opinion of the Scientific Panel on food additives, flavourings, processing aids and materials in contact with food (AFC) related to para hydroxybenzoates (E 214-219) [J]. EFSA Journal, 2004, 2(9).
- MINNESOTA DEPARTMENT OF HEALTH. Incoporation of human equivalent dose calculations into derivation of oral reference doses. MDH Health Risk Assessment Methods [J].
- ENVIRONMENTAL PROTECTION AGENCY. Recommendations for and documentation of biological values for use in risk assessment [J]. 2011.
- HEALTH M D O. Toxicological summary for triclosan. Human health-based water guidance table [J]. 2015.
- HEALTH M D O. Toxicological summary for triclocarban. Human health-based water guidance table [J]. 2013.
- CHEN M L, CHEN C H, HUANG Y F, et al. Cumulative Dietary Risk Assessment of Benzophenone-Type Photoinitiators from Packaged Foodstuffs [J]. Foods, 2022, 11(2).
- BOBERG J, TAXVIG C, CHRISTIANSEN S, et al. Possible endocrine disrupting effects of parabens and their metabolites [J]. Reproductive Toxicology, 2010, 30(2): 301-12.
- LEMINI C, R J, M A E A V, et al. In vivo and in vitro estrogen bioactivities of alkyl parabens [J]. Toxicology and Industrial Health, 2003, 19: 69-79.
- WEI F, MORTIMER M, CHENG H, et al. Parabens as chemicals of emerging concern in the environment and humans: A review [J]. Science of The Total Environment, 2021, 778.
- BEREKETOGLU C, PRADHAN A. Comparative transcriptional analysis of methylparaben and propylparaben in zebrafish [J]. Science of The Total Environment, 2019, 671: 129-39.
- LI M, ZHOU S, WU Y, et al. Prenatal exposure to propylparaben at human-relevant doses accelerates ovarian aging in adult mice [J]. Environmental Pollution, 2021, 285.
- <312.pdf> [J].
- TAN J, KUANG H, WANG C, et al. Human exposure and health risk assessment of an increasingly used antibacterial alternative in personal care products: Chloroxylenol [J]. Science of The Total Environment, 2021, 786.
- FREIRE C, MOLINA-MOLINA J-M, IRIBARNE-DURáN L M, et al. Concentrations of bisphenol A and parabens in socks for infants and young children in Spain and their hormone-like activities [J]. Environ Int, 2019, 127: 592-600.
Figure 1.
Effects of extractant types on extraction efficiency of 7 typical EDCs.
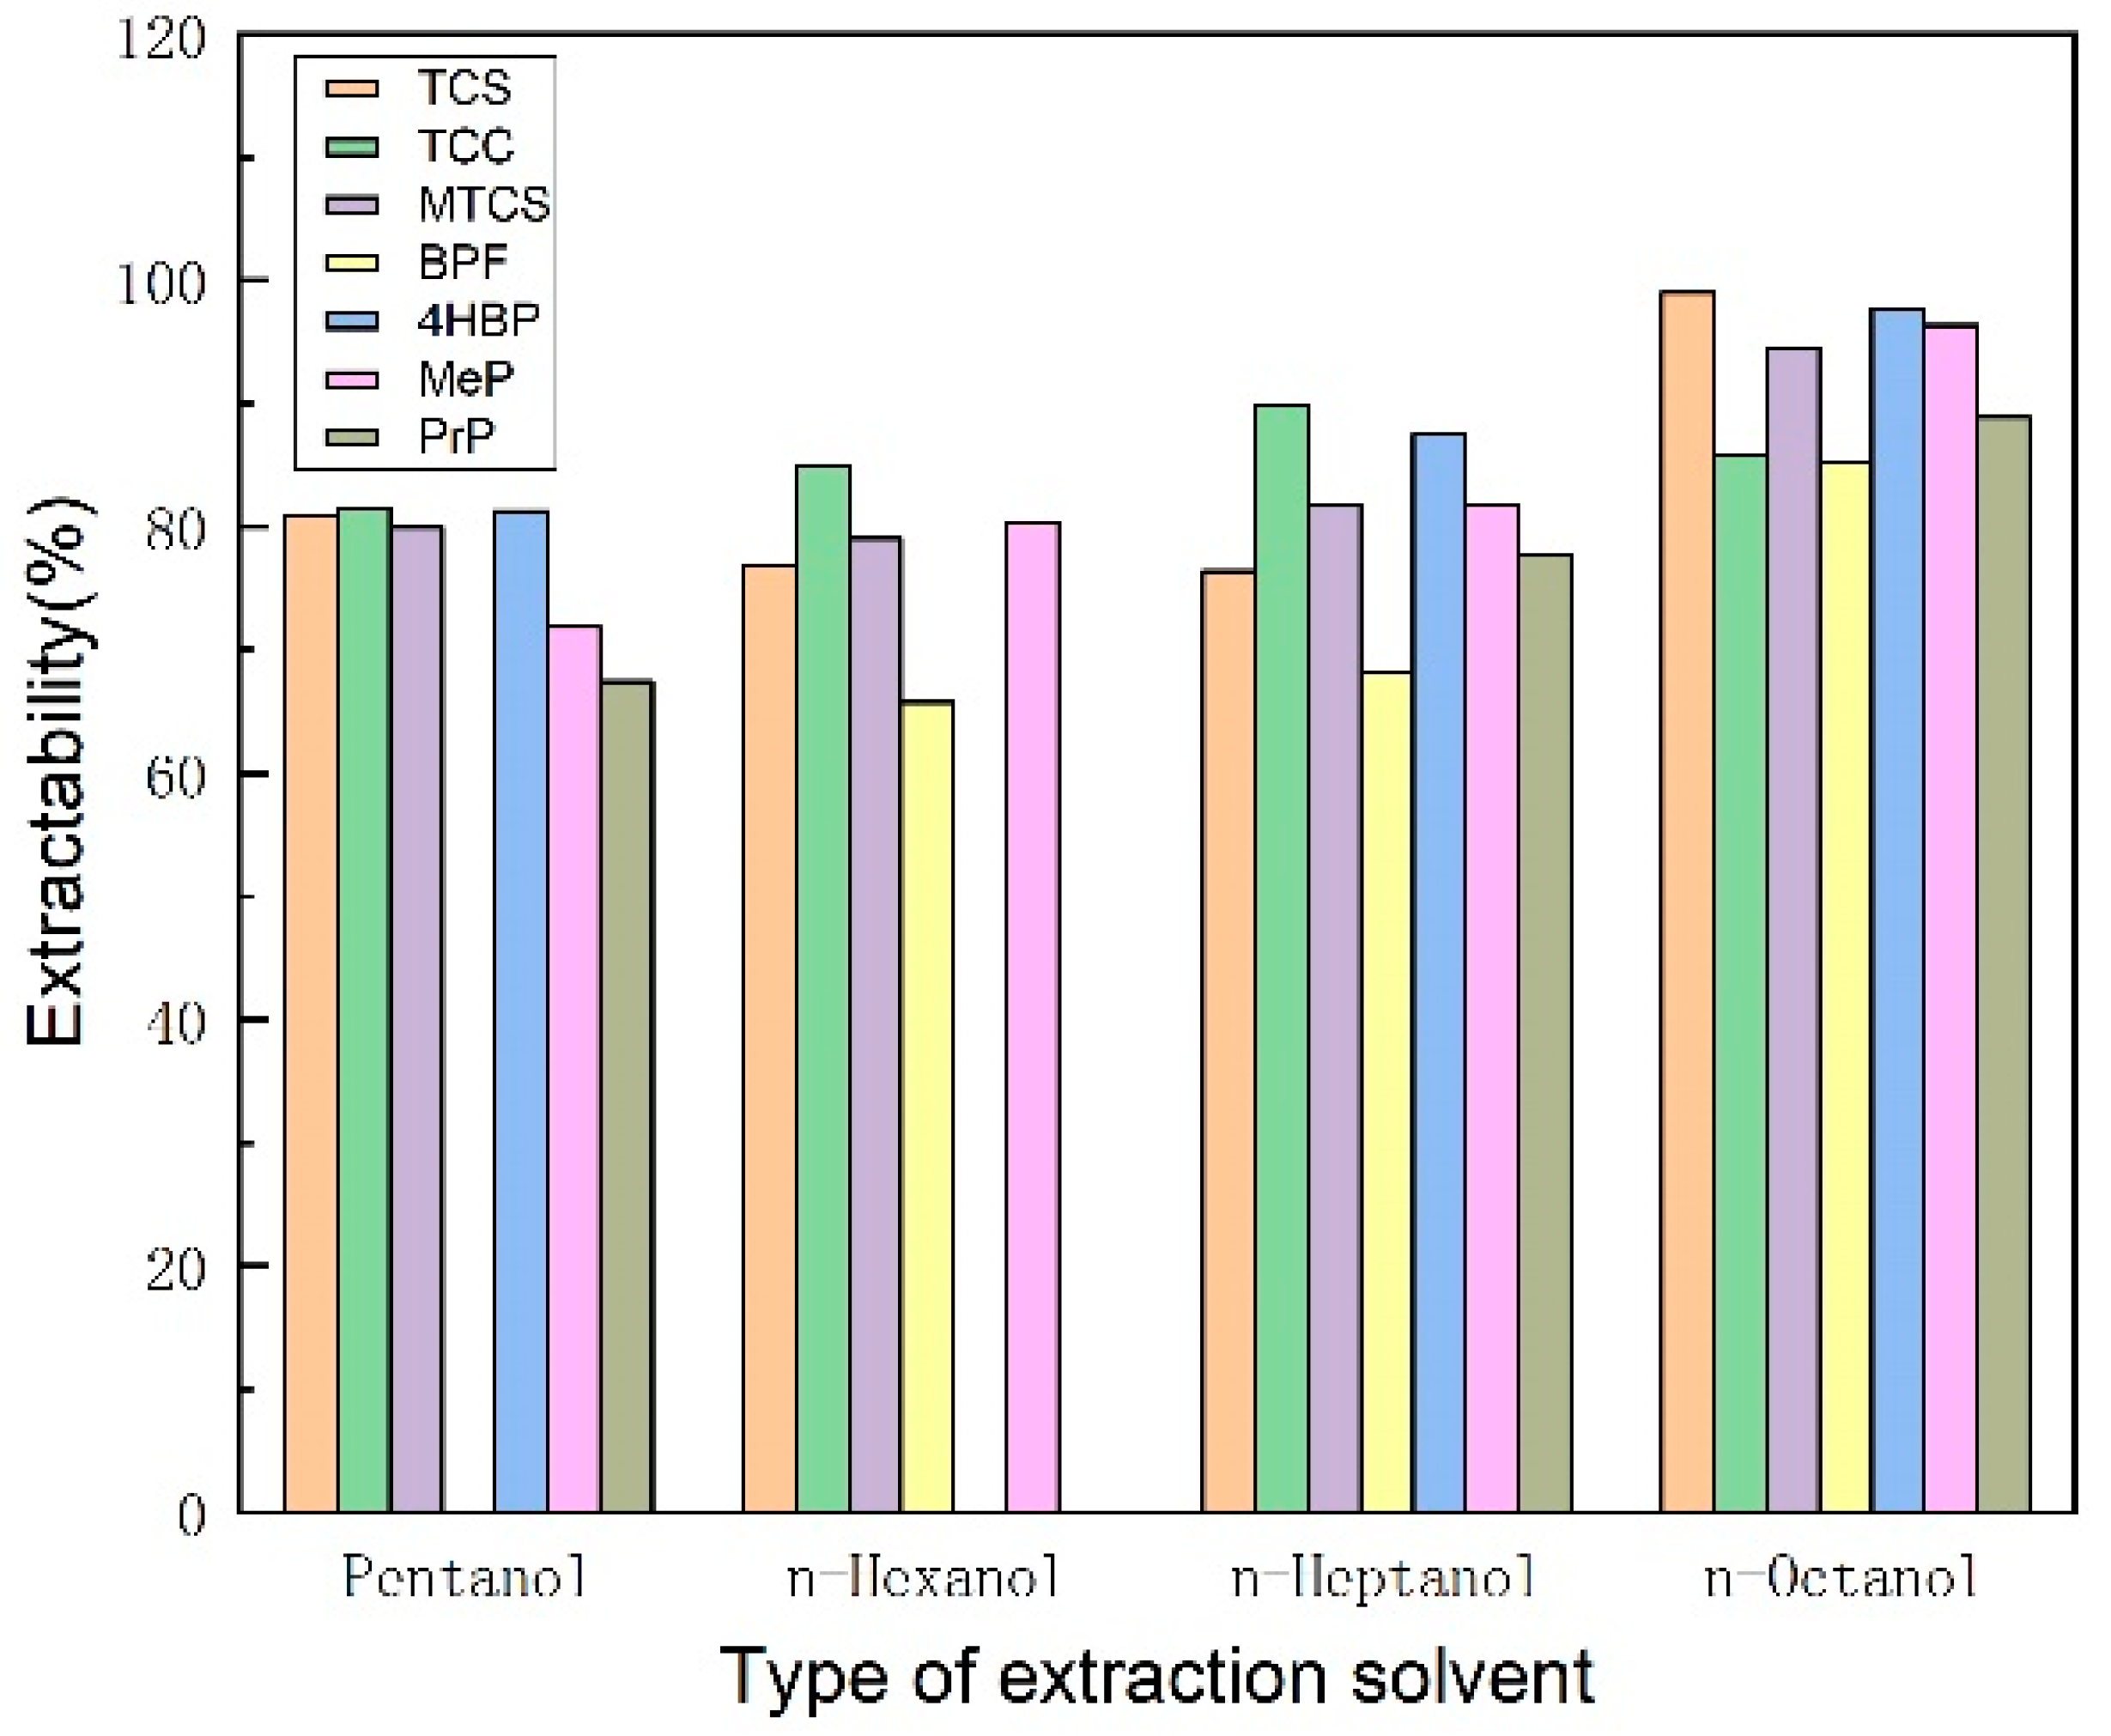
Figure 2.
Effect of extractant volume on extraction efficiency of 7 typical EDCs.
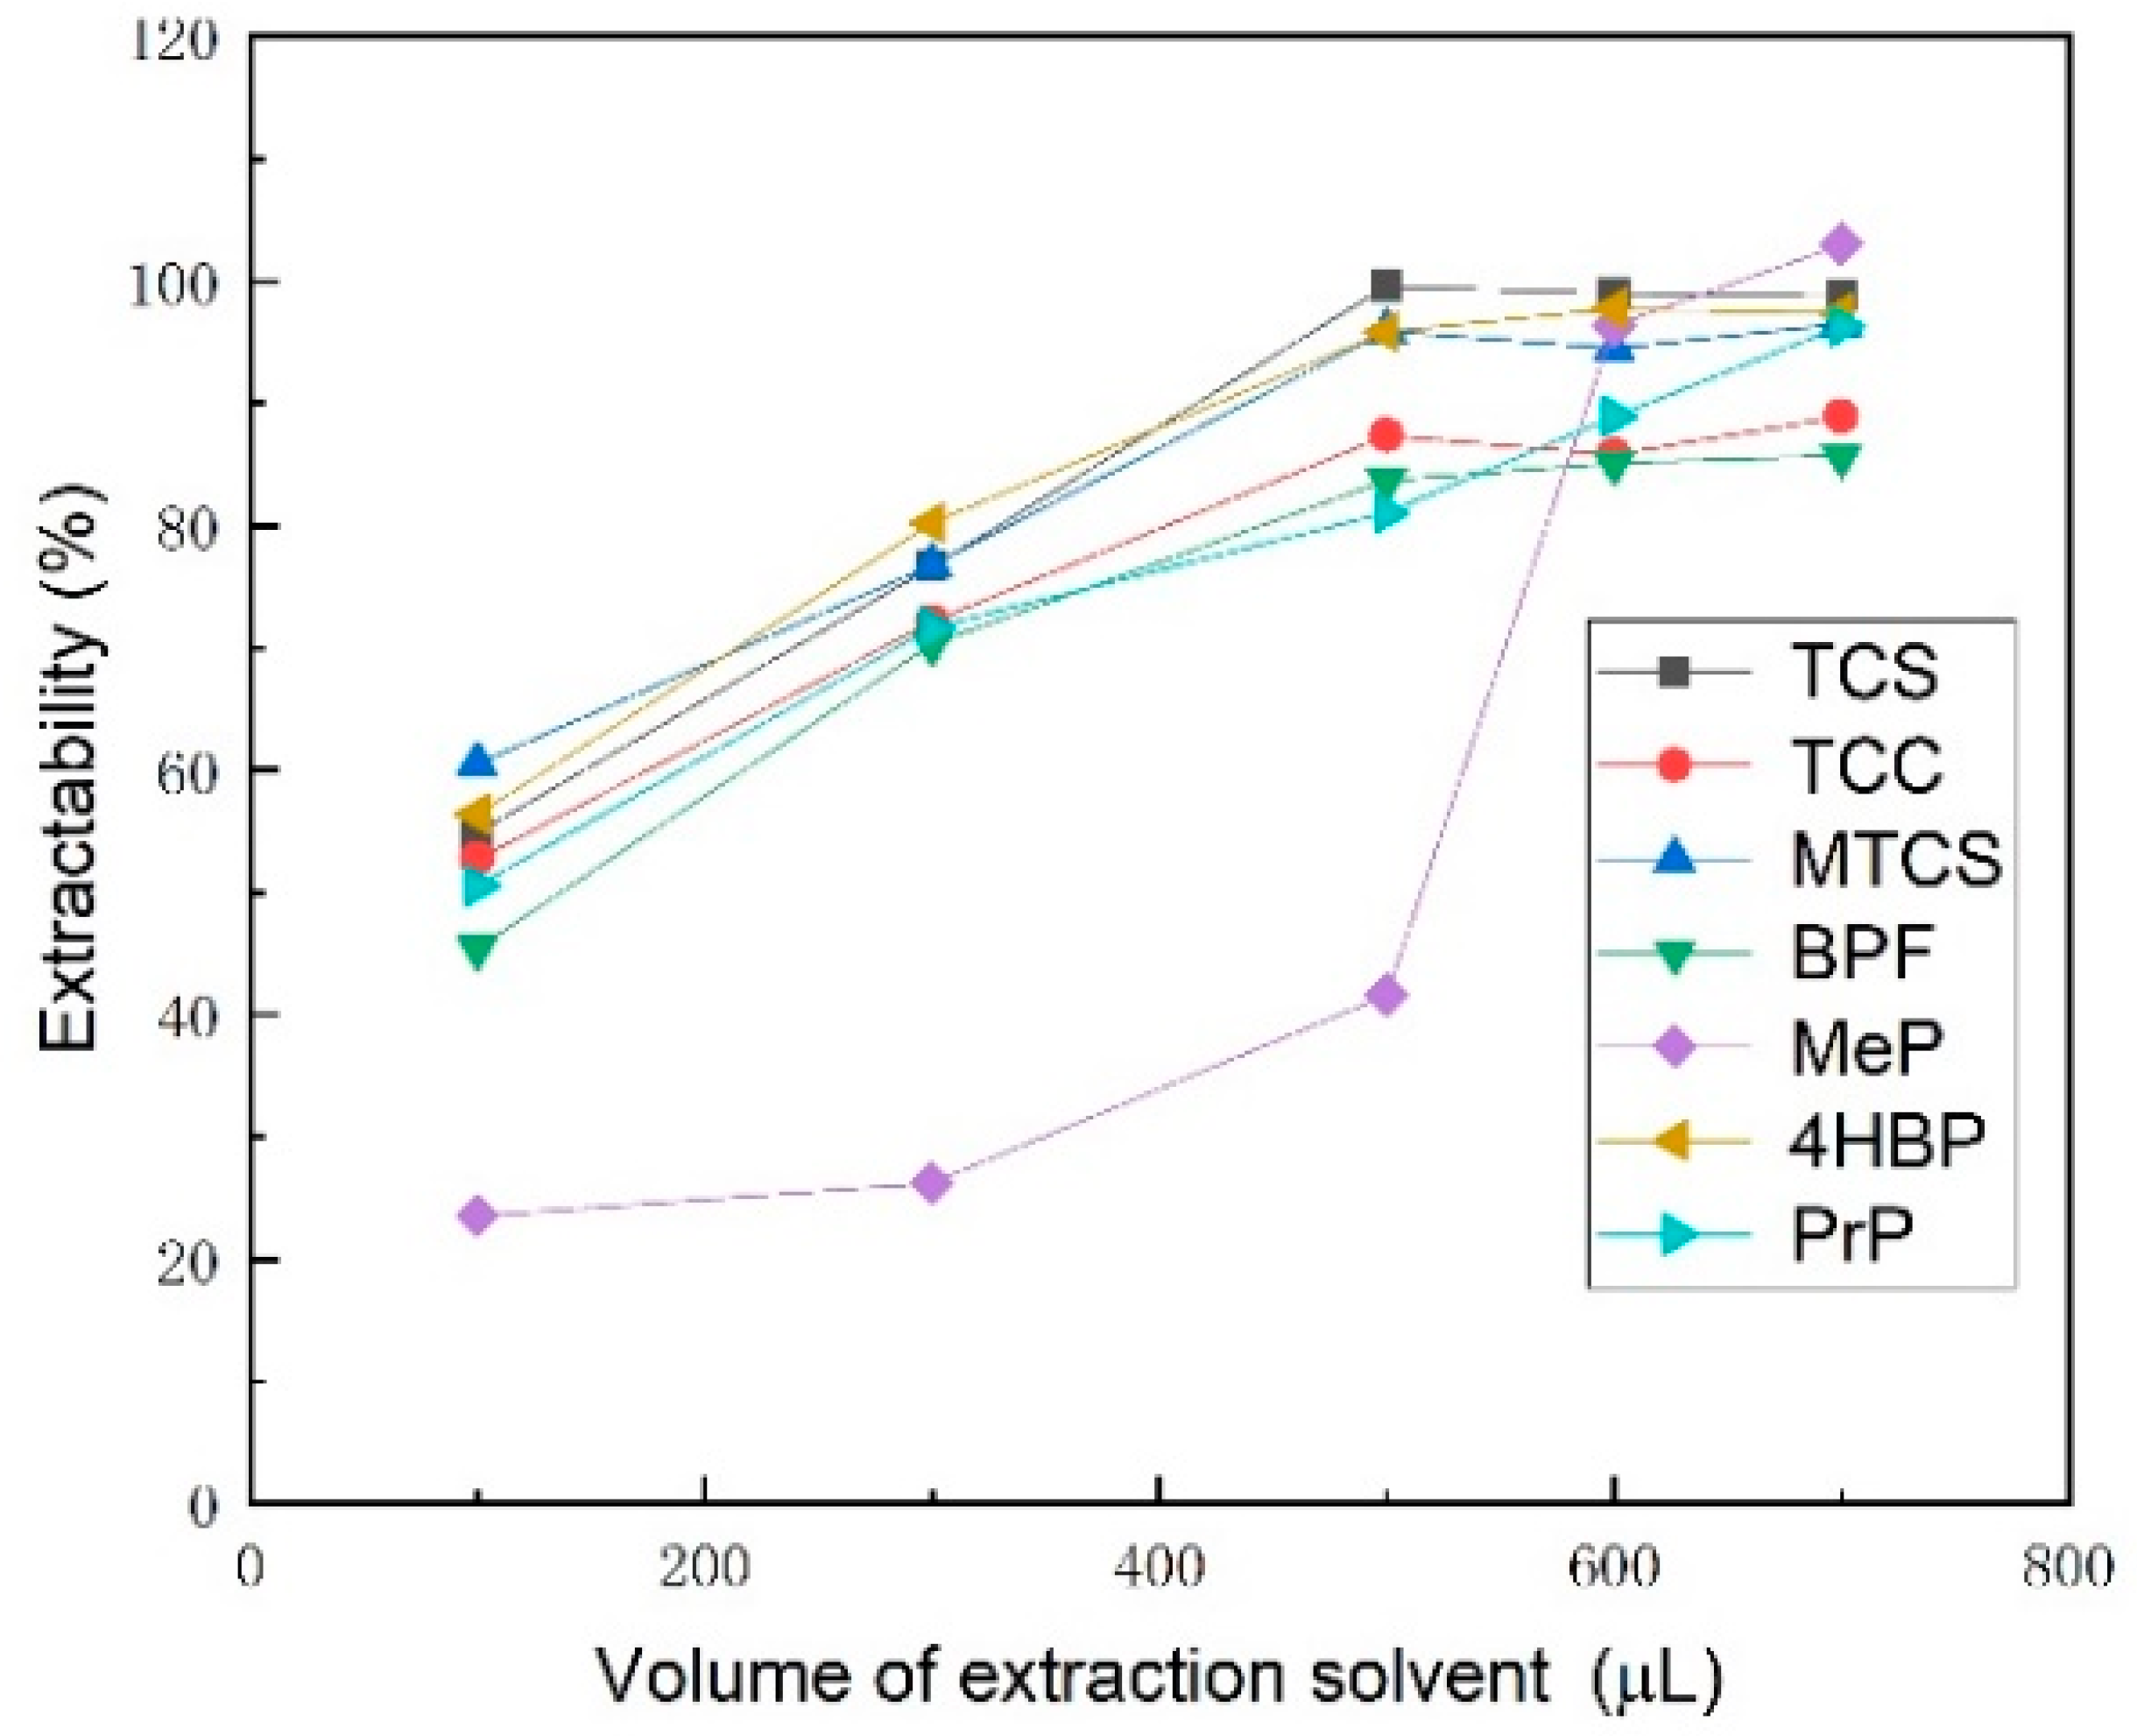
Figure 3.
Effect of ultrasonic duration on extraction efficiency of 7 typical EDCs.
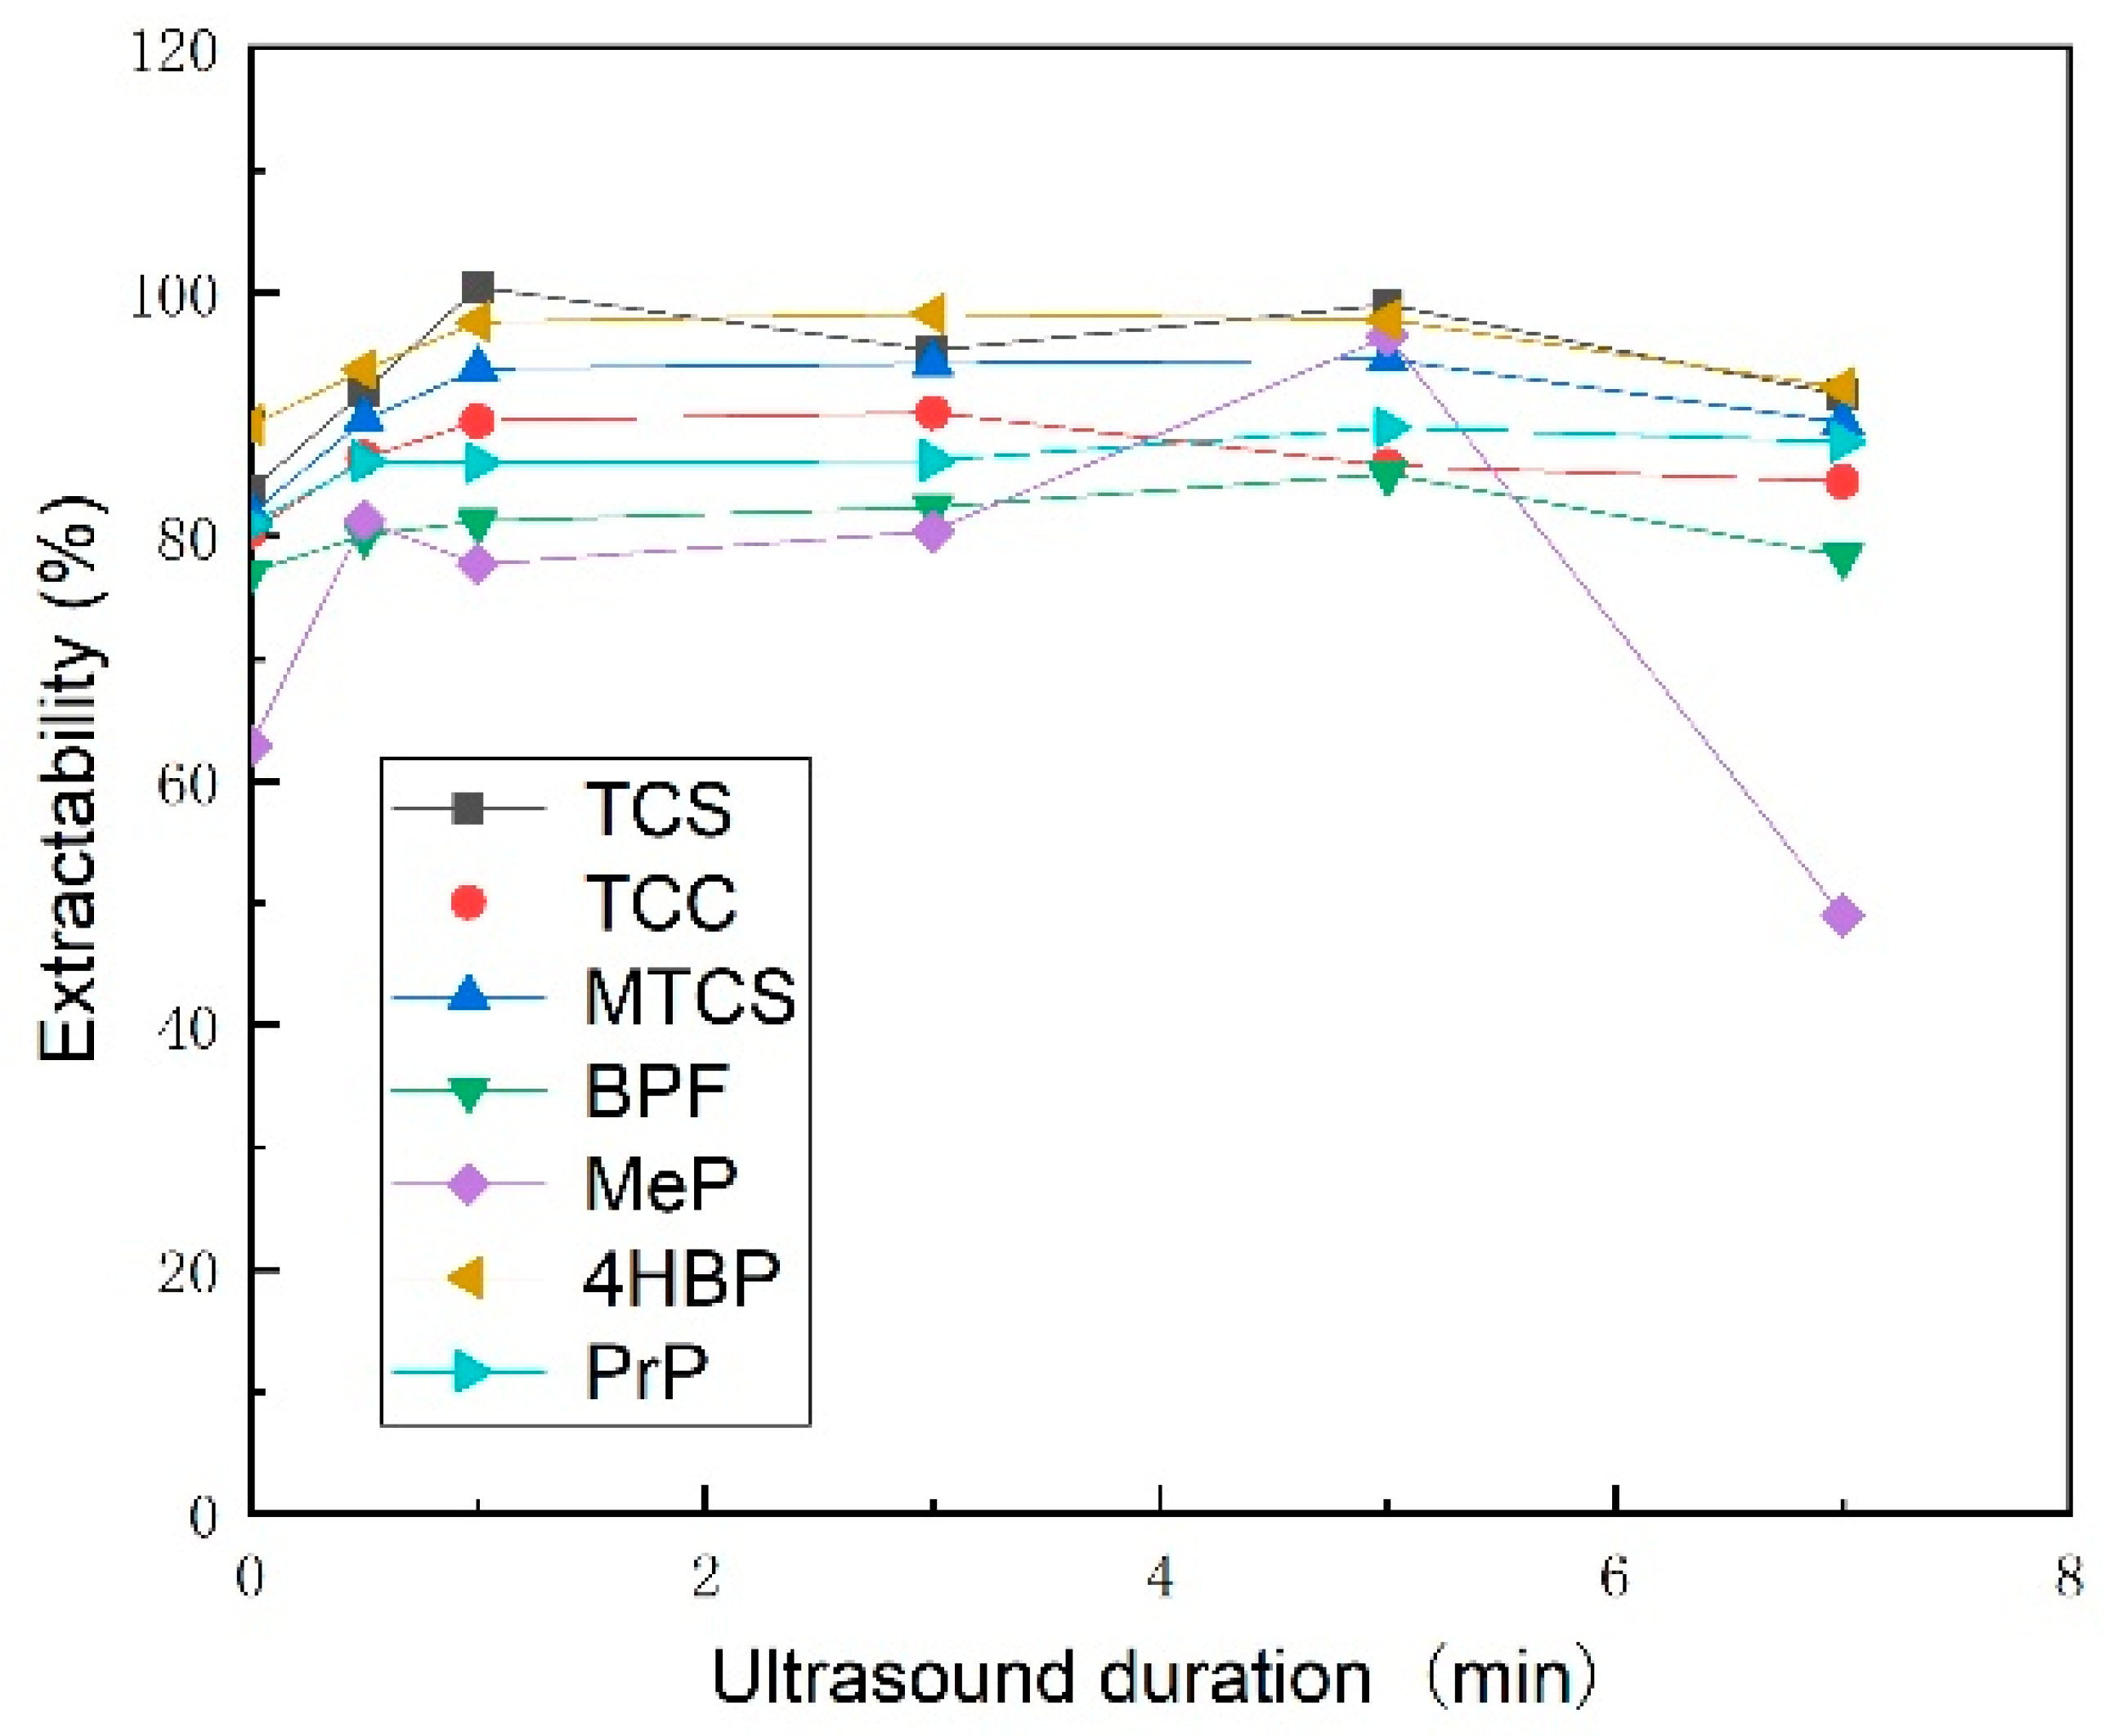
Figure 4.
Effect of ultrasonic temperature on extraction efficiency of 7 typical EDCs.
Figure 5.
Effects of inorganic salt types on extraction efficiency of 7 typical EDCs.
Figure 6.
Effect of inorganic salt dosage on extraction efficiency of 7 typical EDCs.

Figure 7.
Effect of pH on extraction efficiency of 7 typical EDCs.
Figure 8.
Effect of centrifugal rotation speed on extraction efficiency of 7 typical EDCs.
Figure 9.
Effect of centrifugation duration on extraction efficiency of 7 typical EDCs.
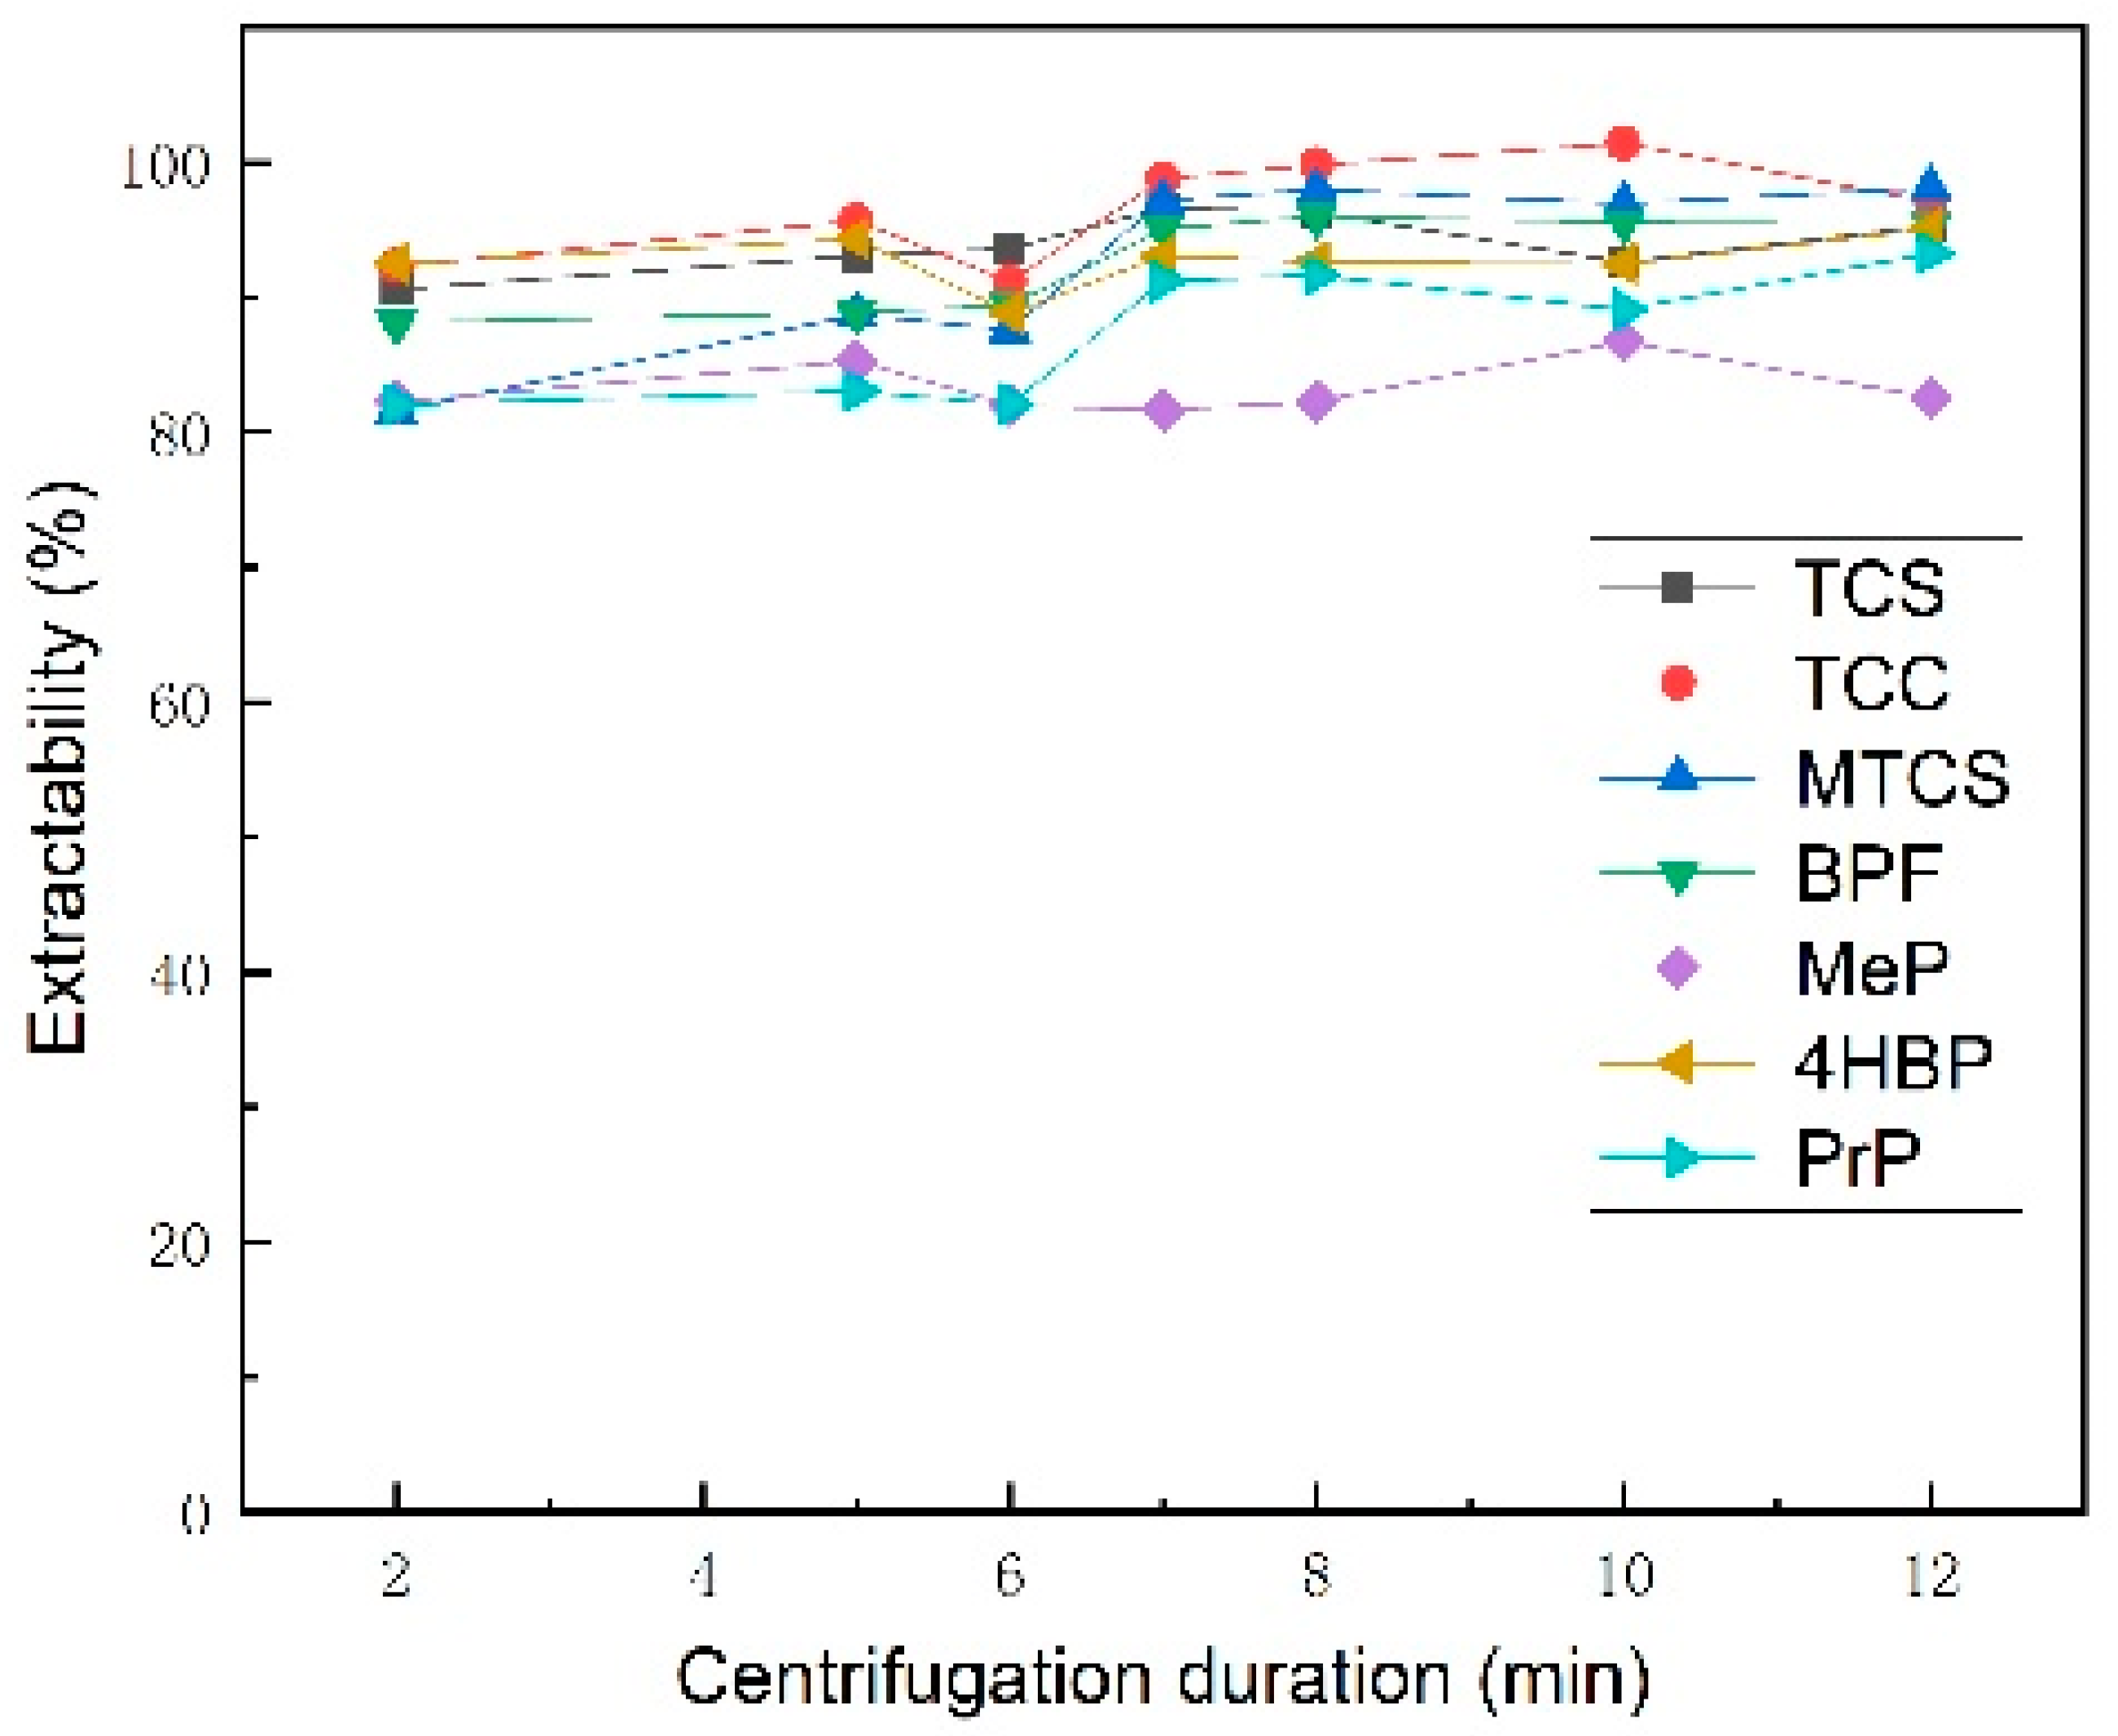
Figure 10.
Contamination of TCS、TCC、BPF、4HBP、MeP and PrP in honey from different sources.
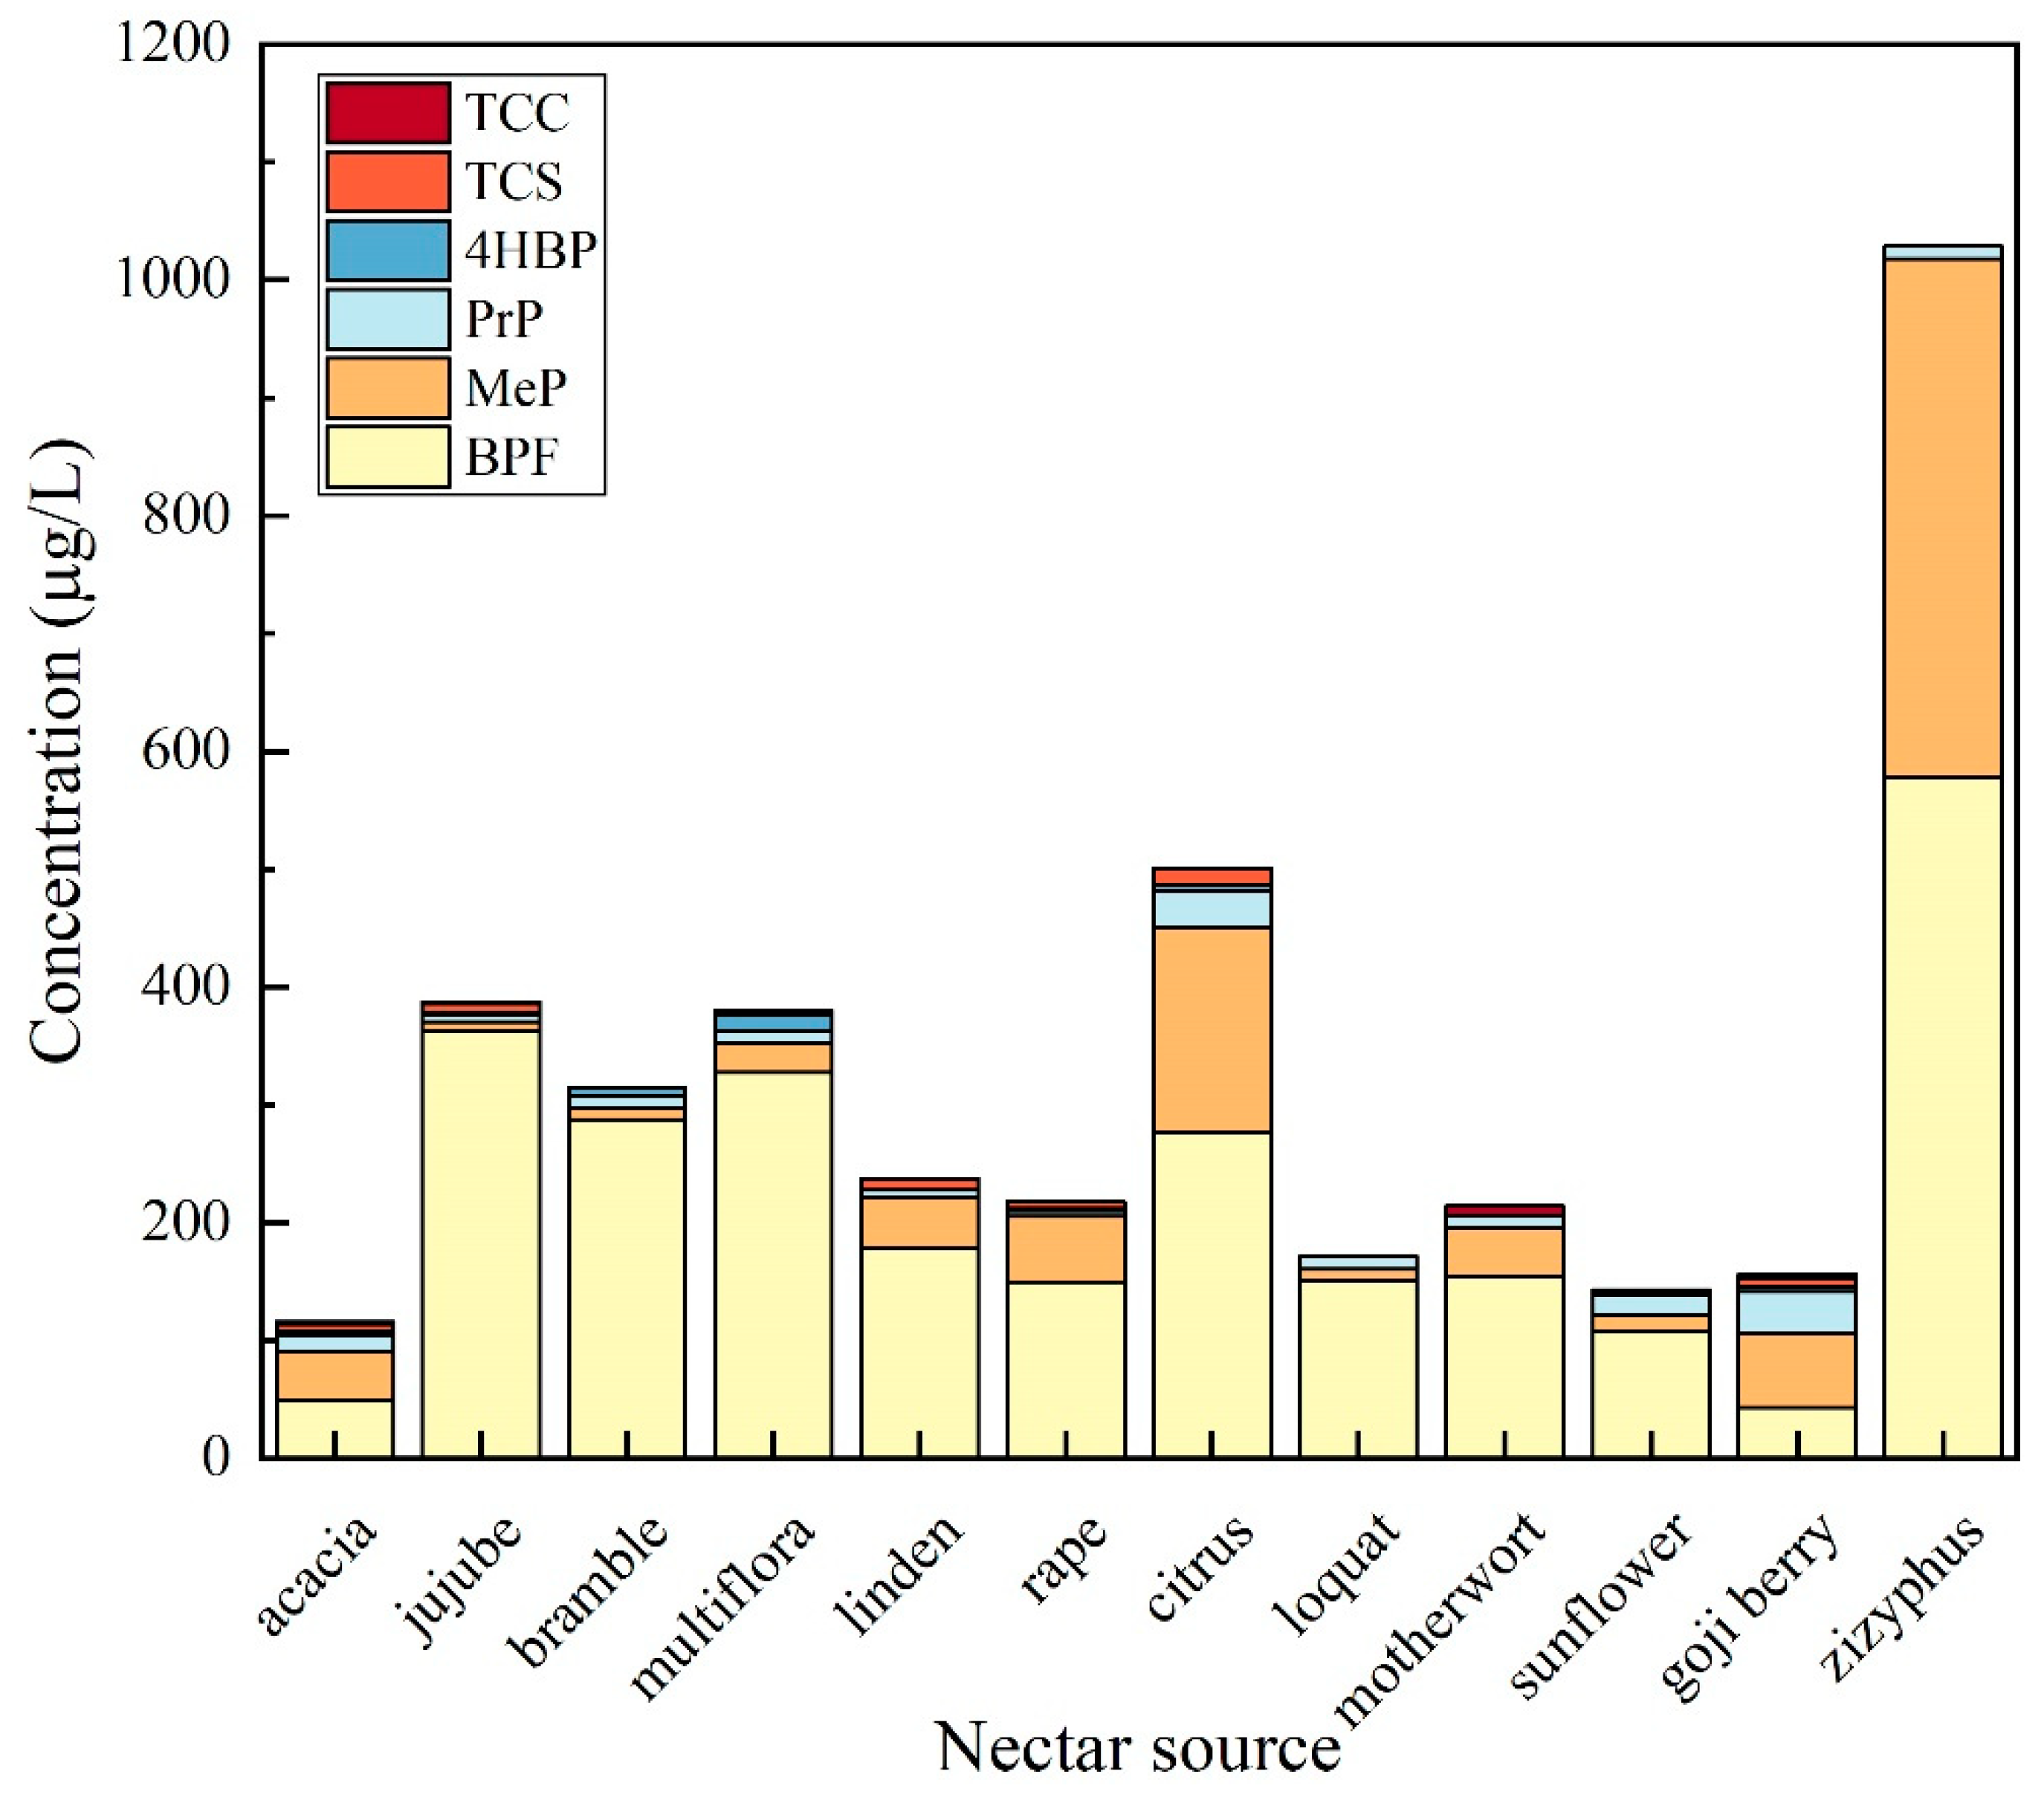
Figure 11.
Contamination of TCS、TCC、BPF、4HBP、MeP and PrP in honey of different packaging materials; LP/FP:laminated polymer/foil bags;GB-PL:glass bottles with plastic lids;GB-PLM:glass bottles with polymer-lined metal lids;AGB:all-glass bottle.
Figure 11.
Contamination of TCS、TCC、BPF、4HBP、MeP and PrP in honey of different packaging materials; LP/FP:laminated polymer/foil bags;GB-PL:glass bottles with plastic lids;GB-PLM:glass bottles with polymer-lined metal lids;AGB:all-glass bottle.
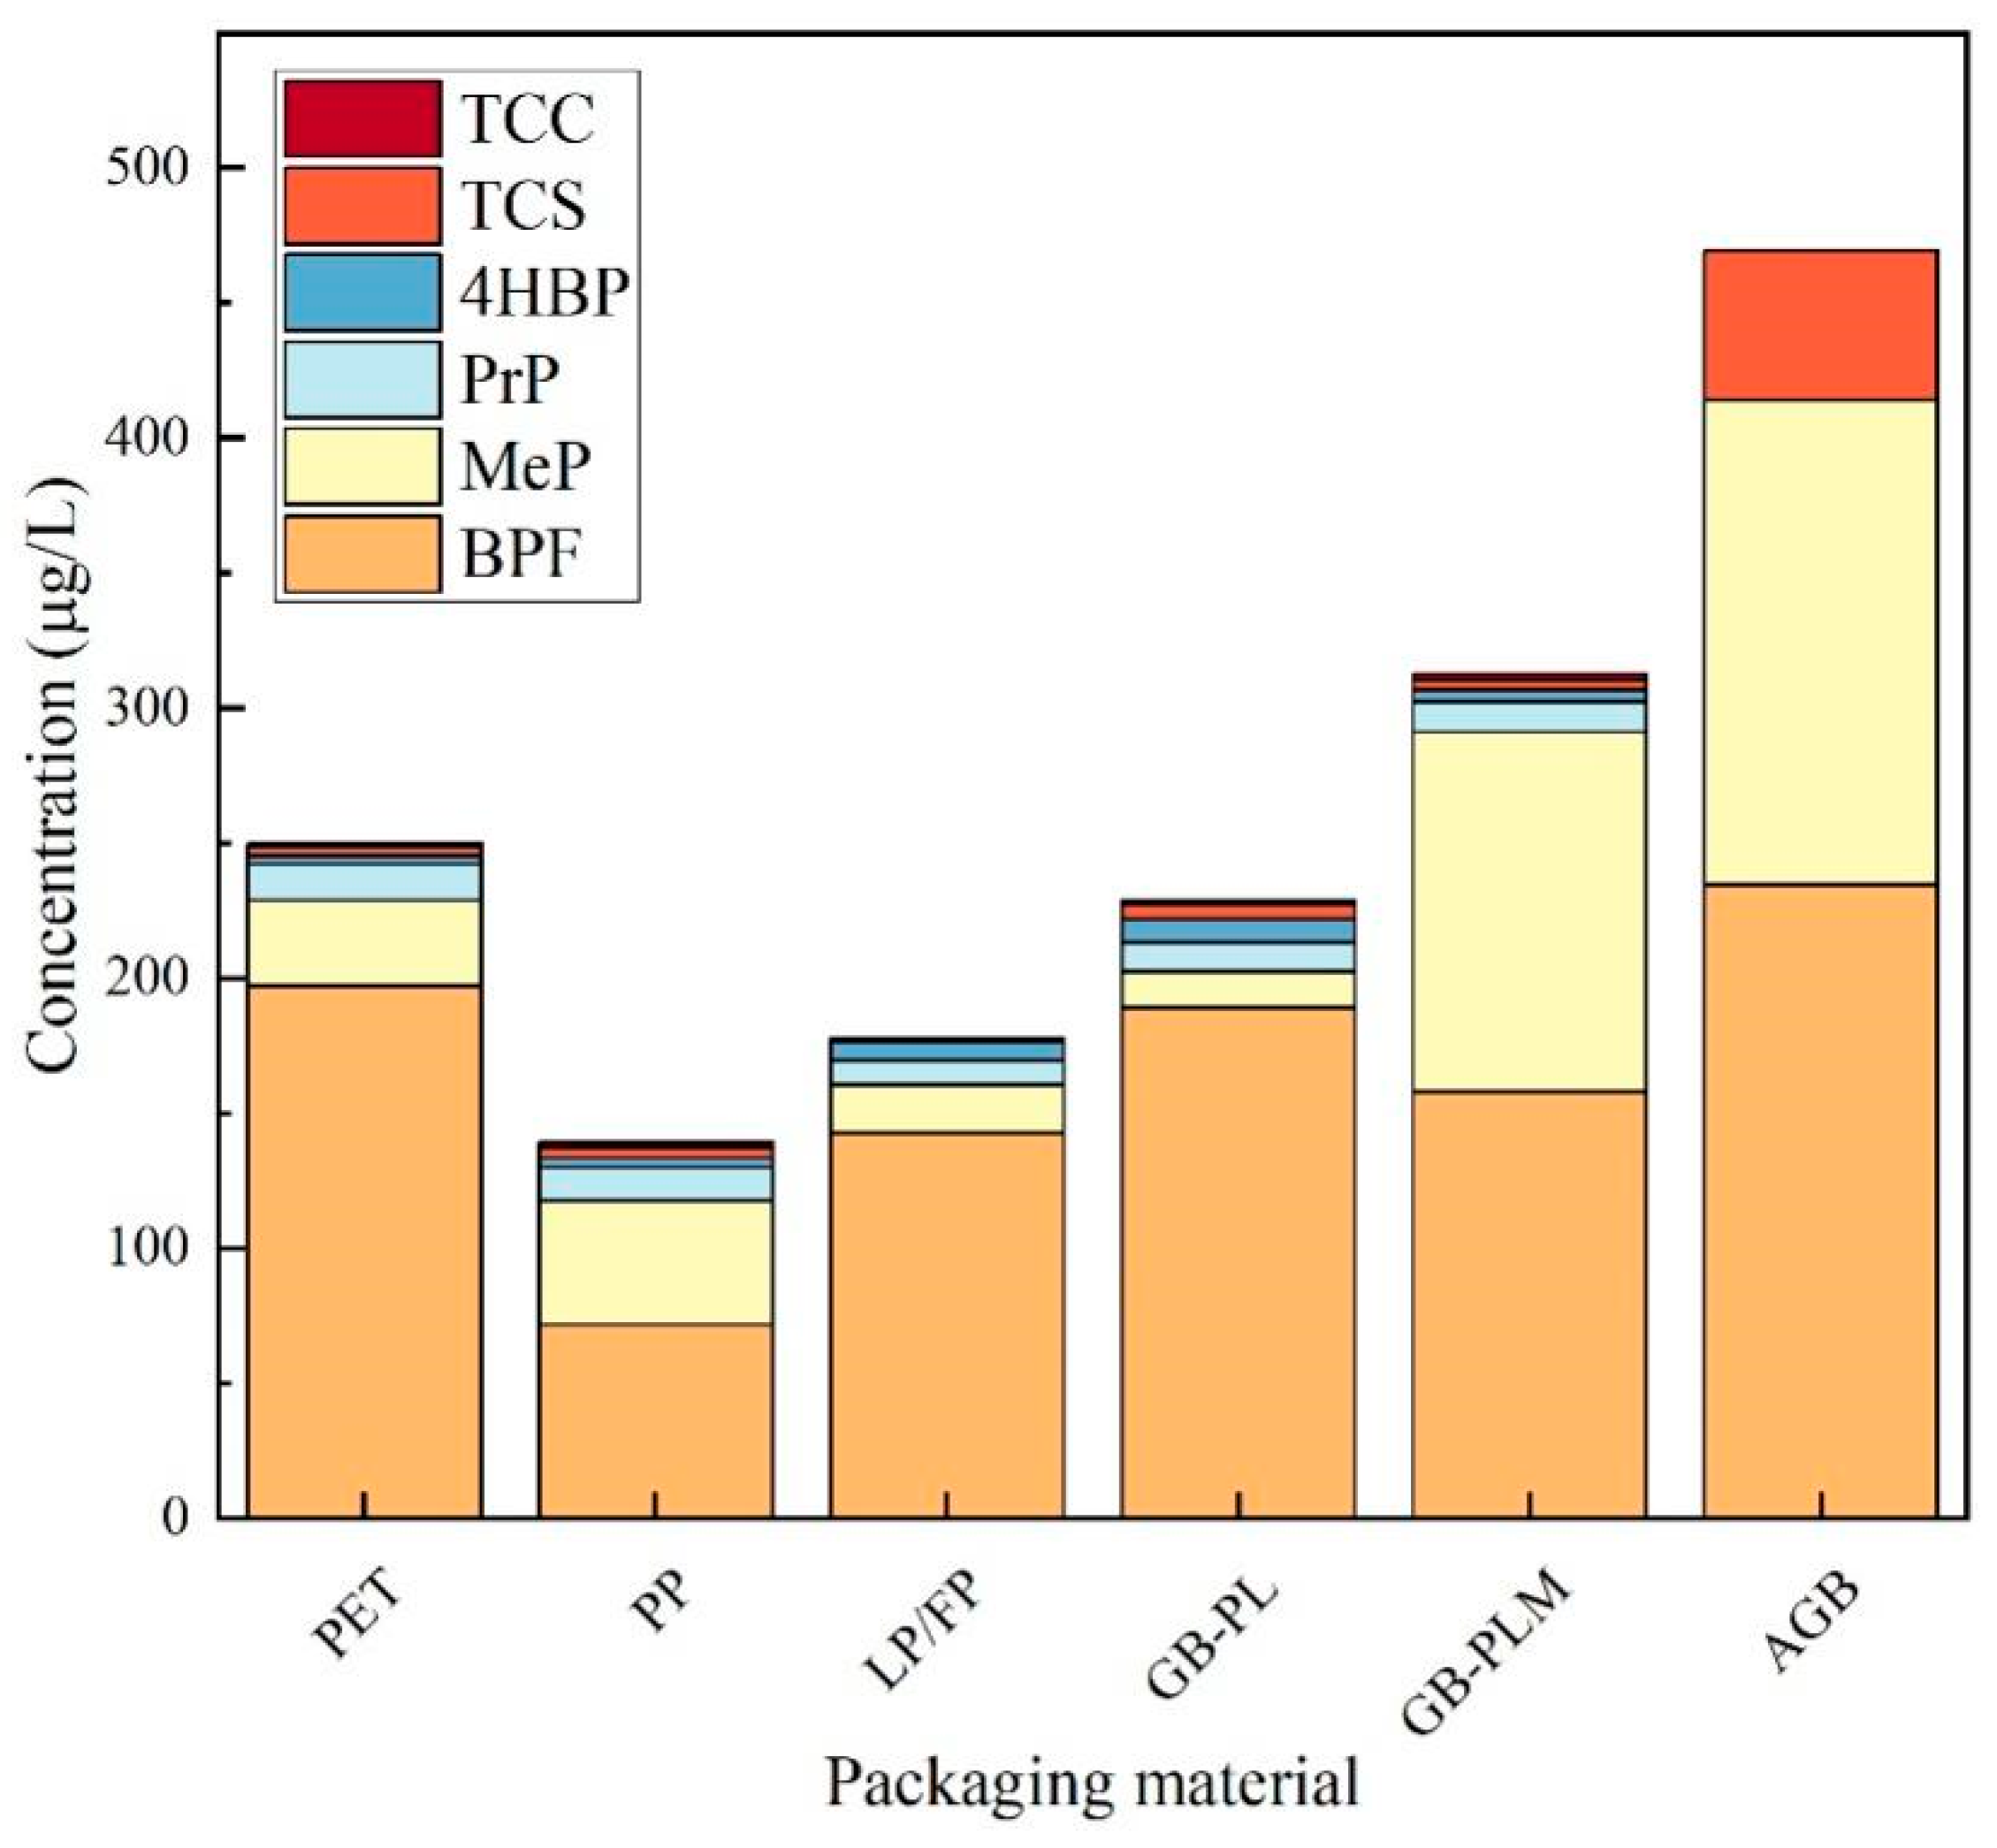
Figure 12.
Comparative analysis of geometric mean concentrations of 6 typical EDCs in honey samples from home and abroad.
Figure 12.
Comparative analysis of geometric mean concentrations of 6 typical EDCs in honey samples from home and abroad.
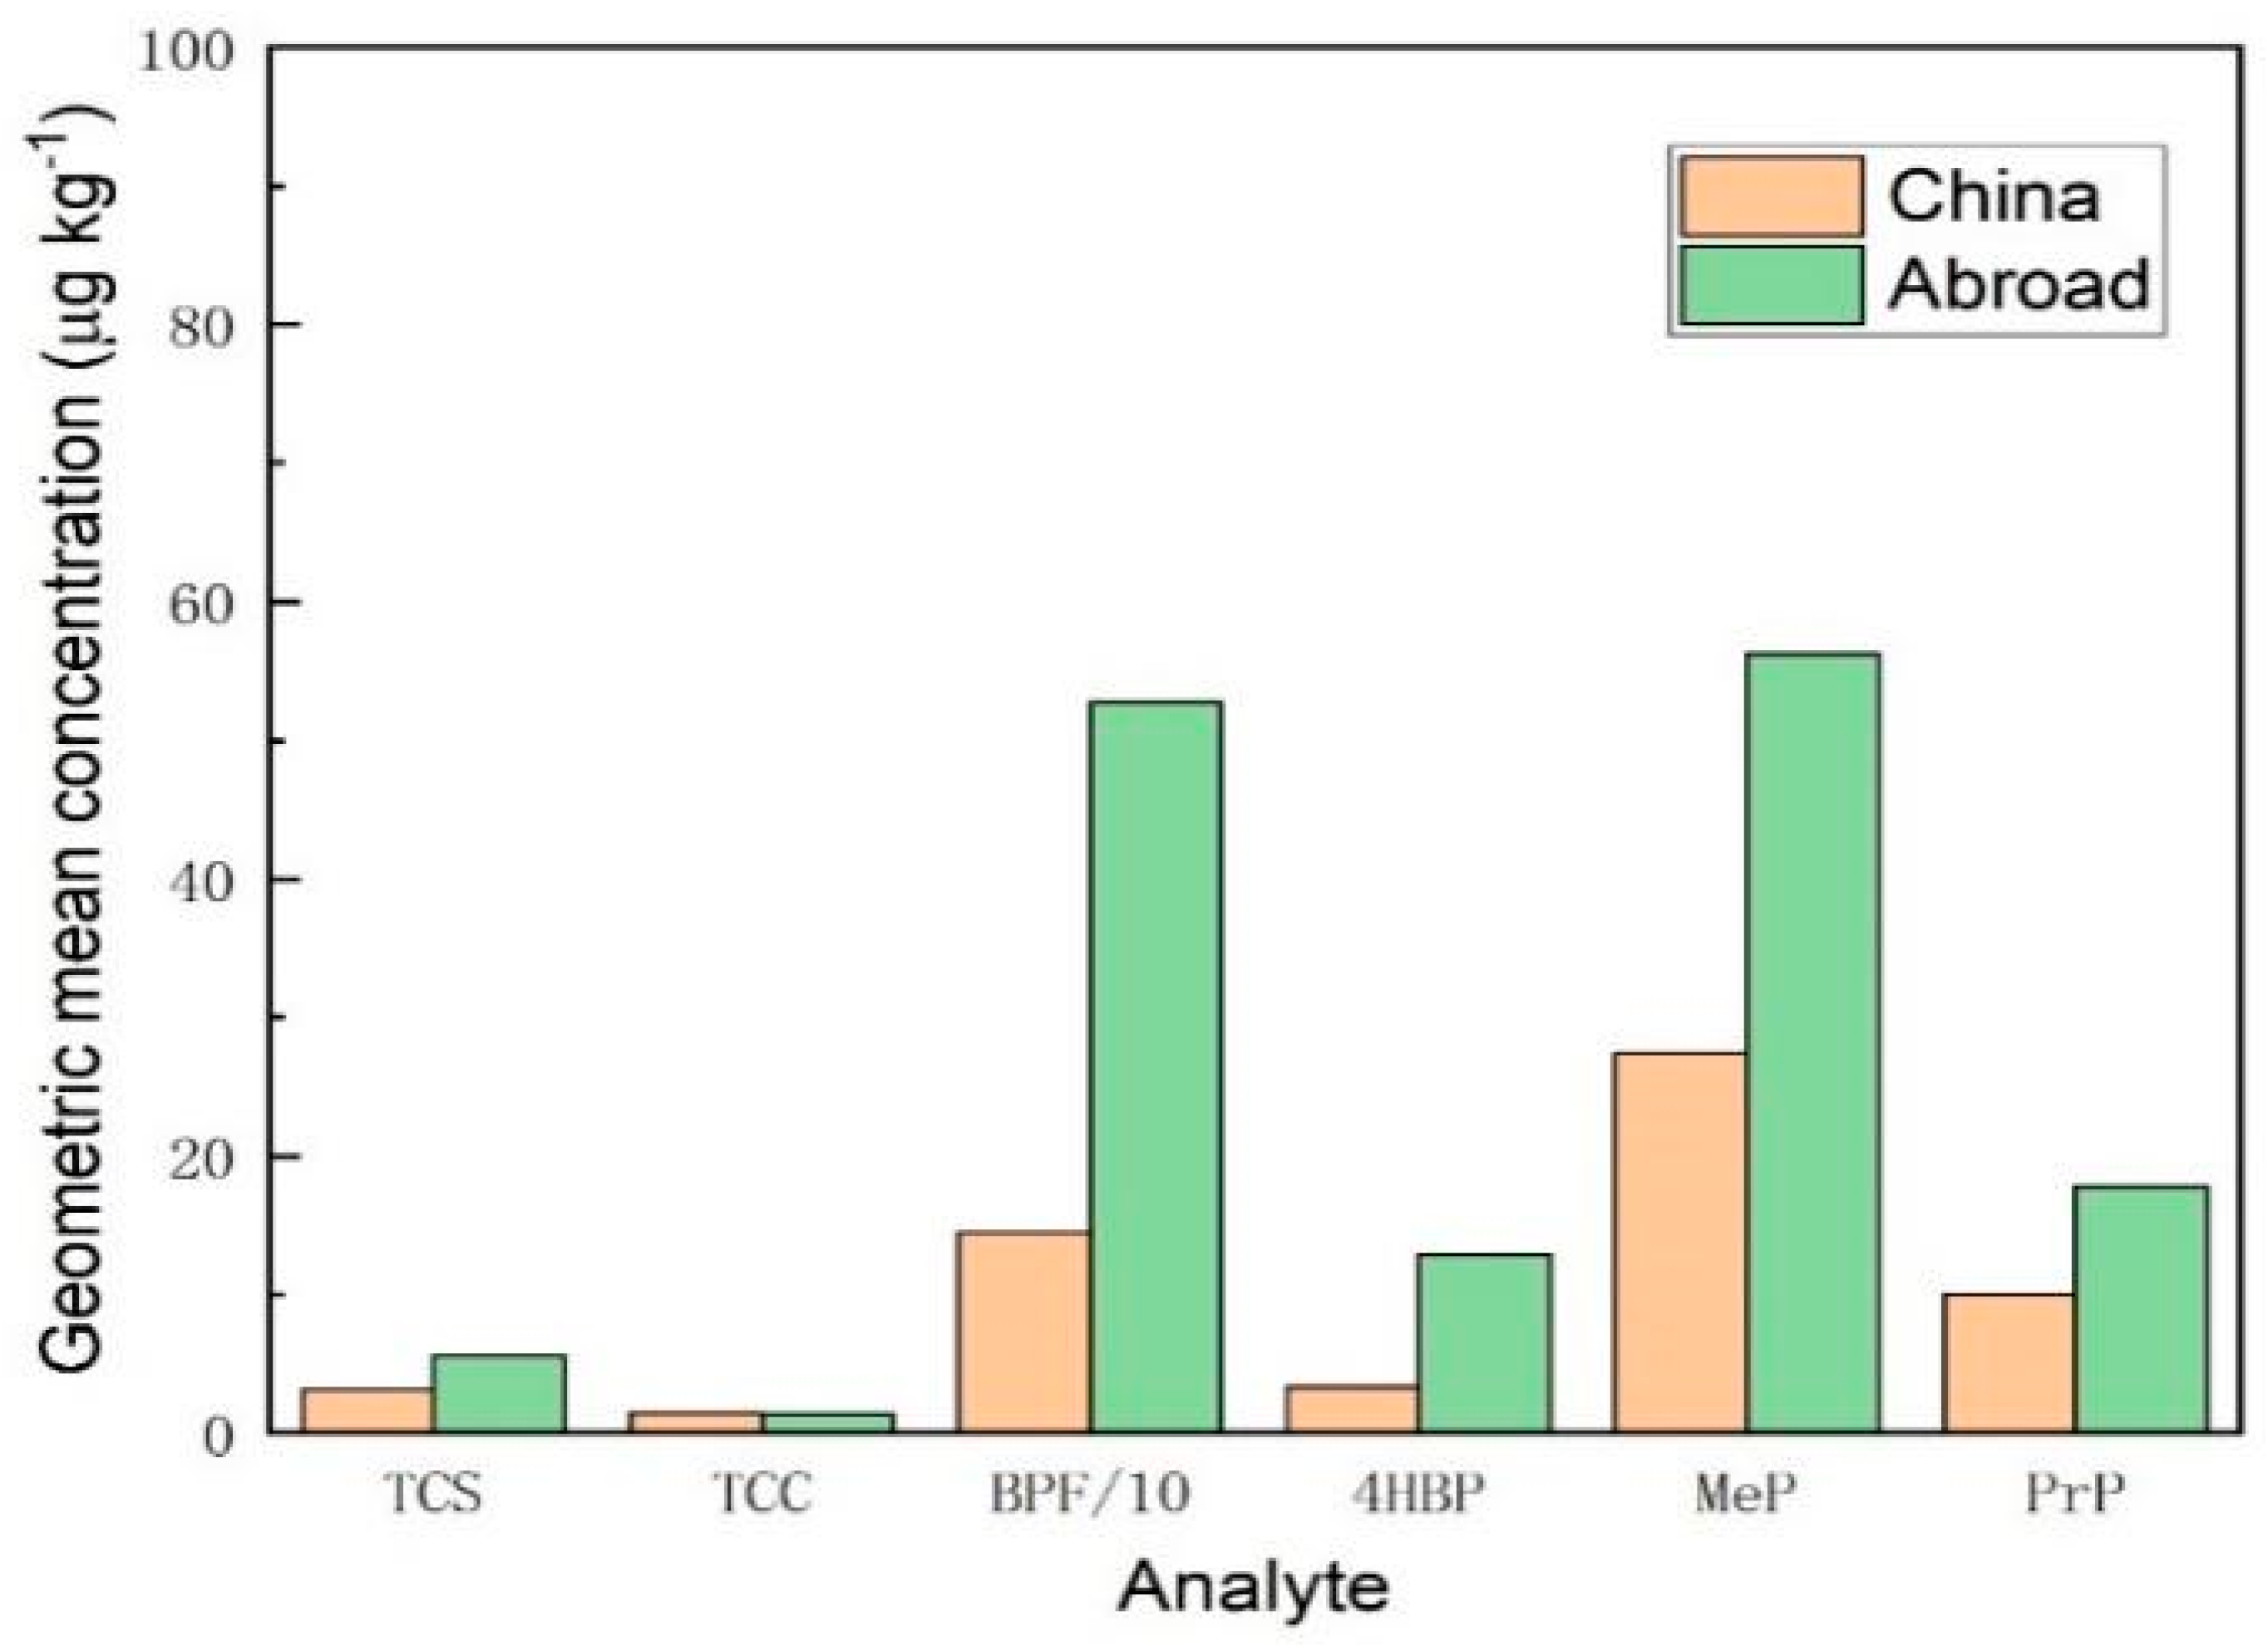
Table 1.
Precision of method for detection of 7 typical EDCs by UALLME-HPLC-DAD.
| Analyte | TCS | TCC | MTCS | BPF | 4HBP | MeP | PrP | |
| Linear range (μg L-1) | 200-1500 | 25-500 | 500-3000 | 200-3000 | 50-1000 | 10-2000 | 50-1000 | |
| Correlation coefficient R2 |
0.9995 |
0.9996 |
0.9991 |
0.9996 |
0.9994 |
0.9999 |
0.9994 |
|
| Limit of detection (μg L-1) |
55 |
8 |
127 |
43 |
15 |
10 |
11 |
|
| Limit of quantification (μg L-1) |
184 |
25 |
422 |
143 |
50 |
36 |
38 |
|
| Standard recovery(%) | Low spiked level |
96.82 |
98.90 |
90.02 |
89.70 |
99.52 |
98.27 |
98.99 |
| Mean spiked level |
100.4 |
98.31 |
97.59 |
95.81 |
95.77 |
94.44 |
100.7 |
|
| High spiked level |
100.2 |
102.2 |
95.98 |
98.48 |
100.0 |
97.54 |
94.11 |
|
| Relative standard deviation(n=9)(%) |
1.7-2.2 |
1.3-2.8 |
1.1-2.7 |
1.4-3.2 |
1.8-3.9 |
1.3-3.4 |
1.2-2.4 |
|
| Inter-day variability(n=6)(%) |
0.8 |
1.5 |
0.6 |
1.1 |
1.1 |
0.9 |
1.6 |
|
| intra-day variability(n=6)(%) |
1.2 |
0.5 |
0.5 |
0.9 |
0.3 |
0.2 |
0.3 |
|
Table 2.
Detection of TCS in honey from different sources.
| Nectar source | Detection rate(%) | Range(μg/kg) | |
|
TCS |
acacia honey | 44.44 | NDa-<LOQb |
| jujube honey | 50 | ND-<LOQ | |
| vitex honey | 0 | ND | |
| linden flower | 50 | ND-144.6 | |
| rape flower honey | 33.33 | ND-121 | |
| citrus honey | 66.67 | ND-<LOQ | |
| loquat honey | 0 | ND | |
| multifloral honey | 15.38 | ND-<LOQ | |
| sunflower honey | 0 | ND | |
| motherwort honey | 0 | ND | |
| wolfberry honey | 50 | ND-<LOQ | |
| milk vetch honey | 0 | ND |
a: No detection; b:Below the LOQ.
Table 3.
Detection of TCC in honey from different sources.
| Nectar source | Detection rate(%) | Range(μg/kg) | |
| TCC | acacia honey | 33.33(3/9) | ND-<LOQ |
| jujube honey | 25(1/4) | ND-<LOQ | |
| vitex honey | 0(0/3) | ND | |
| linden flower | 0(0/4) | ND | |
| rape flower honey | 0(0/3) | ND | |
| citrus honey | 0(0/3) | ND | |
| loquat honey | 0(0/1) | ND | |
| multifloral honey | 15.38(2/13) | ND-<LOQ | |
| sunflower honey | 33.33(1/3) | ND-<LOQ | |
| motherwort honey | 100(1/1) | <LOQ | |
| wolfberry honey | 50(1/2) | ND-<LOQ | |
| milk vetch honey | 0(0/1) | ND |
Table 4.
Detection of BPF in honey from different sources.
| Nectar source | Detection rate(%) | Range(μg/kg) | |
| BPF | acacia honey | 88.89(8/9) | ND-612.5 |
| jujube honey | 100(4/4) | 232.1-642.4 | |
| vitex honey | 100(3/3) | 224.7-415.2 | |
| linden flower | 100(4/4) | <LOQ-593.7 | |
| rape flower honey | 100(3/3) | <LOQ-297.9 | |
| citrus honey | 100(3/3) | 190.7-376.7 | |
| loquat honey | 100(1/1) | 150.8 | |
| multifloral honey | 100(13/13) | <LOQ-1193 | |
| sunflower honey | 100(3/3) | <LOQ-189 | |
| motherwort honey | 100(1/1) | 154.6 | |
| wolfberry honey | 100(2/2) | <LOQ | |
| milk vetch honey | 100(1/1) | 578.2 |
Table 6.
Detection of MeP and PrP in honey from different sources.
| Nectar source | Detection rate(%) | Range(μg/kg) | |
| MeP | acacia honey | 100(9/9) | <LOQ-176.9 |
| jujube honey | 50(2/4) | ND-64.86 | |
| vitex honey | 100(3/3) | <LOQ | |
| linden flower | 75(3/4) | ND-249.7 | |
| rape flower honey | 100(3/3) | <LOQ-149.5 | |
| citrus honey | 100(3/3) | 89.65-299.2 | |
| loquat honey | 100(1/1) | <LOQ | |
| multifloral honey | 69.23(9/13) | ND-320.9 | |
| sunflower honey | 66.67(2/3) | ND-70.02 | |
| motherwort honey | 100(1/1) | 40.52 | |
| wolfberry honey | 100(2/2) | 54.34-72.19 | |
| milk vetch honey | 100(1/1) | 439.5 | |
| PrP | acacia honey | 100(9/9) | <LOQ-109.3 |
| jujube honey | 75(3/4) | ND-<LOQ | |
| vitex honey | 33.33(1/3) | <LOQ | |
| linden flower | 75(3/4) | ND-<LOQ | |
| rape flower honey | 66.67(2/3) | ND-<LOQ | |
| citrus honey | 100(3/3) | <LOQ-56.86 | |
| loquat honey | 100(1/1) | <LOQ | |
| multifloral honey | 69.23(9/13) | ND-136.7 | |
| sunflower honey | 100(3/3) | <LOQ-39.42 | |
| motherwort honey | 100(1/1) | <LOQ | |
| wolfberry honey | 100(2/2) | <LOQ-120.3 | |
| milk vetch honey | 100(1/1) | <LOQ |
Table 7.
Detection of TCS and TCC in honey with different packaging materials.
| Packaging material | Detetion rate(%) | Range(μg/kg) | |
| TCS | PET | 28.57(8/28) | ND-144.6 |
| PP | 33.33(1/3) | ND-<LOQ | |
| laminated polymer/foil pouches | 0(0/5) | ND | |
| glass bottles with plastic lids | 42.86(3/7) | ND-<LOQ | |
| glass bottles with polymer lined metal lids | 33.33(1/3) | ND-<LOQ | |
| all-glass bottle | 100(1/1) | <LOQ | |
| TCC | PET | 17.86(5/28) | ND-<LOQ |
| PP | 33.33(1/3) | ND-<LOQ | |
| laminated polymer/foil pouches | 20(1/5) | ND-<LOQ | |
| glass bottles with plastic lids | 14.28(1/7) | ND-<LOQ | |
| glass bottles with polymer lined metal lids | 33.33(1/3) | ND-<LOQ | |
| all-glass bottle | 0(0/1) | ND |
Table 8.
Detection of BPF in honey with different packaging materials.
| Packaging material | Detetion rate(%) | Range(μg/kg) | |
| BPF | PET | 96.43(27/28) | ND-1193 |
| PP | 100(3/3) | <LOQ-199.3 | |
| laminated polymer/foil pouches | 100(5/5) | <LOQ-580.4 | |
| glass bottles with plastic lids | 100(7/7) | ND-612.5 | |
| glass bottles with polymer lined metal lids | 100(3/3) | <LOQ-479.8 | |
| all-glass bottle | 100(1/1) | 234.5 |
Table 9.
Detection of 4HBP in honey with different packaging materials.
| Packaging material | Detetion rate(%) | Range(μg/kg) | |
| 4HBP | PET | 32.14(9/28) | ND-172.3 |
| PP | 33.33(1/3) | ND-50.62 | |
| laminated polymer/foil pouches | 40(2/5) | ND-294.9 | |
| glass bottles with plastic lids | 57.14(4/7) | ND-72.37 | |
| glass bottles with polymer lined metal lids | 33.33(1/3) | ND-94.43 | |
| all-glass bottle | 0(0/1) | ND |
Table 10.
Detection of MeP and PrP in honey with different packaging materials.
| Packaging material | Detetion rate(%) | Range(μg/kg) | |
| MeP | PET | 82.14(23/28) | ND-439.5 |
| PP | 100(3/3) | 37.2-61.3 | |
| laminated polymer/foil pouches | 80(4/5) | ND-320.9 | |
| glass bottles with plastic lids | 71.43(5/7) | ND-176.9 | |
| glass bottles with polymer lined metal lids | 100(3/3) | 64.86-299.2 | |
| all-glass bottle | 100(1/1) | 179.8 | |
| PrP | PET | 85.71(24/28) | ND-136.7 |
| PP | 66.67(2/3) | ND-<LOQ | |
| laminated polymer/foil pouches | 80(4/5) | ND-45.12 | |
| glass bottles with plastic lids | 71.42(5/7) | ND-109.3 | |
| glass bottles with polymer lined metal lids | 100(3/3) | ND-<LOQ | |
| all-glass bottle | 0(0/1) | ND |
Table 11.
Detection of 6 typical EDCs in honey at home and abroad.
| Place of origin | EDCs | Detetion rate(%) | Range(μg/kg) | Geometric mean concentration(μg/kg) |
| China | TCS | 27.5(11/40) | ND-144.6 | 3.14 |
| TCC | 20.0(8/40) | ND-<LOQ | 1.44 | |
| MTCS | 0(0/40) | ND | ND | |
| BPF | 97.5(39/40) | ND-642.4 | 144.9 | |
| 4HBP | 32.5(13/40) | ND-294.9 | 3.32 | |
| MeP | 82.5(33/40) | ND-439.5 | 27.39 | |
| PrP | 85.0(34/40) | ND-120.3 | 10 | |
| Abroad | TCS | 42.86(3/7) | ND-<LOQ | 5.57 |
| TCC | 14.28(1/7) | ND-<LOQ | 1.34 | |
| MTCS | 0(0/7) | ND | ND | |
| BPF | 100(7/7) | 187.6-1193 | 527.1 | |
| 4HBP | 57.14(4/7) | ND-99.32 | 12.89 | |
| MeP | 85.71(6/7) | ND-320.9 | 56.19 | |
| PrP | 57.14(4/7) | ND-136.7 | 17.80 |
Table 12.
Adults daily intakes and reference measures for TCS, TCC, BPF, 4HBP, MeP, and PrP.
| EDCs | Maximum detectable concentration(μg/kg) |
RfD (ng/kg bw/d) |
EDI (ng/kg bw/d) |
HQ | Reference measurementsa and uncertainty factors |
| TCS | 144.6 | 1.3×10⁴ | 28.92 | 2.2×10⁻³ | HED derived from mature rats: 4.0 × 10⁶ ng/kg bw/day Uncertainty factor for infants: 3 (inter-) × 10 (intraspecies) × 10 (DBUb) |
| TCC | 8 | 1.3×10⁴ | 1.60 | 1.2×10⁻⁴ | HED derived from mature rats: 4.0 × 10⁶ ng/kg bw/day Uncertainty factor for infants: 3 (inter-) × 10 (intraspecies) × 10 (DBUb) |
| BPF | 1193 | 1.1×10⁴ | 238.6 | 2.2×10⁻² | HED derived from mature rats: 3.2 × 10⁶ ng/kg bw/day Uncertainty factor for infants: 3 (inter-) × 10 (intraspecies) × 10 (DBUb) |
| 4HBP | 294.9 | 5.3×10⁴ | 58.98 | 1.1×10⁻³ | HED derived from mature rats: 1.6 × 10⁷ ng/kg bw/day Uncertainty factor for infants: 3 (inter-) × 10 (intraspecies) × 10 (DBUb) |
| MeP | 439.5 | 1.0×10⁷ | 87.90 | 8.79×10⁻⁶ | EDI: 1.0 × 10⁷ ng/kg bw/day for total MeP and EtP |
| PrP | 136.7 | 1.77×10² | 27.34 | 0.15 | HED derived from immature mice: 5.3 × 10⁵ ng/kg bw/day Uncertainty factor for infants: 3 (inter-) × 10 (intraspecies) × 10 (DBUb) × 10 (for adults) |
a: RfD: Reference dose, EDI: Each daily intake, HED: Human equivalent dose; The EDI of the total MeP and EtP was proposed by the European Food Safety Authority (2004)[33]. The HED values of TCS [36], TCC [37], BPF[8], 4HBP[38], and PrP [44], were derived from NOAELs (2.5 × 10⁷, 2.5 × 10⁷, 2×10⁷, 1×10⁸, 6.5 × 10⁶, ng/kg bw/day, respectively) observed in CD-1 mice or Sprague-Dawley rats by multiplying with relative dosimetric adjustment factors (6.2, 6.2, 6.2, 6.2, 12.3, respectively)[35]; b:Database uncertainty accounts for the lack of the multigenerational reproductive studies, the lack of adequate developmental studies, and the lack of adequate repeat-dose studies in at least two mammalian species.
Table 13.
Infants daily intakes and reference measures for TCS, TCC, BPF, 4HBP, MeP, and PrP.
| EDCs | Intake(ng/kg bw/day) | RfD | Reference measurementsa and uncertainty factors | |||||
| 0-1month | 1-4months | 4-6months | 6-12months | 12-24months | 24-36months | |||
| TCS | 290.4 | 186.1 | 166.4 | 140.9 | 111.4 | 93.71 | 1.3×10³ | HED derived from mature rats: 4.0 × 10⁶ ng/kg bw/day Uncertainty factor for infants: 3 (inter-) × 10 (intraspecies) × 10 (DBUb) × 10 (for infants) |
| TCC | 16.06 | 10.30 | 9.2 | 7.80 | 6.16 | 5.18 | 1.3×10³ | HED derived from mature rats: 4.0 × 10⁶ ng/kg bw/day Uncertainty factor for infants: 3 (inter-) × 10 (intraspecies) × 10 (DBU) × 10 (for infants) |
| BPF | 2395.6 | 1535.4 | 1372.8 | 1162.8 | 919.1 | 773.2 | 1.1×10³ | HED derived from mature rats: 3.2 × 10⁶ ng/kg bw/day Uncertainty factor for infants: 3 (inter-) × 10 (intraspecies) × 10 (DBU) × 10 (for infants) |
| 4HBP | 592.2 | 379.5 | 339.4 | 287.4 | 227.2 | 191.1 | 5.3×10³ | HED derived from mature rats: 1.6 × 10⁷ ng/kg bw/day Uncertainty factor for infants: 3 (inter-) × 10 (intraspecies) × 10 (DBU) × 10 (for infants) |
| MeP | 882.5 | 565.6 | 505.8 | 428.4 | 338.6 | 284.8 | 1×10⁶ | EDI: 1.0 × 10⁷ ng/kg bw/day for total MeP and EtP Uncertainty factor for infants:10 |
| PrP | 274.5 | 175.9 | 157.3 | 133.2 | 105.3 | 88.59 | 1.8×10³ | HED derived from immature mice: 5.3 × 10⁵ ng/kg bw/day Uncertainty factor for infants: 3 (inter-) × 10 (intraspecies) × 10 (DBU) |
a: RfD: Reference dose, EDI: Each daily intake, HED: Human equivalent dose; The EDI of the total MeP and EtP was proposed by the European Food Safety Authority (2004)[33]. The HED values of TCS [36], TCC [37], BPF[8], 4HBP[38], and PrP [44], were derived from NOAELs (2.5 × 10⁷, 2.5 × 10⁷, 2×10⁷, 1×10⁸, 6.5 × 10⁶, ng/kg bw/day, respectively) observed in CD-1 mice or Sprague-Dawley rats by multiplying with relative dosimetric adjustment factors (6.2, 6.2, 6.2, 6.2, 12.3, respectively)[35]; b:Database uncertainty accounts for the lack of the multigenerational reproductive studies, the lack of adequate developmental studies, and the lack of adequate repeat-dose studies in at least two mammalian species.
Table 14.
HQ of exposure to 6 typical endocrine disruptors in infants.
| EDCs | HQ | |||||
| 0-1month | 1-4months | 4-6months | 6-12months | 12-24months | 24-36months | |
| TCS | 0.22 | 0.14 | 0.13 | 0.11 | 0.085 | 0.072 |
| TCC | 1.2×10⁻² | 7.9×10⁻³ | 7.1×10⁻³ | 6×10⁻³ | 4.7×10⁻³ | 4.0×10⁻³ |
| BPF | 2.2 | 1.4 | 1.2 | 1.0 | 0.84 | 0.70 |
| 4HBP | 0.11 | 7.2×10⁻² | 6.4×10⁻² | 5.4×10⁻² | 4.3×10⁻² | 3.6×10⁻² |
| MeP | 8.8×10⁻⁴ | 5.6×10⁻⁴ | 5.0×10⁻⁴ | 4.3×10⁻⁴ | 3.4×10⁻⁴ | 2.8×10⁻⁴ |
| PrP | 0.15 | 0.1 | 8.7×10⁻² | 7.4×10⁻² | 5.8×10⁻² | 4.9×10⁻² |
Disclaimer/Publisher’s Note: The statements, opinions and data contained in all publications are solely those of the individual author(s) and contributor(s) and not of MDPI and/or the editor(s). MDPI and/or the editor(s) disclaim responsibility for any injury to people or property resulting from any ideas, methods, instructions or products referred to in the content. |
© 2025 by the authors. Licensee MDPI, Basel, Switzerland. This article is an open access article distributed under the terms and conditions of the Creative Commons Attribution (CC BY) license (http://creativecommons.org/licenses/by/4.0/).
Copyright: This open access article is published under a Creative Commons CC BY 4.0 license, which permit the free download, distribution, and reuse, provided that the author and preprint are cited in any reuse.


