Submitted:
05 March 2025
Posted:
07 March 2025
You are already at the latest version
Abstract
Shear-Thickening or dilatant behavior is difficult to observe because it is frequently confused with mechanical oscillation or with experimental deviation. In appropriated shear rate range this behavior can be identified in samples that behave as a pseudo-plastic or Newtonian fluid in large shear rate range, evidencing what is currently called the shear-thickening – shear-thinning transition, ST–ST transition, even though this transition is less common than the shear-thinning – shear-thickening transition, in which dilatancy occurs at considerably higher shear rates. Chitosan hydrogels have gained significant attention due to their potential applications in various fields, in-cluding biomedical engineering, drug delivery, and tissue regeneration. These hydro-gels due to its peculiar structure often exhibit ST-ST behavior if the shear rate applied is low enough that this transition can be observed. In this work, chitosan hydrogels obtained from chitosan with different molar masses, degrees of acetylation, degree of crosslinking, preparation methods and aging conditions prior to rheological tests at shear rates between 0.03 s-1 and 1.5 s-1, at temperatures of 22°C, 23°C and 37°C were analyzed and the ST-ST transition related to these parameters. It was found that the ST-ST transition is more influenced by pH, molarity and chitosan concentration than by thermal aging.
Keywords:
Chitosan
; hydrogel
; ST-ST transition
; Dilatant behavior
; Rheology
; Biomedical applications
1. Introduction
Shear-thickening, or dilatancy, is a phenomenon characterized by a continuous increase in apparent viscosity with the rate of deformation. Despite its importance, shear-thickening is often challenging to observe due to several factors, including its frequent confusion with mechanical oscillations or experimental deviations [1,2]. This behavior was first hypothesized by Reynolds, with significant developments made later by Hoffmann, who established the foundational theory for understanding shear-thickening. Over time, this theory has been adapted to various polymeric systems, and alternative models have been proposed to explain atypical behaviors specific to each system. Recent advancements have integrated shear-thickening with viscoelasticity, leading to the identification of shear-thinning–shear-thickening (ST-ST) transitions. While considerable attention has been given to the opposite sequence, where shear-thickening emerges in pseudoplastic fluids at high shear rates, relatively few studies [3,4,5,6,7,8] focus on the dilatancy-to-pseudoplasticity sequence. This discrepancy arises from the narrow range in which dilatancy manifests, often overshadowed by pseudoplasticity at higher shear rates [9,10,11,12,13,14,15,16,17]. However, when analyzed within a restricted shear rate range (0.01 s⁻¹ to 2 s⁻¹), the ST-ST transition becomes clearly distinguishable (see Figure 1).
Hydrogels, three-dimensional polymer networks capable of absorbing substantial amounts of water without dissolving, have gained significant attention due to their versatility in various applications, including biomedical engineering, drug delivery, and tissue regeneration. The rheological properties of hydrogels are influenced by factors such as polymer composition, cross-linking density, and solvent nature. In particular, the shear-thickening–shear-thinning (ST-ST) behavior of hydrogels offers valuable applications in fields where controlled shear rates are critical, such as drug delivery, tissue engineering, and ophthalmic materials. Additionally, ST-ST behavior can improve the texture and mouthfeel of food products and enhance the sensory experience of personal care formulations like shampoos and lotions. Understanding the factors that influence ST-ST behavior is critical for designing hydrogels with tailored rheological properties for diverse biomedical, food, and cosmetic applications.
The primary objective of this study was to investigate the shear-thickening–shear-thinning (ST-ST) transition in chitosan hydrogels, a class of biocompatible and biodegradable materials with significant potential for applications in biomedical engineering, drug delivery, and tissue regeneration. Specifically, we aimed to analyze this transition at shear rates below 1 s⁻¹, focusing on the influence of key parameters such as hydrogel pH, the molarity of the pH-modifying solution, chitosan concentration, and accelerated thermal aging conditions. By systematically examining these factors under constant temperature, this work provides a deeper understanding of the rheological behavior of chitosan hydrogels, contributing to the optimization of their properties for advanced biomedical applications.
2. Materials and Methods
2.1. Samples Qx.y and Qx.yP Preparation
2.1.1. Materials
Chitosan (CS) with a molecular weight of 639 kDa and a degree of acetylation of 4% was supplied by Northeastern Biomaterials Evaluation and Development Laboratory - CERTBIO (Campina Grande, Brazil). Acetic acid (CH3COOH) and citric acid (C6H8O7.H2O) were purchased from Química Moderna (Barueri, Brazil). Lactic acid (C3H6O3), sodium hydroxide micropearls (NaOH) were acquired from Neon (Suzano, Brazil) and genipin 98 % and % ethanol were supplied by Sigma Aldrich.
2.1.2. Preparation of Hydrogels
The hydrogels were prepared to obtain compositions with 2.5; 5.0; 7.5; and 10.0% chitosan (w/w), named as Q2.5, Q5.0, Q7.5 and Q10.0, respectively, in a mixture of acids initially formed by 40% acetic acid and 20% lactic acid in distilled water. The compositions were subjected to magnetic stirring for 1 h at 500 rpm. After this period, 4% citric acid was added in a w/w ratio of the acid mixture, maintaining the stirring for another 1h. At the end of the process, the samples were subjected to manual stirring and filtered through a 200 mesh to eliminate possible particulates. The hydrogels were then centrifuged using a Novatecnica NT 835 Benchtop Macro Refrigerated Centrifuge after 48 h of preparation, at 3000 rpm for half an hour, and kept refrigerated.
2.1.3. Preparation of the Crosslinking Solution
The solution was prepared by weighing 1.7 mg of solid genipin and diluting it under magnetic stirring for 30 min in 2 ml of distilled water, then 96% ethanol was added to obtain an 8:2 ethanol/water solution with 0.75 mM solute concentration.
In the hydrogels, the solution was added superficially (by dripping) after their extrusion, with the aim of optimizing the permanence of structure, since it would promote crosslinking in the outermost layer. The crosslinked samples were named Q2.5GP, Q5.0GP, Q7.5GP and Q10.0GP. Table 1 shows the prepared compositions.
2.2. Samples xMy.z Preparation
2.2.1. Materials
High molar mass chitosan (>400 KDa; degree of acetylation (GA) of 3%; Genetic heritage with registration number AEBD12D) and deionized water, supplied by the Northeast Biomaterials Assessment and Development Laboratory – CERTBIO. Acetic acid (CH3COOH) and citric acid (C6H8O7.H2O) were purchased from Química Moderna (Barueri, Brazil). Lactic acid (C3H6O3) and sodium hydroxide micropearls (NaOH) were acquired from Neon (Suzano, Brazil). The FTIR of these samples is shown in Figure 5a e 5b.
2.2.2. Preparation of hydrogels
The synthesis of chitosan hydrogel was conducted using a methodology adapted from [18]. Initially, two acidic solutions were prepared and subsequently combined to dissolve the chitosan. The first solution comprised 40% (v/v) acetic acid, 20% (v/v) lactic acid, and 40% (v/v) deionized water. Concurrently, the second acidic solution was prepared as a 4% (w/v) aqueous solution of citric acid. Following the preparation of these acidic solutions, a final solution was formulated by mixing 3% (v/v) of the citric acid solution with 97% (v/v) of the previously prepared acetic and lactic acid mixture. Chitosan was then dissolved in the resultant acidic solution at a concentration of 5% (w/v), with continuous stirring for 4 hours at room temperature (25°C) until complete homogenization was achieved. The compositions of these hydrogels are shown in Table 2.
Subsequently, aqueous solutions of sodium hydroxide at concentrations of 3M and 10M were produced and dripped onto the resulting hydrogel, under mechanical agitation, until different samples with different pH values were obtained for rheological analysis and properties comparison, as suggested by Richa [19]. Finally, all the samples of the hydrogel were distributed into syringes and, then, centrifuged at 2000 rpm for 15 minutes to remove bubbles.
2.3. Preparation of unexposed (A0) and exposed for 3 months (A3M) hydrogels
2.3.1. Materials
Medium molar mass chitosan (247.65 KDa; degree of acetylation (GA) of 13%; Genetic heritage with registration number AEBD12D) and deionized water, supplied by the Northeast Biomaterials Assessment and Development Laboratory - CERTBIO. Acetic acid (CH3COOH), glycerin (C₃H₈O₃) P.A/ACS and sodium hydroxide (NAOH) in microbeads, supplied by Neon® Suzano, São Paulo - Brazil.
2.3.2. Preparation of hydrogels
The chitosan hydrogel was obtained and its degradation was evaluated in times of 0, and 3 months, under primary packaging storage conditions. The chitosan hydrogel was obtained by dissolving 6 g of chitosan in 150 ml of a 2% (v/v) aqueous acetic acid solution, under mechanical stirring at 400 rpm for 1 hour. After dissolution, 1% of the chitosan mass was added as a plasticizer. Table 3 shows the data for the formulation used.
2.3.3. Thermal Degradation
The thermal degradation stability study followed RDC No. 318/2019, which establishes the criteria for conducting Stability Studies of Active Pharmaceutical Ingredients. To measure accelerated stability, the samples were subjected to pre-established conditions in a chamber (40 ± 2°C and 75% ± 5% relative humidity), in a climatic chamber manufactured by Ethiktechnology.
2.4. Chemical characterization for all Samples
The chemical composition of the chitosan hydrogel and chitosan powder were evaluated. To characterize the chemical composition, Fourier Transform Infrared (FTIR) spectroscopy was employed. The spectra of the samples were recorded over a range of 650 to 4000 cm-1, with 16 scans at resolution of 4 cm-1. These measurements were conducted using the Spectrum 400 FT Mid-IR spectrometer by Perkin Elmer. The data are shown in Figure 2, Figure 3 and Figure 4.
2.5 Rheological Analysis for all Samples
The samples of hydrogel were rheologically characterized using a HAAKE™ MARS™ rheometer (Thermo Fisher Scientific), equipped with a PP35TiL rotor with plate-plate geometry and a gap of 0.5mm, in a shear rate range between 0.01s-1 up to 3s-1, at 22°C, 23°C or 37°C, depending on the application that the hydrogel would have.
3. Results
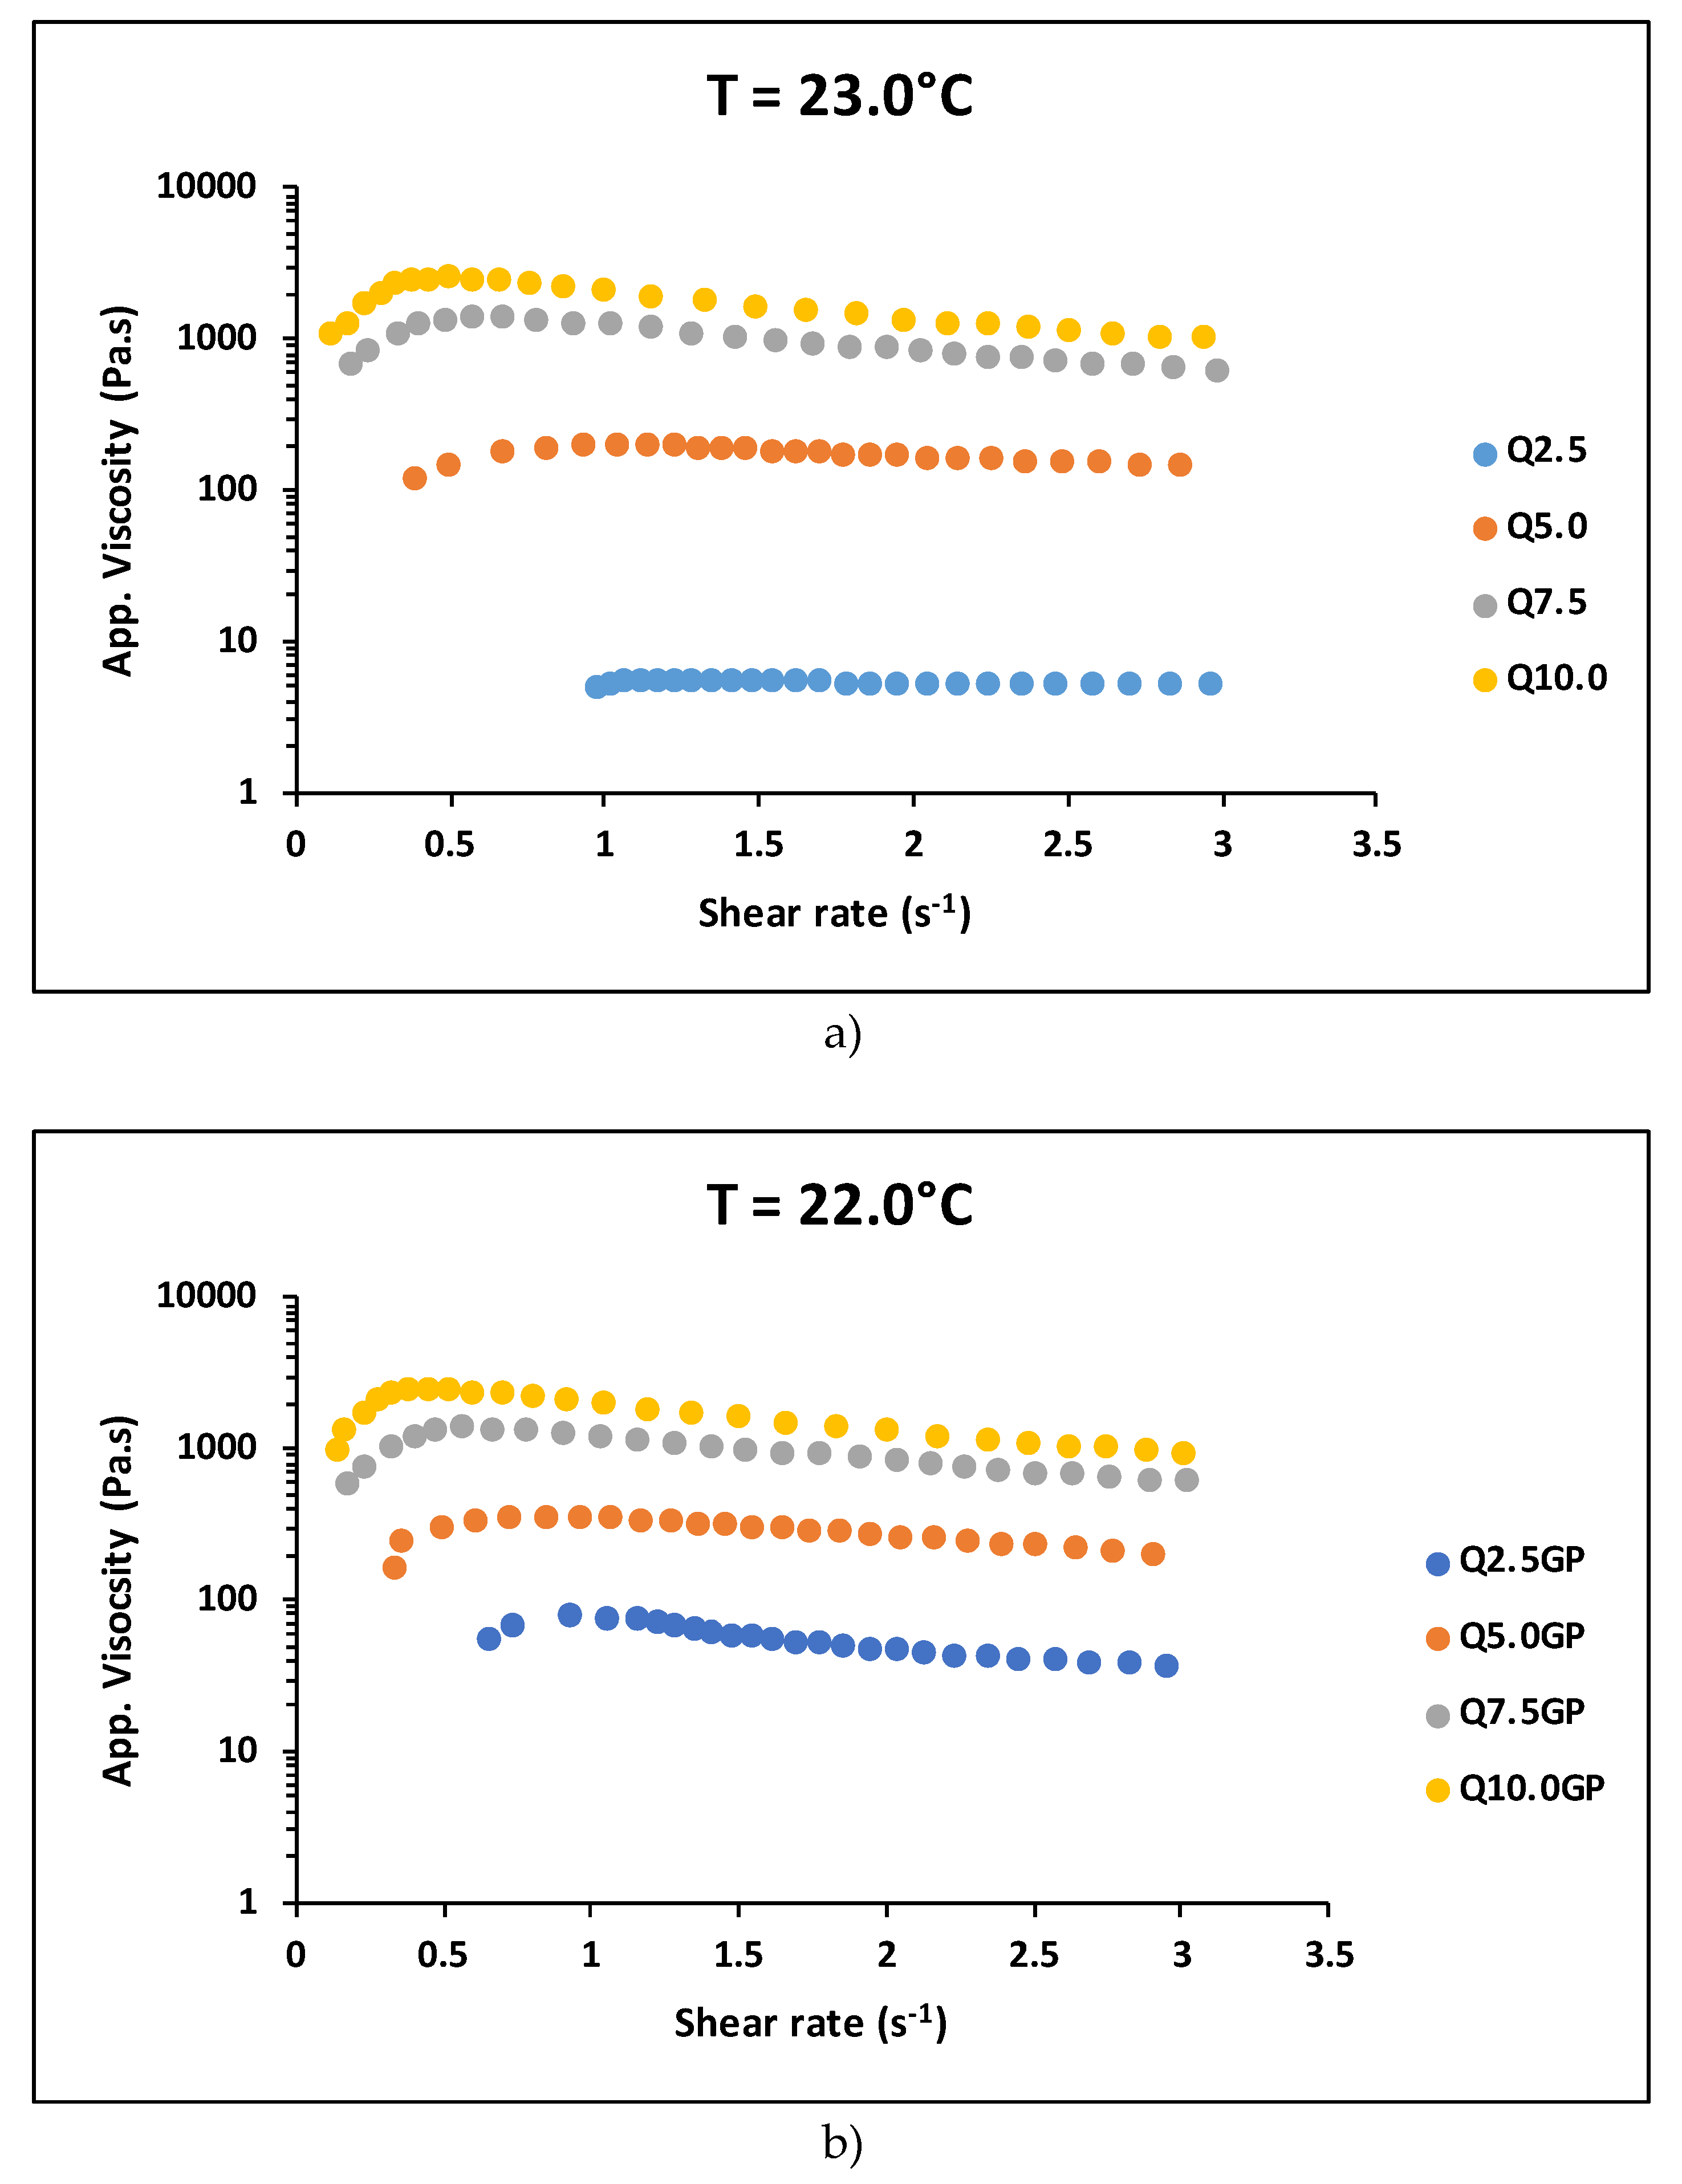
When analyzing Figure 5a and b, a reduction in the critical shear rate for the ST-ST transition of around 40% is observed for the samples crosslinked with genipin with 2.5% and 5.0% chitosan in relation to the non-crosslinked samples with the same concentration. From 5.0% chitosan onwards, there is practically no difference in the shear rate at which the change from dilatant to pseudoplastic behavior occurs, . In other words, as the chitosan concentration increases, the effect of crosslinking becomes negligible in the ST-ST transition. The use of chemical cross-linking agents, such as glutaraldehyde or genipin, can significantly influence the rheological properties of chitosan hydrogels. A higher degree of cross-linking can lead to a more rigid structure, which may exhibit shear-thickening at lower shear rates. Since the genipin concentration was the same for all samples, the relationship between the degree of crosslinking and the chitosan mass decreased with increasing chitosan concentration in the hydrogel. Thus, the critical shear rate was expected to undergo little modification at higher chitosan contents when comparing data from non-crosslinked and crosslinked samples.
Figure 5.
ST-ST transition for chitosan hydrogel with 400KDa molar mass and 80% deacetylation degree for a) non-crosslinked and b) crosslinked samples.
Figure 5.
ST-ST transition for chitosan hydrogel with 400KDa molar mass and 80% deacetylation degree for a) non-crosslinked and b) crosslinked samples.
Here, the concept of pHred, a quantity that relates the pH to the concentration of chitosan in the hydrogel, was used as a way to analyze the effects of these two variables on the rheological behavior of the hydrogel. pHred is obtained by the ratio of the hydrogel's pH to the chitosan concentration (%w/v). Increasing molarity brings the apparent viscosity versus shear rate curves closer together, makes the sol-sol transition (ST-ST) in chitosan hydrogels with similar pHred values for 3M and 10M more evident, and significantly reduces the critical shear rate value (see Figure 6a,b). The higher the molarity, the higher the zero-shear apparent viscosity. A higher zero-shear apparent viscosity can delay the onset of the ST-ST transition. This occurs because the fluid needs to overcome a higher initial resistance to flow, requiring greater shear stress, even at lower critical shear rates, before initiating shear-thinning behavior.
The influence of thermal aging of chitosan hydrogels on their rheological properties
is being analyzed in an ongoing work from which some results have already been processed. In Figure 7, it can be seen that aging for 3 months inside the primary packaging at 40°C and 70% humidity caused a decrease of around 10 decades in the viscosity of the hydrogel. This decrease in viscosity, however, did not provide an ST-ST transition at very different critical shear rates (0.21s-1 for A0; 0.19s-1 for A3M), as observed in the increase in viscosity due to molarity, shown in Figure 3a e b. In the case of thermal aging, the unexposed sample with higher viscosity required a higher shear stress (0.0815 Pa for A0; 3.6922 Pa for A3M) and not a higher shear rate. This is probably related to the difference between the indices n estimated for the two samples in the dilatant region. Contrary to what was observed for the pseudoplastic regions, no sample presented a dilatant region adjusted by the power law. Thus, we will refer to the degree of departure from Newtonian behavior only as index nD, for dilatant region and nP, for pseudoplastic one. nD was estimated by Equation 1:
Where: is the initial shear-viscosity and is the shear rate correspondent to this initial shear-rate viscosity at dilatant region.
While the A0 sample has nD = 1.07, the A3M sample has nD = 1.22, being, therefore, more dilatant than the unexposed sample. For the same initial apparent viscosity, a more dilatant fluid will present a greater increase in apparent viscosity in the same shear rate range, for shear rate higher than 1.0, presenting a greater resistance to flow than the less dilatant fluid. Thus, the balance between initial apparent viscosity and the power law index can justify the fact that both samples present the same critical shear rate for the ST-ST transition.
Regardless of molarity, the ST-ST transition has a sharper peak the lower the nP value, regardless of the nD value. For the same pH, nD increases and nP decreases with increasing chitosan concentration in non-crosslinked hydrogels. For crosslinked gels, it was observed that above 2.5% chitosan, the nD and nP values fluctuate little in relation to the average, remaining within the average ± the standard deviation. These nD and nP behaviors need to be observed in other systems that present the shear-thickening - shear-thinning transition so that more informed conclusions can be drawn.
4. Conclusions
From the results presented in this work, it can be concluded that the complex rheological behavior of chitosan hydrogels, particularly the shear-thickening (dilatant) to shear-thinning (ST-ST) transition, which is challenging to observe due to its frequent confusion with mechanical oscillations or experimental deviations. This transition is more evident in specific shear rate ranges and is less common than the reverse (shear-thinning to shear-thickening). Chitosan hydrogels, known for their applications in biomedical engineering, drug delivery, and tissue regeneration, exhibit ST-ST behavior under low shear rates, making them suitable for controlled applications. The ST-ST transition is primarily influenced by factors such as pH, molarity, and chitosan concentration, rather than thermal aging, with crosslinking agents like genipin enhancing rigidity and promoting shear-thickening at lower shear rates. As chitosan concentration increases, the effect of crosslinking on the transition becomes negligible, while higher molarity of the pH-modifying solution makes the ST-ST transition more visible, decreases the critical shear rate, and increases zero-shear viscosity, delaying the transition onset. Thermal aging affects viscosity but does not significantly alter the critical shear rate, requiring higher shear stress instead. The rheological behavior, characterized by indices such as nD (dilatant region) and nP (pseudoplastic region), helps understand the departure from Newtonian behavior and flow resistance. Overall, understanding ST-ST behavior enables the design of tailored hydrogels for applications in drug delivery, tissue engineering, food texture improvement, and personal care products, emphasizing the importance of controlling specific parameters to achieve desired material properties.
Author Contributions
For research articles with several authors, a short paragraph specifying their individual contributions must be provided. The following statements should be used “Conceptualization, R.N. and S.M.L.S.; methodology, R.N., M.A.S., J.V.S.A.Q.; software, R.N.; validation, R.N., S.M.L.S. and M.V.L.F.; formal analysis, R.N., H.N.S., J.E.S.; investigation, R.N.; resources, R.N.; data curation, R.N.; writing—original draft preparation, R.N.; writing—review and editing, R.N., S.M.L.S.; visualization, R.N.; supervision, R.N.; project administration, R.N.; funding acquisition, S.M.L.S., M.V.L.F. All authors have read and agreed to the published version of the manuscript
Funding
This research received no external funding.
Institutional Review Board Statement
Not applicable
Data Availability Statement
Data are available at certbio.ufcg.edu.br
Acknowledgments
The authors express their gratitude to the National Council for Scientific and Technological Development (CNPq—Brazil) and the Coordination for the Improvement of Higher Education Personnel (CAPES—Brazil) for their financial support. We also extend our thanks to the Federal University of Campina Grande (UFCG, PB, Brazil) and the Northeast Biomaterials Evaluation and Development Laboratory (CERTBIO) for their invaluable support in the execution of this work. The authors are grateful to the Federal University of Campina Grande—UFCG (PB, Brazil) and Northeast Biomaterials Evaluation and Development Laboratory—CERTBIO for supporting the execution of this work, and to researchers Sofia Jansen de Medeiros Alves, Matheus Araújo Santos, João Emídio da Silva Neto, Henrique Nunes da Silva
The following abbreviations are used in this manuscript:
| MDPI | Multidisciplinary Digital Publishing Institute |
| DOAJ | Directory of open access journals |
| TLA | Three letter acronym |
| LD | Linear dichroism |
Conflicts of Interest
The authors declare no conflicts of interest
References
- Navarro, R.F. Application of Non-Linear Rheological Model to Shear-Thickening Polymeric Systems. Polímeros: Ciência e Tecnologia 2002, 12, 41–47. [Google Scholar]
- Navarro, R.F. Mecânica dos Biomateriais; Novas Edições Acadêmicas: Beau-Bissau, 2018. [Google Scholar]
- J.-F. Berret, R.G.-C., S. Lerouge, J.-P. Decruppe. Shear-thickening transition in surfactant solutions: New experimental features from rheology and flow birefringence. European Physical Journal E: Soft matter and biological physics 2000, 2, 343–350.
- Jetin, E. Thomas, A.G., Deshpreet Singh Bedi, Abhinendra Singh, Emanuela Del Gado, Bulbul Chakraborty. Investigating the nature of discontinuous shear thickening: Beyond a mean-field description. J. Rheol. 2020, 64, J Rheol. [Google Scholar]
- Lee, J.; Jiang, Z.; Wang, J.; Sandy, A.R.; Narayanan, S.; Lin, X.-M. Unraveling the Role of Order-to-Disorder Transition in Shear Thickening Suspensions. Physical Review Letters 2018, 180. [Google Scholar]
- Meera Ramaswamy, I.G. , Danilo B. Liarte, Abhishek Shetty, Eleni Katifori, Emanuela Del Gado, James P. Sethna, Bulbul Chakraborty, Itai Cohen. Universal scaling of shear thickening transitions. J. Rheol. 2023, 17, 1189–1119. [Google Scholar]
- Hisao Hayakawa, S.T. Kinetic theory of discontinuous shear thickening. Epj Web of Conferences, Powders and Grains 2017 – 8th International Conference on Micromechanics on Granular Media. 2017, 140, 9003. [Google Scholar]
- Mari, R.a.S. , Ryohei. Force transmission and the order parameter of shear thickening. Soft Matter 2015, 15, 6650–6659. [Google Scholar]
- Zheng, W. , Shi, Y. & Xu, N. Signatures of shear thinning-thickening transition in steady shear flows of dense non-Brownian yield stress systems. Sci. China Chem. 2015, 58, 1013–1020. [Google Scholar]
- David, J. , Filip, P.A., Kharlamov, A. A. Empirical Modelling of Nonmonotonous Behaviour of Shear Viscosity. Advances in Materials Science and Engineering 2013, 658187. [Google Scholar]
- DM., H. Shear thinning and thickening of the Lennard-Jones liquid: a molecular dynamics stud. J Chem Soc, Faraday Trans 2 1986, 82, 1365–1383. [CrossRef]
- Guvendiren, M. , Lu, Hoang D. and Burdick, Jason A. Shear-thinning hydrogels for biomedical applications. Soft Matter 2012, 8, 260–272. [Google Scholar]
- Yan C, A.A. , Yucel T, Nagarkar RP, Schneider JP, Pochan DJ. Injectable solid hydrogel: mechanism of shear-thinning and immediate recovery of injectable β-hairpin peptide hydrogels. Soft Matter. 2012, 6, 5143–5156. [Google Scholar]
- Chen, M.H. , Wang, Leo L., Chung, Jennifer J., Kim, Young-Hun, Atluri, Pavan and Burdick, Jason A. Methods To Assess Shear-Thinning Hydrogels for Application As Injectable Biomaterials. ACS Biomaterials Science & Engineering 2017, 3, 2017. [Google Scholar]
- Dmitrii Roshchin, I.K. , Taotao Fu, Stanislav Patlazhan. Effect of flow bifurcation transitions of shear-thinning fluids on hydrodynamic resistance of channels with sudden contraction and expansion. Chemical Engineering Science 2023, 281, 119169. [Google Scholar]
- Gong, S.C.a.Q.H.a.H.P.a.K.C.a.W.J.a.X. Stress relaxation in the transition from shear thinning to shear jamming in shear thickening fluid. Smart Materials and Structures 2018, 27, 85013. [Google Scholar]
- Lacassagne T, C.N. , Balabani S. Shear-thinning mediation of elasto-inertial Taylor–Couette flow. Journal of Fluid Mechanics 2021, A91, 915. [Google Scholar]
- Qinghua Wu, M.M. , Sophie Lerouge, Daniel Therriault and Marie-Claude Heuzey. 3D Printing of Microstructured and Stretchable Chitosan. Adv. Biosys. 2017, 1700058–1700064. [Google Scholar]
- Richa, A.R.C. pH mediated rheological modulation of chitosan hydrogels. International Journal of Biological Macromolecules 2020, 156, 591–597. [Google Scholar] [PubMed]
Figure 1.
Apparent viscosity versus shear rate curves for a chitosan hydrogel, presented within two distinct shear rate ranges.
Figure 1.
Apparent viscosity versus shear rate curves for a chitosan hydrogel, presented within two distinct shear rate ranges.
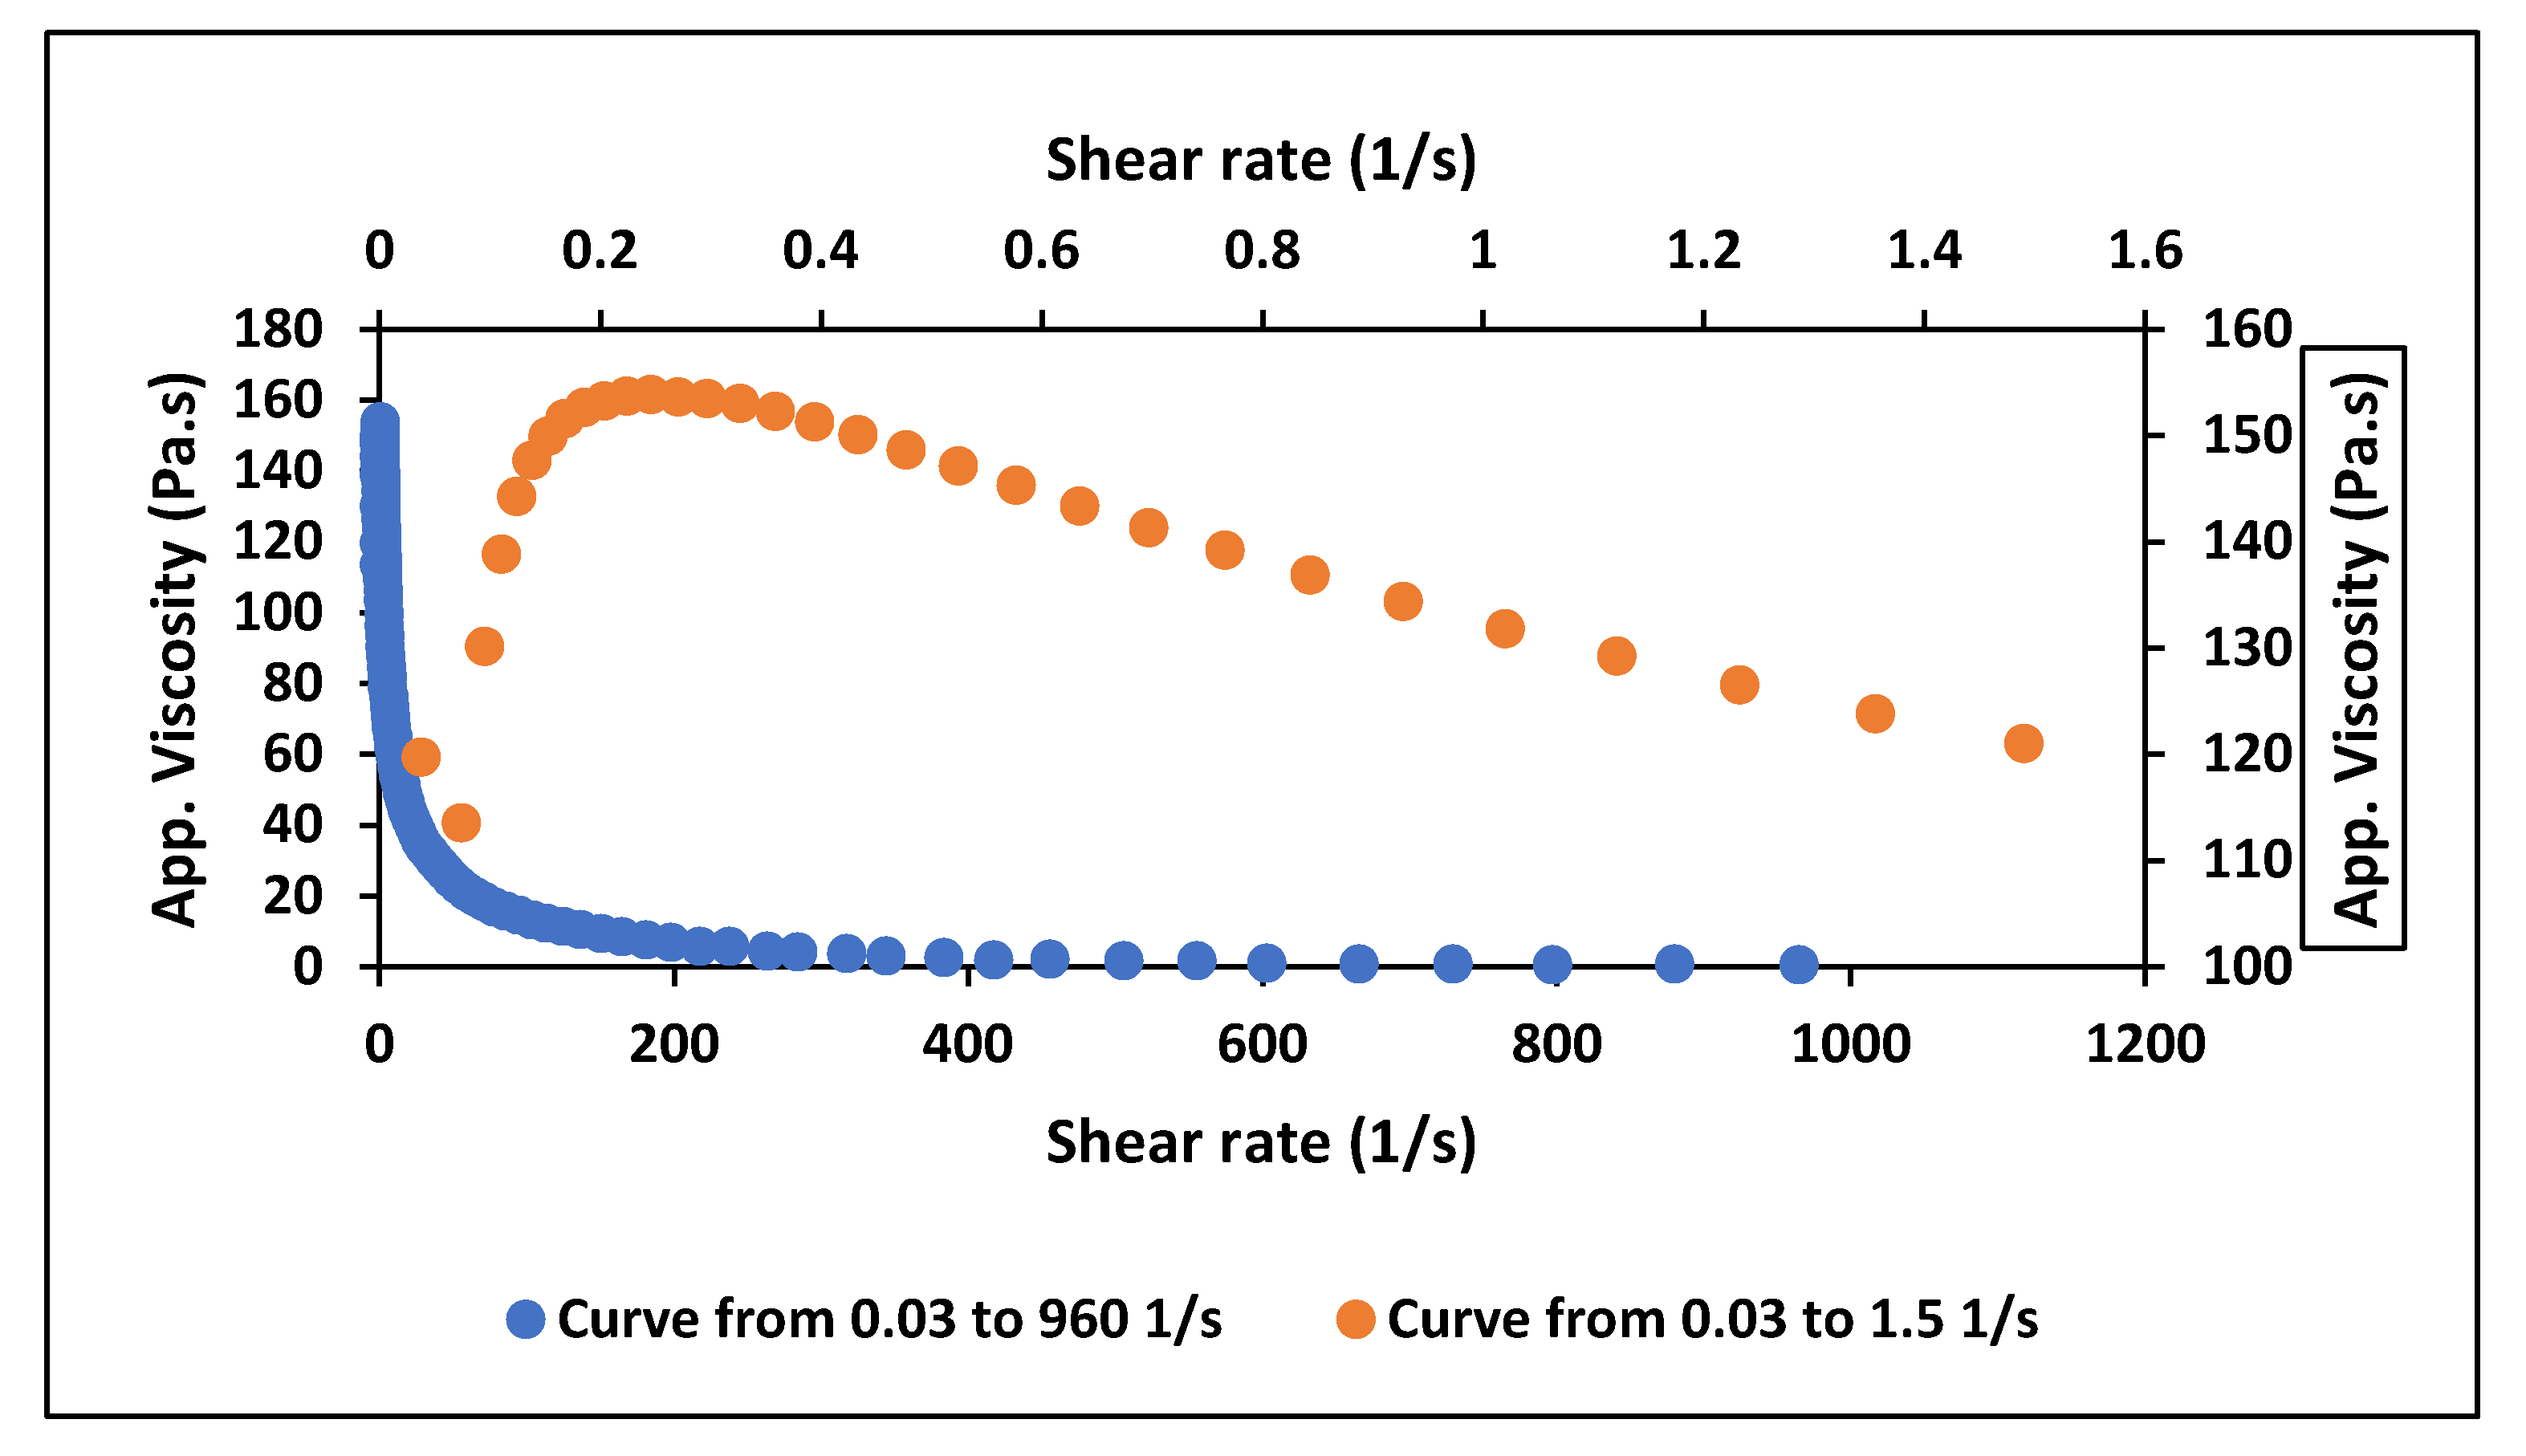
Figure 2.
Chemical composition by FTIR of a) 3Mx.y and b) 10Mx.yz samples.
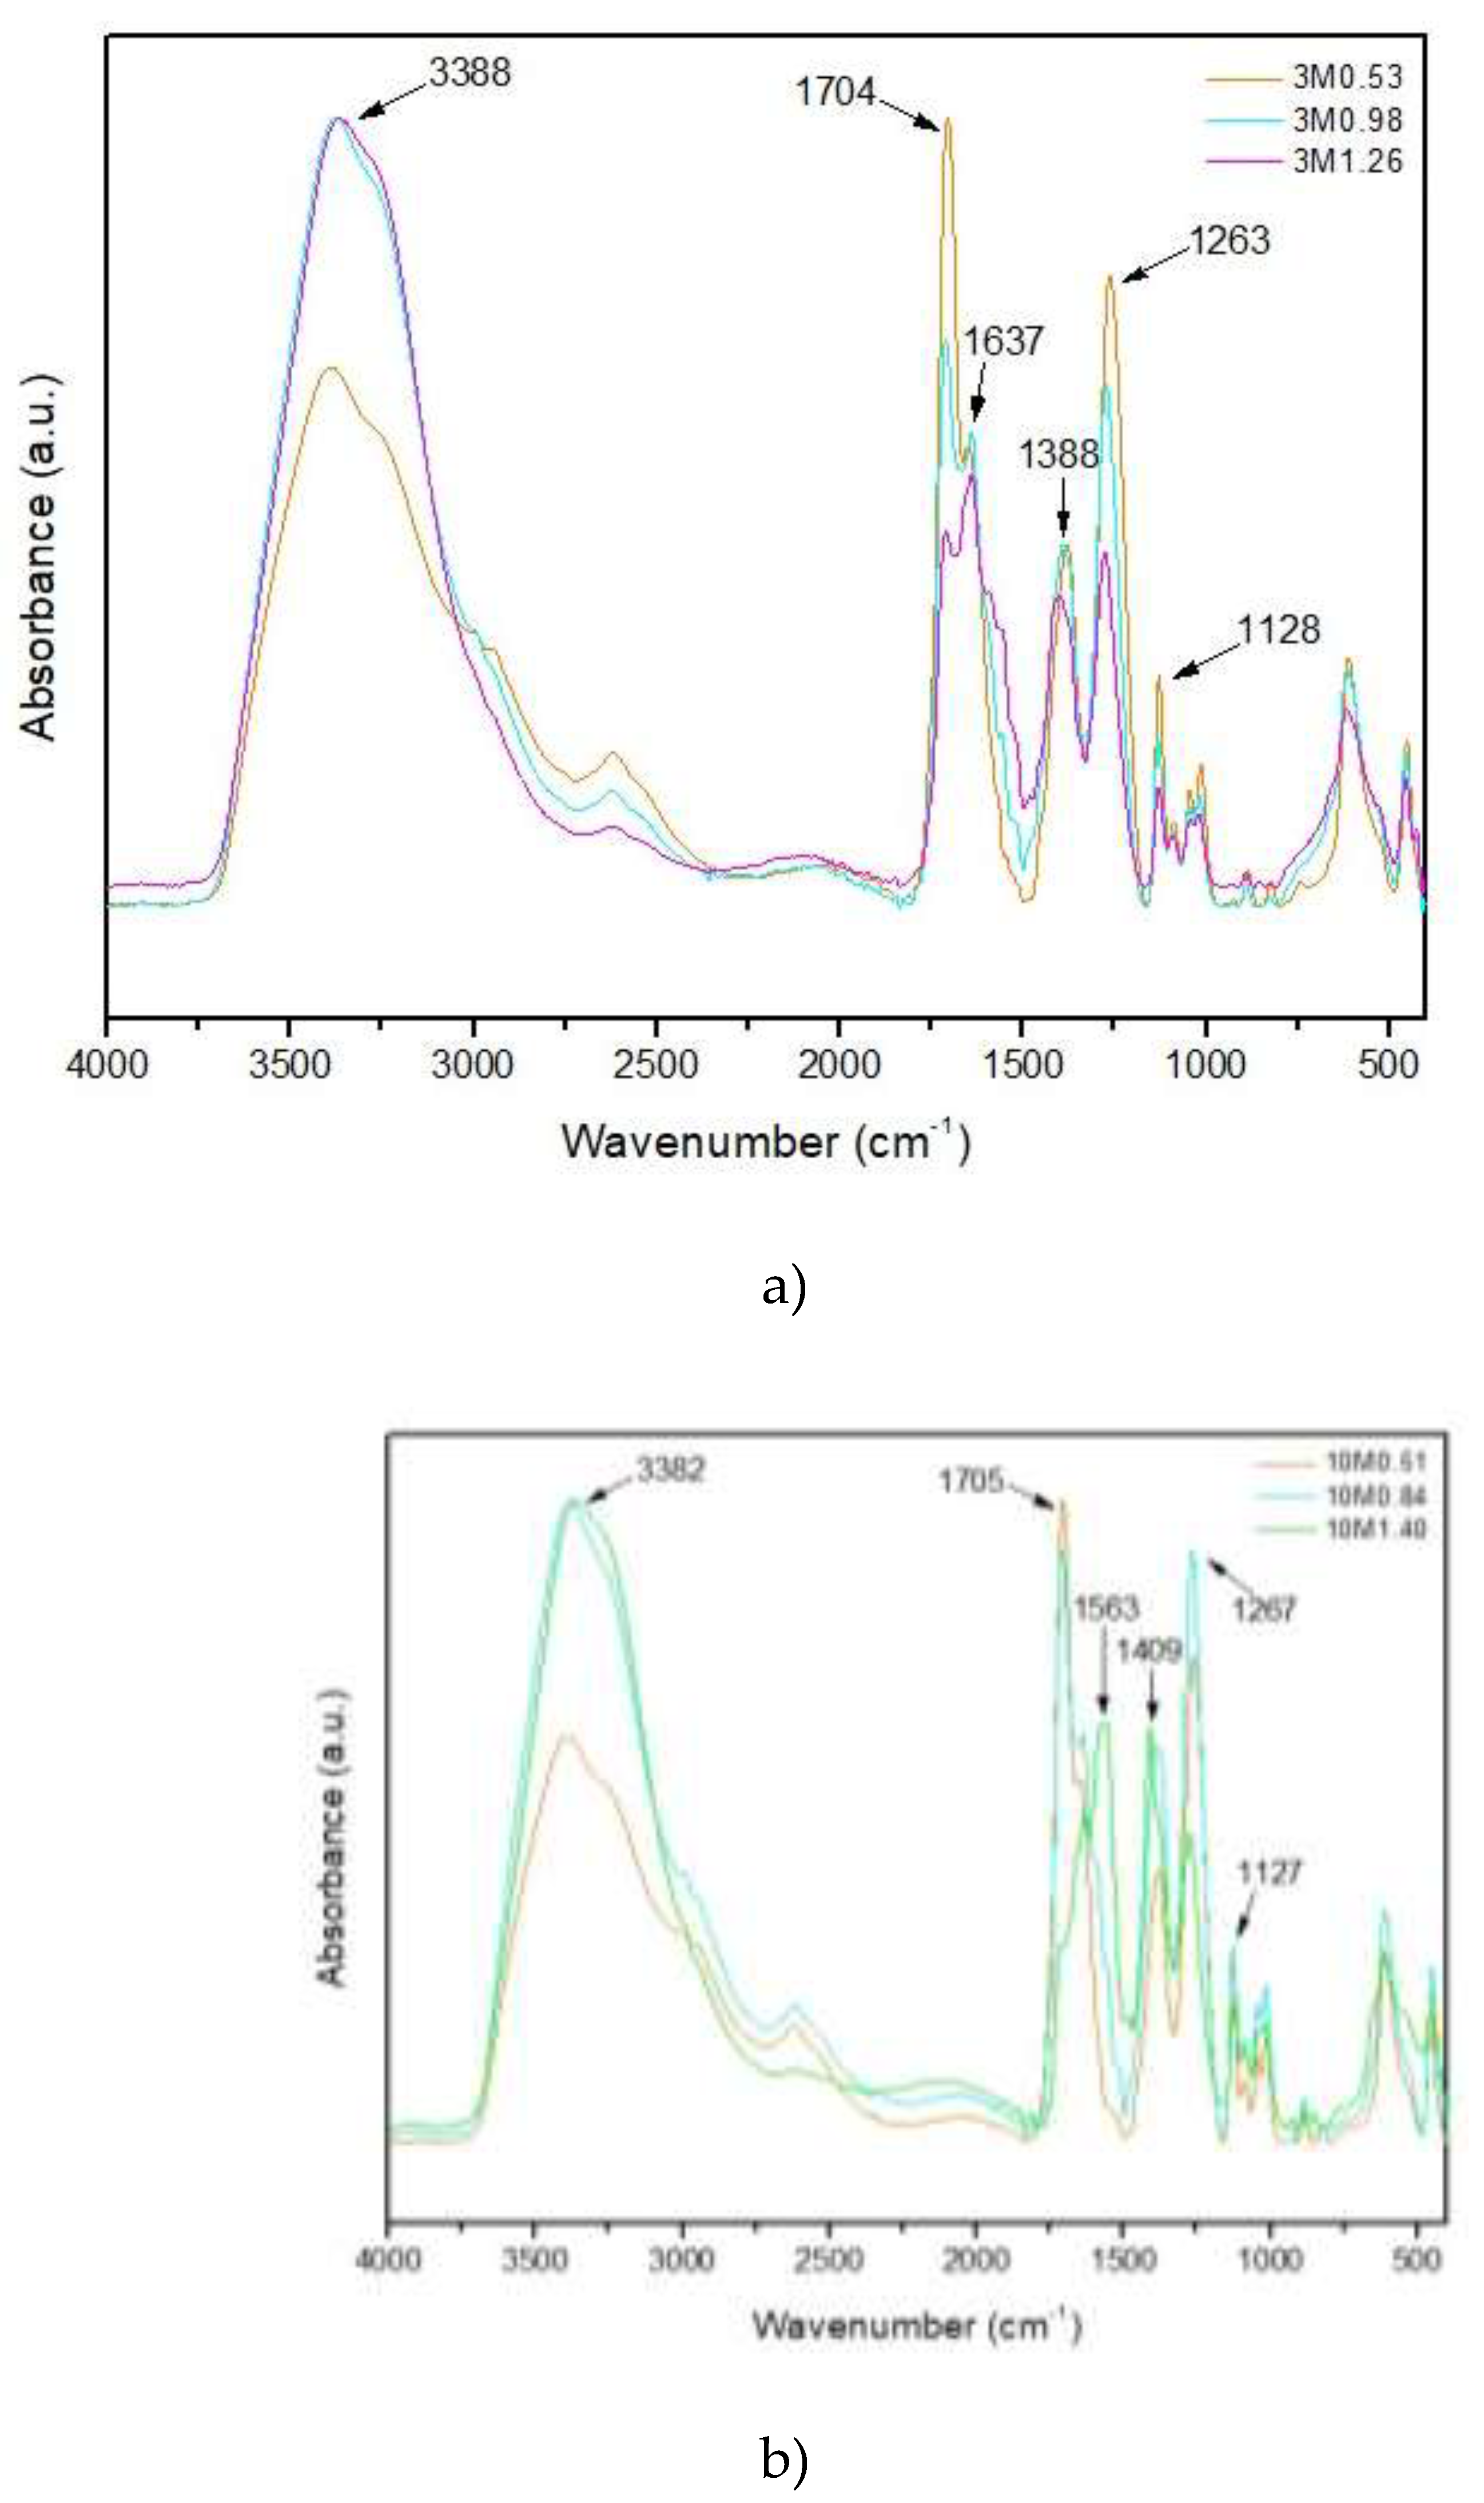
Figure 3.
Chemical composition by FTIR of a) Q2.5 and Q2.5P, b) Q5.0 and Q5.0P, c) Q7.5 and Q7.5P and d) Q10.0 and Q10.0P samples.
Figure 3.
Chemical composition by FTIR of a) Q2.5 and Q2.5P, b) Q5.0 and Q5.0P, c) Q7.5 and Q7.5P and d) Q10.0 and Q10.0P samples.
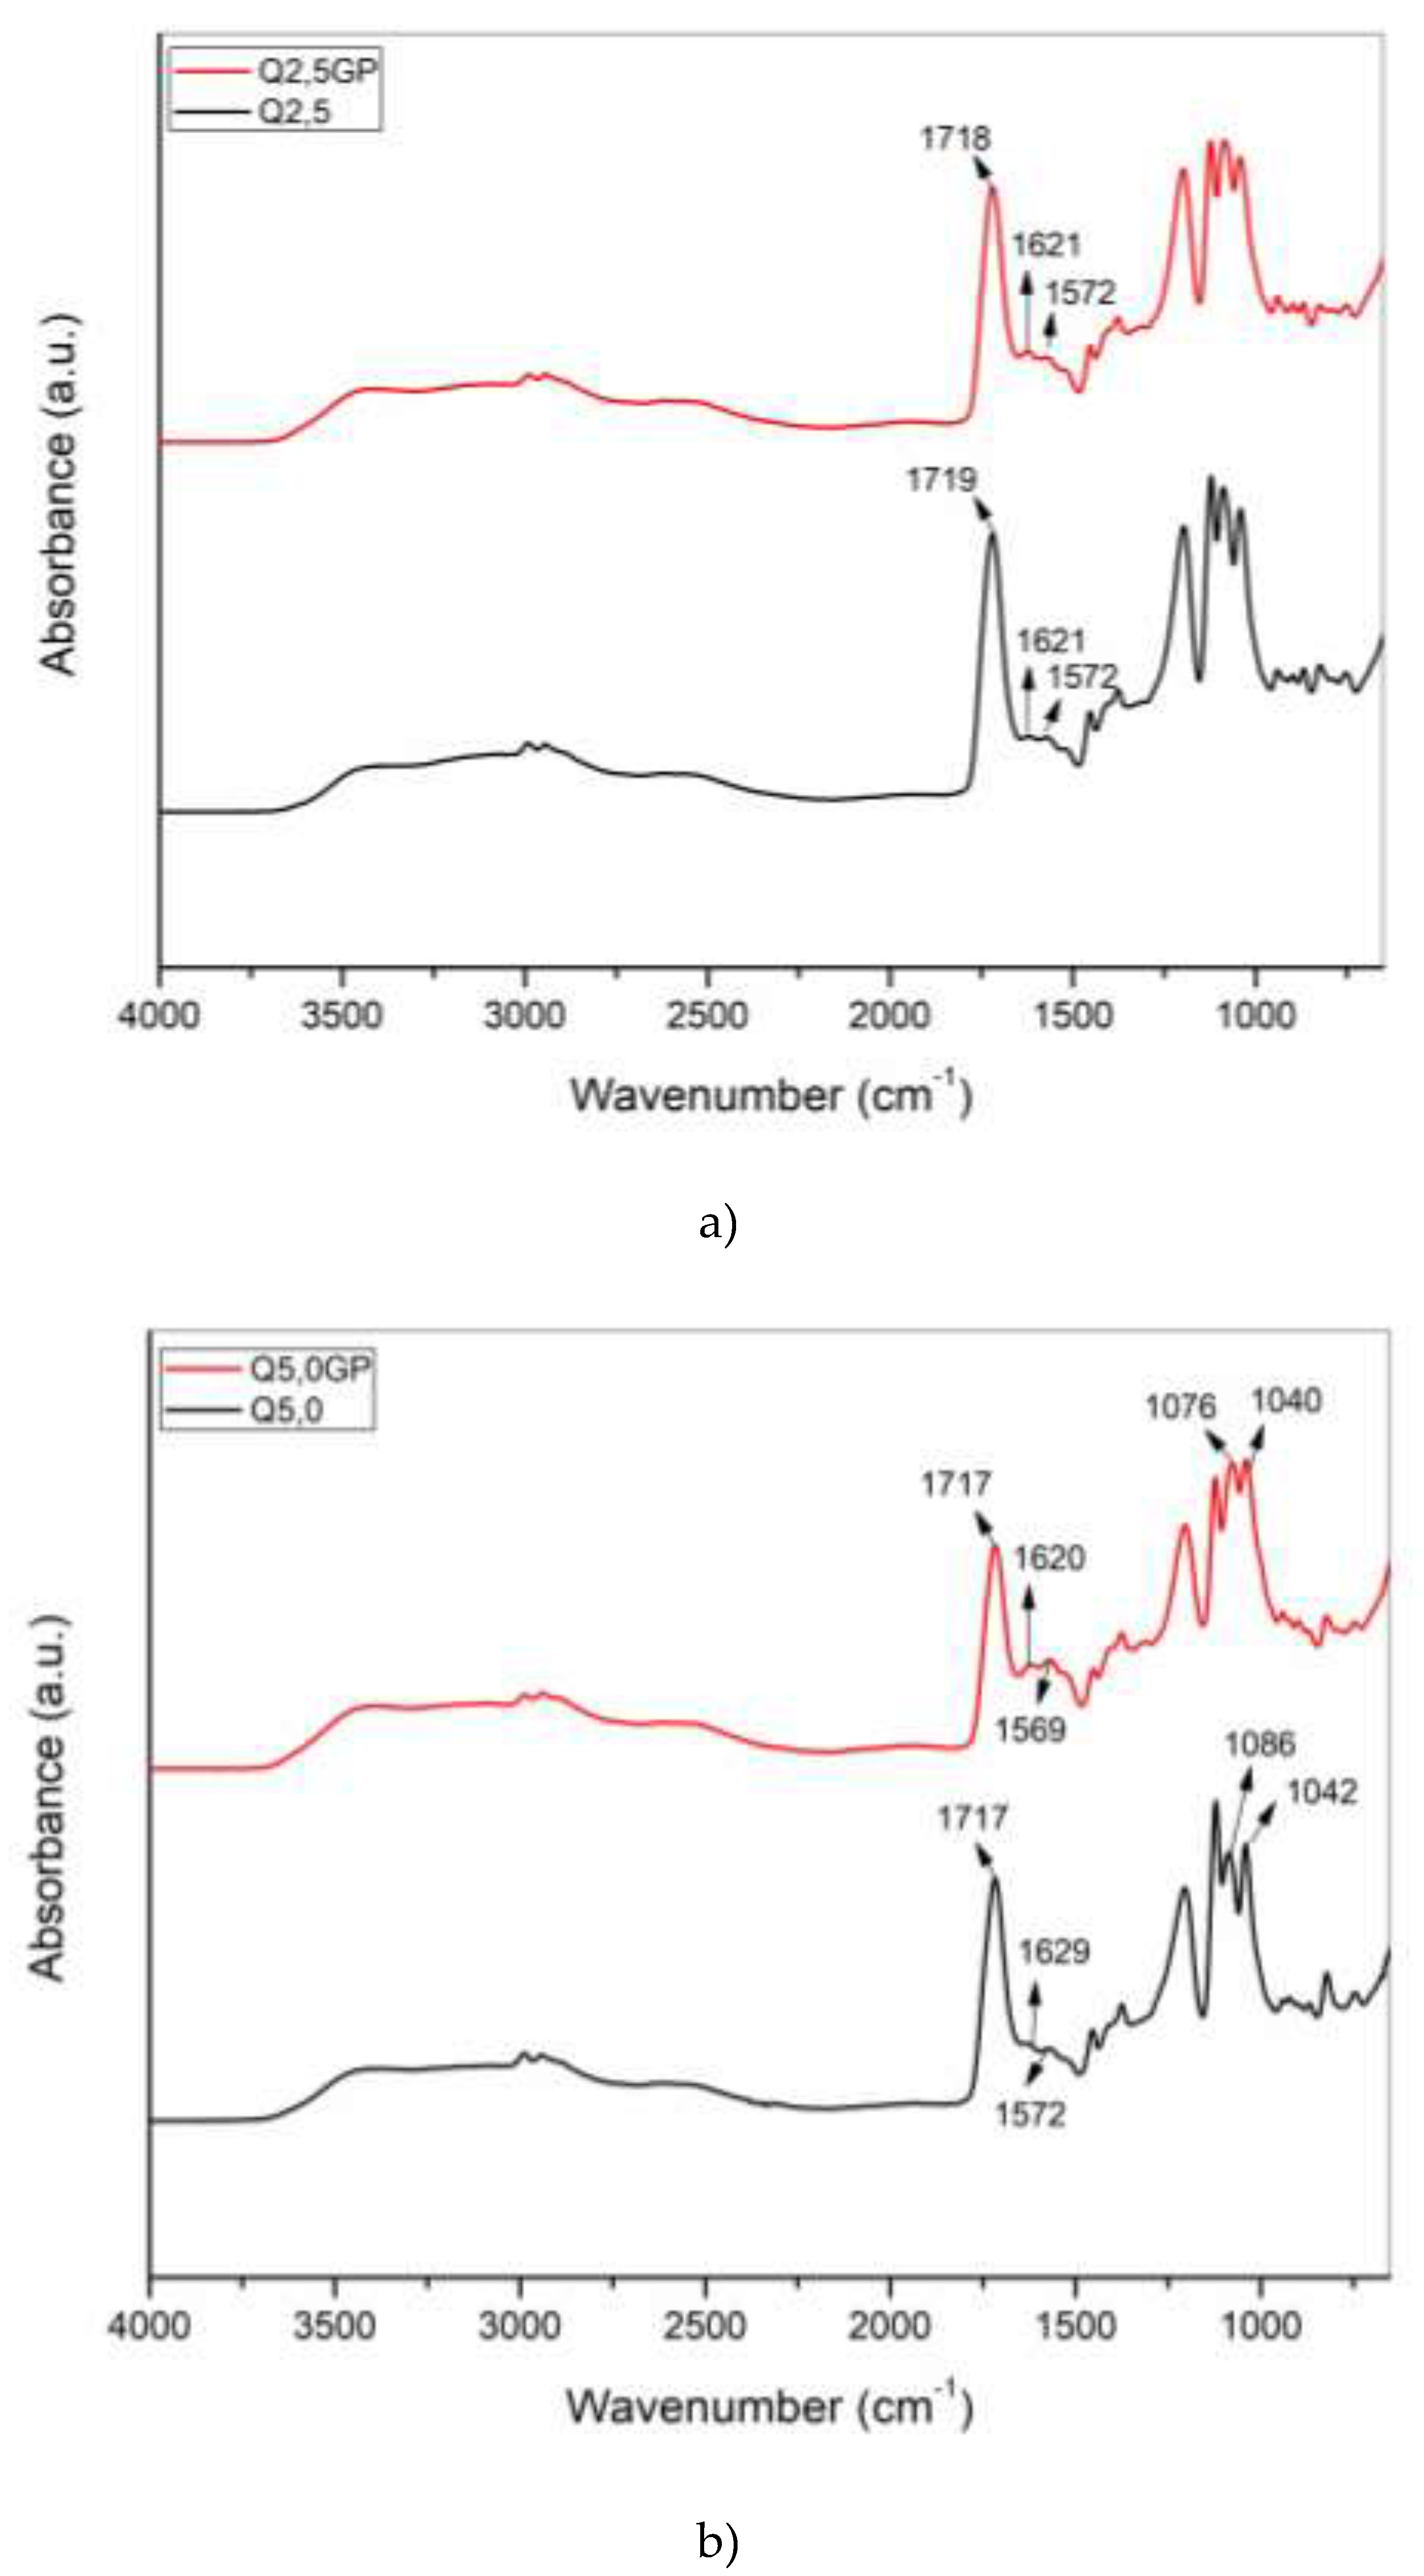
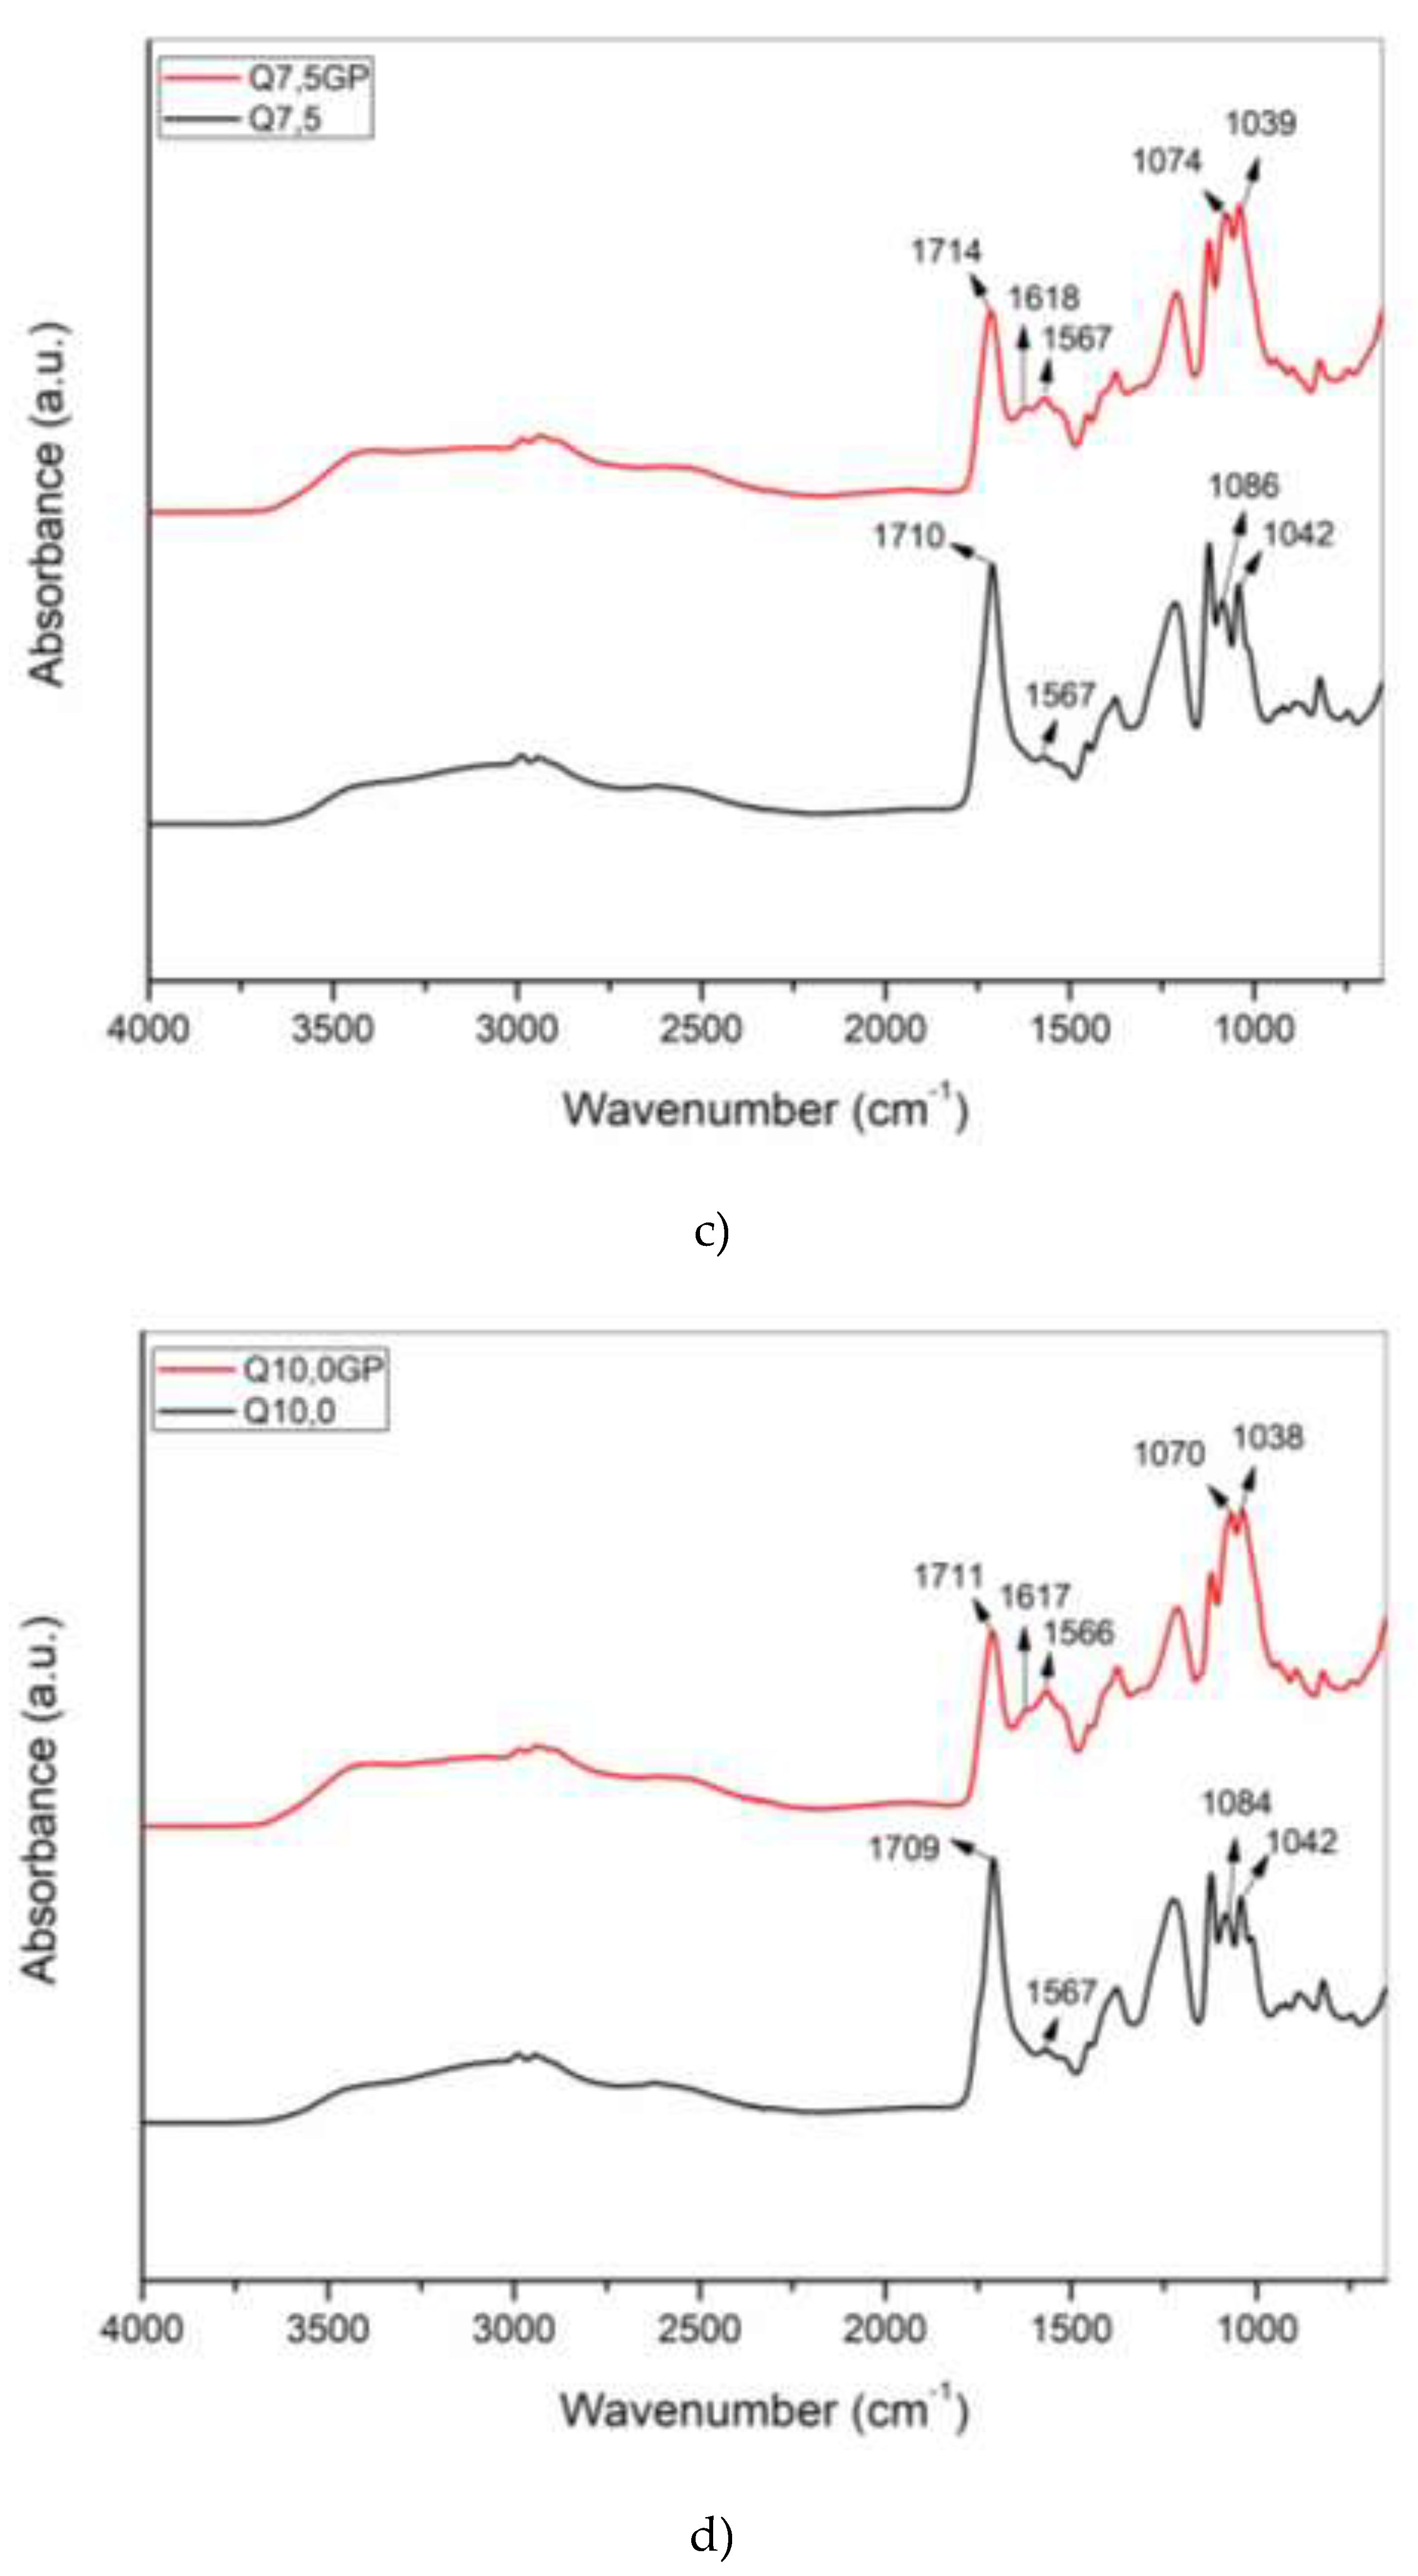
Figure 4.
Chemical composition by FTIR of a) unexposed (A0) and b) exposed (A3M) samples.
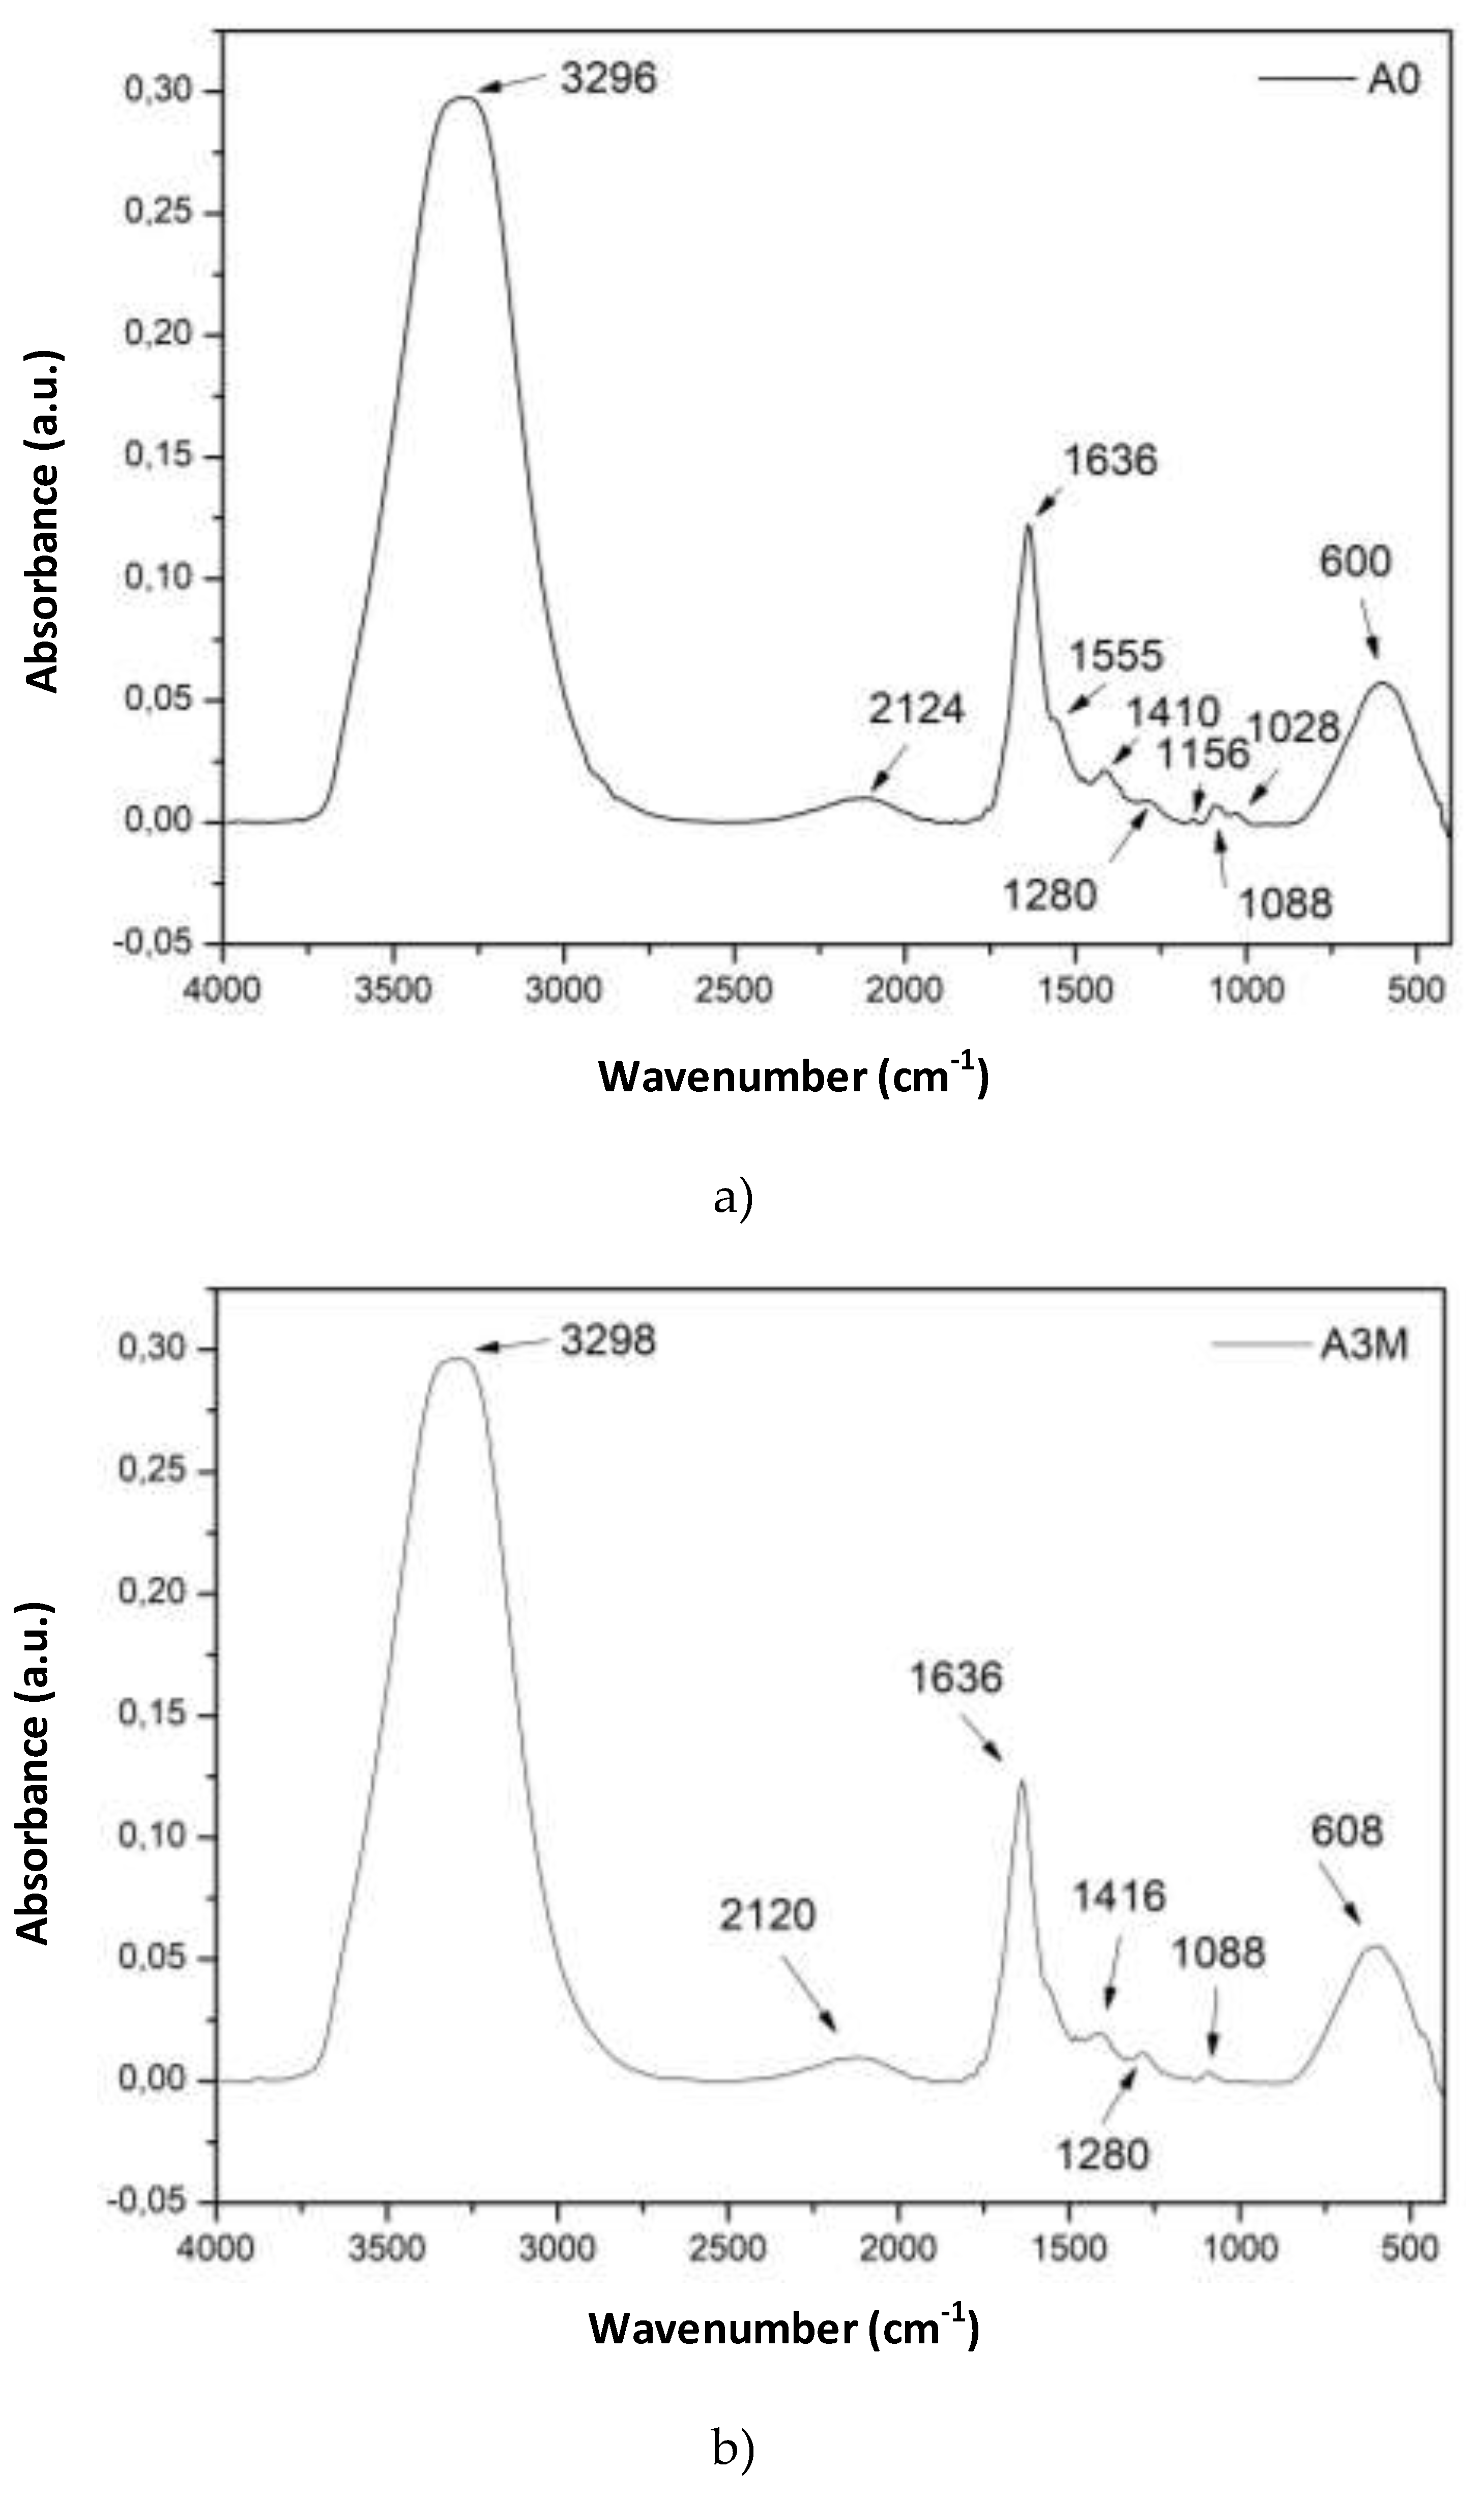
Figure 6.
Effect of molarity a) 3M and b) 10M of pH modifying solution on ST-ST transition for chitosan hydrogel with different pHred.
Figure 6.
Effect of molarity a) 3M and b) 10M of pH modifying solution on ST-ST transition for chitosan hydrogel with different pHred.
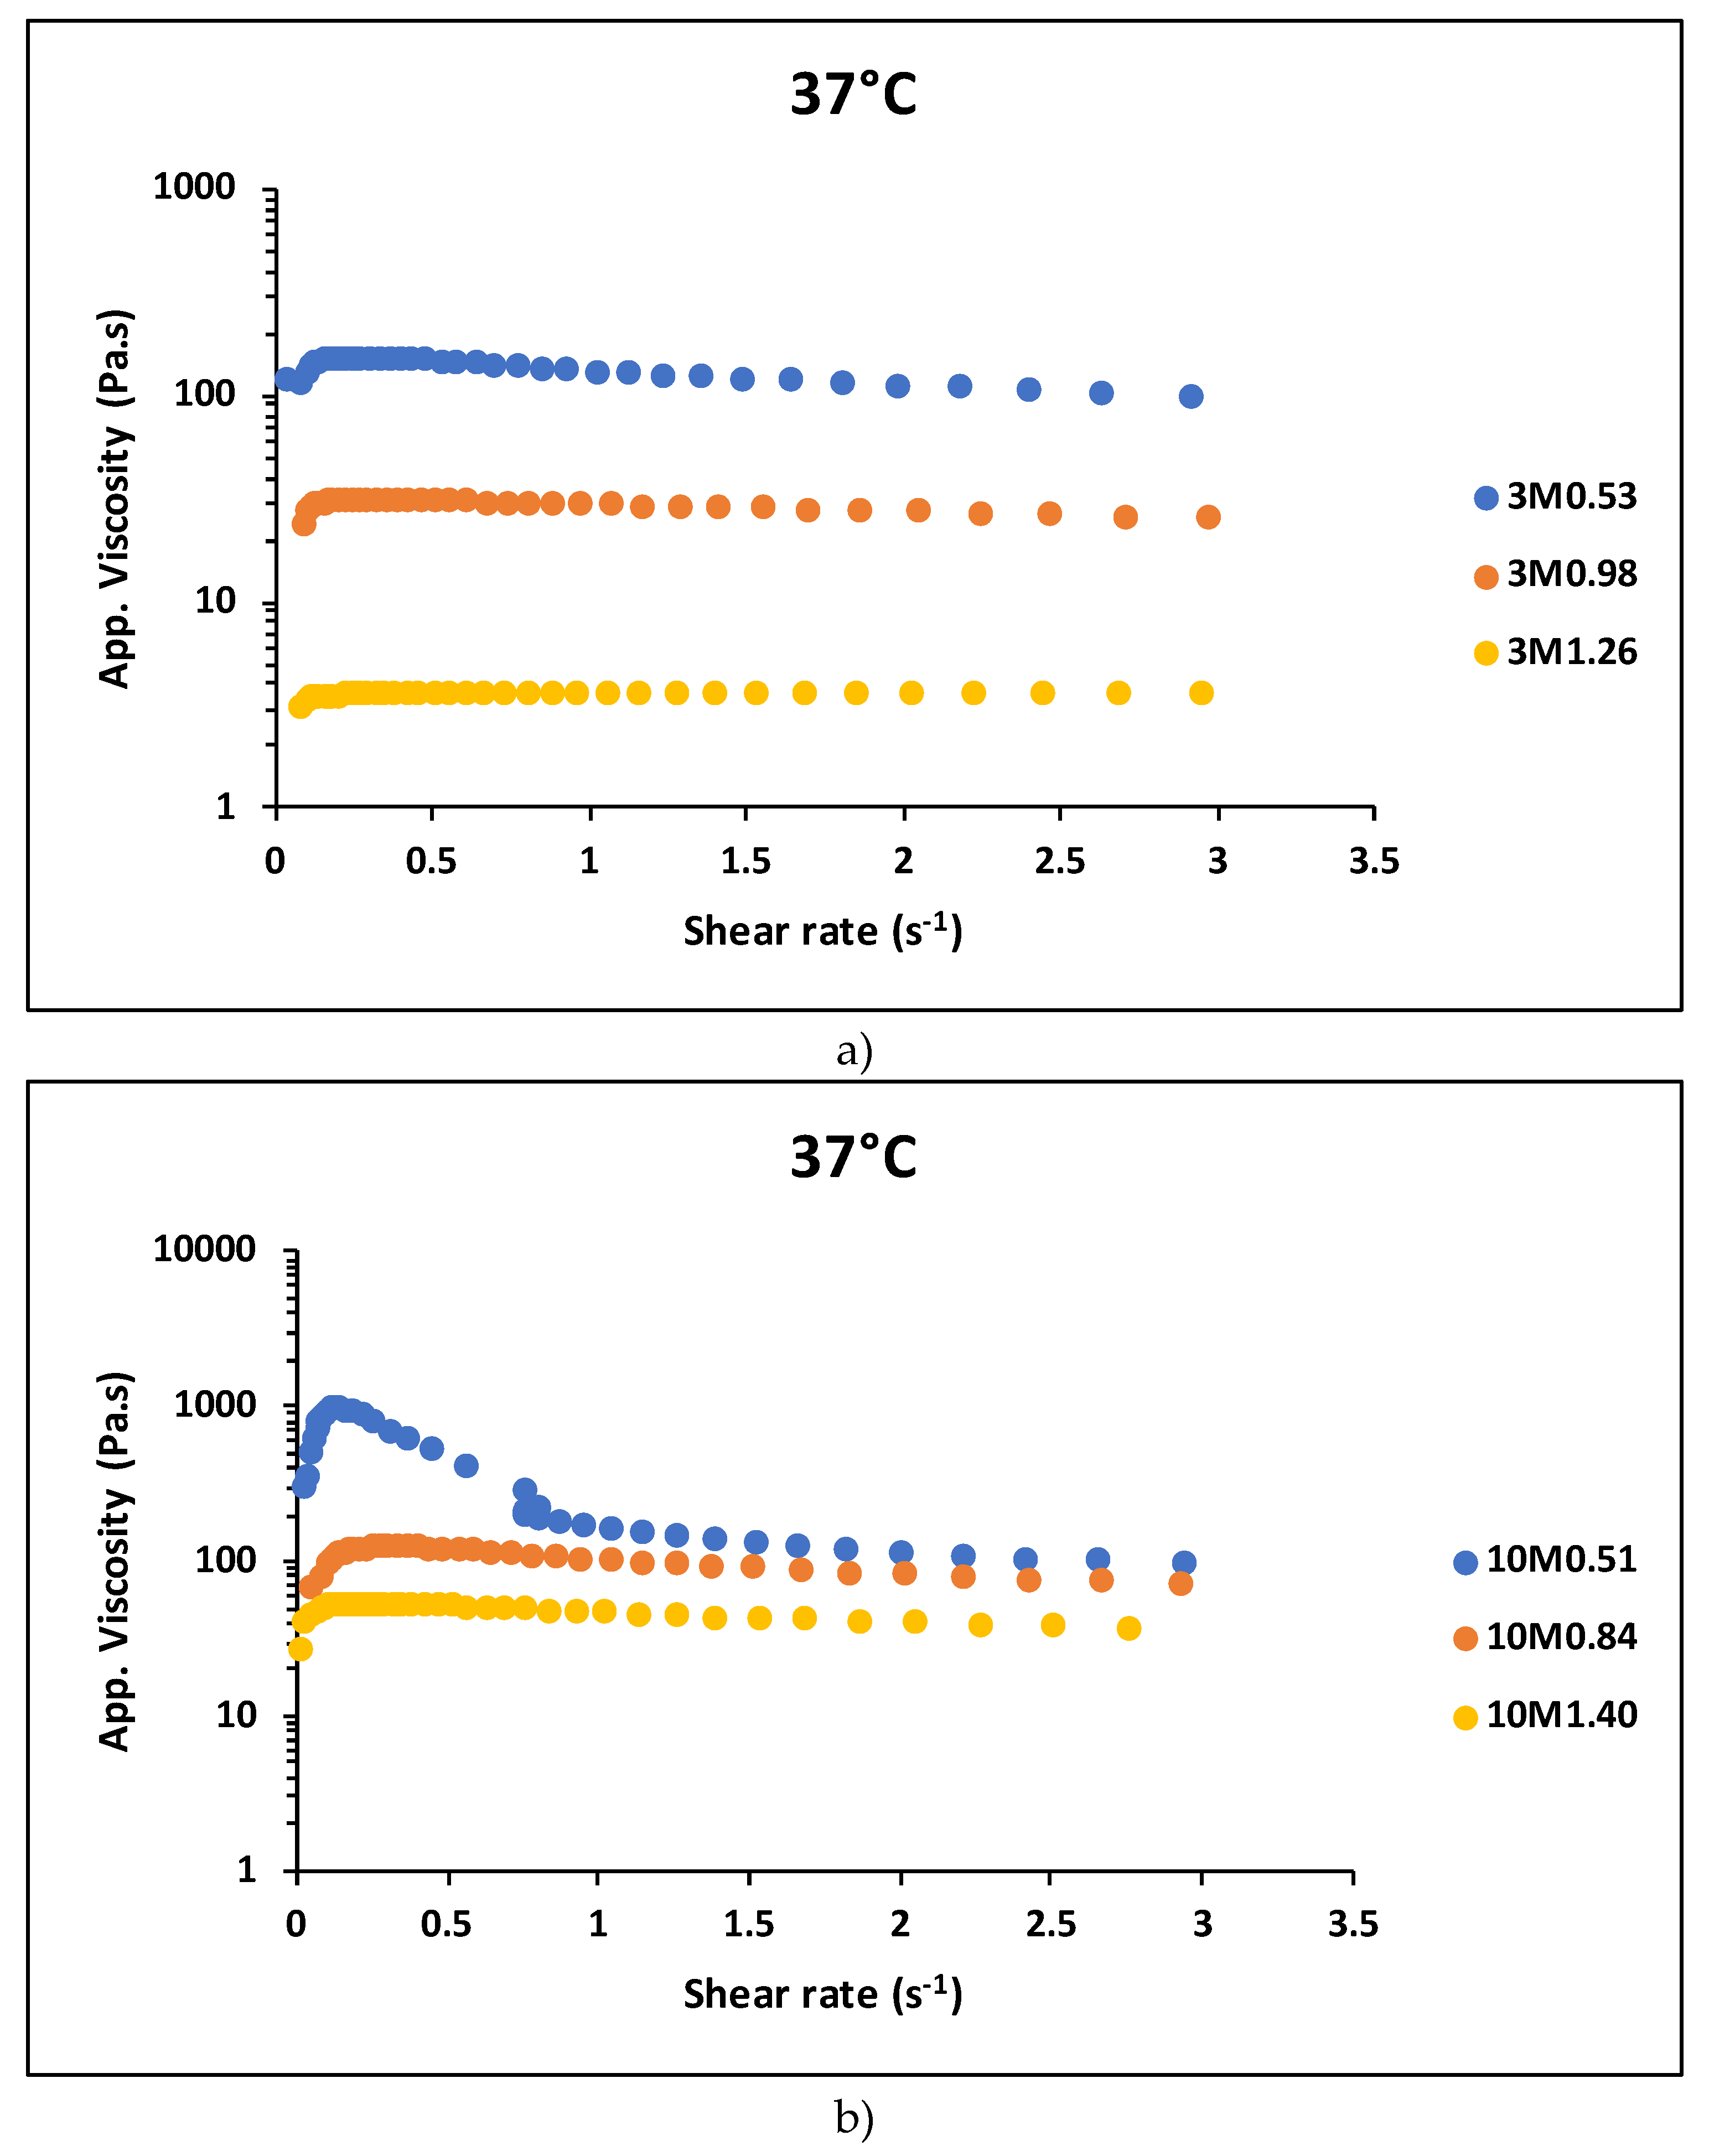
Figure 7.
Influence of thermal aging on the ST-ST transition.
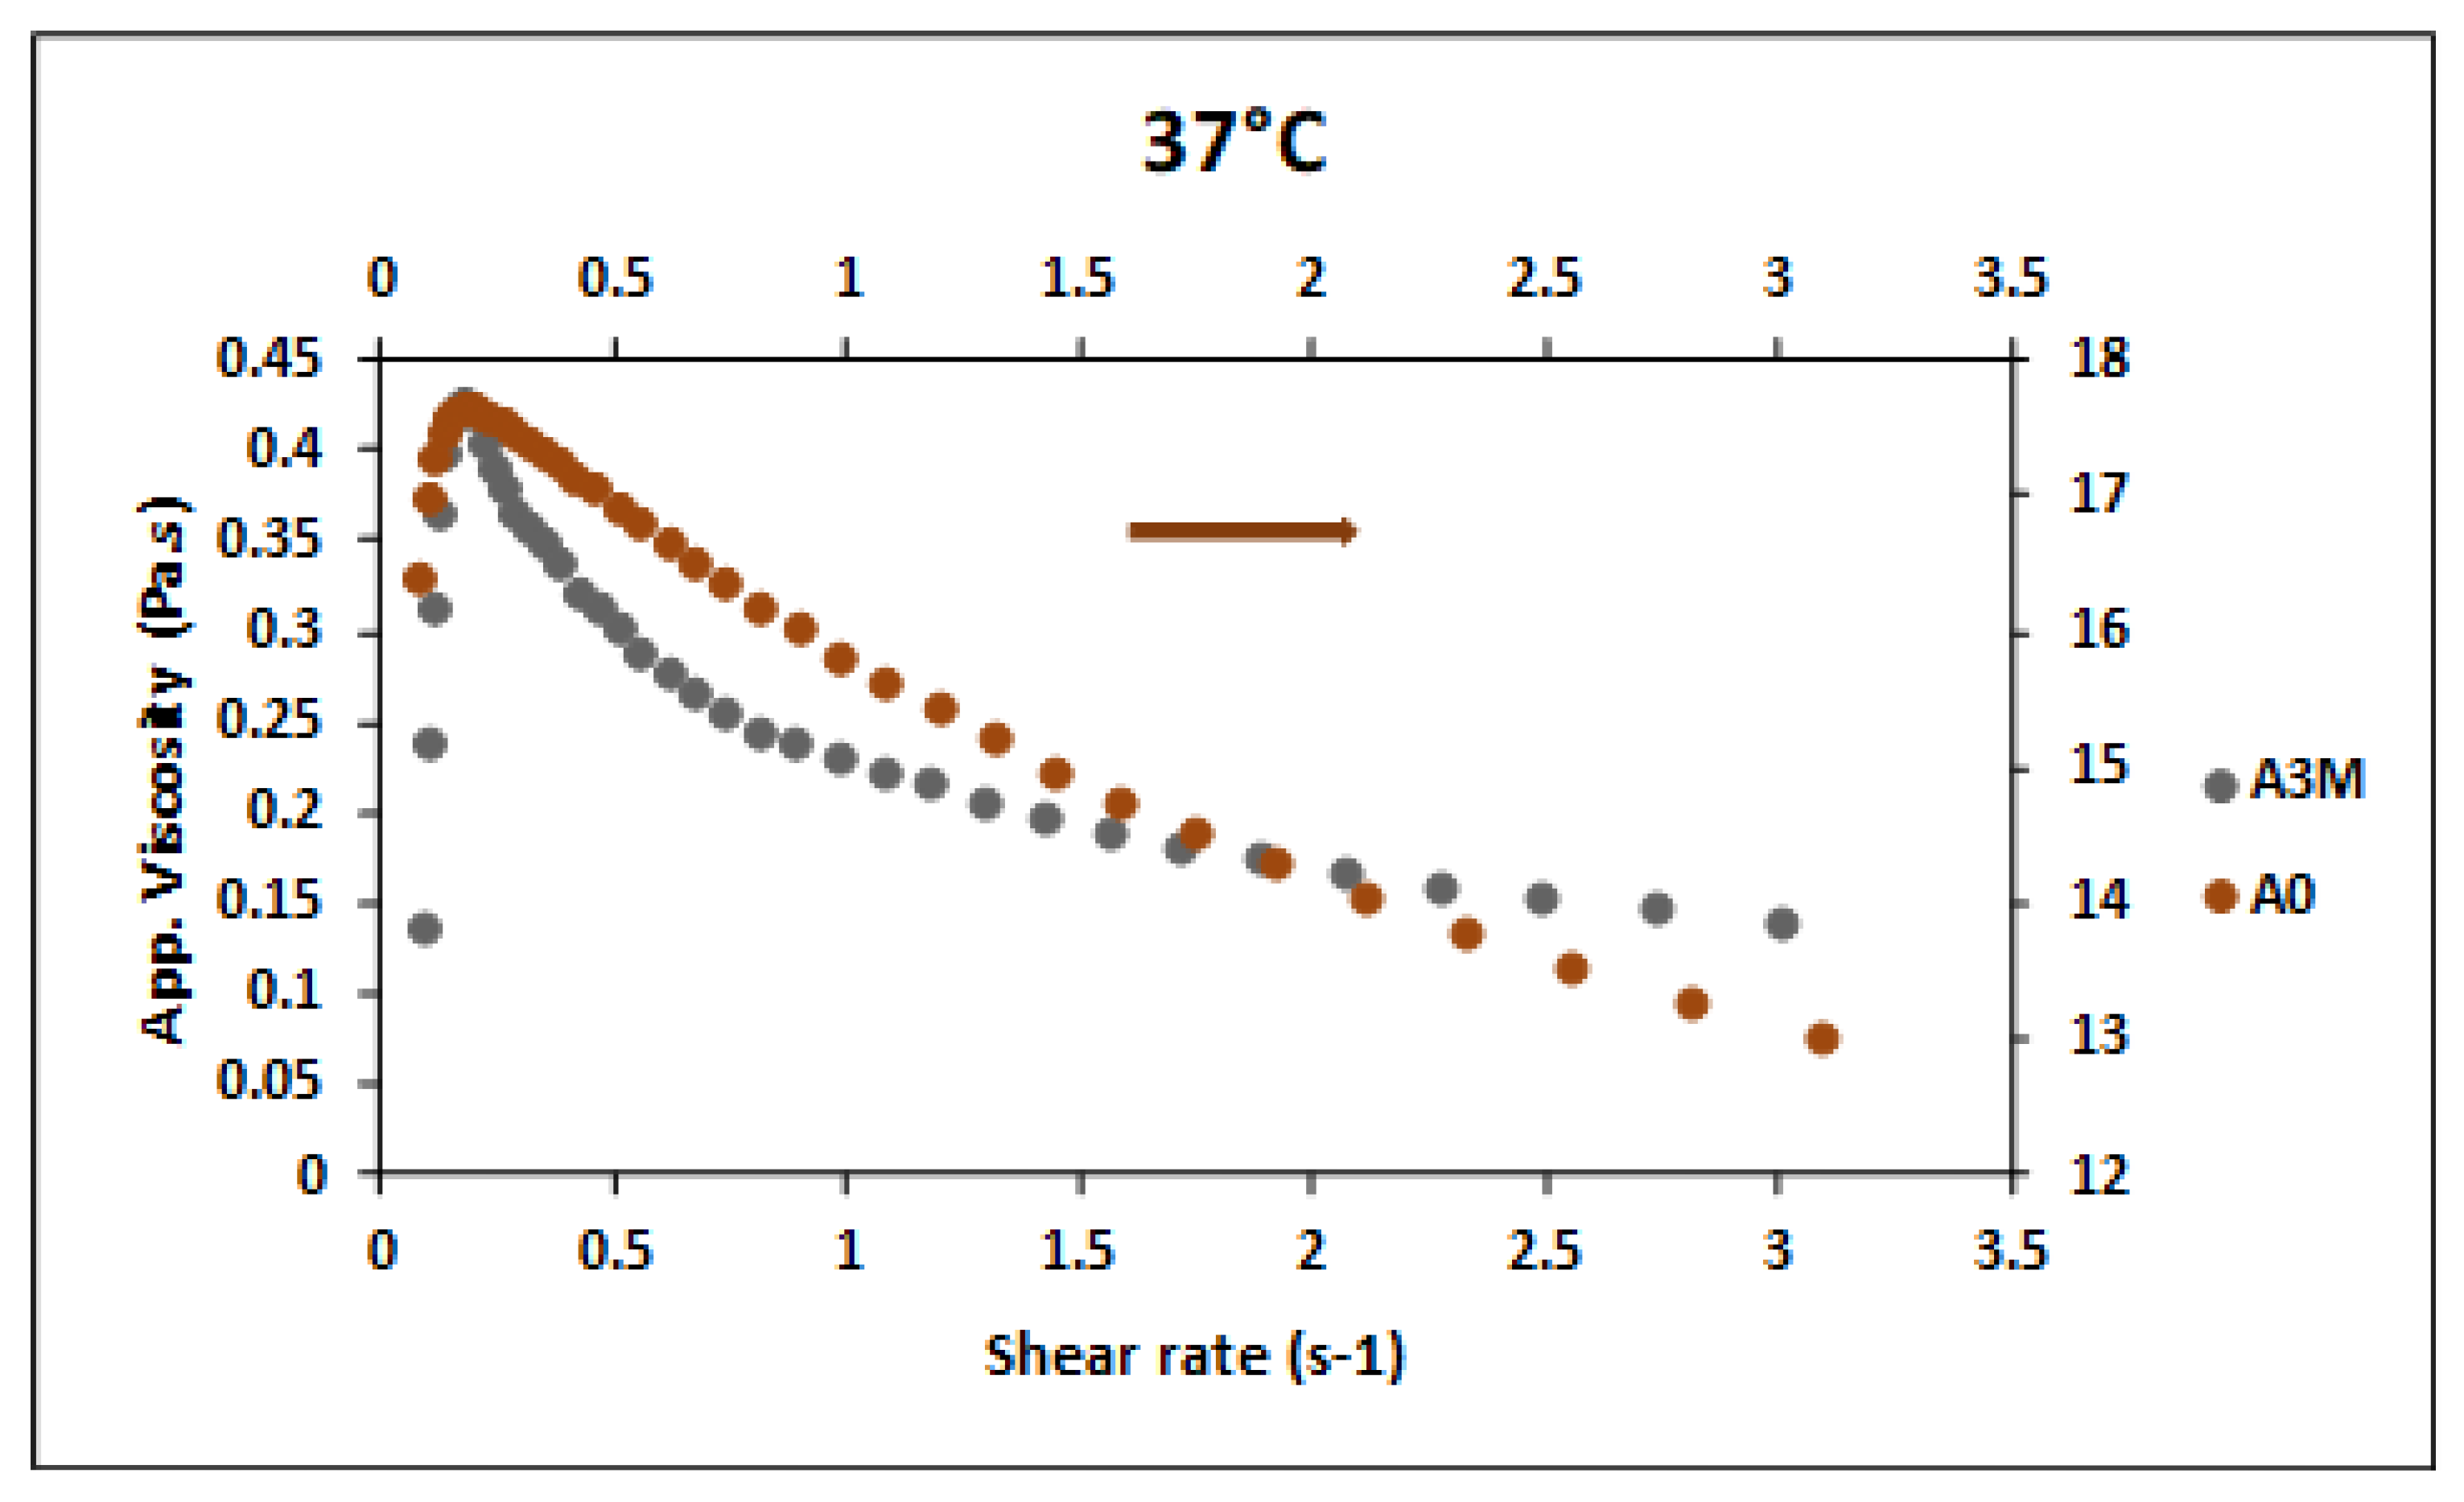

Table 1.
Formulations of Qx.y and Qx.yP hydrogels.
| Sample | Raw Materials | |||||
| Acetic Acid (v/v) | Lactic Acid (v/v) | Citric Acid (v/v) | Chitosan (w/v) | Genipin | ||
| Q2.5 | 40% | 20% | 4% | 2.5% | - | |
| Q5.0 | 40% | 20% | 4% | 5.0% | - | |
| Q7.5 | 40% | 20% | 4% | 7.5% | - | |
| Content | Q10.0 | 40% | 20% | 4% | 10.0% | - |
| Q2.5GP | 40% | 20% | 4% | 2.5% | 0.75 mM | |
| Q5.0GP | 40% | 20% | 4% | 5.0% | 0.75 mM | |
| Q7.5GP | 40% | 20% | 4% | 7.5% | 0.75 mM | |
| Q10.0GP | 40% | 20% | 4% | 10.0% | 0.75 mM | |
Table 2.
Composition of hydrogels xMy.z.
| Sample | pH | Chitosan (% w/v) | |
| Content | 3M0.53 | 2.8 | 5.26 |
| 3M0.98 | 4 | 4.10 | |
| 3M1.26 | 4.8 | 2.78 | |
| 10M0.51 | 2.7 | 5.27 | |
| 10M0.84 | 4 | 4.77 | |
| 10M1.40 | 5.3 | 3.79 |
Table 3.
Composition of hydrogels AO and A3M.
| Raw material | C6H11NO4 (%w/v) |
C2H4O2 (%v/v) |
C3H8O3 (%w/v) |
| Content | 4.0 | 2.0 | 0.04 |
Disclaimer/Publisher’s Note: The statements, opinions and data contained in all publications are solely those of the individual author(s) and contributor(s) and not of MDPI and/or the editor(s). MDPI and/or the editor(s) disclaim responsibility for any injury to people or property resulting from any ideas, methods, instructions or products referred to in the content. |
© 2025 by the authors. Licensee MDPI, Basel, Switzerland. This article is an open access article distributed under the terms and conditions of the Creative Commons Attribution (CC BY) license (http://creativecommons.org/licenses/by/4.0/).
Copyright: This open access article is published under a Creative Commons CC BY 4.0 license, which permit the free download, distribution, and reuse, provided that the author and preprint are cited in any reuse.


