Submitted:
06 March 2025
Posted:
06 March 2025
You are already at the latest version
Abstract
In the context of global carbon peak and carbon neutrality, this work proposes a carbon accounting method for construction engineering based on life-cycle assessment (LCA) and construction cost quota. By incorporating China’s national standards, relevant databases and publications, three major global carbon accounting databases—ICE, EU-EFDB, and IPCC-EFDB—were expanded to enable each database to independently perform full life-cycle carbon accounting for specific construction projects in China. The method is capable of flexibly selecting different databases and quantifying the carbon emissions of construction projects, by directly importing bill of quantities. Finally, a web-based carbon accounting tool was developed, and three databases were used to conduct full life-cycle carbon accounting on three real-world construction projects, to verify the feasibility of the proposed method and compare the carbon accounting results across different databases. Our study showed that, although there were discrepancies in carbon emission results across different stages and processes for the construction projects, the proportions of carbon emissions at each stage and process were relatively consistent.
Keywords:
life-cycle assessment (LCA)
; carbon accounting
; construction cost quota
; carbon emission factor database
; construction-stage carbon accounting
1. Introduction
With the growing global challenges posed by climate change, reducing greenhouse gas emissions has become a critical priority for nations worldwide [1]. In line with the international commitments, China officially introduced the “Dual Carbon Objectives” in 2020, setting goals to reach carbon peak by 2030 and carbon neutrality by 2060 [2]. Within this framework, the construction sector, a major contributor to global energy-related emissions, faces significant pressure to transition to low-carbon practices [3]. Accurate carbon accounting mechanisms in construction projects serve three essential functions: (1) providing empirical support for climate policy development, (2) driving industry-wide decarbonization through standardized measurement protocols, and (3) enabling organizations to assess their emission profiles, implement targeted carbon emission mitigation strategies, and enhance sustainability-driven competitiveness. These multifaceted benefits highlight the methodological and practical importance of establishing robust carbon quantification systems to meet climate targets while promoting green economic growth [4].
Life-cycle assessment (LCA) is a systematic environmental evaluation tool that plays a crucial role in quantifying carbon emission in construction projects [5,6,7,8,9]. This method is capable of evaluating environmental impacts throughout the entire life -cycle of products, processes, and services—from raw material extraction to final disposal—enabling the identification of carbon emission sources at distinct life-cycle stages and supporting targeted mitigation strategies [10,11,12]. Previous studies have demonstrated the effectiveness of LCA applications, for example, Warrier et al. [13] classified the sources of uncertainty in building LCA based on a review of 48 global case studies, while Trabucco et al. [6] conducted a comparative LCA analysis of steel and mass timber building structures, revealing that timber-based solutions result in a 25% lower global warming potential compared to steel or hybrid alternatives. Although the construction stage is often relatively short compared to the full life-cycle, it exhibits disproportionately high carbon emission intensity (per unit length), even with moderate cumulative emissions. This paradox highlights the urgent need to optimize emission reduction strategies during this critical stage. However, currently the construction industry lacks a standardized low-carbon construction technology system, with three key research gaps: (1) insufficient research on carbon emission sources and carbon accounting methods specific to the construction stage of construction projects, (2) lack of standardized measurement protocols for on-site emissions, and (3) limited empirical data to inform evidence-based emission control policies [14]. These challenges impede the accurate quantification and effective management of construction-stage carbon emissions, hindering progress toward our decarbonization targets.
The reliability of carbon accounting results is intrinsically linked to the quality of emission factor databases [15]. While internationally recognized resources such as the Inventory of Carbon and Energy (ICE) [16,17], the European Environment Agency's Emission Factor Database (EU-EFDB) [18,19], and the Intergovernmental Panel on Climate Change Emission Factor Database (IPCC-EFDB) [20,21] have become mainstream references, their application in Chinese construction sector exposes two key limitations. First, current databases suffer from temporal fragmentation, typically focusing on operational stages while overlooking embodied emissions from material production, which represent a significant portion of total building emissions, as indicated in various life-cycle assessment studies [22]. Second, the absence of standardized life-cycle boundaries compromises cross-project comparability, particularly in the context of China's widely-used prefabrication techniques, which alter traditional emission distribution patterns [23]. These gaps highlight the need for localized life-cycle assessment frameworks that incorporate China-specific construction practices and material supply chain characteristics [4].
The evolution of carbon accounting software reveals distinct developmental trajectories between Chinese and international markets. As part of global decarbonization efforts, these tools have become crucial for accurate emission quantification. International solutions, benefiting from earlier research developments, exhibit advanced functionalities, as shown in Table 1. For example, SimaPro platform integrates complex operational workflows from multiple industries through advanced algorithmic architecture, facilitating comprehensive evaluations of carbon emissions across various environmental impact categories [24]. Similarly, Umberto software supports comprehensive life-cycle assessments (LCA) by evaluating the environmental impact of different product systems, enabling comparisons of various options based on multiple impact categories, and providing insights into sustainability improvements for system optimization [25]. These capabilities contrast with Chinese domestic solutions, which remain in earlier stages of development, highlighting some technological gaps in China's current carbon management infrastructure.
Although China's carbon accounting sector emerged later than its international counterparts, it has made significant strides through localized research frameworks. A notable example is SinoCarbon's Carbon e-Management, which offers cost-effective Software as a Service (SaaS) solutions for small and medium-sized enterprises. This platform has been shown to significantly reduce carbon management implementation costs compared to traditional methods [26]. While these advancements highlight recent technological innovations, there are still persistent gaps in the integration of life-cycle data, which pose challenges for their broader application in real-world construction engineering.
As summarized in Table 1, the comparison of carbon accounting software highlights their respective strengths. SimaPro, a leading tool in life-cycle assessment (LCA), facilitates multi-impact category carbon assessments and supports detailed environmental decision-making [24]. Umberto, primarily used for comprehensive product system evaluations, focuses on identifying sustainability improvements to optimize system performance [25]. Gabi offers precise LCA calculations and a comprehensive database for efficient data retrieval [27]. Within China, Sinocarbon's cloud-based model reduces implementation costs for small and medium-sized enterprises (SMEs) [26]. However, the construction stage database remains incomplete, and further research is needed to systematically integrate carbon accounting with specific construction steps.
Despite the widespread use of various methods and tools for carbon emission calculation in construction projects, significant deficiencies persist. A major issue with existing carbon accounting methods is their failure to effectively integrate construction cost quota data, which undermines both their accuracy and applicability. Additionally, many carbon accounting databases are limited to specific fields or project types and lack cross-project data support, which restricts their broader application. Furthermore, the majority of carbon accounting software available is standalone, missing key functionalities such as online collaboration and real-time updates, which are essential for more dynamic and accurate emissions tracking. To overcome these limitations, this study builds upon life-cycle assessment (LCA) methods and previous research on carbon emission reduction. The proposed framework focuses on a systematic life-cycle carbon accounting method that follows the principles of life-cycle assessment (LCA) in accordance with ISO 14040 standard [28], while also incorporating carbon accounting analysis during the construction stage using the Standard for quantity calculation of housing construction and decoration projects Standard for Quantity Calculation of Housing Construction and Decoration Projects (GB/T 50854-2024) [29] and Quotations for Highway Engineering Budgeting (JTG/T 3832-2018) [30]. The methodology integrates three localized emission databases, derived from international references such as the Inventory of Carbon and Energy (ICE) [16,17], the European Union Emission Factor Database (EU-EFDB) [18,19], and the Intergovernmental Panel on Climate Change (IPCC-EFDB) [20,21], as well as Chinese national standards like the Building Carbon Emission Calculation Standard (GB/T 51366-2019) [31], collectively covering a wide range of China-specific construction materials. In addition, a web-based software for the Construction Project Carbon Accounting System (CPCAS) has been developed, by utilizing PHP 8.1 and Node JS 18, which addresses the limitations of traditional standalone systems by enabling multi-user online collaboration, data sharing, and real-time updates. This framework was later applied to three representative real-world construction projects in China, which included National Highway 320 project, Hangzhou-Shaoxing-Ningbo Expressway project, and National Highway G25 project, to assess the results of automated carbon emission calculations and the feasibility of the proposed carbon accounting system in real-world construction projects.
By conducting carbon emission calculations and comparative analyses for the three real-world construction projects, and comparing the three different carbon emission factor databases, the feasibility and effectiveness of the proposed methods, tools, and databases are validated. The results indicate that the carbon accounting method developed in this study is both applicable and stable, capable of calculating life-cycle carbon emissions for construction projects. This study is expected to provide more useful insights into the development of carbon emission calculation methods, carbon emission factor databases, and carbon accounting software for the real-world construction projects.
Figure 1 summarizes the structure of the current paper, which is organized into five sections. Section 1 introduces the development of carbon accounting methods and related software. Section 2 details the creation of a web-based carbon accounting system. Section 3 covers the construction of three emission databases, integrating international references and Chinese domestic standards. Section 4 applies the developed carbon accounting system to three real-world construction projects, including National Highway 320 project, Hangzhou-Shaoxing-Ningbo Expressway project, and National Highway G25 project, and analyze their life-cycle carbon emissions. Section 5 presents a comparative analysis of the carbon emission results and offers practical recommendations for possible future applications. The standards and guidelines referenced in this study include several Chinese standards and databases, such as the Standard for Building Carbon Emission Calculation(GB/T 51366-2019) [31] and the China's Important Conference Paper Database (CPCD) [32].
2. Carbon Accounting Model and Database for Construction Projects
2.1. Carbon Emission Calculation Boundaries
Carbon emission calculation boundaries refer to the scope and limits defined during carbon accounting, which are essential for ensuring the accuracy of carbon calculations and the comparability between different accounting objects [4]. In carbon accounting for construction projects, the “carbon impact” is divided into two categories: operational carbon and embodied carbon. Operational carbon is attributed to the construction project and refers to the carbon emissions produced due to water supply, electricity supply, and other activities, characterized by fewer categories and easier calculation and statistical processes. In contrast, embodied carbon is attributed to building materials and refers to the carbon emissions generated during the manufacturing, production, transportation, construction, maintenance, as well as during the maintenance, replacement, demolition, deconstruction, and disposal of material components. This category is more complex, with numerous classifications, making calculation and statistical processes more difficult, and it remains one of the most critical and challenging issues in current carbon accounting for construction projects [33]. This study draws on life-cycle theory and research on carbon reduction [34], dividing the construction project carbon calculation boundaries into five stages: the production stage, construction stage, use stage, end-of-life stage, and supplementary stage, in chronological order. The carbon emission details to be considered for each stage are outlined in Table 2. Based on this framework, the carbon emission calculation boundaries of construction projects are further refined by considering the emission sources at each stage, as shown in Figure 2.
Given the high carbon emission intensity, numerous processes, and the challenges associated with quantifying emissions during the construction stage of construction projects, this study analyzes the factors influencing carbon emissions in the construction stage using construction cost quota data and bill of quantities. A top-down analysis framework for construction projects, sub-projects, item projects, and quota sub-items, along with a construction carbon accounting sub-model, is developed, as shown in Figure 3. In this model, carbon accounting for the construction stage can be calculated based on three emission sources: material transportation, construction installation, and machinery usage, which can be naturally calculated by using the bill of quantities and the construction cost quota data. Figure 4, using the National Highway 320 project as an example, demonstrates the tiered calculation method applied during the construction stage of this model. The method consists of four levels, including construction project, sub-project, item project, and quota sub-item. Due to the large number of sub-projects, item projects, and quota sub-items in this project, only a partial representation is shown in Figure 4.
2.2. Carbon Emission Factor Database
Based on the five stages of carbon emission in construction project life cycle, the carbon emissions associated with the construction project [35], can be broadly categorized into 11 types. Each stage includes 1-3 types of carbon emissions, as shown in Table 3. Therefore, the 11 types of carbon emission factors are identified as building material carbon emission factor, transportation carbon emission factor, construction installation carbon emission factor, machinery equipment carbon emission factor, material replacement carbon emission factor, structural demolition carbon emission factor, waste disposal carbon emission factor, energy carbon emission factor, reuse carbon emission factor, biogenic carbon emission factor, and carbon sequestration from greening carbon emission factor, as shown in Figure 5. Typically, the first eight types are related to carbon emissions with positive values, while the last three types are related to the reduction of carbon emission with negative values.
When compiling the carbon emission factor database for real-world construction engineering in China, the domestic carbon emission databases are still incomplete, while the international databases are also limited to poor regional applicability and incompleteness. This study deals with the challenges from the following three considerations: the specialization of construction projects, the comprehensiveness of carbon emission factors, and the international applicability and authority of different databases. Based on the characteristics of the Inventory of Carbon and Energy (ICE) [16,17], the European Union Emission Factor Database (EU-EFDB) [18,19], and the Intergovernmental Panel on Climate Change Emission Factor Database (IPCC) [20,21] (as shown in Table 4), and integrating the “Standard for building carbon emission calculation(GB/T 51366-2019)” [31] and the “China's Important Conference Paper Database (CPCD)”[32], three customized LCA databases applicable to the construction projects were then developed, resulting in the customized ICE, the customized EU-EFDB, and the customized IPCC-EFDB, as shown in Figure 4. Table 5 lists some of the typical items for the modified carbon emission factors based on the three databases.
Because the study on carbon emission factors for the supplementary stage is still in its early stage, with very limited data available, the same supplementary stage carbon emission factor database was used for all the three customized databases [16,17,34]. However, carbon emission factor research for the first four stages of the full life-cycle is relatively comprehensive, with most data obtainable from the original ICE, EU-EFDB, and IPCC-EFDB. As a result, the carbon emission factors for the first four stages of the customized databases differ according to Figure 6, which presents an enhanced Entity-Relationship (E-R) diagram of the customized databases, illustrating the cross-references between the customized ICE, EU-EFDB, and IPCC-EFDB, along with the integration of the supplementary stage carbon emission factor data. Due to the lack of uniformity in the units used in the base databases, unit conversions or molecular weight adjustments were carried out using various national industry standards, national statistical yearbooks, and quota standards, ultimately yielding the desired results. Additionally, some building material carbon emission factors, such as those for cement and steel, were derived by calculating the carbon dioxide emissions based on relevant chemical equations for cement (32.5 grade) and steel (section steel), as shown in Table 5. These equations were based on data from the customized ICE, EU-EFDB, and IPCC-EFDB. For example, when calculating the carbon emission factors due to energy resources consumption for the customized IPCC-EFDB, the following steps were undertaken:
- Unit conversion: As different fossil energy sources are measured using different units (e.g., coal is measured in tons, natural gas in cubic meters), it was necessary to convert these into a unified thermal value unit. According to “General Rules for Calculation of the Comprehensive Energy Consumption (GB/T 2589-2020)” [36], all energy sources were converted to a standard unit of Lower Heating Value (LHV) to ensure consistency across the datasets. For instance, 1 ton of coal was converted to its equivalent Lower Heating Value (LHV) value in megajoules per ton (MJ/ton), and the same was done for natural gas and oil, enabling a uniform comparison of carbon emissions across different types of energy resources.
- Preliminary calculation: The carbon emission factors and carbon oxidation rates for various fossil energy sources from the IPCC-EFDB were multiplied by their respective lower heating values. This calculation is done to determine the energy content of each fossil fuel and its contribution to carbon emissions. The result was then further multiplied by 44/12 (to convert atomic carbon to molecular CO₂), as this ratio represents the molecular weight conversion factor, where 44 is the molar mass of CO₂ and 12 is the molar mass of carbon. This method ensures that the carbon content is properly accounted for in the form of carbon dioxide.
Carbon emission calculation: The carbon dioxide emissions from fossil energy encompass both combustion and production processes. Both components were summed to obtain the final emission values. The formula used for the calculation is CEF = Average Lower Heating Value × Carbon Oxidation Rate × 44/12 + production stage Carbon Emission Factor. This formula was derived from the “IPCC-EFDB’s Guidelines for National Greenhouse Gas Inventories (IPCC-EFDB, 2006)” [37] and has been widely adopted in carbon emission assessments for energy consumption. The production stage carbon emission factor accounts for emissions released during the extraction and transportation of fossil fuels, while the combustion process calculates emissions during energy u
2.3. Carbon Emission Calculation Method
This study’s carbon accounting framework is divided into five stages: the production stage, construction stage, use stage, end-of-life stage, and supplementary stage. The calculation method for the carbon sequestration in the greening process during the supplementary stage of embodied carbon is derived from the research [34]. The calculation methods for other stages of embodied carbon are sourced from the seminal work published by UK Institution of Structural Engineers [39]. The operational carbon calculation method is based on the work [40]. Below are the specific calculation formulas,
1.Production stage analysis
The production stage includes three primary processes, and they are raw material supply, material transportation, and product manufacturing. Due to the challenges in obtaining precise data on transportation distances and manufacturing processes, the calculation focuses primarily on raw material inputs. The derivation of the formula depends on the material quantification methods used, including mass m, volume V, area S, and length l.
where represents total production-stage emissions; i, j, k and l represent the material categories; CEF represents the material-specific emission factors; represent the material consumption quantities.
2. Construction stage analysis
Emissions during the construction stage are calculated as follows:
where represents carbon emissions from the TDth (transportation mode) to the site; represents carbon emissions from construction installation; represents carbon emissions from mechanical equipment.
The carbon accounting formula for the goods transportation stage is as follows:
where represents the carbon emission factor of the corresponding mode; represents transportation distance for the TD-th mode.
The carbon accounting formula for the construction installation stage is as follows:
whererepresents waste factor of material i (dimensionless ratio between 0-1); represents waste rate of material i (%); represents carbon emission factor for raw material supply of material i (kgCO₂e/unit); mi represents mass of material i (kg). When using alternative measurement units, substitute with m³, m², or m.
The carbon accounting formula for the machinery equipment stage is as follows:
where represents carbon emissions from mechanical equipment; represents quantity of the i-th mechanical equipment type; represents operational quantity of the i-th equipment (unitless); represents operational duration (hours); represents carbon emission factor of the energy source used (kgCO₂e/kWh).
3.Use stage snalysis
The use stage of a construction project consists of seven processes: operation, maintenance, repair, replacement, renovation, operational electricity consumption, and operational water consumption. Since data for the remaining processes are difficult to obtain, this study uses “replacement” to represent the first five processes. The calculation formula is as follows:
where represents carbon emissions generated during the material replacement of a construction project; represents carbon emissions generated in the operational stage of a construction project due to electricity consumption; represents carbon emissions generated in the operational stage of a construction project due to water consumption.
The carbon accounting formula for the replacement stage is as follows:
where represents the expected lifespan of material i, which is 60 years for building projects and 120 years for infrastructure; represents default service life of material i, rounded up to the next integer.
The carbon accounting formula for electricity consumption in the operational stage of the construction project is as follows:
where represents the proportion of clean energy used; is measured via smart meter data in kilowatt-hours (kWh); represents the carbon emission factor associated with electric consumption in the region where the i-th part of the building project is located.
The carbon accounting formula for water consumption in the operational stage of the construction project is as follows:
where represents the water usage of the i-th part of the construction project; represents the carbon emission factor associated with water consumption in the region where the i-th part of the building project is located.
4.End-of-life stage analysis
The end-of-life stage encompasses four processes: structural demolition, waste transportation, waste treatment, and waste cleanup. As data for waste treatment and cleanup are often combined in practice, these two processes are computed collectively through the following formula:
where represents the carbon emissions during the structural demolition stage of the construction project; represents the emissions from transporting materials to the site using the TD method; represents the emissions generated during the waste disposal process.
The carbon accounting formula for structural demolition is as follows:
where represents kgCO₂e per square meter, and represents square meters.
The carbon accounting formula for waste transportation is as follows:
where represents kgCO₂e per kilogram per kilometer; represents kilometers; represents kilograms.
The carbon accounting formula for waste clearance is as follows:
where represents kgCO₂e per ton; represents tons.
5. Supplementary stage analysis
The supplementary stage involves three carbon sequestration processes: material reuse, biogenic carbon storage, and afforestation. The calculation methodologies for these processes are defined as follows:
where represents the carbon emissions reduction due to material reuse; represents the carbon emissions reduction resulting from the reuse of wood products; represents the carbon emissions reduction generated by greening activities.
The carbon accounting formula for material reuse is as follows:
where represents kgCO₂e per unit; represents units; represents units.
The carbon accounting formula for the biogenic carbon stage is as follows:
where represents the proportion of wood; represents the percentage of moisture; represents the weight of wood; represents the amount of carbon per kilogram of wood.
The carbon accounting formula for the greening carbon sequestration stage is as follows:
where represents the number of plants; represents meters; represents meters; L represents the length of the greening area in meters; W represents the width of the greening area in meters; represents kgCO₂ per plant per year; k represents the empirical density impact coefficient ranging from 0.8 to 1.2.
Finally, the carbon accounting formula for the entire life-cycle of the construction project is as follows:
3. Development of Carbon Accounting Tool for Construction Project
3.1. Software Design Framework
The establishment of the carbon accounting tool aims to enable users to conduct whole-life-cycle carbon accounting for one or more scenarios of actual construction projects, including both operational and embodied carbon, and to perform comparative studies to identify corresponding carbon reduction measures. Given the widespread use of construction cost estimation and budget software in construction projects, this software is designed with user convenience in mind. It incorporates a feature for directly importing bill of quantities, addressing practical needs. Therefore, as illustrated in Figure 7, the system is structured around the following six core functional modules,
- Importing basic project information: This module allows users to input essential project details, including project name, type, location, and timeline (start and end dates).
- Building the LCA model: This module enables users to create one or more life-cycle assessment (LCA) models based on the project details and scenarios.
- Selecting the LCA database: This module provides users with the option to choose from different LCA databases based on the specific needs of the project scenario: the customized ICE, the customized EU-EFDB, and the customized IPCC-EFDB.
- Whole-life-cycle carbon accounting for the construction project: This module enables users to conduct whole-life-cycle carbon accounting for multiple processes and stages of the construction project, including the production stage, construction stage, use stage, end-of-life stage, and supplementary stage.
- Data validation: This module highlights any errors in the data within the model to improve the accuracy of the LCA model.
- LCA carbon footprint results overview: This module clearly presents the results of the LCA carbon accounting, including carbon emissions for each life-cycle stage, construction-stage statistics, bar and pie charts depicting emissions and their respective proportions across stages, and allows for comparison of multiple carbon accounting scenarios to identify potential carbon reduction measures.
3.2. Graphic User Interface (GUI) Design
The Graphical User Interface (GUI) is one of the visible components of the software. This software was developed using the LayUI interface library, leveraging the Windows 11 22H2 operating system and coding tools such as Sublime Text and Visual Studio Code.
In the design of the panel menu, the software utilizes the LayUI interface library to create both the frontend and backend systems. The frontend system includes project management and member management, aiming to provide a platform for carbon accounting and carbon reduction in construction projects. The backend system includes project management, user customization, database management, and system management, aiming to provide a unified platform for editing and managing projects, models, and members. For example, in project management, when the “Project List” option is clicked on, data is asynchronously requested from the backend server (operating on CentOS 8.2.2004) using Asynchronous JavaScript and eXtensible Markup Language (AJAX) technology, and is displayed on the frontend as a dynamic table, facilitating easy viewing by the user. Additionally, the “Project Addition” feature uses LayUI’s form components, along with jQuery (JavaScript Library) for data validation, ensuring that the input data adheres to the system’s requirements.
The software operates on the CentOS (Community ENTerprise Operating System) 8.2 2004 platform, with Nginx (Engine X) 1.18 acting as the web server responsible for processing client Hypertext Transfer Protocol (HTTP) requests and forwarding them to the PHP (Hypertext Preprocessor) 7.3 engine. PHP-7.3, in conjunction with MySQL (My Structured Query Language) 5.6, collaborates to provide data support for the panel menu operations.
For permission management, the software uses LayUI’s event mechanism and Cookie technology. When the frontend sends a request, it includes user authentication information, which is validated by the backend using PHP session management mechanisms. For example, in the planEdit operation, the backend performs a detailed check on the user’s request based on their assigned permissions. Only users with the corresponding permissions are allowed to complete the operation, ensuring the security of the system and the integrity of the data.
As shown in Figure 8, the software’s user interface is depicted, highlighting its structure and GUI design in use.
3.3. Frontend-Backend System Integration
In the carbon accounting software, the frontend and backend systems work closely together to ensure the smooth operation of the software. After logging in, the user can select a model to build, choose the appropriate database, and specify the life-cycle accounting stages. The user then determines the data input method for the construction phase and clicks on the carbon accounting function to display the carbon accounting results for the selected model. If the user exits before completing the process, the data is automatically saved to the backend to prevent data loss.
The backend runs on CentOS (Community ENTerprise Operating System) 8.2 2004, with Nginx (Engine X) 1.18 serving as the web server. The PHP (Hypertext Preprocessor) 7.3 engine and MySQL (My Structured Query Language) 5.6 database handle the business logic. The frontend accepts user commands and inputs, transmitting the data to the backend through an Application Programming Interface (API). For example, after the user selects the database and accounting stages, the frontend sends a request, which is received by the backend PHP code. Using the MySQLi (MySQL Improved) extension, the backend processes the data by filtering it based on the selected stages and returns the results to the frontend for display. The seamless coordination between the frontend and backend ensures smooth operation of the software, aiming to provide users with a more efficient carbon accounting service.
As shown in Figure 9, the software’s frontend-backend workflow chart is illustrated, highlighting the interaction and data transfer between layers and data flow.
4. Engineering Case Studies
4.1. Project Overview
To assess the computational capabilities of the proposed carbon accounting system for construction projects, and analyze life-cycle carbon emission patterns for better mitigation strategies, this study applies the developed software system to three real-world infrastructure construction projects, including (1) the Yuhang Huawu-Fuyang Gaoqiao section of National Highway 320 (NH320), (2) the Hangzhou-Shaoxing segment of the Hangzhou-Ningbo National Expressway (HSY Expressway), and (3) Section 3 of the Changchun-Shenzhen Expressway (G25) expansion project in Hangzhou (National Highway G25), as shown in Figure 10. These three projects, all located within Zhejiang Province, China, offer a unique opportunity to compare life-cycle carbon emissions in the same region, providing valuable insights into regional carbon management practices. The representativeness of these projects lies in their diversity and scale, covering a range of infrastructure types, including highways, expressways, and large-scale expressway expansions. For example, the Yuhang Huawu to Fuyang Gaoqiao section of NH320 handles over 100,000 vehicles daily, the HSY Expressway spans 4.560 km and enhances regional connectivity, and the 35.418 km expansion of the G25 Changchun-Shenzhen Expressway involves complex components like bridges and tunnels. These projects represent a diverse range of infrastructure, from highways to expressways, with varying scales and complexities, providing a diverse dataset for validating the proposed carbon accounting method. The comparison is essential for refining carbon emission factors and improving the accuracy of carbon accounting in large-scale infrastructure construction projects. The three key infrastructure projects within Zhejiang Province, China are detailed as follows,
1. National Highway 320 (NH320), Yuhang Huawu to Fuyang Gaoqiao Section
The Yuhang Huawu to Fuyang Gaoqiao section of National Highway 320 (NH320) is an 8.673 km long road project designed as a dual six-lane, first-class highway. Located between Yuhang District and Fuyang District in Zhejiang Province, this section plays a pivotal role in enhancing the connectivity of Zhejiang’s urban centers. The construction of this road will significantly reduce travel time between major cities and boost the economic development of the surrounding areas.
2. Hangzhou-Shaoxing-Ningbo Expressway (HSY Expressway)
The Hangzhou-Shaoxing-Ningbo Expressway (HSY Expressway), connecting Hangzhou, Shaoxing, and Ningbo, covers a segment of 4.560 km and is a vital transportation artery for the Yangtze River Delta metropolitan area. This project, located along the southern coast of Hangzhou Bay, is designed to improve regional connectivity and support economic growth in one of China's most developed regions. The expressway’s construction will contribute to alleviating traffic congestion, promoting regional commerce, and facilitating the implementation of national economic strategies of China.
3.Changchun-Shenzhen Expressway (G25), Expansion Project in Hangzhou
The expansion of Section 3 of the Changchun-Shenzhen Expressway (G25) in Hangzhou covers a length of 35.418 km. This large-scale infrastructure project involves the construction of subgrades, bridges, tunnels, interchanges, and other critical components. The G25 expansion is an essential project that will enhance the transportation network between Hangzhou and other major cities, thereby improving logistics and supporting urban development. With its focus on modernizing infrastructure, this project also helps demonstrate the application of advanced technologies in road construction.
The geographical locations and construction site layouts of these projects are illustrated in Figure 10, with key project specifications summarized in Table 6, and related statistics of life-cycle data listed in Table 7. In the production stage, the types and quantities of materials are determined based on the materials required during the preparation stage, just before the project begins. In the construction stage, due to the large volume of data, the direct importation of the bill of quantities is employed to ensure the accuracy of the calculations. In the use stage, the maintenance lists are established based on the “Technical Specifications of Maintenance for Highway (JTG H10-2009)” [41] and “Technical Specifications for Maintenance of Highway Asphalt Pavement (JTG 5142-2019)” [42]. In combination with a 25-year project operation period [43], the lists for replacement processes, electricity consumption, and water consumption are determined . The end-of-life stage is assessed by onsite surveys, information provided by the project team, and demolition data from the engineering department, which help establish the lists for waste transportation methods and distances. In the supplementary stage, data is collected through field research, project team information, and actual project conditions to determine the number of plants, the spacing between them, the types and quantities of reusable materials, and the amount of wood products used.
To ensure consistency in carbon accounting results across all projects, the customized ICE was used for analysis. During the construction stage, data integration was achieved directly through the bill of quantities, while other stages (production, use, end-of-life, and supplementary) may rely on manual data entry. Due to space constraints, the paper only covers a selective subset of visuals for demonstration of software interface, where Figure 11 displays the carbon accounting interface for the construction stage of National Highway G25, while Figure 12 shows the aggregated results across all stages.
4.2. Carbon Accounting Results and Comparative Analysis
With the developed software, the life-cycle carbon emission in real-world construction engineering projects can be estimated by systematically integrating construction engineering cost data into the online carbon accounting platform, and utilizing the customized ICE for carbon emission factors. As shown in Figure 13, the bar and pie charts illustrate total emissions and the distribution of emissions across different stages, respectively. The small-scale National Highway 320 project emitted 4.25×10⁴ kgCO₂e, with stage-wise contributions of 46% for production stage, 30% for construction stage, 17% for use stage and 7% for end-of-life stage. The contribution from use stage is based on the assumption of a 25-year service life, incorporating carbon emissions from the use of alternative materials, electricity consumption, and water usage during the operational stage, all of which are integrated into the platform’s calculations. The medium-scale Hangzhou-Shaoxing-Ningbo Expressway project emitted 2.13×10⁸ kgCO₂e, with corresponding contributions of 46% (production), 30% (construction), 18% (use), and 6% (end-of-life). Similarly, the large-scale National Highway G25 project recorded 8.34×10⁹ kgCO₂e, with the following contributions: 45% (production), 30% (construction), 18% (use), and 7% (end-of-life). Cross-project analysis reveals a consistent distributional pattern for carbon emission in the construction projects: the production stage consistently dominated emissions (≈45%), followed by construction (≈30%), use (≈18%), and end-of-life stages (≈7%). The supplementary stage is the carbon reduction stage. The more materials reused, the higher the content of wood products, and the more greenery planted in the project, the greater the carbon reduction will be. In all three projects, the proportion of carbon sequestration through greening in the supplementary stage is the highest, reaching 80.1%, 79.8%, and 84.3%, respectively. In the future, the amount of green vegetation can be increased, or the material reuse rate and the proportion of wood products in materials can be increased, to achieve the goal of carbon neutrality.
The building material-level analysis (Figure 14) reveals the dominance of cement across all projects, accounting for 51.0-53.6% of emissions in the production stage. Secondary materials vary by project: crushed stone (18.1%) and steel reinforcement (10.0%) in National Highway 320 project; steel reinforcement (18.8%) and stone (9.8%) in the Hangzhou-Shaoxing-Ningbo Expressway project; insulation materials (17.9%) and crushed stone (10.1%) in National Highway G25 project. Notably, the top five materials collectively contribute 82.0-84.6% of emissions, with cement alone contributing over 51% in each project. This pattern suggests that optimizing cement production and exploring alternative low-carbon adhesives could yield significant emissions reductions.
In this work, particular attention is paid to the construction stage, due to its complexity in carbon quantification, substantial human activity, and significant mitigation potential. The existing research gaps in construction-stage emissions measurement also require further investigation. Our model leverages construction cost quota to enable more accurate quantitative analysis of this stage, as shown in Figure 15, the carbon emissions of the top three sub-projects in each of the three projects are significantly higher than those of the remaining sub-projects. From the fourth sub-project, there is a significant decline in carbon emissions. Therefore, a focused analysis is conducted on the top three sub-projects for each project as follows.
For National Highway 320 project, the carbon emissions in the construction stage are approximately 1.32×10⁴ kgCO₂e. The top sub-projects account for 67.24% of the total emissions, with the top three sub-projects contributing 51.01% of the emissions. For the Hangzhou-Shaoxing-Ningbo Expressway project, the carbon emissions in the construction stage are about 6.63×10⁷ kgCO₂e. The top eight sub-projects contribute 67.53% of the total emissions, and the top three sub-projects account for 51.05%. For National Highway G25 project, the carbon emissions in the construction stage are approximately 2.61×10⁹ kgCO₂e. The top eight sub-projects contribute 66.35% of the total emissions, with the top three sub-projects contributing 44.76%.
These results indicate that the top three sub-projects in each project contribute over 44% of the total carbon emissions in the construction stage, highlighting substantial carbon reduction potential. Therefore, to achieve more effective carbon mitigation, it is crucial to focus on the emissions from material transport, construction installation, and machinery usage for the top three carbon-emitting sub-projects in the construction stage of the above projects.
5. Comparison of Carbon Emission Estimation Based on Different Databases
5.1. Similarities in Carbon Emission Estimated by the Three Customized Databases
To assess the consistency and accuracy of carbon accounting results across different databases, a comparison was conducted based on data from three real-world construction projects. By analyzing the carbon emissions calculated through three distinct databases, we can better understand the variations and potential causes behind these differences. Table 8 shows the total carbon emissions for the three projects calculated using the three databases, while Figure 16, Figure 17, Figure 18, Figure 19, Figure 20 and Figure 21 present life-cycle carbon accounting results for National Highway 320, Hangzhou-Shaoxing-Ningbo Expressway, and National Highway G25 using the customized EU-EFDB and IPCC-EFDB. These results, in conjunction with Figure 13, Figure 14 and Figure 15 (representing carbon emission accounting results with the customized ICE), reveal both differences and similarities.
Although the carbon accounting results from the three databases exhibit differences in specific values, they show a high degree of consistency in overall trends. For instance, in the case of the entire life-cycle carbon emissions of the National Highway 320 project, the proportion of carbon emissions across different stages exhibits similar trends across all three databases. In the production stage (as shown in Figure 13, Figure 16 and Figure 19), the carbon accounting proportion is 45.61% for the customized ICE, 45.72% for the customized EU-EFDB, and 46.52% for the customized IPCC-EFDB. The values are close, with deviations of less than 1%, demonstrating that the use stage is the primary source of carbon emissions in the LCA results for this project, a trend that remains consistent across all three databases. Additionally, the order of materials in terms of carbon emissions is also consistent across the three databases. For the National Highway G25 project (as shown in Figure 14, Figure 17 and Figure 20), cement, insulation materials, gravel, steel reinforcement, and plastic are consistently the top five materials contributing to carbon emissions in the production stage, with only minor differences in the specific proportions, but the ranking remains the same.
Furthermore, in the carbon emissions proportion of sub-projects, the results from the three databases also show a high degree of similarity. For example, in the Hangzhou-Shaoxing-Ningbo Expressway project (as shown in Figure 15, Figure 18 and Figure 21), whether considering carbon accounting values or carbon emissions intensity, the top five sub-projects by proportion of emissions are consistently subgrade soil, excavation works, pavement surface layers, special subgrade treatment works, protective works, and tunnel works. The carbon emissions proportion error is within 3%, also indicating a high level of consistency.
5.2. Differences in Carbon Emission Estimated by the Three Customized Databases
Upon analyzing the carbon accounting results for the National Highway 320, Hangzhou-Shaoxing-Ningbo Expressway, and National Highway G25 projects, some differences were also observed in the results from the different databases. Specifically, the carbon accounting result for the National Highway 320 project was highest in the customized EU-EFDB, with a total carbon emission of 1.29×10⁵ kgCO₂e, followed by 4.25×10⁴ kgCO₂e in the customized ICE and 3.50×10⁴ kgCO₂e in the customized IPCC-EFDB. The EU-EFDB result was 206.03% higher than that of ICE and 262.50% higher than that of IPCC-EFDB.
For the Hangzhou-Shaoxing-Ningbo Expressway project, the highest carbon accounting value was found in the customized IPCC-EFDB, with a total carbon emission of 6.54×10⁸ kgCO₂e. This was followed by 5.99×10⁸ kgCO₂e in the customized EU-EFDB and 2.13×10⁸ kgCO₂e in the customized ICE. The IPCC-EFDB value was 8.54% higher than EU-EFDB and 25.94% higher than ICE.
In the case of the National Highway G25 project, the carbon accounting result was highest in the customized ICE, with a total carbon emission of 8.39×10⁹ kgCO₂e. This was followed by 3.35×10⁹ kgCO₂e in the customized IPCC-EFDB and 3.29×10⁹ kgCO₂e in the customized EU-EFDB. The ICE value was 112.14% higher than IPCC-EFDB and 111.11% higher than EU-EFDB.
These discrepancies arise from differences in carbon emission factors, calculation methods, and the estimation techniques used for different materials and construction phases across the databases. A more detailed analysis of the causes for these differences, broken down by stage, is provided as follows,
National Highway 320 (EU-EFDB > ICE > IPCC-EFDB)
In the production stage, cement accounted for 51.4% of carbon emissions, and the carbon emission factor in the customized EU-EFDB (0.88 kgCO₂e/kg) was 60.00% higher than the customized ICE (0.55 kgCO₂e/kg) and 66.04% higher than the customized IPCC-EFDB (0.53 kgCO₂e/kg). In the construction stage, the extensive use of cement concrete mixing stations in the road surface, cast-in-place concrete, and reinforced concrete led to the customized EU-EFDB having the highest carbon emission factor (63.96 kgCO₂e/h), which was 11.20% higher than the customized ICE (57.51 kgCO₂e/h) and 15.99% higher than the customized IPCC-EFDB (55.14 kgCO₂e/h). In the use stage, the higher electricity consumption of the project facilities along the route caused the customized EU-EFDB to have the highest carbon accounting value. In the end-of-life stage, the project primarily used road transportation for waste disposal, and the carbon emission factor for this phase was highest in the customized EU-EFDB, at 1.12×10⁻⁴ kgCO₂e/(kg·km), which was higher than the customized ICE (1.10×10⁻⁴ kgCO₂e/(kg·km)) and the customized IPCC-EFDB (1.09×10⁻⁴ kgCO₂e/(kg·km)).
Hangzhou-Shaoxing-Ningbo Expressway (IPCC-EFDB > EU-EFDB > ICE)
In the production stage, steel accounted for 18.80% of carbon emissions, and the carbon emission factor for steel in the customized IPCC-EFDB (2.67 kgCO₂e/kg) was 8.54% higher than the customized EU-EFDB (2.46 kgCO₂e/kg) and 25.94% higher than the customized ICE (2.12 kgCO₂e/kg). In the construction stage, the heavy use of double steel wheel vibratory rollers for subgrade soil and excavation works led to a carbon emission factor of 76.46 kgCO₂e/h in the customized IPCC-EFDB, which was 11.22% higher than the customized EU-EFDB (68.75 kgCO₂e/h) and 15.82% higher than the customized ICE (66.02 kgCO₂e/h). In the operational stage, the high replacement of steel resulted in the highest carbon accounting value in the customized IPCC-EFDB. In the end-of-life stage, since waste was mainly reused on-site, the customized IPCC-EFDB had the highest carbon emission factor at 5.0×10⁻³ kgCO₂e/kg, which was higher than the customized EU-EFDB (4.5×10⁻³ kgCO₂e/kg) and the customized ICE (4.3×10⁻³ kgCO₂e/kg).
National Highway G25 (ICE > IPCC-EFDB > EU-EFDB)
In the production stage, the use of materials like rock wool boards for tunnel construction led to a higher carbon emission factor in the customized ICE (1.99 kgCO₂e/kg) compared to the customized IPCC-EFDB (1.54 kgCO₂e/kg), a difference of 29.22%, and compared to the customized EU-EFDB (1.49 kgCO₂e/kg), a difference of 33.56%. In the construction stage, electrical equipment such as axial flow fans led to higher carbon emissions, and the customized ICE showed the highest carbon emission factor at 1.37 kgCO₂e/h, which was 29.47% higher than the customized IPCC-EFDB (1.06 kgCO₂e/h) and 34.90% higher than the customized EU-EFDB (1.01 kgCO₂e/h). In the use stage, the project’s high water consumption caused the carbon emission factor to be highest in the customized ICE (1.41 kgCO₂e/m³), which was 16.53% higher than the customized IPCC-EFDB (1.21 kgCO₂e/m³) and 38.24% higher than the customized EU-EFDB (1.02 kgCO₂e/m³). In the end-of-life stage, the project primarily used landfill disposal for waste, and the customized ICE had the highest carbon emission factor at 0.012 kgCO₂e/kg, which was 9.09% higher than the customized IPCC-EFDB (0.011 kgCO₂e/m³) and 33.33% higher than the customized EU-EFDB (0.009 kgCO₂e/m³).
5.3. Discussions
When conducting life-cycle assessment (LCA) carbon accounting for construction projects using three different databases, the following two comments may be considered to help ensure the effective and rational use of the databases,
1. Weighed average of carbon emission databases
By integrating the characteristics of each database, a weighted method of 1:1:1 can be employed for carbon accounting, giving equal weight to the three databases. For example, when calculating the weighted carbon accounting value for a specific stage, if the carbon accounting value from the customized ICE is denoted as A, the value from the customized EU-EFDB is B, and the value from the customized IPCC-EFDB is C, the final weighted carbon accounting value for this stage is calculated as (A×1 + B×1 + C×1) ÷ (1 + 1 + 1) = (A + B + C) ÷ 3. Using this method, the carbon emissions for the product stage of National Highway 320 would be 3.25×10⁴ kgCO2e. This equal-weighted integration approach combines the advantages of each database, minimizing the limitations of relying on a single database. Table 9 presents the carbon emission accounting results after applying the 1:1:1 weighting of the three databases to the three different projects.
2. Focus on the progress of carbon monitoring technologies and industry standards in construction
Currently, carbon monitoring technologies are still under development, and the construction industry has yet to establish unified, mature carbon emission monitoring standards. As a result, the accuracy of carbon accounting continues to face significant uncertainty. However, with gradual technological advancements, the precision of carbon accounting methods is expected to improve substantially in the future. Emerging technologies, such as a novel blockchain-based carbon auditing tool designed to support the life-cycle assessment of photovoltaic systems [44], are gradually being adopted within the construction sector. The maturation and widespread implementation of these technologies will significantly enhance the timeliness and accuracy of carbon emission data. Concurrently, as industry standards within construction continue to be established and refined, the regulatory framework and consistency of carbon accounting will steadily improve [45]. Therefore, the future accuracy of carbon accounting will rely heavily on these technological innovations and the advancement of construction industry standards.
6. Final Remarks
This study establishes a comprehensive framework of carbon emission accounting for real-world construction projects, covering method development, database customization, and the implementation of web-based accounting software. Validation across three infrastructure construction projects—National Highway 320, Hangzhou-Shaoxing-Ningbo Expressway, and National Highway G25—has led to several key findings and recommendations, while also identifying challenges that may be pertinent to carbon accounting in the context of China’s construction industry.
The developed web-based platform, grounded in life-cycle assessment (LCA) principles, has demonstrated practical feasibility through its application in various construction projects. These case calculations have validated the platform’s ability to perform complex carbon accounting tasks for construction projects, especially in the construction stage, where the software can directly import the bill of quantities data to calculate carbon emissions based on construction cost quotas. However, the validation of calculation precision may rely on future advancements in carbon monitoring technologies.
A cross-project analysis revealed consistent emission patterns, with the proportion of emissions across stages following a ratio of approximately 45:30:18:7:3 (production: construction: use: end-of-life: supplementary). The results show that the production stage consistently dominates the emissions profile, contributing between 45.3% and 45.6% of the total emissions, with the top three materials responsible for over 79.1% of the emissions. Additionally, a high concentration of emissions is found in the construction stage, with the top five sub-projects accounting for 67.47% of emissions. Notably, the selection of the database significantly influences the emission results, with a variance of 14% to 33% in stage-specific emissions, emphasizing the need for context-sensitive database selection.
Differences observed between the customized ICE, EU-EFDB, and IPCC-EFDB primarily come from the interaction between the projects and the databases. The EU-EFDB excels in locally material-intensive projects such as National Highway 320, where cement contributes 51.4% of emissions. The IPCC-EFDB provides high precision for steel-reliant designs, as seen in the Hangzhou-Shaoxing-Ningbo Expressway, where steel accounts for 18.8% of emissions. The ICE is more suited for specialized constructions like the National Highway G25, where tunnel emissions account for 47.52%. To mitigate database biases, a weighted composite method has been proposed, which can be useful in reducing individual database biases.
The possible challenges identified for further applications in construction industry are, (1) the customization of carbon accounting methods to better reflect China’s regional construction practices, (2) the need for strengthened updates to carbon emission factors to reflect technology progresses, and (3) the enhancement of database compatibility to domestic software platforms. This research framework provides a practical methodological approach while emphasizing the need for standardized protocols and ongoing improvements in the databases.
In conclusion, this research aims to contribute to the development of carbon accounting methods and tools, with the hope of providing more insights for carbon reduction in the China’s construction industry. The findings and the proposed framework are also expected to serve as a valuable reference for future studies and practical applications in carbon management and decarbonization efforts in other sectors.
Data Availability
The data and tools related with this research can be made accessible upon request.
Competing Interests
The authors declare no competing interests.
Author Contributions
Methodology Conceptualization: Yuechen Wu, Fushen Liu; Data Curation: Yuechen Wu; Localized Database Development: Yuechen Wu, Wenxuan Deng, Sanpo Jike; Computational Methods & Software Development: Fushen Liu, Yuechen Wu; Data Acquisition: Chaofeng Zhang, Yanzhao Liu; Manuscript Preparation: Yuechen Wu, Fushen Liu; Correspondence: Fushen Liu. All authors have reviewed and approved the final version for publication.
Funding
This research was supported by the ZJU-ZCCC Institute of Collaborative Innovation (Grant No. ZDJG2021005).
Acknowledgments
We would like to express our gratitude to Zhejiang Communications Construction Group Co., Ltd. for providing the construction-related data and facilitating the field trips to the construction sites.
References
- Pan, X. Towards a sustainable net-zero future: energy and economic transition amid global warming; proceedings of the The 4th International Academic Conference on Environmental Resources and Energy Engineering, Zhuhai, Guangdong Province, China, F, 2024.
- Zhiqi Z, Yongqiang C, Meiyan F, et al. Role of CO2 geological storage in China's pledge to carbon peak by 2030 and carbon neutrality by 2060. Energy, 2023, 272.
- Qiao H, Liu J. Research on the challenges and path of China's energy transformation under the goal of "Carbon Neutrality" based on the law of international energy transformation; proceedings of the Proceedings of the 2nd International Symposium on Innovation Management and Economics, online conference, F, 2022.
- Sun Y, Chen L, Gao M, et al. Exploration of establishing a unified carbon accounting method in the field of public buildings; proceedings of the The 4th International Academic Conference on Environmental Resources and Energy Engineering, Zhuhai, Guangdong Province, China, F, 2024.
- Song Y, Zhang H, Mo H. A LCA-based optimization method of green ecological building envelopes: a case study in China; proceedings of the 2020 International Conference on New Energy,Power and Environmental Engineering(NEPEE2020), Xiamen, Fujian Province, China, F, 2020.
- Trabucco D, Perrucci G. Steel–Timber hybrid buildings: a comparative life cycle assessment study of global warning potential impacts. Sustainability, 2025, 17(2) : 718-.
- Zhao L, Guo C, Chen L, et al. Using BIM and LCA to calculate the life cycle carbon emissions of inpatient building: a case study in China. Sustainability, 2024, 16(13) : 5341-.
- Shaukat M M, Luqman M, Asif M, et al. A theoretical framework to promote LCA in the construction industry of Saudi Arabia. Sustainability, 2024, 16(9).
- Ma L, Azari R, Elnimeiri M. A building information modeling-based life cycle assessment of the embodied carbon and environmental impacts of high-rise building structures: a case study. Sustainability, 2024, 16(2).
- Ciacci C, Bazzocchi F. Retrofitting of the Italian precast industrial building stock. LCA analysis as decision-making tool. Journal of Cleaner Production, 2024, 478: 143933-.
- Hemmati M, Messadi T, Gu H, et al. LCA operational carbon reduction based on energy strategies analysis in a mass timber building. Sustainability, 2024, 16(15) : 6579-.
- Zhan Z, Xia P, Xia D. Study on carbon emission measurement and influencing factors for prefabricated buildings at the materialization stage based on LCA. Sustainability, 2023, 15(18).
- Warrier G A, Palaniappan S, Habert G. Classification of sources of uncertainty in building LCA. Energy & Buildings, 2024, 305: 113892-.
- Wang, H. Study on carbon emission calculation and prediction of Guangxi Expressway Construction, Master Thesis, Guangxi University, 2022.
- Zhang R, Zhang H, Hei S, et al. Research on database construction and calculation of building carbon emissions based on BIM general data framework. Sustainability, 2023, 15(13).
- Symons, K. Book review: embodied carbon: the inventory of carbon and energy (ICE). A BSRIA guide. Proceedings of the Institution of Civil Engineers - Energy, 2011, 164(4) : 206-.
- Circular Ecology Embodied carbon - the ICE database.(2013-11-05)[2025-02-28].https://circularecology.com/embodied-carbon-footprint-database.html.
- Crippa M, Janssens-Maenhout G, Dentener F, et al. Forty years of improvements in European air quality: regionalpolicy-industry interactions with global impacts. Atmospheric Chemistry and Physics, 2016, 16(6) : 3825-41.
- EMEP/EEA air pollutant emission inventory guidebook 2023.(2024-11-11)[2025-02-24].https://www.eea.europa.eu/en/datahub?size=n_10_n&filters%5B0%5D%5Bfield%5D=issued.date&filters%5B0%5D%5Btype%5D=any&filters%5B0%5D%5Bvalues%5D%5B0%5D=All%20time.
- Muñoz I, Schmidt J, Weidema B P. The indirect global warming potential of methane oxidation in the IPCC’s sixth assessment report. Environmental Research Letters, 2024, 19(12) : 121002-.
- WMO&UNEP. Intergovernmental Panel on Climate Change.(2023-03-09)[2025-02-24].https://www.ipcc-nggip.iges.or.jp/efdb/find_ef.php.
- Zhu W, Feng W, Li X, et al. Analysis of the embodied carbon dioxide in the building sector: A case of China. Journal of Cleaner Production, 2020, 269(prepublish).
- Luo W J, Ma X C, Meng C Y, et al. Carbon emission modeling and analysis of building materialization process. The 3rd International Academic Conference on Green Building and Environmental Management, 2020, : 13.
- Starostka-Patyk, M. New products design decision making support by SimaPro software on the base of defective products management. Procedia Computer Science, 2015, 65(C) : 1066-74.
- Orr, E. Sustainable waste management in schools, Master Thesis, University of Rhode Island, 2021.
- SinoCarbon Technology Co., Ltd. SinoCarbon.(2010-07)[2025-02-28].https://cloud.sinocarbon.cn/product/ecm/.
- Tam W Y V, Le K N, Tran C N N, et al. A review on contemporary computational programs for Building's life-cycle energy consumption and greenhouse-gas emissions assessment: An empirical study in Australia Journal of Cleaner Production, 2018, 172: 4220-30.
- WY. T V, Yijun Z, Chethana I, et al. A critical review on BIM and LCA integration using the ISO 14040 framework. Building and Environment, 2022, (prepublish) : 108865.
- Standard for Quantity Calculation of Housing Construction and Decoration Projects.Ministry of Transport of the People's Republic of China. 2024-12-17.GB/T 50854-2024.
- Quotations for Highway Engineering Budgeting.Ministry of Transport of the People's Republic of China.2018-12-17.JTG/T 3832-2018.
- Standard for Building Carbon Emission Calculation.Ministry of Housing and Urban-Rural Development of the People's Republic of China.GB/T 51366-2019.
- China Academic Journal Electronic Magazine Press. China's Important Conference Paper Database.(2011-06)[2025-02-28].https://cnki.nbsti.net/Kns55/Navi/CPFDInstituteNavi.aspx?NaviID=26&CatalogName=cpfd_xingzhi.
- Yang J, Wang Z, Li G, et al. AutoBPS-carbon: A tool to estimate multi-year dynamic embodied and operational carbon emissions in the building sector. Journal of Building Engineering, 2025, 101: 111942-.
- Melanta S, Miller-Hooks E, Avetisyan H G. Carbon footprint estimation tool for transportation construction projects. Journal of Construction Engineering and Management, 2013, 139(5) : 547-55.
- Cui, P. The establishment of a life-cycle carbon emission factor database for building and research, Master Thesis, Southeast University, 2015.
- General Rules for Calculation of the Comprehensive Energy Consumption.State Administration for Market Regulation and the Standardization Administration of China.2020-09-29.GB/T 2589-2020.
- Intergovernmental Panel on Climate Change. 2006 IPCC Guidelines for National Greenhouse Gas Inventories.(2006-04)[2025-02-28].https://www.ipcc-nggip.iges.or.jp/public/2006gl/chinese/index.html.
- National Development and Reform Commission (NDRC) Office. Guidelines for Corporate Greenhouse Gas Emission Accounting and Reporting (Trial Version).(2013-11-01)[2025-02-28].https://www.ndrc.gov.cn/xxgk/zcfb/tz/201311/t20131101_963960.html.
- The Institution of Structural Engineers. How to calculate embodied carbon.(2025-01-20)[2025-02-28].www.istructe.org.
- Louis Z, M. B D, T. M L, et al. Operational carbon footprint of the U.S. water and wastewater sector’s energy consumption. Journal of Cleaner Production, 2021, 321.
- Technical Specifications of Maintenance for Highway.Ministry of Transport of the People's Republic of China.2010-01-01.JTG H10-2009.
- Technical Specifications for Maintenance of Highway Asphalt Pavement.Ministry of Transport of the People's Republic of China 2019-09-01.JTG 5142-2019.
- The Central People's Government of the People's Republic of China. Regulations on the Administration of Toll Highways.(2004-11-01)[2025/02/28].https://www.gov.cn/zwgk/2005-05/23/content_241.htm.
- Luo Y, Shen J, Liang H, et al. Carbon monitoring, reporting and verification (MRV) for cleaner built environment: Developing a solar photovoltaic blockchain tool and applications in Hong Kong's building sector. Journal of Cleaner Production, 2024, 471: 143456-.
- Martin R, Maria B, Marcella R M S. Embodied carbon emissions of buildings and how to tame them. One Earth, 2023, 6(11) : 1458-64.
Figure 1.
Summary and organization of the current work.
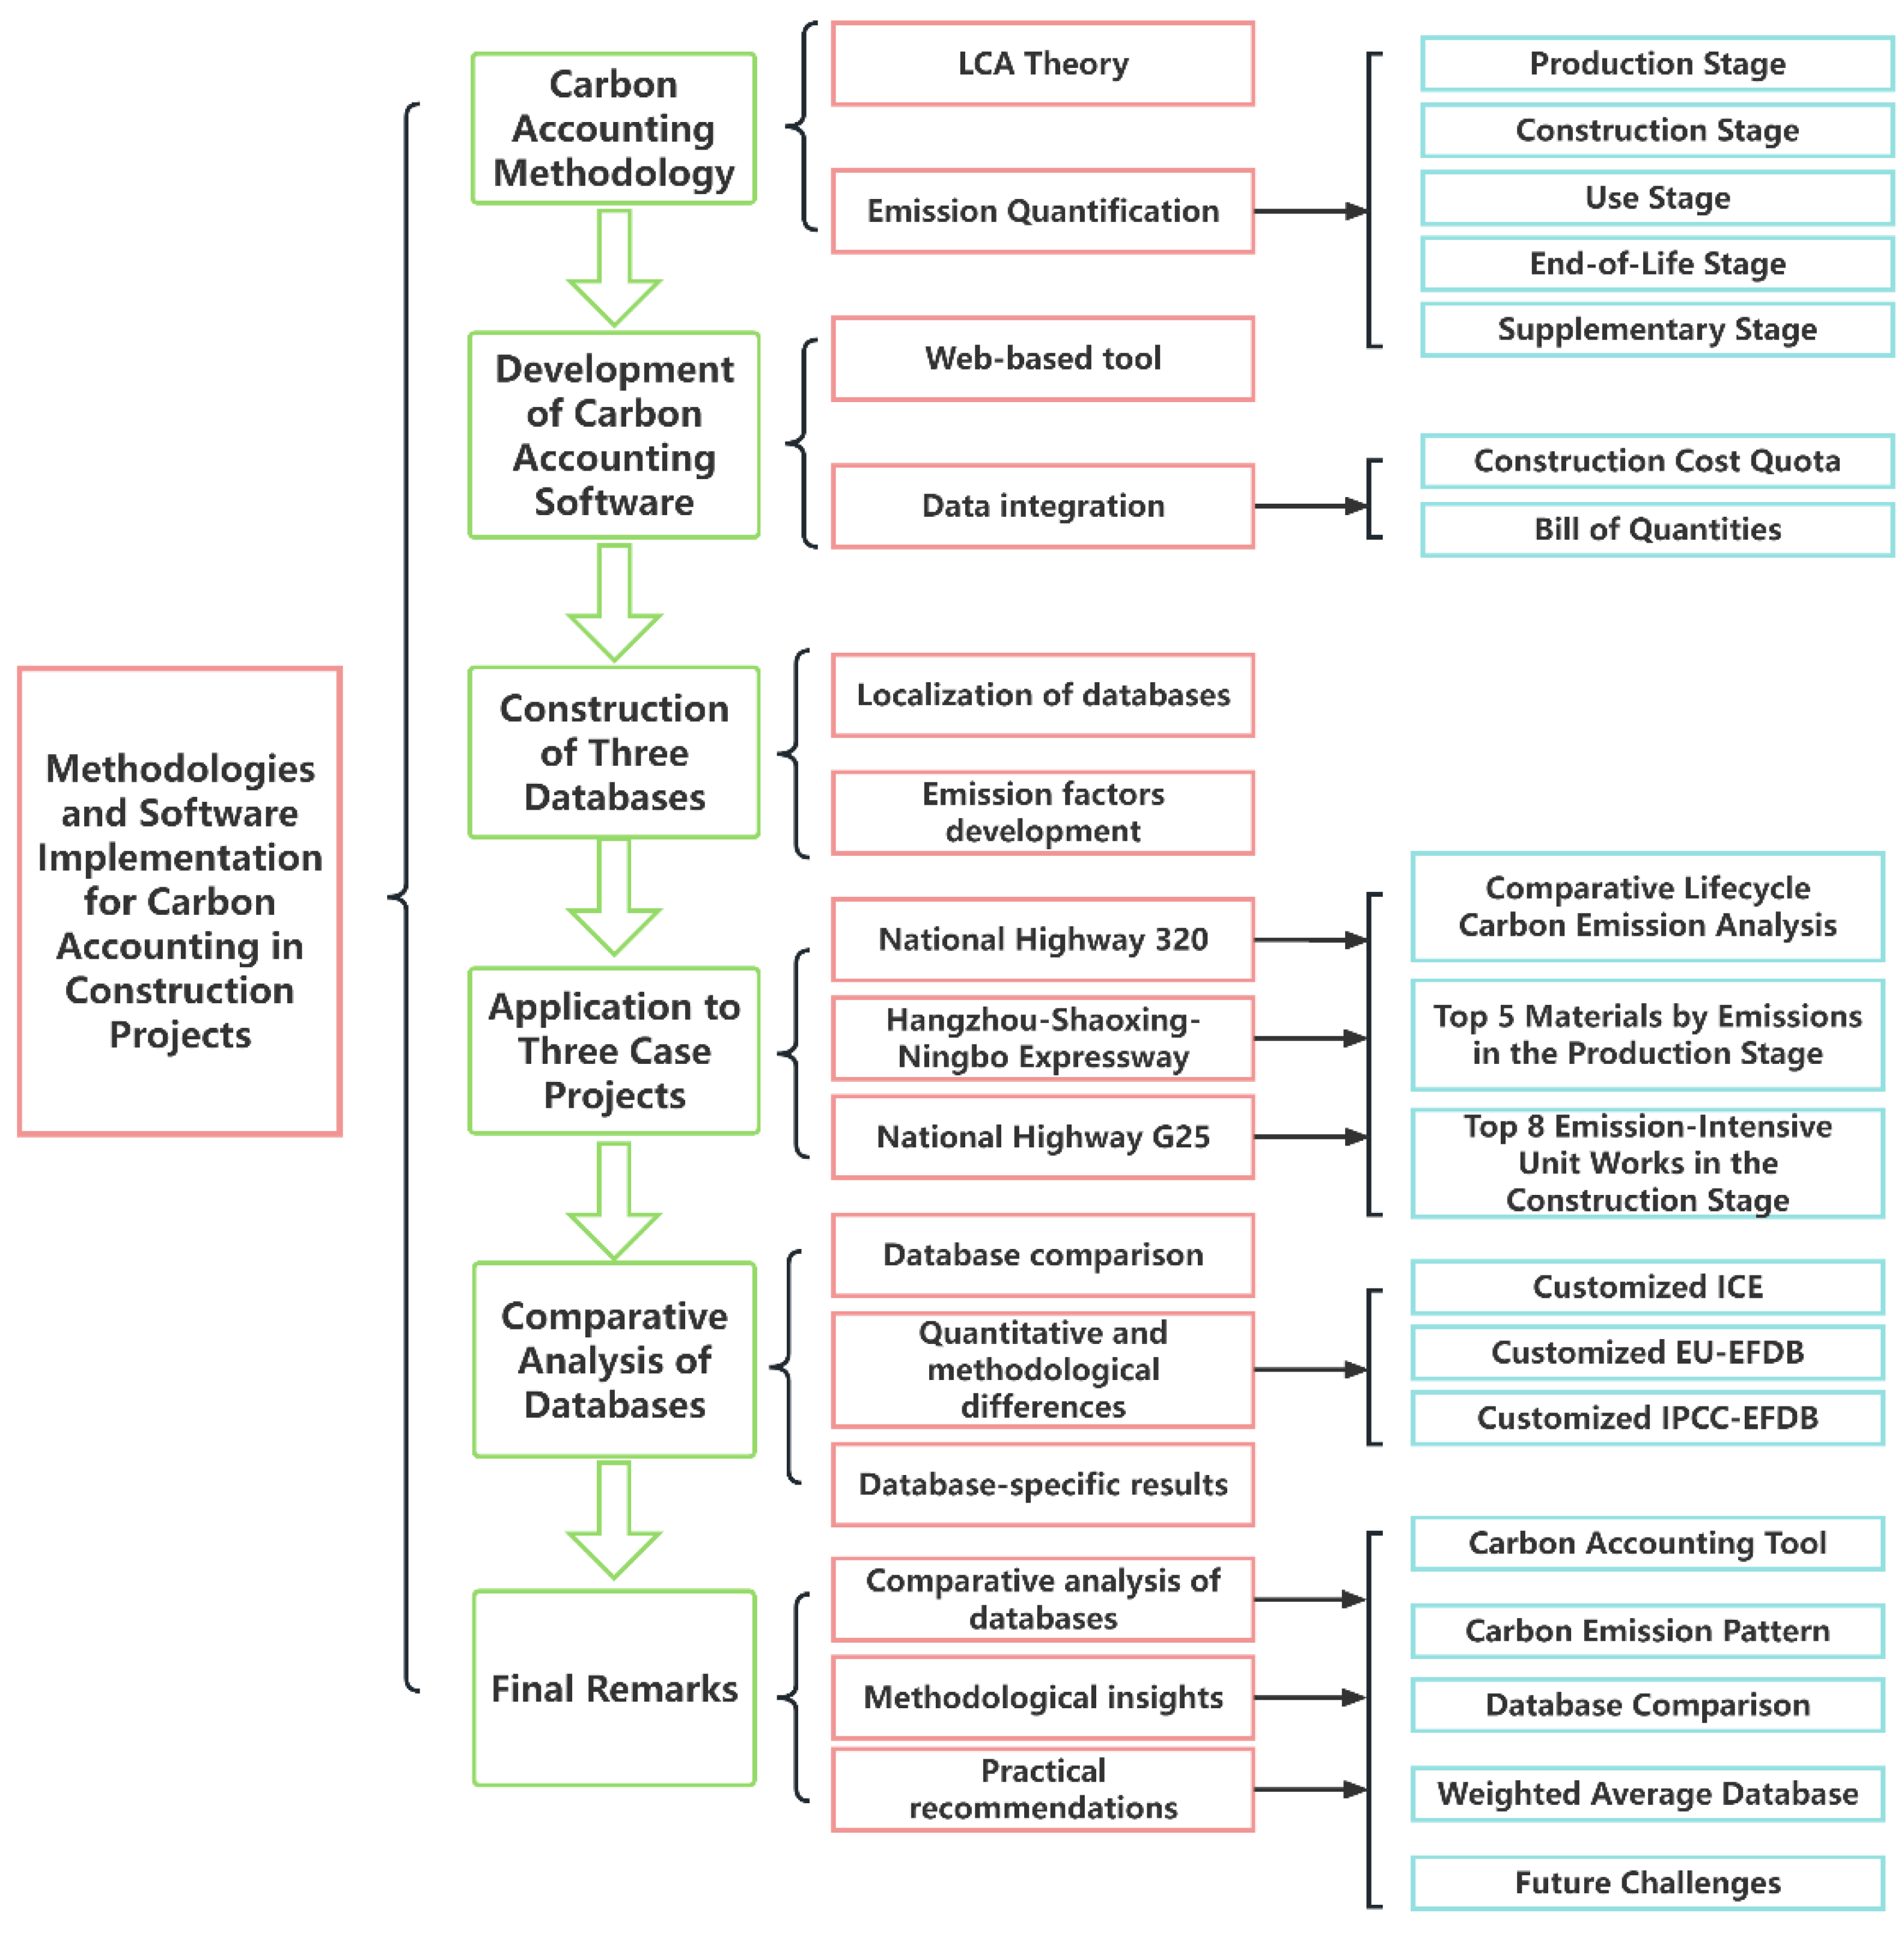
Figure 2.
System boundaries for carbon emission in construction projects.
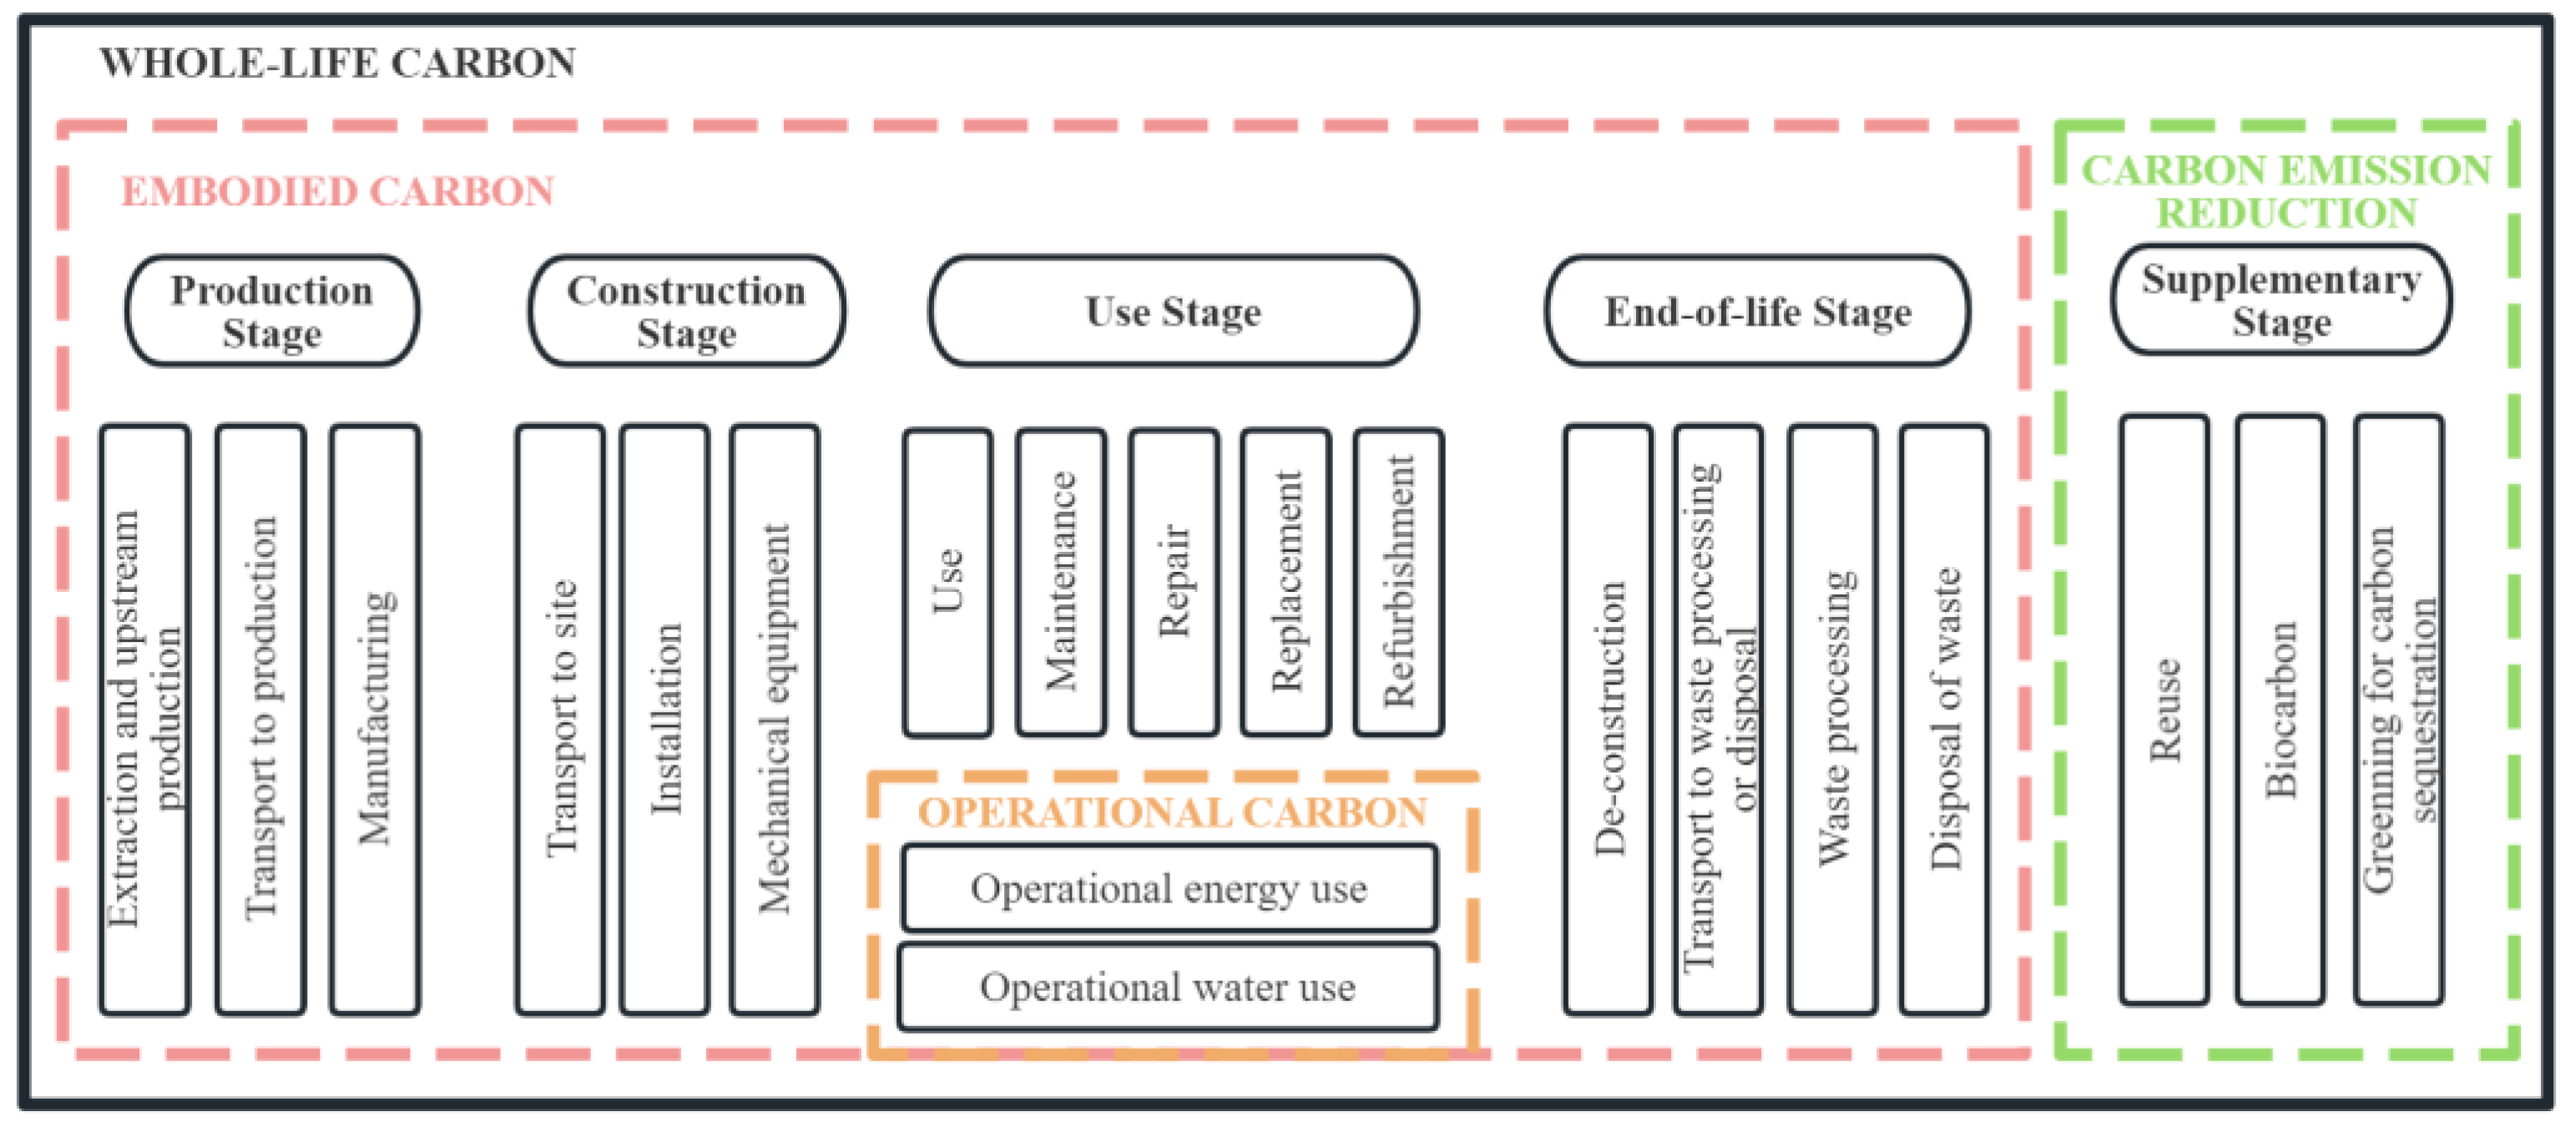
Figure 3.
Integration of construction cost quota data and bill of quantities for calculating construction-stage carbon emission.
Figure 3.
Integration of construction cost quota data and bill of quantities for calculating construction-stage carbon emission.
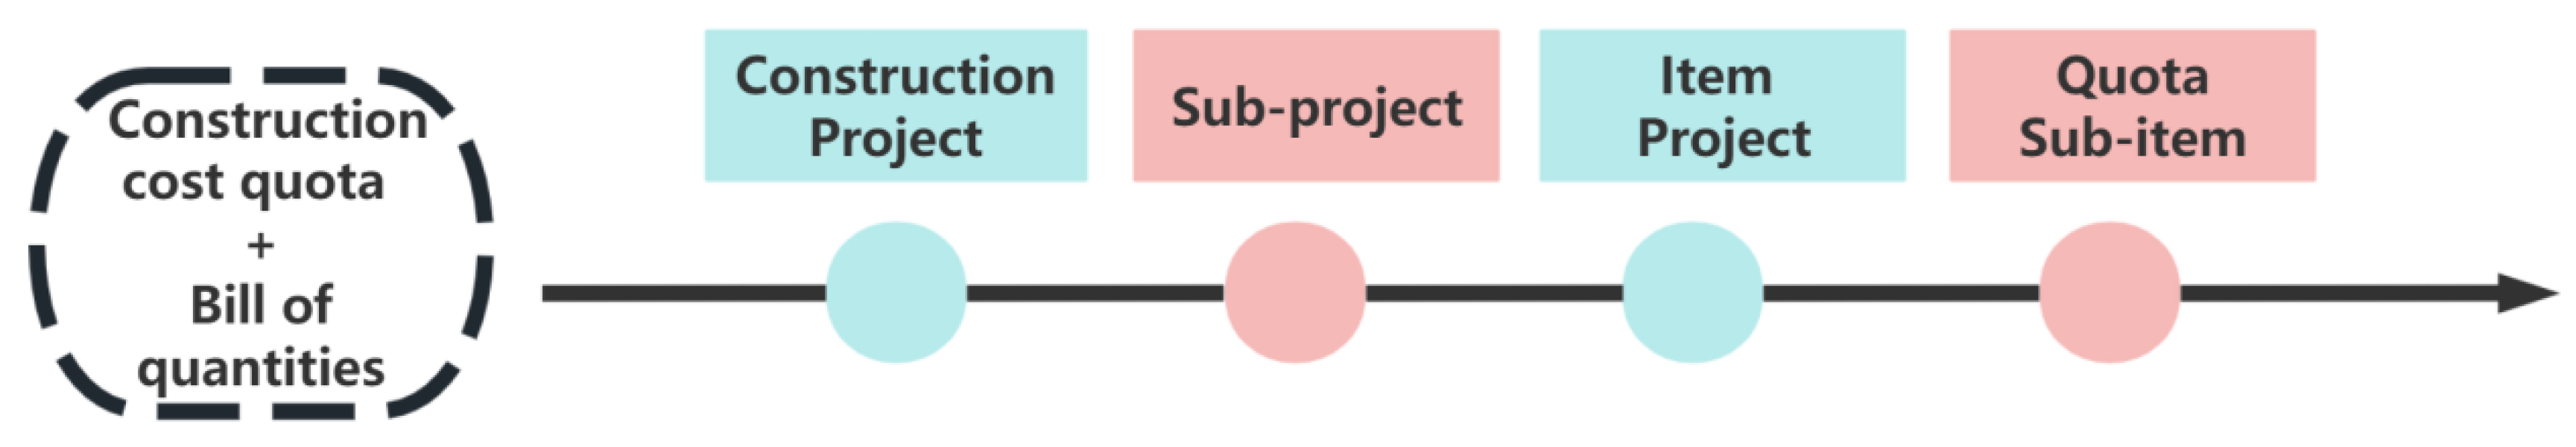
Figure 4.
Hierarchical calculation of carbon emission in the construction stage, exemplified by the National Highway 320 project.
Figure 4.
Hierarchical calculation of carbon emission in the construction stage, exemplified by the National Highway 320 project.
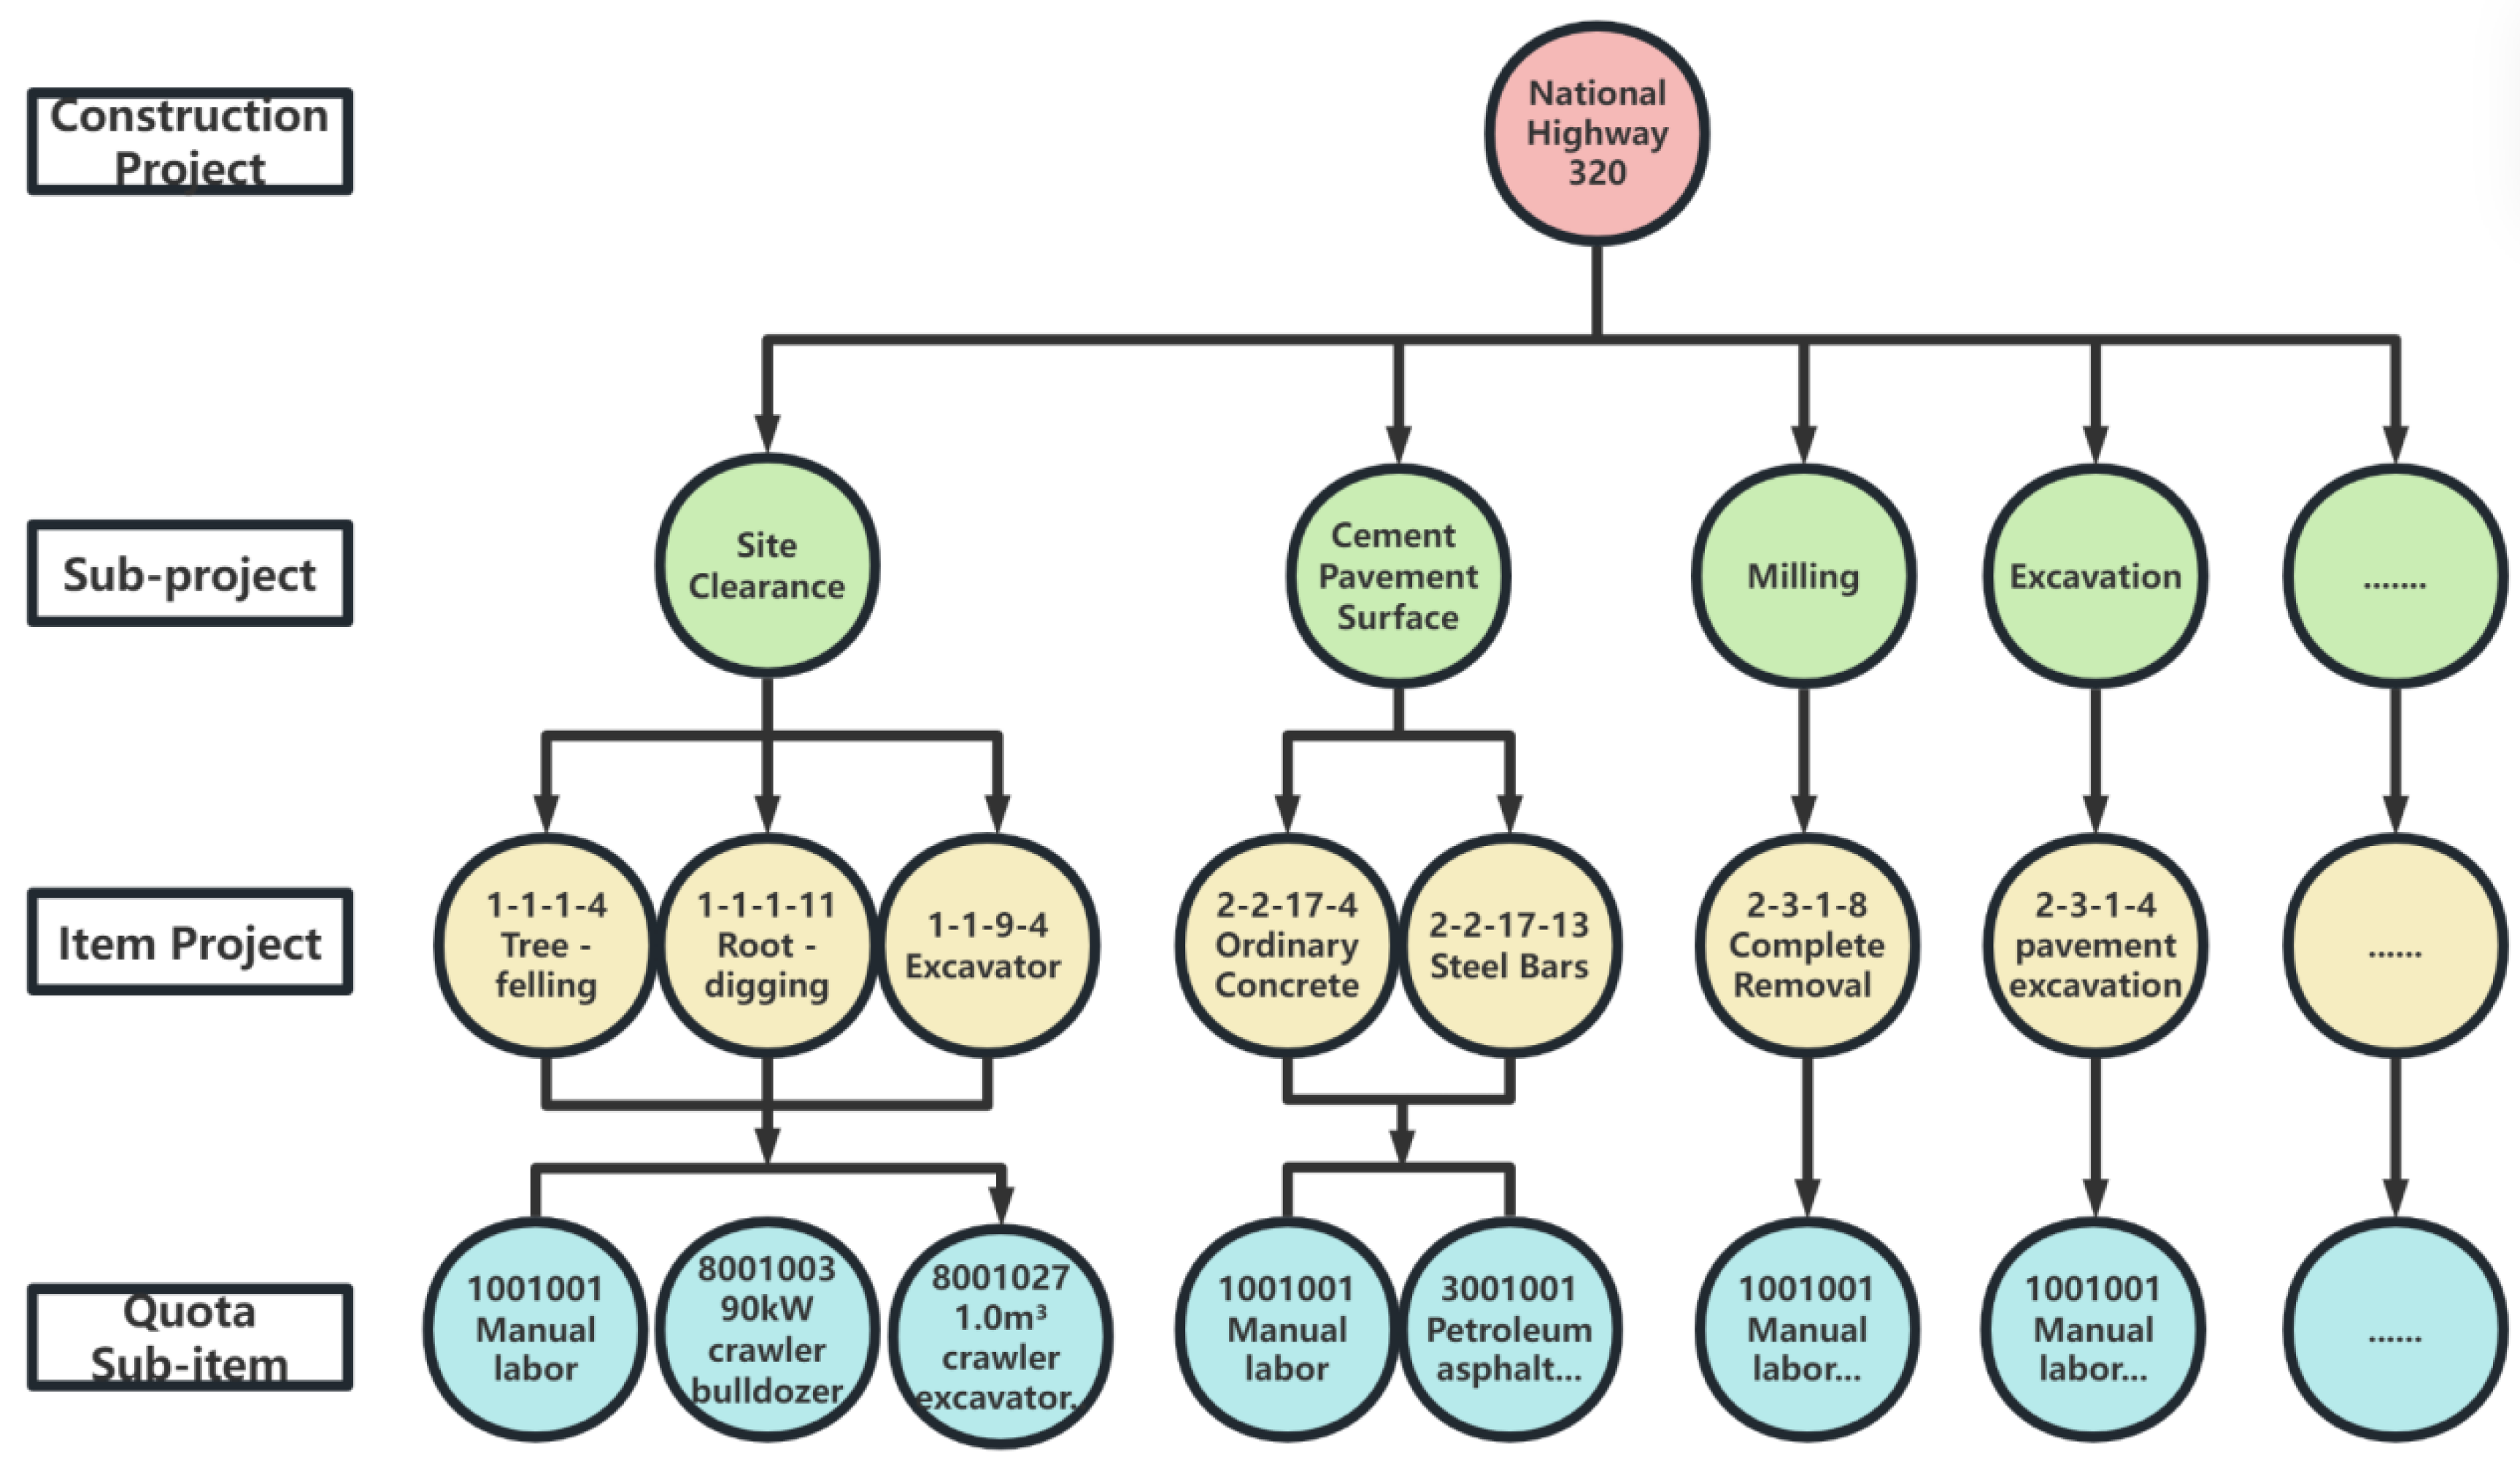
Figure 5.
Workflow for compiling the customized carbon emission factor databases for specific construction projects.
Figure 5.
Workflow for compiling the customized carbon emission factor databases for specific construction projects.
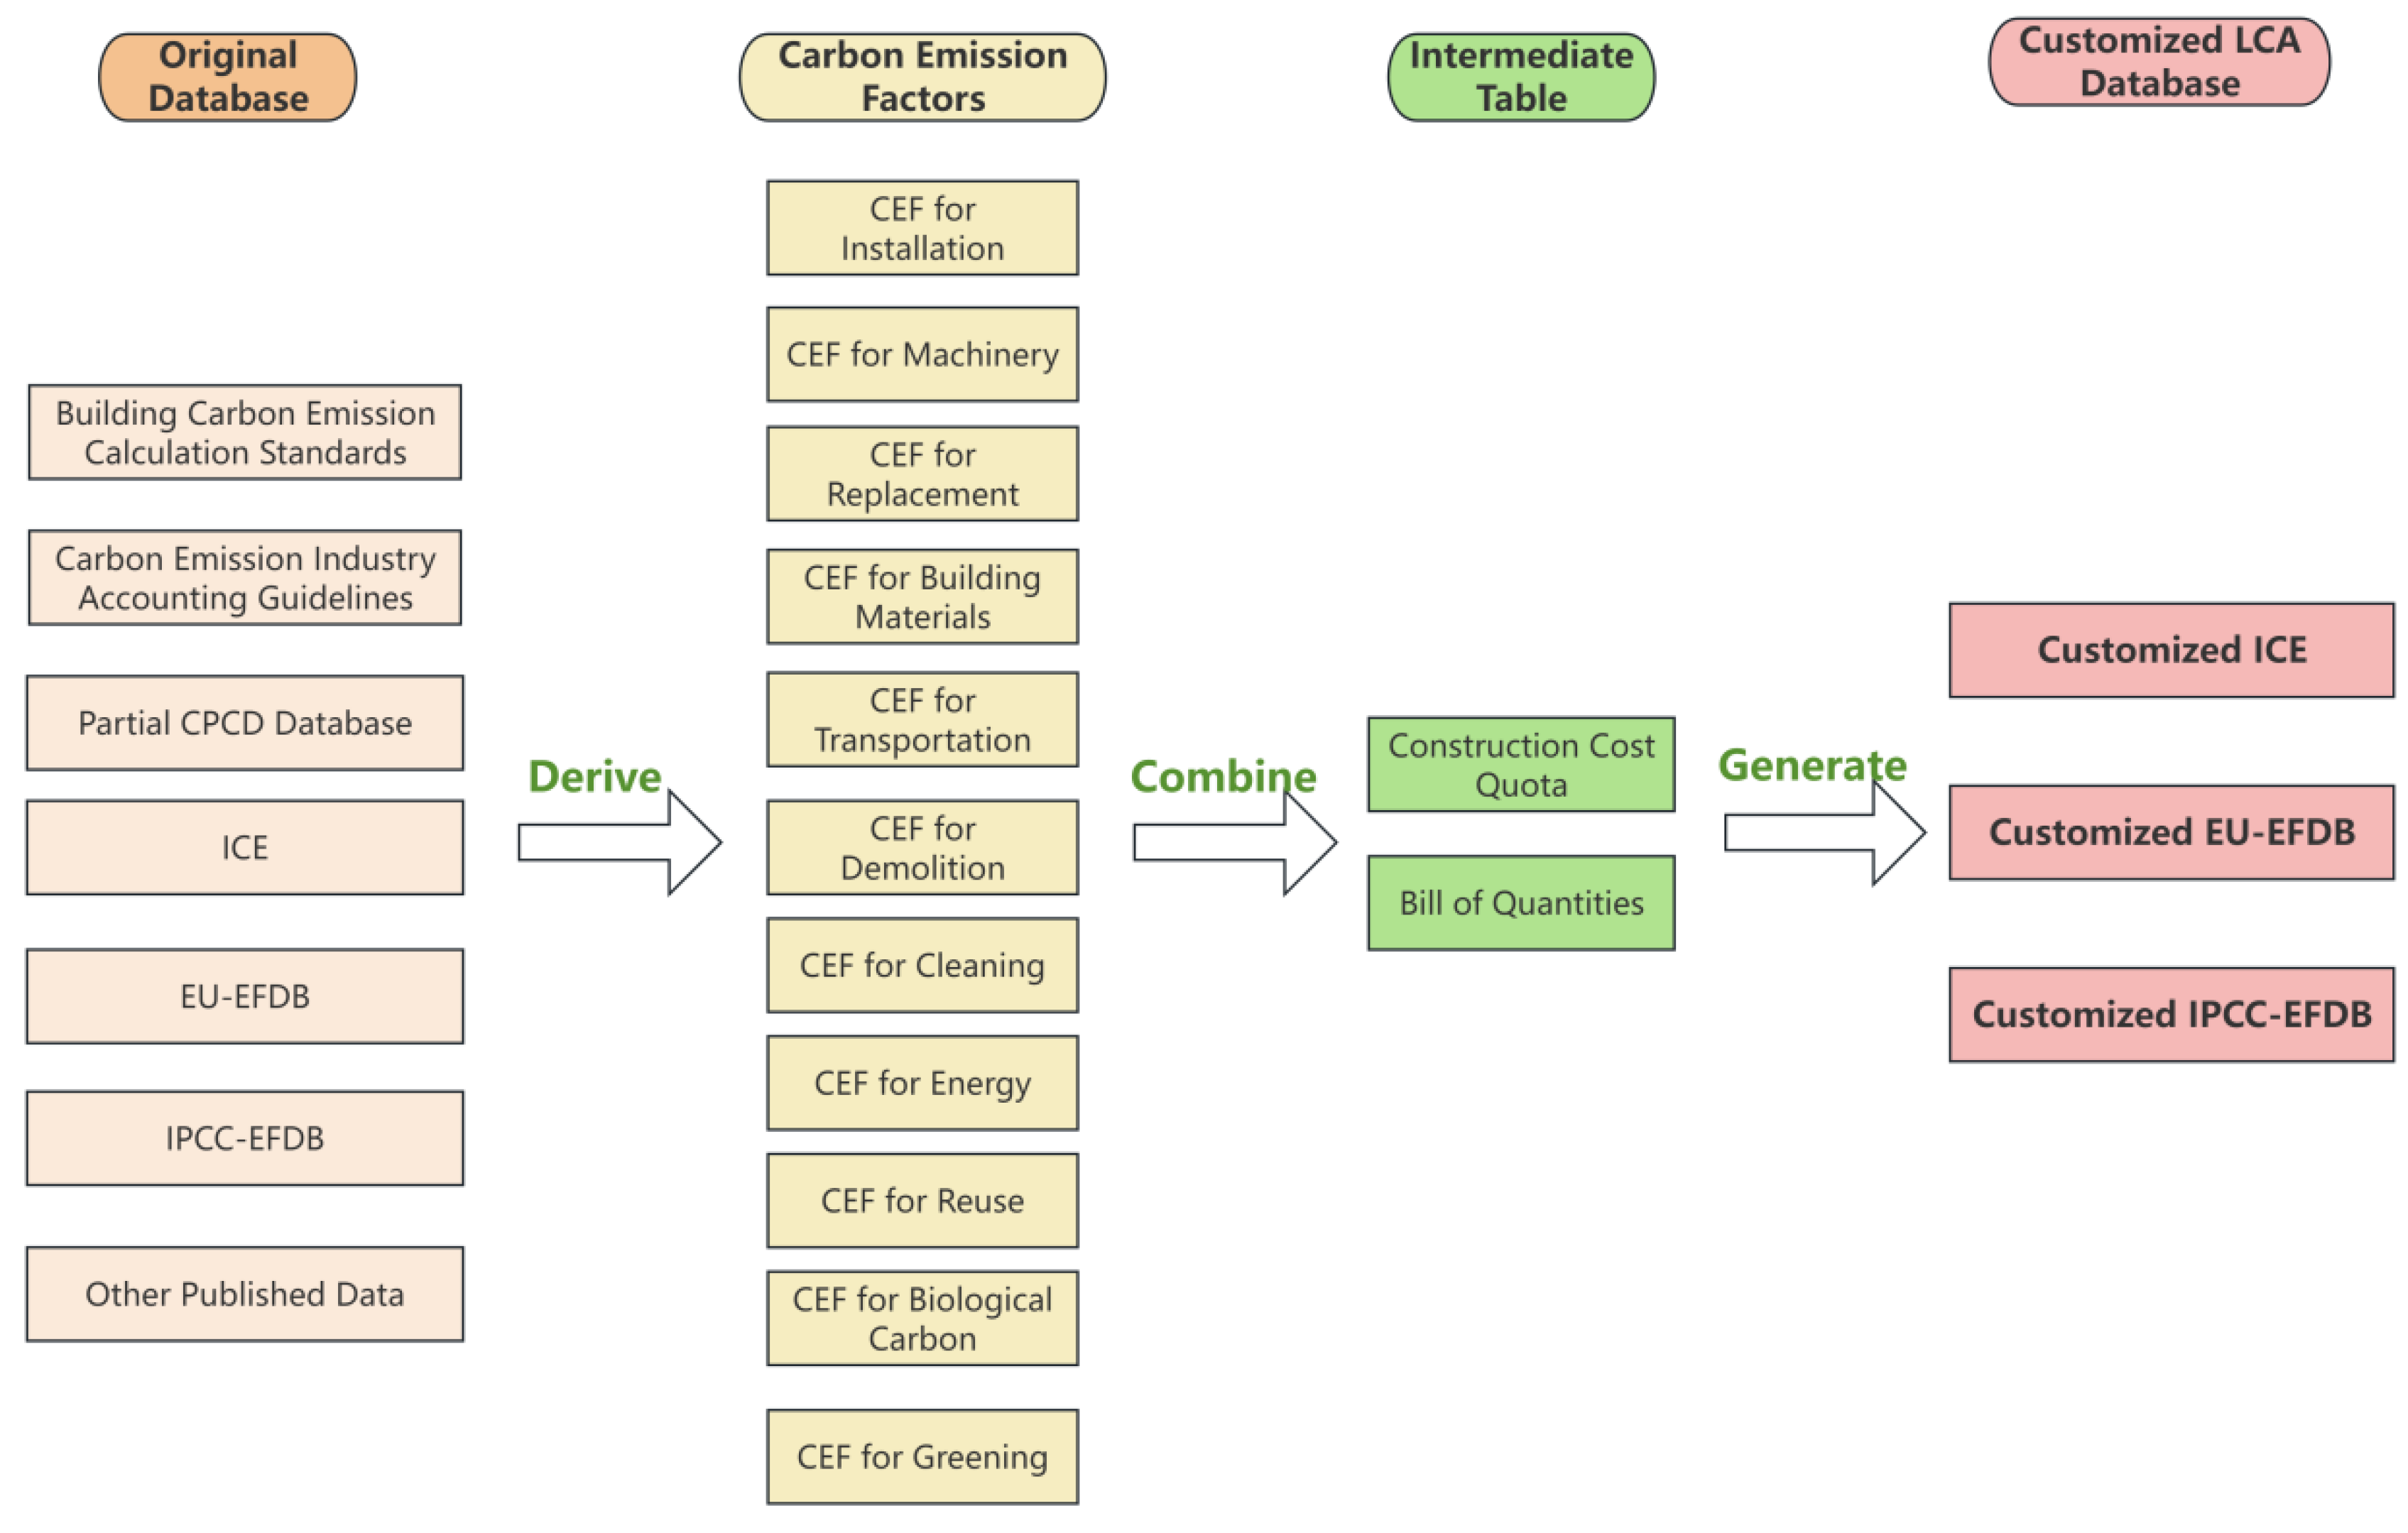
Figure 6.
Enhanced E-R diagram of the customized carbon emission factor databases.
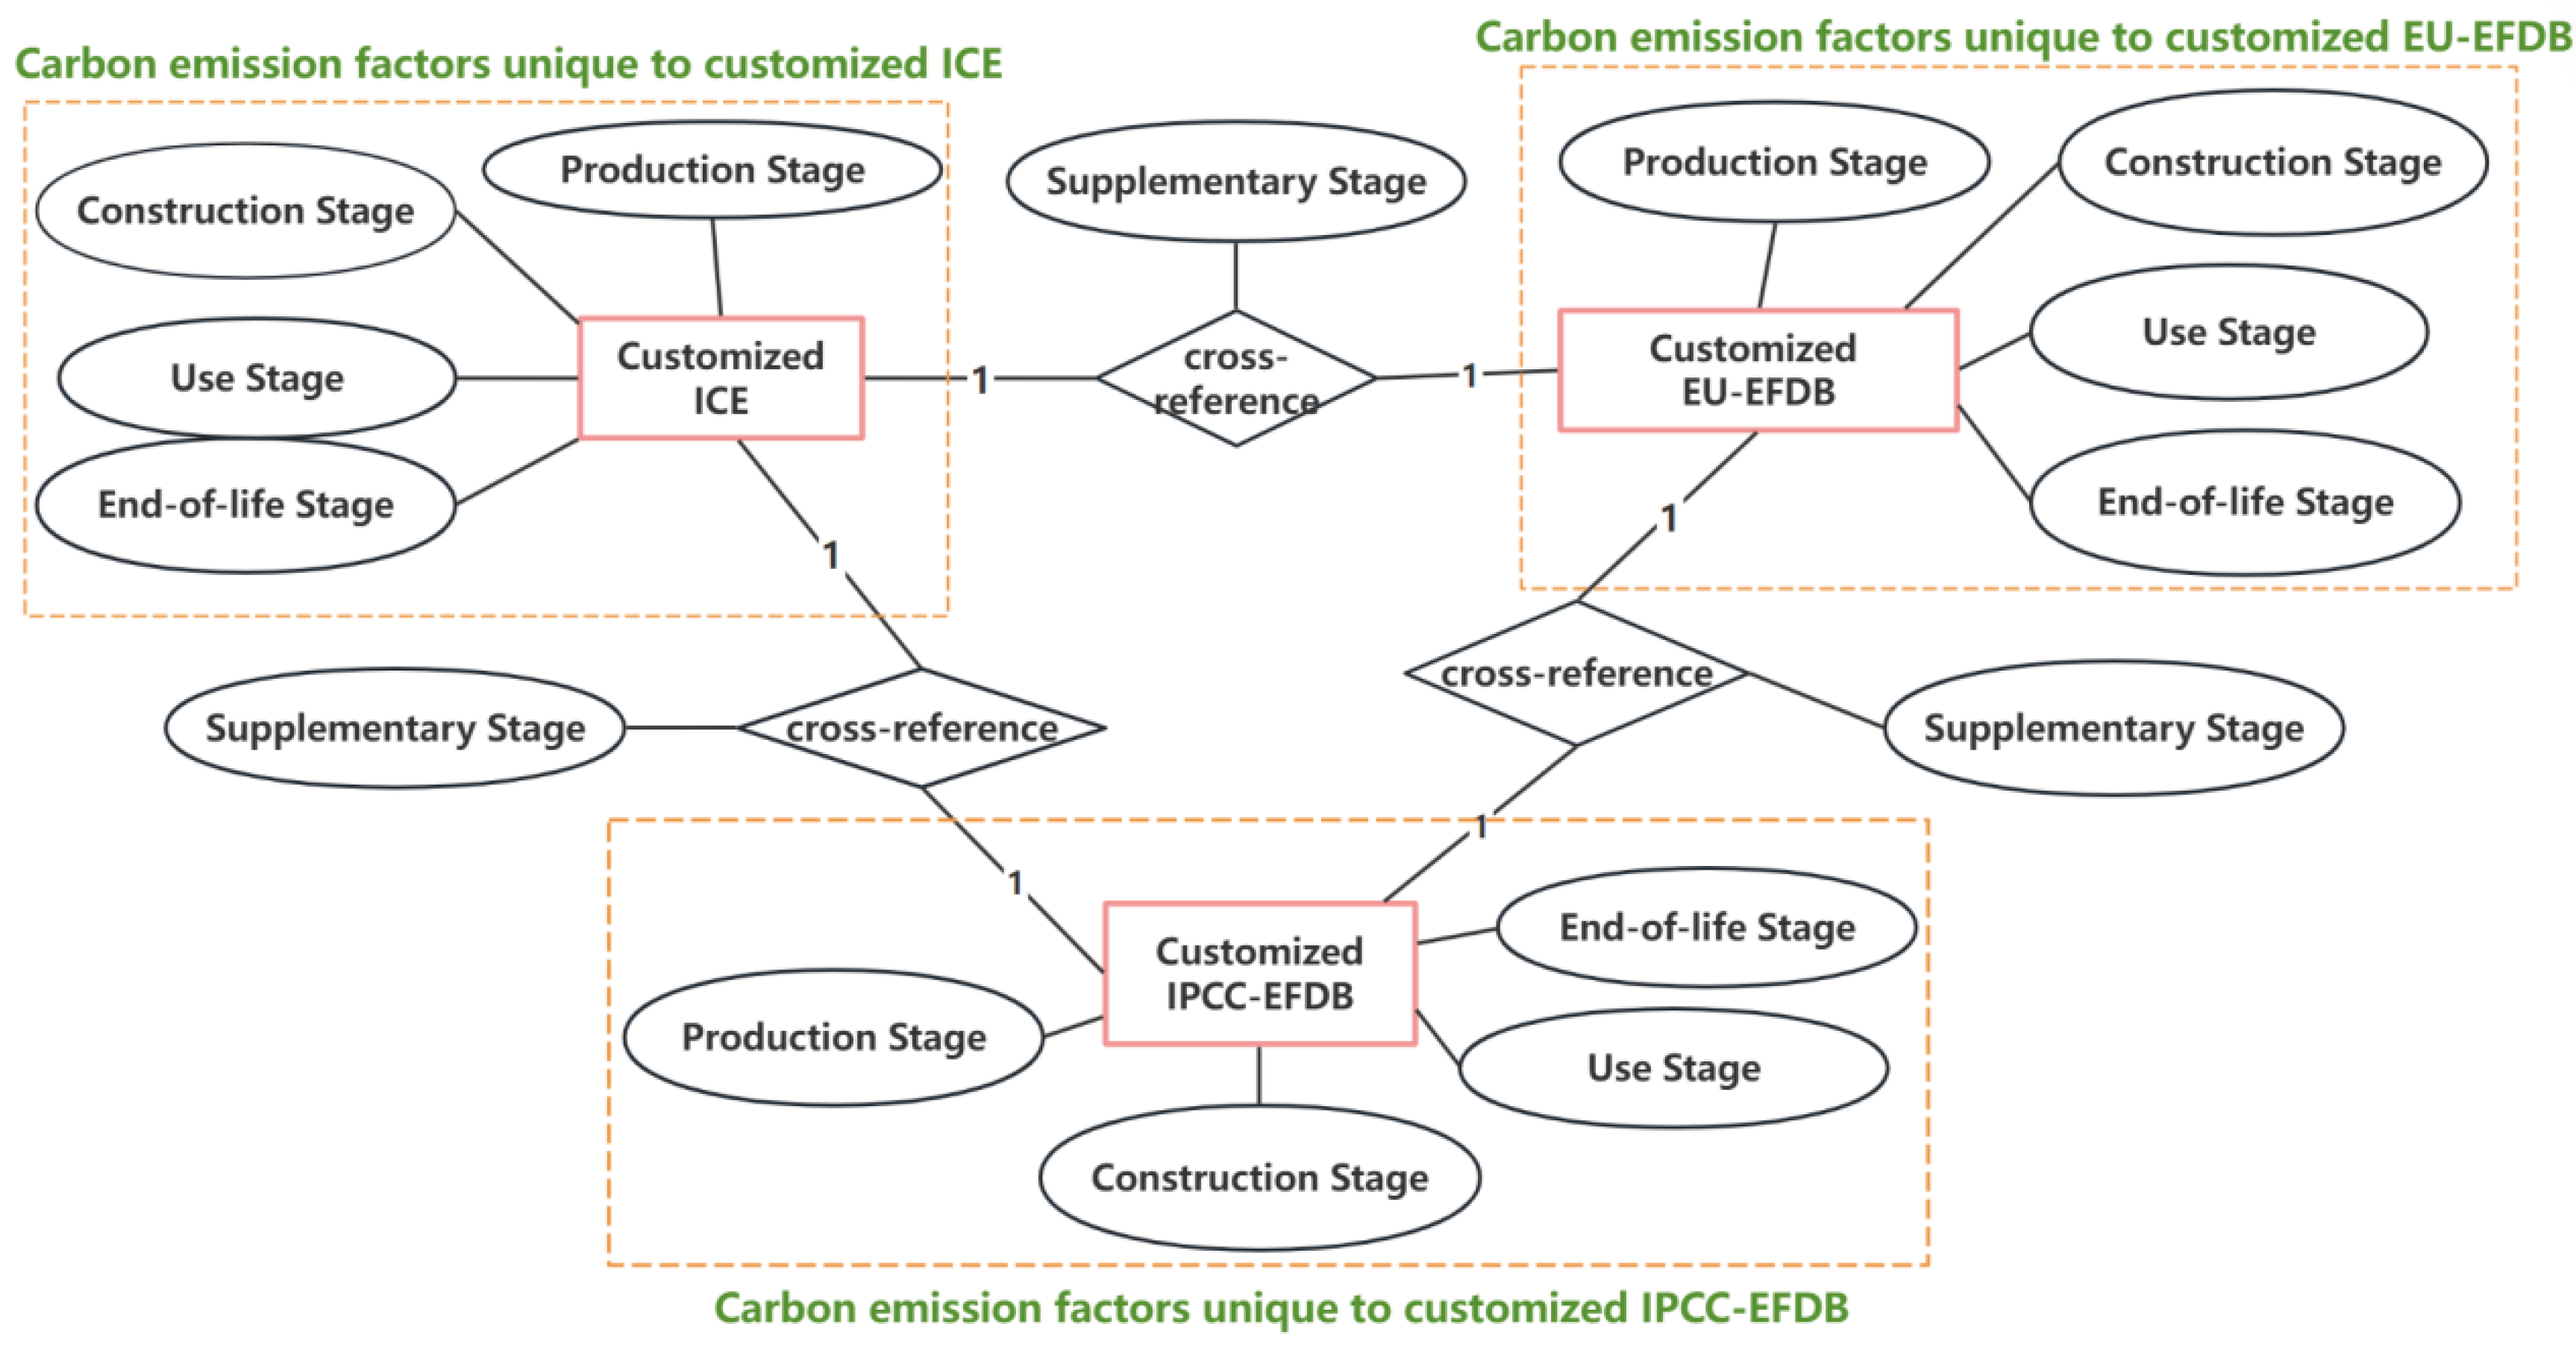
Figure 7.
Design framework for the web-based carbon emission accounting tool.
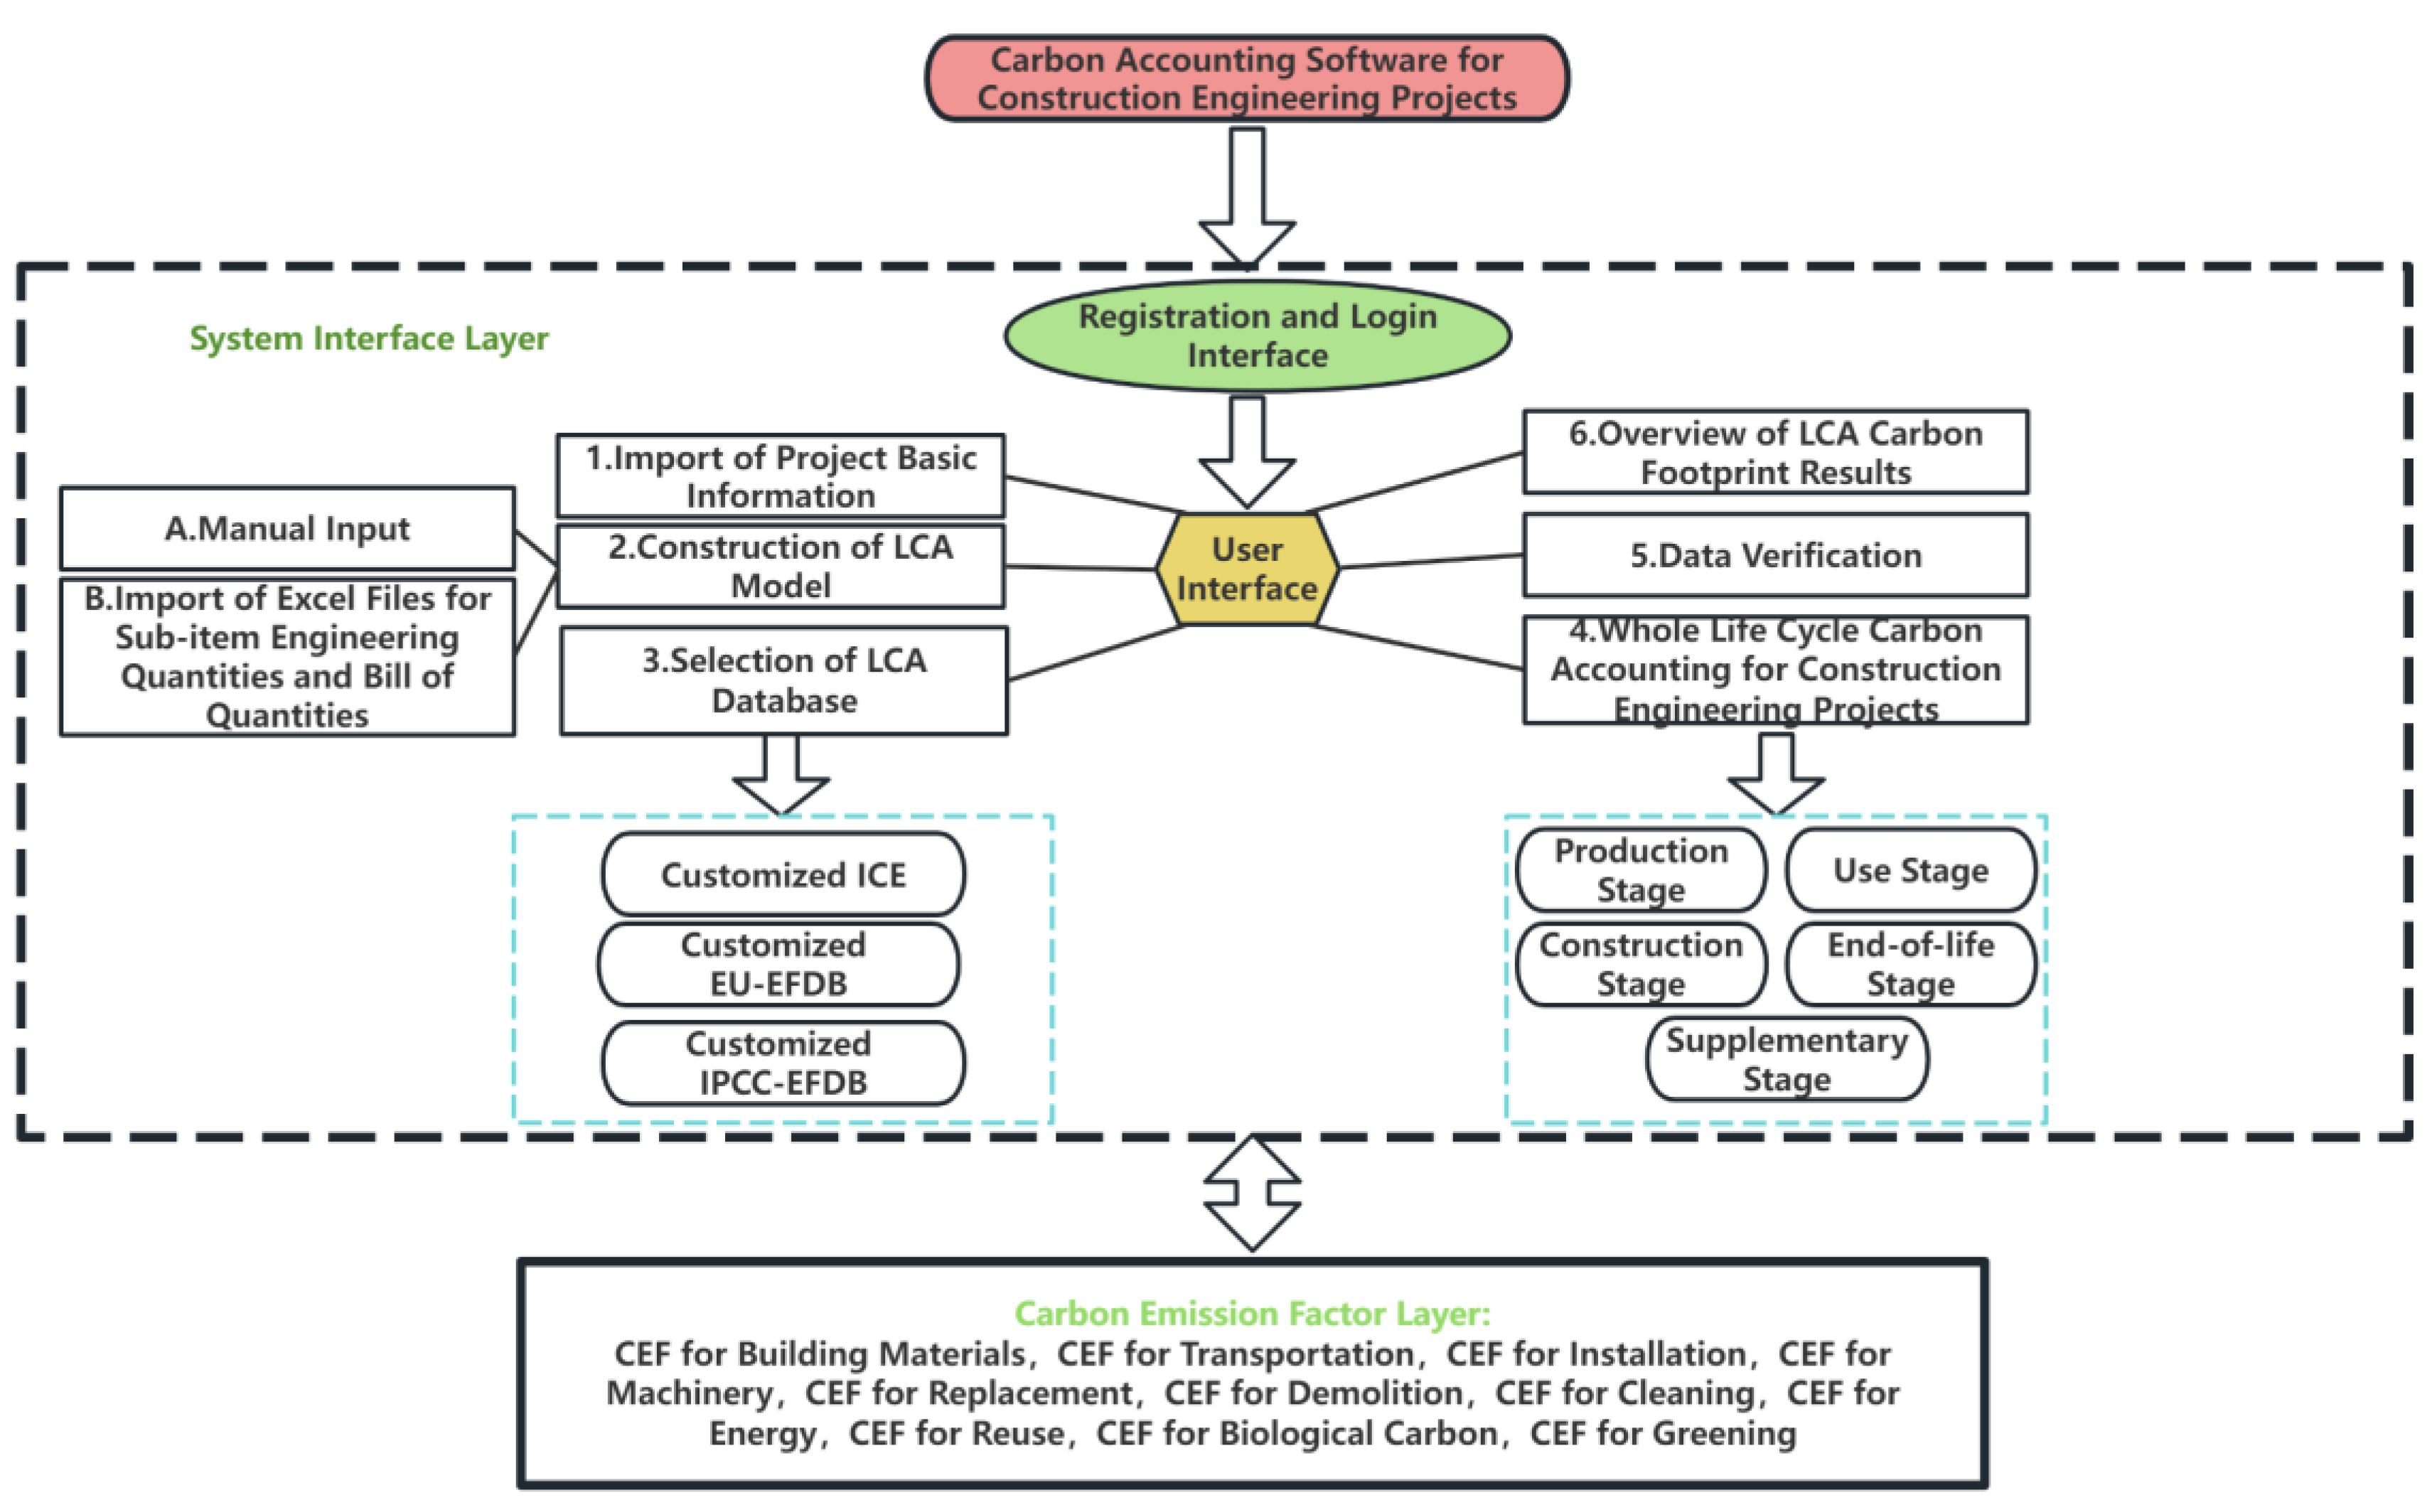
Figure 8.
Graphical User Interface for the carbon emission accounting tool.
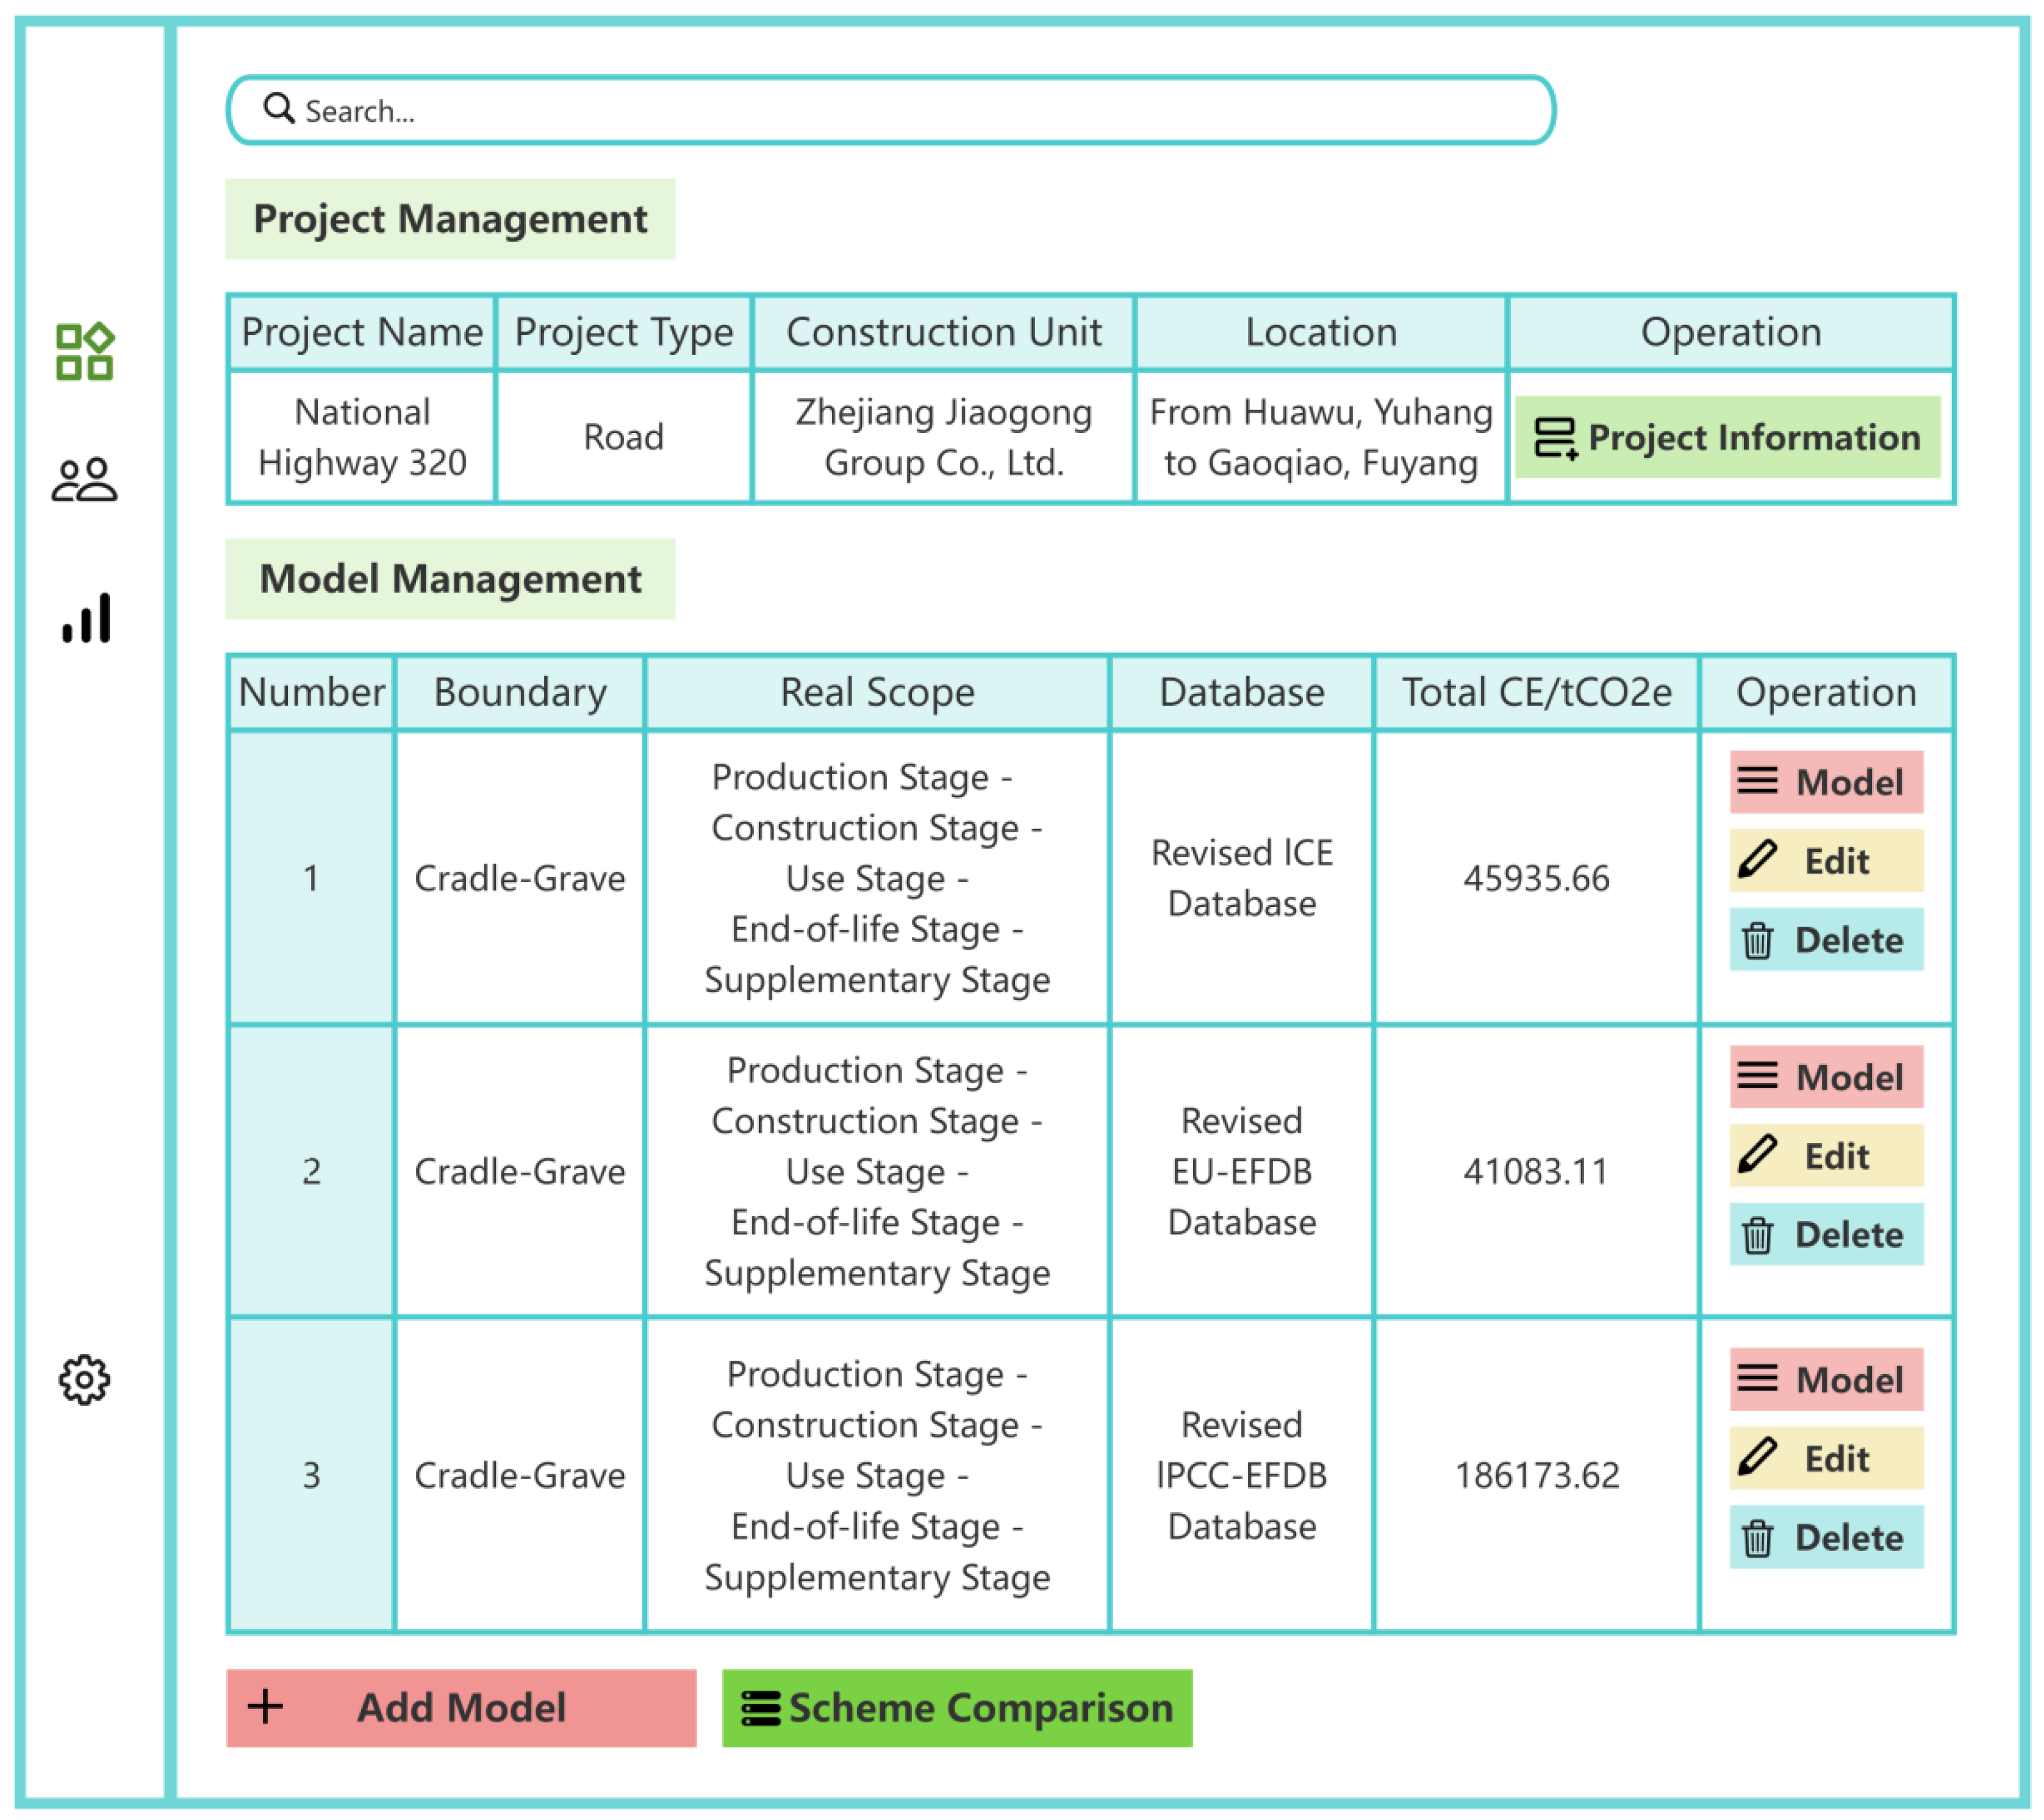
Figure 9.
Front-end/Back-end workflow chart for the carbon emission accounting tool.
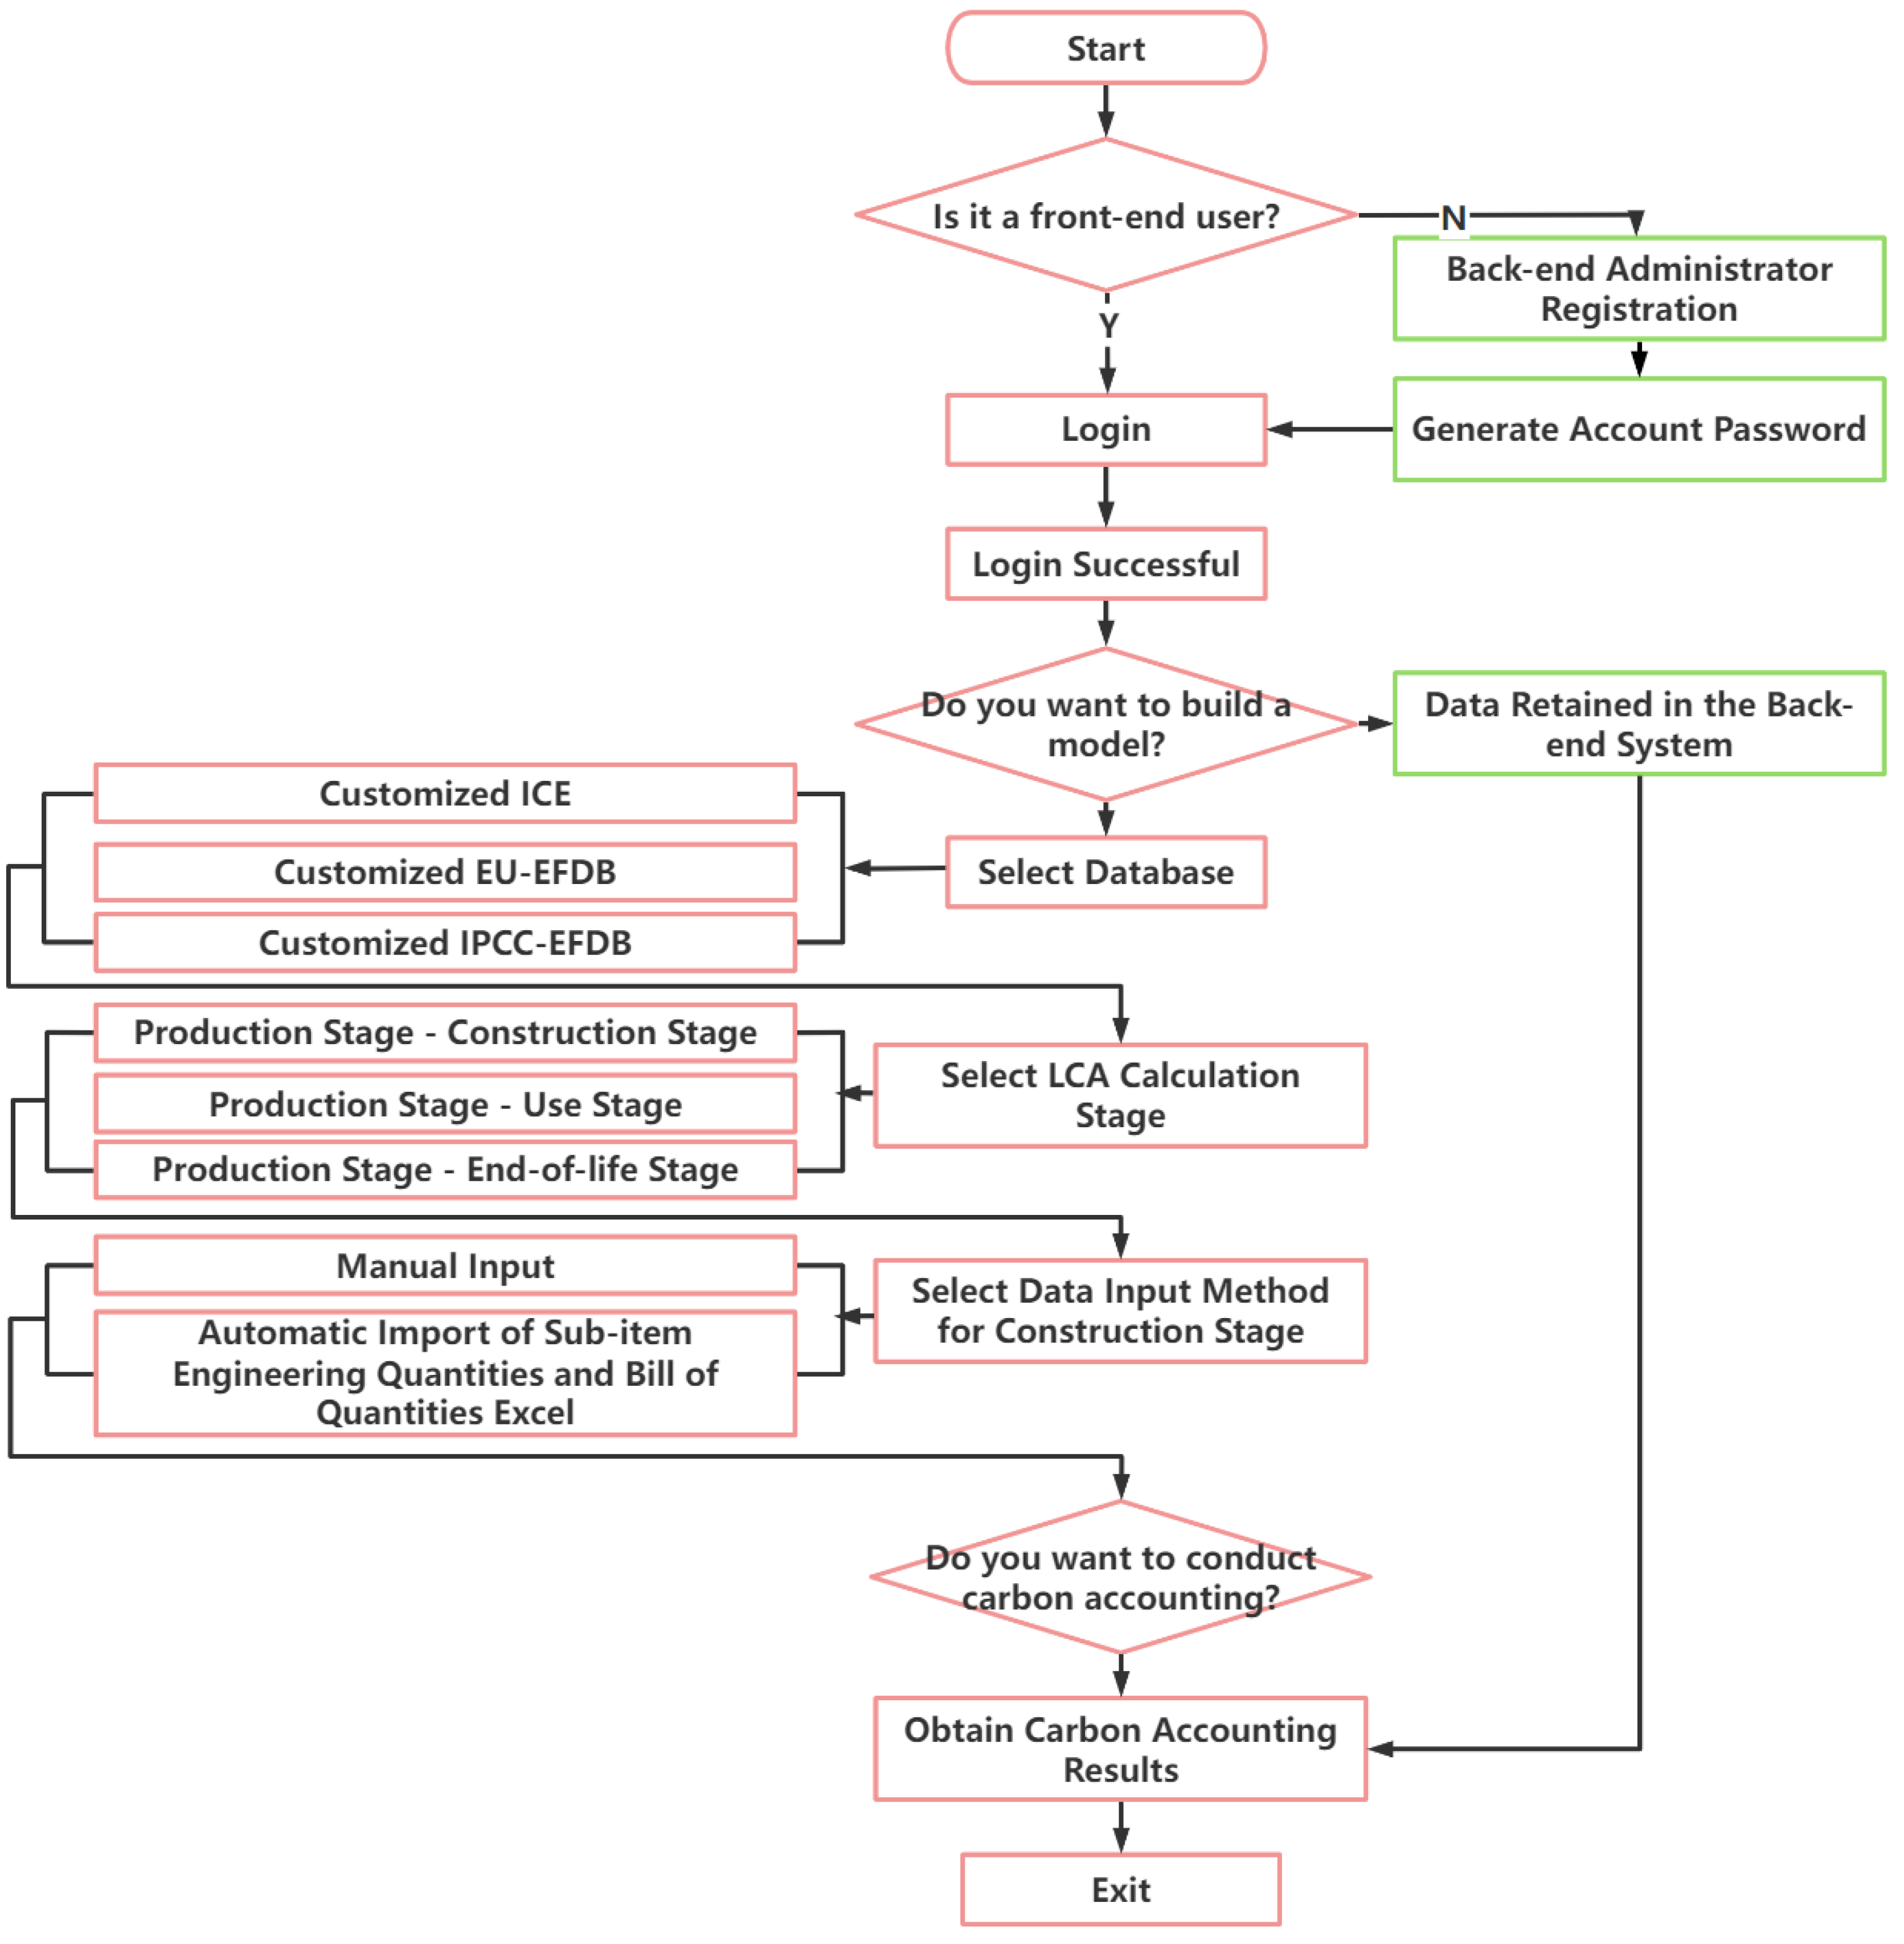
Figure 13.
Life-cycle emission analysis using the customized ICE: (a, c, e) Bar charts representing the total emissions for NH320/HSY/NHG25 project, respectively; (b, d, f) Pie charts representing the relative contribution of carbon emission for each carbon emission stage, respectively.
Figure 13.
Life-cycle emission analysis using the customized ICE: (a, c, e) Bar charts representing the total emissions for NH320/HSY/NHG25 project, respectively; (b, d, f) Pie charts representing the relative contribution of carbon emission for each carbon emission stage, respectively.
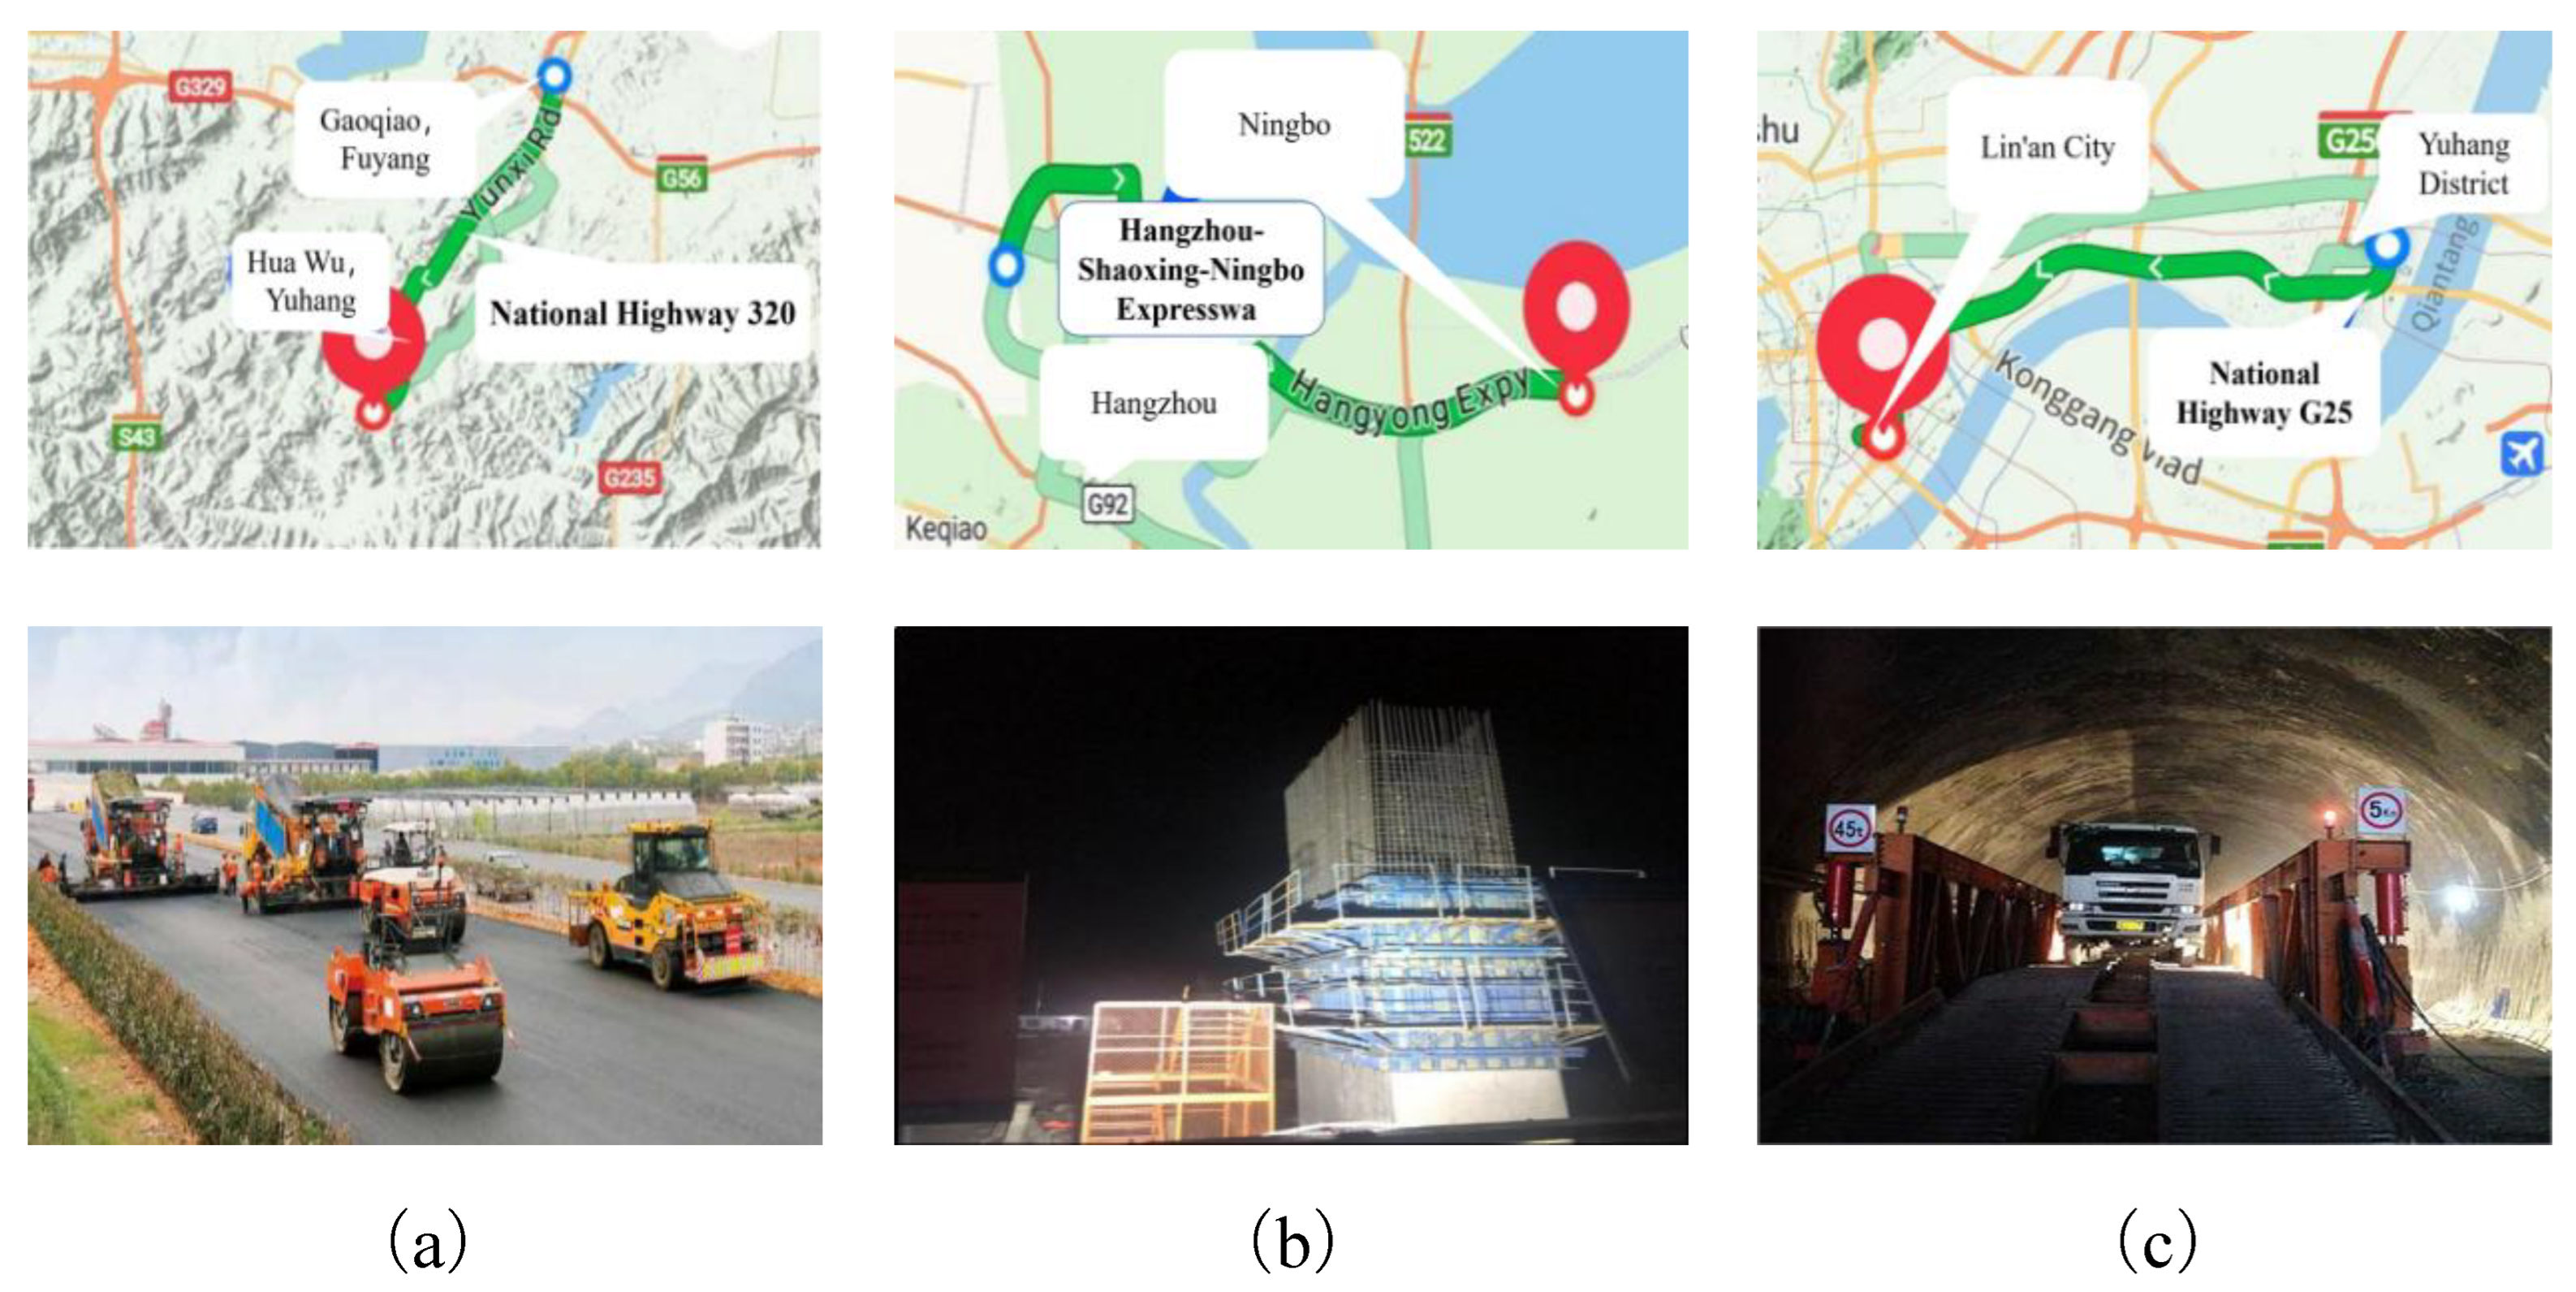
Figure 14.
Production stage carbon emission analysis using ICE: (a,b) NH320 material breakdown & percentage, (c,d) HSY material breakdown & percentage, (e,f) NHG25 material breakdown & percentage.
Figure 14.
Production stage carbon emission analysis using ICE: (a,b) NH320 material breakdown & percentage, (c,d) HSY material breakdown & percentage, (e,f) NHG25 material breakdown & percentage.
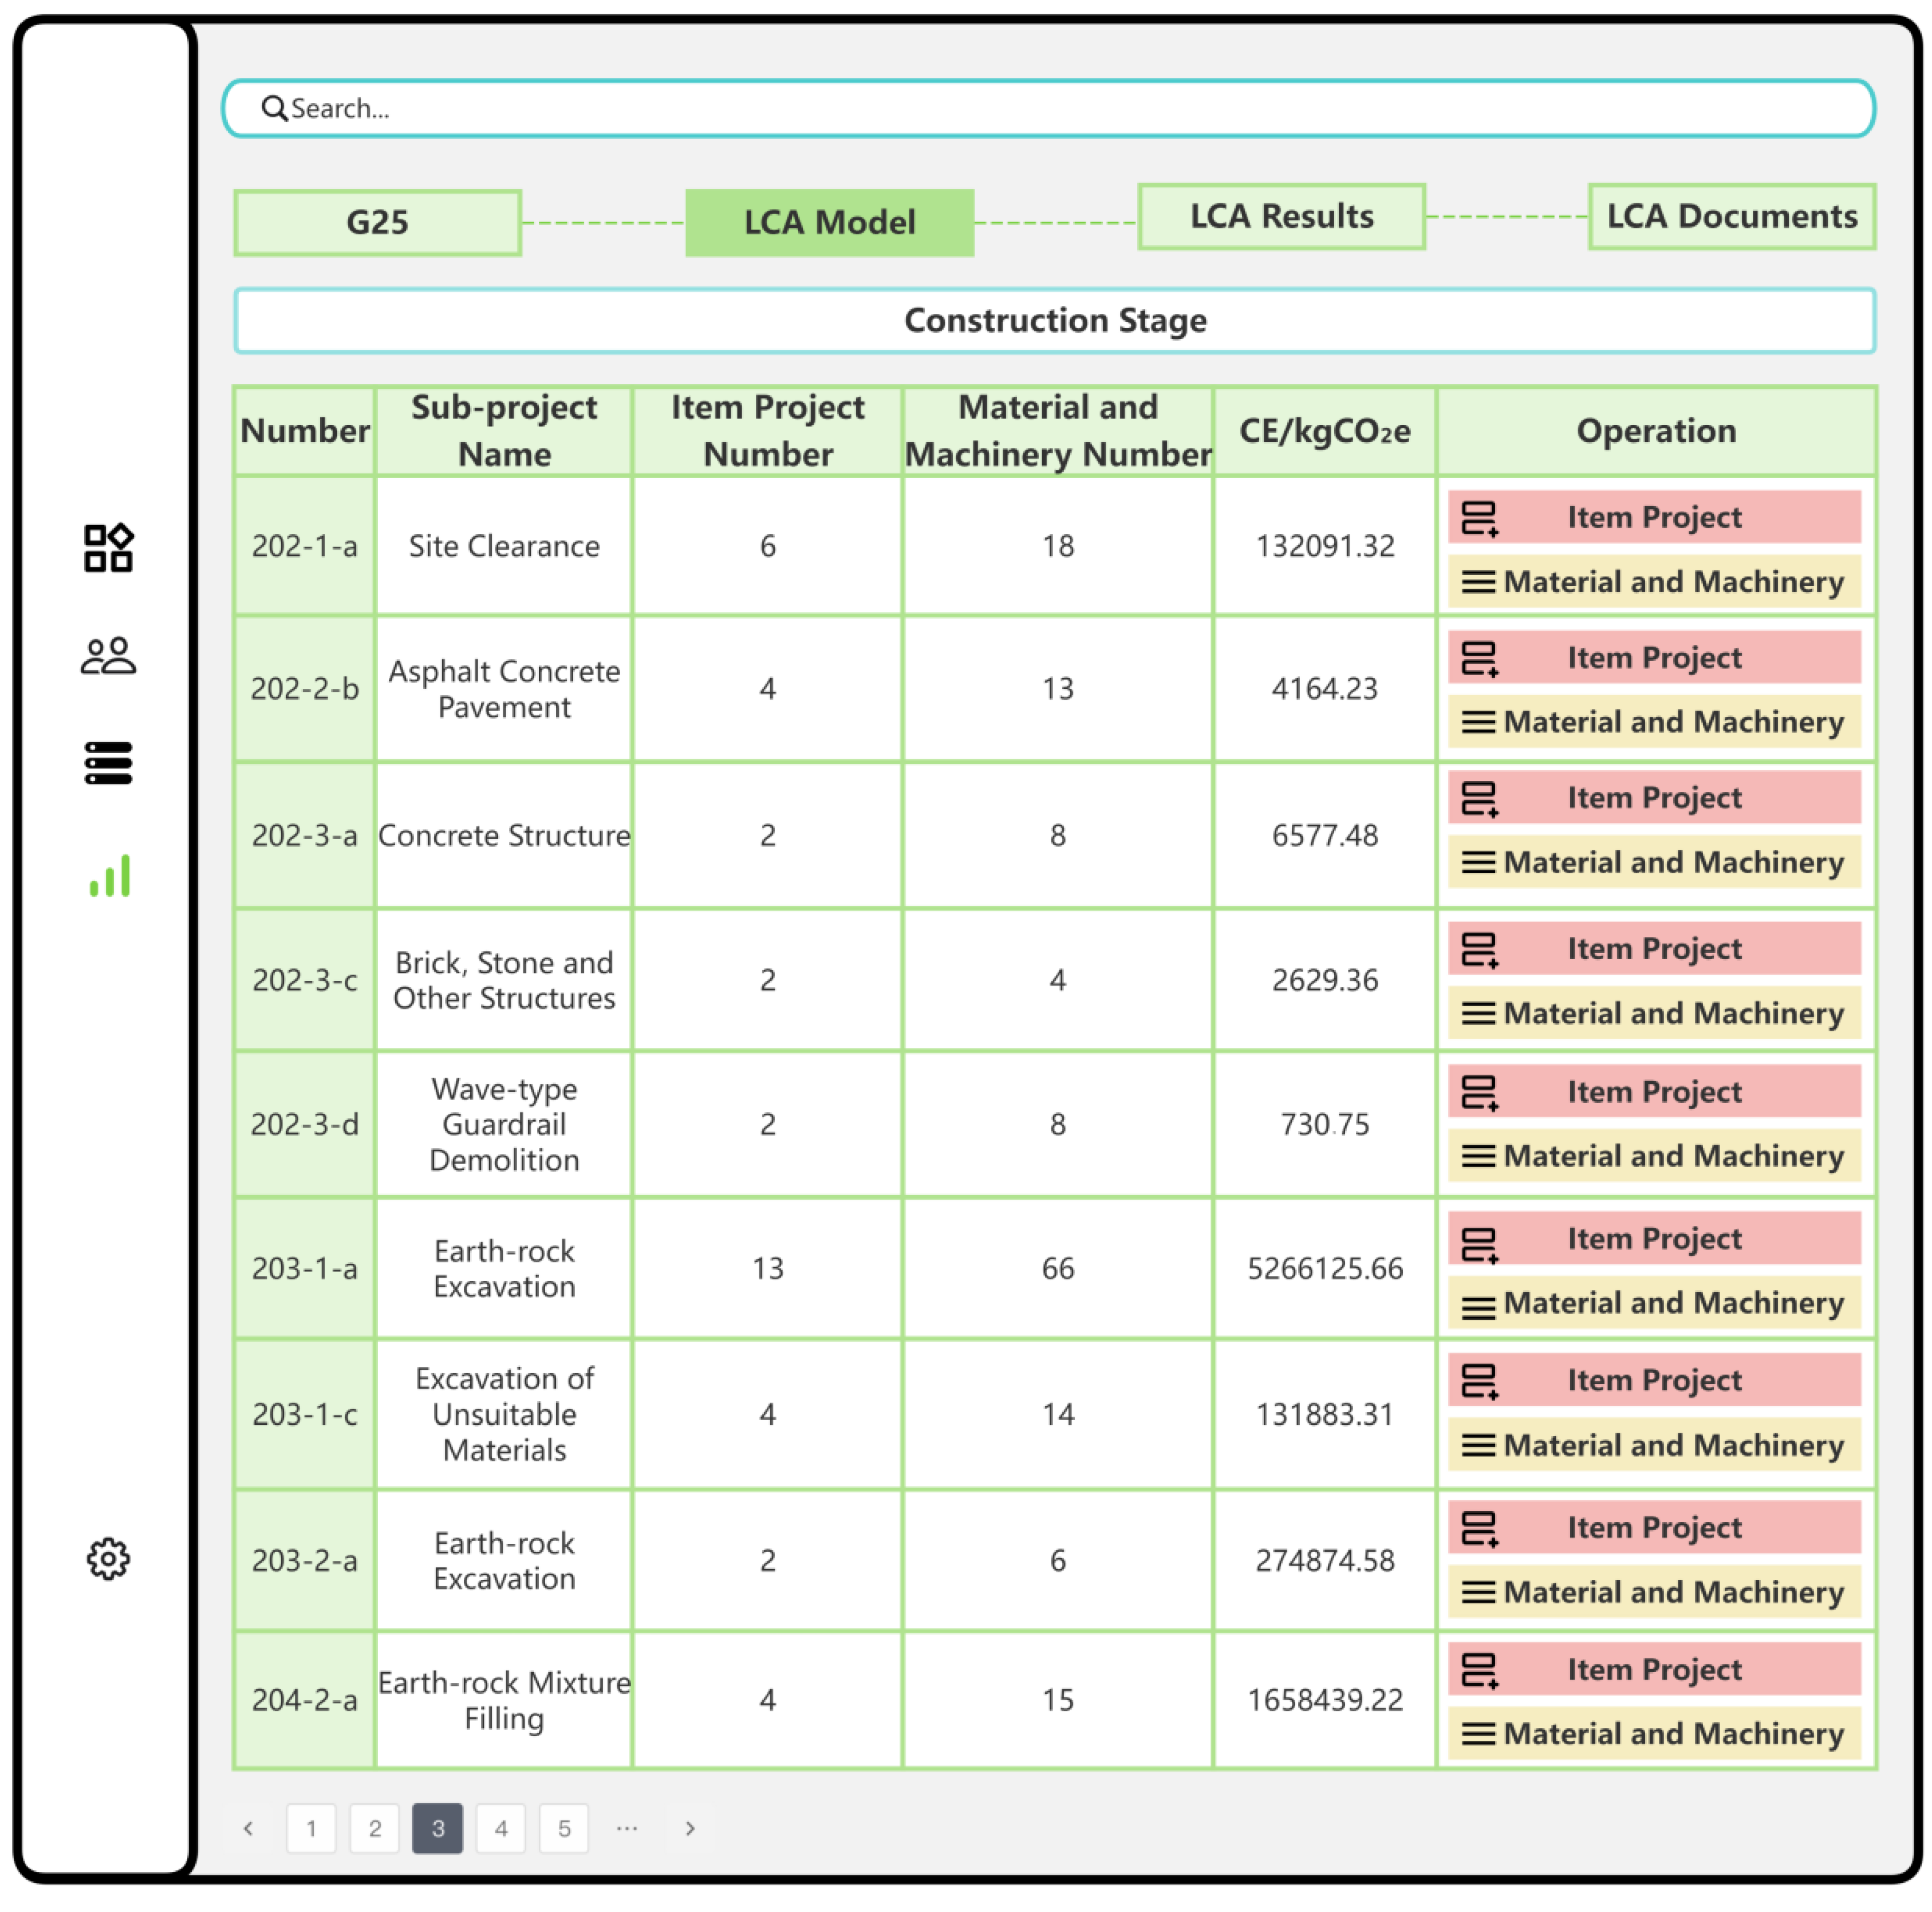
Figure 15.
Construction stage sub-projects analysis with ICE: (a,c,e) Pareto charts: Top 8 emission sources(b,d,f) Radar charts: emission intensity vs. total emissions.
Figure 15.
Construction stage sub-projects analysis with ICE: (a,c,e) Pareto charts: Top 8 emission sources(b,d,f) Radar charts: emission intensity vs. total emissions.
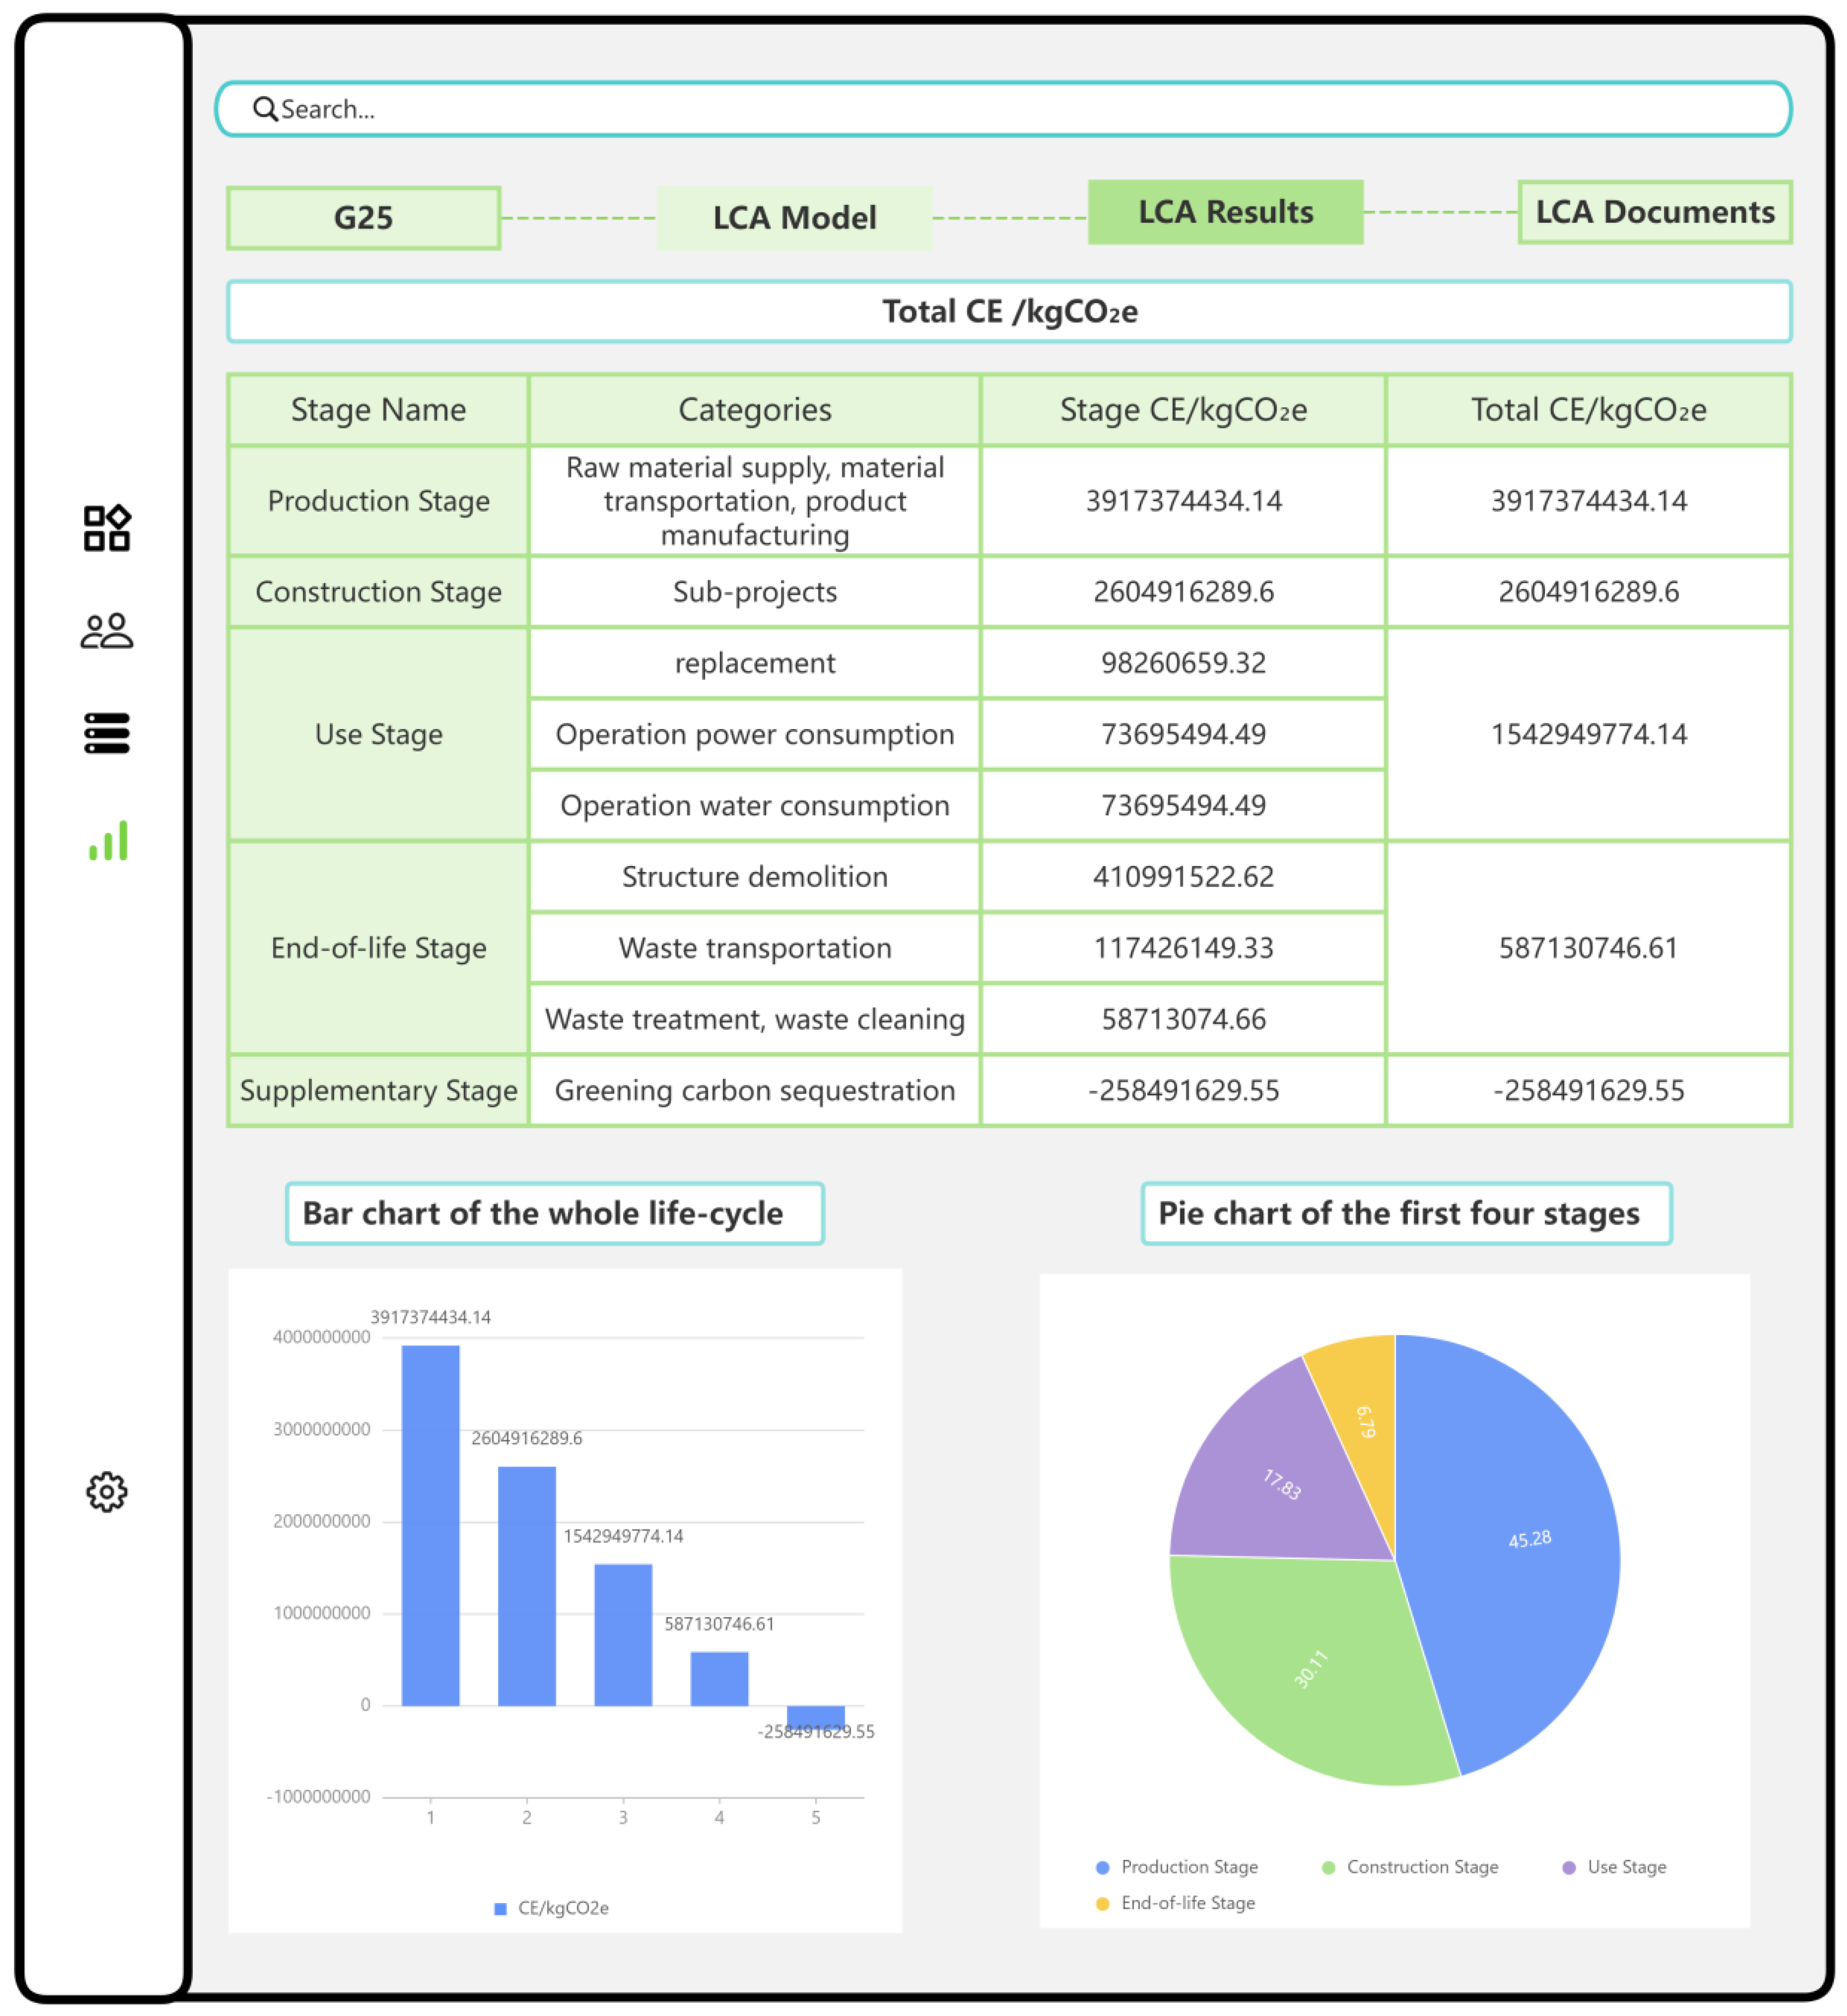
Figure 10.
Geographic location map and construction sites: (a) National Highway 320 (NH320), (b) Hangzhou-Shaoxing-Ningbo Expressway (HSY Expressway), (c) National Highway G25 (NHG25).
Figure 10.
Geographic location map and construction sites: (a) National Highway 320 (NH320), (b) Hangzhou-Shaoxing-Ningbo Expressway (HSY Expressway), (c) National Highway G25 (NHG25).
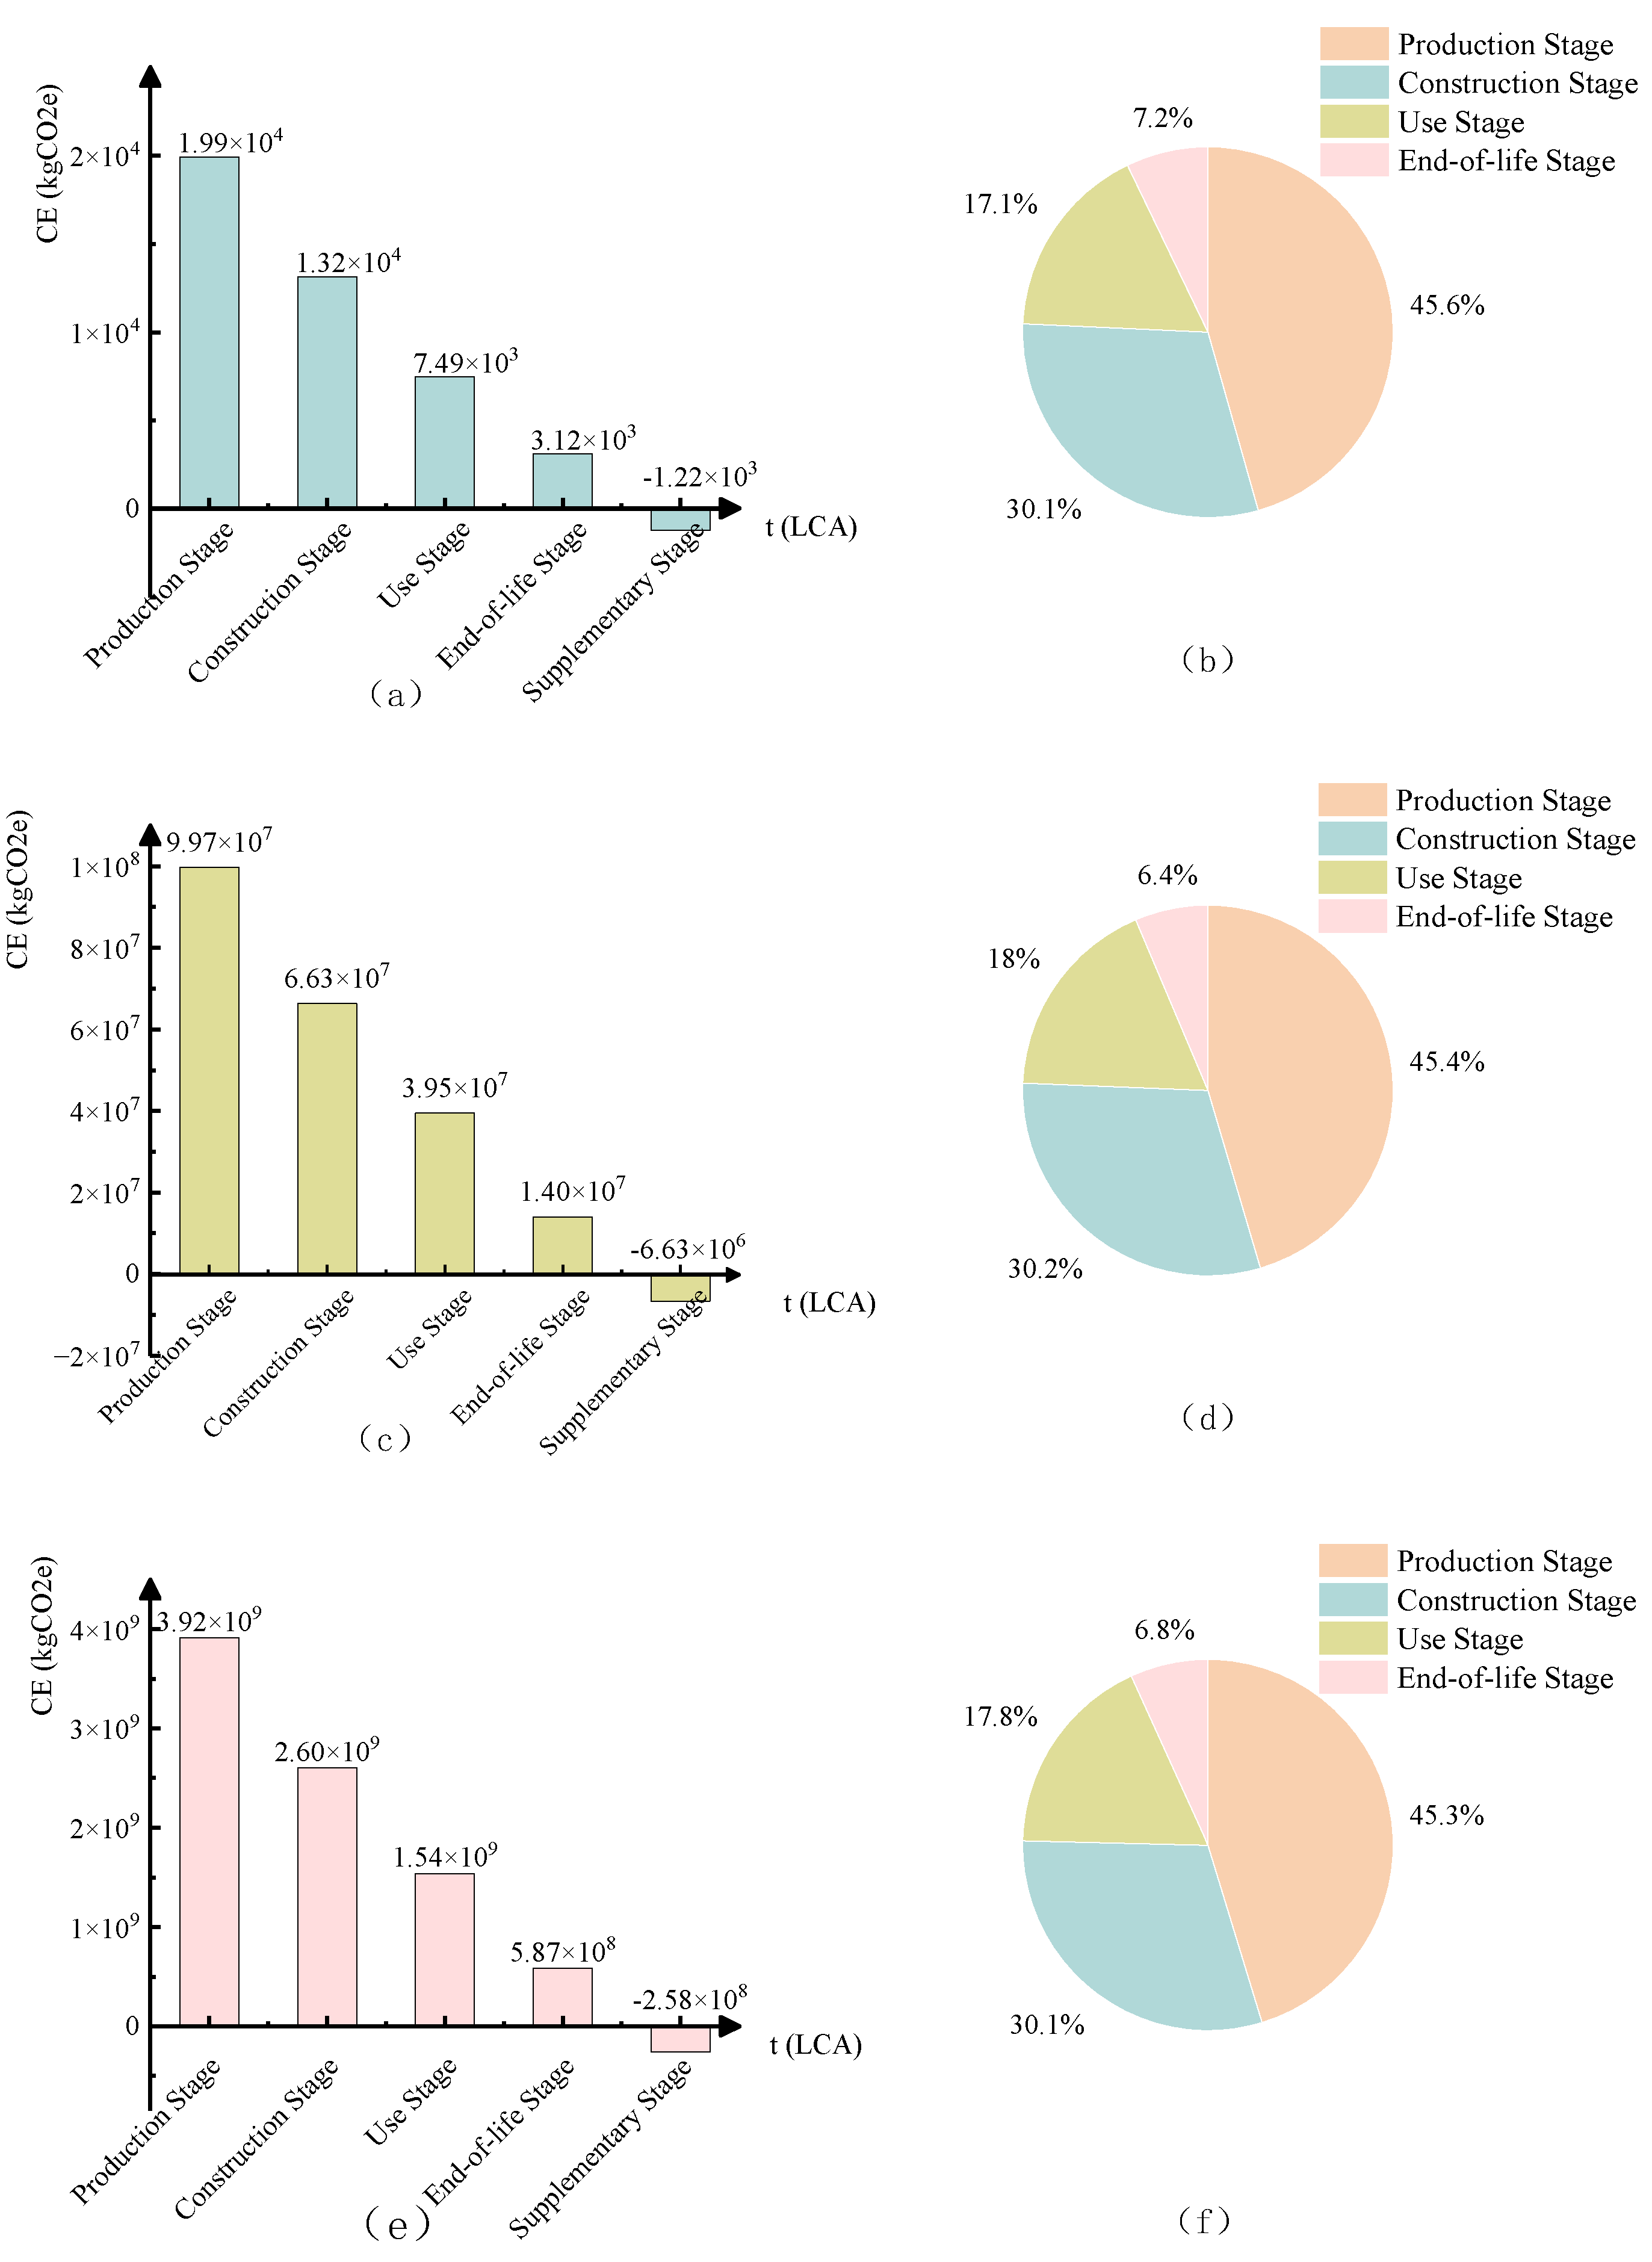
Figure 11.
Construction stage data interface for National Highway G25 with the customized ICE.
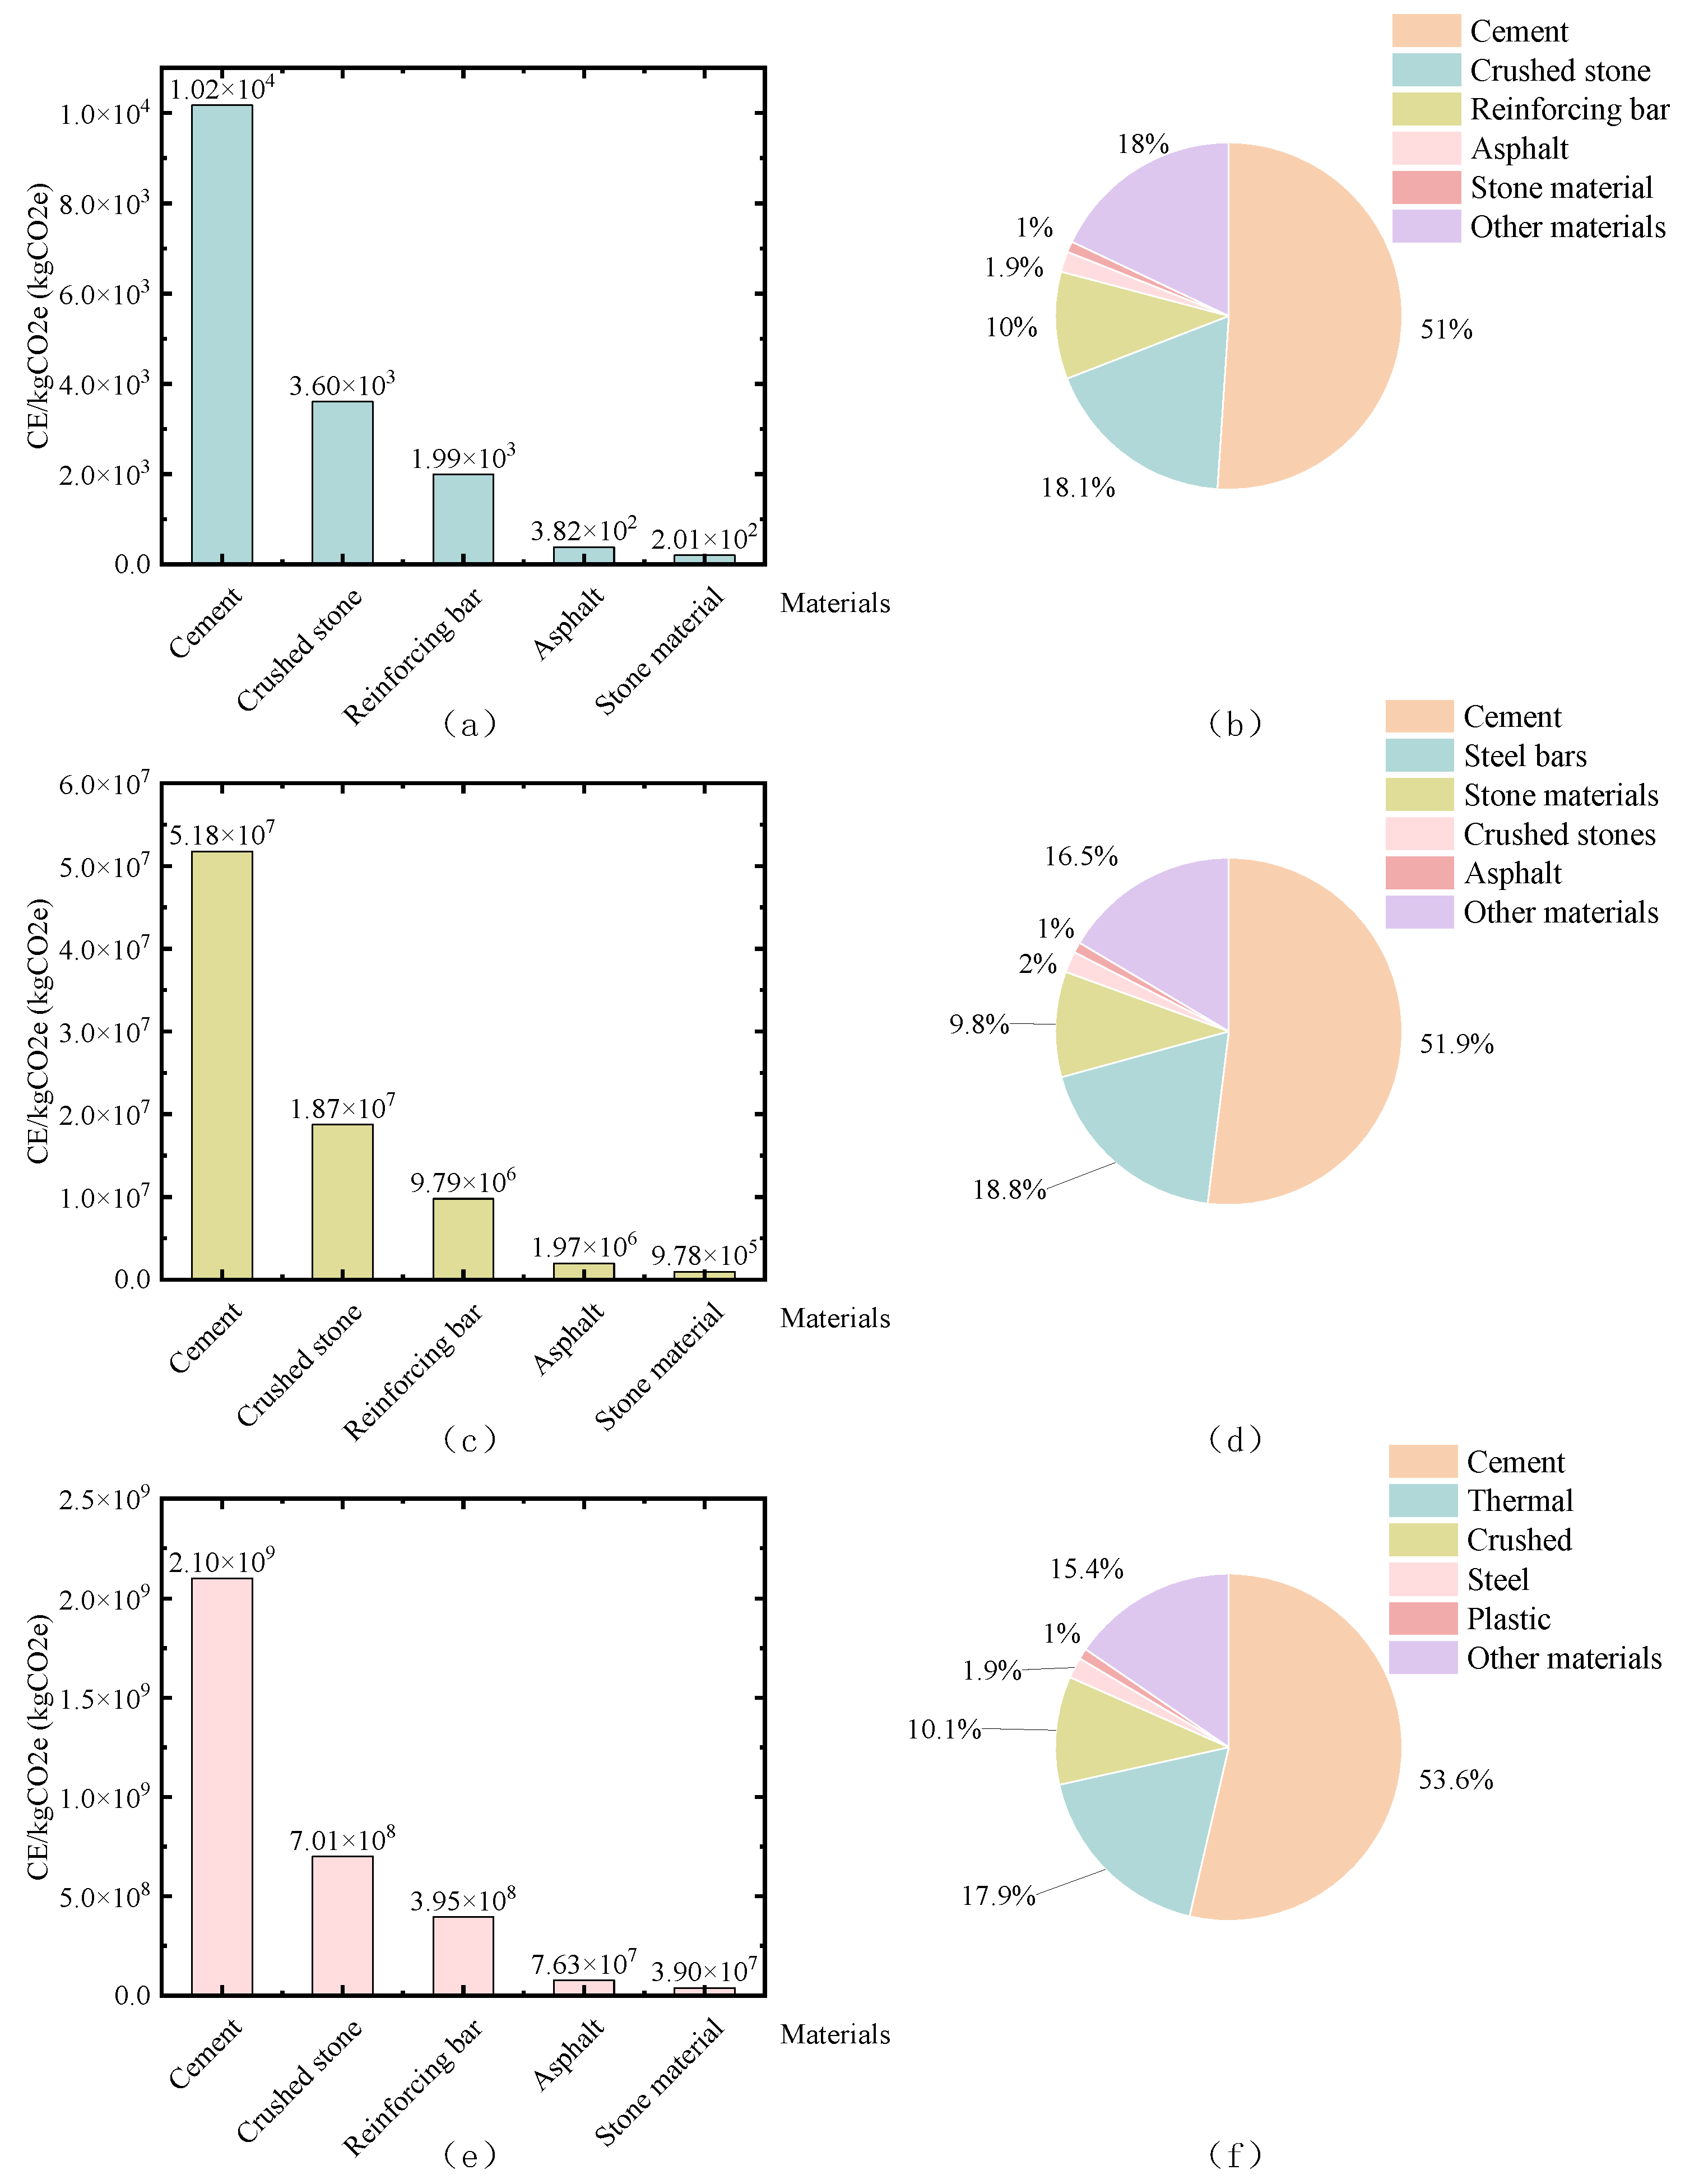
Figure 12.
User interface showing the total carbon accounting results for National Highway G25, including itemized carbon emission amount, bar chart and pie chart for different stages.
Figure 12.
User interface showing the total carbon accounting results for National Highway G25, including itemized carbon emission amount, bar chart and pie chart for different stages.
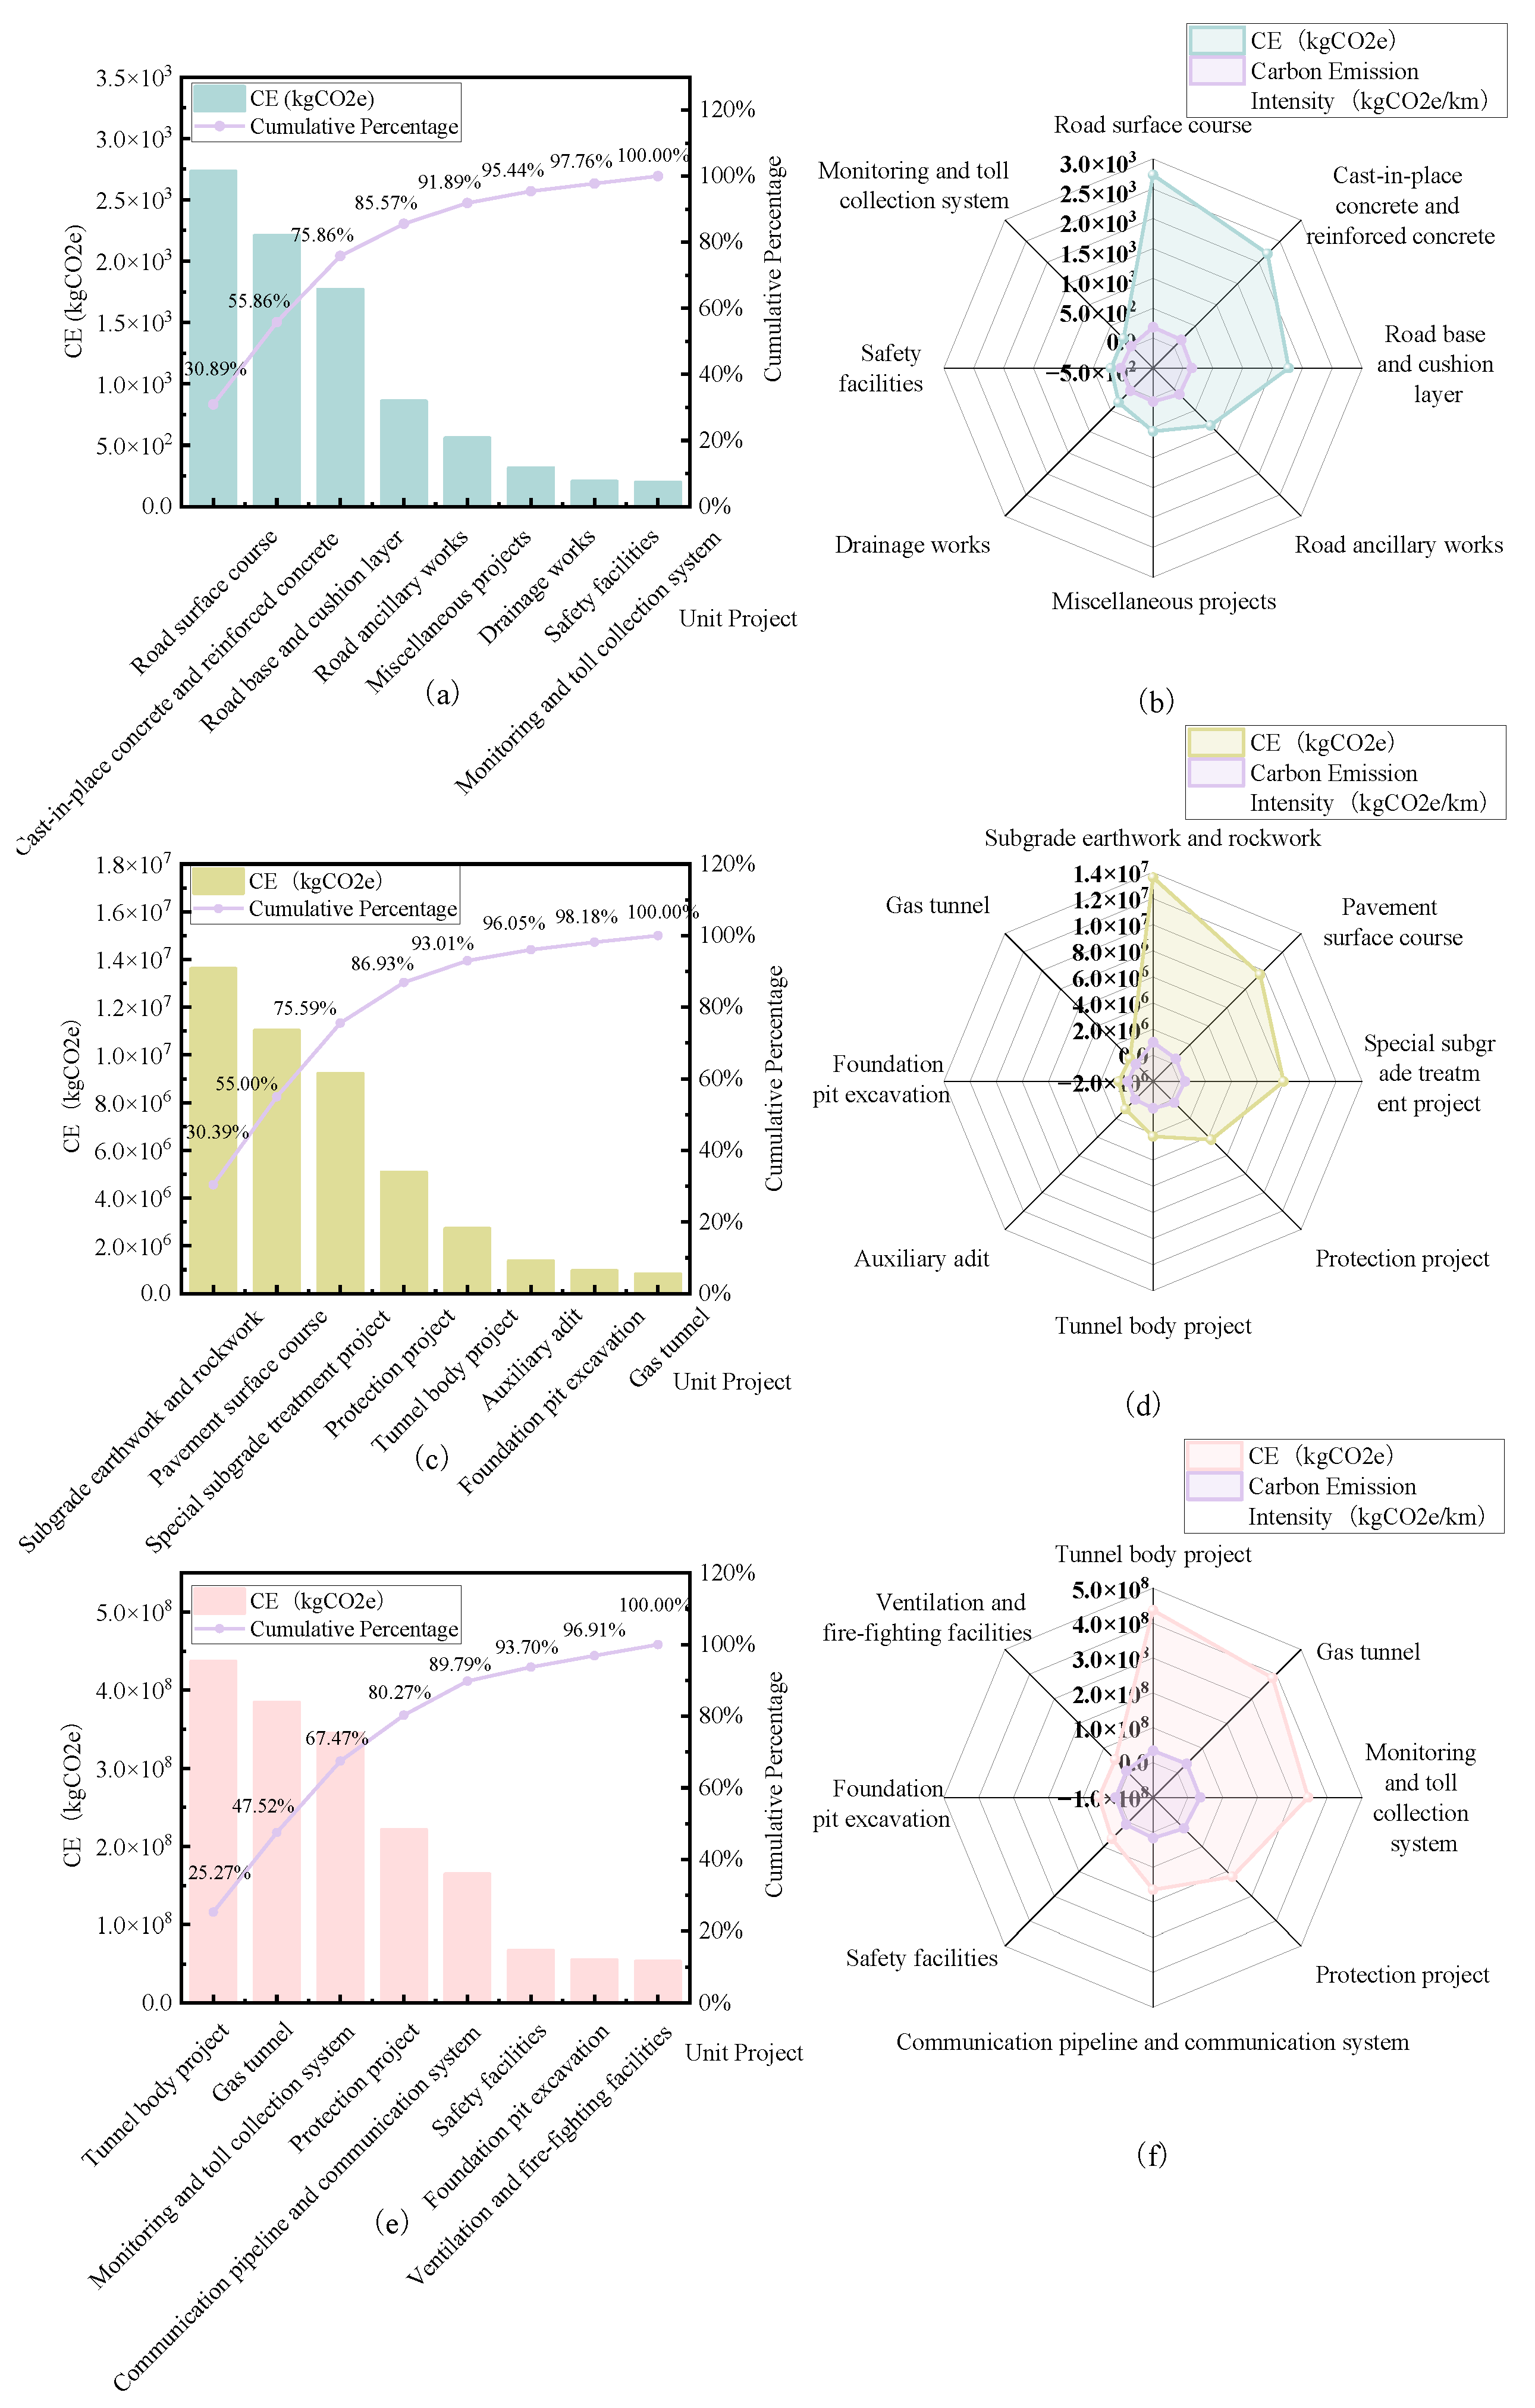
Figure 16.
Life-cycle emission analysis using customized EU-EFDB: (a,c,e) Bar charts: total emissions for NH320, HSY, and NHG25 (b,d,f) Pie charts: stage contributions (excluding supplementary stage).
Figure 16.
Life-cycle emission analysis using customized EU-EFDB: (a,c,e) Bar charts: total emissions for NH320, HSY, and NHG25 (b,d,f) Pie charts: stage contributions (excluding supplementary stage).
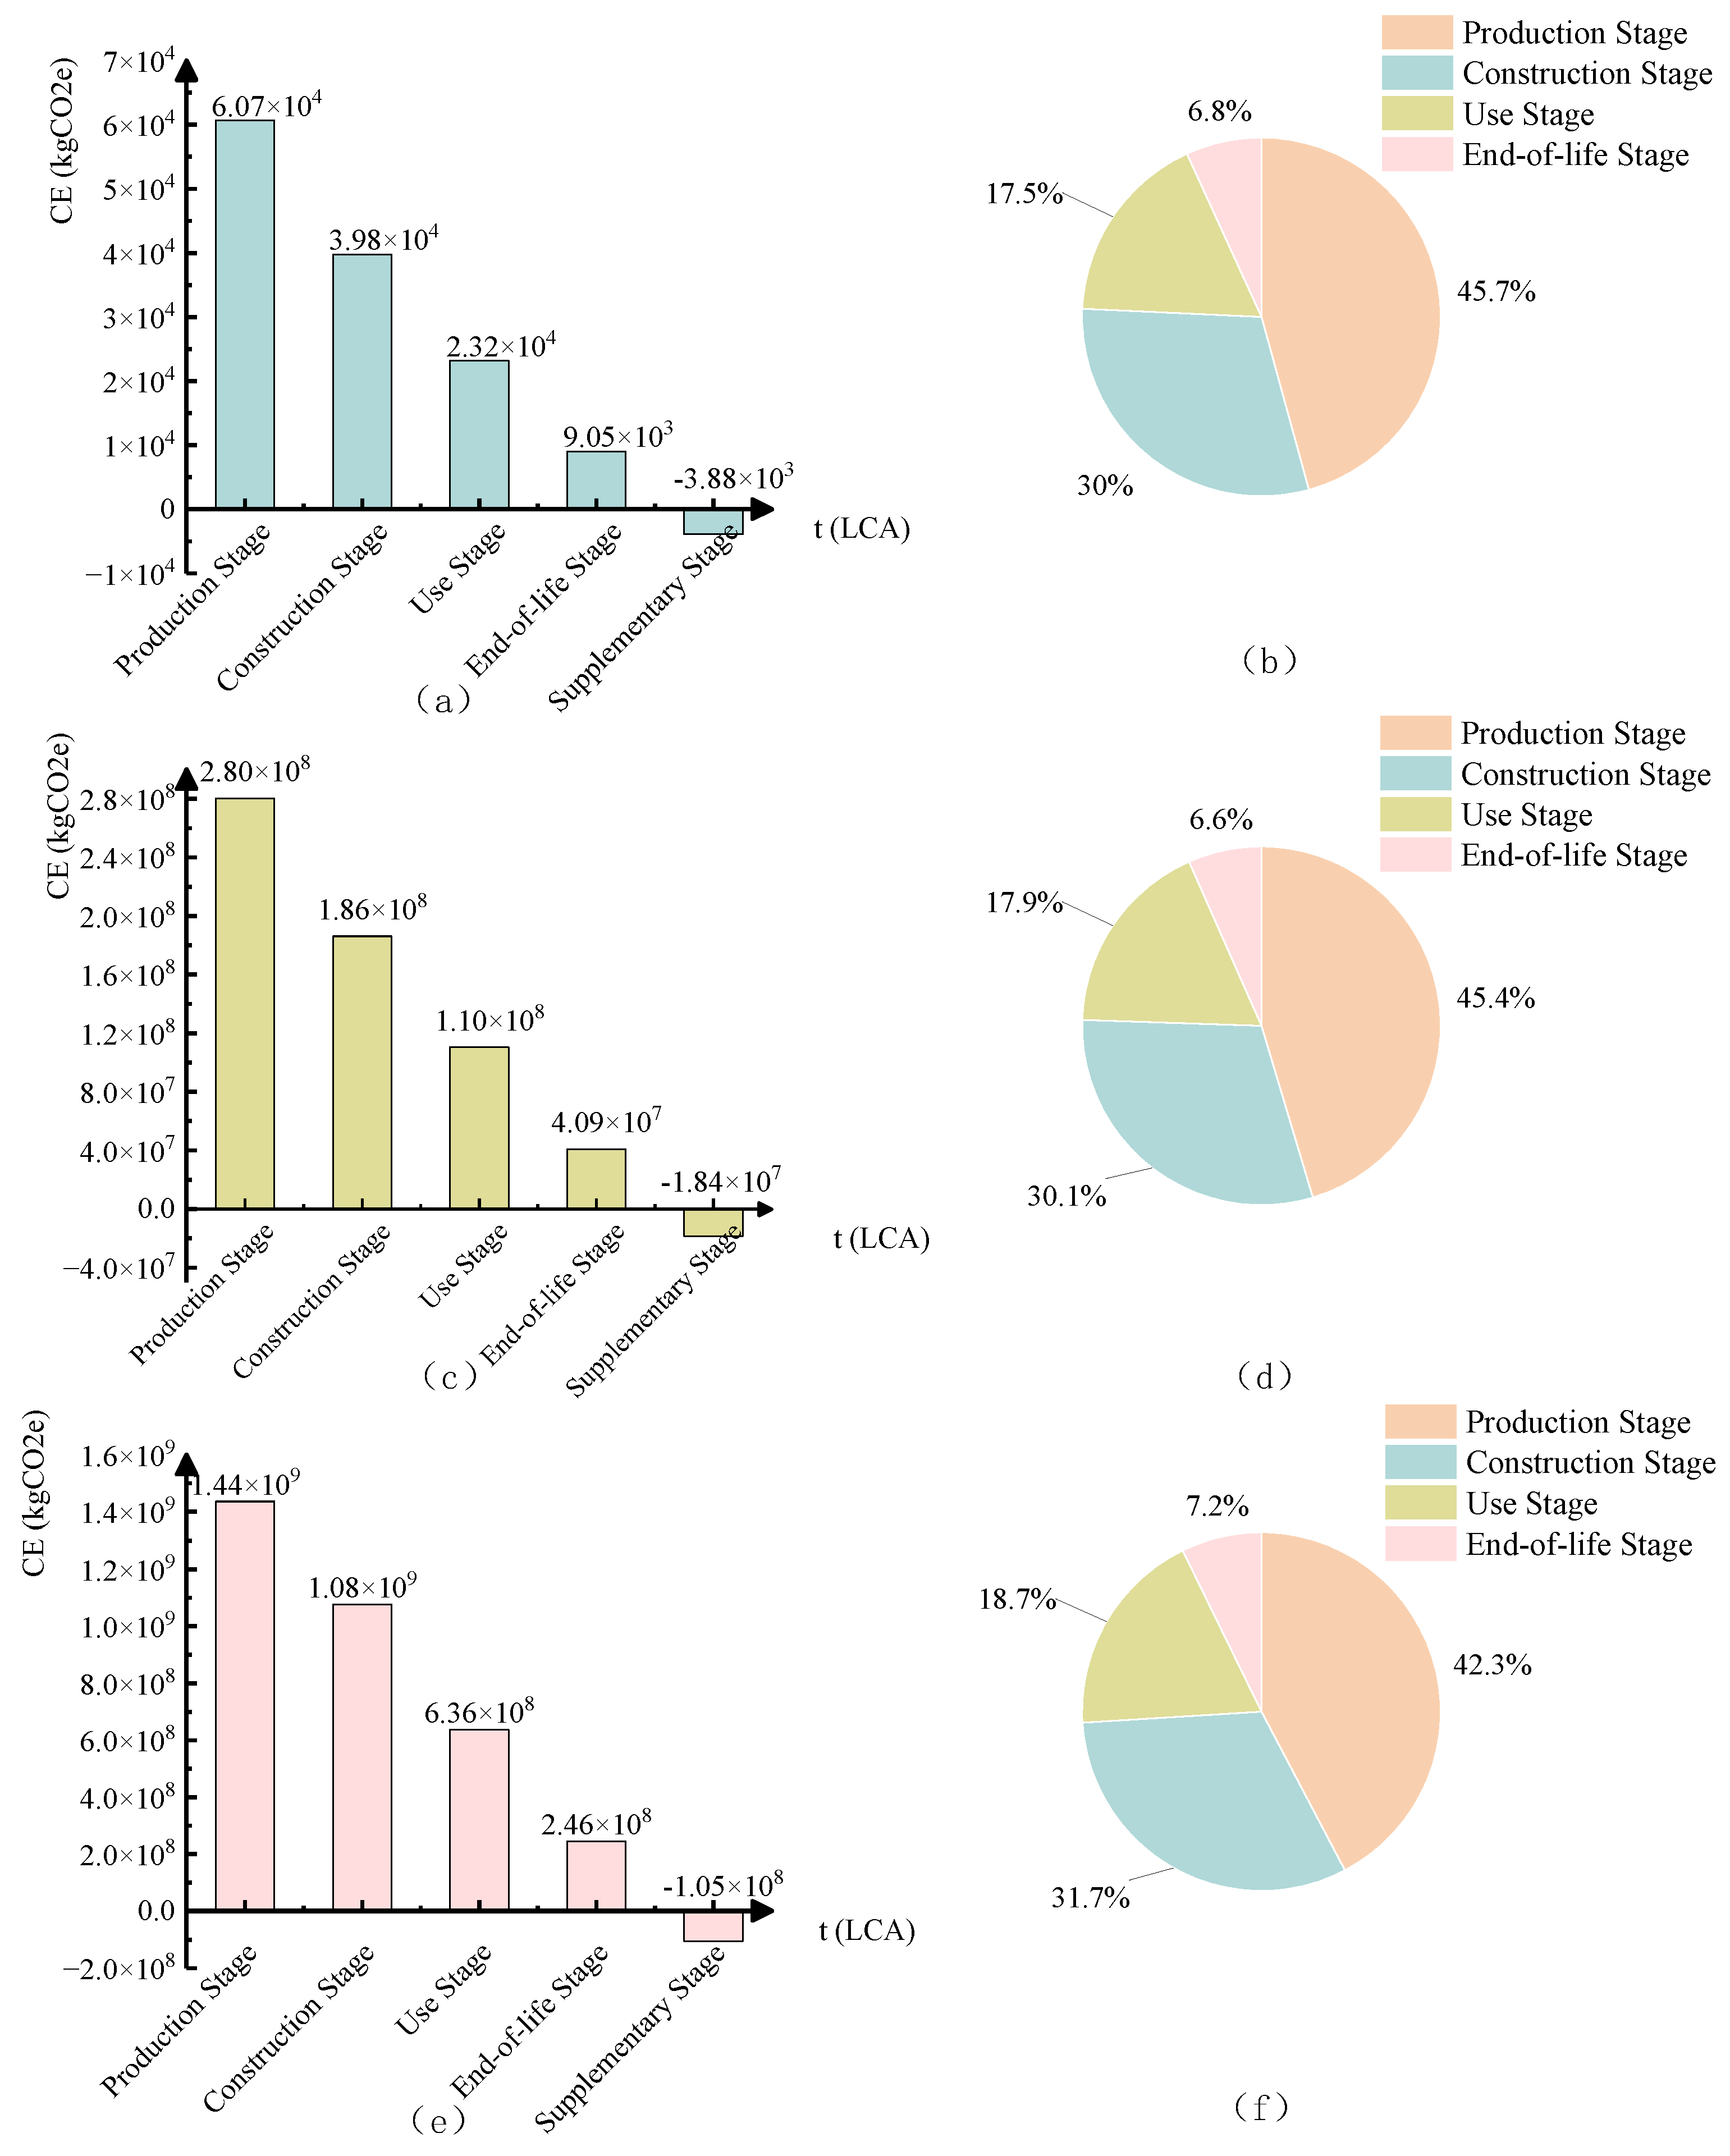
Figure 17.
Production stage material analysis using customized EU-EFDB : (a, b) Material breakdown and percentages for NH320 (c, d) Material breakdown and percentages for HSY (e, f) Material breakdown and percentages for NHG25.
Figure 17.
Production stage material analysis using customized EU-EFDB : (a, b) Material breakdown and percentages for NH320 (c, d) Material breakdown and percentages for HSY (e, f) Material breakdown and percentages for NHG25.
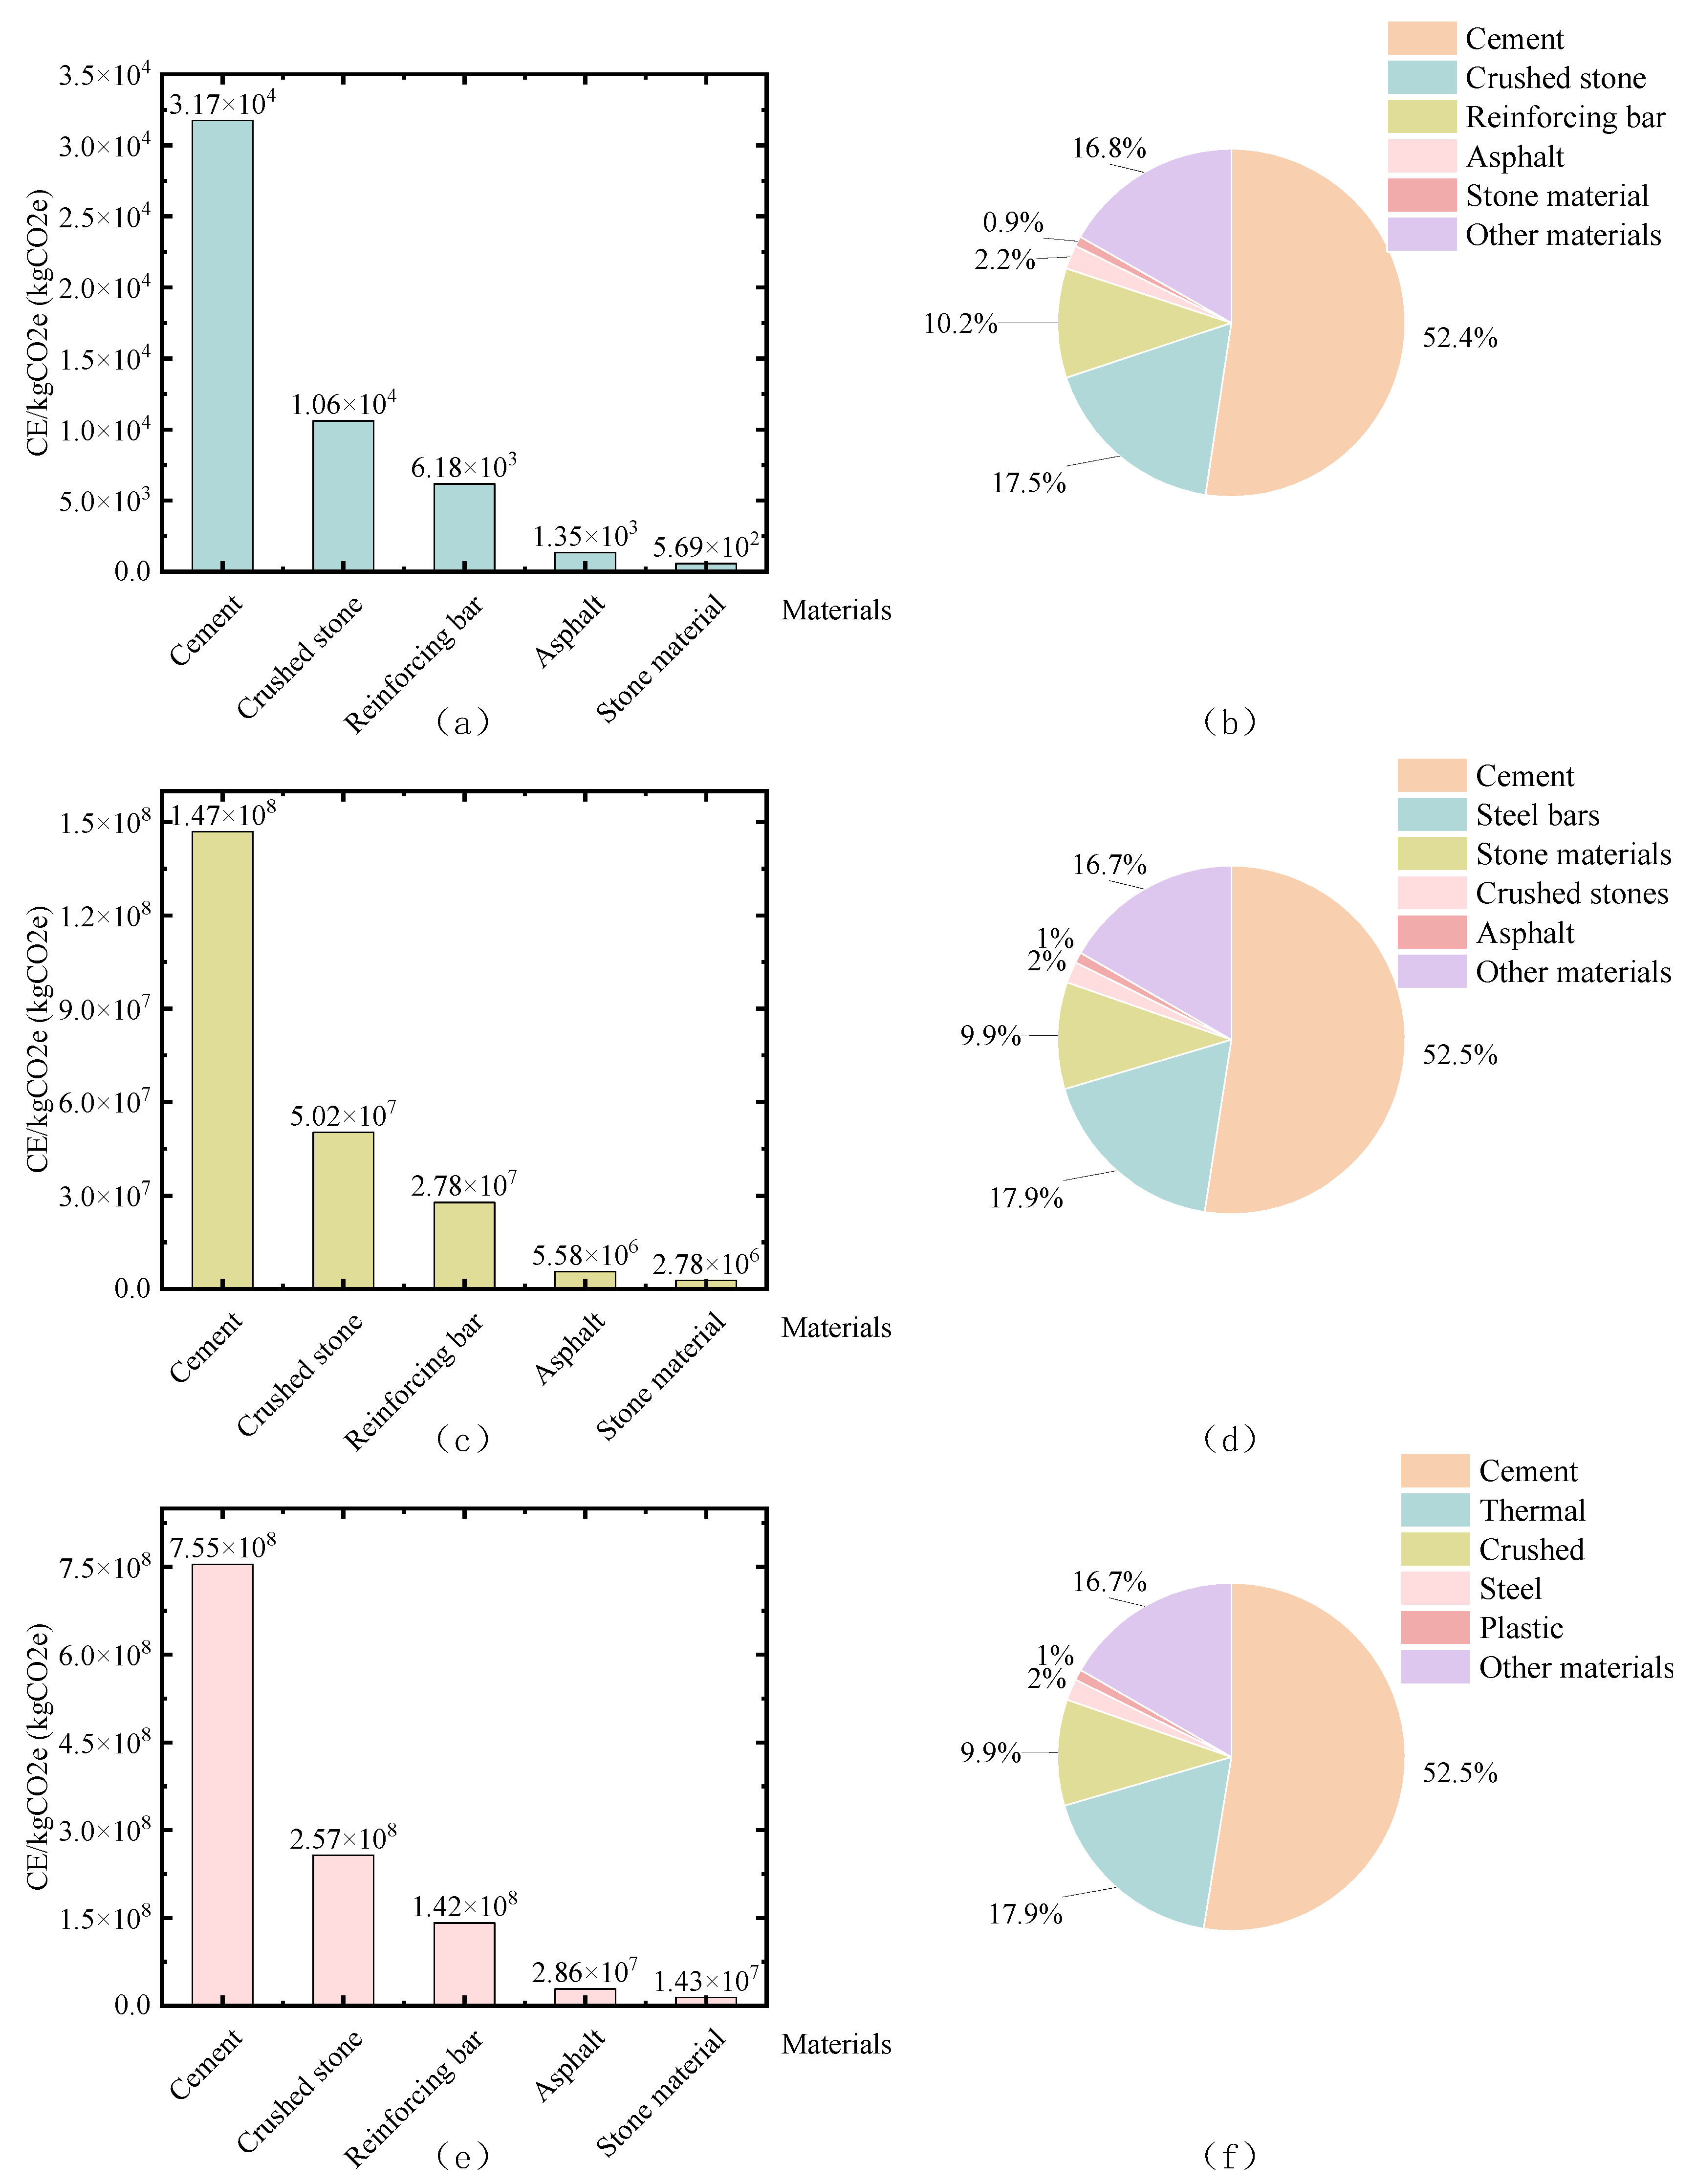
Figure 18.
Construction stage sub-projects analysis using revided EU-EFDB: (a, c, e) Pareto charts of Top 8 emission sources (b, d, f) Radar charts of emission intensity vs. total emissions.
Figure 18.
Construction stage sub-projects analysis using revided EU-EFDB: (a, c, e) Pareto charts of Top 8 emission sources (b, d, f) Radar charts of emission intensity vs. total emissions.
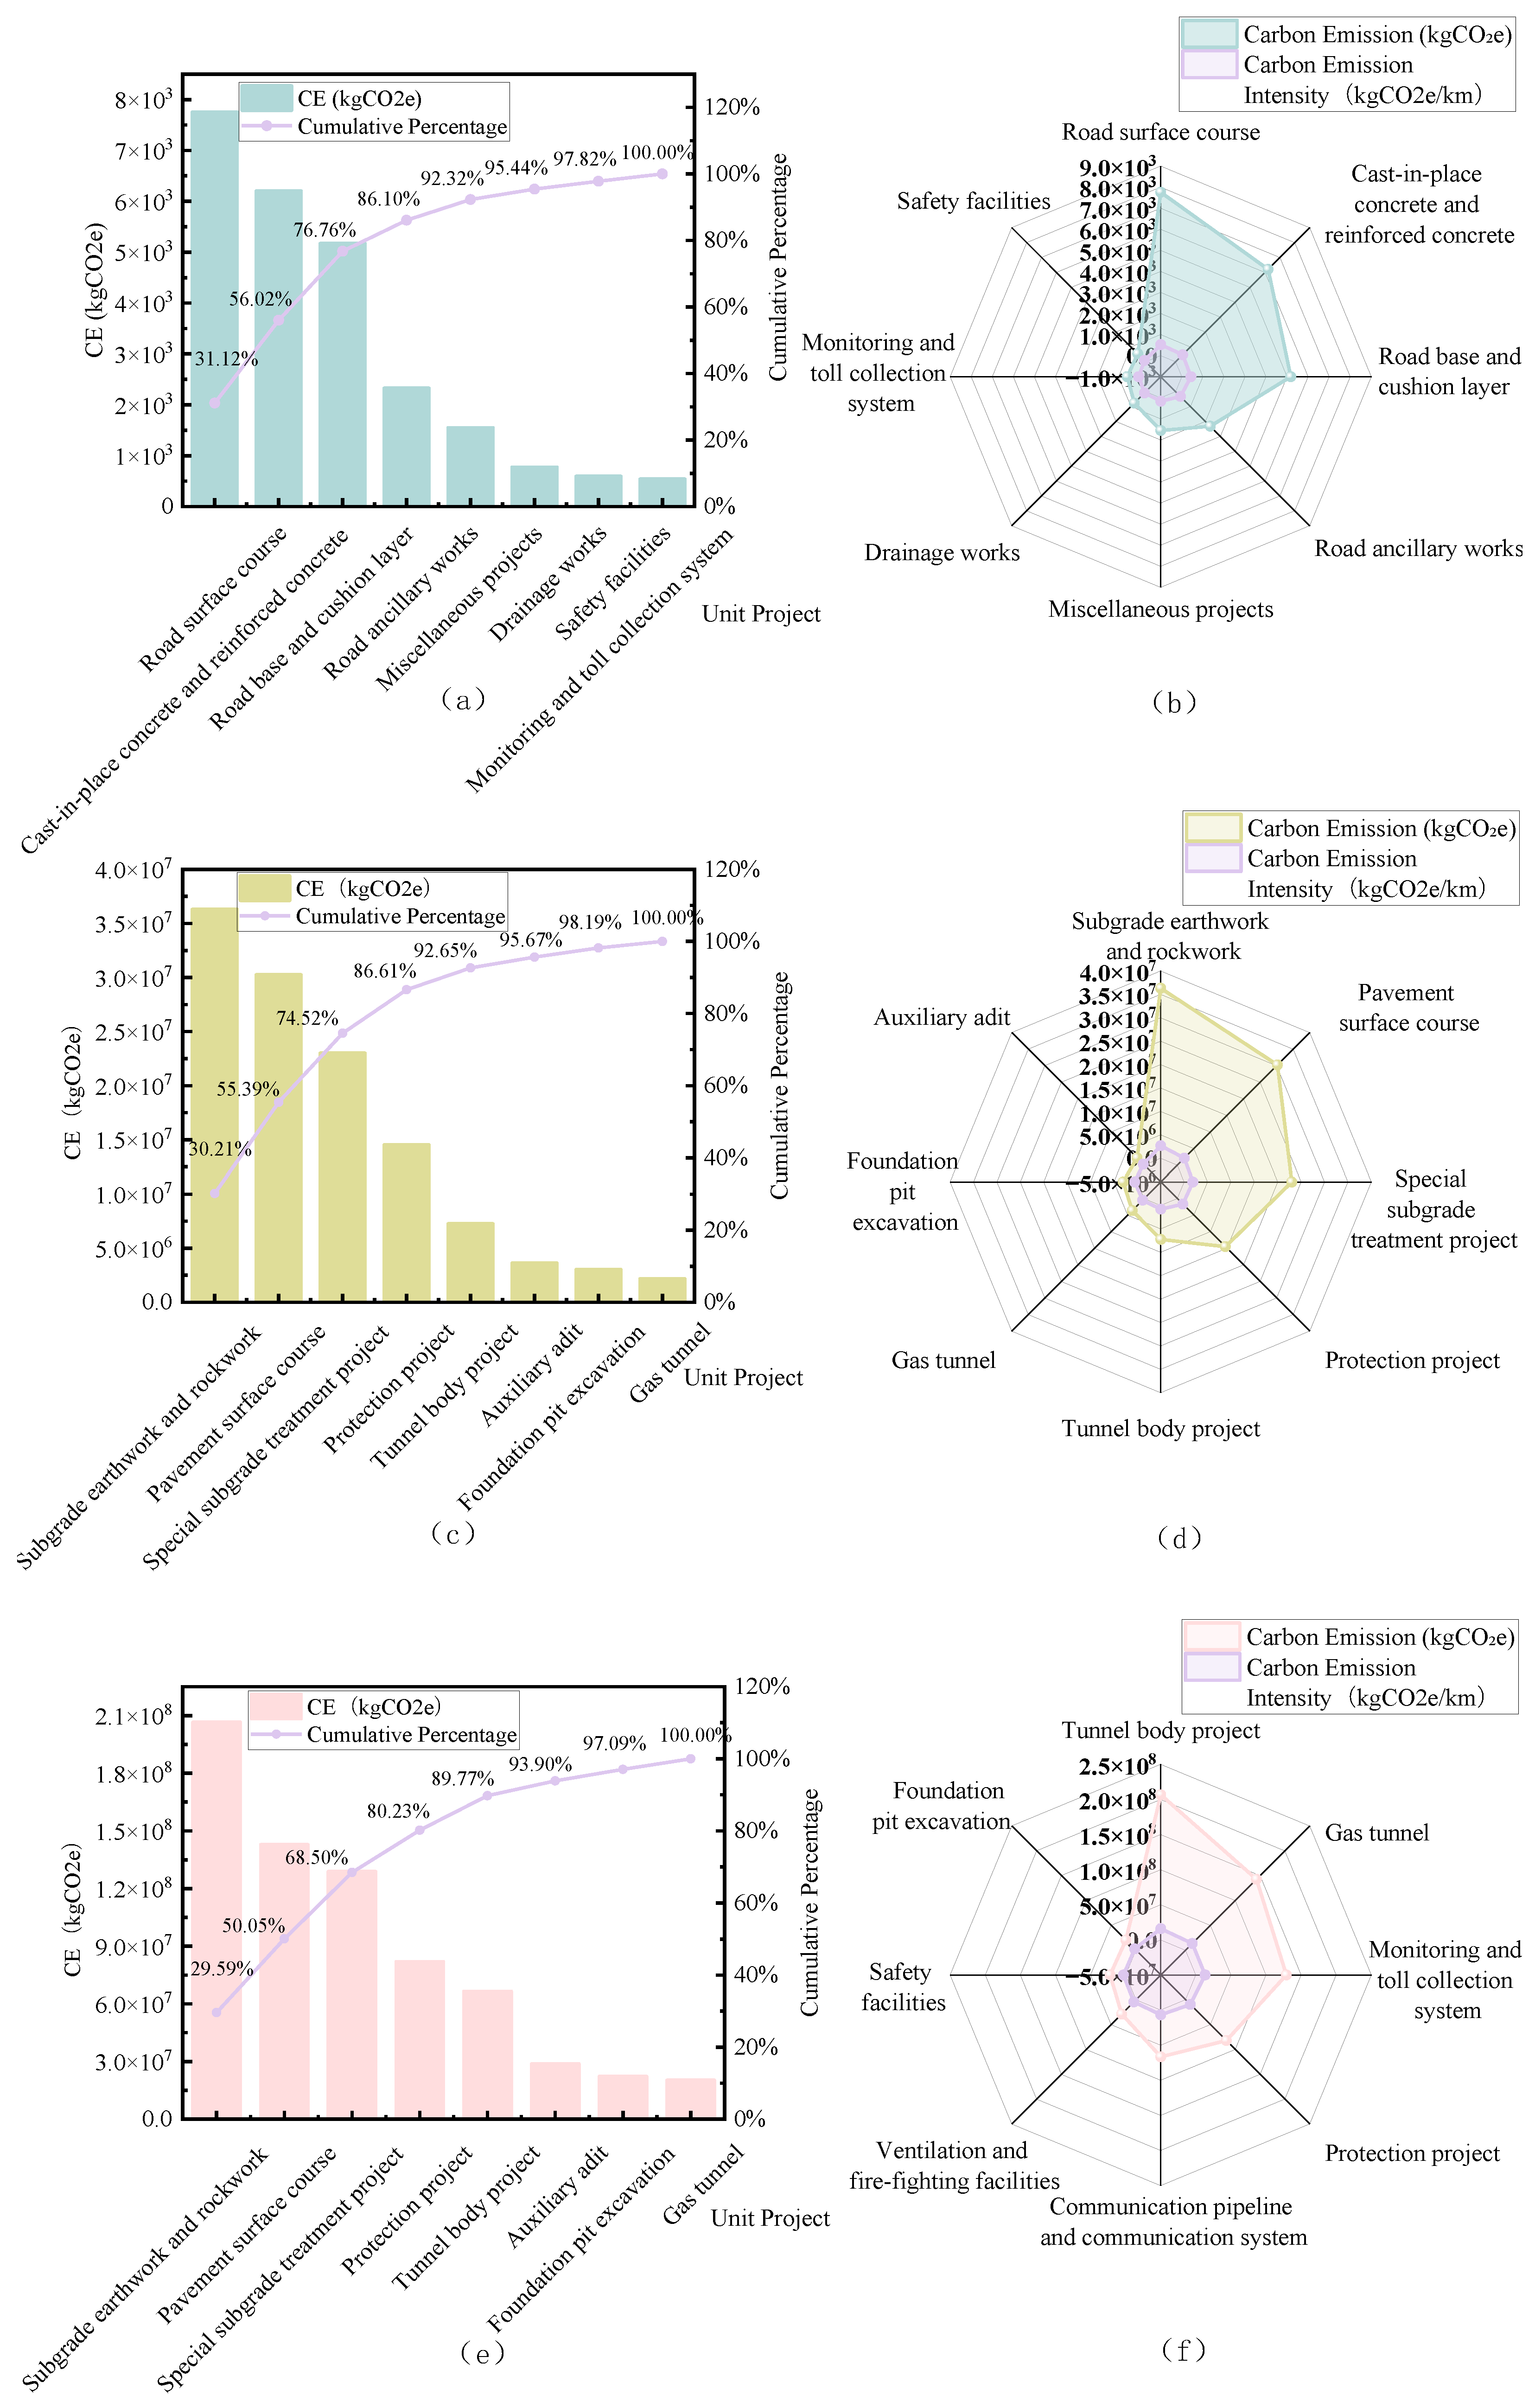
Figure 19.
Life-cycle emission analysis using the customized IPCC-EFDB: (a,c,e) Bar charts: total emissions for NH320, HSY, and NHG25 (b,d,f) Pie charts: stage contributions (excluding supplementary stage).
Figure 19.
Life-cycle emission analysis using the customized IPCC-EFDB: (a,c,e) Bar charts: total emissions for NH320, HSY, and NHG25 (b,d,f) Pie charts: stage contributions (excluding supplementary stage).
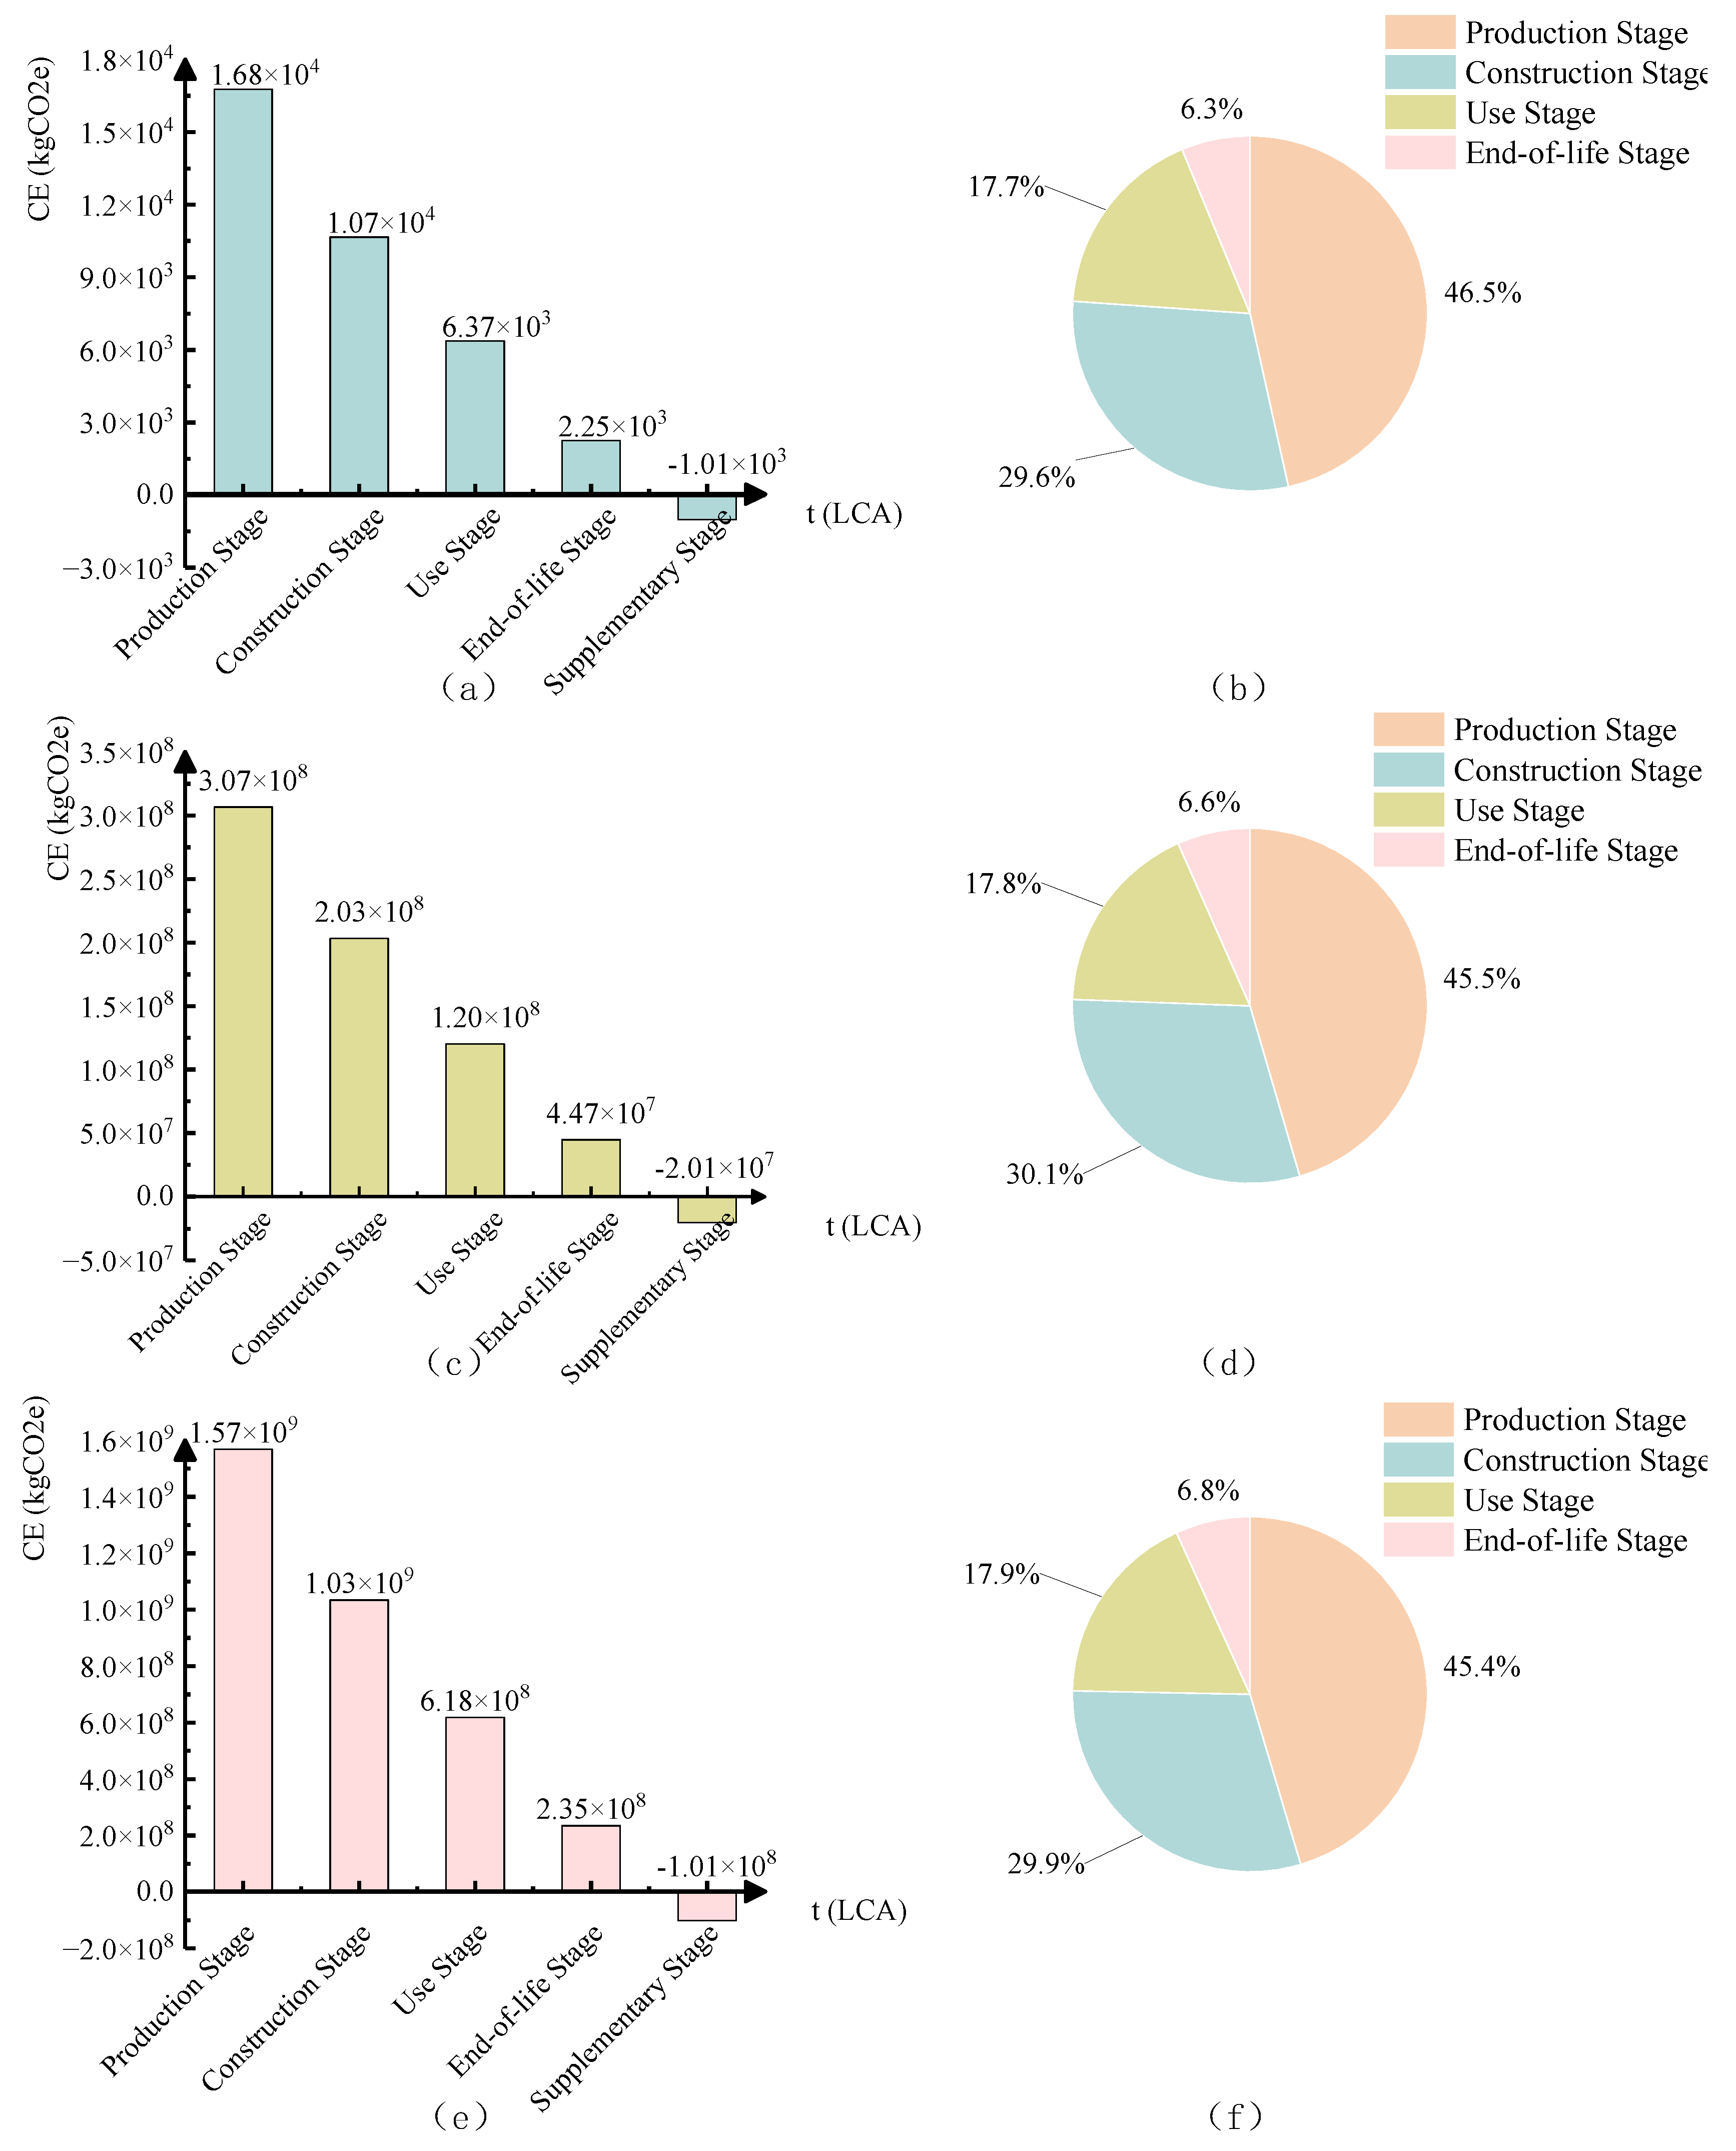
Figure 20.
Production stage material analysis using customized IPCC-EFDB: (a, b) Material breakdown and percentages for NH320 (c, d) Material breakdown and percentages for HSY (e, f) Material breakdown and percentages for NHG25.
Figure 20.
Production stage material analysis using customized IPCC-EFDB: (a, b) Material breakdown and percentages for NH320 (c, d) Material breakdown and percentages for HSY (e, f) Material breakdown and percentages for NHG25.
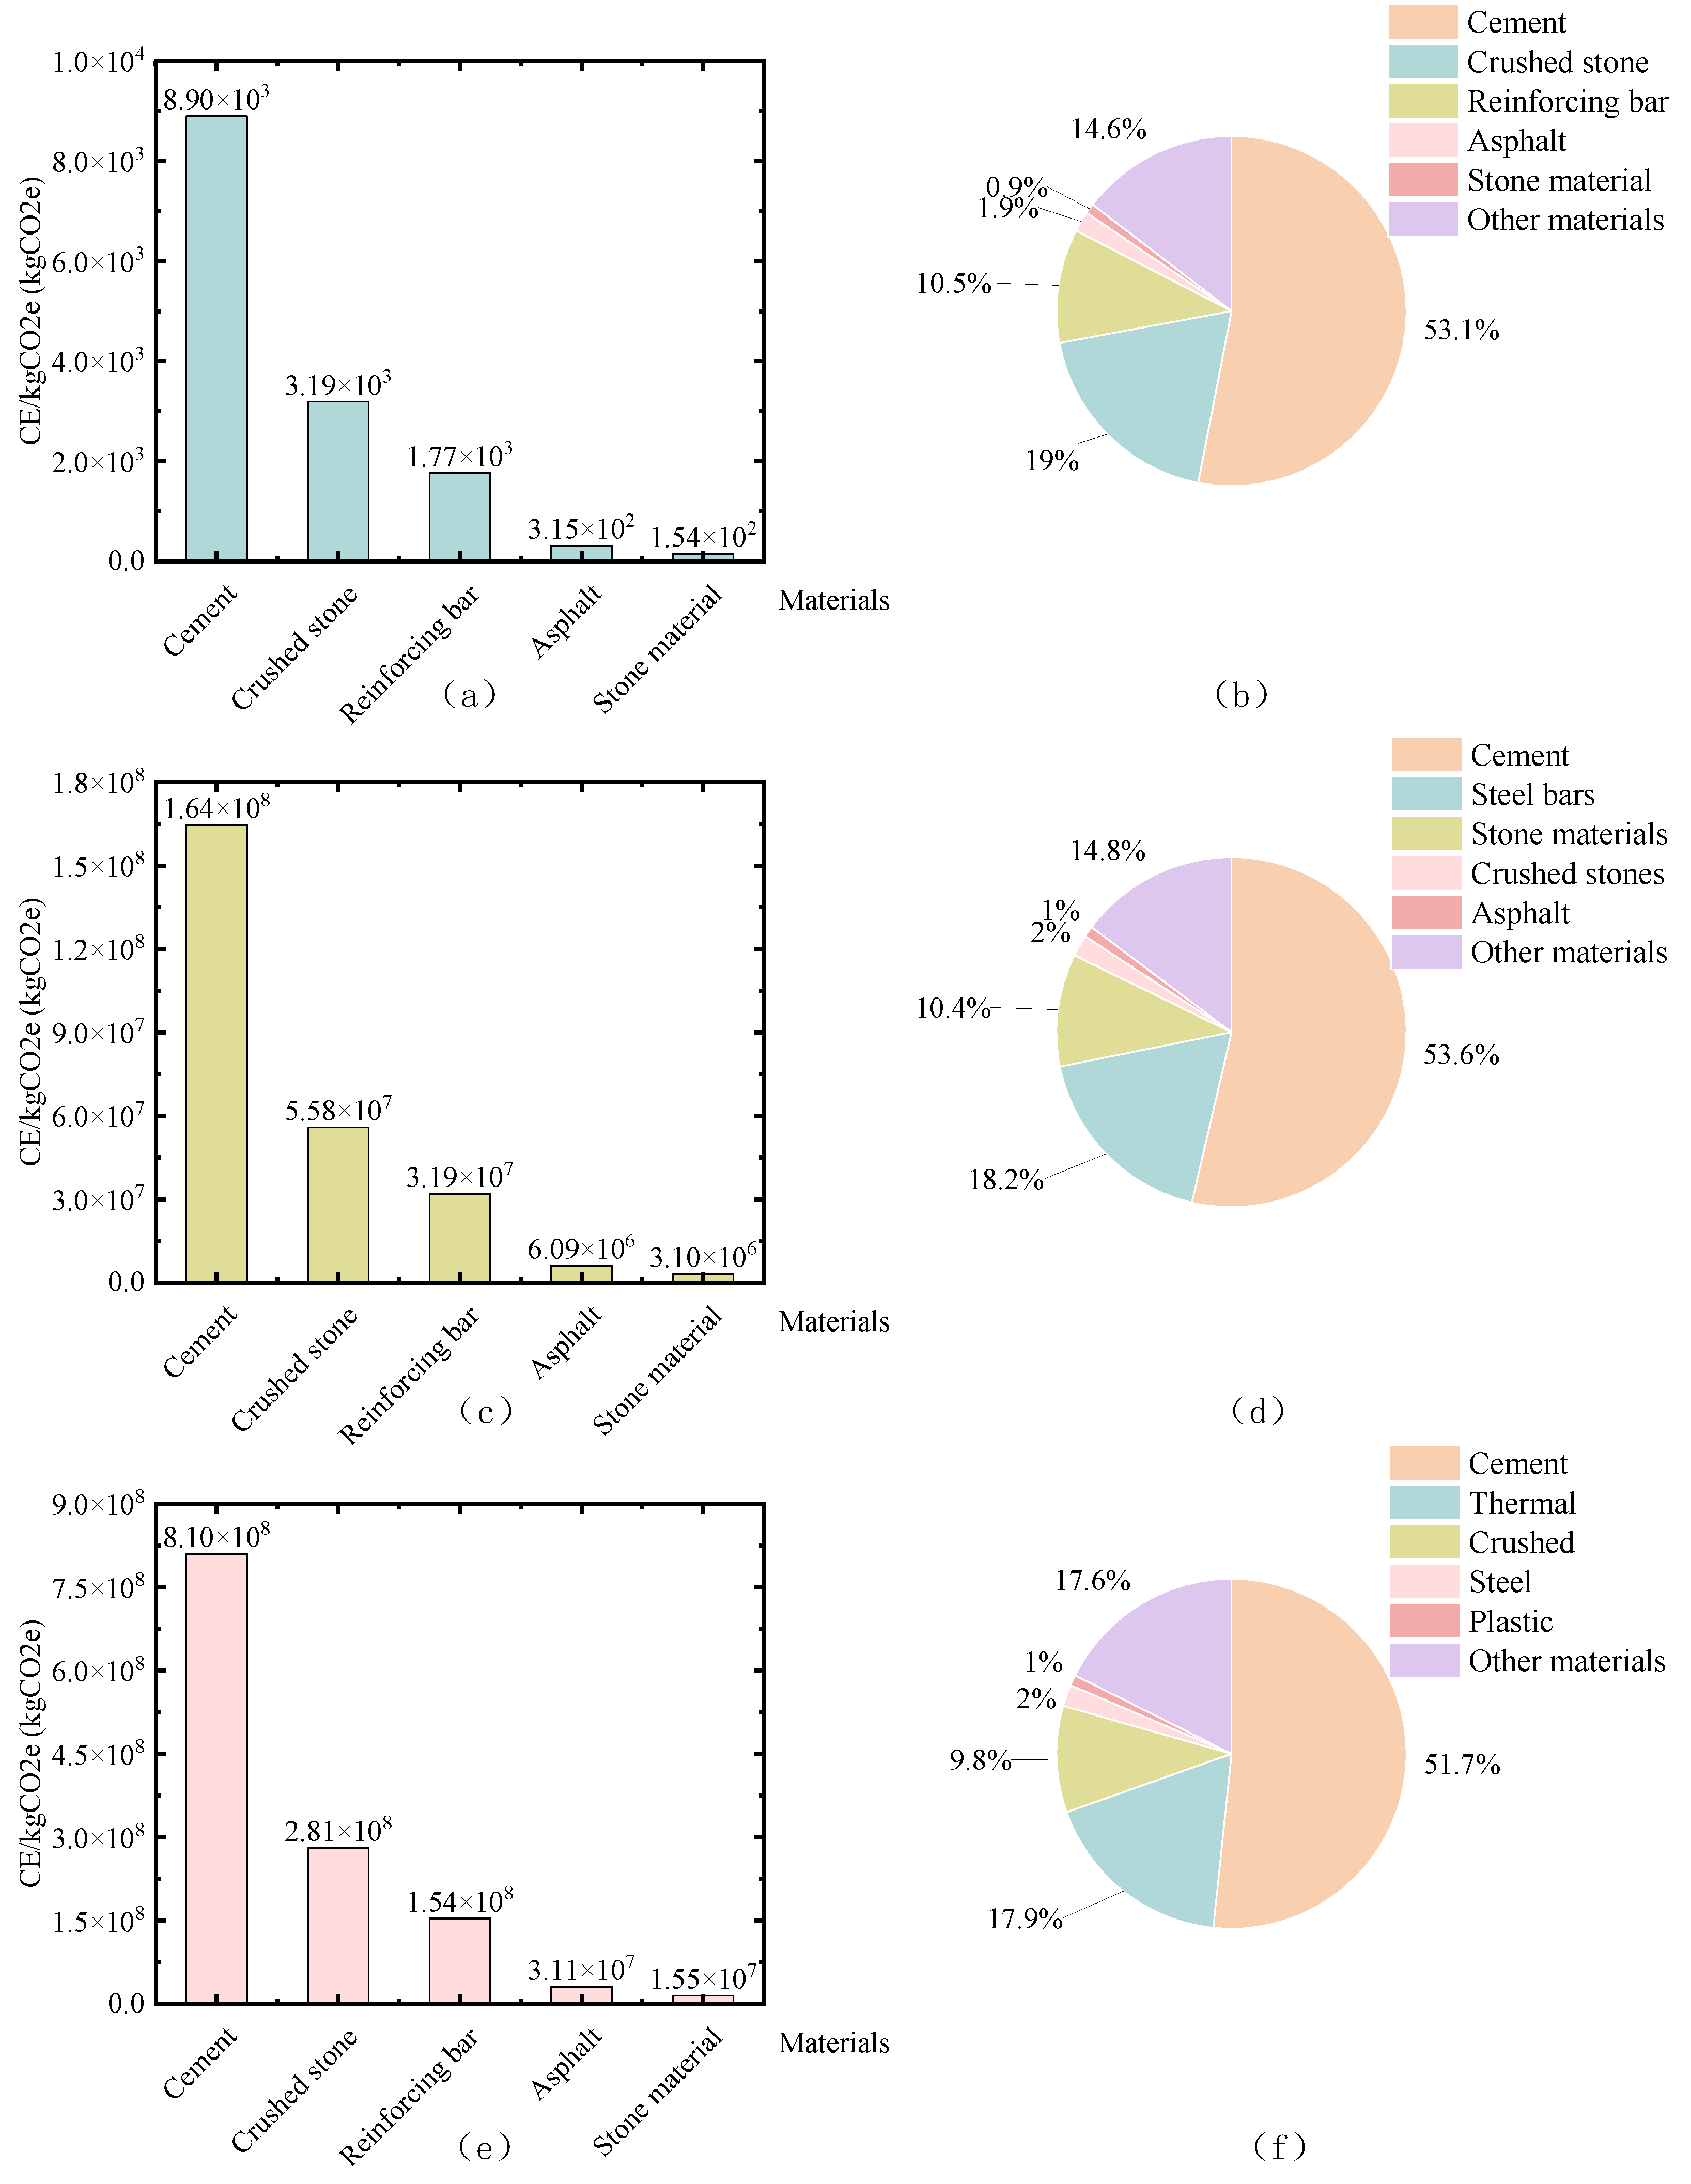
Figure 21.
Construction stage sub-projects analysis using customized IPCC-EFDB: (a, c, e) Pareto charts of top 8 emission sources (b, d, f) Radar charts of carbon emission intensity vs. total emissions.
Figure 21.
Construction stage sub-projects analysis using customized IPCC-EFDB: (a, c, e) Pareto charts of top 8 emission sources (b, d, f) Radar charts of carbon emission intensity vs. total emissions.
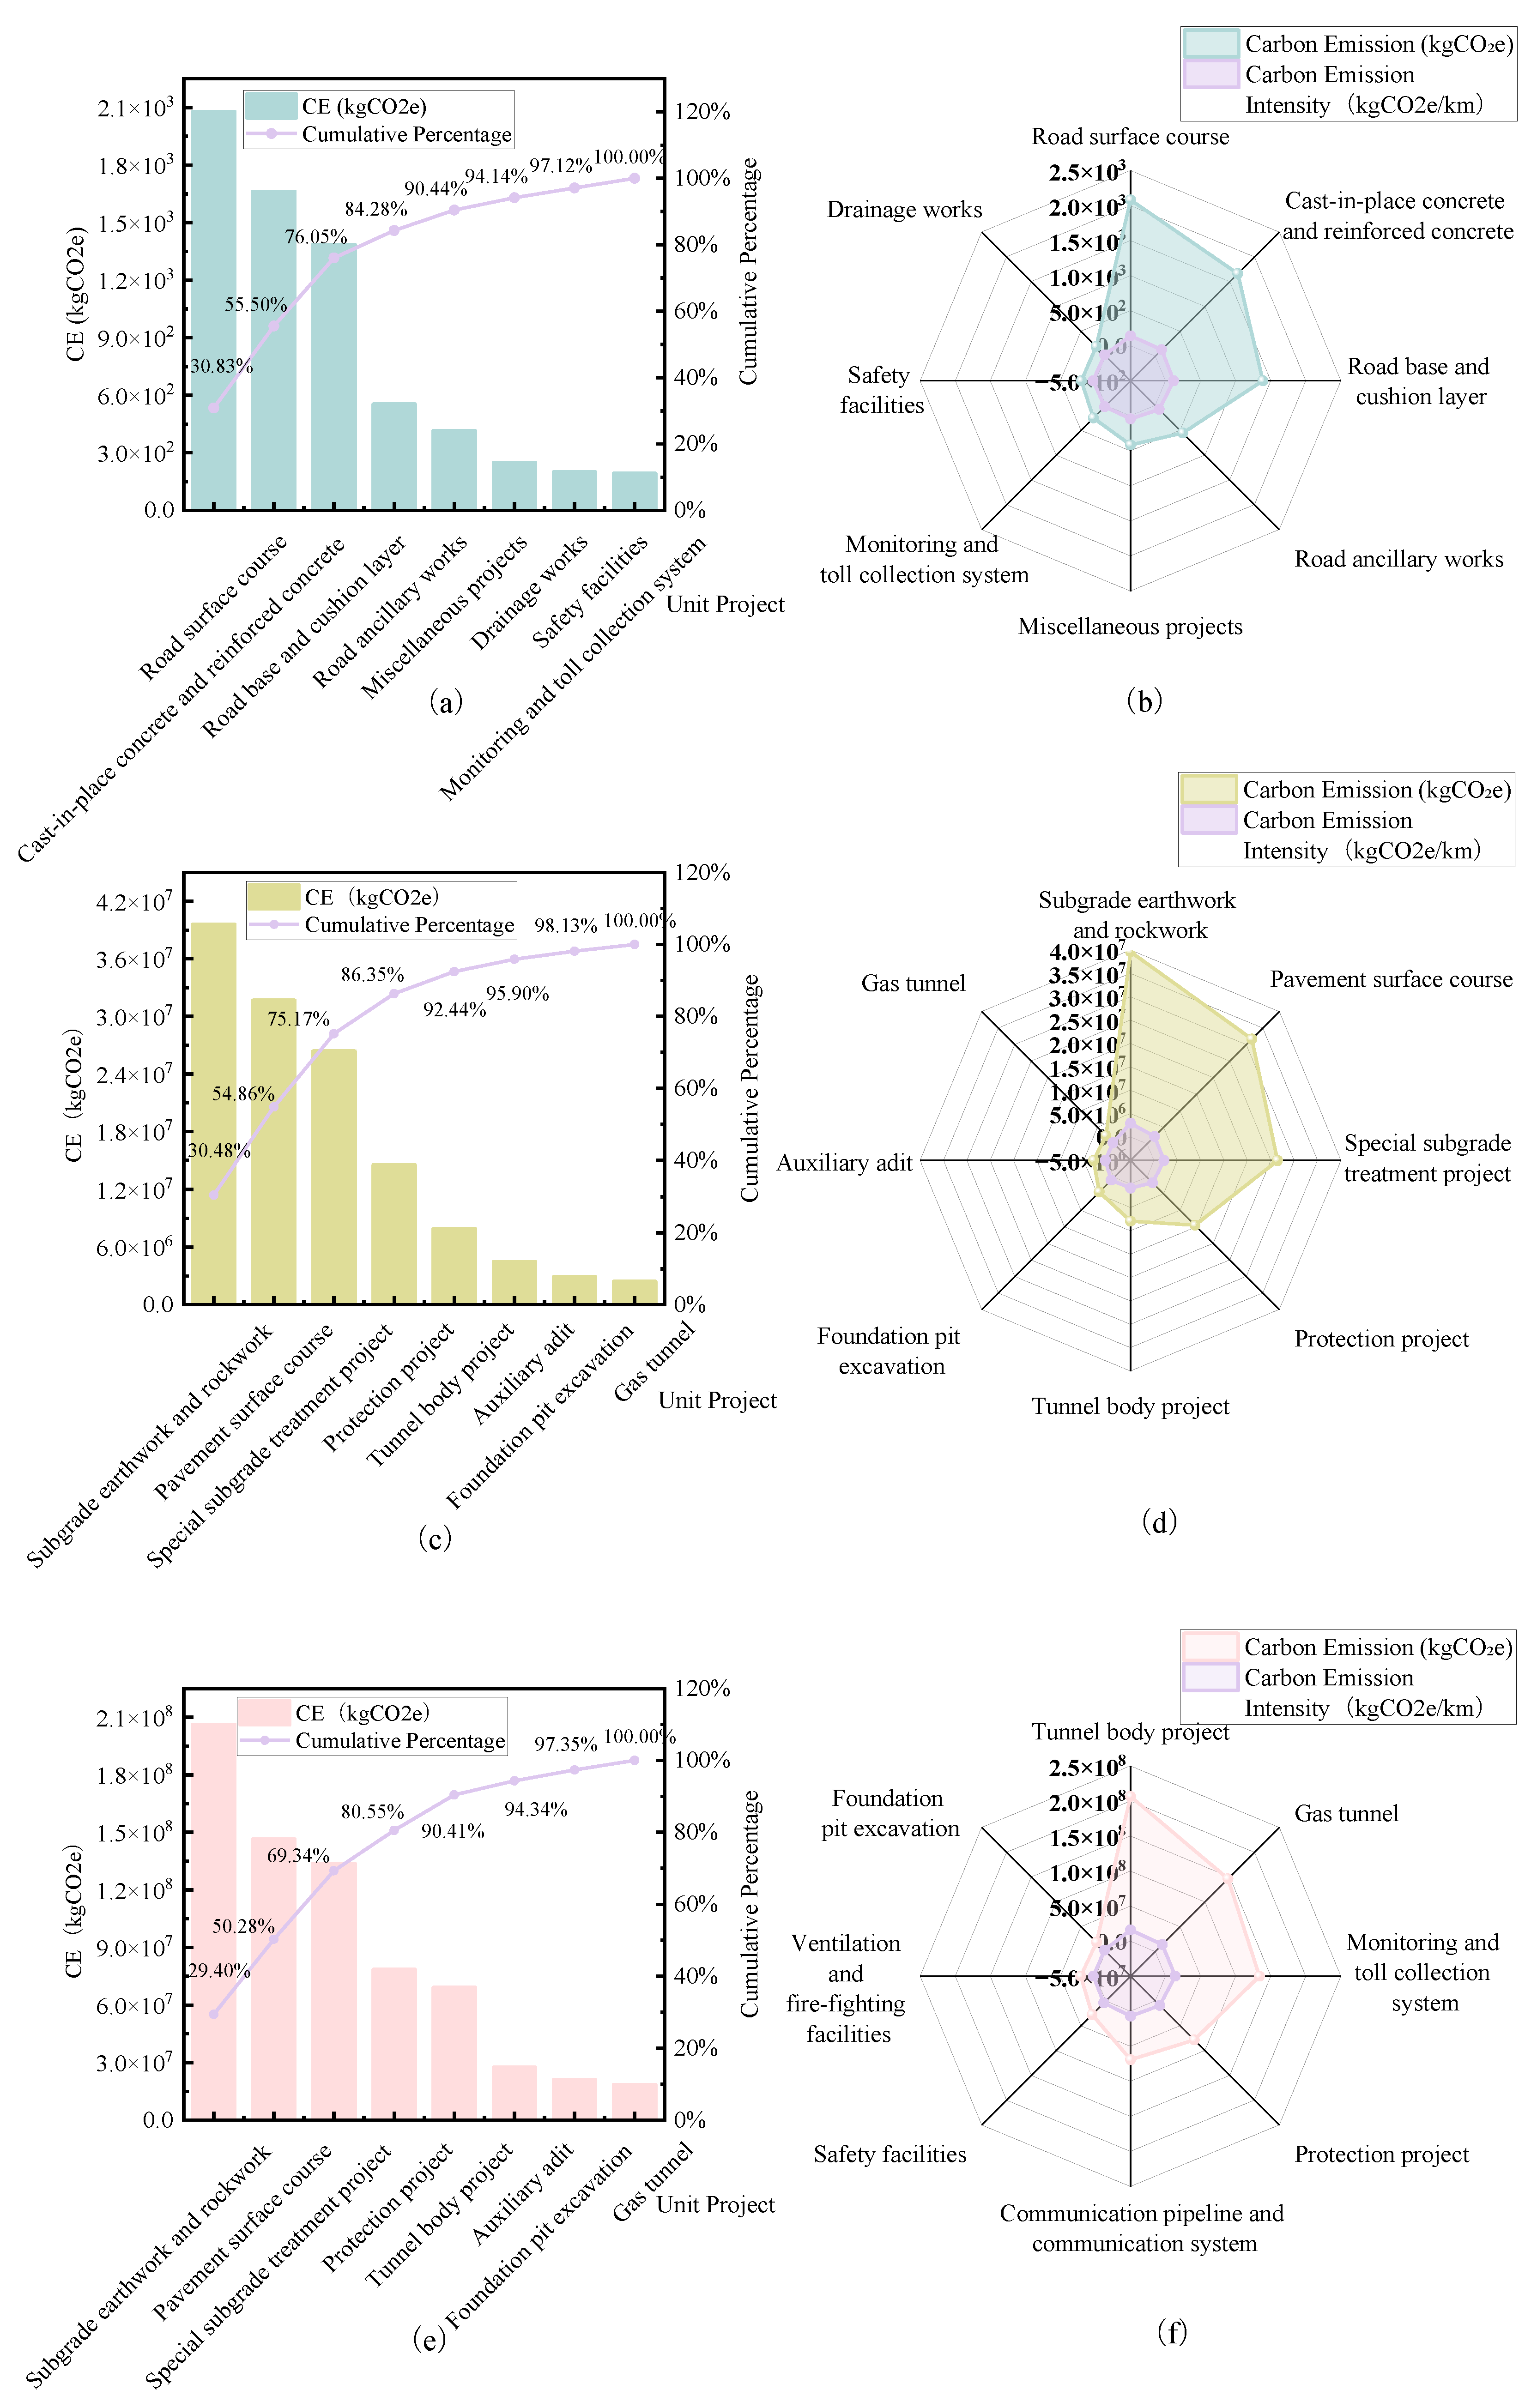

Table 1.
Comparison of carbon accounting software.
| Software Name | Country | Functionalities | References |
|---|---|---|---|
| SimaPro | Netherlands | Facilitate multi-impact category carbon assessments. Support detailed life-cycle analysis for environmental decision-making. |
Starostka-Patyk et al. [24] |
| Umberto | Germany | Focuse on comprehensive product system life-cycle evaluations. Identify sustainability improvements for optimized system performance. |
Orr et al. [25] |
| Gabi | Germany | 1. LCA calculations with granular process breakdown. 2. Comprehensive database with efficient data retrieval. | Tam et al. [27] |
| Carbon e-Management | China | 1. Cloud-based SaaS model with low implementation cost. 2. One-stop solution for Small and Medium Enterprises (SME) carbon management. | Tang et al. [26] |
Table 2.
Life-cycle stages in the proposed model.
| No. | Stages | Content | Category |
|---|---|---|---|
| 1 | Production | Carbon emissions during material extraction, processing, and manufacturing of construction components | Traditional Life-cycle Stages |
| 2 | Construction | Carbon emissions during the transportation of construction materials to the site, the installation of components, and the use of machinery | |
| 3 | Use | Carbon emissions generated through building usage, maintenance, repair, renovation, and operational electricity/water consumption | |
| 4 | End-of-life | Carbon emissions from building demolition, deconstruction, waste material transportation, and waste disposal | |
| 5 | Supplementary | Carbon benefits from material recycling (e.g., scrap steel substitution), reuse, and biogenic carbon sequestration through greening initiatives | Additional Life-cycle Stage |
Table 3.
Carbon emission types across life-cycle stages.
| No. | Emission Type | Production Stage | Construction Stage | Use Stage | End-of-life Stage | Supplementary Stage |
|---|---|---|---|---|---|---|
| 1 | Material Production | ✓ | ||||
| 2 | Transportation | ✓ | ✓ | ✓ | ||
| 3 | Construction Installation | ✓ | ||||
| 4 | Machinery Equipment | ✓ | ||||
| 5 | Material Replacement | ✓ | ||||
| 6 | Structural Demolition | ✓ | ||||
| 7 | Waste Management | ✓ | ||||
| 8 | Operational Energy Use | ✓ | ||||
| 9 | Reuse Sequestration | ✓ | ||||
| 10 | Biogenic Carbon Sequestration | ✓ | ||||
| 11 | Afforestation Sequestration | ✓ |
Table 4.
Introduction to original and customized ICE, EU-EFDB, and IPCC-EFDB.
| Database | Country/Region | Content | Features | Modification Methods | Customized CEF Entries |
|---|---|---|---|---|---|
| ICE | UK | Building materials Construction processes Transportation Waste management Building energy consumption |
Specialized in construction sector, rich historical data, authoritative sources. Limited coverage outside construction, slow update cycle. |
1. Unit conversion using Standard for Building Carbon Emission Calculation(GB/T 51366-2019) [31] and Guidelines for Corporate Greenhouse Gas Emission Accounting and Reporting (2013) [38] 2. Enhanced construction-stage calculation methods using Standard for Quantity Calculation of Housing Construction and Decoration Projects (GB/T 50854-2024) [29] and Quotations for Highway Engineering Budgeting (JTG/T 3832-2018) [30]. 3. Supplementary stage factors added from carbon reduction studies |
1,574 |
| EU-EFDB | Europe | Building materials Transportation Agriculture Waste management Building energy consumption |
Pollutant data integration, real-time updates, broad sector coverage. Limited data in industrial production and land-use changes. |
Same | 1,605 |
| IPCC-EFDB | Global | Building materials Transportation Industrial production Land-use changes Waste management Building energy consumption |
Global policy benchmarks, standardized methodologies, widely recognized references. Infrequent updates, may lack recent trends (e.g., building energy consumption). | Same | 1,548 |
Table 5.
Some typical CEFs for customized ICE,EU-EFDB, and IPCC-EFDB.
| LCA Stage | Category | Type/ Item |
Specification/Region | Customized ICE | Customized EU-EFDB | Customized IPCC-EFDB |
|---|---|---|---|---|---|---|
| Production Stage | Raw Material Supply | Cement (32.5 grade) kgCO₂e/kg |
- | 0.55 | 0.88 | 0.53 |
| Steel (section steel)/kgCO₂e/kg | - | 2.12 | 2.46 | 2.67 | ||
| Rock Wool Board kgCO₂e/kg |
120-160 kg/m³ | 1.99 | 1.49 | 1.54 | ||
| Construction Stage (Manual Input) |
Freight Transport | Road Transport kgCO₂e/(kg·km) |
Fully Loaded | 1.10×10⁻⁴ | 1.12×10⁻⁴ | 1.09×10⁻⁴ |
| Construction Installation | Concrete Mixing Plant/kgCO₂e/h | ≤60 m³/h | 57.51 | 63.96 | 55.14 | |
| Double Drum Vibratory Roller/kgCO₂e/h | ≤15 t | 66.02 | 68.75 | 76.46 | ||
| Axial Flow Fan kgCO₂e/h |
≤100 kW | 1.37 | 1.01 | 1.06 | ||
| Construction Stage (Quota-based) | Subgrade Works | Rockwork kgCO₂e/quota |
Code 1-1-1 | 71.660 | 75.13 | 69.12 |
| Code 1-1-2 | 41.775 | 45.11 | 46.23 | |||
| Code 1-1-3 | 74.145 | 68.12 | 77.91 | |||
| Use Stage | Replacement | Cement (grade 32.5) kgCOe/kg |
- | 0.55 | 0.88 | 0.53 |
| Electricity Consumption | North China Region kgCO₂e/kWh |
Beijing, Tianjin, Hebei | 0.884 | 0.901 | 0.841 | |
| Northeast Region kgCO₂e/kWh |
Liaoning, Jilin, Heilongjiang | 0.777 | 0.801 | 0.745 | ||
| East China Region kgCO₂e/kWh |
Shanghai, Jiangsu, Zhejiang | 0.704 | 0.791 | 0.688 | ||
| Water Consumption | Water (Tap Water) kgCOe/t |
- | 0.168 | 0.168 | 0.168 | |
| End-of-life Stage | De-construction | Wall (Inner Surface Area) kgCO₂e/m² |
- | 3.40 | 3.47 | 3.45 |
| Transport to waste processing or disposal | Site Common Transport Vehicles kgCO₂e/(kg·km) |
Distant Transport | 1.10 × 10⁻⁴ | 1.12 × 10⁻⁴ | 1.09 × 10⁻⁴ | |
| Disposal of waste | On-site Reuse kgCO₂e/kg |
Local Reuse | 4.3 × 10⁻³ | 4.5 × 10⁻³ | 5.0 × 10⁻³ | |
| Landfill | 0.012 | 0.009 | 0.011 | |||
| Supplementary Stage | Reuse | Concrete (Cast-in-place) kgCO₂e/m³ |
- | -1.23 × 10⁻³ | -1.23 | -1.23 |
| Biocarbon | Timber kgCO₂e/kg |
National | -0.166 | -0.66 | -0.66 | |
| Greening for carbon sequestration | Camphor Tree kgCO₂e/(m²·year) |
-0.978 | -0.978 | -0.978 | ||
| Chinese Fir kgCO₂e/(m²·year) |
-0.811 | -0.811 | -0.811 |
Table 6.
Project profiles and key specifications.
| Project Title | National Highway 320 | Hangzhou-Shaoxing-Ningbo Expressway | National Highway G25 |
|---|---|---|---|
| Contractor | Zhejiang Communications Construction Group Co., Ltd. | ||
| Site Location | Yuhang Huawu to Fuyang Gaoqiao | Hangzhou to Ningbo | Lin’an District to Yuhang District |
| Chainage Limits | K9+600 to K18+273.141 | K0+000 to K4+560.3 | K74+40 to K83+000~K60+000 to K83+000 |
| Length | 8.673 km | 4.560 km | 35.418 km |
| Project Type | Road & Bridge & Tunnel | ||
| Project Overview | The 8.673-km Yuhang Huawu-Fuyang Gaoqiao section of National Highway 320 features a dual six-lane, first-class highway standard, incorporating surface roads and multiple bridges. This typical first-class highway project serves as a reference for carbon accounting in similar engineering contexts. | Located along the southern coast of Hangzhou Bay, the Hangzhou-Shaoxing-Ningbo Expressway (parallel to route G92N of regional ring highway G92) is a key infrastructure project in the Yangtze River Delta metropolitan cluster. Connecting Hangzhou, Shaoxing, and Ningbo, it enhances regional connectivity and supports socioeconomic development. | The 62.715-km expansion of the Changchun-Shenzhen Expressway (G25) in Hangzhou involves complex engineering components, including subgrades, bridges, tunnels, interchanges, and extra-large bridges. This project provides rigorous validation scenarios for carbon accounting software in processing large-scale engineering data. |
Table 7.
Some key real-world sengineering data related with carbon emission.
| Stage | Metric | National Highway 320 | Hangzhou-Shaoxing-Ningbo Expressway | National Highway G25 |
|---|---|---|---|---|
| Production | Material types involved | 49 types | 101 types | 117 types |
| Most consumed material & quantity | 32.5 Cement (5,398.42 t) |
32.5 Cement (24,589.23 t) |
C25 Cast-in-place Concrete (26,578.12 m³) |
|
| Construction | Sub-project | 9 | 153 | 285 |
| Item project | 11 | 216 | 314 | |
| Use | Most frequent replacement material & quantity | Petroleum Asphalt (16.78 kg) | Rubble (89.11 m³) |
Gravel (97.46 m³) |
| Electricity consumption | 1.99×10⁷ kWh | 1.09×10¹¹ kWh | 4.84×10¹¹ kWh | |
| Water consumption | 4.67×10⁶ m³ | 9.79×10⁷ m³ | 8.97×10⁸ m³ | |
| End-of-life | Predominant waste transport & distance | Road Transport (87 km) | Road Transport (169 km) |
Rail Transport (187 km) |
| Supplementary | Primary carbon-sequestration plants & spacing | Camphor Tree (3-5 m) |
London Planetree (2-4 m) |
Huanshan Katsura Tree (5-6 m) |
Table 8.
Life-cycle carbon emissions estimated using three databases.
| Project | Customized ICE (kgCO₂e) |
Customized EU-EFDB (kgCO₂e) | Customized IPCC-EFDB (kgCO₂e) |
|---|---|---|---|
| National Highway 320 | 4.25×10⁴ | 1.29×10⁵ | 3.50×10⁴ |
| Hangzhou-Shaoxing-Ningbo Expressway | 2.13×10⁸ | 5.99×10⁸ | 6.54×10⁸ |
| National Highway G25 | 8.39×10⁹ | 3.29×10⁹ | 3.35×10⁹ |
Table 9.
Carbon emissions values for different construction projects using 1:1:1 weighting of the three databases.
Table 9.
Carbon emissions values for different construction projects using 1:1:1 weighting of the three databases.
| Project Name | Weighted Carbon Emission Value (kgCO₂e) |
|---|---|
| National Highway 320 | 6.88×10⁴ |
| Hangzhou-Shaoxing-Ningbo Expressway | 2.71×10⁸ |
| National Highway G25 | 5.01×10⁹ |
Disclaimer/Publisher’s Note: The statements, opinions and data contained in all publications are solely those of the individual author(s) and contributor(s) and not of MDPI and/or the editor(s). MDPI and/or the editor(s) disclaim responsibility for any injury to people or property resulting from any ideas, methods, instructions or products referred to in the content. |
© 2025 by the authors. Licensee MDPI, Basel, Switzerland. This article is an open access article distributed under the terms and conditions of the Creative Commons Attribution (CC BY) license (http://creativecommons.org/licenses/by/4.0/).
Copyright: This open access article is published under a Creative Commons CC BY 4.0 license, which permit the free download, distribution, and reuse, provided that the author and preprint are cited in any reuse.


