
Submitted:
03 March 2025
Posted:
05 March 2025
You are already at the latest version
Abstract
Methanol is of rising interest as a potential hydrogen storage molecule and chemical building block producible from green hydrogen and captured carbon dioxide. Although the reaction kinetics have been studied for decades and numerous models are available, new recent insights reveal that a so far not quantitatively considered autocatalytic reaction pathway is of large relevance in heterogeneously catalyzed methanol synthesis over Cu/ZnO/Al2O3 catalysts. Inspired by these recent reports, an extended kinetic model was derived and parameterized exploiting the same data base used to parameterize earlier derived models. Thus, we provide the first model for quantifying the kinetics of the heterogeneously catalyzed methanol synthesis from CO/CO2/H2 which includes a methanol-assisted autocatalytic reaction pathway. Various reduced model variants were derived from the suggested model. A comparison with these reduced models and also with recalibrated further literature models reveals that the incorporation of the autocatalytic reaction pathway is beneficial. This finding encourages further assessment and validation considering a broader data base.
Keywords:
methanol synthesis
; heterogeneous catalysis
; autocatalysis
; CZA catalyst
; model derivation
; reaction kinetics
; reaction mechanism
1. Introduction
Methanol is an important chemical building block, a potential hydrogen carrier and a fuel [1]. Its industrial production started in the beginning of the 20th century with different metal oxide catalysts. In the 1960’s more active copper containing catalysts could be established in the industry due to improved removal of sulfur containing compounds from the feed gases and reduced poisoning. This and the beneficial inclusion of CO2 in the feed stream allowed for running the methanol synthesis process at lower pressures (from 200 bar to 50-100 bar) and temperatures (from 673 K to 503 K) [2]. The typical catalyst consisting of Cu/ZnO/Al2O3 (CZA) established commercially in the mid of the 1960’s [2,3]. The reaction mechanism on such types of catalyst was investigated over decades. Questions regarding the carbon source (CO or CO2), the number and character of active sites, the reaction mechanism and rate-determining steps were studied intensively [2].
Recent work of the Christensen group and the Muhler group reveals that a methanol-assisted reaction pathway is of large importance [3,4]. Furthermore, Thrane et al. postulate that the major number of turnovers for the applied conditions in the industrial process is through this autocatalytic pathway [4]. The Brilman group emphasizes in recent work the need to take the influence of methanol and water on the reaction mechanism into account [5]. Our work is a contribution to that. To the best of our knowledge no formulation of a quantitative kinetic model taking this pathway into account is available in the literature until now.
The aim of this contribution is to derive a mechanistically based kinetic model for the methanol synthesis including a methanol-assisted autocatalytic reaction route exploiting recent findings in the literature and following a well-established derivation methodology [6]. This model is parameterized utilizing a readily available data set [7,8] and compared with reduced model variants and several literature models.
Conventionally, it is assumed that the CZA catalyst promotes the hydrogenation of carbon monoxide (CO), the hydrogenation of carbon dioxide (CO2) and the (reverse) water gas shift reaction (WGS) as assumed by Graaf et al. [9]. For kinetic modeling different simpler options based on neglecting one of the reactions can be found [10,11]. Depending on the feed composition and the reaction temperature the relevance of the three mentioned reactions differs [12]. Feeds consisting despite minor impurities only of CO/H2 as well as CO2/H2 can yield significant amounts of methanol [7]. It is widely accepted that mixed feeds containing CO/CO2/H2 generate the most methanol and that the hydrogenation of CO2 is at least dominant under industrial conditions for CZA catalysts [13,14,15]. The presence of CO is beneficial because it removes inhibiting water via WGS reaction [14,15]. Some authors postulate that the direct hydrogenation of CO is not occurring at all on commercial CZA catalysts under relevant temperatures because no methanol formation was observed applying purified CO/H2 feeds free of CO2 and H2O [16,17]. The authors of this contribution are not convinced that this claim is generally valid for all commercial CZA catalysts over the entire temperature range of industrial methanol synthesis. Several other authors consider the direct CO hydrogenation as relevant reaction pathway for at least specific conditions like low CO2 contents in the feed [14,18] or at higher reaction temperatures [12]. Thus, in this work, a direct CO hydrogenation is included in the analysis together with model versions neglecting this reaction. Additionally, we assume inspired by Schwiderowski et al. as a fourth reaction the methanol-assisted hydrogenation of CO2 [3]. The complete reaction network evaluated is illustrated in Figure 1.
2. Kinetic Description and Model Derivation
Based on recent literature, elementary reaction steps and rate-determining steps are assumed. Rate approaches are derived for all four main reactions which are considered in the model. The reactor model which is used later on for parameter estimation is also introduced.
For simplicity, ideal gas conditions are assumed and partial pressures are used for the model formulation. The majority of the re-analyzed experiments (136 of 140) was conducted at 30 – 60 bar. The model accuracy at higher pressures could be still increased using fugacities. For the model derivation all reactive components are assumed to adsorb. An adsorption of inert nitrogen is neglected. Adsorption is regarded as an elementary reaction step and conventionally formulated as a forward reaction while the desorption of a component is formulated as backward reaction.
The focus of this contribution is not a consideration of the chemical nature of the active sites. This aspect is not required. Only the assignment which reaction and adsorption phenomena occur on which site is important for the derivation of the equations. Following de Oliveira Campos et al. and Seidel, three active catalytic sites are considered for adsorption and reaction [18,19,20]. Site 1 () is metallic copper active for hydrogenation of CO and WGS. Site 2 () is a unspecified copper zinc species offering a contact area active for hydrogenation of CO2 with and without methanol-assistance as well as for WGS. An additional site 3 () is active for adsorption and splitting of hydrogen and water.
2.1. Elementary Reaction Steps
For every reaction pathway a table summarizes the assumed elementary reaction steps, an ID for each step in the pathway, an equation for every step as well as the equation number (separate numbering with S) which regards the steps of all reaction pathways (Table 1, Table S1-S4 in the Supporting Information SI 1). The step which is treated as rate-determining is bold printed and marked with an asterisk*.
CO hydrogenation: Despite the low importance of the direct hydrogenation of CO for mixed CO/CO2/H2 feeds under industrial conditions, it is considered for some variants of the model and neglected for others which will be compared later. It is assumed to take place only on one site, which is the metallic copper (site 1) [18,19,20]. A stepwise hydrogenation of CO is considered (see Table S1) [9,14,18,19,21]. A difference to most other kinetic models is the assumption that also methanol adsorbs as assumed by Vollbrecht [7,8,22]. The rate-determining step (step A4 in Table S1) was adopted from de Oliveira Campos et al. [18,19,23].
CO2 hydrogenation without methanol-assistance: From the results of a reaction flow analysis de Oliveira Campos et al. drew the conclusion that the hydrogenation of CO2 occurs mainly on site 2 (involving Zn) [18]. Thus, in our contribution it is assumed that both the hydrogenation of CO2 with and without methanol-assistance occur only on site 2. The hydrogenation of the intermediate formate HCOO* is assumed to be rate-determining (step B4 in Table S2) [3,14,21]. The elementary reaction steps of the CO2 hydrogenation are in line with Studt et al. and de Oliveira Campos et al. supplemented by the methanol adsorption (see Table S2) [14,18,19,20].
Water gas shift reaction: For the WGS reaction a carboxyl mechanism is considered occurring on both active sites 1 and 2 via the same elementary steps [18,19,24]. The reaction of a carboxyl species COOH* with a hydroxy species OH* is considered to be rate-determining (step C5 / D5 in Table S3 / S4). De Oliveira Campos et al. formulated the reaction as reverse WGS and considered this elementary step as rate-determining [18,19,23]. Due to the assumption of a rate-determining step all other reactions are at quasi-equilibrium. Adapting this simplification, the same step is rate-determining in both directions. Thus, this step (C5 / D5) was chosen as rate-determining one for the WGS reaction on both active sites in the following. In contrast, Studt et al. postulate the water-splitting into OH* and H* to be rate-determining for the WGS (step C3 / D3 in Table S3 / S4) [24]. The elementary reaction steps of the WGS reaction were adopted from Studt et al. and de Oliveira Campos et al. (see Table S3 and Table S4) [18,19,24].
Autocatalytic CO2 hydrogenation with methanol-assistance: Finally, the assumption of the elementary reaction steps of the methanol-assisted hydrogenation of CO2 is based on the catalytic cycle postulated by Schwiderowski et al. [3]. The formation of the intermediate methyl formate ester HCOOCH3* (step E6 in Table 1) is assumed to be rate-determining because it is the elementary step converting formate HCOO* which is the educt of the rate-determining step in the CO2 hydrogenation without methanol-assistance. The reaction mechanism is summarized in Table 1.
2.2. Reaction Rates
For every reaction the concept of a rate-determining step is applied for reasonable simplification. All other elementary steps are then assumed to be at quasi-equilibrium. Thus, the overall rate can be obtained by substitution of the unknown variables in the overall rate equation of the rate-determining step. This is shown exemplary for the new pathway of the autocatalytic hydrogenation of CO2 in this chapter. The derivations are summarized for all reactions in SI 2.
Starting from the brutto rate equation of the rate-determining step E6 (Equation (S24)) all adsorbed surface species are replaced with the equations for the steps assumed to be at quasi-equilibrium (E1-5,E7-10) from Table 1. The overall rate of the pathway equals the rate of the rate-determining step.
This inserting procedure is shown in more detail in the SI 2 and leads to Equation (2).
The backward rate coefficient of the rate-determining step can be substituted with the help of the equilibrium constant of the step (Equation (3)).
After some rearrangements one obtains Equation (4).
Due to the mass action law, the equilibrium constant of the hydrogenation of CO2 must be equal with and without methanol-assistance (Equation (5)).
Lumping constants together leads to the final rate equation (Equation (6)).
The rate equations of the other reactions (Equations (7-9)) were derived in a similar way using the assumptions summarized in chapter 2.1 (SI 2).
Studt et al. postulated that the rate of the WGS is similar on both active sites [24]. Thus, for the sake of simplicity, we assumed that the rate constants of the WGS are equal for both active sites and can be represented by one rate constant in this contribution. The equilibrium constants were calculated with empirical correlations taken from Graaf & Winkelman [25] and summarized in SI 4. The temperature dependency of the reaction rates is handled applying a temperature-centered Arrhenius approach (Equation 10) [26]. Every reaction rate constant consists of two parameters resulting in eight parameters for all reaction rate constants (-). was used.
2.3. Surface Coverages
The reaction rates (Equations (6-9)) depend on the reactant partial pressures and the surface coverages of the free active sites. The latter can be calculated with the help of the balance equations of the active sites containing all adsorbing species and free sites (Equations (11-13)).
The surface coverages of all adsorbing species were substituted with the equations of the quasi-equilibrated elementary steps from Table 1 and Table S1-S4. The full derivation is shown in SI 3. After inserting, rearrangement and lumping constants together one obtains Equations (14-16).
In addition to the full model, reduced models were tested. One or two of the four reaction rates (Equations (6-9)) and the corresponding surface coverages of adsorbed species in the balances of the active sites (Equations (11-13)), forcing parameters to be zero a priori, were neglected in these cases. Furthermore, literature models were refitted to the data set used in this study for comparison [10,27,28]. The equations for these models can be found in the SI 6.
2.4. Reactor Model
The already published experimental data set used in this work was generated performing experiments with an isothermally and isobarically operated micro Berty reactor ensuring gradient-free conditions allowing an easy evaluation of kinetic data [7]. The component balance of a perfectly mixed continuously stirred tank reactor (CSTR) is given in Equation (17). The total molar inlet flow rate (respective the total volumetric flow rate) differs from the total outlet flow rate due to the reduction in mole number through methanol synthesis.
According to Keßler & Kienle, can be substituted with the help of the total material balance (summation over all species) leading to the following steady state component balance for each species [29]. Ideal gas behavior was assumed. The mass of catalyst was 3.95 g.
This results in a system of six algebraic equations that can be summarized as Equation (19).
is the vector of mole fractions and is the vector of parameters that have to be considered for the corresponding kinetic model.
3. Parameter Estimation Methodology
An experimental data set produced by Vollbrecht was used for the parameter estimation. A description of the experimental setup and the methods applied can be found in his doctoral thesis [7]. The data set itself was also published by Seidel et al. [8]. It consists of 140 isothermal, isobaric steady state experiments conducted in a kinetic micro Berty reactor filled with 3.95 g of a commercial CZA catalyst exploiting feeds with only CO, only CO2 or both as carbon source yielding industrial relevant amounts of methanol (230-260 °C, 30-70 bar).
To identify the parameters of the kinetic model the following least squares optimization problem was implemented and solved in the programming language Julia [30]:
The objective function is defined in Equation (23) as quadratic normalized deviation of the mole fractions of the carbon species between the simulation and the experimental data.
The factor ensures a reasonable residual even for experimental values of zero or close to zero. The simulated values are obtained in each step by solving the resulting system of algebraic equations by a Newton-Raphson method implemented in the package NonlinearSolve.jl (Equation (19)) [31]. We assume that the algebraic equations have always a unique solution [32]. Accordingly, the experimental data points were used as initial values for the mole fractions, resulting in a well-initialized state close to the actual solution. Furthermore, the adsorption constants and the parameters corresponding to the activation energies () must always be greater than zero. Therefore, these parameters were exponentially transformed to avoid negative values during the optimization (Equation (21)). denotes the total number of derived parameters.
The function is a regularization term and is introduced to obtain physical reasonable parameters and to increase their identifiability. For this purpose, the experiments were divided into subsets to estimate the parameters for the individual reactions separately in a first step and use these values later on as initial values and for a regularization of the parameters corresponding to the activation energies. First, all experiments without CO2 in the feed were used to fit the direct CO hydrogenation. All other reactions were neglected in this case. Secondly, the data without CO in the inlet was utilized to estimate the initial parameters for the CO2 hydrogenation without methanol-assistance and the WGS reaction while the rates of CO hydrogenation and autocatalytic pathway were set to zero. The autocatalytic hydrogenation of CO2 with methanol-assistance was neglected in this step because the carbon-based yield of methanol is small (< 3%) compared to CO/CO2 mixed feeds. After that, only the cases with both CO and CO2 in the feed were considered for the identification of the initial parameters of the autocatalytic hydrogenation of CO2 with methanol-assistance while the CO hydrogenation was neglected and the other reactions were regularized in this case. With this, reference values for all four activation energy related parameters were obtained which were used for their regularization in the final fit of all parameters with all experiments. In addition to that, we also add a term to minimize the remaining constants and to reduce the number of parameters resulting in the regularization function (Equation (23)).
How strong the regularization influences the objective function in Equation (22) and thus the parameter estimation depends on the regularization factor in Equation (23). In the following we used . Details on this and the used values for are summarized in SI 5. The optimization problem was solved with the Optimization.jl package [33] by using direct solvers of Optim.jl. The minimum was obtained by repeatedly applying a particle swarm optimization (1000 iterations) to escape from local optima, and a Nelder Mead algorithm to finally converge to a minimum.
4. Estimated Parameters and Model Evaluation
The resulting parameters for all models are summarized in Table 2. always represent a kind of collision factor, while always correspond to an activation energy related parameter in terms of their physical interpretability. After the parameter identification 14 of the 28 parameters of the full model approached zero, which reduced significantly the model complexity. The final number of parameters of the different models analyzed ranges from 8 to 14.
Discussion of Results
a) Parameter values
In the full model , quantifying the rates of all four considered reactions, the methanol-assisted pathway is dominant for CO2/H2 and CO/CO2/H2 feeds. The simulated amount of methanol formed via the autocatalytic hydrogenation of CO2 ranges from 83 to 99% of the total amount of methanol formed under the conditions evaluated. This is in accordance with the postulation of Thrane et al. that this pathway is of major importance [4]. The direct hydrogenation of CO is negligible in the full model for CO2 containing feeds for the evaluated operating conditions. It is therefore unlikely that the consideration of this reaction strongly influences the parameter values identified for the other reactions. This is evident as the respective parameter values of the full model and the reduced model without CO hydrogenation are almost identical (see Table 2). Vice versa, for the CO/H2 feeds without measurable CO2 or water in the reactor inlet, the direct CO hydrogenation reaction allows the description of methanol production in this case. Three further reduced models were tested neglecting (i) CO2 hydrogenation without methanol-assistance (), (ii) the autocatalytic CO2 hydrogenation () or (iii) the autocatalytic pathway and direct CO hydrogenation (). The parameters of the autocatalytic pathway are always similar when this pathway is considered (, , ) supporting the fact that it is dominating. The less important the other methanol producing reactions are the less they affect the estimates of the parameters of the autocatalytic CO2 hydrogenation. Also the parameters of the WGS are similar in these cases (, , ) whether assuming CO hydrogenation, CO2 hydrogenation without methanol-assistance or both to take place. When model is further reduced to model assuming that no direct hydrogenation of CO takes place the parameters of the WGS reaction change distinctly. Without the otherwise dominant autocatalytic pathway, the contribution of the CO hydrogenation is increased causing its neglect now to be more significant.
If the parameters of the re-parameterized Arrhenius equation (Equation (10)) are calculated back into reaction-specific activation energies, the values range from 57.9 kJ/mol to 210 kJ/mol for the considered models. The upper bound is very high occurring only for the direct CO hydrogenation when it is negligible causing the parameter to be not sensitive in this case (, ) and for the CO2 hydrogenation without methanol-assistance for the Vanden Bussche model. The latter observation is interesting because the refitted Nestler model assuming the same reactions with different equations was identified with much lower activation energies (respective , ). This shows how strong the parameter values are bond to the model equations and thus the mechanistic assumptions questioning the meaningfulness of comparisons with reported parameters in literature with different model assumptions. Despite the insignificant direct CO hydrogenation the highest activation energy for the models derived in this work was identified with 137 kJ/mol for the hydrogenation of CO2 without methanol-assistance in the full model being in a reasonable order of magnitude. The estimated activation energy of the autocatalytic reaction pathway is 115 kJ/mol for the full model .
b) Residual and parity plots
All models fit the data rather well. Interestingly, the residual is always smaller when the autocatalytic hydrogenation of CO2 is considered (, , ), indicating that an autocatalytic behavior should be taken into account. It is also smaller compared to the refitted literature models of Vanden Bussche et al., Nestler et al., Seidel et al. and van Schagen et al. [5,10,27,28]. It needs to be mentioned that the models of Vanden Bussche et al., Nestler et al. and van Schagen et al. have at least one parameter less. Even though the full model has four parameters more than the reduced model , the residual is almost the same. Since all models fit the reactor outlets for CO2 containing feeds well (see Figure 2) a rigorous final model discrimination may not be appropriate with the data basis analyzed.
Nevertheless, for the description of CO2 containing feeds the reduced model is recommended having a very good performance in terms of the residual including the capability to account for the autocatalytic behavior of methanol synthesis, while the number of 10 parameters is not far from established literature models. Additionally, model does not include a direct CO hydrogenation which is found to be at least insignificant for the industrial process [5,13,14,15]. The equations of the full model and the reduced model are summarized in compact manner in the Appendix A usable with the parameters in Table 2.
It is known that the morphology of the catalyst and thus the number of active sites changes under varying process conditions and strongly depends on the reduction potential of the reactants [21,34,35]. Such dynamic changes of the active catalytic sites can be taken into account according to Seidel et al. to improve predictions for dynamic operation regimes [8,22,28]. This extension is not the scope of this article.
(14 parameters), reduced model (10 parameters) and literature models for comparison utilizing CO2 containing feeds only.
5. Conclusions
A mechanistically based kinetic model for the heterogeneously catalyzed methanol synthesis on Cu/ZnO/Al2O3 catalysts was derived and parameterized in this work. A so far in available literature models not quantitatively included methanol-assisted autocatalytic reaction pathway was added to conventionally considered reaction pathways. The derived full model contains 14 parameters. Several reduced models can be obtained as special cases and were also evaluated by neglecting one or two of the methanol producing reactions. A reduced model with ten parameters (), in which the direct CO hydrogenation is not taken into account, performs equally well as the full model for CO2 containing feeds. It was shown that the reduced model is also competitive to literature models. The extension by an autocatalytic reaction pathway leads inherently to additional parameters. All models that incorporate this reaction pathway, i.e. the full model and the reduced models and , provided a significantly lower residual compared to all other models which exclude this pathway (see Equation (22) and Table 2). This result strongly supports that the consideration of an autocatalytic reaction pathway in kinetic modeling of heterogeneously catalyzed methanol synthesis over Cu/ZnO/Al2O3 catalysts appears to be very reasonable. Nevertheless, all investigated models fit the steady state data set exploited rather well. Thus, the analysis of a larger data base as well as results of dynamic experiments observing transient changes of the catalyst are necessary to validate this finding.
Supplementary Materials
The following supporting information can be downloaded at the website of this paper posted on Preprints.org.
Acknowledgment
Gefördert durch die Deutsche Forschungsgemeinschaft (DFG) - SPP 2080: Katalysatoren und Reaktoren unter dynamischen Betriebsbedingungen für die Energiespeicherung und –wandlung (358713534), Teilprojekt: 406561907. Funded by the Deutsche Forschungsgemeinschaft (DFG, German Research Foundation) - SPP 2080: Catalysts and reactors under dynamic conditions for energy storage and conversion (358713534), subproject: 406561907.
Symbols
Appendix A
In this Appendix the full model and the reduced model are summarized. The corresponding parameters are given in Table 2. Parameters equal to zero after parameter estimation were neglected in this model summary.
in this work
The equilibrium constants can be calculated according to [25] summarized in SI 4.
Full model :
Reduced model :
References
- S. Bube, S. Voß, N. Bullerdiek, U. Neuling, M. Kaltschmitt, Electricity-Based Methanol: Status and Prospects of Methanol as a Power-To-Liquid Product, Powerfuels, 2025, pp. 667-711. [CrossRef]
- A. Beck, M.A. Newton, L.G.A. van de Water, J.A. van Bokhoven, The Enigma of Methanol Synthesis by Cu/ZnO/Al(2)O(3)-Based Catalysts, Chem Rev 124(8) (2024) 4543-4678. [CrossRef]
- P. Schwiderowski, S. Stürmer, M. Muhler, Probing the methanol-assisted autocatalytic formation of methanol over Cu/ZnO/Al2O3 by high-pressure methanol and methyl formate pulses, Reaction Chemistry & Engineering 7(10) (2022) 2224-2230. [CrossRef]
- J. Thrane, S. Kuld, N.D. Nielsen, A.D. Jensen, J. Sehested, J.M. Christensen, Methanol-Assisted Autocatalysis in Catalytic Methanol Synthesis, Angew Chem Int Ed Engl 59(41) (2020) 18189-18193. [CrossRef]
- T.N. van Schagen, H. Keestra, D.W.F. Brilman, Improved kinetic model for methanol synthesis with Cu/ZnO/Al2O3 catalysts based on an extensive state-of-the-art dataset, Chemical Engineering Journal (2025). [CrossRef]
- D.Y. Murzin, T. Salmi, Kinetic Modeling, Catalytic Kinetics, Elsevier, 2016, pp. 665-721. [CrossRef]
- B. Vollbrecht, Zur Kinetik der Methanolsynthese an einem technischen Cu/ZnO/Al2O3-Katalysator, Otto von Guericke University, Magdeburg, 2007.
- C. Seidel, A. Jörke, B. Vollbrecht, A. Seidel-Morgenstern, A. Kienle, Kinetic modeling of methanol synthesis from renewable resources, Chemical Engineering Science 175 (2018) 130-138. [CrossRef]
- G.H. Graaf, E.J. Stamhuis, A.A.C.M. Beenackers, Kinetics of low-pressure methanol synthesis, Chemical Engineering Science 43(12) (1988) 3185-3195. [CrossRef]
- K.M. Vanden Bussche, G.F. Froment, A Steady-State Kinetic Model for Methanol Synthesis and the Water Gas Shift Reaction on a Commercial Cu/ZnO/Al2O3Catalyst, Journal of Catalysis 161(1) (1996) 1-10. [CrossRef]
- Y. Slotboom, M.J. Bos, J. Pieper, V. Vrieswijk, B. Likozar, S.R.A. Kersten, D.W.F. Brilman, Critical assessment of steady-state kinetic models for the synthesis of methanol over an industrial Cu/ZnO/Al2O3 catalyst, Chemical Engineering Journal 389 (2020). [CrossRef]
- R. Gaikwad, H. Reymond, N. Phongprueksathat, P.R. von Rohr, A. Urakawa, From CO or CO2?: space-resolved insights into high-pressure CO2hydrogenation to methanol over Cu/ZnO/Al2O3, Catalysis Science & Technology 10(9) (2020) 2763-2768. [CrossRef]
- G.C. Chinchen, P.J. Denny, D.G. Parker, M.S. Spencer, D.A. Whan, Mechanism of methanol synthesis from CO2/CO/H2 mixtures over copper/zinc oxide/alumina catalysts: use of14C-labelled reactants, Applied Catalysis 30(2) (1987) 333-338. [CrossRef]
- F. Studt, M. Behrens, E.L. Kunkes, N. Thomas, S. Zander, A. Tarasov, J. Schumann, E. Frei, J.B. Varley, F. Abild-Pedersen, J.K. Nørskov, R. Schlögl, The Mechanism of CO and CO2 Hydrogenation to Methanol over Cu-Based Catalysts, ChemCatChem 7(7) (2015) 1105-1111. [CrossRef]
- N.D. Nielsen, A.D. Jensen, J.M. Christensen, The roles of CO and CO2 in high pressure methanol synthesis over Cu-based catalysts, Journal of Catalysis 393 (2021) 324-334. [CrossRef]
- A.Y. Rozovskii, G.I. Lin, Fundamentals of Methanol Synthesis and Decomposition, Topics in Catalysis 22(3/4) (2003) 137-150. [CrossRef]
- Y.B. Kagan, A.Y. Rozovskij, L.G. Liberov, E.V. Slivinskij, G.I. Lin, S.M. Loktev, A.N. Bashkirov, Study of mechanism of methanol synthesis from carbon monoxide and hydrogen using radioactive carbon isotope C14, Dokl. Akad. Nauk SSSR 224(5) (1975) 1081-1084.
- B.L. de Oliveira Campos, K.H. Delgado, S. Wild, F. Studt, S. Pitter, J. Sauer, Surface reaction kinetics of the methanol synthesis and the water gas shift reaction on Cu/ZnO/Al2O3, Reaction Chemistry & Engineering 6(5) (2021) 868-887. [CrossRef]
- B.L. de Oliveira Campos, K.H. Delgado, S. Wild, F. Studt, S. Pitter, J. Sauer, Correction: Surface reaction kinetics of the methanol synthesis and the water gas shift reaction on Cu/ZnO/Al2O3, Reaction Chemistry & Engineering 6(8) (2021) 1483-1486. [CrossRef]
- C. Seidel, Modellierung und Optimierung erzwungener periodischer Betriebsweisen für die Methanolsynthese, Otto von Guericke University, Magdeburg, 2023.
- M. Behrens, F. Studt, I. Kasatkin, S. Kühl, M. Hävecker, F. Abild-Pedersen, S. Zander, F. Girgsdies, P. Kurr, B.L. Kniep, M. Tovar, R.W. Fischer, J.K. Nørskov, R. Schlögl, The active site of methanol synthesis over Cu/ZnO/Al2O3 industrial catalysts, Science 336(6083) (2012) 893-7. [CrossRef]
- C. Seidel, A. Jörke, B. Vollbrecht, A. Seidel-Morgenstern, A. Kienle, Corrigendum to “Kinetic modeling of methanol synthesis from renewable resources” (Chem. Eng. Sci. 175 (2018) 130–138), Chemical Engineering Science 223 (2020). [CrossRef]
- B.L. de Oliveira Campos, K.H. Delgado, S. Pitter, J. Sauer, Development of Consistent Kinetic Models Derived from a Microkinetic Model of the Methanol Synthesis, Industrial & Engineering Chemistry Research 60(42) (2021) 15074-15086. [CrossRef]
- F. Studt, M. Behrens, F. Abild-Pedersen, Energetics of the Water–Gas-Shift Reaction on the Active Sites of the Industrially Used Cu/ZnO/Al2O3 Catalyst, Catalysis Letters 144(11) (2014) 1973-1977. [CrossRef]
- G.H. Graaf, J.G.M. Winkelman, Chemical Equilibria in Methanol Synthesis Including the Water–Gas Shift Reaction: A Critical Reassessment, Industrial & Engineering Chemistry Research 55(20) (2016) 5854-5864. [CrossRef]
- M. Schwaab, J.C. Pinto, Optimum reference temperature for reparameterization of the Arrhenius equation. Part 1: Problems involving one kinetic constant, Chemical Engineering Science 62(10) (2007) 2750-2764. [CrossRef]
- F. Nestler, A.R. Schütze, M. Ouda, M.J. Hadrich, A. Schaadt, S. Bajohr, T. Kolb, Kinetic modelling of methanol synthesis over commercial catalysts: A critical assessment, Chemical Engineering Journal 394 (2020). [CrossRef]
- C. Seidel, D. Nikolić, M. Felischak, M. Petkovska, A. Seidel-Morgenstern, A. Kienle, Optimization of Methanol Synthesis under Forced Periodic Operation, Processes 9(5) (2021). [CrossRef]
- T. Keßler, A. Kienle, Robust Design and Operation of a Multistage Reactor for Methanol Synthesis from Renewable Resources, Processes 11(10) (2023). [CrossRef]
- J. Bezanson, A. Edelman, S. Karpinski, V.B. Shah, Julia: A Fresh Approach to Numerical Computing, SIAM Review 59(1) (2017) 65-98. [CrossRef]
- A. Pal, F. Holtorf, A. Larsson, T. Loman, F. Schaefer, Q. Qu, A. Edelman, C. Rackauckas, NonlinearSolve. jl: High-Performance and Robust Solvers for Systems of Nonlinear Equations in Julia, arXiv (2024). [CrossRef]
- J. Leipold, M. Jung, T. Keßler, A. Kienle, Nonlinear Behavior of Methanol Synthesis Compared to CO2 Methanation, Chemical Engineering & Technology 47(3) (2024) 531-536. [CrossRef]
- V.K. Dixit, C. Rackauckas, Optimization.jl: A Unified Optimization Package, Zenodo (2023). [CrossRef]
- J.D. Grunwaldt, A.M. Molenbroek, N.Y. Topsøe, H. Topsøe, B.S. Clausen, In Situ Investigations of Structural Changes in Cu/ZnO Catalysts, Journal of Catalysis 194(2) (2000) 452-460. [CrossRef]
- L. Pandit, A. Boubnov, G. Behrendt, B. Mockenhaupt, C. Chowdhury, J. Jelic, A.L. Hansen, E. Saraçi, E.J. Ras, M. Behrens, F. Studt, J.D. Grunwaldt, Unravelling the Zn-Cu Interaction during Activation of a Zn-promoted Cu/MgO Model Methanol Catalyst, ChemCatChem 13(19) (2021) 4120-4132. [CrossRef]
Figure 1.
Considered reaction network of the heterogeneously catalyzed methanol synthesis on CZA catalysts including an autocatalytic reaction pathway.
Figure 1.
Considered reaction network of the heterogeneously catalyzed methanol synthesis on CZA catalysts including an autocatalytic reaction pathway.
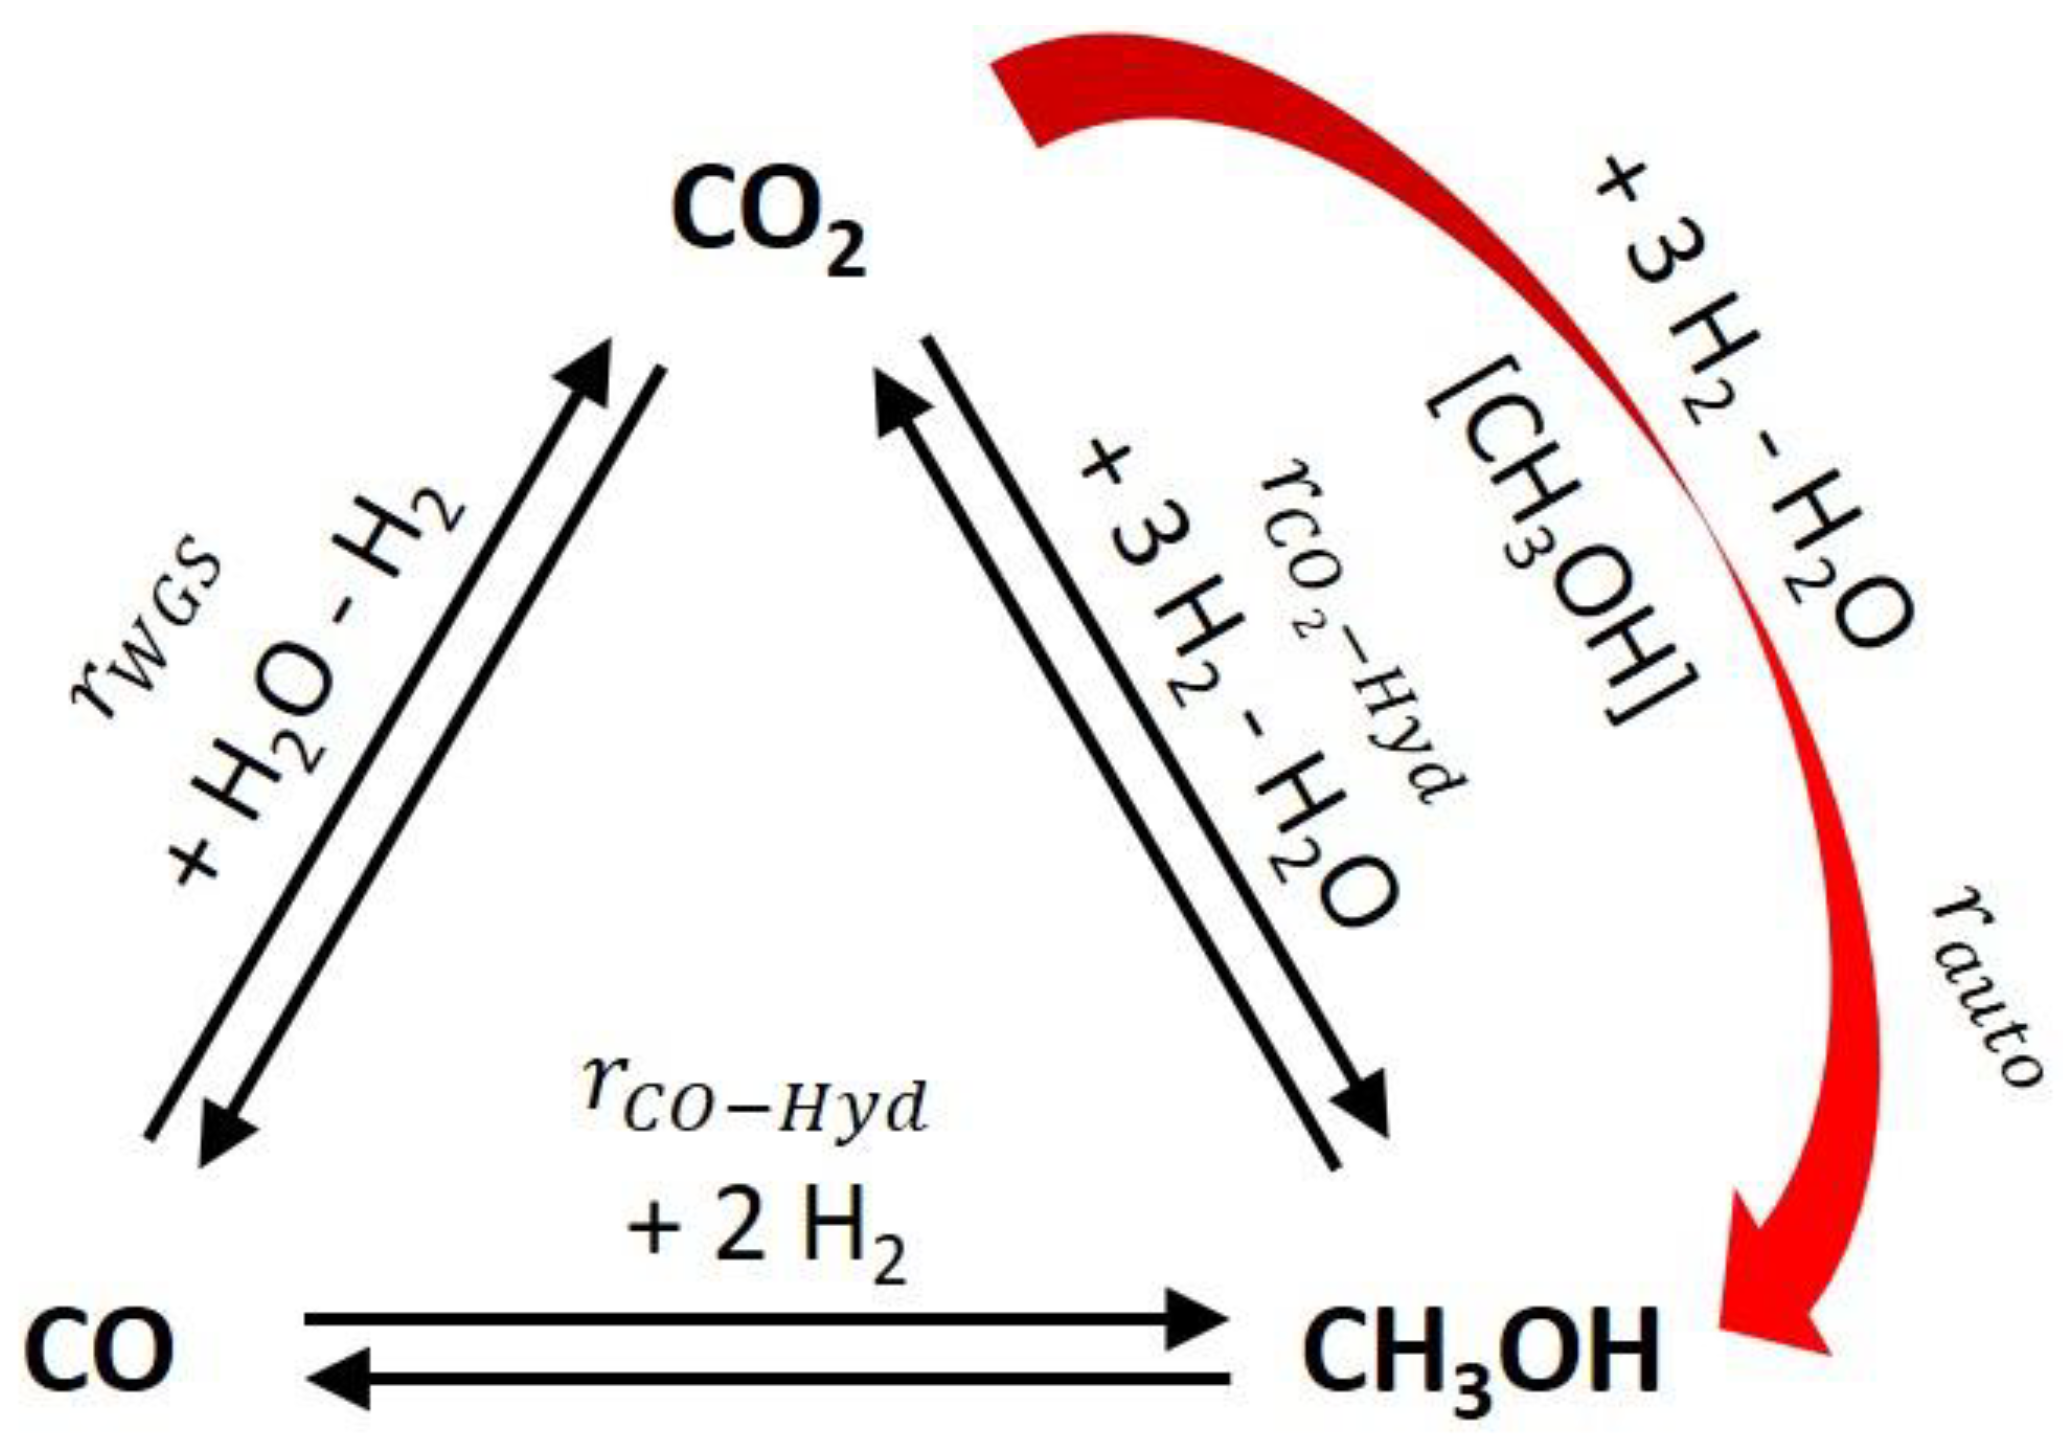
Figure 2.
Parity plots for the reactor outlet molar fractions of the five reactants and inert nitrogen for the full autocatalytic model
Figure 2.
Parity plots for the reactor outlet molar fractions of the five reactants and inert nitrogen for the full autocatalytic model
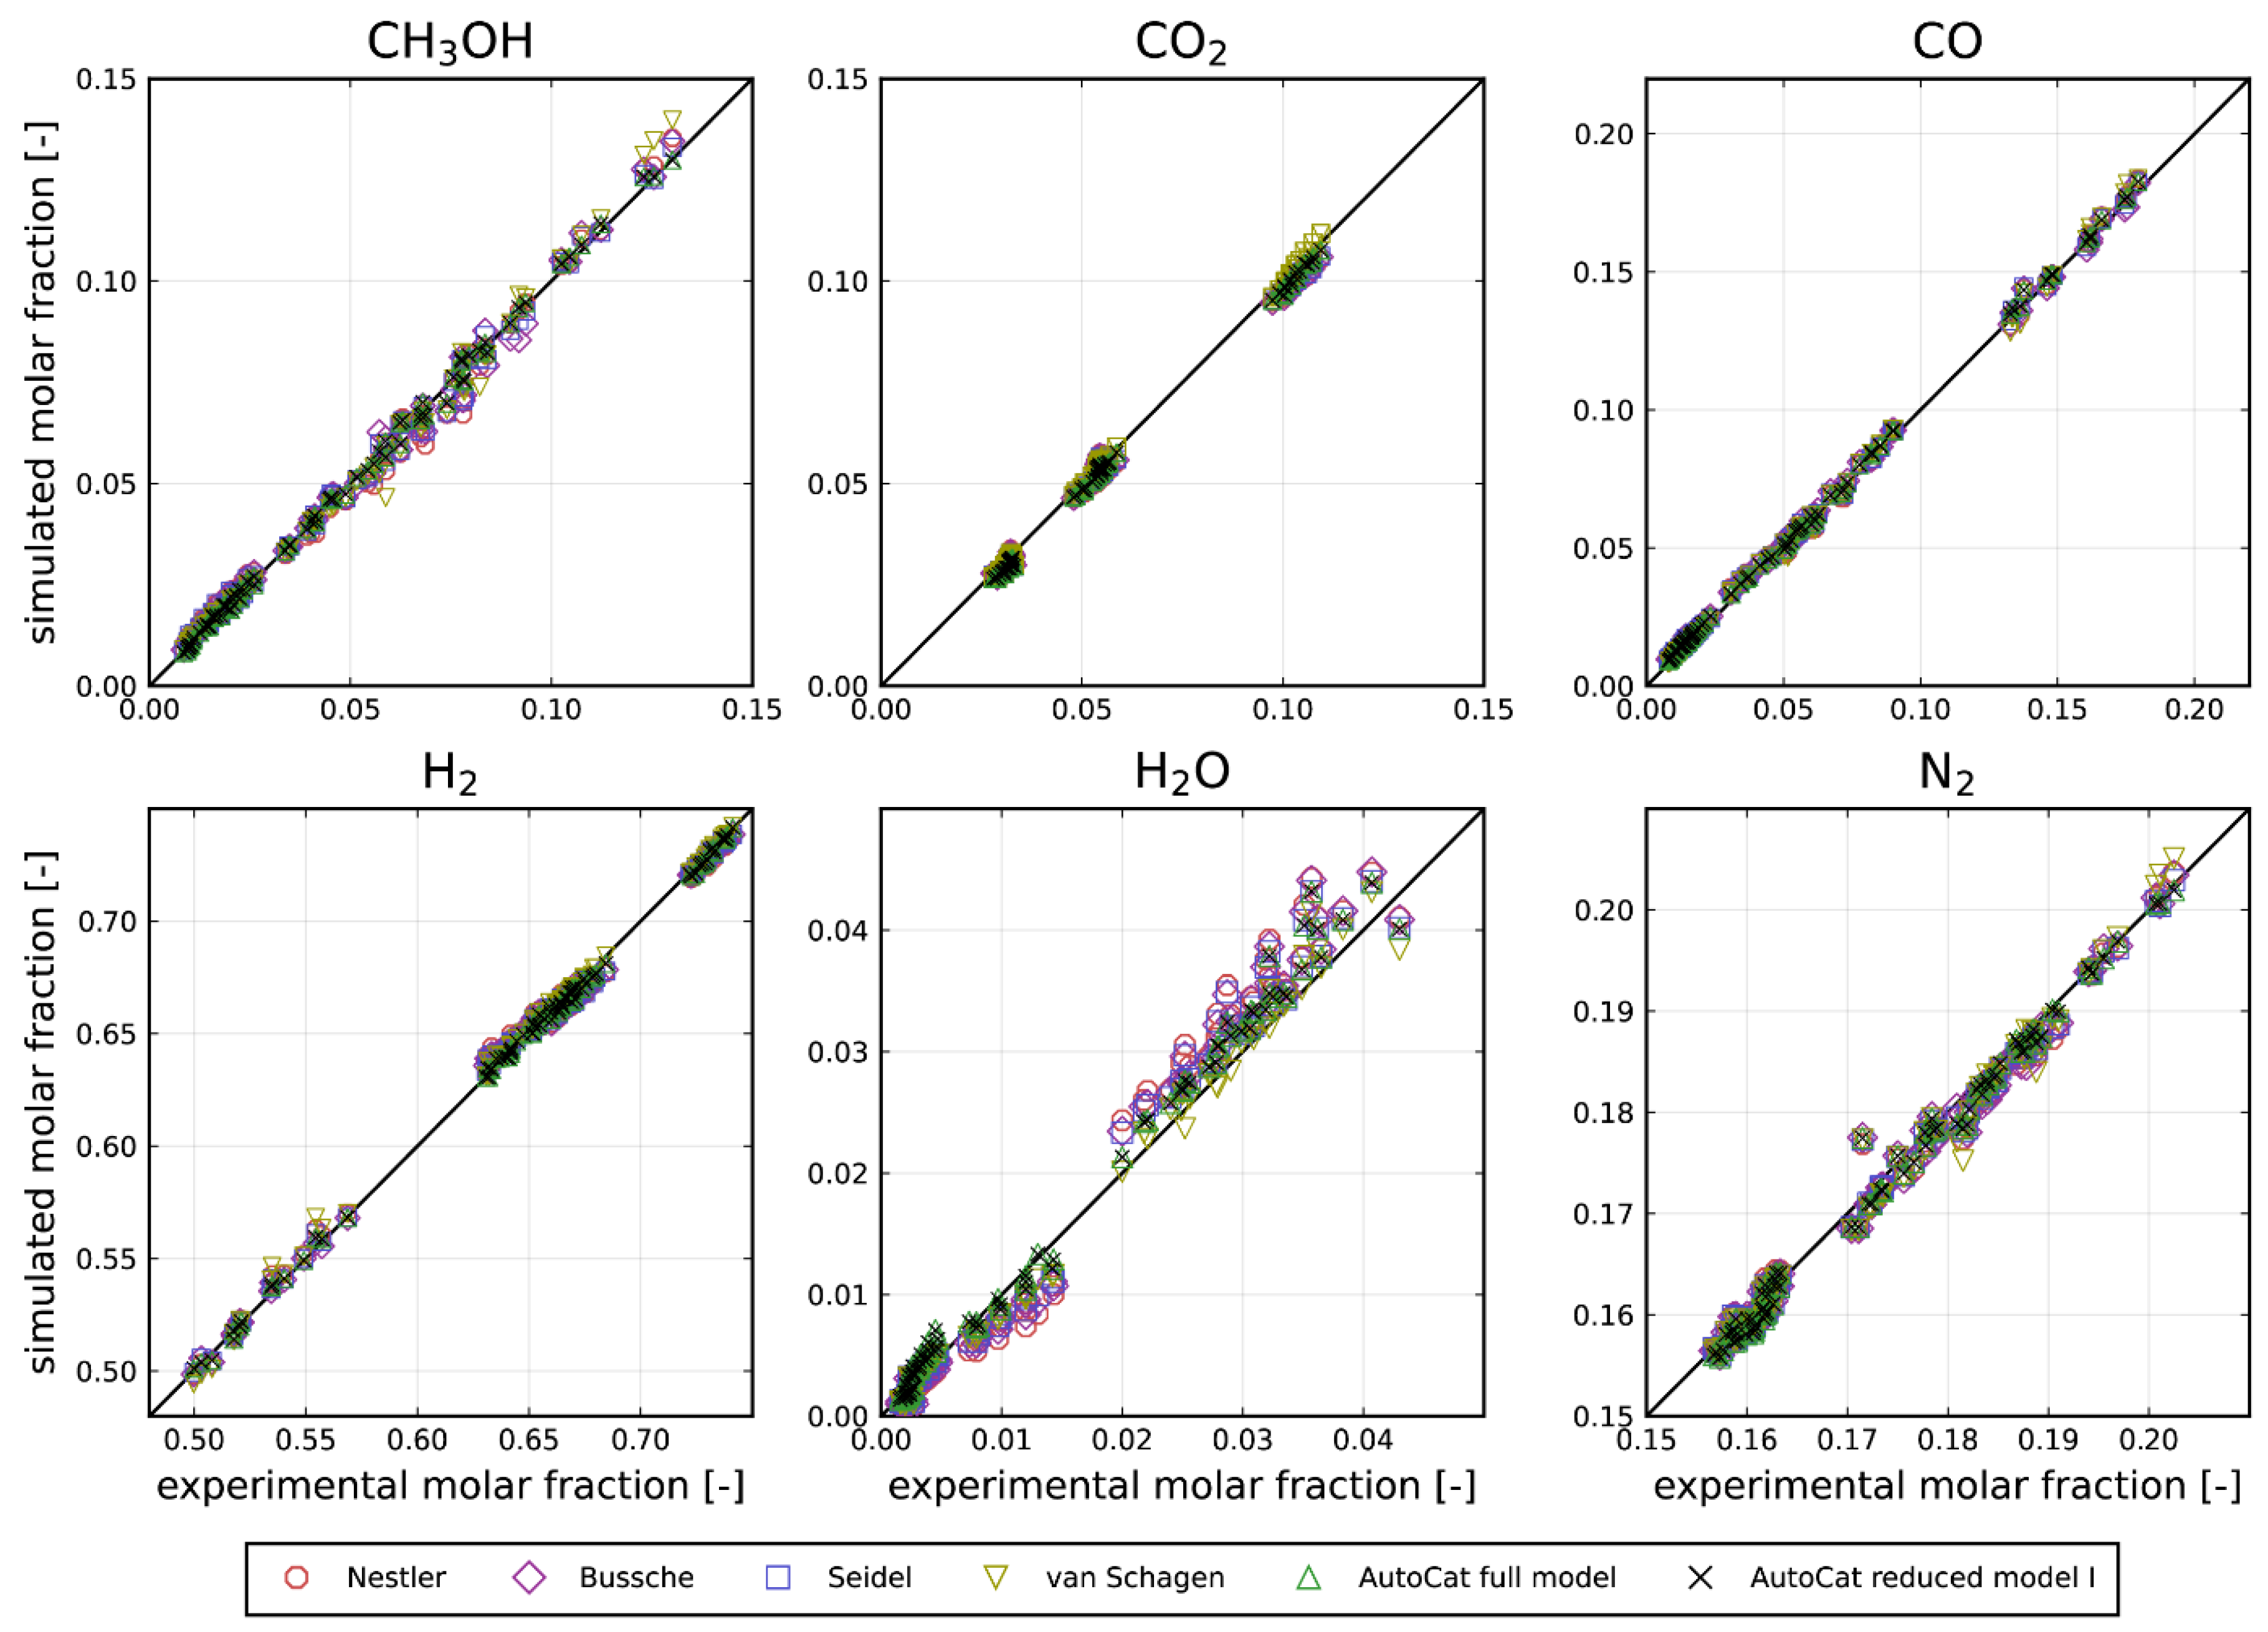

Table 1.
Assumed elementary reaction steps of the methanol-assisted autocatalytic hydrogenation of CO2 on copper/zinc () included in the proposed extended kinetic model
Table 1.
Assumed elementary reaction steps of the methanol-assisted autocatalytic hydrogenation of CO2 on copper/zinc () included in the proposed extended kinetic model
| ID | Elementary reaction step | Equation | Equationnumber |
| E1 | (S8) | ||
| E2 | (S2) | ||
| E3 | (S16) | ||
| E4 | (S9) | ||
| E5 | (S14)´ | ||
| E6* | (S24) | ||
| E7 | (S15) | ||
| E8 | (S25) | ||
| E9 | (S13) | ||
| E10 | (S17) |
* rate-determining step, ID: letter for overall reaction and number for elementary step (A: CO hydrogenation, B: CO2 hydrogenation without methanol-assistance, C: WGS on , D: WGS on , E: autocatalytic pathway), equations of elementary steps are numbered separately with a preceded S
Table 2.
Kinetic Parameters and residual of all kinetic models considered
| .assignment in models of this work |
unit in this work |
this work | literature models | ||||||||
|
full model |
reduced model |
reduced model |
reduced model |
reduced model |
Vanden Bussche (1996) | Nestler (2020) | Seidel (2021) | van Schagen (2025) | |||
| [ln(mol s-1 kg-1 bar-ro)] | -10.671 | X | -10.692 | -10.670 | X | X | X | -9.718 | X | ||
| [ln(mol s-1 kg-1 bar-ro)] | 47.680 | X | 47.585 | 28.395 | X | X | X | 27.199 | X | ||
| [ln(mol s-1 kg-1 bar-ro)] | -7.964 | -8.014 | X | -5.018 | -4.955 | -17.704 | -16.988 | -5.088 | -6.246 | ||
| [ln(mol s-1 kg-1 bar-ro)] | 31.468 | 30.058 | X | 28.894 | 29.269 | 48.255 | 15.743 | 29.909 | 21.304 | ||
| [ln(mol s-1 kg-1 bar-ro)] | 3.878 | 3.891 | 3.935 | 3.964 | 3.605 | -10.730 | -6.332 | -3.558 | -3.918 | ||
| [ln(mol s-1 kg-1 bar-ro)] | 26.586 | 26.580 | 27.038 | 13.527 | 17.521 | 35.524 | 13.308 | 19.316 | 28.824 | ||
| [ln(mol s-1 kg-1 bar-ro)] | -3.107 | -3.111 | -2.912 | X | X | X | X | X | X | ||
| [ln(mol s-1 kg-1 bar-ro)] | 26.413 | 26.518 | 26.191 | X | X | X | X | X | X | ||
| [bar-0.5] | 0 | 0 | 0 | 0.304 | 0 | 1977.62 | -13.050 | 0.492 | 0.1313 | ||
| [bar-0.5] | 0 | 0 | 0 | 170.571 | 171.536 | -3.016 | 3.869 | 0.0255 | 58.638 | ||
| [bar-1] | 64.186 | 63.677 | 69.800 | 8.101 | 0 | 9.851 | 3.354e-6 | 0.743 | 0 | ||
| [bar-1] | 0 | 0 | 0 | 0 | 0.354 | -9.189e6 | -1.674 | 25.923 | |||
| [bar-1.5] | 0 | X | 0 | 0.0279 | X | 40575.4 | -16.145 | 0.210 | |||
| [-] | 53.379 | X | 50.533 | 0 | X | 0 | |||||
| [bar-0.5] | 24.574 | X | 24.211 | 0.737 | X | 0 | |||||
| [bar-1] | 0 | X | 0 | 0 | X | 0 | |||||
| [bar-1] | 14.937 | 49.845 | 20.061 | 0 | 25.511 | ||||||
| [bar-1.5] | 0 | 0 | 0 | 0 | 0 | ||||||
| [bar-1] | 0 | 0 | 0 | 0.5930 | 0.942 | ||||||
| [bar-1.5] | 0.0359 | 0.0359 | 0.0375 | 0 | 0 | ||||||
| [-] | 0 | 0 | X | 0 | 0 | ||||||
| [bar-0.5] | 0 | 0 | X | 0 | 0 | ||||||
| [-] | 0 | 0 | 0 | 0 | 0 | ||||||
| [bar-0.5] | 0 | 0 | 0 | 0 | 0 | ||||||
| [bar-1] | 0 | 0 | 0 | 0 | 0 | ||||||
| [bar-1] | 0 | 0 | 0 | 0 | 0 | ||||||
| [bar-1.5] | 0 | 0 | 0 | 0 | 0 | ||||||
| [-] | 7.950 | 8.318 | 7.332 | X | X | ||||||
| considered parameters | [-] | 28 | 22 | 24 | 25 | 19 | 9 | 9 | 14 | 7 | |
| identified parameters | [-] | 14 | 10 | 12 | 12 | 8 | 9 | 9 | 11 | 6 | |
| residual for all experiments (Equation (22)) | [-] | 0.03709 | - | 0.03734 | 0.06894 | - | - | - | 0.05078 | - | |
| residual without CO/H2 feeds (Equation (22)) |
[-] | 0.03041 | 0.03043 | 0.03066 | 0.06219 | 0.06270 | 0.04787 | 0.06862 | 0.04720 | 0.04093 | |
X: reaction or parameter was not considered and neglected a priori (parameter equals to zero), Literature models were refitted with the same solver used for the models derived in this work and the parameters published as initial values. For the literature models the RWGS direction was implemented. The units of the parameters β1−8 depend on the total reaction orders. All quantities are based on the units K, bar, mol, s and kg.
Disclaimer/Publisher’s Note: The statements, opinions and data contained in all publications are solely those of the individual author(s) and contributor(s) and not of MDPI and/or the editor(s). MDPI and/or the editor(s) disclaim responsibility for any injury to people or property resulting from any ideas, methods, instructions or products referred to in the content. |
© 2025 by the authors. Licensee MDPI, Basel, Switzerland. This article is an open access article distributed under the terms and conditions of the Creative Commons Attribution (CC BY) license (http://creativecommons.org/licenses/by/4.0/).
Copyright: This open access article is published under a Creative Commons CC BY 4.0 license, which permit the free download, distribution, and reuse, provided that the author and preprint are cited in any reuse.


