Submitted:
04 March 2025
Posted:
05 March 2025
You are already at the latest version
Abstract
The intensified global focus on energy transition and sustainability has increased the drive to leverage electric vehicle (EV) batteries as virtual power plant (VPP) resources. However, uncertainties and governance factors associated with this integration have not been systematically researched. This study aimed to identify and evaluate the key uncertainties surrounding the deployment of EV batteries in VPPs and propose strategic responses from an ESG perspective. We adopted a mixed-methods approach using scenario planning to identify critical uncertainties. The approach included quantitative assessments using Monte Carlo simulations and a scenario matrix to incorporate ESG elements into future projections. The findings highlighted economic value volatility (E) and employment creation potential and sustainability (S) as key uncertainties, with transparency requirements (G) as a subfactor. Four distinct scenarios were identified. By proposing tailored response strategies for each scenario, this study suggests that the long-term sustainability of EV batteries and VPP industries can be bolstered in various potential future environments. Integrating ESG factors into scenario analysis helps decision-making in industries characterized by high uncertainty. The study offers strategies that embed ESG considerations to support the sustainability of EV batteries and VPP sectors and provides valuable insights for shaping policies, industrial strategies, and corporate ESG initiatives.Keywords: virtual power plant (VPP); scenario planning; Monte Carlo simulation; ESG; uncertainty prediction; sustainability strategy; EV batteries
Keywords:
virtual power plant (VPP)
; scenario planning
; Monte Carlo simulation
; ESG
; uncertainty prediction
; sustainability strategy
; EV batteries
1. Introduction
Major countries, including Korea, face the significant challenge of enhancing their energy supply efficiency while achieving substantial reductions in greenhouse gas emissions by 2050 [1]. In particular, these nations are rapidly increasing their share of renewable energy in their efforts to meet the 2050 carbon neutrality goals. However, the intermittency of renewable energy sources poses a threat to the stability of power supply [2]. In this context, virtual power plants (VPPs), which integrate and manage distributed energy resources (DERs), have emerged as a critical technology for addressing the intermittency of renewable energy [3,4]. Currently, VPP resources that leverage demand response (DR) through flexible power operation plans and ICT are being deployed in the industrial sector [5]. However, owing to structural changes in industries and economic fluctuations, the scale of resource deployment has shown a declining trend. Consequently, electric vehicle (EV) batteries have attracted significant attention as potential alternative resources for VPPs. With vehicle-to-grid (V2G) technology, EV batteries have become crucial assets for complementing the irregular generation of renewable energy and enhancing grid stability [6].
Numerous countries are actively advancing the integration of EV batteries as valuable resources for VPPs [7]. In the United States, Federal Energy Regulatory Commission (FERC) Order No. 2222 enables the participation of small-scale DERs in electricity markets, thereby providing a regulatory framework for incorporating EV batteries into VPPs. Similarly, the European Union’s “Clean Energy for All Europeans” package fosters the inclusion of small-scale DERs in the power market, laying a strong foundation for the integration of EV batteries into VPPs. Conversely, several nations, including Korea, remain in the early stages of this process and require the development and refinement of relevant policies and institutional frameworks. Within this context, environmental, social, and governance (ESG) factors are increasingly being recognized as pivotal drivers of energy transition and long-term sustainability [8]. Consequently, there is a growing demand for comprehensive research that explores the implementation and evolution of EV batteries and VPP integration from an ESG perspective.
Existing studies [9,10] have primarily focused on the technological feasibility of EV battery and VPP operations, as well as short-term efficiency improvements, such as DR programs and electricity rate optimization. For example, Wang et al. [9] proposed a method for enhancing the operational efficiency of a VPP by connecting large-scale wind power with EV batteries, whereas Qureshi et al. [10] explored operational optimization through EV battery scheduling. However, research that addresses the long-term sustainability and evolution of EV battery resource utilization by incorporating scenario analysis considering factors such as technological progress, social acceptance, and policy uncertainties, remains relatively limited. Additionally, integrating ESG factors into this study is crucial for enabling a more sustainable and equitable energy transition. By emphasizing governance aspects such as transparency enhancement and job creation from an ESG perspective, a more stable and inclusive energy transition can be realized in the long run [11].
This study, based on the premise that EV batteries can serve as a VPP resource to simultaneously achieve grid stability and carbon neutrality [12], aimed to systematically identify and assess the uncertainties associated with the integration of EV batteries into VPPs. The goal was to propose future scenarios and corresponding response strategies from an ESG perspective. Specifically, a mixed-methods research approach combining scenario planning, Monte Carlo simulations, and scenario matrices was employed to derive diverse future scenarios that incorporate key ESG elements such as economic feasibility, social acceptance, and transparency requirements [13,14]. Through this approach, this study sought to provide practical insights for the development of policies and industrial strategies for the EV battery and VPP sectors and contribute to an ESG-focused sustainable energy transition.
The remainder of this paper is organized as follows. Section 2 reviews relevant literature and presents the research methodology, including scenario planning, Monte Carlo simulations, and scenario matrices. Building on this foundation, the uncertainties and scenarios derived from the study are presented. Section 3 discusses the analysis results for each scenario and their strategic implications from an ESG perspective. Finally, Section 4 presents the conclusions of this study and its significance and suggests directions for future research.
2. Literature Review
2.1. Previous Studies on the Use of EV Batteries as VPP Resources
Studies on the utilization of EV batteries and VPPs have primarily concentrated on technical optimization and short-term efficiency improvements [9,10]. Li et al. [15] proposed real-time DR optimization strategies for EV batteries to support China’s dual carbon goals. This study developed multiregional VPP operational strategies and derived efficient demand management solutions utilizing EV batteries. Similarly, Qureshi et al. [10] combined mixed density neural networks (MDNN) and probabilistic receding-horizon convex optimization techniques to enhance the efficiency of EV and VPP integration, focusing on reducing grid volatility and improving real-time operational efficiency. These studies primarily targeted grid volatility reduction and operational efficiency, concentrating on short-term technical optimization. Although these studies provide practical technical solutions for utilizing EV batteries as VPP resources, they have limitations in addressing broader policy shifts and the long-term evolution of the power grid.
Wang et al. [9] proposed a method for enhancing grid stability by integrating wind power with EV batteries. However, the study did not sufficiently consider long-term variables such as battery price fluctuations and battery lifespan. Although Wang et al.’s study focused on the immediate integration of EV batteries with wind power, it offered limited insight into strategies for ensuring the long-term sustainability of battery resource utilization. Zhou et al. [16] explored the charging and discharging processes of EVs and spectrum allocation in communication networks; however, their work did not account for the long-term impacts of changes in EV adoption rates or policy support on battery utilization. Although these studies provided valuable technical solutions for improving grid efficiency, they offered little consideration of the social, economic, and environmental sustainability aspects of EV battery resource utilization.
Although short-term optimization studies are effective in providing practical solutions in industrial contexts, they have limited focus on long-term scenario analyses that incorporate social acceptance, policy changes, and governance factors. Harsh et al. [17] proposed a method to optimize DR programs by integrating EV batteries with solar power, battery storage systems, and controllable loads. This study considered long-term technological advancements and included discussions on policy response strategies. Notably, it highlighted the integration of various energy resources to maximize VPP efficiency, underscoring the importance of considering policy shifts beyond technical aspects.
Jeon et al. [18] analyzed the economic value of EV demand resources within the framework of South Korea’s 9th Basic Plan for Long-Term Electricity Supply and Demand, demonstrating that the integration of EV batteries as VPP resources can play a pivotal role in sustainable energy transitions. This study emphasizes the importance of policy support and social acceptance in the resource utilization of EV batteries and illustrates the impact of policy measures on VPP integration efficiency. Consequently, the study emphasizes that long-term scenario analyses incorporating ESG factors are crucial for enhancing the sustainability of EV battery integration into VPPs, with social acceptance and policy support being vital components of this process.
Environmental, Social, and Governance (ESG) factors play a critical role, particularly in governance aspects such as enhancing transparency, creating jobs, and fostering social responsibility, all of which contribute to the realization of a stable energy transition in the long term [11]. This study systematically analyzed social acceptance and policy response strategies from an ESG perspective, areas that have not been extensively addressed in previous studies, to highlight potential changes in the utilization of EV batteries as VPP resources. Notably, social acceptance and policy support have been identified as fundamental elements for ensuring the sustainability of EV battery resource utilization [19].
2.2. Previous Studies on the Utilization of Scenario Planning
Scenario planning is widely recognized as an effective technique for forecasting future development, formulating strategies, and identifying critical variables in environments marked by high uncertainty. This method relies primarily on qualitative analysis to explore various future pathways and supports strategic decision making by integrating uncertainties [20]. Notably, scenario planning plays a vital role in strategic decision-making and policy development and is increasingly being employed to address complex issues, such as the integration of EV batteries into VPP [21,22,23].
Chen et al. [21] explored the development pathways for China’s renewable energy sector up to 2030 using scenario planning integrated with the Delphi method. This study identified key uncertainties and influential factors in the sector by incorporating the Delphi survey results to create a three-dimensional scenario analysis framework. The study outlined eight future scenarios based on three primary uncertainties: “technology development,” “ecological awareness,” and “national energy pricing policies.” Five major development scenarios were selected, and policy response strategies were formulated for each scenario. This approach demonstrated the effectiveness of combining the Delphi method with scenario planning, significantly contributing to policy formulation and strategic development in China’s renewable energy sector. Such methodologies are also beneficial for creating strategies that align with national policies and technological advancements in the integration of EV batteries into VPPs by considering factors such as policy support, technological development, and market price fluctuations.
Fathi [22] applied scenario planning using the Delphi method to explore the future of operations research (OR). In this study, key uncertainty factors were derived based on surveys and expert opinions, and strategies were developed around the core factors (e.g., technological innovation and market changes) in each scenario. This approach offers valuable insights into various variables in integrating EV batteries and VPP resources through a qualitative analysis. Mietzner and Reger [23] examined the strengths and weaknesses of scenario-planning techniques, utilizing them as a strategic forecasting tool to explain development processes in alignment with the goals of diverse stakeholders. They systematically analyzed its advantages and limitations, emphasizing that scenario planning can provide critical insights and be an invaluable tool for addressing uncertainty. These studies present important implications for evaluating uncertainties in EV batteries and VPP resource utilization, particularly when making strategic decisions.
These studies underline the limitation that the results derived from scenario planning often rely on expert opinions, yet reaffirm their usefulness in developing policy response strategies through the analysis of various pathways in uncertain future contexts [24]. In particular, when integrating EV batteries into VPP resources, it is crucial to develop future scenarios based on various uncertainty factors, such as government EV support policies, fluctuations in battery prices, and advancements in battery technologies. Thus, scenario planning is essential for evaluating various uncertainty factors and the corresponding future pathways when establishing strategies for integrating EV batteries into VPPs. This approach enables a systematic analysis of how variables such as policy changes, technological innovations, market price fluctuations, and social acceptance interact with and influence one another. Such an analysis forms an important foundation for mid- to long-term policy and strategy formulation, providing tailored response strategies in line with the policy directions and technological development of each country.
2.3. Previous Studies on the Combination of Scenario Planning and Monte Carlo Simulation
Combining scenario planning with Monte Carlo simulations has gained recognition as a method that provides a more quantitative approach to addressing uncertainties [13]. Monte Carlo simulations use probabilistic techniques to assign probability distributions to various input variables, thereby enabling the simulation of multiple scenarios and enhancing the precision of future forecasts [25]. This approach complements the qualitative analysis inherent in scenario planning, offering a more detailed and quantitative framework for strategic assessments, which is particularly valuable for sustainability-oriented decision-making.
Zhu et al. [26] employed a generalized divisia index model (GDIM) to decompose the factors influencing carbon emissions in China’s power industry from 2000 to 2015. They assessed the impact of economic growth, population size, and energy consumption on carbon emissions. Additionally, they applied Monte Carlo simulations to project carbon emission scenarios for the 2017–2030 period, providing crucial insights for formulating carbon reduction strategies. This methodology is particularly beneficial for modeling uncertainties related to the integration of EV batteries and VPPs, supporting the development of specific sustainability scenarios and response strategies.
Prakash et al. [27] introduced an innovative strategic approach that combines Monte Carlo simulations with scenario planning to address uncertainties related to service quality gaps in the life insurance sector. By modeling various uncertainties, this study assessed how risks associated with service quality gaps could affect different scenarios, ranging from the best case to the worst case, and suggested tailored strategies accordingly. This approach is particularly useful for modeling uncertainties in the integration of EV batteries and VPPs, including policy changes, market demand fluctuations, and technological advancements. This enables the development of more precise scenarios and strategies that align with long-term sustainability goals. Monte Carlo simulations are highly sensitive to the accuracy of the input data and assumptions regarding their probability distributions, which can significantly influence the simulation outcomes [25]. Long-term variables such as the volatility of EV battery prices and battery lifespan are inherently uncertain, making precise estimations challenging. Therefore, it is essential to incorporate real-world data that reflect external environmental changes such as policy shifts and technological advancements. Moreover, considerable effort is required to address uncertainties related to factors such as EV adoption rates, battery longevity, and policy support to ensure the appropriate assignment of probability distributions to each variable [25]. This integrated approach facilitates the systematic management of uncertainties, offers a more comprehensive view of future pathways, and provides valuable insights for formulating medium- to long-term strategies that promote sustainability.
3. Methods
Electric Vehicle (EV) batteries are poised to become a pivotal component of future VPP resources; however, this integration is fraught with various uncertainties spanning the policy, social, and economic domains. Addressing these uncertainties is essential for enhancing the strategic adaptability and sustainability of EV batteries and VPP systems. This study aims to identify and analyze these uncertainties and propose strategic response measures for the effective and sustainable utilization of EV batteries as resources. To achieve this, it is critical to systematically derive and analyze future uncertainties through scenario analysis based on objective data to minimize subjective bias. Specifically, a multiphase evaluation process for future uncertainties coupled with collaborative expert reviews is required to improve the accuracy and sustainability of the input variables [28]. Additionally, the study incorporated validated methods to ensure the reliability of the scenario analyses and the precision of their outcomes, thereby supporting a more sustainable decision-making approach.
3.1. Research Procedure
This study was conducted in stages following the research procedure illustrated in Figure 1. In the Framework Design phase, to comprehensively analyze the external environment influencing the integration of EV batteries into VPPs, a political, economic, social, and technological (PEST) analysis framework [29] was combined with ESG factors, resulting in a PEST-ESG analytical approach [30]. Subsequently, the range of the identified uncertainty factors was progressively narrowed down through three stages: initial selection, secondary refinement, and tertiary refinement, ultimately revealing three key uncertainties (two primary and one secondary) to construct a 2×2 scenario matrix. The purpose of this iterative three-step process was to enhance accuracy and reliability through repeated feedback, ensure consistency through expert consultations, and achieve a comprehensive evaluation by incorporating diverse perspectives [31]. To systematically derive data on uncertainty factors, this study employed a combination of semi-structured interviews and the Delphi method [32]. The initial interviews involved experts from the EV battery and VPP sectors, including legislative bodies, operational agencies, and industry practitioners, to gain in-depth insights and foundational data that facilitated the initial identification of uncertainty factors. Following this, a process of opinion consolidation and additional consensus-building was undertaken to select the primary uncertainty factors [33,34,35,36].
To derive generalizable results from the initially identified uncertainty factors, a survey utilizing a three-point scale (low, medium, high) was conducted [36,37,38]. The survey was extended to 50 relevant experts from the policy, technology, and market sectors, and incorporated the 17 experts who participated in the initial interviews to capture diverse perspectives and practical insights. To ensure that the respondents could answer without prior knowledge, definitions and background information regarding the uncertainty factors were provided. The survey responses were quantified to assess the relative ranking of each uncertainty factor, which informed the selection of key factors for the scenario design. The selected secondary uncertainty factors were subjected to probabilistic analysis using Monte Carlo simulations to complement the quantitative analysis of the findings. Following the research procedure, probability distributions (e.g., triangular, normal) were assigned to each uncertainty factor, and Python was used to perform 1,000,000 iterative simulations per factor to estimate the distribution of future outcomes [39]. Notably, “market growth rate” was designated as the indicator (dependent variable) representing the degree of promotion of EV battery VPP resource utilization, and the impact of each uncertainty factor on this growth rate was assessed.
The simulation results identified the uncertainty factor with the highest standard deviation in the market growth rate, which was subsequently designated as the primary axis (X- and Y-axes) and a sub-factor in the scenario matrix [40,41]. This foundation facilitated the construction of a 2×2 scenario matrix yielding four alternative scenarios [42]. Each scenario comprehensively synthesized the anticipated implications from an ESG perspective and proposes systematic strategies to address future industrial uncertainties. The research design outlined in this study aims to support practical and strategic decision-making for EV battery VPP resource utilization. Detailed explanations of the numerical analyses, simulation configurations, and expert selection processes at each stage are provided in the following sections.
3.1.1. Stage 1: Framework Design
This study aimed to identify the uncertainty factors that may influence the resource utilization of EV batteries in VPPs, based on the PEST-ESG analysis method [29]. In the PEST analysis, the social element addresses the societal trends and cultural changes that interact with economic, political, and technological shifts, whereas the social element of ESG focuses on evaluating corporate social responsibility and its societal impact. This study sought to comprehensively consider the policy, economic, social, and technological factors in the power and energy industries, along with the ESG aspects.
3.1.2. Stage 2: Initial Identification of Uncertainty Factors
Given that research and commercialization related to the resource utilization of EV batteries in VPPs are still in the early stages, there are constraints in securing a large number of experts with both policy and technical expertise. Therefore, to enhance communication efficiency, facilitate consensus-building, enable focused discussions, and derive in-depth conclusions through specialized expertise, a semi-structured interview method was adopted with optimal experts for the initial identification of uncertainty factors [43].
The interviews were conducted using various methods, including in-person, video, and phone interviews, to gather in-depth information through flexible communication with the experts [34,35,36]. The interview period spanned from 1 August 2024 to 30 September 2024 and was conducted over multiple sessions. The interviewees consisted of 17 optimal experts from various backgrounds, including government agencies (Ministry of Industry, Ministry of Environment), public institutions (state-owned power companies, regulatory agencies), large corporations (project managers), SMEs (executives), and startups (CEOs), all of whom possess extensive experience and expertise in policy, technical, and economic aspects related to EV battery VPP resource utilization. This diverse composition provided a foundation for gaining valuable insights from different perspectives [43]. As Table 1 shows, the interview questions were designed by integrating PEST and ESG analyses [30]. This approach aimed to identify the potential uncertainties surrounding EV battery VPP resource utilization from multiple angles and to conduct a deep analysis of how each factor influences the resource utilization process. The following questions were used in the interviews. (see Appendix Table A1 for the full list of questions).
3.1.3. Stage 3: Selection of Primary Uncertainty Factors
We selected primary uncertainty factors for this study to enhance the depth of analysis and validity of the results by prioritizing and rigorously evaluating key factors, given that not all initially identified candidate factors hold equal importance [44]. This phase was conducted considering that uncertainty factors would be progressively refined in subsequent stages. To achieve this, the initially identified uncertainty factors were disclosed to the same group of experts, who were then asked to select three factors per domain that they deemed to have significant external influence. In this context, significant external influence refers to factors that are likely to induce widespread changes or cascading effects across the broader external environment, including political, economic, social, technological, and ESG dimensions.
3.1.4. Stage 4: Selection of Secondary Uncertainty Factors
The second-stage selection of uncertainty factors aimed to systematically incorporate diverse perspectives and practical insights from the first-stage results to identify uncertainty factors for quantitative analysis using the Monte Carlo simulation technique. This phase was conducted considering that the uncertainty factors would be progressively refined in the subsequent stages. The survey was conducted from 4 October to 15 November 2024 and was structured using a combination of a three-point scale and open-ended questions [36,37]. In particular, because EV battery VPP resource utilization is expected to have significant impacts not only in economic and technological aspects, but also in the environmental (E), social (S), and governance (G) domains, the second-stage uncertainty selection process included an assessment of the ESG relevance of each factor through a survey. Respondents evaluated the ESG relevance of each uncertainty factor by selecting “high,” “medium,” or “low,” and a three-point scale weighting was applied to the selected responses to ensure both efficiency and consistency in quantifying the scores of each uncertainty factor [45]. Based on aggregated weighted scores, the factor with the highest total score in each domain was selected.
This ESG assessment approach enables a broader consideration of diverse perspectives such as environmental sustainability, social acceptance, and transparent governance. Consequently, this study contributes to a comprehensive review of the long-term sustainability of the energy industry, investment attraction, and policy and regulatory alignment. The survey was conducted with an “expanded expert group” of 50 professionals from various sectors including government agencies, public institutions, corporations, and academia. The group comprised four policymakers, two experts in policy formulation and regulatory operations, eight public institution representatives, 32 corporate professionals overseeing EV projects, and four energy research specialists. By leveraging their field experience and expertise, these experts conducted a multifaceted and in-depth evaluation of the uncertainty factors associated with EV battery VPP resource utilization. Ultimately, this approach provided highly relevant and reliable data, significantly enhancing the practical applicability and credibility of the study’s findings.
3.1.5. Stage 5: Selection of Final Uncertainty Factor
The final selection of uncertainty factors was based on the procedure outlined in Figure 2, with a primary focus on identifying the key uncertainty factors necessary for deriving final scenarios [40,41].
Traditional studies employing a 2×2 scenario matrix typically generate four outcome scenarios by combining the X- and Y-axis factors [46]. However, this study aims to comprehensively consider the uncertainties across various ESG domains. Therefore, instead of relying solely on the X- and Y-axes, an additional sub-factor was incorporated, resulting in the selection of three key uncertainty factors. Specifically, a 2×2 matrix was constructed using two core uncertainty factors, whereas the remaining uncertainty factor was integrated as a subfactor within each scenario. This approach was designed to reduce strategic complexity while systematically analyzing the influence of additional variables [47,48].
To derive the variables and probability distributions of the uncertainty factors consistently, the same optimal experts who participated in the “initial and first-round uncertainty factor selection” conducted multiple rounds of interviews [31]. Through this process, the initial variables were identified, followed by a further exchange of opinions and a consensus-building process that led to the final selection of variables and probability distribution parameters. Subsequently, to conduct an objective data-driven probability analysis, a Monte Carlo simulation was performed using Python [25]. By combining expert-based research with program-based analysis, this study addresses the limitations of traditional qualitative scenario planning and provides more specific and quantitative strategic analysis results.
In this study, each uncertainty factor and variable, selected based on the collective intelligence of the expert group derived through multiple interviews, was considered a critical element influencing actual market growth and resource promotion. As their combination is deemed suitable for explaining overall market growth [49], the market growth rate was set as the outcome variable in the simulation. A Python code was designed to extract the maximum, median, minimum, and standard deviation values of the market growth rate from the simulation results [39]. Using this program, 1,000,000 simulation results were generated for each uncertainty factor, and the analysis identified the uncertainty factors with the largest standard deviation of the market growth rate, selecting one from each ESG domain. These factors were confirmed as final uncertainty factors [41]. We selected high-uncertainty factors as “final uncertainties” because they are the most influential in scenario techniques and future prediction studies, with a high likelihood of significantly shaping future scenarios [47]. The specific processes and detailed results for each stage are described in the following sections.
Step 1: Initial extraction of variables for uncertainty factors. This stage aims to derive the variable values necessary to execute the Monte Carlo simulation of the selected secondary uncertainty factors [50]. Given the constraints in securing experts with high policy and technical expertise in the early stages of research and commercialization, a semi-structured interview method was adopted, as in the initial uncertainty identification stage, to enhance communication efficiency, facilitate consensus building, enable focused discussions, and derive in-depth conclusions through specialized expertise [43,44]. The experts involved in this process were the same as those who participated in the initial uncertainty identification stage. They engaged in flexible communication through various methods, including in-person meetings, video conferences, and phone interviews, to gather in-depth information regarding the questions outlined in Table 2 [33,34]. The interviews were conducted from 18–30 November 2024, and the initial interview questions for variable extraction were structured to assess the impact of uncertainty factors on future outcomes. (See Appendix Table A2 for the full list of questions).
Step 2: Selection of final variables and probability distributions. In this study, we selected the final variables to enhance the depth of analysis and validity of the results by prioritizing and rigorously evaluating key variables, similar to the process used for selecting uncertainty factors. This approach considers that not all initially identified candidate variables hold equal importance [44]. The initially derived variables undergo an additional consensus-building process to refine the selection and determine the final set of variables. This process minimizes the model complexity and unnecessary noise caused by excessive variable inclusion while ensuring a balanced approach that effectively captures the critical aspects of key uncertainties [50]. Thus, the initially derived variables for each uncertainty factor were disclosed to the same group of experts, who were asked to reselect the variables they deemed to have significant external influence [50]. For consistency with the first-stage uncertainty factor selection, “significant external influence” was defined as variables with the potential to induce widespread changes or cascading effects across the broader external environment, including political, economic, social, technological, and ESG dimensions. This multistage approach aligns with the objective of improving both research efficiency and analytical accuracy [44].
The procedure for selecting the probability distributions for each variable begins with a literature review and theoretical foundations, based on which the researcher predefines the target variables and their uncertainty ranges. Subsequently, we interviewed a group of optimal experts through semi-structured interviews to gather their opinions on the key parameter values. Subsequently, a consensus was reached, and feedback was incorporated to derive representative probability distributions using qualitative consensus techniques [51,52]. A sensitivity analysis was then performed to evaluate the impact of variable variability on the scenario outcomes. This process helps acquire additional data to reduce the uncertainty of key variables or improve the modeling process [53,54]. In this study, the key parameters (e.g., 70%) were adjusted within a ±10% range (e.g., 60%, 80%) for sensitivity evaluation [55,56]. This step plays a crucial role in assessing the impact of variable uncertainty on scenario outcomes and examining the influence of the probability distribution values on the overall simulation results [50].
Step 3: Monte Carlo simulation implementation. Python is an open-source general-purpose programming language that enables the efficient and rapid implementation of complex Monte Carlo simulations by leveraging various scientific and numerical computation libraries, such as NumPy, SciPy, pandas, and matplotlib [57]. The Monte Carlo simulation is a statistical technique that assesses model uncertainty by generating random numbers and simulating probability distributions. Python’s vectorized operations and random number generation capabilities are well-suited for such tasks, allowing for precise results [25]. The following key components of the Python code were designed for this study:
Conducted 1,000,000 simulation iterations.
Fixed the random seed to ensure the reproducibility of results upon code execution.
Incorporated the final selected variables and probability distribution data based on prior consensus.
Utilized DataFrame.describe() to summarize descriptive statistics (mean, standard deviation, minimum, maximum, etc.) for each variable, and displayed the results using the print() function.
Step 4: Derivation of simulation results and final selection of uncertainties. In this stage, the results obtained from the Monte Carlo simulation were analyzed, and the final uncertainty factors were selected based on this analysis. The simulation results were evaluated by assessing the impact of each uncertainty factor on the market growth rate and analyzing their statistical characteristics, including standard deviation. The final uncertainty factors were primarily selected based on the factors with the highest standard deviations among the simulation results [41]. Through this process, the most critical uncertainty elements in each ESG domain were identified.
3.1.6. Stage 6: Derivation of 2x2 Scenarios
In this study, the scenario matrix method–widely used in “futures” studies and strategic management–was applied to reduce complex and highly uncertain environmental factors into two primary axes [47,48]. Using this approach, multiple alternative future states were derived. In this process, the two uncertainty factors with the highest standard deviation values were designated as the core axes and a third factor was incorporated as a sub-element to enable a more refined scenario analysis.
The scenario axes were structured in a two-level opposing format, such as “low vs. high” or “negative vs. positive” [42]. Additionally, a sub-factor was incorporated to construct a 2×2 scenario matrix, ensuring that the characteristics of each scenario were clearly distinguished for ease of comparison [58]. Each scenario comprehensively described the assumed future environment (e.g., policy and regulatory frameworks, technological advancement speed, market demand, and social perception) and was used as the foundation for developing a scenario storyline. In this process, economic value volatility, job creation potential, and ESG transparency requirements were established as key uncertainties, while additional factors such as government support policies, advancements in EV battery recycling technologies, and fluctuations in international energy prices were considered to enhance the realism and consistency of the scenarios. Through this analysis, each scenario provides in-depth insights into how it may unfold in real-world conditions and enables the derivation of policy implications and strategic responses [59].
3.2. Analysis Method
3.2.1. Scenario Planning
Scenario planning is a key methodology for exploring multiple alternative scenarios in highly uncertain future environments and developing the corresponding strategic responses [20]. Schwartz [47] defined this approach as “a process of exploring multiple alternative scenarios to prepare for an uncertain future and formulating strategies tailored to each scenario.” Schoemaker [58] emphasized that scenario planning involves identifying key uncertainties and developing interrelated scenarios, enabling organizations to respond effectively to change and implement sustainable strategies. In this study, a scenario planning methodology was applied to comprehensively consider policy, social, economic, and technological uncertainties, as well as ESG factors related to EV battery utilization as a VPP resource. First, potential future environmental changes and risks associated with EV battery deployment were identified. Among the derived uncertainty factors, the most influential and volatile were selected to define the primary scenario axes. Future environmental projections were then developed using a scenario matrix, incorporating environmental, social, and economic sustainability considerations to formulate strategic responses. However, because scenario planning is particularly effective for exploring various future possibilities based on expert subjective judgment, it is essential to integrate quantitative analysis and expert validation to enhance the accuracy and reliability of the results. 3.2.2. Monte Carlo Simulation Monte Carlo simulation is a probabilistic method that estimates the range of future outcomes (e.g., mean, standard deviation) by defining variables and probability distributions for uncertainty factors and repeatedly simulating various scenarios based on these inputs [25]. This technique was first introduced in the Manhattan Project in 1949 and has since been widely applied to risk analysis and forecasting across multiple fields, including finance, investment, manufacturing, and logistics [60]. In this study, normal and triangular distributions were assigned to key variables related to EV battery VPP resource utilization. A random number generator was used to randomly sample values for each variable, which were then used to compute scenario outcomes. The simulation was executed 1,000,000 times and the resulting outputs were analyzed in terms of means, standard deviations, and confidence intervals. This analysis enabled the evaluation of how the volatility of each variable impacts future market growth [61].
The primary advantage of Monte Carlo simulation is its ability to incorporate uncertain factors, such as unpredictable market conditions, technological advancements, and policy changes, allowing for the estimation of a wide range of possible outcomes [62]. Additionally, this method enables the analysis of extreme environmental shifts and rare scenarios through simulation, making it a valuable tool for risk assessment in VPP and EV battery resource utilization. In this study, policy, social, and economic factors influencing EV battery VPP resource utilization were assigned variables and probability distributions to move beyond simple qualitative assessments and derive probabilistic scenarios. This approach allows for the quantification of risks and opportunities, the estimation of the actual likelihood of each scenario occurring, and the development of sustainable strategic response measures. Ultimately, it supports strategic decision making by providing a data-driven framework for evaluating uncertainty.
3.2.3. Combination of Scenario Planning and Monte Carlo Simulation
The research methodology combining scenario planning and Monte Carlo simulation serves as a critical tool for systematically and reliably supporting strategic decision-making in highly uncertain environments. Scenario planning qualitatively explores various uncertainty factors to present potential future pathways, offering a comprehensive understanding of how policy, technological, economic, and social factors interact. In contrast, Monte Carlo simulation applies variables and probability distributions to each uncertainty factor and repeatedly simulates numerous scenarios to enable a quantitative assessment of the outcomes [25]. This approach complements the qualitative analysis derived from scenario planning by providing clearer predictions of the likelihood and potential impact of each scenario. The integration of these methods enhances the accuracy of future environmental forecasts and offers valuable insights into risk management and opportunity analyses. This process was performed in the following stages:
Identification of uncertainty factors: Define the input variables for the Monte Carlo simulation based on the key uncertainty factors (E), (S), and (G) derived from scenario planning.
Variable and probability distribution setup: Establish appropriate probability distributions (e.g., triangular, normal) for each uncertainty factor’s variables based on expert opinions and historical data.
Simulation execution: Conduct 1,000,000 iterations of the simulation to quantitatively assess the probability and impact of each scenario.
Scenario matrix construction: Utilize the simulation results to structure a 2×2 scenario matrix by assigning (E), (S), and (G) elements to the X-axis, Y-axis, and sub-factors. Analyze the characteristics of each scenario to derive strategic response measures.
4. Results
The key findings of this study are presented in the main text to enhance the readability of the results and facilitate the identification of essential information. For the list, please see Appendix Table A3.
4.1. Stage 1: Result of Framework Design
The horizontal axis represents ESG factors, and the vertical axis represents PEST factors, creating nine categories. The nine categories were divided into political/environmental (PE), social/environmental (SE), economic/environmental (EE), political/social (PS), social/social (SS), economic/social (ES), political/governance (PG), social/governance (SG), and economic/governance (EG). Political and technological factors were combined on a single axis because policy changes and technological innovations are closely interconnected in the energy and environmental sectors [63]. Policy decisions can either promote or constrain the development of new technologies, whereas technological innovations can guide policy changes or trigger new policies. Reflecting this interdependent characteristic, the two elements were grouped into one axis to improve analytical efficiency and provide a more practical analytical framework.
4.2. Stage 2: Results of Initial Identification of Uncertainty Factors
Table 3 shows the results of initial identification of uncertainty factors. (See Appendix Table A3 for a detailed list).
As listed in Table 3, 46 uncertainty factors were identified through semi-structured interviews with the optimal expert group. Key uncertainty factors include the possibility of legal and regulatory changes (PE), government subsidies and taxation policies (EE), community acceptance (PS), fluctuations in raw material prices (EE), integration with renewable energy (PE), transparency and standardization requirements (PG), and changes in ESG investment indicators (EG). These factors are interdependent, suggesting that changes in one area may have cascading effects on other areas. Additionally, the linkage between decentralized power and renewable energy policies, growth potential in the battery recycling and reprocessing market (EE), and community participation and conflict resolution (PS) create positive synergies between VPP and EV battery utilization while simultaneously introducing uncertainties owing to policy changes or social conflicts, thereby having dual impacts. The need for enhanced transparency and reliability (SG) and education and talent development (PS) highlights that stakeholder collaboration and social consensus across the entire VPP industry ecosystem must be considered in future development.
4.3. Stage 3: Results of Selection of Primary Uncertainty Factors
Among the initially derived 46 uncertainty factors, 27 factors were selected based on their perceived “significant external influence,” as shown in Table 4. (See Appendix Table A3 for the detailed contents).
When evaluating the impact of economic value volatility on the speed of EV battery VPP resource utilization, all experts agreed that this factor exerts a strong external influence within the EE category. This suggests that when the economic value is high, the speed of resource utilization may be highly responsive to economic conditions. This stage focused on enhancing accuracy and reliability, ensuring consistency through expert opinion exchanges, and incorporating diverse perspectives to derive a comprehensive evaluation. The key findings were as follows:
From a policy (P) and regulatory perspective, the PE category ranked “possibility of legal revisions,” “policy alignment,” and “government subsidy policies” as the top three factors, in that order. This reflects the perception that volatility in policy environments, such as government subsidies and legal or regulatory changes, plays a crucial role in determining the success of EV battery-based VPP resource utilization. Similarly, in the PS category, “changes in legal regulations” (ranked 1st), “community participation and conflict resolution policies” (also ranked first), and “technical education and talent development policies” (ranked 2nd) were selected. This suggests that policy development and institutionalization are directly linked to social consensus and conflict resolution.
From a social (S) acceptance and perception change perspective, in the SE category, “perception change” received the highest number of votes, indicating that public acceptance of eco-friendly and new technologies is a key variable for project expansion. In the SS category, “job creation potential and sustainability” (tied for the 1st position) and “trustworthiness changes” (tied for the 1st position) were ranked highly, suggesting that job creation at the community level and the establishment of trust in technology and regulatory frameworks are essential for gaining social support.
From the economic (E) and market volatility and opportunity perspective, in the EE category, “economic value volatility” received the highest number of votes across all categories, followed by “changes in subsidies and tax benefits.” This finding indicates that marketability and profitability are the most significant uncertainty factors. In the ES category, the “promotion of the sharing economy and the potential for new business models” and the “economic value of newly emerging job categories” were widely selected. This indicates strong expectations for new market and business opportunities emerging from VPP and EV battery resource utilization. In the EG category, the “need for sustainable investment and capital flow volatility” was a major concern, emphasizing that financial investments must ensure long-term sustainability, and that stable capital flow is a critical factor.
From a governance (G) and transparency requirement perspective, in both the PG and SG categories, “increasing transparency requirements” was consistently ranked among the top factors, indicating that clear and secure procedures must be in place to ensure stakeholder confidence in electricity trading, subsidy execution, and battery recycling. In the PG category, “policy cooperation and regulatory direction changes” and the “development of technical standards and policy guidelines” also received significant votes, further emphasizing the importance of coordination among governments, private entities, and local communities, as well as the need for well-defined regulations.
In conclusion, during the reselection of uncertainty factors, the experts identified policy volatility, economic uncertainty, social acceptance, and governance transparency as core risks and opportunities for EV battery-based VPP resource utilization. This suggests that among the broad range of uncertainty factors initially identified in the first stage, these factors are key elements with the potential to drive widespread changes or trigger cascading effects.
4.4. Stage 4: Results of Selection of Secondary Uncertainty Factors
Table 5 presents the results. (For a detailed list, please see Appendix Table A3).
As illustrated in Table 5, nine uncertainty factors with high ESG relevance were selected from the initially identified 27 factors through the “secondary uncertainty factor selection” process. Total scores range from 88 to 120 points, with the “possibility of legal amendments” receiving the highest score of 120 points in the PE category. This phase focused on selecting the uncertainties with the highest ESG relevance scores for each category without comparing scores across different categories. Compared with the initial selection of uncertainty factors, this stage is significant in that it reflects detailed changes in priorities and a more concrete emphasis on ESG considerations.
In the prioritization shift considering ESG relevance, legal and institutional volatility (PE, possibility of legal amendments) and economic uncertainty (EE, economic value volatility) remain prominent uncertainty factors. Notably, in the social (S) domain, “employment creation potential and sustainability” (SS) and “technical education and talent development policies” (PS) achieved relatively high scores. This underscores the heightened emphasis on the importance of human resources and community from an ESG perspective, particularly in the social (S) dimension. Furthermore, reinforcement of the ESG perspective has elevated the significance of social (S) and governance (G) elements such as transparency requirements (PG), perception changes (SS), and employment creation (SS). This reaffirms the close association between transparent governance and social value in advancing EV battery and VPP initiatives.
In this extended analysis, “continuous marketing investment decisions” (SG) and “technical education and talent development” (PS) emerged as top factors, illustrating the concrete importance of social engagement and perception improvement strategies beyond mere institutional reforms. Additionally, the high evaluation of “sharing economy activation and business model creation potential” (ES) in the context of the relationship between economic value volatility and sharing economy opportunities suggests increased expectations for new markets and employment opportunities from an ESG perspective. In conclusion, both the initial and extended analyses aligned with the significance of policy and institutional volatility, economic fluctuations, social consensus, and transparent governance. The distinction lies in the clearer and strengthened prioritization of ESG factors, particularly within the social (S) and governance (G) dimensions, indicating that the ESG perspective has become an essential requirement, rather than a supplementary element, in promoting EV battery-based VPP resource development.
4.5. Stage 5: Results of Final Selection of Uncertainty Factors
To enhance the quantitative findings of the nine previously identified uncertainty factors, a probabilistic analysis was conducted using Monte Carlo simulation. This process involves determining the variables and their probability distributions, followed by their selection for simulation execution. The simulation results led to the identification of three final uncertainty factors that served as the basis for the 2x2 scenario matrix in this study. The subsequent sections provide a detailed explanation of the Monte Carlo simulation procedures and their outcomes.
4.5.1. Steps 1 and 2: Results of Variable Selection and Extraction of Probability Distribution Parameters
Table 6 and Table 7 show the results for variable selection and the extraction of probability parameters. For the detailed contents of the nine identified categories, please see Appendix Table A3.
As illustrated in Table 6, 51 variables were derived for the nine uncertainty factors, with each factor initially associated with four to seven variables. To minimize model complexity and unnecessary noise caused by excessive variables while effectively reflecting the key aspects of core uncertainties, an additional expert consensus process was conducted. Consequently, three variables were selected for each uncertainty factor, resulting in a final set of 27 variables. These final variables largely incorporated the fundamental concepts (policy, economy, society, environment, governance, etc.) and thematic groups (e.g., legal and institutional changes, market and technological uncertainties, social acceptance, transparency, and investment issues) presented in the initial variables. Importantly, the final variable set maintained the overall coverage originally intended during the initial selection, ensuring that no significant concepts were excluded. Regarding employment-related variables, instead of merely addressing “fluctuations in the number of jobs,” the final variables were selected with an emphasis on sustainable employment and social benefits, reflecting ESG considerations. This suggests that the final variable set encompasses a broad range of ESG implications.
As shown in Table 7, the parameter values for each variable were determined through a Consensus Conference among the experts [64]. These parameters were designed to incorporate collective intelligence from an expert group, accounting for policy proactiveness, shifts in social perception, market competitiveness, and governance elements related to ESG, considering both current conditions and future uncertainties [65]. Based on this, Monte Carlo simulations generated various scenarios, such as early or delayed legal amendments and different levels of technological innovation, allowing for a quantitative assessment of the risks and opportunities associated with EV battery-based VPP resource utilization. Furthermore, a combination of binomial, normal, triangular, Poisson, discrete, and lognormal distributions was applied to reflect the characteristics and realism of each uncertainty factor precisely. For instance, binary distributions were used to model distinct occurrences, such as whether a legal amendment took place, while normal distributions were employed for continuous and variable factors, such as the intensity of legal amendments or shifts in public perception. Additionally, triangular distributions were used for parameters such as the timing of legal amendments, proportion of investment in education budgets, employment growth, and marketing effectiveness, facilitating an intuitive analysis during scenario development.
4.5.3. Steps 3 and 4: Results of Simulation Execution and Final Selection of Uncertainties
The Python code depicted in Figure 3 facilitated the execution of the Monte Carlo simulations, leading to the quantitative outcomes presented in Table 8 and the visual representations illustrated in Figure 4.
As shown in Table 8, among the nine uncertainty factors, economic value volatility (EE, 13.37%), employment creation potential and sustainability (SS, 10.68%), and increased transparency requirements (PG, 8.60%) exhibited the highest standard deviation values in their respective domains, and were thus selected as the final uncertainty factors. This indicates that these factors demonstrate greater variability than others and are more likely to be sensitive to external environmental and policy changes. Although the standard deviation of perception change (E, 11.06%) was slightly higher than those of the (S) and (G) factors, this study focused on the scenario design based on the “highest standard deviation per ESG category.” Therefore, changes in perception were excluded from the final comparison and selection processes. However, as perception change may influence economic value volatility and transparency requirements over the long term, it was indirectly considered in the scenario development, even though it was not included as a direct simulation variable.
Factors with high standard deviations exhibit significant individual volatility and interact with one another [66]. For example, an increase in economic value volatility (E) may affect employment creation potential, sustainability (S), and corporate transparency (G). Therefore, in addition to analyzing individual factors, a comprehensive approach that considers the interconnections among ESG elements is essential. In conclusion, this study analyzed uncertainty by focusing on the most volatile factors in each ESG category. These results suggest that factors with high standard deviations may serve as key variables that should be prioritized when formulating ESG policies and strategies.
Table 9 presents the results of a Monte Carlo simulation executed using a Python-based model.
As shown in Table 9, the parameters for 27 variables were adjusted within a ±10% range from their baseline values. The analysis evaluated how these adjustments influenced the probability distribution values of the market growth rate simulations, revealing that the standard deviation differences remained within 1%. This outcome indicates that the model is robust and maintains stable reliability despite parameter adjustments. Through such sensitivity analysis, it is possible to quantitatively assess the impact of key model variables on market growth rates and understand the extent to which the results fluctuate with variable changes. The standard deviation difference remaining within 1% demonstrates that the market growth rate predictions do not exhibit excessive volatility in response to minor variable changes, highlighting the model’s resilience to uncertainty. The Python code in Figure 5 was designed as an extension of the code in Figure 3 to generate the sensitivity evaluation results. Researchers and practitioners can use this automated simulation framework to continuously conduct sensitivity assessments. Automation of this evaluation process enables rapid result generation and enhances the reliability of the findings through extensive scenario testing [67,68].
4.6. Stage 6: Results of 2x2 Scenario Matrix
To construct a 2×2 scenario matrix, we selected economic value volatility (EE, 13.37%), employment creation potential and sustainability (SS, 10.68%), and increased transparency requirements (PG, 8.60%) as the final uncertainty factors based on their standard deviations obtained from the Monte Carlo simulation. The two factors with the highest standard deviations—employment creation potential and sustainability (X-axis) and economic value volatility (Y-axis)—were designated as the principal axes, whereas increased transparency requirements were set as a subsidiary factor.
Figure 6 presents a 2×2 scenario matrix constructed with employment creation potential and sustainability on the X-axis and economic value volatility on the Y-axis, with increased transparency requirements as a subsidiary factor. The following four scenarios were derived from this matrix:
Scenario A: This ideal scenario envisions continuous industrial growth facilitated by stable policy support and corporate investment. This occurs when proactive government policies align with long-term corporate investment commitments.
Scenario B: In this scenario, while the industrial environment remains stable, advancements in technology and automation limit employment opportunities. This highlights the impact of automation and innovation on employment within the existing industrial framework.
Scenario C: Characterized by high market volatility, this scenario perceives active job creation driven by technological innovation and the emergence of new business models, indicating that uncertain market conditions can foster new opportunities.
Scenario D: This scenario depicts a situation in which rapid industrial changes, coupled with a focus on automation and efficiency, adversely affect the labor market, emphasizing the negative impact of automation on employment amid high volatility.
These four scenarios, derived from the two key axes, provide a framework for analyzing potential futures. Detailed interpretations and strategic responses to each scenario are discussed in the Discussion section.
5. Discussion
This study employed a 2×2 scenario matrix methodology to forecast the future trajectory of the EV battery and VPP industries. The analysis centers on two primary uncertainties: economic value volatility and employment creation potential, with ESG transparency requirements incorporated as a subsidiary variable. The following sections interpret the outcomes derived from each scenario, elucidate their significance, and propose the policy implications and strategic responses.
In Scenario A, the EV battery and VPP industries sustained stable growth, driven by the increasing demand for electric vehicles and the global transition to sustainable energy. This scenario assumes that strong policy support and long-term corporate investment create a solid foundation for industrial expansion [69]. Consequently, there is a growing demand for high-skilled workers in battery recycling, operation, and data analytics, reflecting a qualitative improvement in employment opportunities rather than simply quantitative growth [70]. This shift contributes to positive social spillover effects as industries benefit from a well-trained workforce. Furthermore, high ESG transparency requirements encourage companies to systematically disclose ESG data, thus fostering long-term corporate value growth and trust building [71]. To capitalize on this favorable scenario, governments should leverage low market volatility to promote stable investments in infrastructure and technology through policy financing and green bond issuance [72,73]. Additionally, the public and private sectors must collaborate on workforce training programs and integrate practical education that aligns with the latest technological trends and ESG standards. Finally, strengthening ESG disclosure frameworks and establishing regular stakeholder communication channels are crucial to securing long-term trust [74].
In Scenario B, the EV battery and VPP industries maintain stable economic value; however, automation- and efficiency-driven strategies limit new job creation [75]. Although firms operate in a stable market environment, they prioritize cost reduction and productivity enhancement through advanced technology and automation, leading to restrained hiring beyond essential personnel. Even under high transparency requirements, employment growth remains limited as companies may focus on enhancing environmental sustainability and governance structures to maintain public trust [76]. Given this scenario, companies must maximize cost efficiency through automation, AI, and big data analytics, while selectively hiring a small number of highly skilled specialists [77]. Governments and educational institutions should work together to enhance workforce training programs, and firms should actively promote ESG initiatives to demonstrate their commitment to sustainability and ethical management.
Scenario C is characterized by high economic value volatility, leading to rapid market expansion and a surge in employment creation. Although this volatility can generate significant short-term profits, the sustainability of these employment opportunities remains uncertain. Companies may adopt flexible workforce strategies, including project-based contracts and partnerships, to manage this uncertainty [78]. Given the high transparency requirements, firms must be prepared to address the environmental risks and community concerns that may arise during periods of rapid market growth. To navigate this high-risk, high-reward environment, firms should diversify their energy sector investments, including energy storage systems, renewable energy, and VPP technologies, to hedge against volatility. They should also implement flexible hiring structures, allowing them to quickly scale up or down as needed. Additionally, regular ESG disclosures and transparent risk management processes are essential for maintaining trust among stakeholders.
Scenario D represents a highly volatile economic environment with intense technological competition that severely limits new employment creation. Under these conditions, companies focus on cost reduction and efficiency by prioritizing process automation and AI-driven optimization over new hiring [79]. Instead of expanding their workforce, firms reallocate existing employees and invest in technological advancements.
Simultaneously, strict ESG transparency requirements force companies to disclose financial and ESG performance data regularly, compelling them to adopt alternative corporate social responsibility initiatives, such as environmental protection and community engagement, to maintain a positive reputation. To withstand extreme market fluctuations, firms must establish rigorous risk management and internal control systems to maintain investor confidence [80]. Moreover, maximizing the use of AI and automation is essential to ensure cost efficiency and competitiveness. Because new employment creation is minimal, firms should focus on enhancing environmental performance and social contribution initiatives to strengthen their corporate image and secure long-term competitiveness.
Unlike previous studies that primarily focused on short-term technological optimization, this study adopted a comprehensive scenario analysis approach that integrates long-term sustainability, social acceptance, policy support, and ESG transparency requirements. By defining economic value volatility and employment creation potential as core uncertainties and incorporating ESG transparency requirements as a secondary factor, this study presents a more holistic perspective on the long-term development pathways of the EV battery and VPP industries beyond purely technological considerations.
6. Conclusions
The findings of this study demonstrate that each scenario provides a multifaceted outlook on market growth potential and employment creation, emphasizing not only technological optimization, but also the comprehensive impact of policy and societal factors on industry development. By highlighting social responsibility and sustainability, which have often been overlooked in previous research, this study clarifies how employment creation and ESG requirements interact under various conditions. Consequently, this study offers strategic directions for businesses and policymakers to navigate evolving market environments effectively.
The academic contribution of this study lies in its broader perspective on the future trajectory of the EV battery and VPP industries, integrating social and policy factors into a more comprehensive analytical framework. This study makes a significant contribution to long-term industry forecasting by focusing on economic value and employment creation potential. From a policy perspective, this study provides insights into transparency-enhancing policies and workforce development programs that offer practical guidance to companies seeking sustainable growth strategies. Furthermore, this study employed a mixed-methods approach that combines scenario planning with Monte Carlo simulations, thereby supplementing traditional qualitative analyses with quantitative uncertainty assessments. By using scenario planning to explore various future pathways and Monte Carlo simulations to provide probabilistic analyses of each pathway, this study produced more reliable and realistic policy recommendations. This hybrid methodology is particularly effective for systematically analyzing uncertainties in complex systems, making it a valuable contribution to future applications across diverse industries.
Despite its contributions, this study had several limitations. First, it does not fully incorporate the impact of external variables, such as regulatory changes, geopolitical dynamics, and the pace of technological innovation. Future research should expand scenario analysis by integrating quantitative models and empirical data to account for these external factors [81,82]. In addition, more empirical case studies should be conducted to enhance the practical applicability of these findings to industry professionals. This study provides a comprehensive perspective on the development of the EV battery and VPP industries, reaffirming the significance of sustainable energy transitions and social value creation from an ESG perspective. The findings offer valuable implications for policy formulation and corporate strategy, and serve as a foundational reference for future refined research in this field.
Author Contributions
Conceptualization, S.C. and K.C.; methodology, S.C.; software, S.C.; validation, S.C.; formal analysis, S.C.; writing—original draft preparation, S.C.; writing—review and editing, S.C. and K.C.; supervision, K.C. All authors have read and agreed to the published version of the manuscript.
Funding
This research received no external funding.
Data Availability Statement
The data used to support the findings of this study are included in the article.
Conflicts of Interest
The authors declare no conflicts of interest.
Appendix A

Table A1.
Interview questions for initial uncertainty identification.
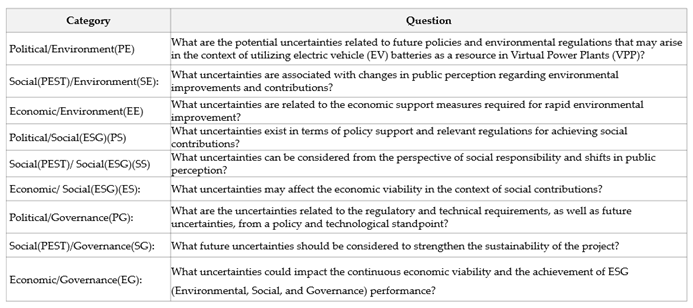 |
Table A2.
Interview questions for initial variable extraction.
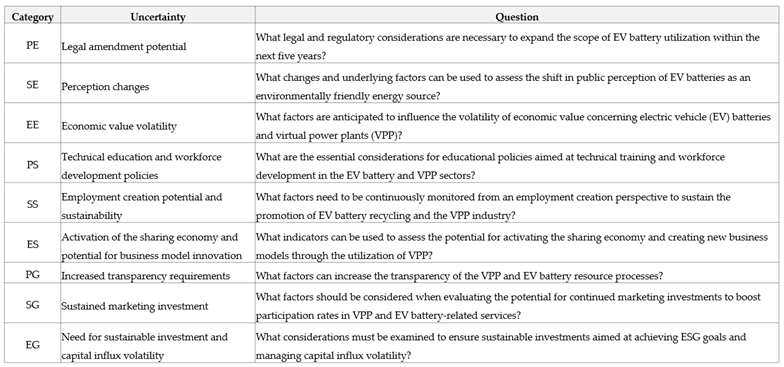 |
Table A3.
Results of initial identification of uncertainty factors.
| Category | # | Uncertainty Factors / Concise Expression |
|---|---|---|
| PE | 6 |
|
| SE | 5 |
|
| EE | 6 |
|
| PS | 5 |
|
| SS | 6 |
|
| ES | 4 |
|
| PG | 4 |
|
| SG | 5 |
|
| EG | 5 |
|
Table A4.
Results of selection of primary uncertainty factors.
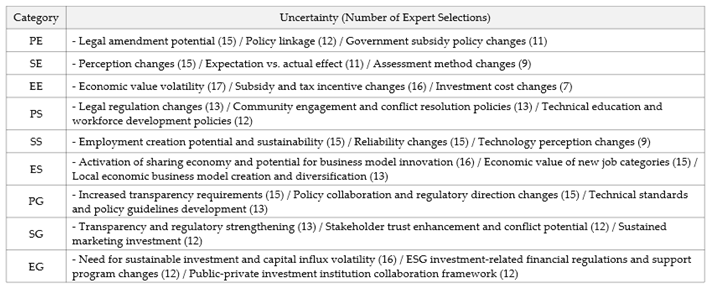 |
Table A5.
Results of selection of secondary uncertainty factors.
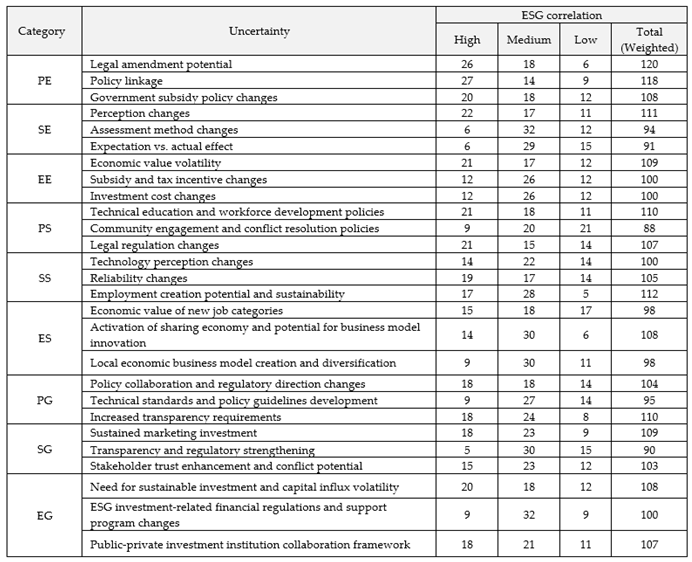 |
Table A6.
Result of initial variable extraction and final variable selection.
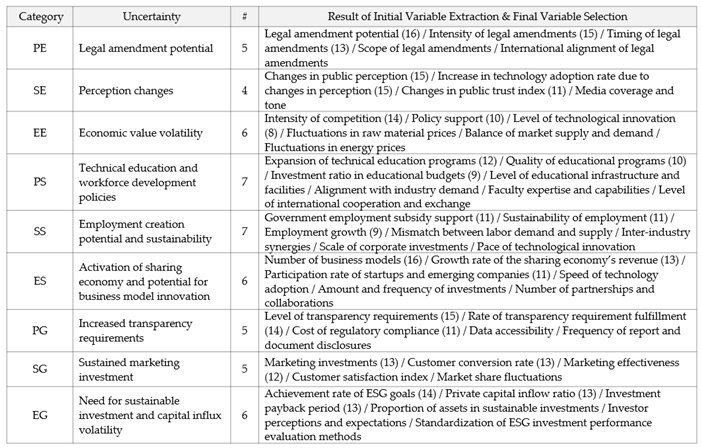 |
Table A7.
Results of extraction of probability distribution parameters.
| Uncertainty | Variable | Probability Distribution | Parameters |
|---|---|---|---|
| (PE) Legal amendment potential | Legal amendment potential | Binomial Distribution |
|
| Intensity of legal amendments | Normal Distribution |
|
|
| Timing of legal amendments | Triangular Distribution |
|
|
| (SE) Perception changes | Changes in public perception | Normal Distribution |
|
| Changes in public trust index | Normal Distribution |
|
|
| Increase in technology adoption rate due to changes in perception | Triangular Distribution |
|
|
| (EE) Economic value volatility | Intensity of competition | Normal Distribution |
|
| Policy support | Discrete Probability Distribution |
|
|
| Level of technological innovation | Triangular Distribution |
|
|
| (PS) Technical education and workforce development policies | Expansion of technical education programs | Binomial Distribution |
|
| Quality of educational programs | Normal Distribution |
|
|
| Investment ratio in educational budgets | Triangular Distribution |
|
|
| (SS) Employment creation potential and sustainability | Government employment subsidy support | Triangular Distribution |
|
| Sustainability of employment | Normal Distribution |
|
|
| Employment growth | Triangular Distribution |
|
|
| (ES) Activation of sharing economy and potential for business model innovation | Number of business models | Poisson Distribution |
|
| Growth rate of the sharing economy’s revenue | Normal Distribution |
|
|
| Participation rate of startups and emerging companies | Triangular Distribution |
|
|
| (PG) Increased transparency requirements | Level of transparency requirements | Normal Distribution |
|
| Rate of transparency requirement fulfillment | Triangular Distribution |
|
|
| Cost of regulatory compliance | Triangular Distribution |
|
|
| (SG) Sustained marketing investment | Marketing investments | Binomial Distribution |
|
| Customer conversion rate | Triangular Distribution |
|
|
| Marketing effectiveness | Triangular Distribution |
|
|
| (EG) Need for sustainable investment and capital influx volatility | Achievement rate of ESG goals | Triangular Distribution |
|
| Private capital inflow ratio | Normal Distribution |
|
|
| Investment payback period | Log-Normal Distribution |
|
References
- Lau, H.C.; Tsai, S.C. Global Decarbonization: Current Status and What It Will Take to Achieve Net Zero by 2050. Energies 2023, 16, 7800. [Google Scholar] [CrossRef]
- Schmietendorf, K.; Peinke, J.; Kamps, O. The Impact of Turbulent Renewable Energy Production on Power Grid Stability and Quality. The European Physical Journal B 2017, 90, 1–6. [Google Scholar] [CrossRef]
- Liu, R.; Liu, Y.; Jing, Z. Impact of Industrial Virtual Power Plant on Renewable Energy Integration. Global Energy Interconnection 2020, 3, 545–552. [Google Scholar] [CrossRef]
- Dielmann, K.; van der Velden, A. Virtual Power Plants (VPP)—A New Perspective for Energy Generation? In Proceedings of the 9th International Scientific and Practical Conference of Students, Post-graduates Modern Techniques and Technologies, 2003. MTT 2003; IEEE: 2003.
- Pasetti, M.; Rinaldi, S.; Manerba, D. A Virtual Power Plant Architecture for the Demand-Side Management of Smart Prosumers. Applied Sciences 2018, 8, 432. [Google Scholar] [CrossRef]
- Lund, H.; Kempton, W. Integration of Renewable Energy into the Transport and Electricity Sectors Through V2G. Energy Policy 2008, 36, 3578–3587. [Google Scholar] [CrossRef]
- Rubino, L.; Capasso, C.; Veneri, O. Review on Plug-in Electric Vehicle Charging Architectures Integrated with Distributed Energy Sources for Sustainable Mobility. Applied Energy 2017, 207, 438–464. [Google Scholar] [CrossRef]
- Nitlarp, T.; Kiattisin, S. The Impact Factors of Industry 4.0 on ESG in the Energy Sector. Sustainability 2022, 14, 9198. [Google Scholar] [CrossRef]
- Wang, W.; Chen, P.; Zeng, D.; Liu, J. Electric Vehicle Fleet Integration in a Virtual Power Plant With Large-Scale Wind Power. IEEE Transactions on Industrial Informatics 2020, 16, 5612–5620. [Google Scholar] [CrossRef]
- Qureshi, U.; Andrabi, I.; Manzoor, M.; Khan, S.J.; Gul, O.; Farooq, F. Optimizing Electric Vehicle Integration in Virtual Power Plants: A Stochastic Optimization Framework with MDNN Integration. IEEE Transactions on Industrial Informatics 2024. [CrossRef]
- Popescu, C.; et al. Social Innovation, Circularity, and Energy Transition for Environmental, Social, and Governance (ESG) Practices—A Comprehensive Review. Energies 2022, 15, 9028. [Google Scholar] [CrossRef]
- Veza, I.; et al. Electric Vehicle (EV) and Driving Towards Sustainability: Comparison Between EV, HEV, PHEV, and ICE Vehicles to Achieve Net Zero Emissions by 2050 from EV. Alexandria Engineering Journal 2023, 82, 459–467. [Google Scholar] [CrossRef]
- Foa, R.; Howard, M. Use of Monte Carlo Simulation for the Public Sector: An Evidence-Based Approach to Scenario Planning. International Journal of Market Research 2006, 48, 27–48. [Google Scholar] [CrossRef]
- Gordon, A.V. Matrix Purpose in Scenario Planning: Implications of Congruence with Scenario Project Purpose. Futures 2020, 115, 102479. [Google Scholar] [CrossRef]
- Li, J.; Peng, D.; Zhao, H.; Wang, D.; Qi, E. A ‘Spatial-Temporal’ Bi-Layer Optimal Control Strategy of Large-Scale Electric Vehicles (EVs) in a Multi-Area Virtual Power Plant (VPP) Oriented to Dual Carbon Target. IET Renewable Power Generation 2022, 16, 1445–1461. [Google Scholar] [CrossRef]
- Zhou, B.; Zhang, K.; Chan, K.W.; Li, C.; Lu, X.; Bu, S. Optimal Coordination of Electric Vehicles for Virtual Power Plants With Dynamic Communication Spectrum Allocation. IEEE Transactions on Industrial Informatics 2020, 16, 5612–5623. [Google Scholar] [CrossRef]
- Harsh, P.; Sun, H.; Das, D.; Awagan, G.; Jiang, J. A Stochastic Incentive-Based Demand Response Program for Virtual Power Plant with Solar, Battery, Electric Vehicles, and Controllable Loads. arXiv 2024, arXiv:2406.00163 2024. [Google Scholar]
- Jeon, W.; Cho, S.; Cho, I. Economic Value Analysis of Electric Vehicle Demand Resources Under the Energy Transition Policy: Focusing on the 9th Power Supply and Demand Plan(에너지전환 정책하에 전기차 수요자원의 경제적 가치 분석: 9차 전력수급계획 중심으로. 자원경제연구). Journal of Resource Economics 2021, 38, 57–73. [Google Scholar]
- Wüstenhagen, R.; Wolsink, M.; Bürer, M.J. Social Acceptance of Renewable Energy Innovation: An Introduction to the Concept. Energy Policy 2007, 35, 2683–2691. [Google Scholar] [CrossRef]
- Matz Ringdgren, H.; Vandhold, H. Scenario Planning. Filmak, 2012.
- Chen, K.; Ren, Z.; Mu, S.; Sun, T.Q.; Mu, R. Integrating the Delphi Survey into Scenario Planning for China’s Renewable Energy Development Strategy Towards 2030. Technological Forecasting and Social Change 2020, 158, 120157. [Google Scholar] [CrossRef]
- Fathi, M.R.; Maleki, M.H.; Sobhani, S.M.; Koksal, C.D. Future Study of Operations Research Based on Scenario Planning and Soft Systems Methodology. Foresight 2020, 22, 223–249. [Google Scholar] [CrossRef]
- Mietzner, D.; Reger, G. Advantages and Disadvantages of Scenario Approaches for Strategic Foresight. International Journal of Technology Intelligence and Planning 2005, 1, 220–239. [Google Scholar] [CrossRef]
- Sikander, A. Scenario-Planning as a Stand-Alone Tool for Strategic Foresight: Limitations and Options. Change Management: An International Journal 2016, 16, 1. [Google Scholar] [CrossRef]
- Mun, Johnathan. Modeling risk: Applying Monte Carlo simulation, real options analysis, forecasting, and optimization techniques. Vol. 347. John Wiley & Sons, 2006.
- Zhu, L.; He, L.; Shang, P.; Zhang, Y.; Ma, X. Influencing Factors and Scenario Forecasts of Carbon Emissions of the Chinese Power Industry: Based on a Generalized Divisia Index Model and Monte Carlo Simulation. Energies 2018, 11, 2398. [Google Scholar] [CrossRef]
- Prakash, A.; Jha, S.K.; Mohanty, R.P. Scenario Planning for Service Quality: A Monte Carlo Simulation Study. Journal of Strategy and Management 2012, 5, 331–352. [Google Scholar] [CrossRef]
- Markmann, C.; Darkow, I.-L.; Von Der Gracht, H. A Delphi-Based Risk Analysis—Identifying and Assessing Future Challenges for Supply Chain Security in a Multi-Stakeholder Environment. Technological Forecasting and Social Change 2013, 80, 1815–1833. [Google Scholar] [CrossRef]
- Ho, J.K.-K. Formulation of a Systemic PEST Analysis for Strategic Analysis. European Academic Research 2014, 2, 6478–6492. [Google Scholar]
- Oyasor, E.I.; Gbadebo, A.D. Strategic Decisions for Business Sustainability: Evidence Based on the Five C Analysis and PEST Analysis. International Journal of Professional Business Review 2024, 9, 15. [Google Scholar] [CrossRef]
- Nasir, M.H.N.M.; Sahibuddin, S. Addressing a Critical Success Factor for Software Projects: A Multi-Round Delphi Study of TSP. International Journal of the Physical Sciences 2011, 6, 1213–1232. [Google Scholar]
- Holt, G.; Hughes, D. A Study Using Semi-Structured Interview and Delphi Survey to Explore the Barriers and Enabling Factors that Influence Access and Utilization of Weight Management Services for People Living with Morbid Obesity: A Patient and Professional Perspective. Journal of Human Nutrition and Dietetics 2021, 34, 215–223. [Google Scholar] [CrossRef]
- Maier, H.R.; et al. An Uncertain Future, Deep Uncertainty, Scenarios, Robustness, and Adaptation: How Do They Fit Together? Environmental Modelling & Software 2016, 81, 154–164. [Google Scholar]
- Dalkey, N.; Helmer, O. An Experimental Application of the DELPHI Method to the Use of Experts. Management Science 1963, 9, 458–467. [Google Scholar] [CrossRef]
- Rowe, G.; Wright, G. The Delphi Technique as a Forecasting Tool: Issues and Analysis. International Journal of Forecasting 1999, 15, 353–375. [Google Scholar] [CrossRef]
- Landeta, J.; Barrutia, J.; Lertxundi, A. Hybrid Delphi: A Methodology to Facilitate Contribution from Experts in Professional Contexts. Technological Forecasting and Social Change 2011, 78, 1629–1641. [Google Scholar] [CrossRef]
- McKim, C.A. The Value of Mixed Methods Research: A Mixed Methods Study. Journal of Mixed Methods Research 2017, 11, 202–222. [Google Scholar] [CrossRef]
- Harpe, S.E. How to Analyze Likert and Other Rating Scale Data. Currents in Pharmacy Teaching and Learning 2015, 7, 836–850. [Google Scholar] [CrossRef]
- Al Atoum, B.; Biagi, S.F.; González-Díaz, D.; Jones, B.J.P.; McDonald, A.D. Electron Transport in Gaseous Detectors with a Python-Based Monte Carlo Simulation Code. Computer Physics Communications 2020, 254, 107357. [Google Scholar] [CrossRef]
- Han, H.-S.; Kim, C.-Y. Applying Monte Carlo Simulation for Supporting Decision Making in Software Projects. Journal of Information Technology Services 2010, 9, 123–133. [Google Scholar]
- Hawawini, G.A. A Mean-Standard Deviation Exposition of the Theory of the Firm under Uncertainty: A Pedagogical Note. The American Economic Review 1978, 68, 194–202. [Google Scholar]
- Rhydderch, A. Scenario Building: The 2x2 Matrix. Futuribles International 2017.
- Brown, J. Interviews, Focus Groups, and Delphi Techniques. In Advanced Research Methods for Applied Psychology; Routledge: 2018, pp. 95–106.
- Dilshad, R.M.; Latif, M.I. Focus Group Interview as a Tool for Qualitative Research: An Analysis. Pakistan Journal of Social Sciences 2013, 33, 191–198. [Google Scholar]
- Nardi, P.M. Doing Survey Research: A Guide to Quantitative Methods. Routledge: 2018.
- Hejazi, A. Unveiling Cognitive Biases in Scenario Development: A Study of the 2x2 Matrix Method. Nuts About Leadership 2024, 1, 1–7. [Google Scholar]
- Schwartz, P. The Art of the Long View: Planning for the Future in an Uncertain World. Currency Doubleday: 1991.
- Van der Heijden, K. Scenarios: The Art of Strategic Conversation. Wiley: 1996.
- McHugh, K.A.; et al. Collective Decision Making, Leadership, and Collective Intelligence: Tests with Agent-Based Simulations and a Field Study. The Leadership Quarterly 2016, 27, 218–241. [Google Scholar] [CrossRef]
- Lavenberg, S.S.; Welch, P.D. A Perspective on the Use of Control Variables to Increase the Efficiency of Monte Carlo Simulations. Management Science 1981, 27, 322–335. [Google Scholar] [CrossRef]
- Kermanshachi, S.; Rouhanizadeh, B.; Dao, B. Application of Delphi Method in Identifying, Ranking, and Weighting Project Complexity Indicators for Construction Projects. Journal of Legal Affairs and Dispute Resolution in Engineering and Construction 2020, 12, 04519033. [Google Scholar] [CrossRef]
- Vidal, L.-A.; Marle, F.; Bocquet, J.-C. Using a Delphi Process and the Analytic Hierarchy Process (AHP) to Evaluate the Complexity of Projects. Expert Systems with Applications 2011, 38, 5388–5405. [Google Scholar] [CrossRef]
- Saltelli, A.; Ratto, M.; Andres, T.; Campolongo, F.; Cariboni, J.; Gatelli, D.; Saisana, M.; Tarantola, S. Global Sensitivity Analysis: The Primer. Wiley: 2008.
- De Lataillade, A.; et al. Monte Carlo Method and Sensitivity Estimations. Journal of Quantitative Spectroscopy and Radiative Transfer 2002, 75, 529–538. [Google Scholar] [CrossRef]
- Xu, C.; Gertner, G. Uncertainty and Sensitivity Analysis for Models with Correlated Parameters. Reliability Engineering & System Safety 2008, 93, 1563–1573. [Google Scholar]
- Park, H.W.; Jeon, S.P.; Kim, S.G. Analysis of Technology Evaluation Impact Factors in the Agricultural and Food Industry and Comparison with Simulation-Based Technology Evaluation. Journal of Technology Innovation 2016, 24, 277–307. [Google Scholar]
- Lewis, A. GetDist: A Python Package for Analyzing Monte Carlo Samples. arXiv 2019, arXiv:1910.13970, 2019. [Google Scholar]
- Schoemaker, P.J.H. Scenario Planning: A Tool for Strategic Thinking. Sloan Management Review 1993, 36, 25–40. [Google Scholar]
- Bradfield, R.; Wright, G.; Burt, G.; Cairns, G.; van der Heijden, K. The Origins and Evolution of Scenario Techniques in Long Range Business Planning. Futures 2005, 37, 795–812. [Google Scholar] [CrossRef]
- Metropolis, N.; Ulam, S. The Monte Carlo Method. Journal of the American Statistical Association 1949, 44, 335–341. [Google Scholar] [CrossRef]
- Mahmutoglu, A.G.; Erdogan, A.T.; Demir, A. Random Input Sampling for Complex Models Using Markov Chain Monte Carlo. arXiv 2012, arXiv:1211.4706 2012. [Google Scholar]
- Kroese, D.P.; Taimre, T.; Botev, Z.I. Handbook of Monte Carlo Methods. Wiley: 2011.
- Qamruzzaman, M.D.; Karim, S. Green Energy, Green Innovation, and Political Stability Led to Green Growth in OECD Nations. Energy Strategy Reviews 2024, 55, 101519. [Google Scholar] [CrossRef]
- Fink, A.; et al. Consensus Methods: Characteristics and Guidelines for Use. American Journal of Public Health 1984, 74, 979–983. [Google Scholar] [CrossRef] [PubMed]
- Woolley, A.W.; et al. Evidence for a Collective Intelligence Factor in the Performance of Human Groups. Science 2010, 330, 686–688. [Google Scholar] [CrossRef]
- Saltelli, A.; et al. Variance-Based Sensitivity Analysis of Model Output. Design and Estimator for the Total Sensitivity Index. Computer Physics Communications 2010, 181, 259–270. [Google Scholar] [CrossRef]
- Pedregosa, F.; et al. Scikit-learn: Machine Learning in Python. The Journal of Machine Learning Research 2011, 12, 2825–2830. [Google Scholar]
- McKinney, W. Python for Data Analysis: Data Wrangling with Pandas, NumPy, and IPython. O’Reilly Media, Inc.: 2012.
- Rezvani, Z.; Jansson, J.; Bodin, J. Advances in Consumer Electric Vehicle Adoption Research: A Review and Research Agenda. Transportation Research Part D: Transport and Environment 2015, 34, 122–136. [Google Scholar] [CrossRef]
- Dubois, C.-A.; Singh, D. From Staff-Mix to Skill-Mix and Beyond: Towards a Systemic Approach to Health Workforce Management. Human Resources for Health 2009, 7, 1–19. [Google Scholar] [CrossRef]
- Ioannou, I.; Serafeim, G. The Impact of Corporate Social Responsibility on Investment Recommendations: Analysts’ Perceptions and Shifting Institutional Logics. Strategic Management Journal 2015, 36, 1053–1081. [Google Scholar] [CrossRef]
- Flammer, C. Corporate Green Bonds. Journal of Financial Economics 2021, 142, 499–516. [Google Scholar] [CrossRef]
- Wüstenhagen, R.; Menichetti, E. Strategic Choices for Renewable Energy Investment: Conceptual Framework and Opportunities for Further Research. Energy Policy 2012, 40, 1–10. [Google Scholar] [CrossRef]
- Eccles, R.G.; Ioannou, I.; Serafeim, G. The Impact of a Corporate Culture of Sustainability on Corporate Behavior and Performance. National Bureau of Economic Research 2012, 17950, 1. [Google Scholar] [CrossRef]
- Brynjolfsson, E.; McAfee, A. The Second Machine Age: Work, Progress, and Prosperity in a Time of Brilliant Technologies. WW Norton & Company: 2014.
- Surroca, J.; Tribó, J.A.; Waddock, S. Corporate Responsibility and Financial Performance: The Role of Intangible Resources. Strategic Management Journal 2010, 31, 463–490. [Google Scholar] [CrossRef]
- Acemoglu, D.; Restrepo, P. Artificial Intelligence, Automation, and Work. In The Economics of Artificial Intelligence: An Agenda; University of Chicago Press: 2018; pp. 197–236.
- Hobday, M. The Project-Based Organisation: An Ideal Form for Managing Complex Products and Systems? Research Policy 2000, 29, 871–893. [Google Scholar] [CrossRef]
- Autor, D.H.; Levy, F.; Murnane, R.J. The Skill Content of Recent Technological Change: An Empirical Exploration. The Quarterly Journal of Economics 2003, 118, 1279–1333. [Google Scholar] [CrossRef]
- Cortesi, A.; Tettamanzi, P.; Corno, F. Empirical Evidence on Internal Control Systems and Corporate Governance in Italy. Journal of Management & Governance 2009, 13, 75–100. [Google Scholar]
- Rogelj, J.; et al. Scenarios Towards Limiting Global Mean Temperature Increase Below 1.5°C. Nature Climate Change 2018, 8, 325–332. [Google Scholar] [CrossRef]
- Kemp-Benedict, E. From Narrative to Number: A Role for Quantitative Models in Scenario Analysis. 2004.
Figure 1.
Research procedure.
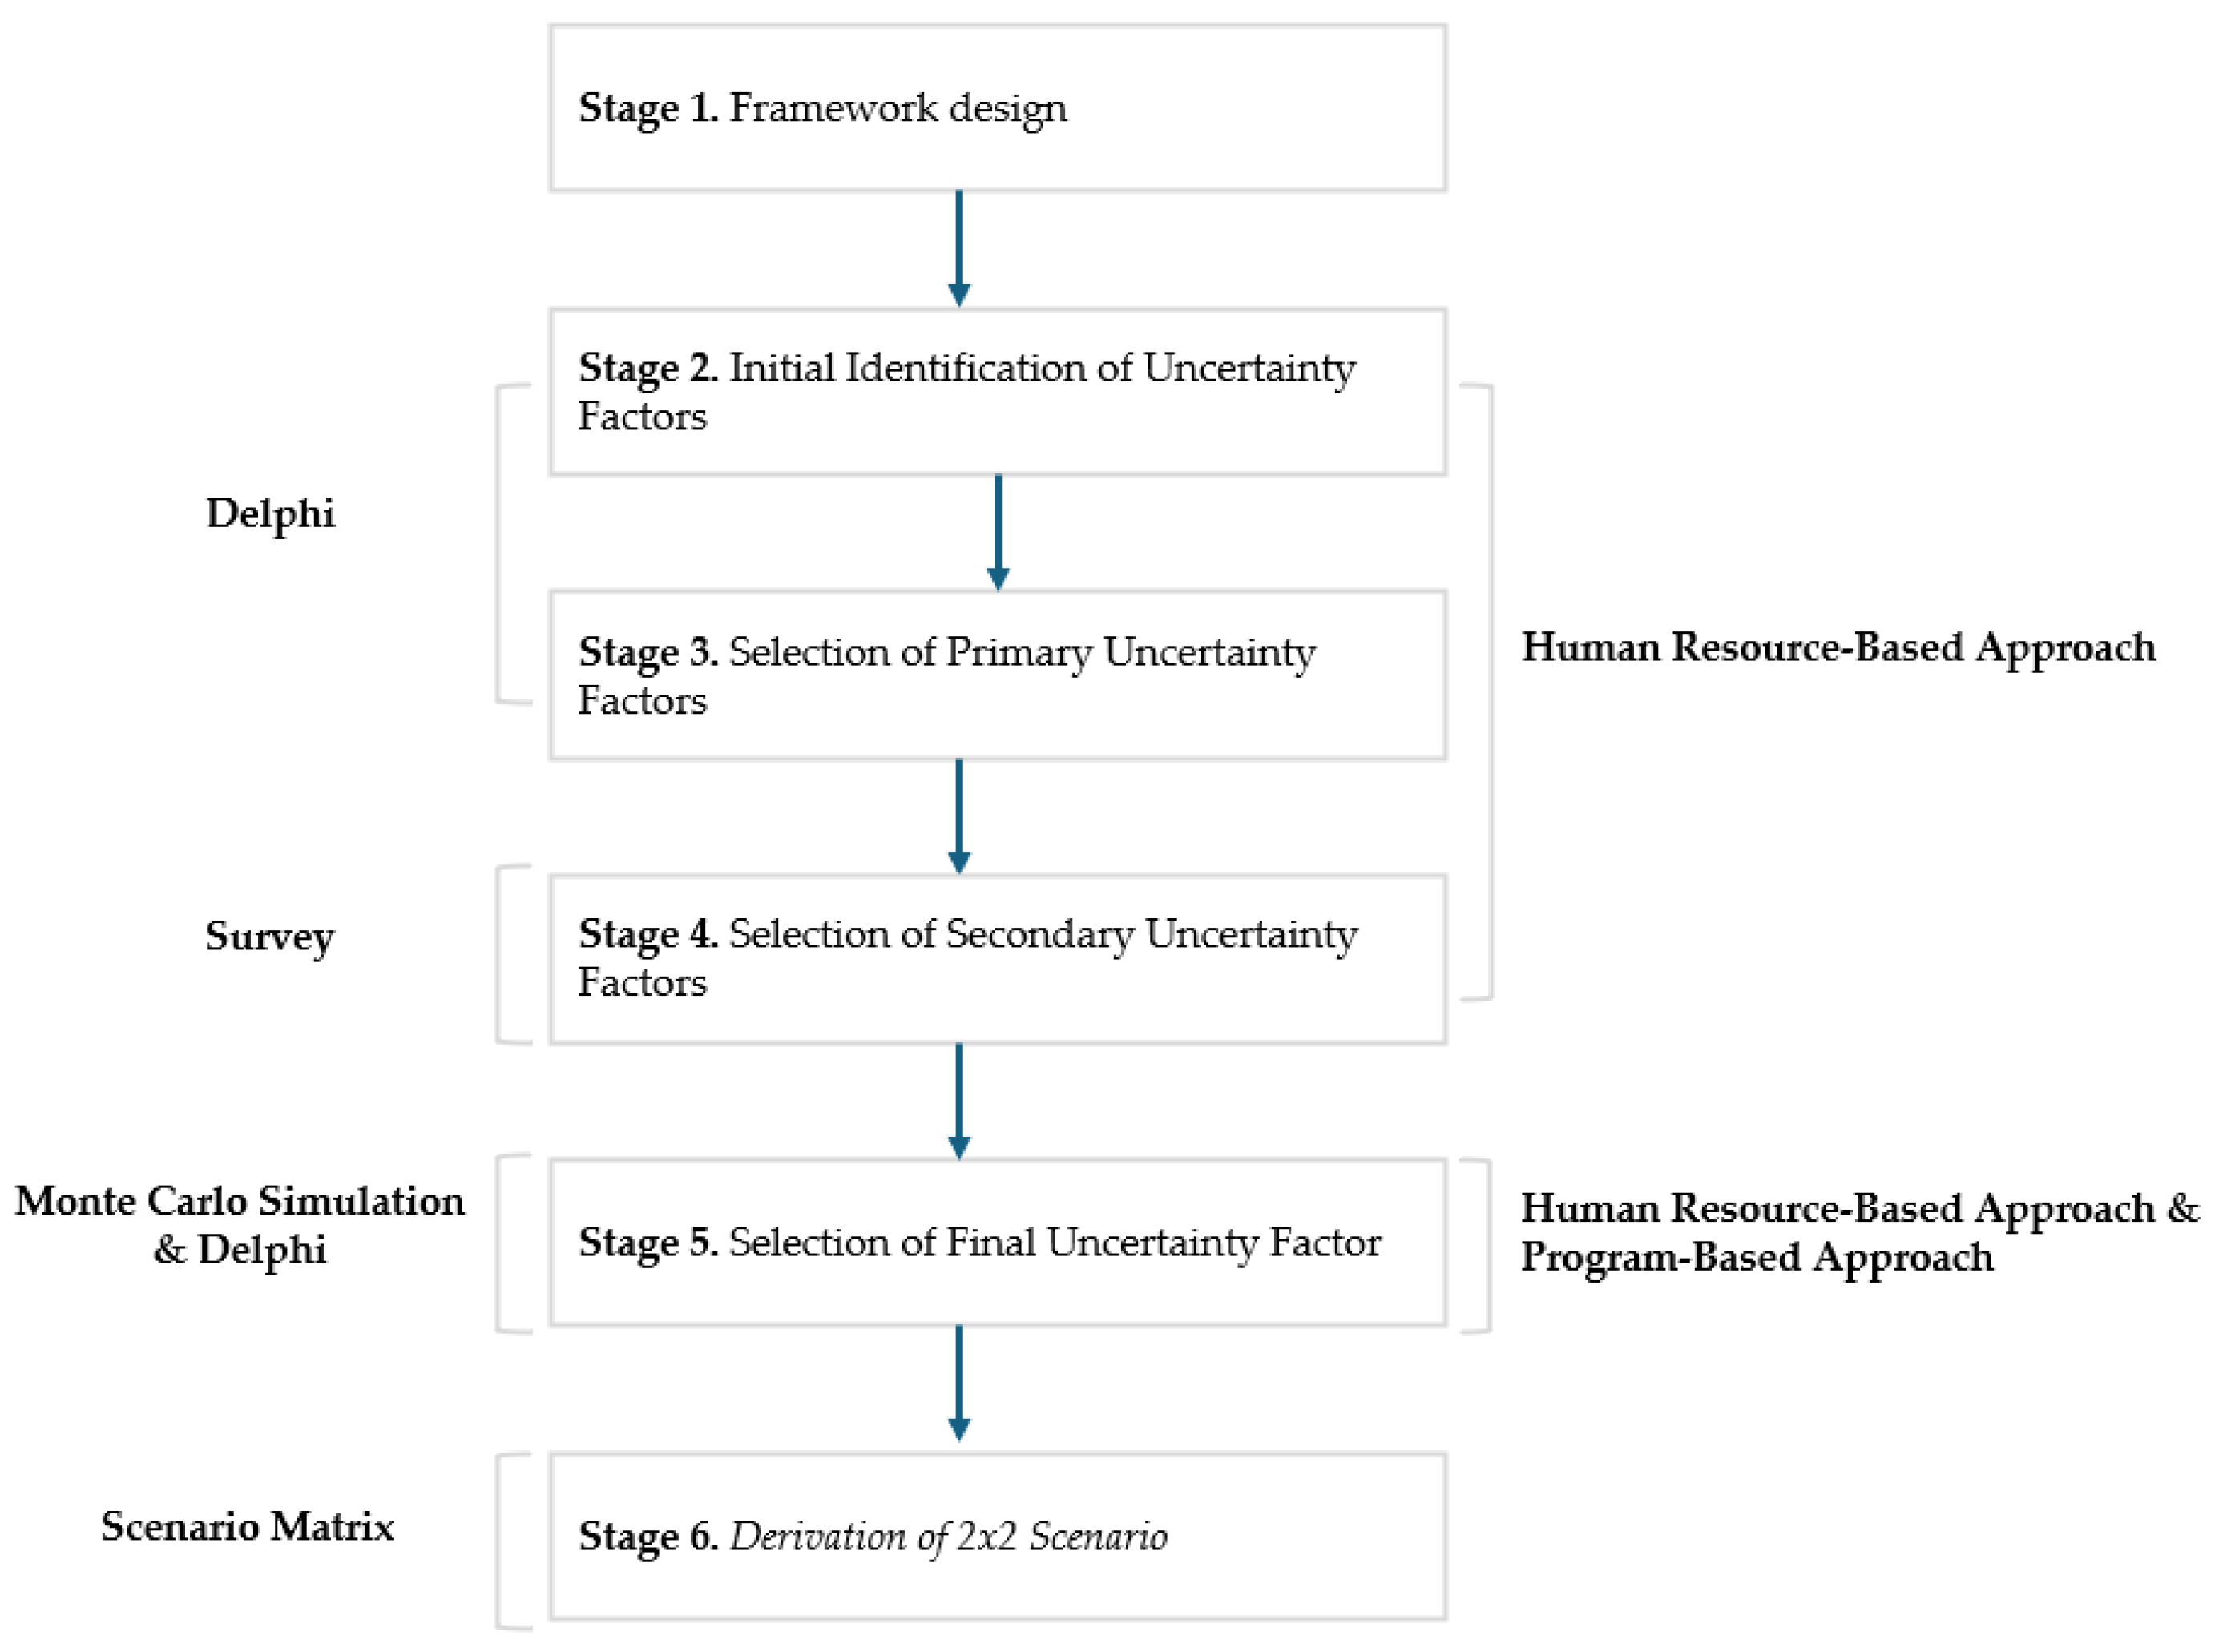
Figure 2.
Procedure for Scenario Development.
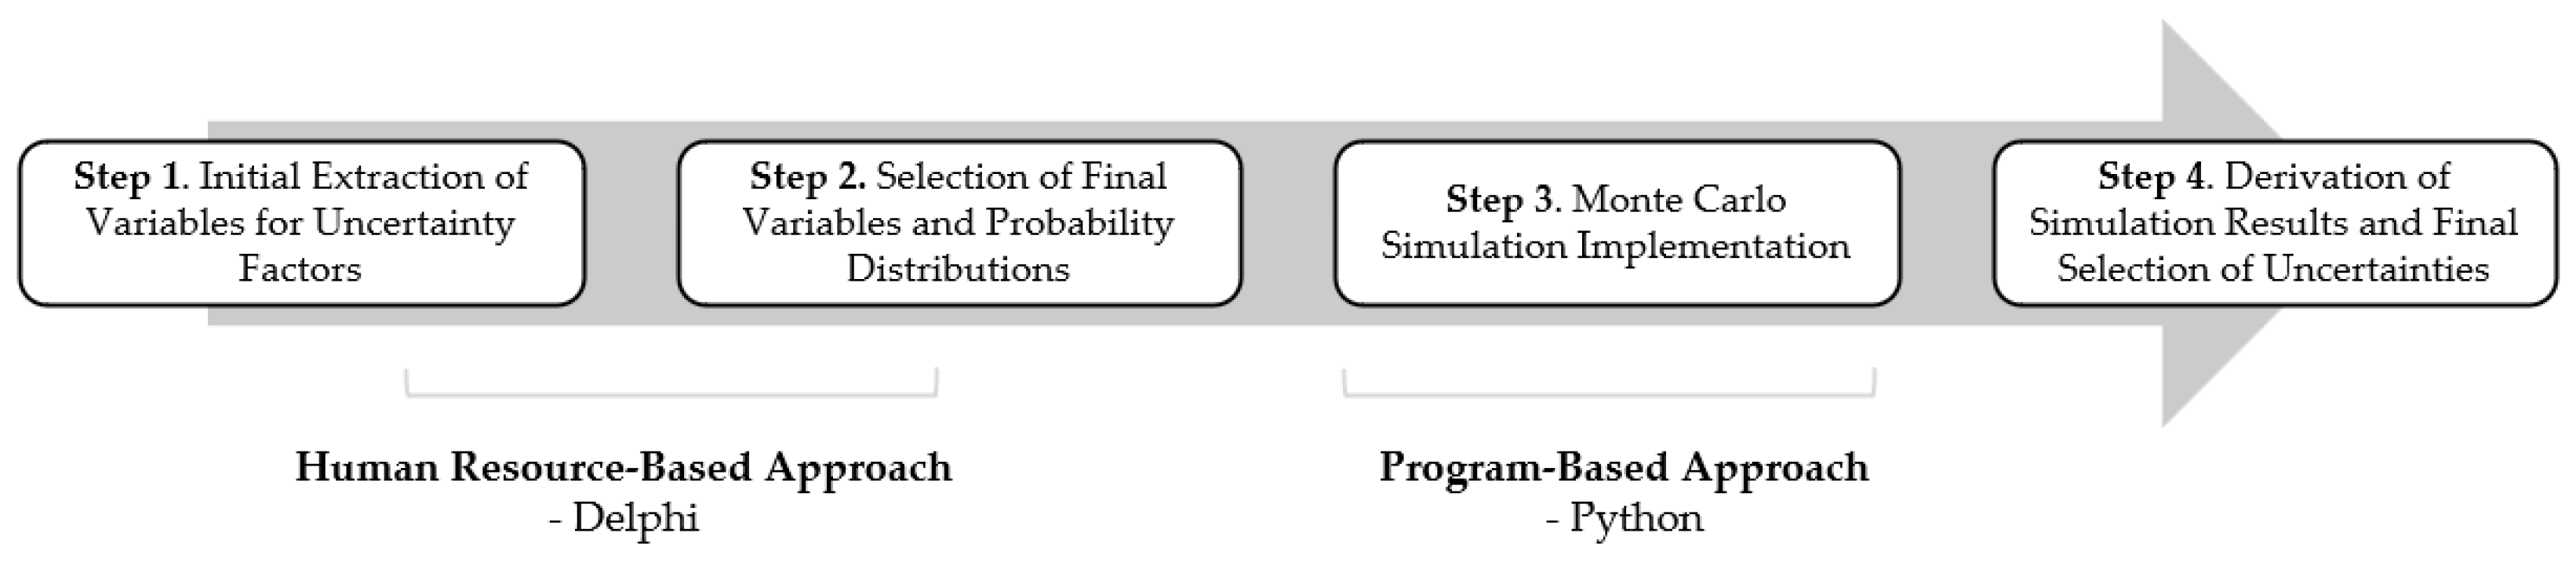
Figure 3.
Python code for “legal amendment potential (PE)”.
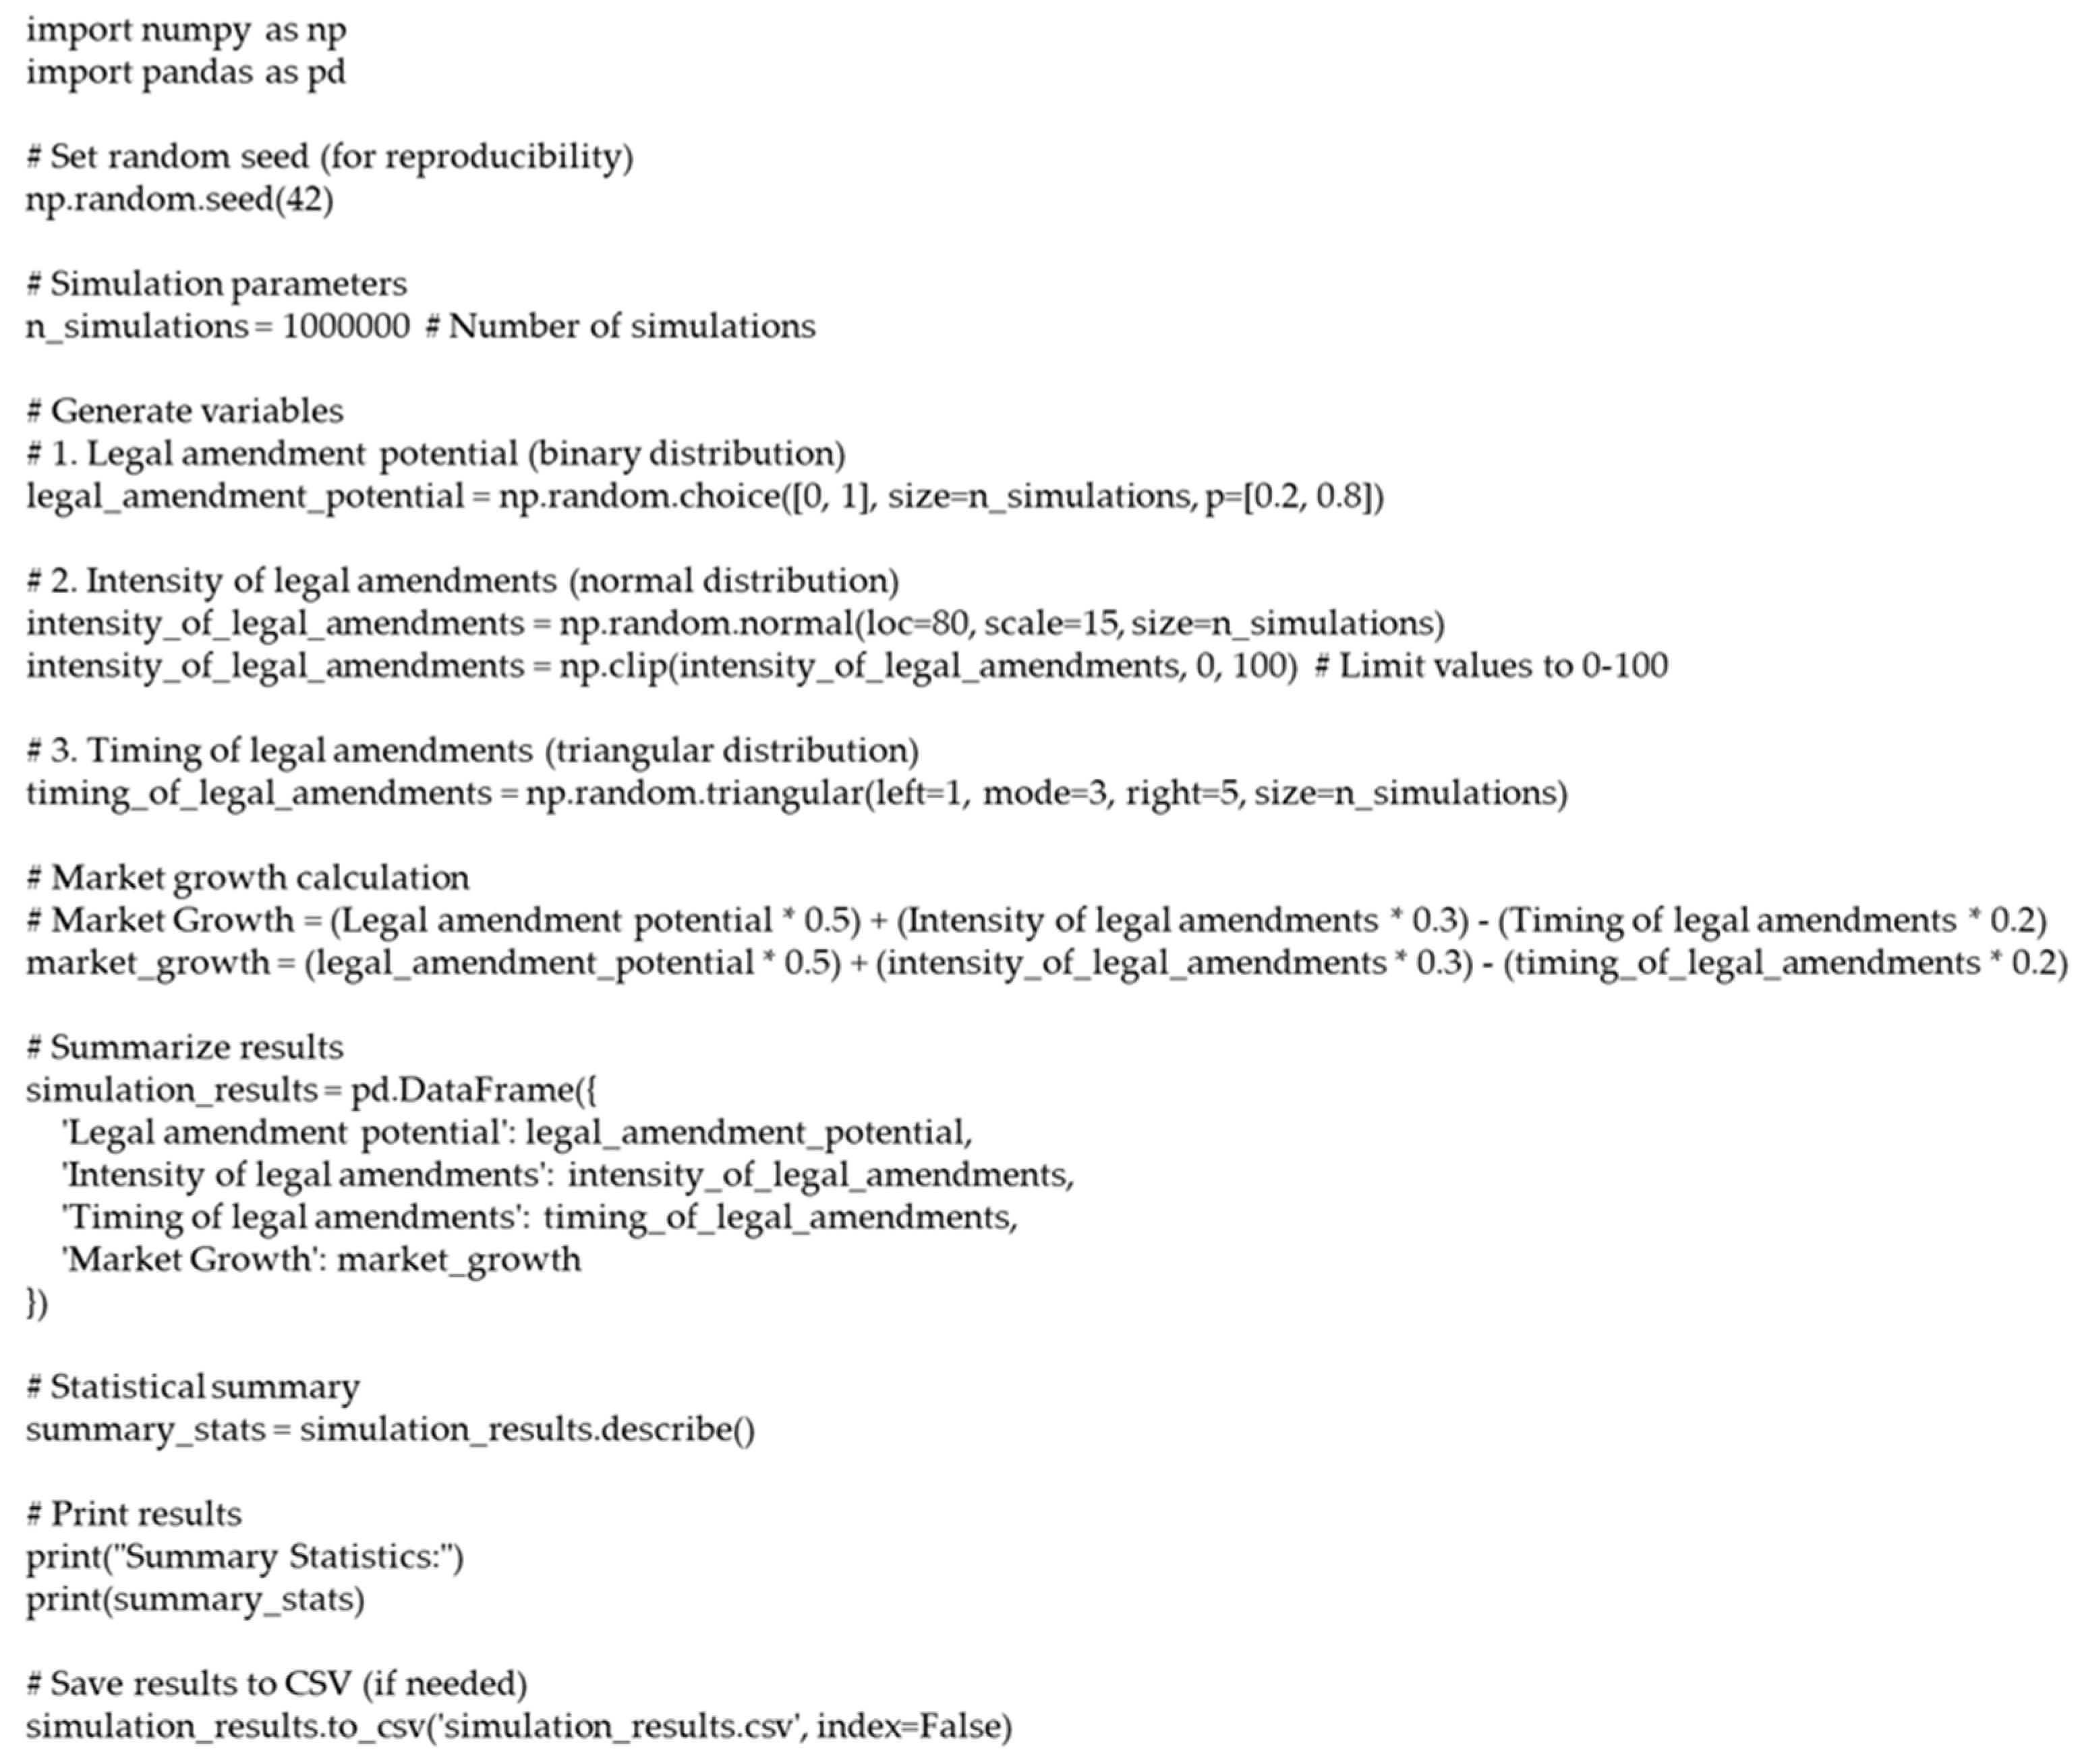
Figure 4.
Visualization of simulation results for “legal amendment potential (PE)”.
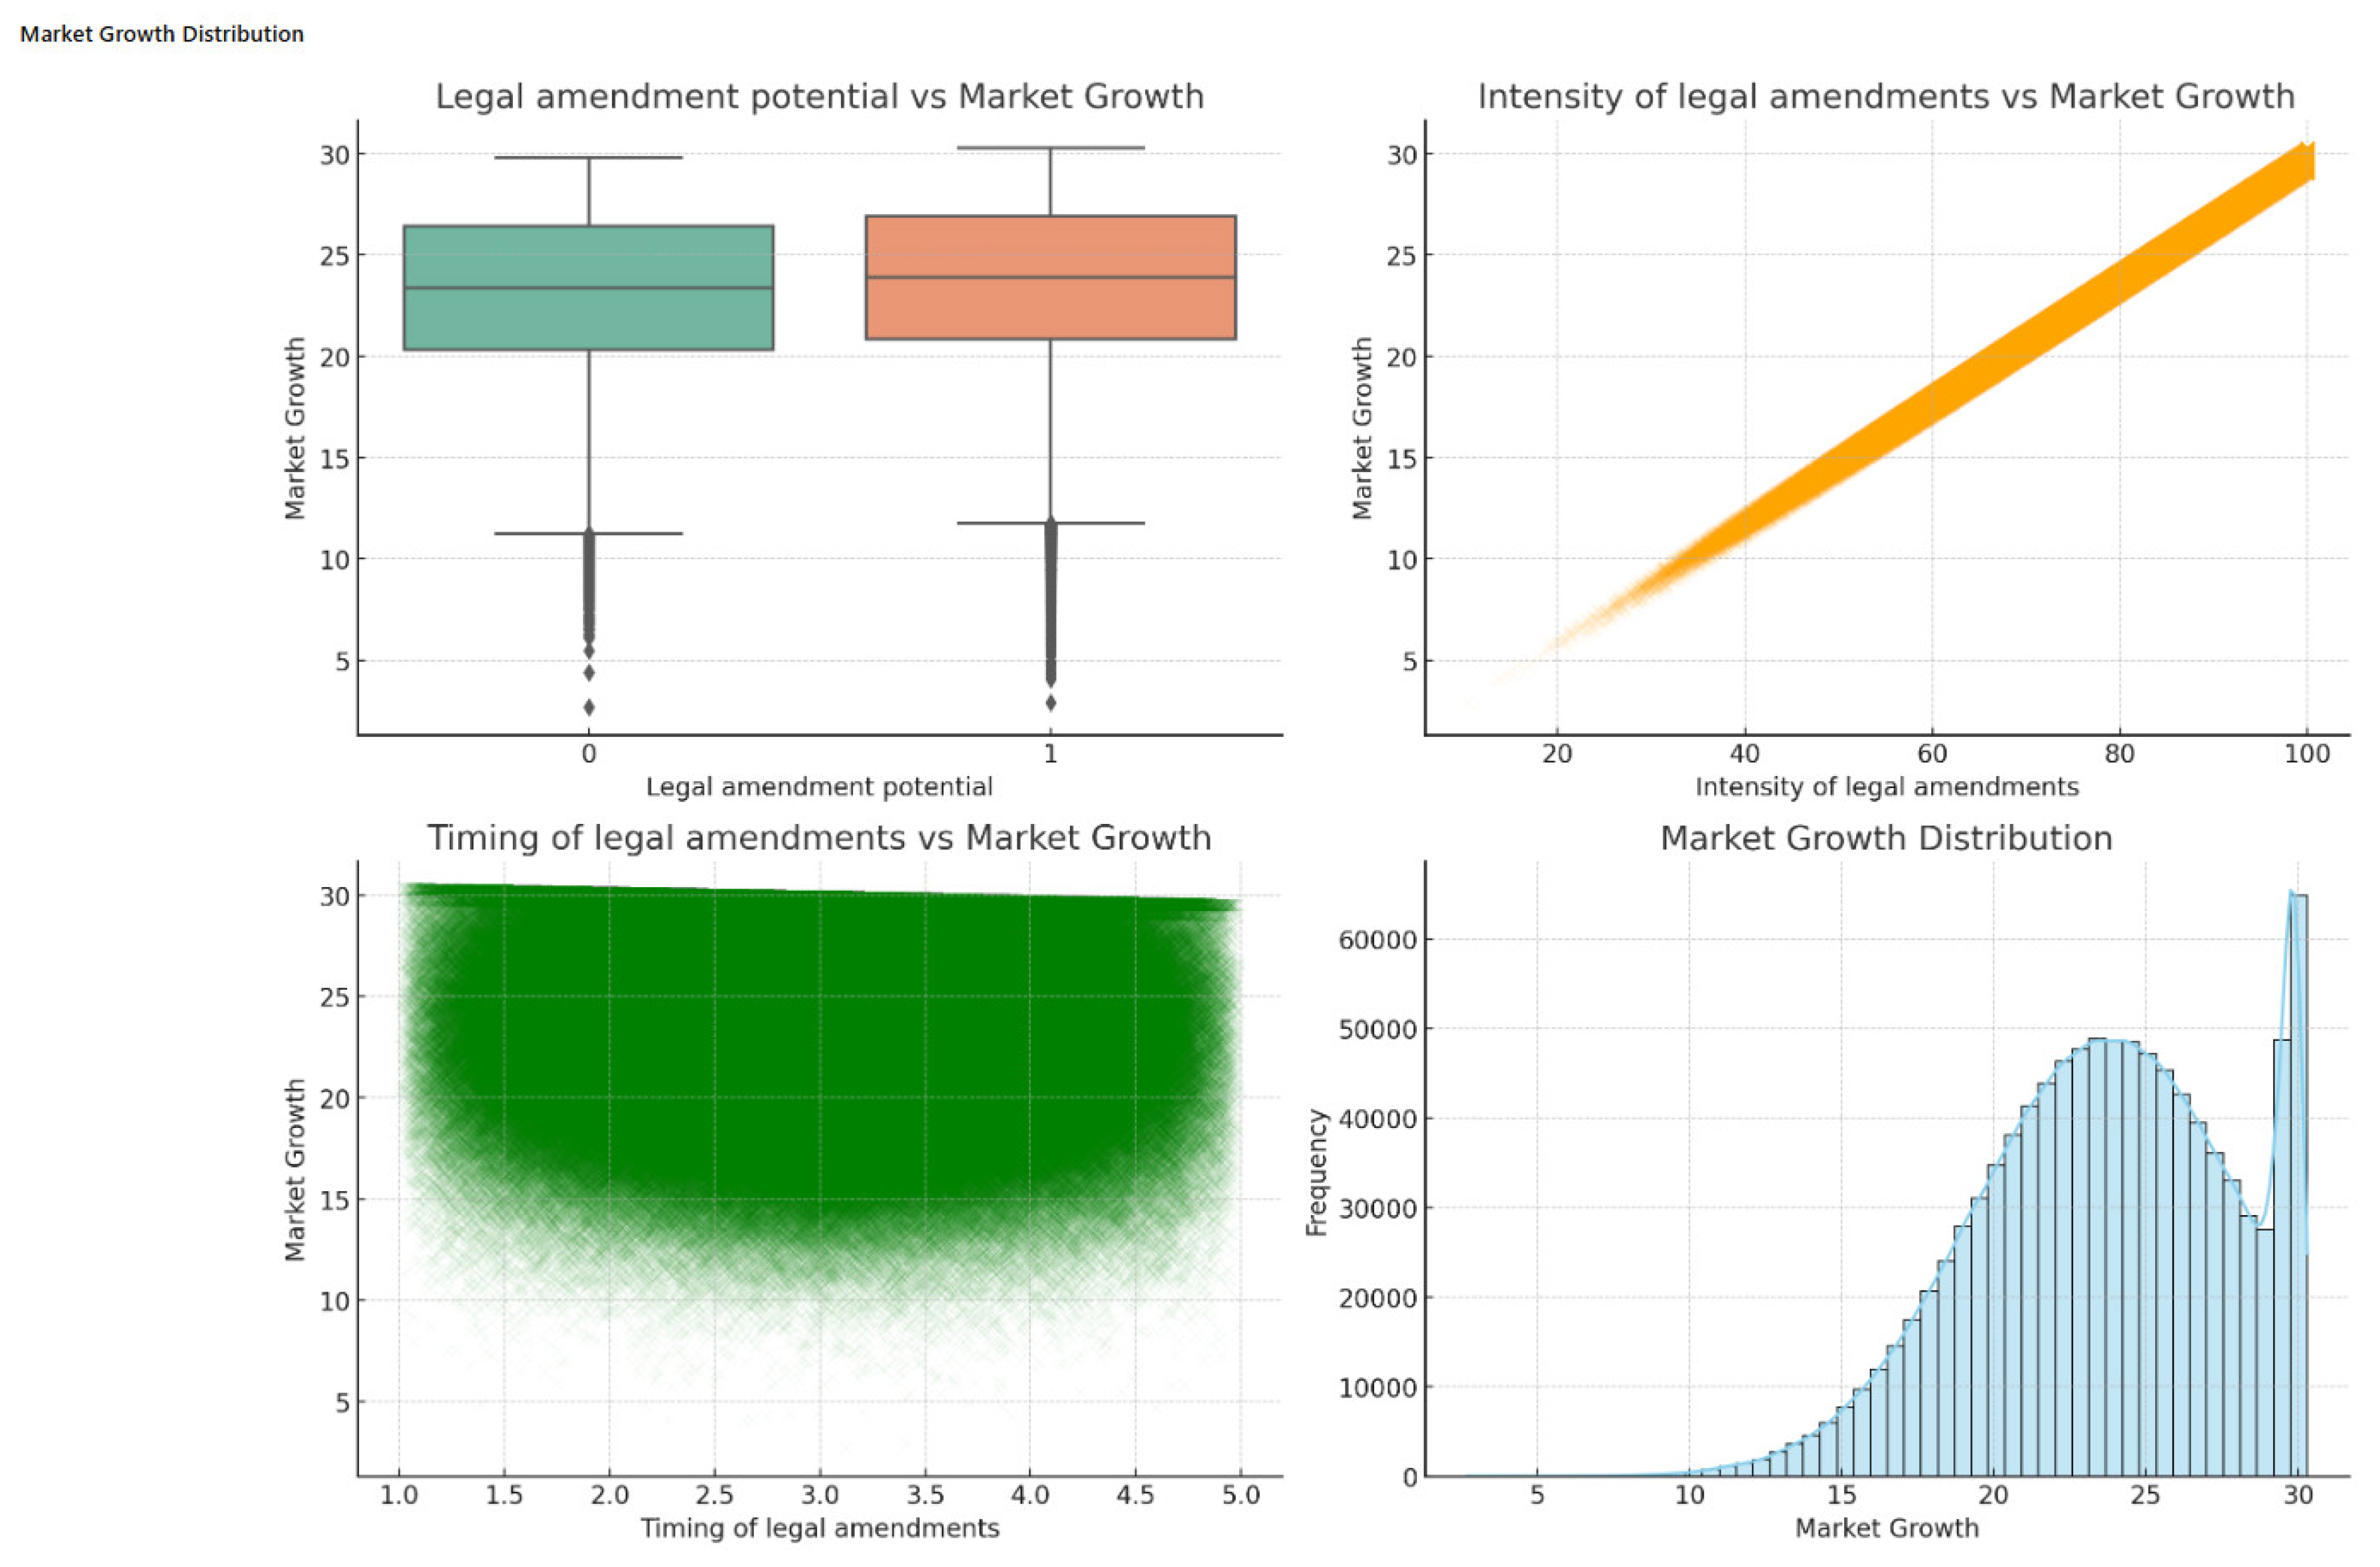
Figure 5.
Python code for adjusting the parameter reference value of “legal amendment potential” variable within a ±10% range.
Figure 5.
Python code for adjusting the parameter reference value of “legal amendment potential” variable within a ±10% range.
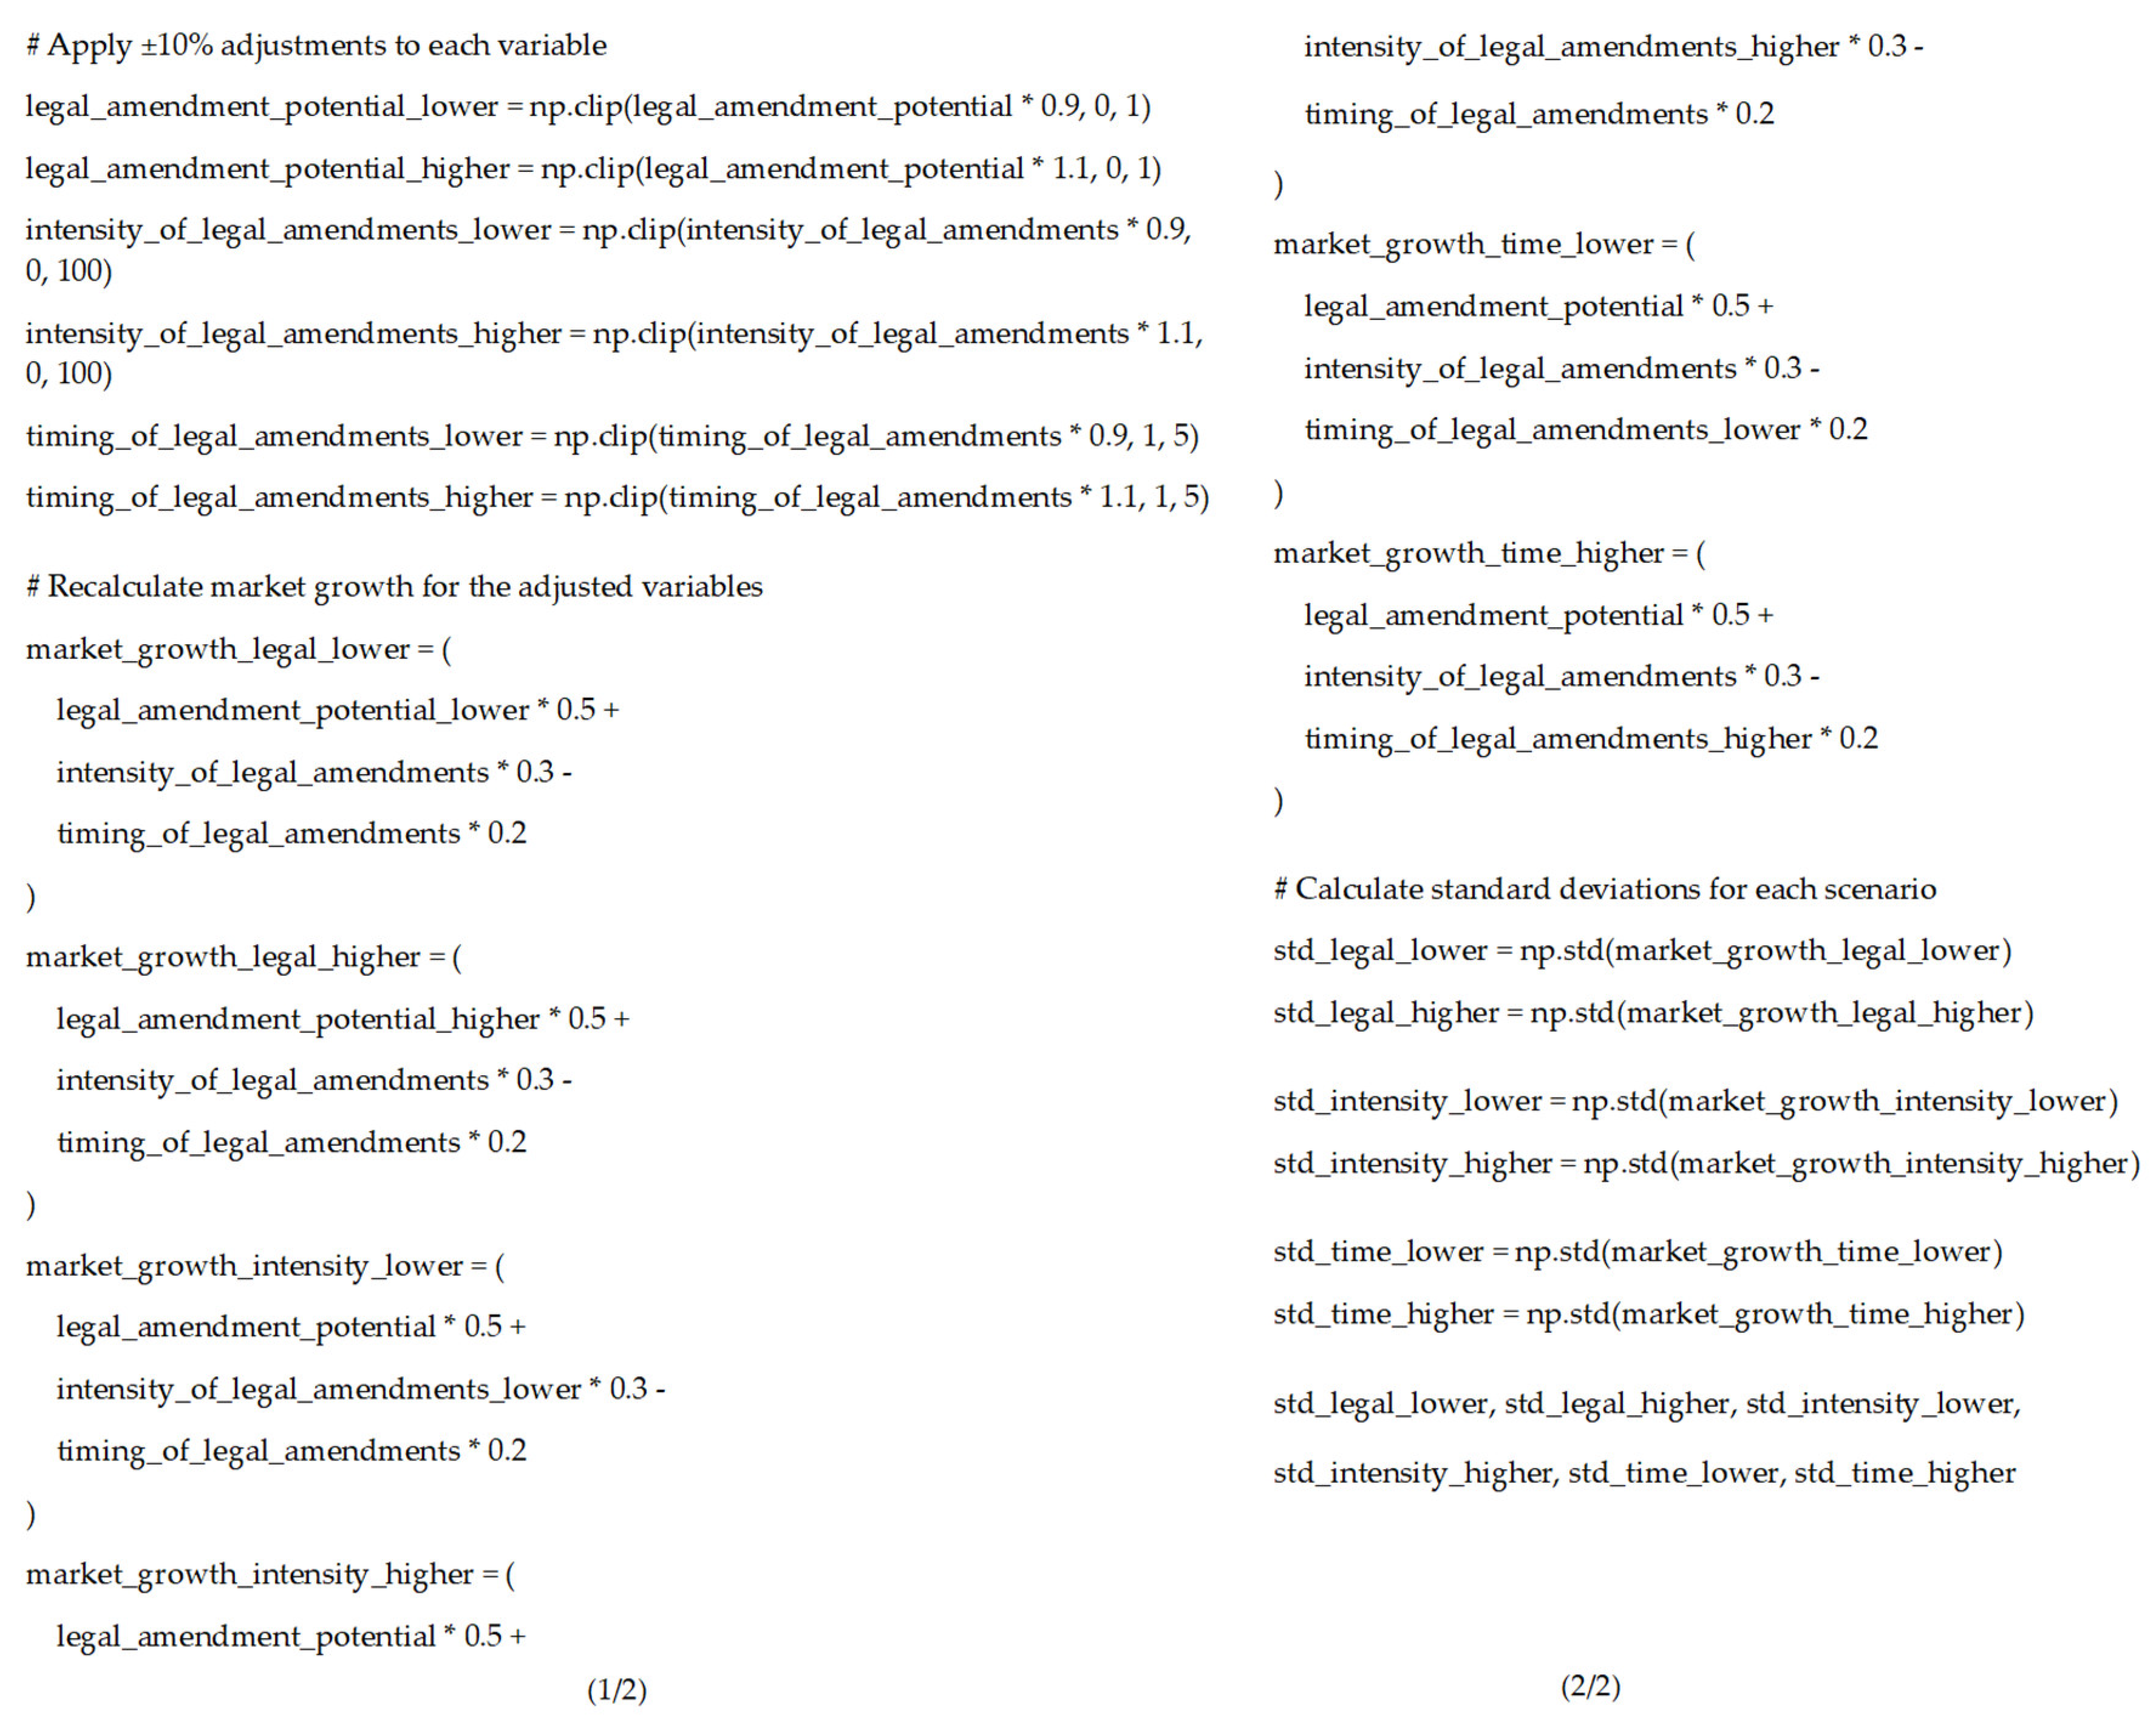
Figure 6.
Results of the 2x2 Scenario Matrix.
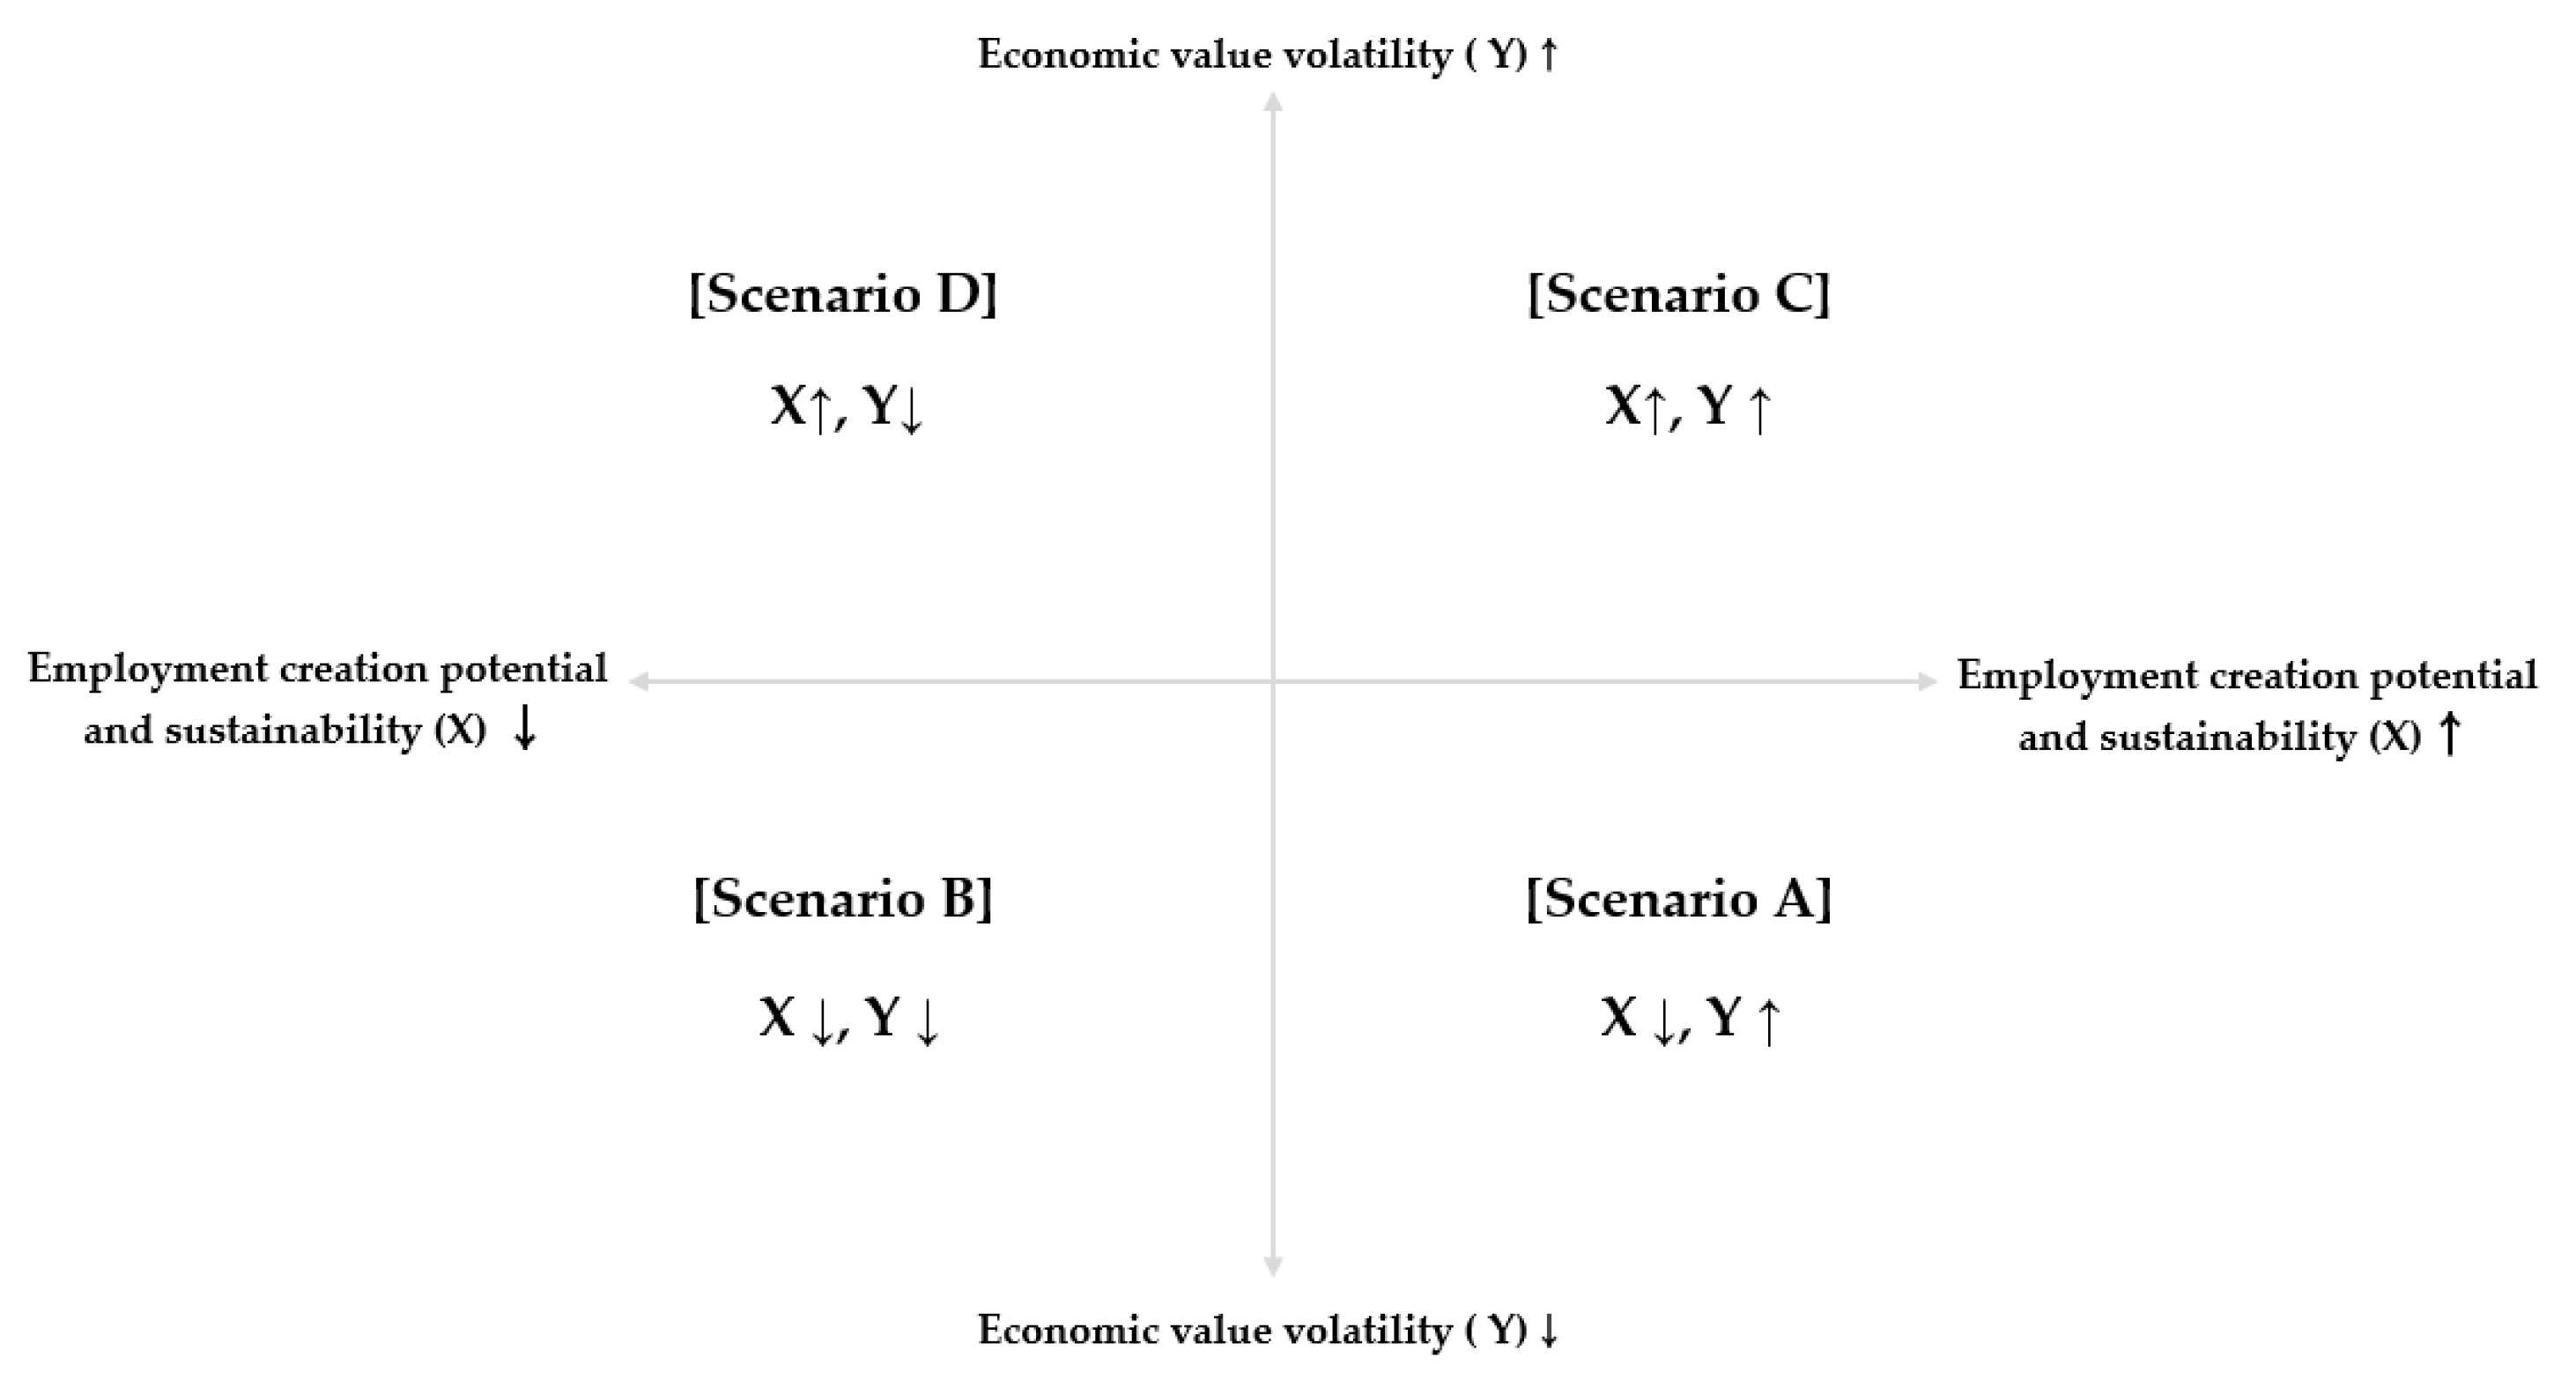
Table 1.
Interview questions for initial uncertainty identification.
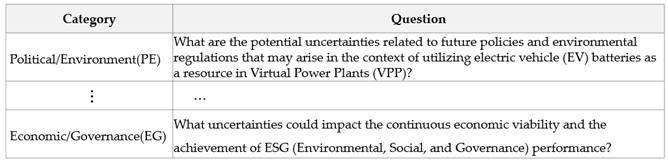 |
Table 2.
Interview questions for initial variable extraction.
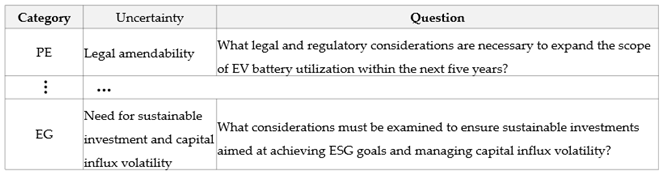 |
Table 3.
Results of Initial Identification of Uncertainty Factors.
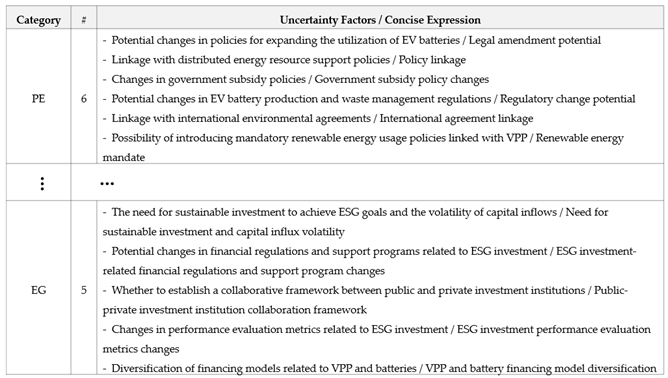 |
Table 4.
Results of Selection of Primary Uncertainty Factors.
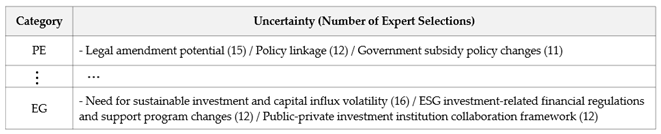 |
Table 5.
Results of Selection of Secondary Uncertainty Factors.
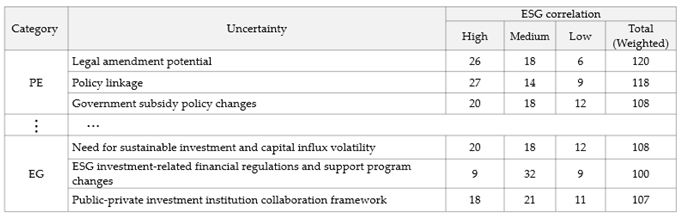 |
Table 6.
Result of Initial Variable Extraction and Final Variable Selection.
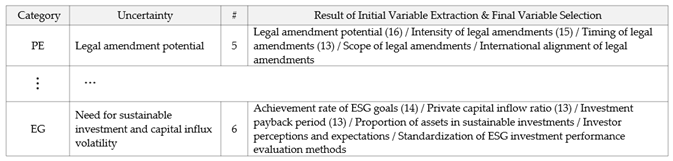 |
Table 7.
Results of Extraction of Probability Distribution Parameters.
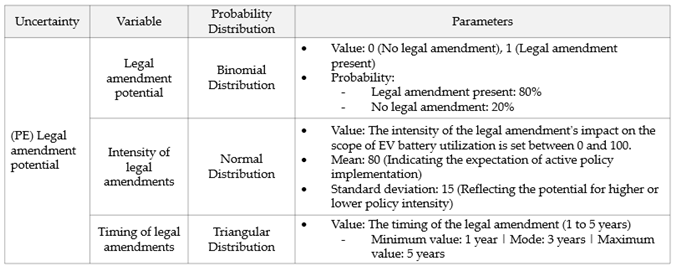 |
Table 8.
Final Result of Simulation.
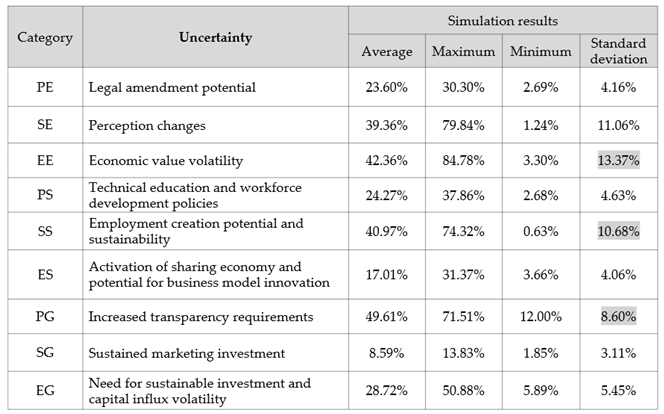 |
Table 9.
Result of Sensitivity Analysis.
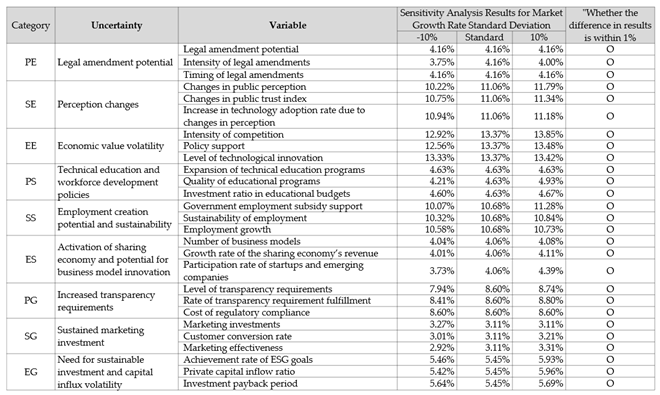 |
Disclaimer/Publisher’s Note: The statements, opinions and data contained in all publications are solely those of the individual author(s) and contributor(s) and not of MDPI and/or the editor(s). MDPI and/or the editor(s) disclaim responsibility for any injury to people or property resulting from any ideas, methods, instructions or products referred to in the content. |
© 2025 by the authors. Licensee MDPI, Basel, Switzerland. This article is an open access article distributed under the terms and conditions of the Creative Commons Attribution (CC BY) license (http://creativecommons.org/licenses/by/4.0/).
Copyright: This open access article is published under a Creative Commons CC BY 4.0 license, which permit the free download, distribution, and reuse, provided that the author and preprint are cited in any reuse.


