Submitted:
28 July 2025
Posted:
29 July 2025
You are already at the latest version
Abstract
In order to reduce the risk brought by the uncertainty of renewable energy output and electric vehicle travel to virtual power plant scheduling, this paper proposes an optimal scheduling model of virtual power plant incorporating electric vehicles based on in-formation gap decision theory. Firstly, a Monte Carlo load prediction model was estab-lished based on the behavior characteristics of EV users, and the Sigmoid function was introduced to quantify the dynamic relationship between user response willingness and VPP incentive price. Secondly, based on the VPP framework, wind power, photovoltaic power, gas turbines, energy storage systems and EV clusters with V2G capabilities are integrated to establish an economic optimization scheduling model considering mul-ti-source collaboration. Then, aiming at the uncertain parameters in the model, the in-formation gap decision theory is introduced, and a two-level decision-making mecha-nism with both risk aversion and opportunity seeking is constructed. Finally, a virtual power plant is tested with an example to verify the correctness and effectiveness of the proposed model and algorithm. The results show that the method can realize the load side peak balancing and valley filling effectively, and has advantages in economy and stability.
Keywords:
information gap decision theory
; electric vehicles
; virtual power plant
; optimal scheduling
1. Introduction
Distributed energy sources are widely used in the construction of new power systems due to their multiple advantages, such as being green, flexible, and renewable [1,2,3]. At the same time, they exhibit randomness and volatility due to environmental factors. In the future, the large-scale, high-proportion integration of distributed energy will pose significant challenges to the stability of the power system and energy security. Therefore, establishing a more flexible and resilient new power system has become an urgent task. The Virtual Power Plant (VPP) aggregates and controls controllable loads such as wind power, photovoltaics, energy storage, and electric vehicles, participating in the electricity market through advanced communication technologies [4,5]. Through complementary advantages and optimal allocation within the VPP, it is possible to reduce the randomness and volatility of renewable energy within the system on one hand, and to achieve multi-energy complementarity on the power side and flexible interaction on the load side on the other [6]. Therefore, studying the optimal scheduling and operation methods of VPPs has important practical value for the optimized utilization of distributed energy.
Currently, research on VPPs mainly focuses on dynamic aggregation, electricity market transactions, and economic dispatch [7]. Literature [8] proposes an optimal dispatch strategy that considers the spatio-temporal coupling relationship of output and inter-station flow of adjacent hydropower stations in a whole basin network with abundant hydropower, achieving risk-optimal dispatch that accounts for the uncertainty of VPP wind and solar output and water flow. Literature [9] presents a coordinated internal and external bidding strategy for a VPP operator, who participates in the energy and peak-shaving markets externally while coordinating with its members internally. A Stackelberg game is used to model the dynamic price-quantity game between the operator and controllable distributed power sources and flexible loads. With the rapid development of the Electric Vehicle (EV) industry, the potential of EV clusters as distributed energy storage resources has become increasingly prominent [10]. Many scholars have already studied the coordinated dispatch mechanism between EVs and VPPs. Literature [11] proposes a Stackelberg game-based interval optimization model for a VPP including EVs, where the upper-level model aims to minimize the VPP's operating cost, and the lower-level model's objective is to minimize the charging and discharging costs of EVs, using an improved particle swarm algorithm to iteratively solve the bi-level game model. Literature [12] uses the whale optimization algorithm to optimize the output of the VPP in each period and treats EVs as mobile energy storage devices participating in VPP dispatch according to their travel patterns. Literature [13] aggregates wind and solar distributed energy and EVs into a VPP and proposes a sampling-then-clustering charge-discharge management strategy for EVs, analyzing the impact of different EV management strategies on VPP profits in multiple markets. However, existing work often focuses on physical model optimization, with insufficient research on the correlation mechanism between users' subjective response willingness and incentive strategies.
Meanwhile, the uncertainty of high-proportion renewable energy output is a major focus of current research. Literature [14] uses the two-point estimation method to describe the uncertainty of wind speed, solar irradiation, and load; although the modeling is simple, its accuracy is relatively poor, making it difficult to directly guide practical production. Literature [15] uses a scenario-based method to predict wind power output; while it can accurately describe uncertainty, its computational cost is high, and the distribution of uncertain parameters is difficult to obtain. Literature [16] proposes an economic dispatch model based on chance-constrained programming, discussing the integrated energy system dispatch plans and operating costs under different confidence levels; this stochastic optimization method has a certain degree of subjectivity, and the optimal solution set is closely related to the probability distribution of the uncertain parameters. Literature [17] proposes a two-stage distributional robust optimization model based on a Wasserstein distance-based ambiguity set for wind and solar output forecast errors to study the VPP dispatch decision problem; the choice of the ambiguity set in this method directly affects the model's conservatism and practicality. Literature [18] proposes a robust optimal dispatch strategy considering multiple uncertainties; this method finds it difficult to accurately quantify the impact of uncertain parameters on system operation. Existing models mostly use stochastic programming or robust optimization to handle the combined wind-solar-EV uncertainty, but stochastic optimization relies on precise probability distributions and is computationally complex, while the excessive conservatism of robust optimization leads to low economic efficiency. Information Gap Decision Theory (IGDT), as a method for studying the range of variation of uncertain parameters, requires less information and has high computational efficiency. IGDT provides a basis for decision-making from both robustness and economic perspectives and analyzes the impact of the information gap on the objective function's perturbation, meeting the control needs for uncertain parameters in practical industrial processes.
Therefore, this paper proposes an optimal scheduling model for a VPP including EVs based on Information Gap Decision Theory. First, a Monte Carlo probability forecasting model for EV charging load is constructed based on user travel characteristics. Then, the travel patterns and charging/discharging behaviors of EVs are quantified based on user willingness, incorporating vehicle-to-grid (V2G) technology into the VPP dispatch framework. Second, to reflect the uncertainty of renewable energy output, Information Gap Decision Theory is introduced to replace traditional stochastic programming and robust optimization. IGDT dynamically adjusts the uncertainty interval through a forecast reference value and a deviation factor, handling system uncertainty from both risk-averse and opportunity-seeking perspectives, providing decision-makers with bidirectional dispatch strategies. Finally, a case study is used to verify the effectiveness and superiority of the proposed method in dealing with source-load uncertainty.
2. Electric Vehicle Load Forecasting Model
According to the "China New Energy Vehicle Big Data Research Report (2020)" released by the National Big Data Alliance of New Energy Vehicles, the real-time monitoring operation data of new energy electric vehicles in 2019 were statistically analyzed and fitted. A normal distribution is used to fit the travel characteristics of electric vehicles. The daily driving mileage of a user tends to follow a log-normal distribution, with its probability density function as:
whereis the expected value of the driving distance in kilometers, andis the standard deviation.
The start time of a user's trip follows a normal distribution with the probability density function:
where is the expected value of the travel start time in hours, and is its standard deviation.
The end time of the user's travel for the day follows a normal distribution with the probability density function:
where is the expected value of the return end time in hours, and is its standard deviation.
Taking a charging station in Nanjing as an example, its EV charging data is shown in Figure 1. The Monte Carlo method is used to predict the EV charging load: by inputting basic parameters such as charging power, discharging power, charging efficiency, discharging efficiency, and maximum daily mileage, fundamental random numbers, initial state of charge, and charging start time are generated to calculate the charging duration [19], thereby obtaining the charging or discharging load of a single EV.
Whether an EV owner is willing to follow the dispatch commands of the VPP is highly subjective. To accurately represent the user's willingness to participate in the response, this paper uses the Sigmoid function to model user willingness. This model can effectively reflect the relationship between the EV user's response willingness and the VPP's incentive price [20]. The specific formula is as follows:
where represents the EV user's willingness, is the maximum willingness, k controls the steepness of the curve, p is the VPP's incentive price, and is the midpoint of the curve.
The curve of EV user willingness versus the VPP incentive price is shown in Figure 2. When the price is below the minimum effective price , the owner's willingness is close to zero, meaning they are unwilling to participate. When the price exceeds the saturation price , the owner's willingness approaches its maximum value, and further price increases will not affect it. When the price is at the recommended incentive price , the willingness exceeds 0.8, and most EV users are willing to follow the VPP's control.
At this point, the total EV charging load and total discharging load can be expressed as:
where represents the willingness of the i-th EV user, and are the charging and discharging powers of the i-th EV at time t, respectively.
3. VPP Optimal Dispatch Model with Electric Vehicles
3.1. VPP Framework with Electric Vehicles
The VPP model studied in this paper integrates common power loads such as wind turbines (WT), photovoltaics (PV), gas turbines (GT), energy storage systems (ES), charging piles, and electric vehicles. By coordinating user-side loads and distributed power sources, a VPP framework including electric vehicles is established. The entire framework is shown in Figure 3. The power grid and gas company are the main energy supply sources for the VPP. The new energy generation units are wind turbine and photovoltaic units. The gas turbine uses gas to supply electricity to the user-side load. The gas turbine and energy storage system have fast regulation capabilities, complementing the non-dispatchable nature of renewable energy, which can effectively suppress the fluctuations of wind and solar power and improve the consumption of new energy generation. V2G technology dispatches electric vehicles to eliminate the fluctuations of new energy generation, reduce the impact of renewable energy randomness on the power system, and enable the system to operate efficiently, stably, and safely.
3.2. Objective Function
The model's operating cost includes the gas turbine generation cost , the cost of purchasing electricity from the grid , the operation and maintenance cost of wind and solar power , the energy storage system loss cost , and the EV dispatch cost . The objective function is to minimize the total operating cost of the VPP system, which can be expressed as:
where C is the economic cost of the VPP in one dispatch cycle, T is 24h;
is the GT operation and maintenance management factor, is the actual output of the GT, is the price of natural gas, is the generation efficiency of the gas turbine, and is the calorific value of natural gas;
is the electricity purchase price at time t, and is the purchased power at time t;
and are the operation and maintenance coefficients for wind turbines and photovoltaics, is the number of wind turbines, is the number of photovoltaic panels, and , are the aggregated power of wind and photovoltaics;
and are the charging and discharging price coefficients for electric vehicles at time t;
and are the loss cost and operation/ maintenance cost of the energy storage system at time t, is the operating cost coefficient, is the maintenance cost coefficient, is the rated power, is the energy loss cost coefficient, and are the charging and discharging powers at time t, and , are the charging and discharging efficiencies of the energy storage system.
3.3. Constraints
The VPP purchases electricity and natural gas resources from the high-level energy network and supplies energy to multi-energy users through various energy conversion devices. Its power balance constraint is as follows:
where is the electricity load of the VPP at time t.
The output constraint for the gas turbine is as follows:
where and are the minimum and maximum outputs of the gas turbine.
The constraints for wind and photovoltaic power are as follows:
where and are the maximum available outputs of wind and photovoltaic power at time t.
The charging/discharging and capacity constraints for electric vehicles are as follows:
where and are the maximum charging and discharging powers of the EV cluster.
The power constraint for purchasing from the electricity market is as follows:
where is the maximum power purchase limit.
The energy storage constraints are as follows:
where
and are the maximum discharging and charging powers of the energy storage system;
and are the minimum and maximum state of charge of the ES, respectively; and are the remaining capacity state of the ES at time t and t-1, respectively;
is the self-discharge rate of the ES; and E is the capacity of the ES.
4. VPP Model Based on IGDT
4.1. Introduction to IGDT
Information Gap Decision Theory (IGDT) is used to study the allowable range of variation for uncertain parameters while satisfying preset objectives. It can be used to solve randomness problems when the predicted values of input parameters are known. It includes a robust model and an opportunity model, which correspond to the two different decisions a decision-maker might take when facing risks [21].
When uncertainty exists, decision-makers need to adopt appropriate strategies to handle the resulting impacts. IGDT mainly consists of three parts: the system model, operational requirements, and the uncertainty set model.
4.2. System Model
For a cost optimization problem, the system model is as follows:
where w is the uncertain parameter, d is the decision variable, B(w, d) is the objective function, and H(w, d) and G(w, d) are the equality and inequality constraints, respectively.
4.3. Uncertainty Modeling
In IGDT, the fluctuation range of an uncertain parameter w around its predicted value can be described by the following model [22]:
where represents the fluctuation magnitude of the uncertain parameter, ; indicates that the deviation of the uncertain parameter w from its predicted value does not exceed .
Taking wind and photovoltaic power output as the uncertain parameters, their fluctuation ranges can be expressed according to equation (27) as:
where are the predicted outputs of the wind farm and photovoltaic plant, and are their corresponding fluctuation magnitudes.
When there is more than one uncertain parameter in the model, a weighted sum can be used to convert the fluctuation magnitudes of multiple uncertain parameters into a comprehensive fluctuation range , expressed as:
where represents the fluctuation range of the n-th class of uncertain parameters, and the corresponding is its weight factor.
4.4. Operational Requirements
The IGDT dispatch model is a bi-level optimization model. The lower level ensures that as the uncertain parameters fluctuate within the uncertainty set, the system cost does not exceed the expected cost or seeks a better dispatch cost. In an uncertain environment, the robust model represents the system's ability to withstand the maximum change in uncertain parameters, while the opportunity model represents the return from the minimum change in uncertain parameters. The corresponding mathematical models for these two strategies are as follows [23,24]:
where is the objective function value under the deterministic model; are deviation factors, representing the degree to which the expected cost is higher or lower than ; for a given d, and are functions of the uncertainty parameter w.
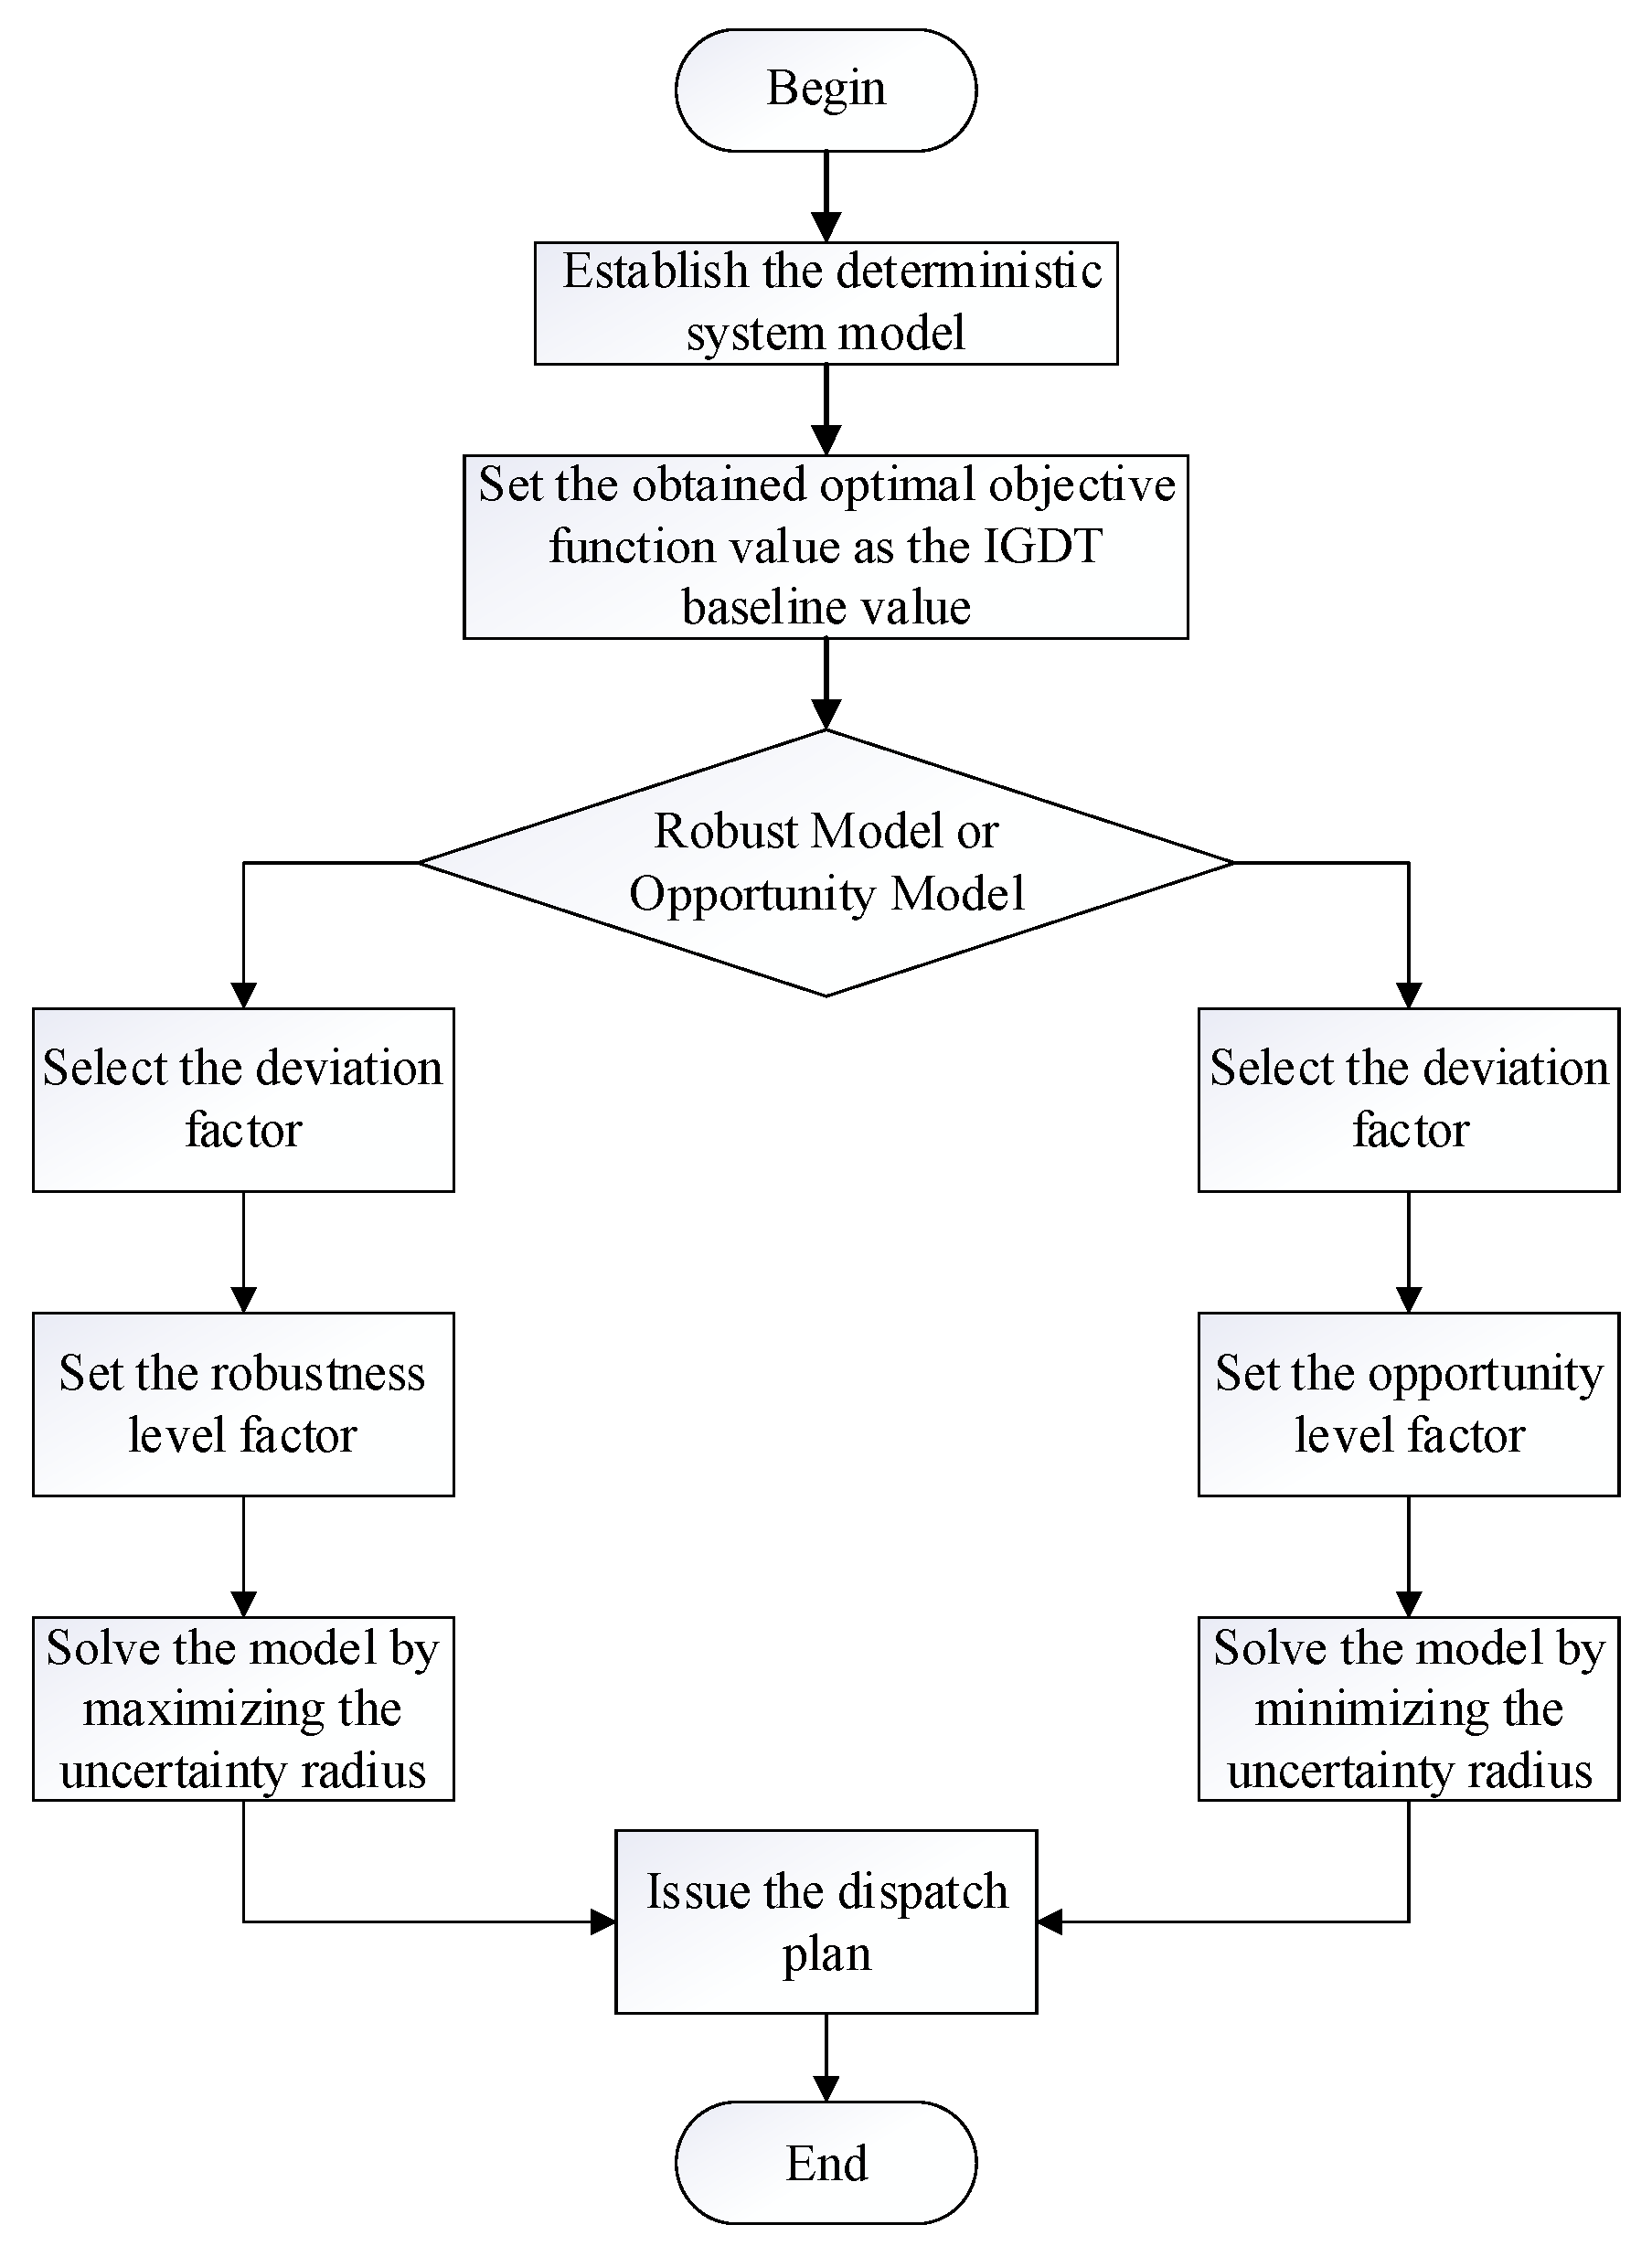
4.5. Algorithm Flow
- Replace the uncertain parameters with their predicted values and solve the original deterministic system model to obtain the objective function value fd.
- The decision-maker sets the subjective deviation factors θr, θo for the robust and opportunity models, respectively, and incorporates them into the system model with uncertainty to obtain the prediction error α and the corresponding dispatch plan.
- Calculate the variation interval of the uncertain parameters under different plans. End.
Figure 4.
IGDT scheduling flowchart.
5. Case Study Analysis
The economic optimal dispatch model of a VPP including EVs based on IGDT is a mixed-integer linear programming problem. The experiments were conducted on a computer with a 64-bit operating system, 8.0 GB of memory, and an Intel(R) Core(TM) i5-1035G1 processor. The software environment was MATLAB R2021a with the Gurobi 11.0.3 solver. Monte Carlo scenario generation used the MATLAB Parallel Computing Toolbox (Parfor). This paper selects the operational data of a typical day from an actual VPP demonstration project in Jiangsu Province. The VPP system consists of a 900 kW wind farm, a 500 kW photovoltaic station, two 440 kW gas turbines, a 400 kW energy storage system, and 50 public charging piles with V2G capability. The load includes residential, general commercial, and industrial loads.
Detailed parameters for WT, PV, GT, and ES are shown in Table 1; the time-of-use electricity prices are in Table 2; EV parameter values and distributions are in Table 3; and the WT, PV output forecasts and load forecast are shown in Figure 5.
5.1. VPP Optimal Dispatch Based on IGDT in an Uncertain Environment
By substituting the system parameters and the wind and load forecast values into the deterministic dispatch model, the global optimal solution is found to be = 11,432.1 yuan. Figure 6 shows the optimal dispatch results corresponding to the optimal compromise solution obtained from the IGDT model. A positive power value indicates energy supply, while a negative value indicates energy consumption. As shown in Figure 7, from 00:00 to 06:00, the electricity price is in the off-peak period. During this time, V2G guides EV users to charge, and the ES enters a charging state. From 06:00 to 08:00, the GT output increases significantly, while EVs and the ES continue to charge during the mid-peak period. During peak hours, the VPP reduces electricity purchases through optimal dispatch, instead using natural gas and the ESS to offset the economic burden of high peak electricity prices. The GT output increases significantly, and the ES discharges to meet load demand. Simultaneously, under the guidance of the time-of-use price strategy and V2G, EVs act as a power source for the system, reducing the peak load and lowering the VPP's operating cost during peak hours.
5.2. Impact of EV Forecasting Model on VPP Dispatch Model
In the model constructed in this paper, the optimization cost is heavily influenced by the costs of purchasing electricity and gas. To analyze the impact of EV integration on the system cost, the purchased power and GT output are compared for different EV user willingness levels. The willingness is set to 0 (no EV users accept VPP control), 0.8 (most users are willing to participate), and 1 (all users follow VPP dispatch), as shown in Figure 7 and Figure 8.
When V2G participates in the system's optimal dispatch, the peak load is significantly reduced. EV charging during peak hours is shifted to off-peak hours, which increases the load during the off-peak period. Since the off-peak electricity price is lower, the system chooses to purchase more power from the main grid to reduce operating costs. Comparative analysis shows that when the user willingness is 0.8, 80% of EV users are willing to participate in control, reducing the 24-hour power purchase by 1898.5 kW and natural gas consumption by 293.9 m³, lowering the system dispatch cost by 906.4 yuan. When the user willingness is 1, meaning all users accept VPP dispatch, the 24-hour power purchase is reduced by 2315.3 kW and natural gas consumption by 376.9 m³, decreasing the system dispatch cost by 1132.9 yuan. The cost comparison for the three scenarios is shown in Table 4.
Figure 9 shows a comparison of EV charging/discharging and the load before and after optimization. Analysis of the bar chart shows that EVs play a positive role on both the supply and user sides. EVs smooth the load curve, reduce the peak-to-valley load difference, and also lower the charging costs for EV owners. During peak hours such as 08:00-11:00, 13:00-15:00, and 18:00, EVs discharge, playing a peak-shaving role on the load curve and reducing the amount of electricity the VPP purchases from the main grid. While meeting the needs of EV owners, V2G gently shifts the load from peak hours to mid-peak and off-peak periods. The EV charging peak load from 13:00-15:00 is distributed to the noon and afternoon of the mid-peak period, and the peak from 18:00-22:00 is moved to the period from 22:00 to the early morning of the next day, achieving the goal of peak shaving and valley filling and effectively improving the system's operational economy and security.
5.3. Impact of Deviation Factor on IGDT Dispatch Results
To analyze the issue of wind and solar output uncertainty within the system, three different uncertainty scenarios were set, as shown in Table 5, where "√" indicates that the model considers the uncertainty factor, and "×" indicates that it does not.
Let the fluctuation magnitude of the uncertain parameter in the IGDT robust dispatch model be , and in the IGDT opportunity dispatch model be . Taking a deviation factor of 0.05 as an example, the pessimistic and optimistic dispatch costs for the system are 12,003.7 yuan and 10,860.4 yuan, respectively. In the model, the fluctuation magnitudes considering wind power uncertainty can be obtained as , , as well as those considering photovoltaic uncertainty 、. The uncertain output range for wind and photovoltaic power is shown in Figure 10.
The value of the deviation factor needs to be chosen based on historical data, risk preference, and strategic goals, so that the decision can both handle uncertainty risks and seize potential opportunities. For this purpose, the deviation factor coefficient was varied from -0.05 to 0.05. The uncertainty radius and system operating cost of the IGDT dispatch model are shown in Figure 11. As seen in the figure, the uncertainty radius continuously increases with the increase of the risk-aversion coefficient, and the system operating cost also increases. This is because in the IGDT robust model, uncertainty pushes the objective expectation in an unfavorable direction. A larger uncertainty radius means less risk from wind power uncertainty, but a higher system operating cost. Conversely, in the IGDT opportunity model, uncertainty moves the objective expectation in a favorable direction. A smaller uncertainty radius means the decision-maker is less optimistic about the benefits from wind power fluctuations, and the dispatch cost increases accordingly. An increase in the uncertainty radius represents an improvement in the system's ability to withstand wind and solar load uncertainty. The dispatch plan in this case can better cope with the long-term uncertainty of wind and load, and the VPP can choose an appropriate aversion coefficient based on the cost it can bear.
5.4. Comparative Analysis of IGDT and Stochastic Optimization
This section compares IGDT with the Monte Carlo and robust optimization methods to verify the differences between the IGDT model proposed in this paper and traditional stochastic optimization methods in handling wind power uncertainty. The Monte Carlo method was used to generate 1000 scenarios, where wind power output follows a Beta distribution with shape parameters α=2.5, β=3.0, and a forecast reference value of 1000 kW; photovoltaic output follows a Beta distribution with shape parameters α=3.0, β=2.8, and a forecast reference value of 360 kW. The K-means clustering method was then used to cluster these into 3 typical scenarios [25,26]. The clustering results for photovoltaic and wind power are shown in Figure 12 and Figure 13.
Robust optimization aims to minimize the total operating cost in the worst-case scenario. The values for the relevant uncertain parameters are shown in the table below:

Table 6.
Robust optimization parameters.
| Parameter | Value | Model |
|---|---|---|
| Wind power fluctuation range | ±25% of predicted value | |
| Photovoltaic fluctuation range | ±25% of predicted value | |
| Load fluctuation range | ±15% of predicted value |
To verify the model's practicality, the performance of IGDT, Monte Carlo, and robust optimization was compared based on actual operational data from a typical day of a VPP demonstration project in Jiangsu Province, China, as shown in Table 7.
The performance of the method proposed in this paper was compared with other stochastic optimization methods in terms of total cost, uncertainty radius, and computation time. The comparison results between IGDT and stochastic optimization are shown in Table 8.
As can be seen from Table 8, although the Monte Carlo method has better uncertainty handling than robust optimization, its scenario computation time increases exponentially, resulting in a long optimization time. Robust optimization has the strongest ability to withstand wind and solar load uncertainty, but its cost is also the highest, trading economy for system stability. Compared to other stochastic optimization methods, IGDT has better economic benefits and computational speed, but its tolerance for uncertainty prediction deviation is lower, requiring the system to have stronger uncertainty management capabilities.
6. Conclusion
This paper, based on the operational characteristics of a multi-source VPP and the V2G characteristics of electric vehicles, considered source-load uncertainty and established a multi-objective IGDT optimal dispatch model for a VPP under V2G mode, with system operating cost as the optimization target. This provides theoretical support for the real-time dispatch of VPPs in a highly uncertain environment. Its bi-directional decision-making mechanism and efficient computation can be extended to regional integrated energy systems and electricity market trading scenarios. By coordinating multi-energy complementarity and load-side flexibility, it helps to enhance the security and economy of the power grid. The case study simulation leads to the following conclusions:
- Based on time-of-use electricity prices, using V2G to shift the charging and discharging cycles of electric vehicles can achieve "peak shaving and valley filling" of the load curve by incorporating demand-side adjustable resources into the power balance. This alleviates the pressure on power supply and improves supply reliability.
- The VPP optimal dispatch model including V2G can fully leverage the flexibility of electric vehicles on both the supply and load sides. It has strong dispatchability, smoothing the load curve while reducing the electricity costs for EV owners, thereby lowering the system's operating cost.
- The uncertainty-based optimal dispatch model using IGDT quantifies uncertainty from the perspectives of risk aversion and opportunity seeking, providing decision-makers with a bi-directional dispatch model. By setting weight coefficients, the impact of wind and photovoltaic power output uncertainty on dispatch operations is quantified, offering a reference for the optimal dispatch of multi-source photovoltaic power stations.
Author Contributions
Conceptualization, L.G. and W.Y.; methodology, L.G.; validation, L.G. and W.Y.; formal analysis, L.G.; investigation, W.Y.; resources, W.Y.; data curation, W.Y.; writing, W.Y. All authors have read and agreed to the published version of the manuscript.
Funding
This work was supported by the Science and Technology Project of State Grid Jiangsu Electric Power Co., Ltd. (J2023125).
Data Availability Statement
Data used in this paper is unavailable due to privacy or ethical restrictions.
Conflicts of Interest
The authors declare no conflicts of interest.
Abbreviations
The following abbreviations are used in this manuscript:
| VPP | Virtual Power Plant |
| V2G | Vehicle-to-Grid |
| IGDT | Information Gap Decision Theory |
| EV | Electric Vehicle |
| WT | Wind Turbines |
| PV | Photovoltaics |
| GT | Gas Turbines |
| ES | Energy Storage systems |
| TOU | Time-of-Use |
References
- Fusco, A.; Gioffrè, D.; Castelli, A.F.; et al. A multi-stage stochastic programming model for the unit commitment of conventional and virtual power plants bidding in the day-ahead and ancillary services markets. Appl. Energy 2023, 336. [Google Scholar] [CrossRef]
- Li, P.; Zhang, F.; Ma, X.; et al. Cost optimization method of regional integrated energy system in electricity market environment considering uncertainty. J. Mod. Power Syst. Clean Energy 2023, 11, 368–380. [Google Scholar] [CrossRef]
- Sun, J.; Wang, Y.; Guo, X.; et al. Fundamental optimal operation of virtual power plant considering environmental externality and output uncertainty of wind and photovoltaic power. Autom. Electr. Power Syst. 2022, 46, 50–59. [Google Scholar]
- Zhou, Z.; Sun, C.; Shi, R.; et al. Robust energy scheduling in vehicle-to-grid networks. IEEE Netw. 2017, 31, 30–37. [Google Scholar] [CrossRef]
- Xu, K.; Guo, C.; Bao, M.; et al. Bidding strategy for combined heat and power virtual power plant in electricity market considering multiple uncertainties. Power Syst. Technol. 2022, 46, 3354–3365. [Google Scholar]
- Chen, H.; Zhang, H.; Wang, Z. A review of market and scheduling characteristic parameter aggregation algorithm of different types of virtual power plants. Proc. CSEE 2023, 43, 15–28. [Google Scholar]
- Zhu, Y.; Sun, X.; Xie, X.; et al. Multi-objective cooperative optimal scheduling of electric vehicles considering travel chain reconstruction in multi-state scenarios. Autom. Electr. Power Syst. 2024, 48, 129–141. [Google Scholar]
- Lu, Y.; Ma, Y.; Ma, Z.; et al. Interval optimization scheduling of virtual power plant with electric vehicles based on master-slave game. Electr. Eng. 2024, 21, 20–26. [Google Scholar]
- Pan, Z.; Sun, L. Economic optimal dispatch analysis of virtual power plant with electric vehicles. J. Shanghai Dianji Univ. 2024, 27, 131–136. [Google Scholar]
- Wang, R.; Wu, J.; Cai, Z.; et al. Optimal scheduling of virtual power plant with electric vehicles in multi-coordination market. South. Power Syst. Technol. 2021, 15, 45–55. [Google Scholar]
- Li, X.; Qin, W.; Jing, X.; et al. Joint optimization strategy of virtual power plant participation in main and auxiliary markets considering uncertain risks and multi-agent collaboration. Power Syst. Technol., 1–16.
- Chen, Y.; Chen, C.; Zhang, S.; et al. Optimization scheduling strategy of small hydropower enrichment virtual power plant considering spatiotemporal coupling. Autom. Electr. Power Syst. 2022, 46, 90–98. [Google Scholar]
- Wang, Y.; Chen, H.; Huang, Y.; et al. Robust optimal scheduling strategy for virtual power plant participating in electricity energy and demand response markets under multiple uncertainties. Power Gener. Technol. 2024, 45, 1173–1185. [Google Scholar]
- Sun, H.; Fan, X.; Hu, S.; et al. Virtual power plants participate in the internal and external coordinated bidding strategy of the day-ahead power market. Power Syst. Technol. 2022, 46, 1248–1262. [Google Scholar]
- Ge, X.; Hu, W.; Fu, Y.; et al. Electric vehicle optimal scheduling strategy based on 3D Sigmoid cloud model of user response willingness. Proc. CSEE 2024, 44, 8874–8884. [Google Scholar]
- Sun, J.; Wang, Y.; Guo, X.; et al. Virtual power plant operation optimization considering environmental externalities and wind-solar output uncertainty. Autom. Electr. Power Syst. 2022, 46, 50–59. [Google Scholar]
- Tan, H.; Li, Z.; Wang, Q.; et al. A novel forecast scenario-based robust energy management method for integrated rural energy systems with greenhouses. Appl. Energy 2023, 330, 120343. [Google Scholar] [CrossRef]
- Tu, Q.; Miao, S.; Yang, Z.; et al. A collaborative scheduling strategy for power transmission and distribution network considering peak-charge allocation mechanism and key Scenarios of wind power. Proc. CSEE 2023, 1–14. [Google Scholar]
- Zhang, Y.; Ai, Q.; Hao, R.; et al. Economic dispatching of building integrated Energy system based on chance constrained programming. Power Syst. Technol. 2019, 43, 108–116. [Google Scholar] [CrossRef]
- Ge, L.; Wang, Q.; Wang, M.; et al. Electric vehicle aggregators considering charge and discharge incentive mechanism participate in multi-stage operation strategy of energy-FM market. Power Autom. Equip., 1–9.
- Jordehi, A.R. How to deal with uncertainties in electric power systems? a review. Renew. Sustain. Energy Rev. 2018, 96, 145–155. [Google Scholar] [CrossRef]
- Soroudi, A.; Rabiee, A.; Keane, A. Information gap decision theory approach to deal with wind power uncertainty in unit commitment. Electr. Power Syst. Res. 2017, 145, 137–148. [Google Scholar] [CrossRef]
- Lu, C.; Sun, W.; Liang, R.; et al. Robust scheduling of integrated energy system in coal mine containing Power-to-Gas based on information gap decision theory. High Volt. Eng. 2023, 49, 4203–4212. [Google Scholar]
- Wang, C.; Wei, H.; Wu, S. Multi-source Joint Optimization of Unit Commitment Based on Information Gap Decision Theory. Proc. CSEE 2018, 38, 3431–3442. [Google Scholar]
- Yuan, T.; Cao, J. Capacity optimization of wind hydrogen low-carbon energy system with wind power-load uncertainty. High Volt. Eng. 2022, 48, 2037–2044. [Google Scholar]
- Shi, W.; Lü, L.; Gao, H.; et al. Economic dispatch of active distribution network with participation of demand response and electric vehicle. Autom. Electr. Power Syst. 2020, 44, 41–51. [Google Scholar]
Figure 1.
Daily charging data of charging station.
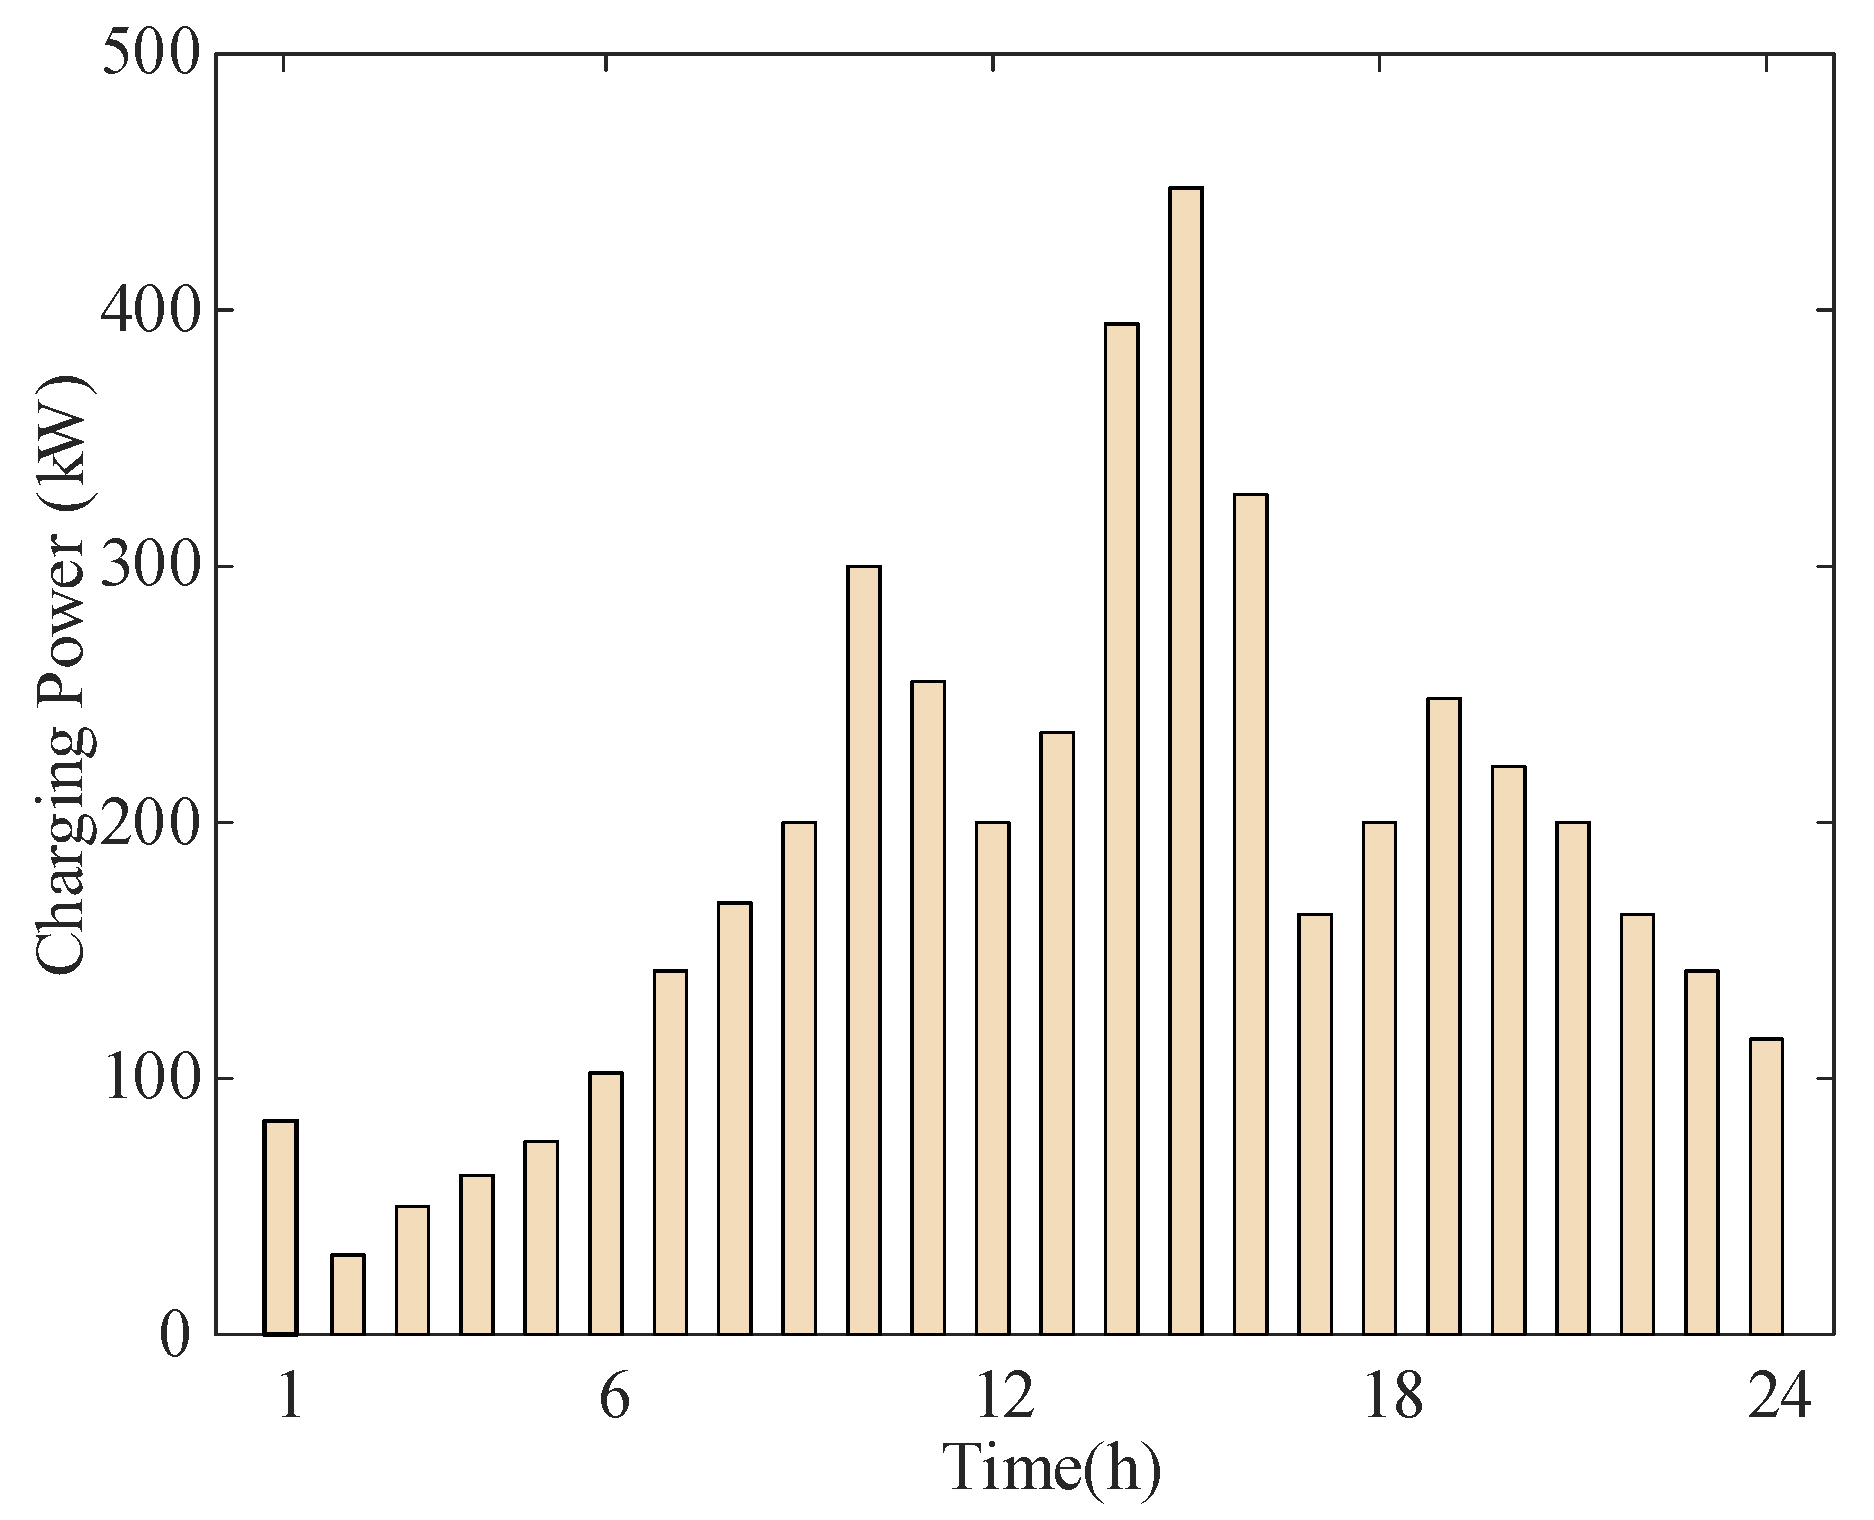
Figure 2.
Willingness-Incentive price curve.
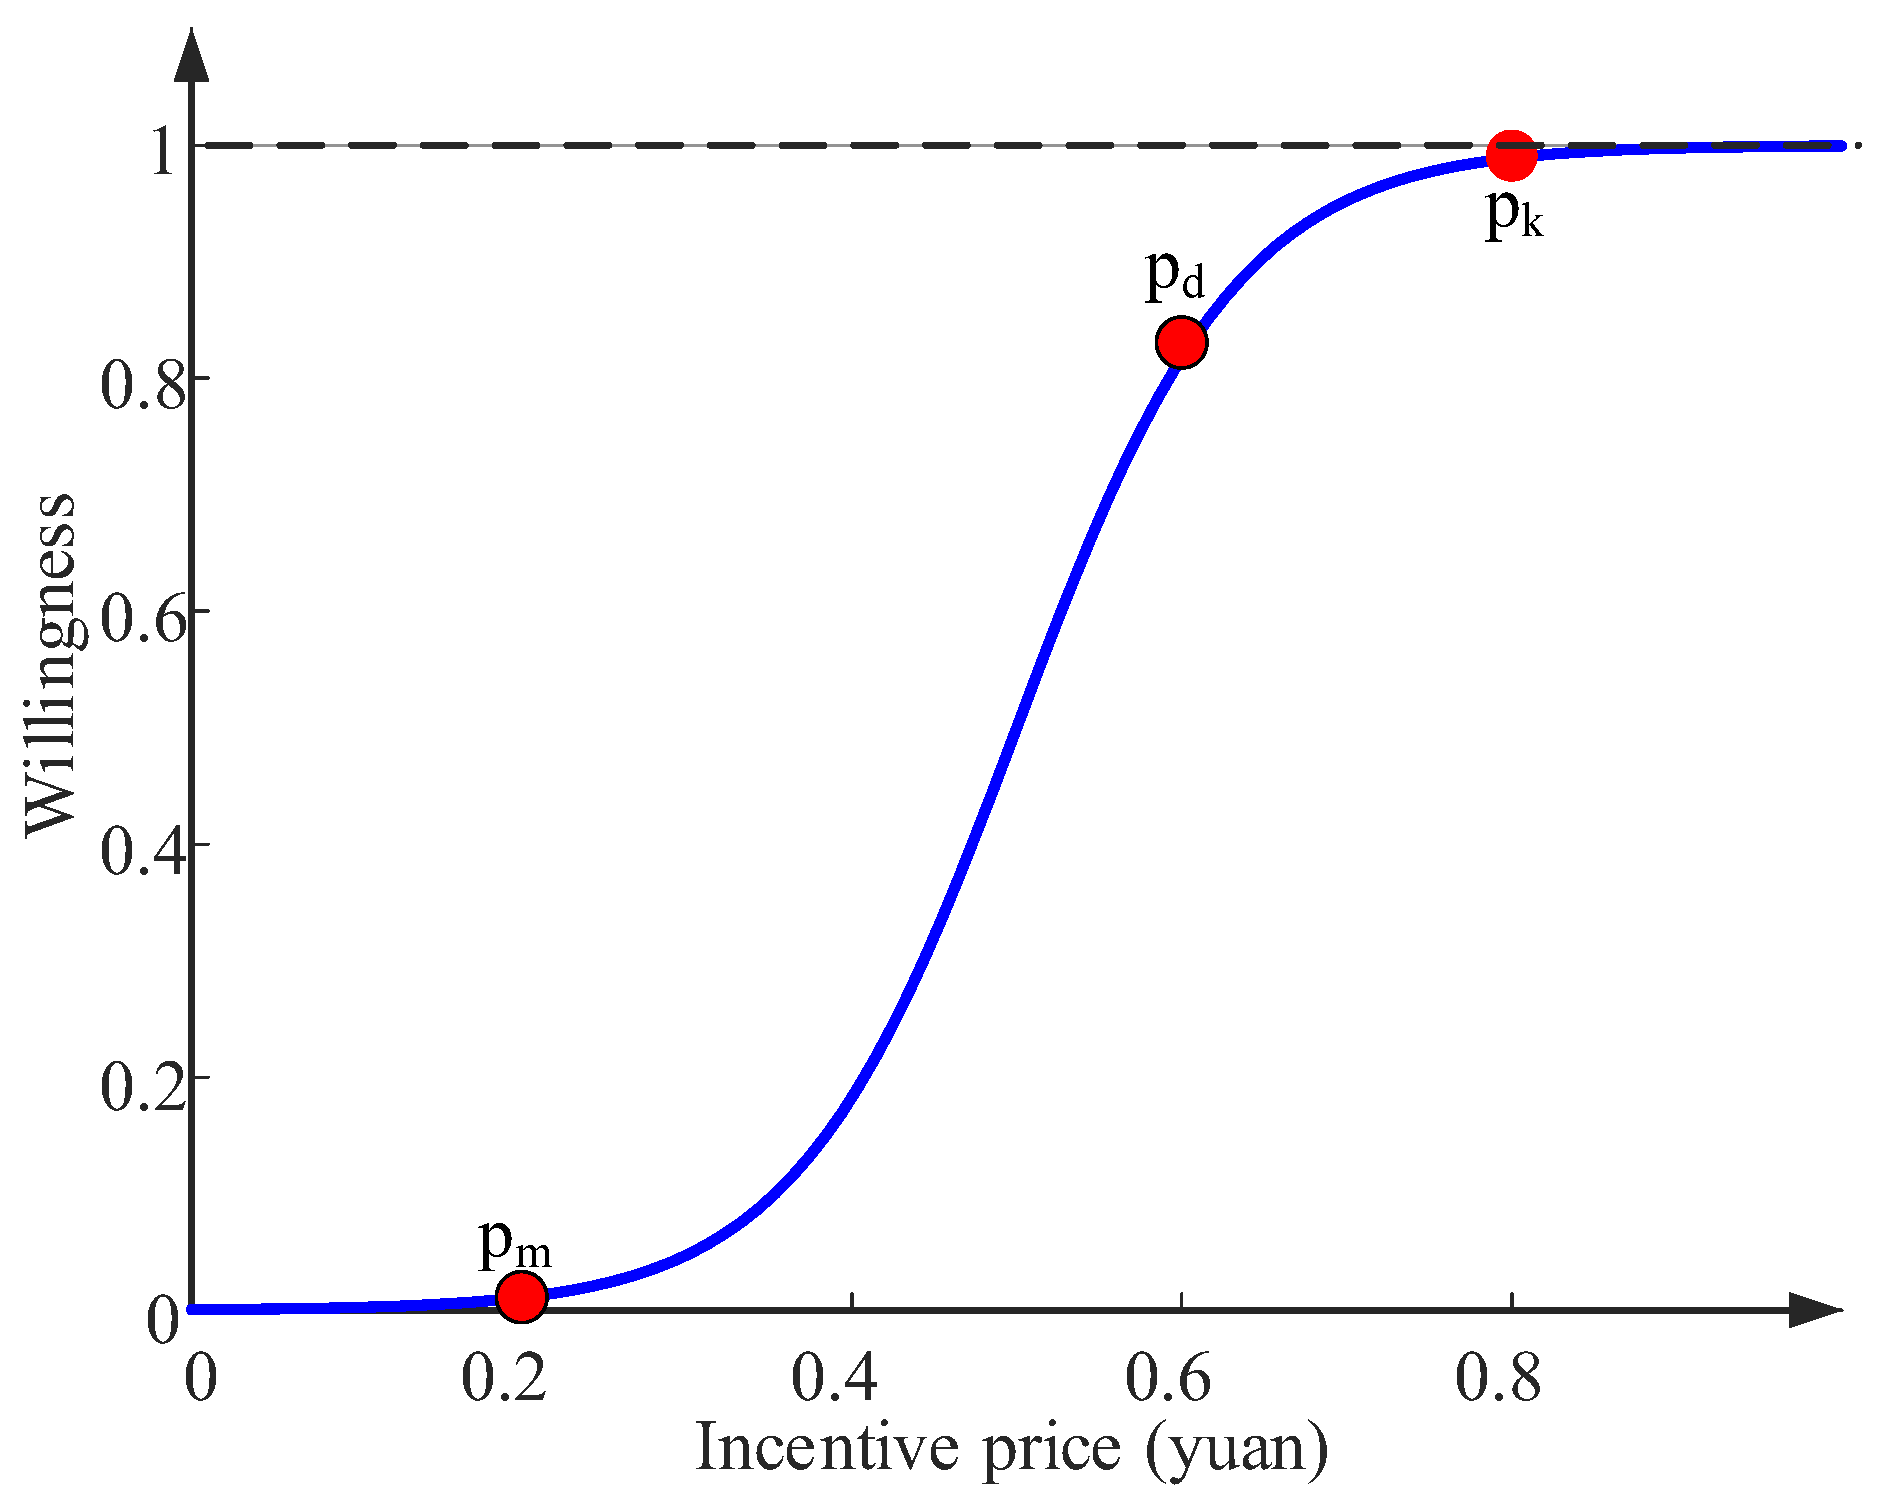
Figure 3.
VPP framework.
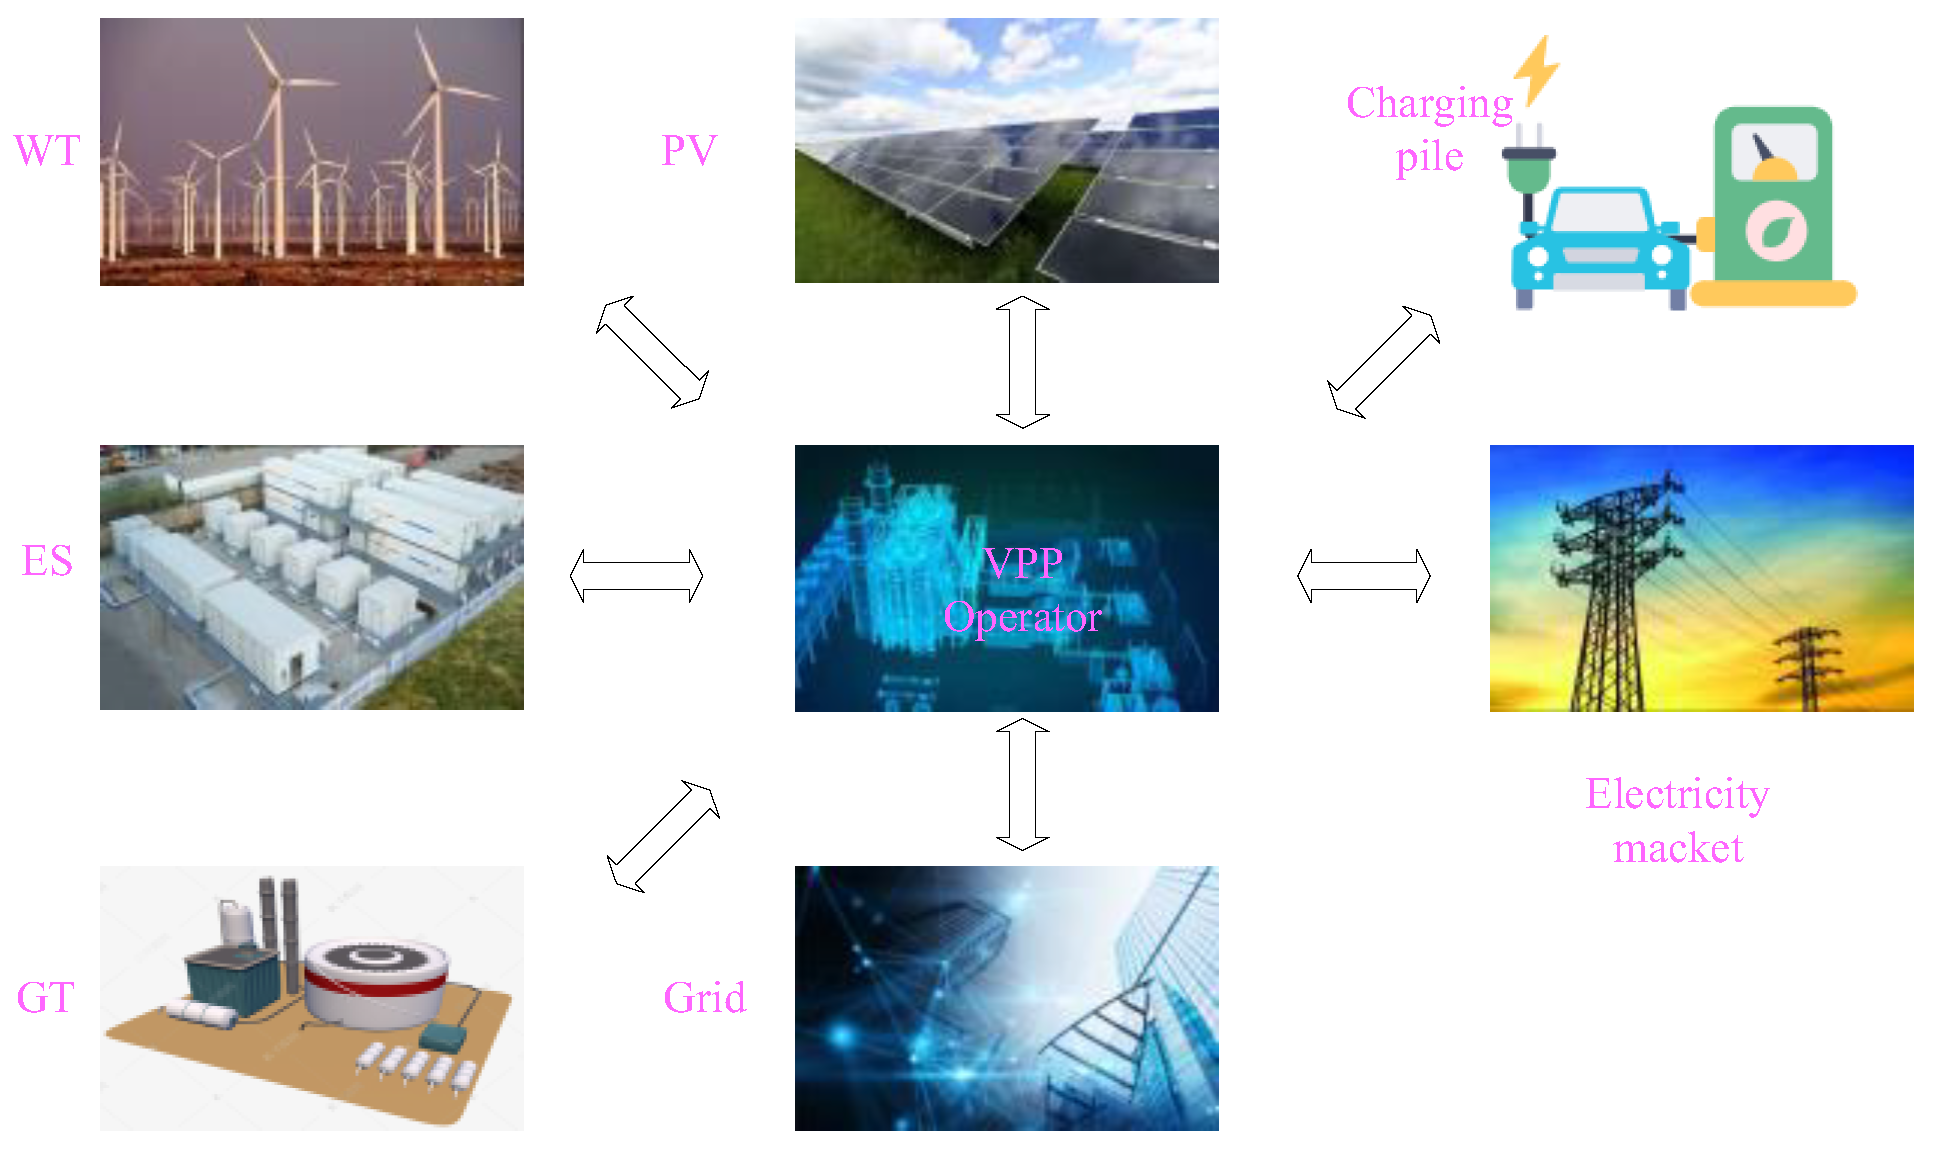
Figure 5.
Load, photovoltaic and wind power forecast.
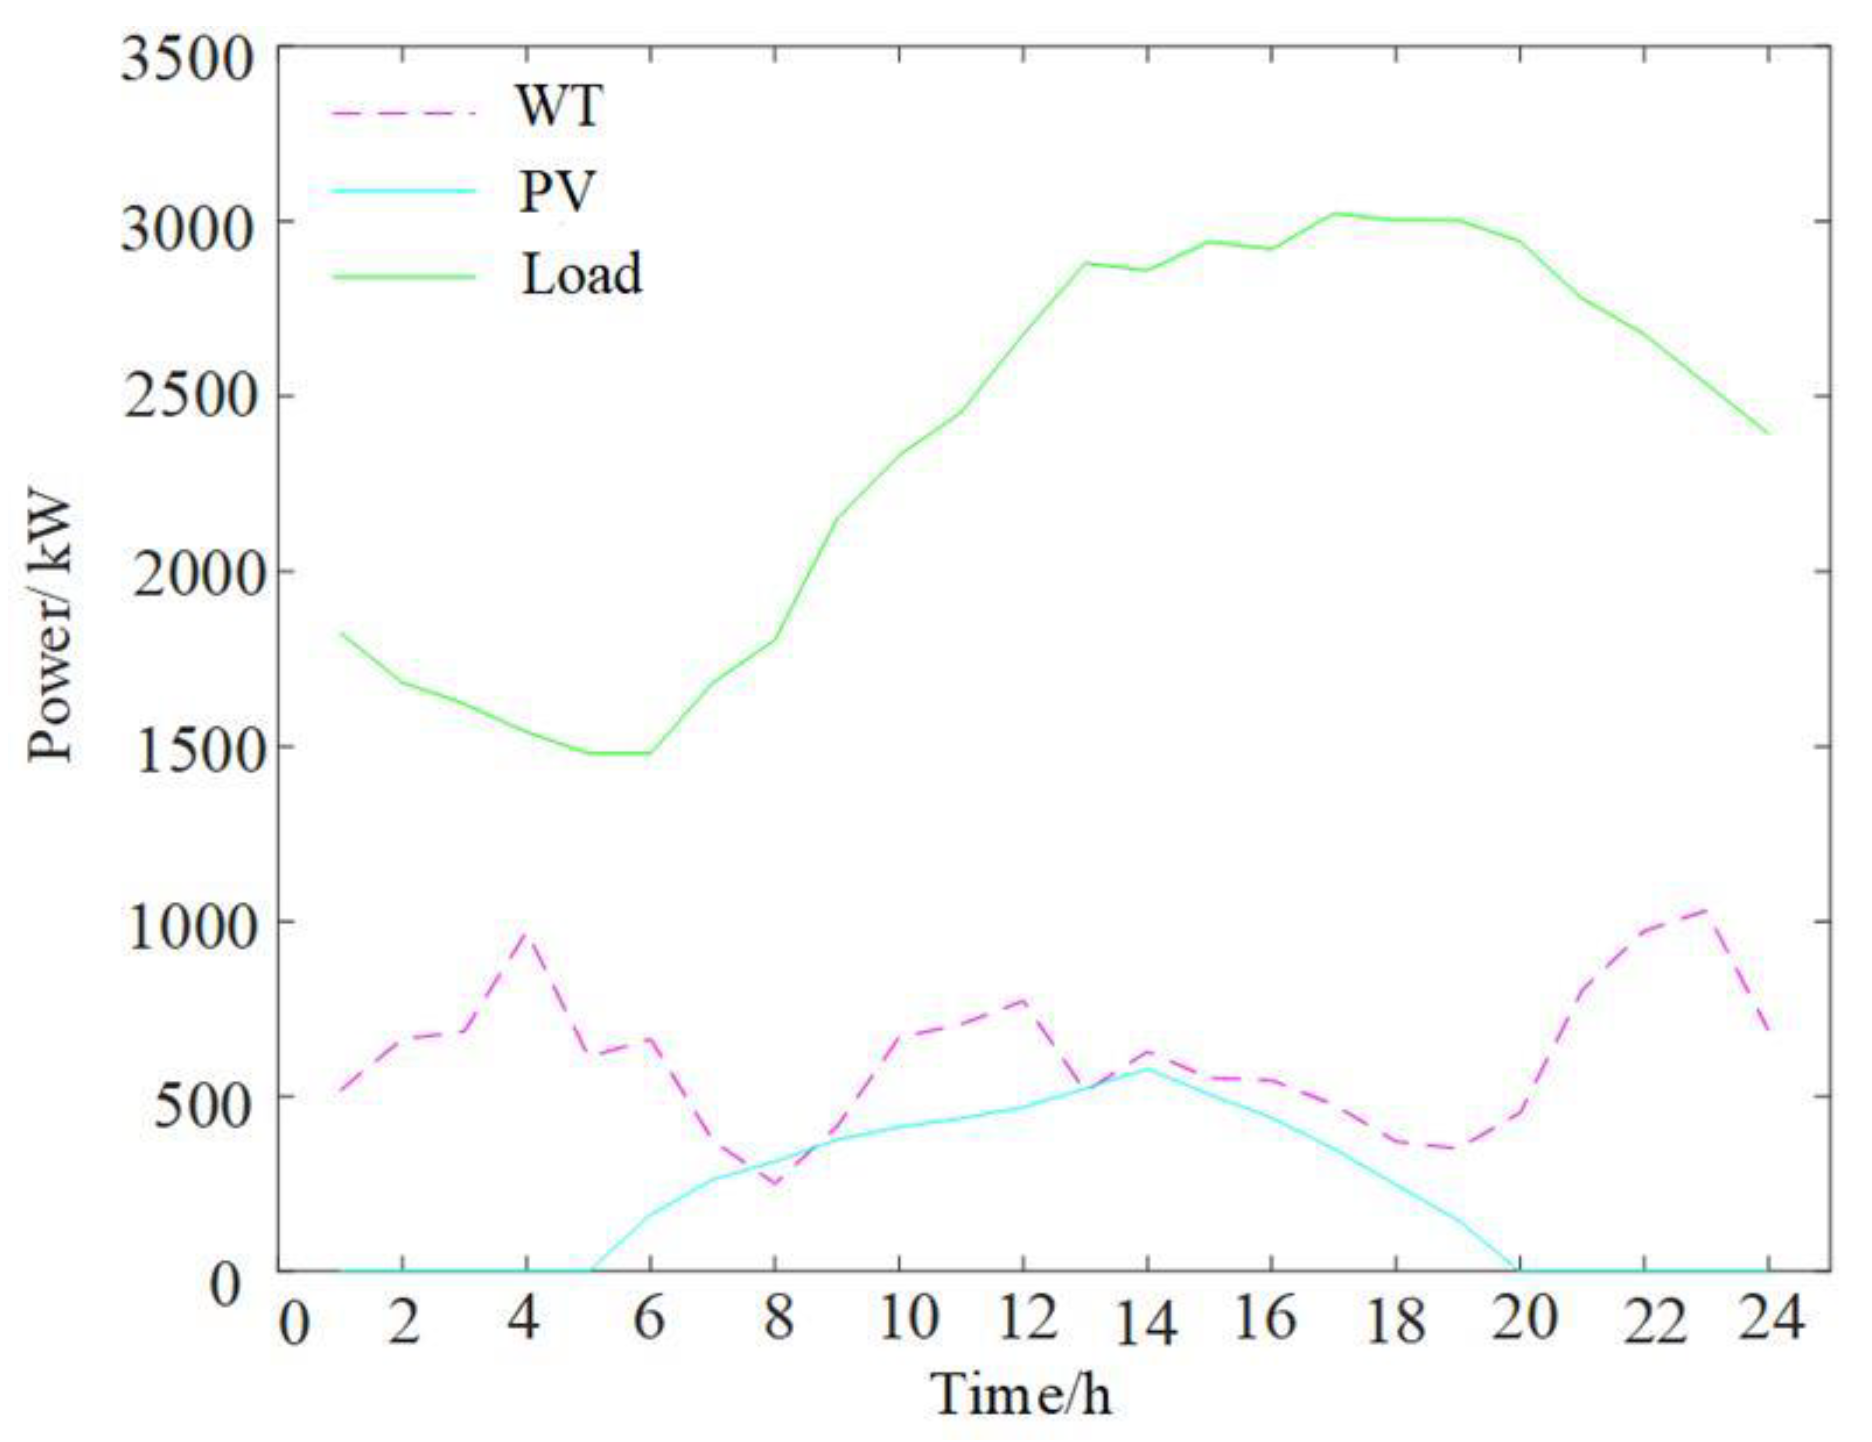
Figure 6.
Optimal scheduling results based on IGDT model.
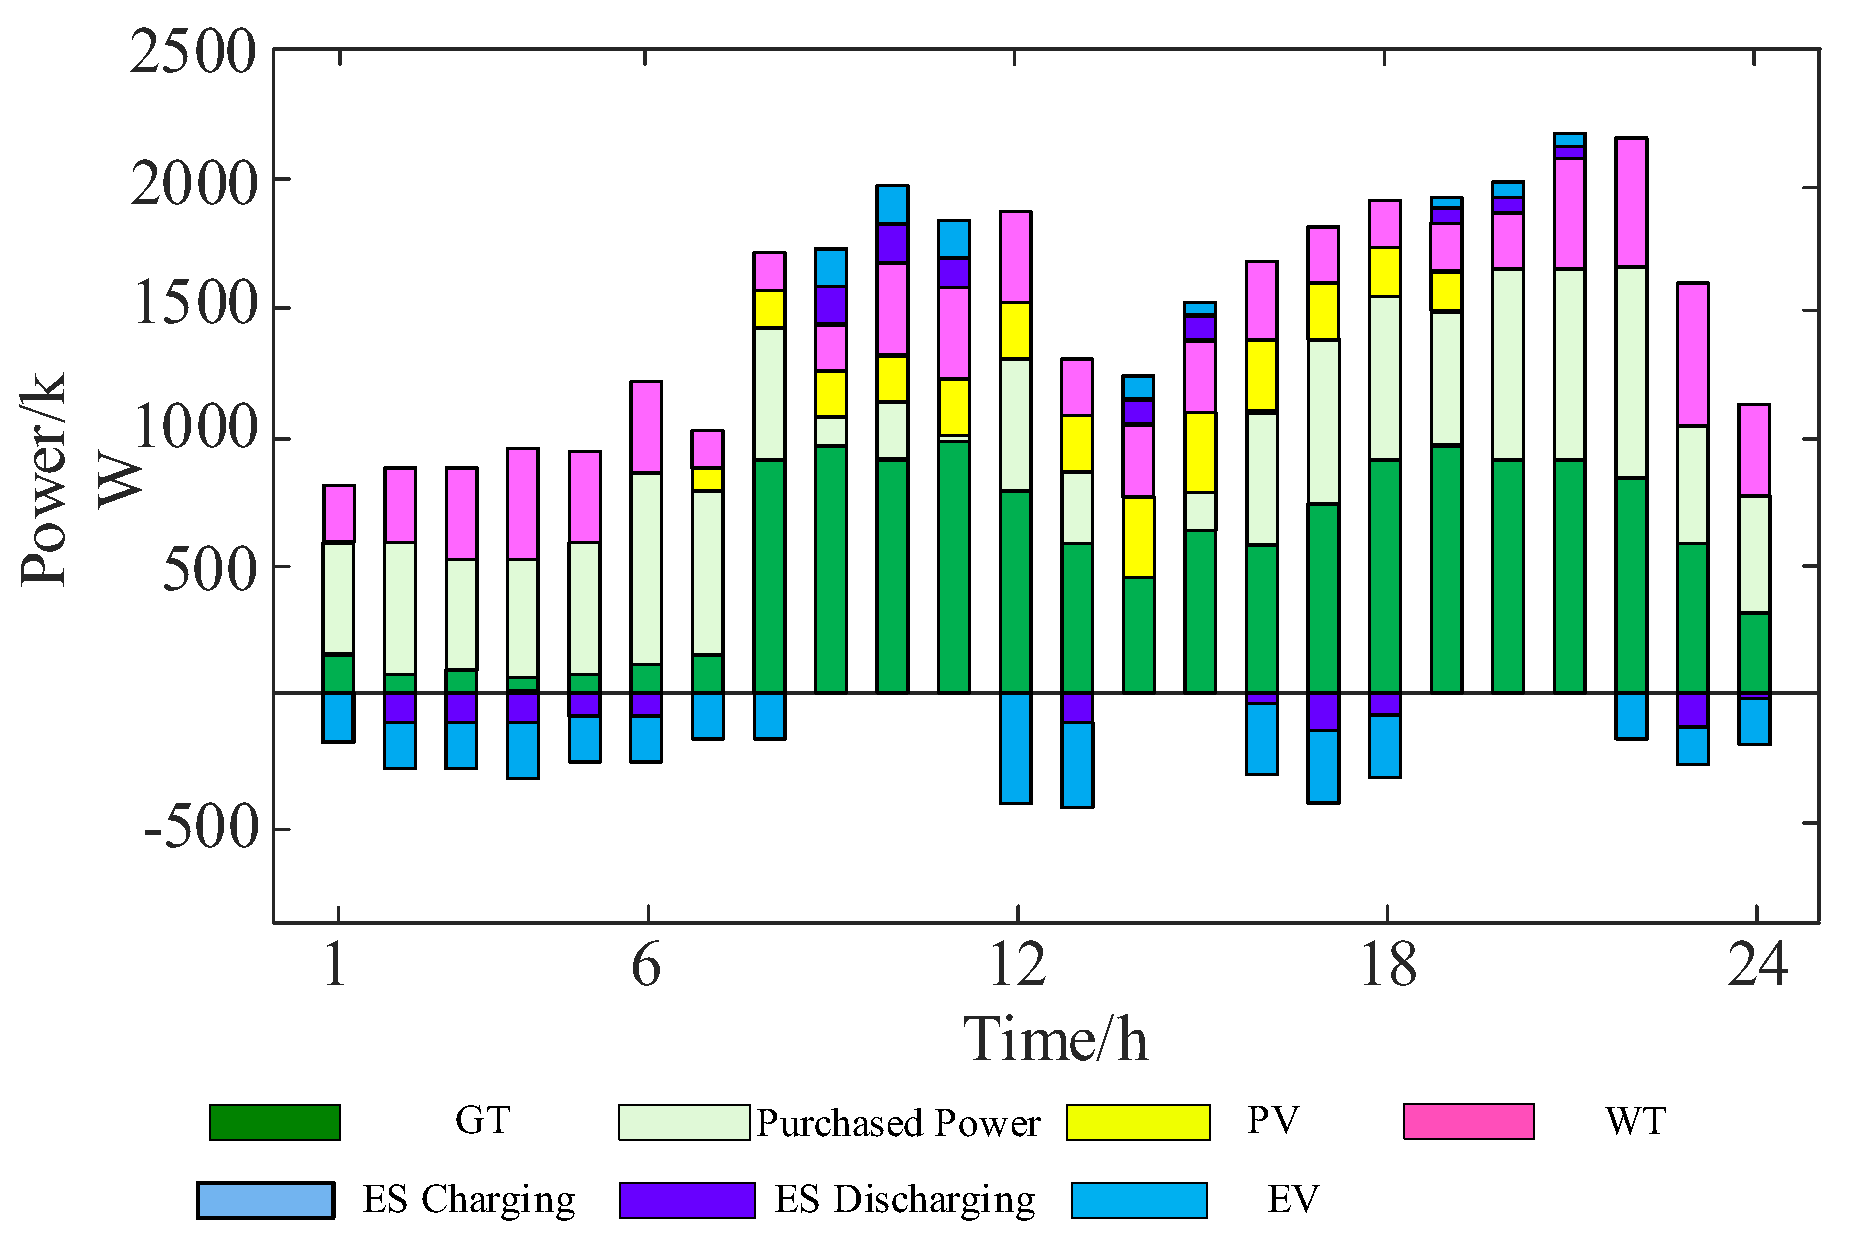
Figure 7.
Comparison of GT output and power purchase.
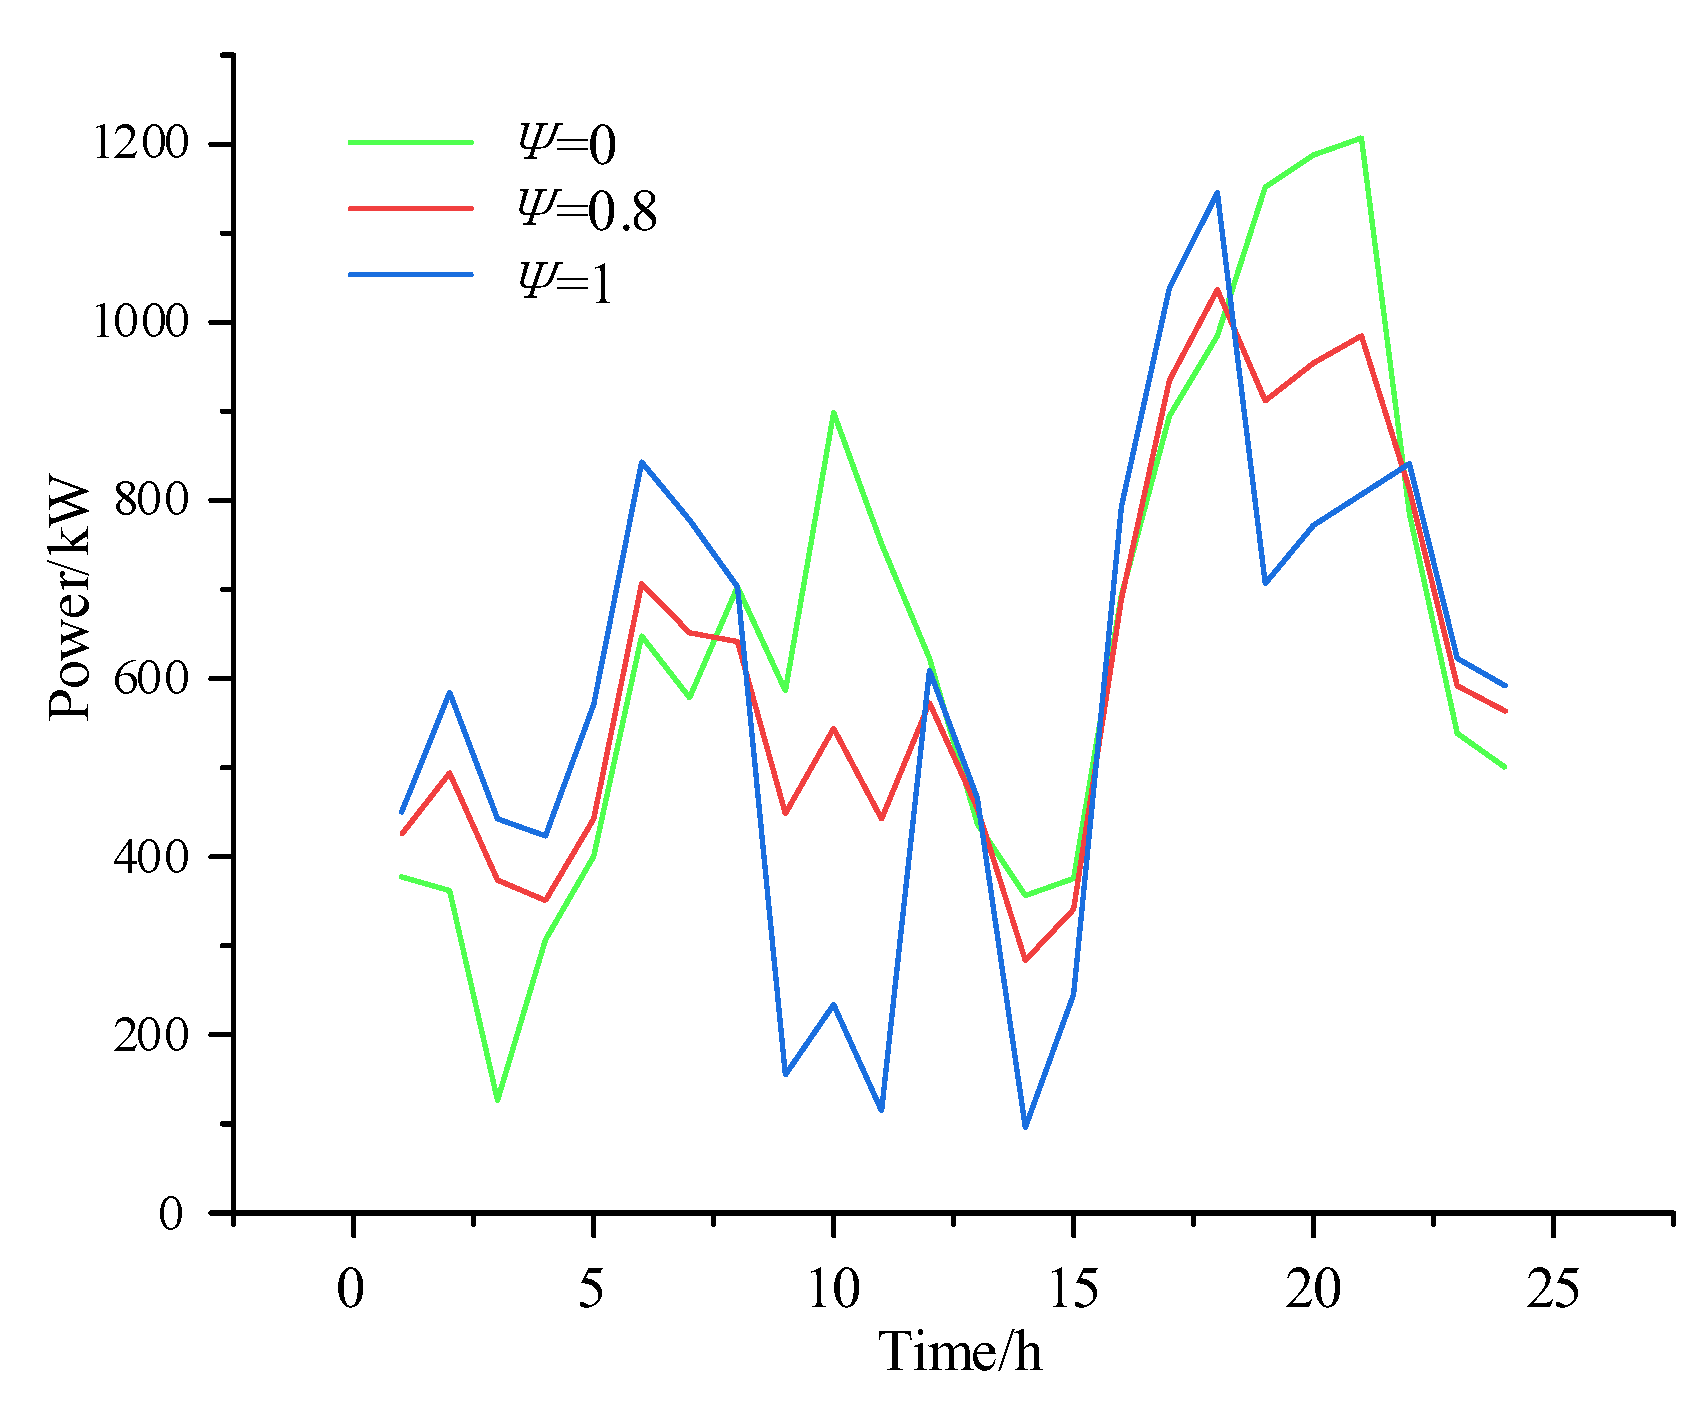
Figure 8.
Comparison of GT output.
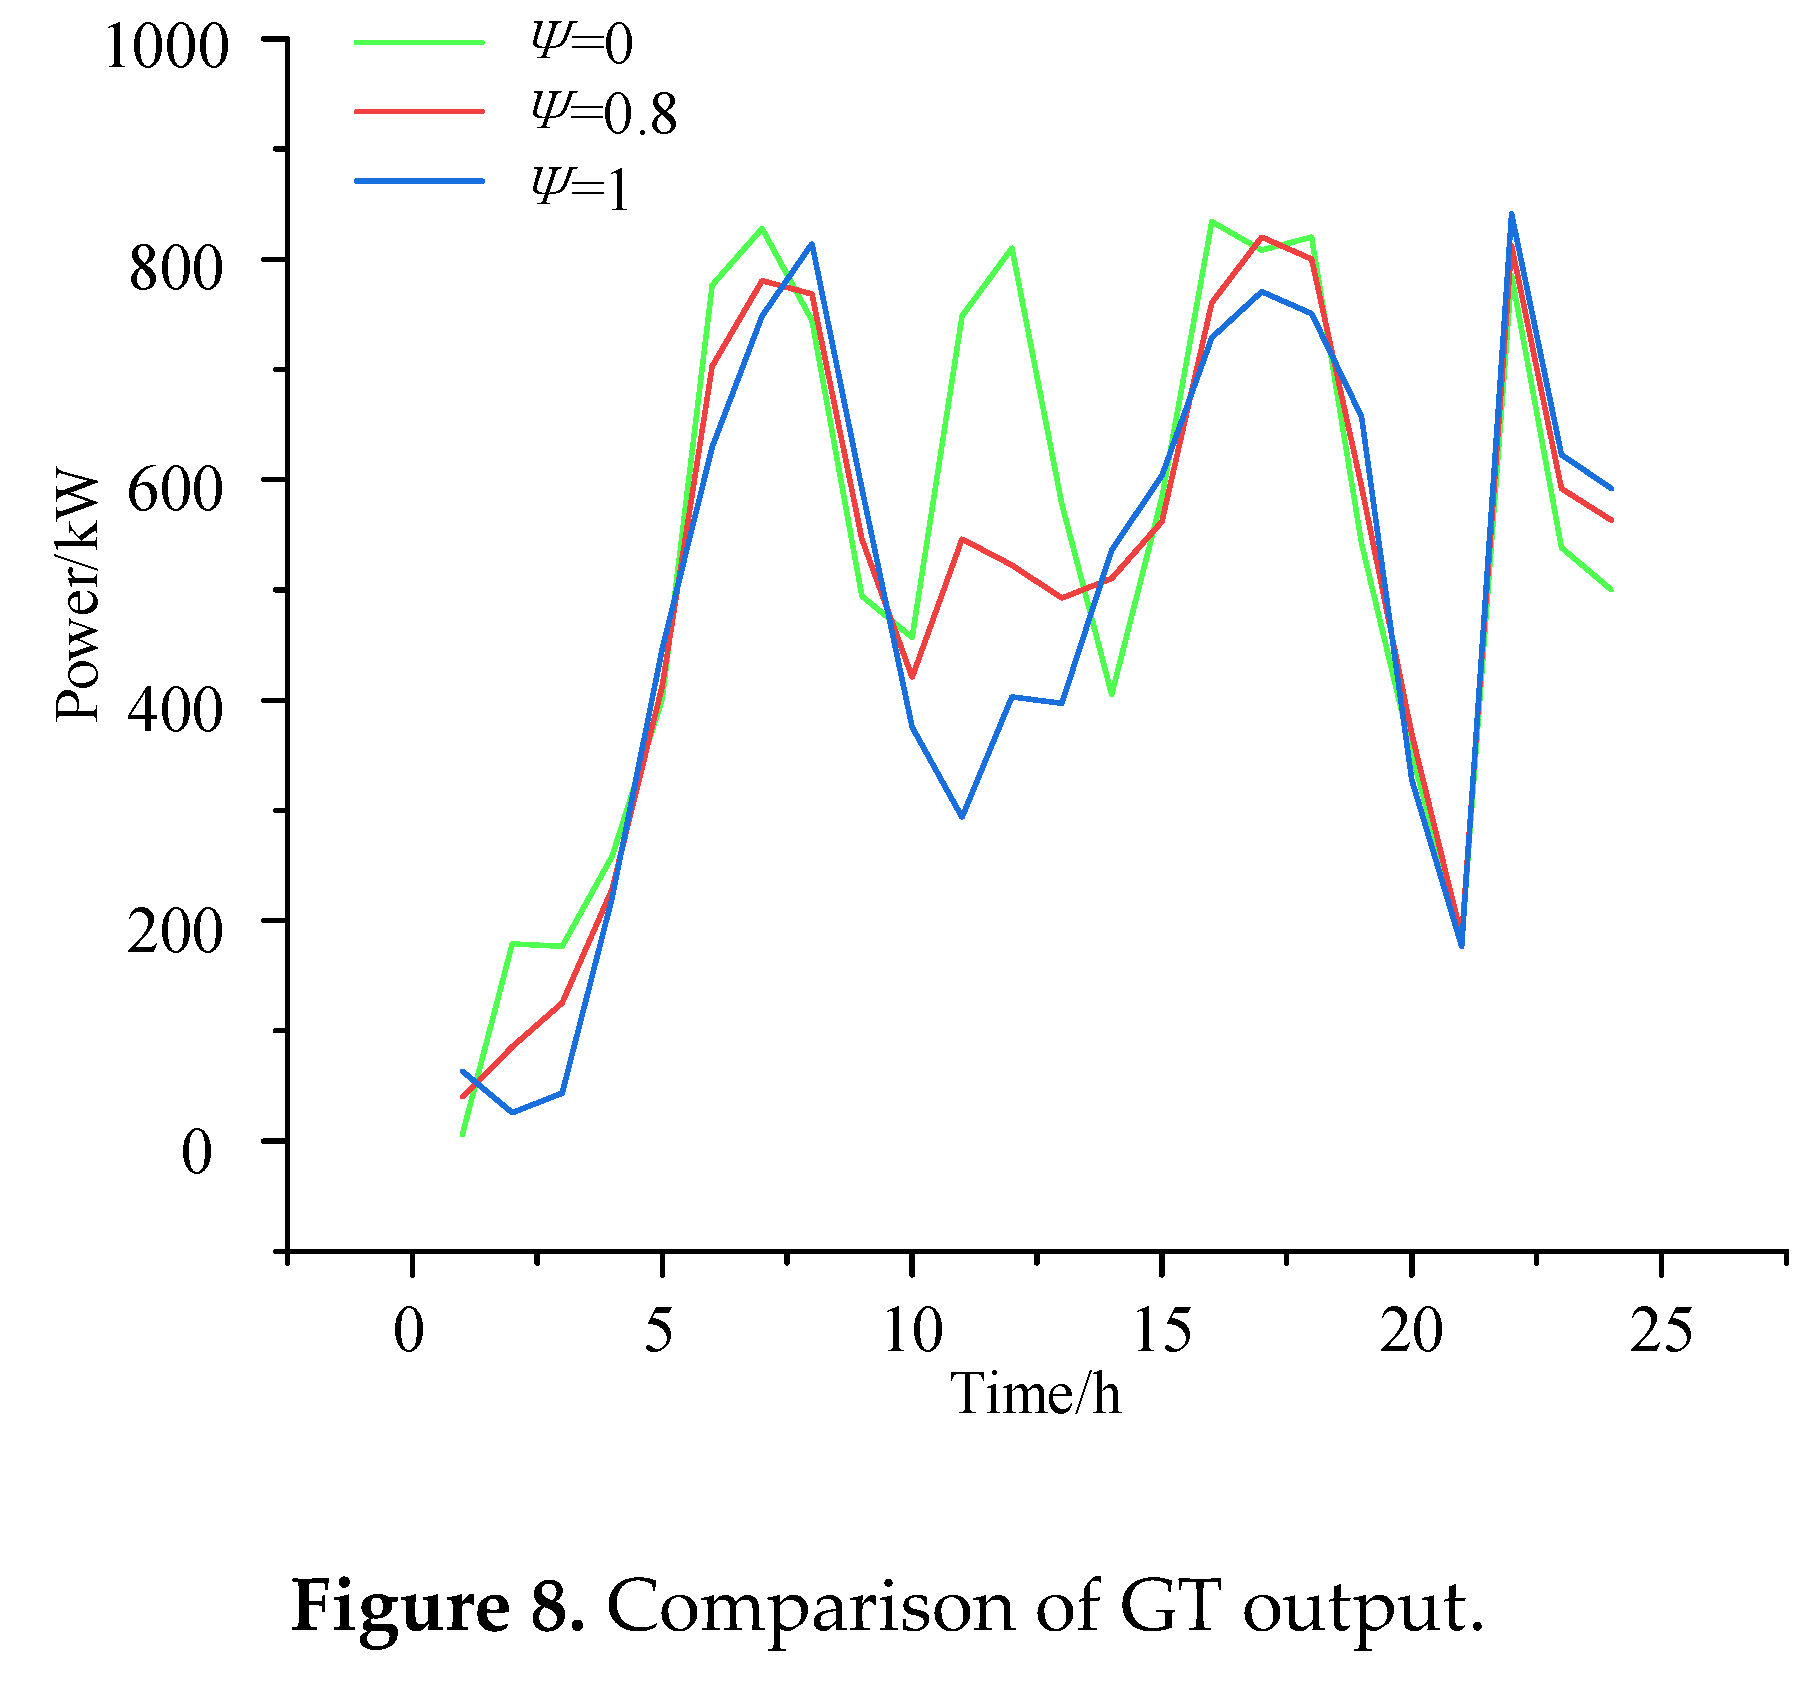
Figure 9.
Comparison of load curves before and after dispatch.
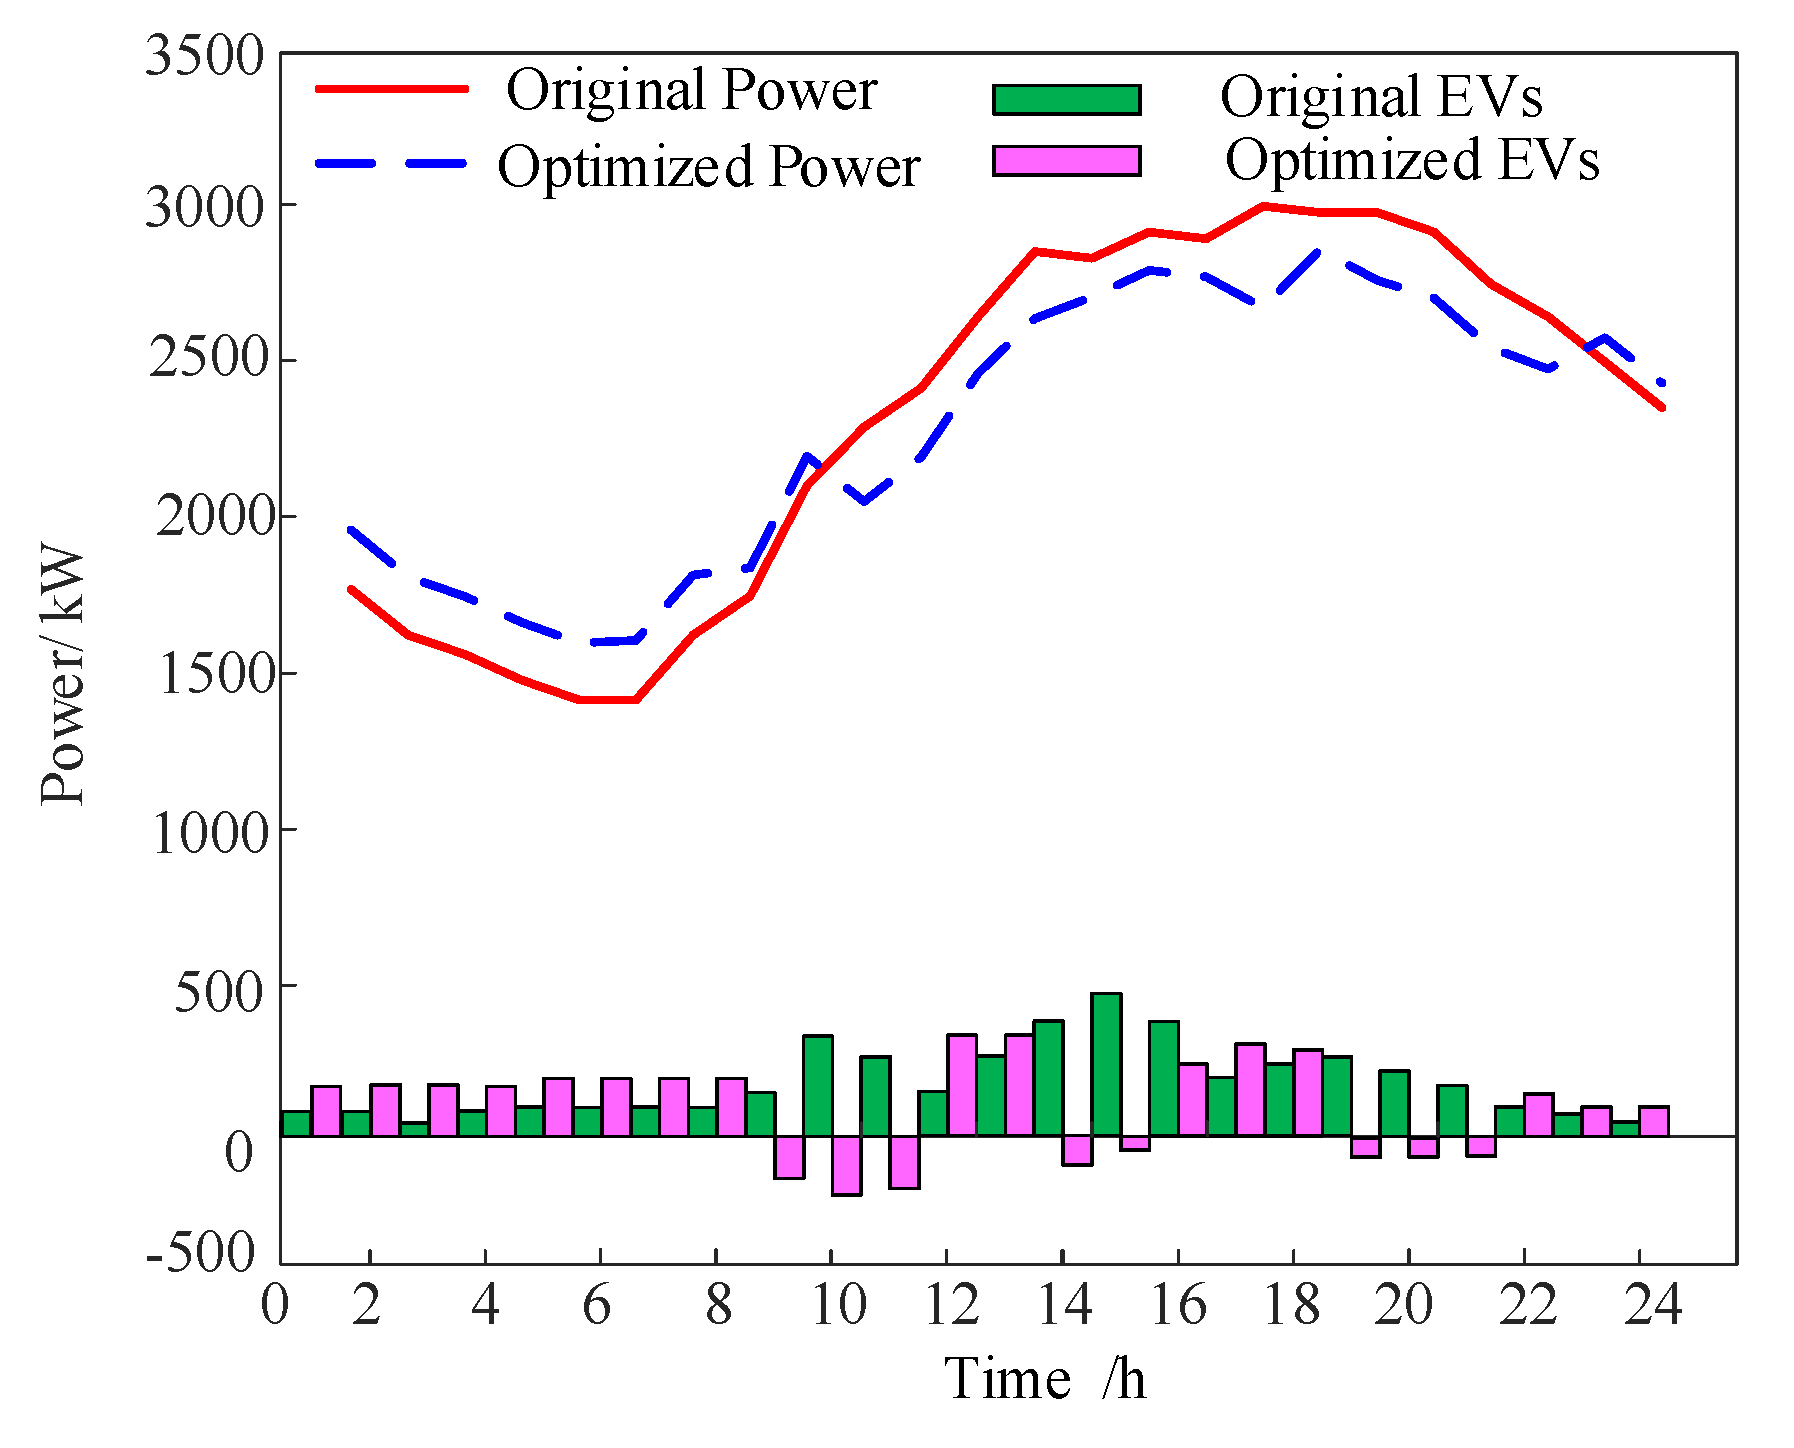
Figure 10.
Wind power and PV uncertain output range.
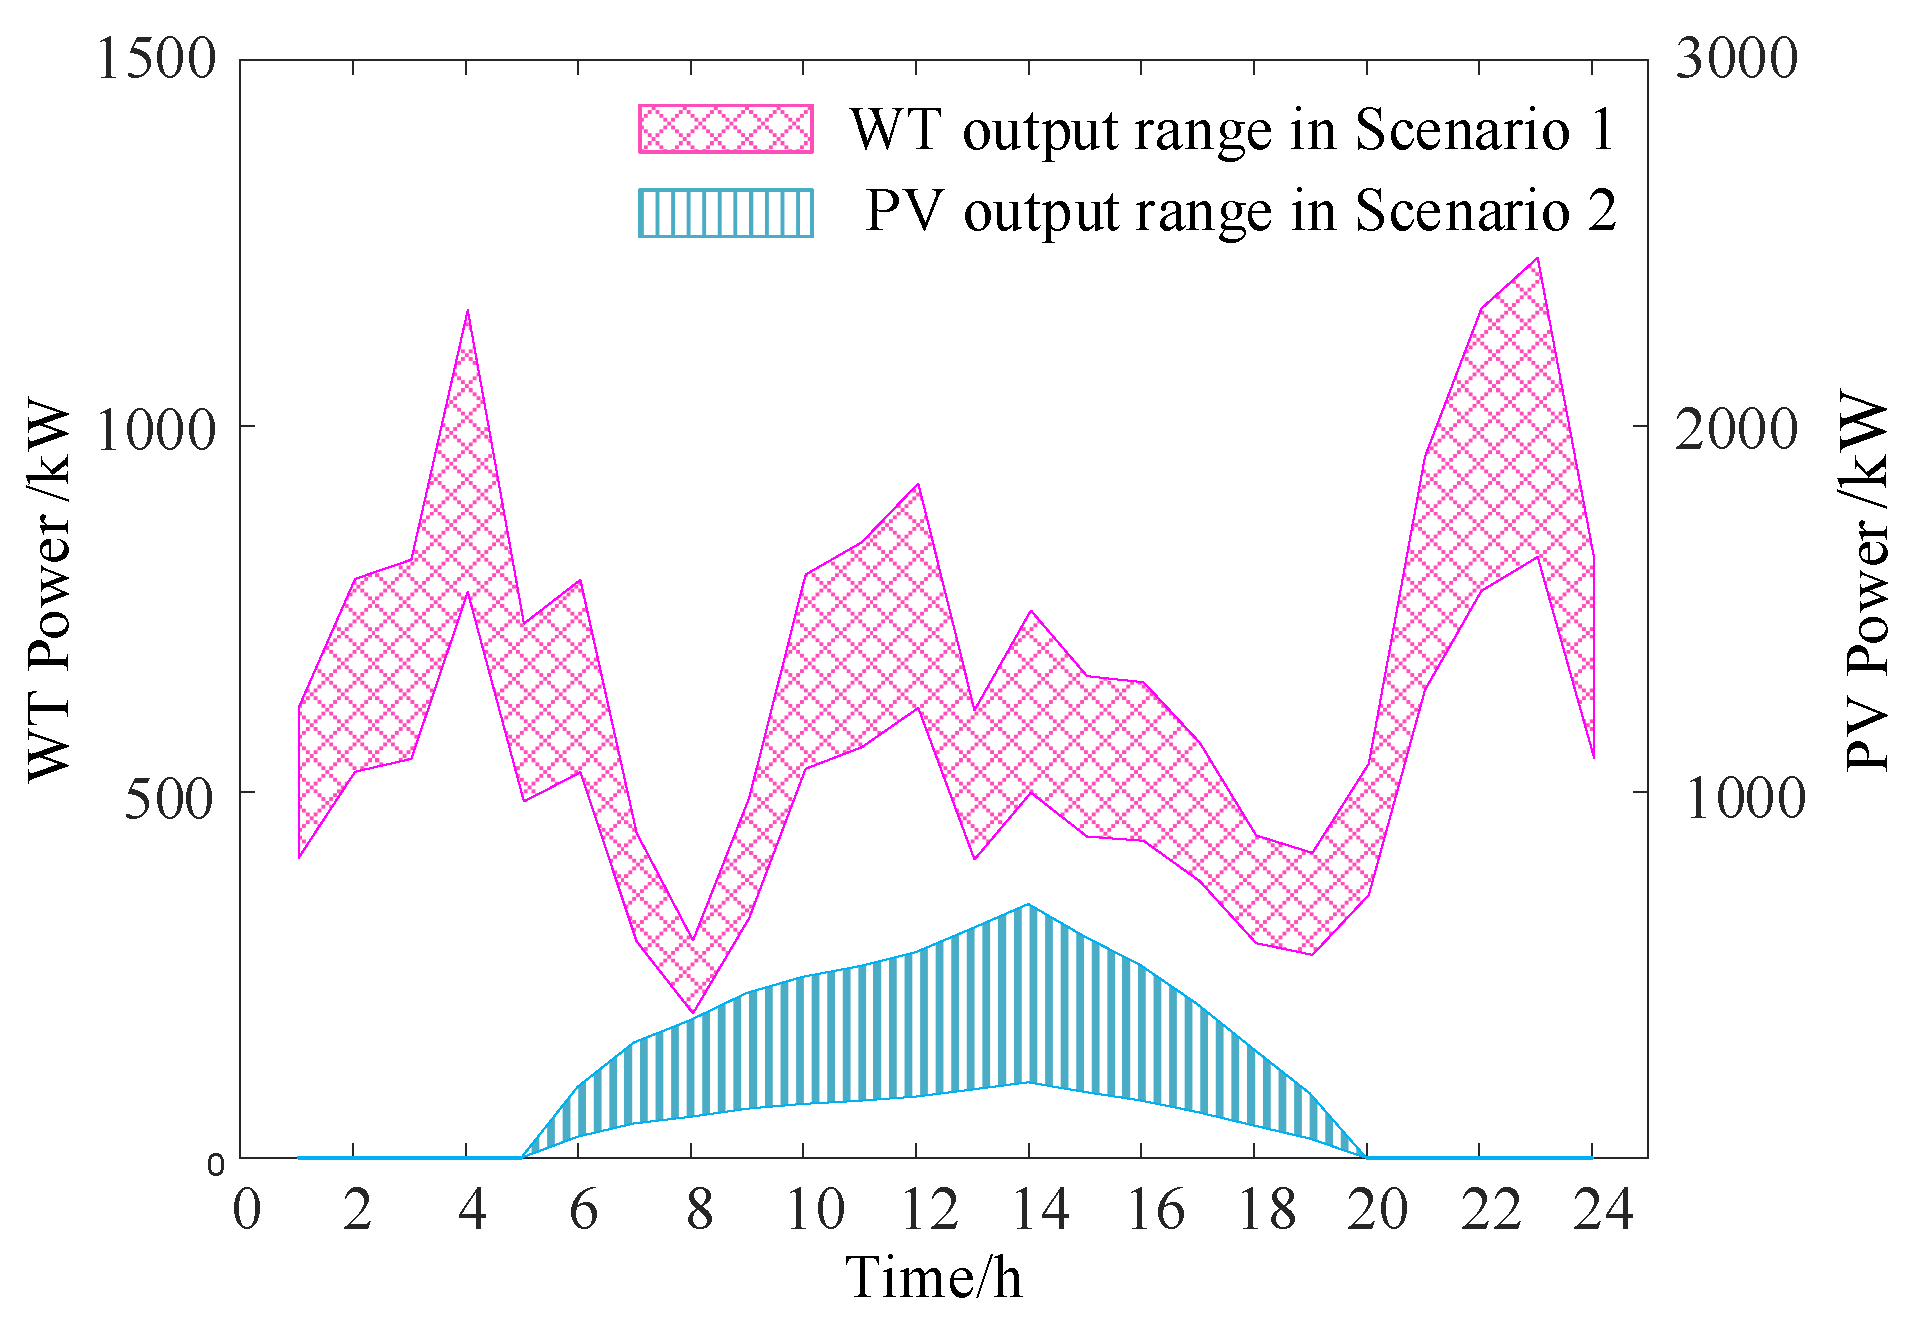
Figure 11.
Influence of deviation factor on uncertainty interval and scheduling cost.
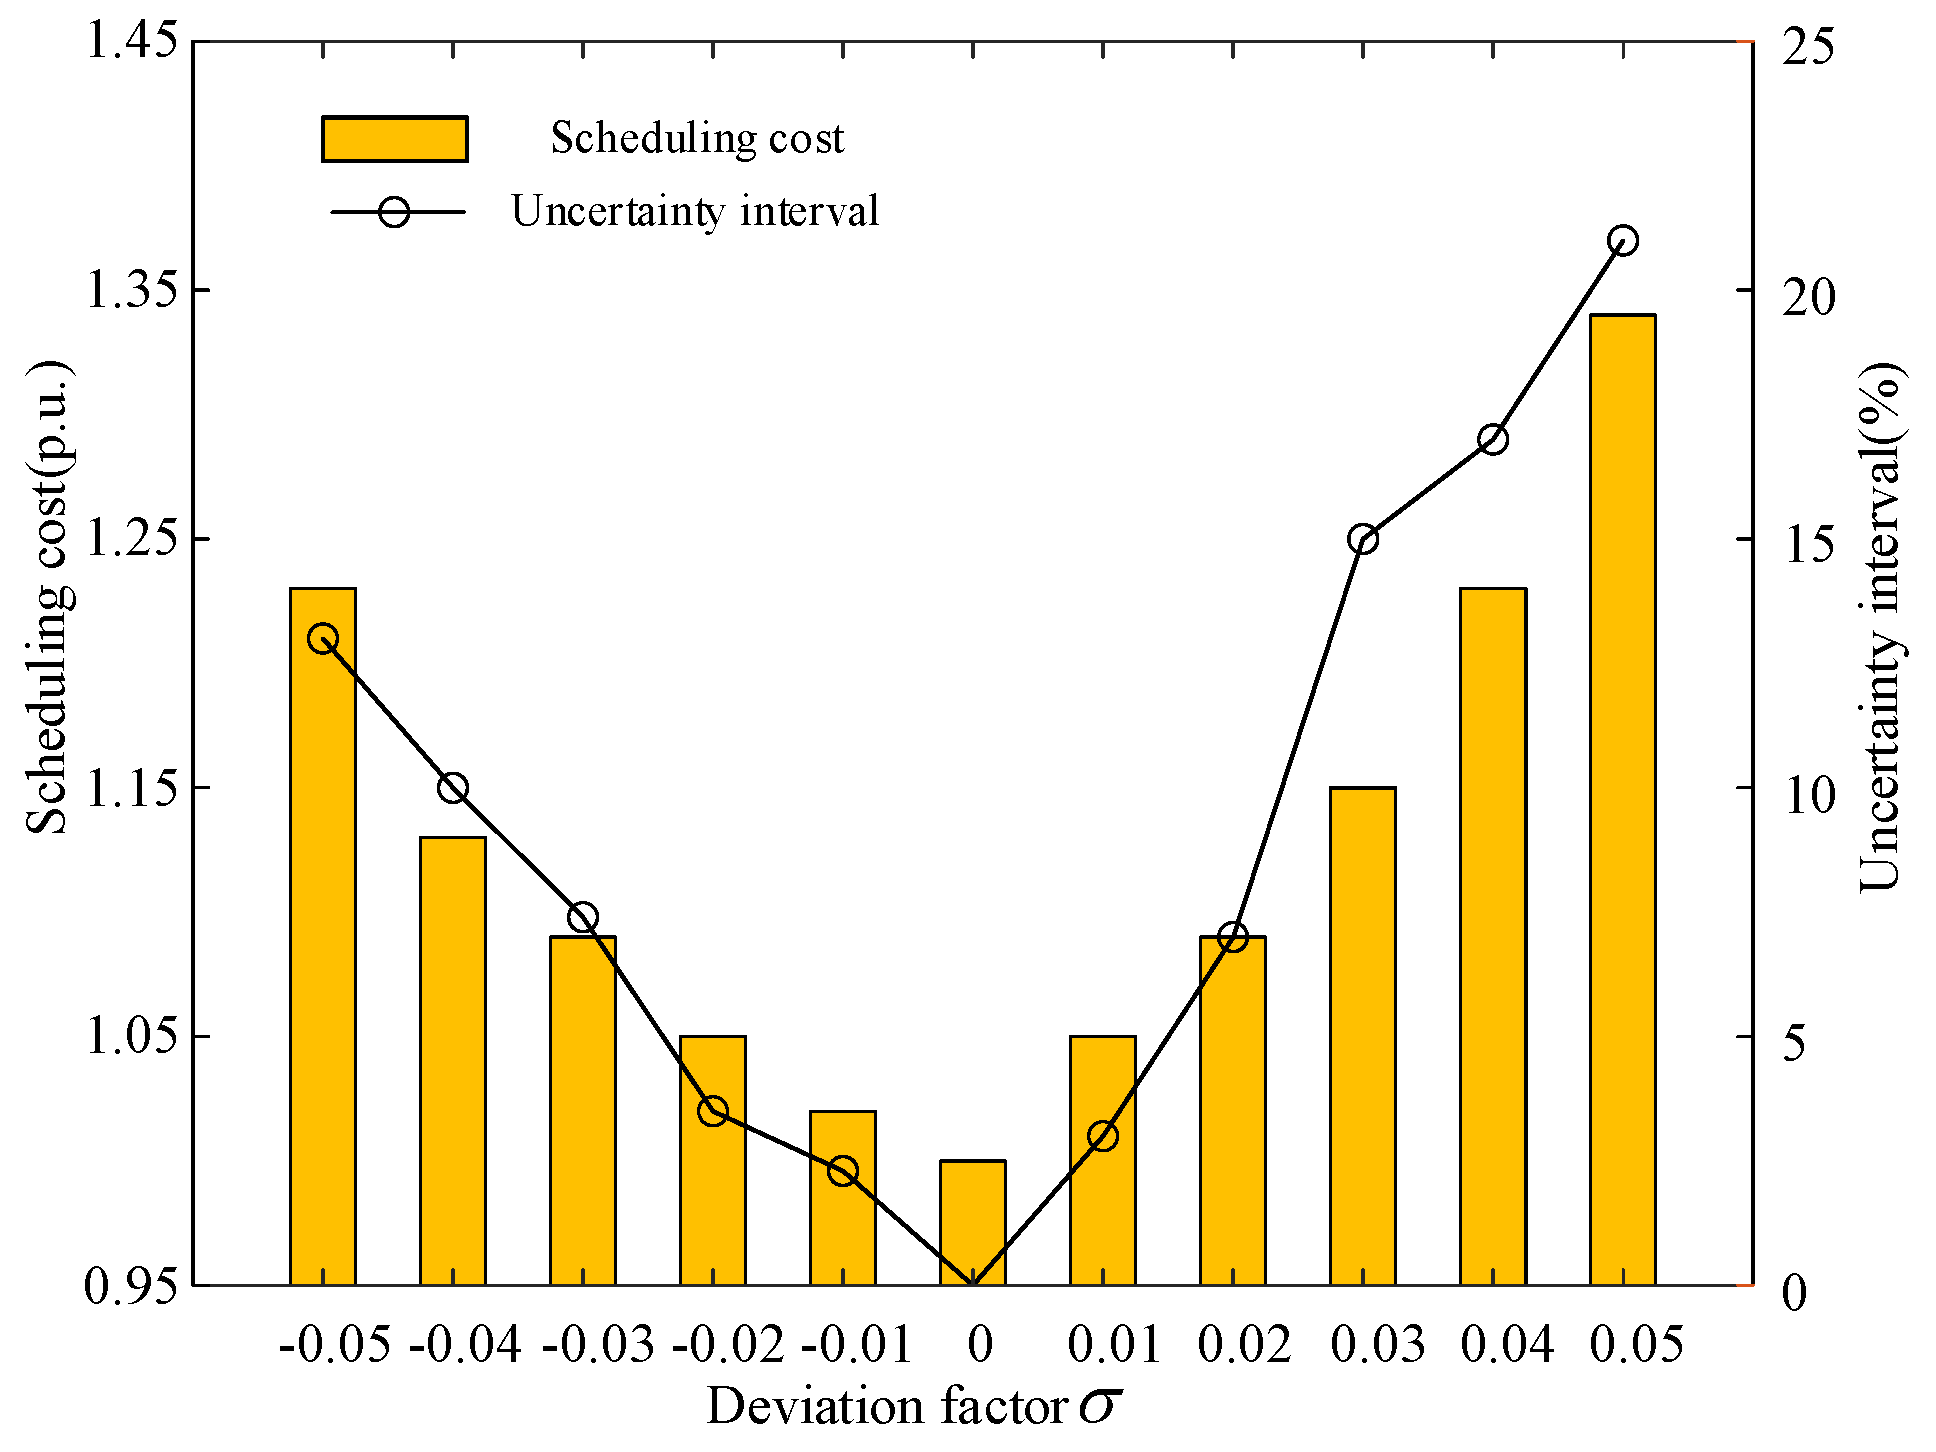
Figure 12.
Three typical scenarios of PV output.
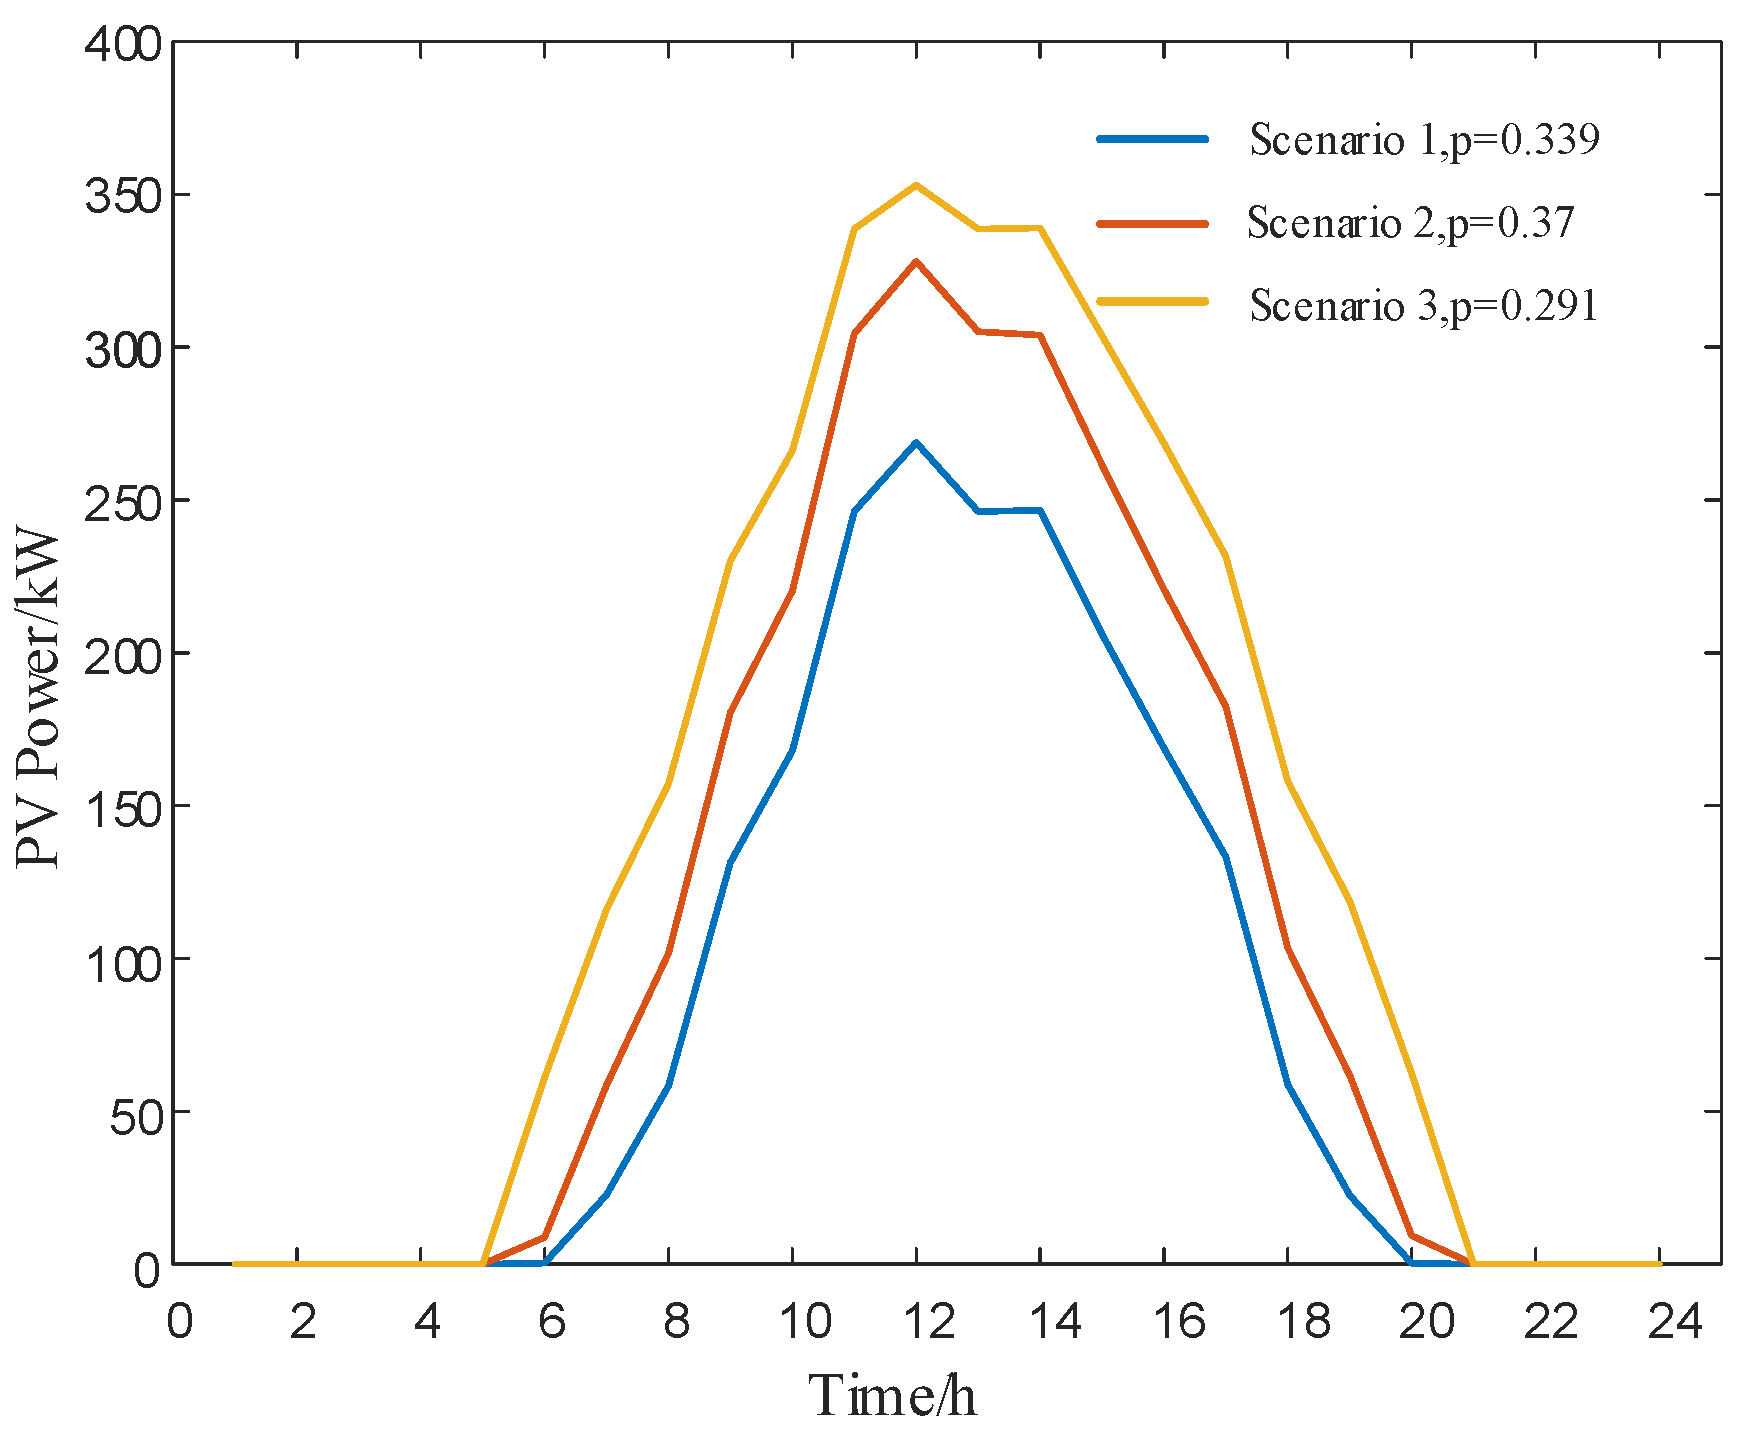
Figure 13.
Three typical scenarios of wind power output.
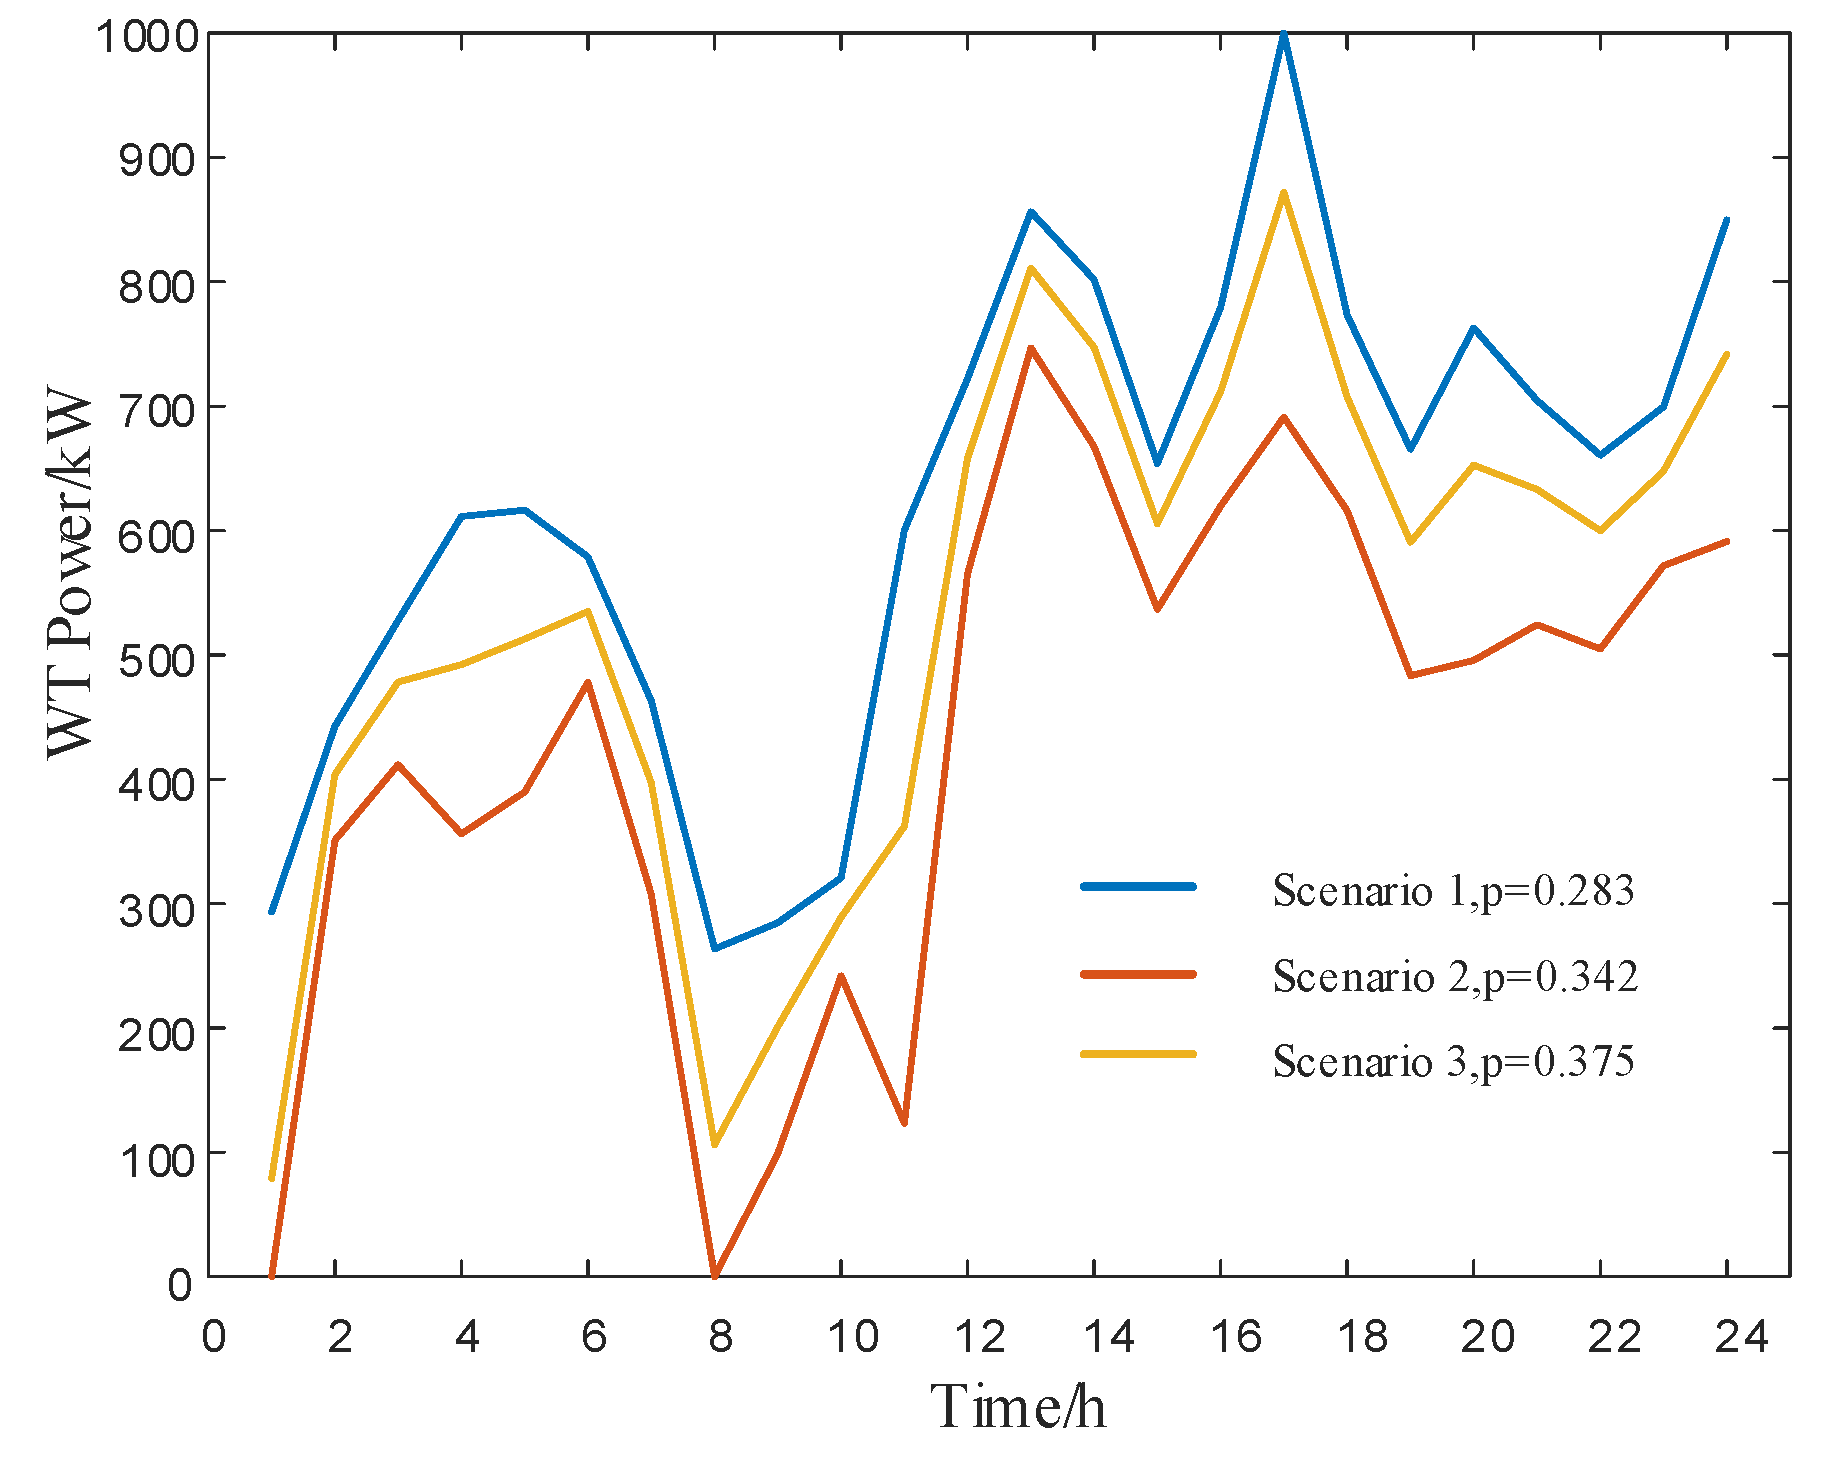
Table 1.
VPP system parameters.
| 1000kW | 600kW | 500kW | 150kW | 150kW |
| 400kW h | 0kW h | 2.5¥/m3 | 9.7kWh/m3 | 0.12¥/kW |
| 0.009 | 0.05 | 0.0253 | 0.03 | 0.01 |
Table 2.
TOU electricity price.
| Name | Period | Price |
|---|---|---|
| Peak | 10:00~15:00、18:00~21:00 | 0.84 |
| Mid-peak | 7:00~10:00、15:00~18:00、21:00 ~24:00 | 0.53 |
| Off-peak | 24:00~07:00 | 0.27 |
Table 3.
Electric vehicle parameter values and distribution.
| Parameter | Value | Parameter |
|---|---|---|
| (%) | 80 | SOC (%) |
| (kW) | 5 | (h) |
| (kW) | 5 | (h) |
Table 4.
Cost comparison.
| Optimal Dispatch System | Power Purchase Cost / yuan | Gas Purchase Cost / yuan | EV Dispatch Cost / yuan | Total Cost / yuan |
|---|---|---|---|---|
| Ψ=0 | 6458.3 | 4953.8 | 0 | 11412.1 |
| Ψ=0.8 | 5491.2 | 4201.7 | 812.8 | 10505.7 |
| Ψ=1 | 5249.5 | 4013.7 | 1016 | 10279.2 |
Table 5.
Three uncertainty scenarios.
| Scenario | Wind Power | Photovoltaic |
|---|---|---|
| Scenario1 | √ | × |
| Scenario2 | × | √ |
| Scenario3 | √ | √ |
Table 7.
Actual operating parameters.
| Parameter | Value | Unit |
|---|---|---|
| Actual wind power output | 832±121 | kW |
| Actual photovoltaic output | 378±89 | kW |
| System load | 2150±205 | kW |
| Electricity purchase cost | 0.84/0.53/0.27 | yuan/kWh |
| Natural gas price | 2.52 | yuan/m³ |
Table 8.
IGDT compared with other stochastic optimization methods.
| Method | Uncertainty (%) | Total Cost (yuan) | Time (s) |
|---|---|---|---|
| Monte Carlo | 22.64 | 11958.5 | 597 |
| Robust Optimization | 25.00 | 12156.4 | 139 |
| IGDT | 18.65 | 11432.1 | 53 |
Disclaimer/Publisher’s Note: The statements, opinions and data contained in all publications are solely those of the individual author(s) and contributor(s) and not of MDPI and/or the editor(s). MDPI and/or the editor(s) disclaim responsibility for any injury to people or property resulting from any ideas, methods, instructions or products referred to in the content. |
© 2025 by the authors. Licensee MDPI, Basel, Switzerland. This article is an open access article distributed under the terms and conditions of the Creative Commons Attribution (CC BY) license (http://creativecommons.org/licenses/by/4.0/).
Copyright: This open access article is published under a Creative Commons CC BY 4.0 license, which permit the free download, distribution, and reuse, provided that the author and preprint are cited in any reuse.


