
Submitted:
03 March 2025
Posted:
04 March 2025
You are already at the latest version
Abstract
In northern China, intercropping soybeans with forage mulberry enhances soybean yields through the optimization of natural resource use. However, the mechanisms underlying these improvements remain largely unknown. The aim was to explore the effects of this intercropping on soybean growth and yield. We used transcriptomics, redundancy analysis (RDA), and structural equation modelling (SEM) to evaluate soybean growth, yield, and nodulation; Results showed that intercropping didn't adversely affect plant height or stem diameter but increased chlorophyll content, photosynthetic rate, leaf area, and yield of soybean. It also increased available phosphorus (AP), available potassium (AK) and soil water content (SWC), while reducing soil available nitrogen (AN) and pH value. It promoted P and organic acid metabolism, transporter activity, and key - gene expression. RDA strikingly revealed that intercropping was positively correlated with yield, gene expression and soil properties. Meanwhile, SEM analysis demonstrates that soil AK, AP content, and SWC are positively correlated with soybean nodulation. Additionally, nodulation traits can directly enhance nitrogen metabolism, which subsequently boosts photosynthesis and ultimately exerts an indirect positive influence on soybean yield. Furthermore, intercropping soybeans with forage mulberry did not induce shade stress on the above-ground portion of soybean but promoted its growth and nodulation.
Keywords:
soybean intercropping forage mulberry
; nodulation traits
; photosynthesis
; isoflavone biosynthesis pathway
1. Introduction
Soybean (Glycine max L.) is a highly versatile crop used in food products, oils, proteins, and animal feed[1], with a low yield in China[2] due to a restricted acreage of suitable arable land[3] and inherent intolerance to continuous cropping[4]. Therefore, there is a need to optimize cultivation practices to enhance soybean production and reduce its import dependency. Intercropping is a widely used agricultural practice that enhances land productivity[5,6]. Intercropping gramineous plants with legumes can reduce nitrogen depletion in soil, improve nodulation for N fixation, and increase N transfer[7], thereby decreasing the need for chemical fertilizers[8]. Mechanistic studies on the promotion of N fixation in legumes by intercropping with gramineous plants mainly focus on the absorption of nitrogen in gramineous plants to create nitrogen-depleted conditions and prompt soybean roots to release nodulation signal substances like flavonoids[7,9,10]. Intercropping also aids rhizosphere soil acidification that benefits the activation of soil phosphorus[11] and strengthens the expression of genes related to nodulation and N fixation[12]. Intercropping soybeans with corn is especially widespread in China and enables farmers to obtain an additional soybean harvest while not impacting the yield of corn[5,13]. However, during the symbiotic stage, soybeans endure considerable shade stress imposed by corn, which reduces their photosynthetic capacity and biomass[14,15] and alters the red-to-farred light ratio in their canopy[16-18], leading to their collapse [19] and reduced yield [20-22].
To mitigate the shading impact on intercropped soybeans, forage mulberry, which can be harvested 2 to 3 times annually, is usually intercropped with soybeans to obtain more time and space for sunlight absorption. Mulberry also serves as an ideal special livestock feed when it is less than 1 meter high and has unlignified tender branches and leaves. Intercropping with soybeans also enhances soil nutrient availability and the diversity of the microbial community, thereby increasing the biomass of mulberry[12]. However, the effects of intercropping forage mulberry on the growth of soybeans have not been comprehensively explored. Therefore, this study aims to investigate the impacts of intercropping soybeans with forage mulberry on soybean growth indices, yield components, photosynthesis, shading status, and root nodulation. Our findings would facilitate the formulation of a high-yield intercropping model specific to soybeans. These results will also enrich the theory of high-yield soybean cultivation, thereby offering a valuable reference point for the expansion of the soybean cultivation area.
2. Materials and Methods
Site description. A field experiment was conducted in 2021, 2022 and 2023 at the Experimental Base of Northeast Forestry University in Li Ming Town, Harbin City, Heilongjiang Province (45°44'N, 126°36'E), situated at an altitude of 95.0 m. The region experiences an annual average temperature of 5.5°C, a cumulative temperature above 10°C totalling 2700°C, a frost-free period of 115-130 days, and an annual average precipitation of 560 mm, predominantly falling between July and September, which accounts for over 59% of the total. The experimental site was characterised by a meadow soil composed of 1.42 g/kg of total nitrogen, 23.12 g/kg of total potassium, 0.62 g/kg of total phosphorus, 31.1 g/kg available matter content, and a pH of approximately 6.51.
Experimental design. The field experiment was carried out in a randomized block design in an irrigated 600 m2 unobstructed arable land, with each intercropping plot measuring 6 m x 12 m. To explore the effects of intercropping with forage mulberry on soybean nodulation, the researchers deliberately excluded nitrogen fertilizer to establish a nitrogen - deficient condition. The treatments consisted of plots with sole-cropped soybean without nitrogen fertilizer (SN0) and intercrops of forage mulberry and soybeans without nitrogen fertilizer (IN0). In the intercropping system, the rows of plants were arranged in a 3:4 ratio, specifically three rows of forage mulberry followed by four rows of soybean. Both the soybean and forage mulberry were planted with a consistent row - to - row spacing of 0.65 m. The soybean was planted in rows spaced 8 cm apart to reach a final population of 190,000 plants/hm2, was fertilized with 65 kg/hm2 of P as triple superphosphate and 75 kg/hm2 of K as KCl, whereas the forage mulberry was planted in rows 5 cm apart for a population of 300,000 plants/hm², received 35 kg/hm2 of P and 60 kg/hm2 of K from the same sources.
Growth performance and yield. Plant height was measured at soybean growth stages of beginning bloom (R1) as described previously[23] for both the SN0 and IN0 treatments. The diameter of the stem base and the length and width of the third compound leaf were measured using vernier callipers (DL91150, Deli, China), while the leaf area was calculated using the formula: Leaf area = length × width × 0.75, where 0.75 means leaf area coefficient of soybeans. The fresh and dry weights of the entire plant were recorded using an analytical balance (BSA223S, Sartorius, Germany). The plants were dried in an oven at 105°C for 1 h, then dried at 75°C until a constant weight was reached to determine the dry weight. The chlorophyll content was determined using the ethanol extraction colourimetric method, 0.5 grams of leaves were placed in a 50 mL centrifuge tube with 20 mL of 95% ethanol, sealed, and extracted in the dark at room temperature for 24 hours until the tissue turned white. The chlorophyll content was then measured using a UV-visible spectrophotometer at wavelengths of 665 nm and 649 nm. To determine the yield, the seeds were harvested according to the treatment plots and threshed, followed by measurement of the seed weight from each plot using an electronic balance in triplicates.
Photosynthetic gas exchange parameters. The photosynthetic parameters were measured using a Li-6400 portable photosynthetic system (LI-COR, Lincoln, USA) between 9:00 and 11:00 hours on the fully expanded functional leaves at the R1 stage before the first mowing of forage mulberry. All these measurements were repeated five times.
Measurement of nitrogenase activity. The nitrogenase activity of root nodules was indirectly determined by the acetylene reduction assay. Briefly, the roots from each plant with root nodules were collected and placed into sealed vials. Two millilitres of air were removed from each vial and replaced with an equal volume of acetylene. After incubating at 28°C for 2 h, the ethylene content was measured using gas chromatography (GC-2010, Shimadzu, Japan). The nitrogenase activity of nodules was expressed as the amount of ethylene produced in micromoles per hour per gram of sample. Each measurement was repeated five times.
Measurement of nitrogen metabolism. The third compound leaf of the soybean was collected at flowering stage (R1) in 2023. The concentrations of NH4+ -N in the leaves were measured using phenol disulfonic acid colorimetry and potassium chloride extraction-indophenol blue colorimetry [24]. The activities of glutamine synthetase (GS) and glutamate synthase (GOGAT) in soybean leaves were refered to the method of Feng [25].
Transcriptome analysis. Soybean root samples were collected at the R1 stage in triplicates and stored in a cryostat. The root samples were washed with 75% ethanol to remove dust and soil and then frozen in liquid nitrogen for 1 h and stored at -80°C. The total RNA extracted from the root samples was used to construct the library and for transcriptome sequencing at the Hangzhou Kaitai Biotechnology.
Soil physical and chemical properties. The soil samples from soybean roots were collected at the R1 stages. The pH value of the soil was measured using a pH meter (delta 320, Mettler Toledo, Switzerland) with electrodes in a soil and water (1:2.5) suspension. The available nitrogen was determined using the alkali hydrolysis diffusion method [26], while the available phosphorus and potassium were determined as described by Lu [24].
Statistical analysis. All independent experiments were repeated at least five times. Statistical analyses were performed using SPSS 24.0 with a two-way analysis of variance to analyze the interaction of planting pattern and year on soil physico-chemical properties. And least significant difference (LSD) tests were used to compare differences between cropping patterns at the same year, as well as between years within the same cropping pattern differences among treatments. Canoco 4.5 was used to reveal the correlation among planting patterns, growth indices and soil properties though redundancy analysis (RDA). To establish a theoretical framework for intercropping that favours soybean cultivation and management, we employed structural equation modelling (SEM) to uncover the pathways and interaction mechanisms of various factors affecting soybean growth and nodulation traits and analyzed their direct and indirect effects. The interaction relationship was further analyzed by the partial least squares path model (PLS-PM). The path and determination coefficients (R2) in the path model were calculated by the plspm package of R 4.4.0.
3. Results
3.1. Growth Indices at the Bloom Stage of Soybean
Based on three years of data, there were no significant differences in the plant height and stem diameter of soybeans between sole-cropping and intercropping (Table 1). While, soybean intercropped with forage mulberry consistently achieved significantly higher values of leaf area, fresh weight per plant and dry weight per plant their corresponding values in sole-cropping.
Specifically, in 2021, 2022, and 2023, the leaf area of intercropped soybeans was 5.17% (P<0.05), 8.11% (P<0.05), and 5.79% (P<0.05) larger than that in sole - cropping, respectively. Similarly, the soybean fresh weight per plant of intercropped soybeans was 5.81% (P<0.05), 5.10% (P<0.05) and 4.63% (P<0.05) higher, and the dry weight was 4.19% (P<0.05), 2.69% (P<0.05), and 3.81% (P<0.05) higher than that in sole-cropping.
The results of the two-way ANOVA test showed that pattern has significant effect on soybean fresh weight per plant. While, year, pattern and year × pattern have no significant effects on plant height, stem diameters, leaf area and dry weight. Which clearly indicating intercropping with forage mulberry refrained from triggering spindly growth in soybeans and, to a certain degree, actively promoted their growth and development.
3.2. The Soybean Yield Components of Soybean
From 2021 to 2023, when compared with soybeans under sole cropping, the yield components of soybeans intercropped with forage mulberry showed significant increases (Table 2). Specifically, in 2021, 2022, and 2023, the number of pods per plant in intercropped soybeans was 5.48% (P < 0.05), 4.39% (P < 0.05), and 5.84% (P < 0.05) higher than that in sole - cropping, respectively. The number of seeds per plant in intercropped soybeans was 12.63% (P < 0.05), 11.39% (P < 0.05), and 8.47% (P < 0.05) higher than in sole - cropping. In the same vein, the grain yield per plant of intercropped soybeans was 7.41% (P < 0.05), 6.31% (P < 0.05), and 7.84% (P < 0.05) higher. The 100 - seed weight of intercropped soybeans was 12.17% (P < 0.05), 11.85% (P < 0.05), and 9.39% (P < 0.05) higher, and the overall grain yield was 8.39% (P < 0.05), 7.69% (P < 0.05), and 10.88% (P < 0.05) higher than that in sole - cropping.
The results of the two-way ANOVA test showed that the cropping pattern had a significant effect on the grain yield per plant, 100-seed weight, and fresh weight of soybean grains. In contrast, neither the year nor the interaction between the year and the cropping pattern had significant effects on these characteristics.
3.3. Root Nodule Traits at the Bloom Stage of Soybean
From 2021 to 2023, compared with soybeans in sole cropping, the number of root nodules, along with the fresh and dry weights of root nodules intercropped with forage mulberry treatment, were significantly increased (Table 3).
In particular, in 2021, 2022, and 2023, the number of root nodules per plant intercropped soybeans were 21.43% (P<0.05), 24.21% (P<0.05), and 25.79% (P<0.05) more than that in sole-cropping, respectively. Similarly, the fresh weight of nodules per plant of intercropped soybeans was 51.58% (P<0.05), 54.89% (P<0.05) and 56.78% (P<0.05) higher, and the dry weight was 40.21% (P<0.05), 44.00% (P<0.05), and 51.30% (P<0.05) higher than that in sole-cropping.
The results of the two - way ANOVA test showed that the cropping pattern had a significant effect on the number of nodules, the fresh weight of nodules, and the dry weight of nodules. Conversely, both the year and the interaction of the year and the cropping pattern had no significant impacts on these features.
3.4. Physical and Chemical Properties in Rhizosphere Soil
From 2021 to 2023, when compared with soybeans under sole cropping, the content of available nitrogen (AN) and the pH value in the treatment of soybeans intercropped with forage mulberry decreased significantly (Table 4). In contrast, the content of available phosphorus (AP), the content of available potassium (AK), and the soil water content (SWC) were higher in the intercropping system than in the sole - cropping system.
For example, in 2021, 2022, and 2023, the AN content in the soil of intercropped soybeans were 9.95% (P<0.05), 8.95% (P<0.05), and 9.31% (P<0.05) lower, respectively, and the pH value was 1.62% (P<0.05), 3.04% (P<0.05), and 2.44% (P<0.05) lower than that in sole-cropping. On the other hand, the AP content in the soil of intercropped soybeans was 16.72% (P<0.05), 16.48% (P<0.05) and 16.30% (P<0.05) higher, and the AK content was 19.77% (P<0.05), 19.53% (P<0.05), and 20.57% (P<0.05), and SWC was 13.51% (P<0.05), 11.28% (P<0.05), and 12.06% (P<0.05) higher than that in sole-cropping.
The results of the two-factor variance analysis indicated that the planting pattern had a significant influence on the pH value, AN, AP, AK and SWC in rhizosphere soil of the soybean. However, year and the interaction between the year and the planting pattern had no significant impact on the above - mentioned properties of the rhizosphere soil.
3.5. Photosythetic Parameters at Blooming Stage
Intercropping soybeans with forage mulberry significantly affected the main gas exchange parameters of soybean leaves, as presented in Figure 1. When compared to sole - cropping, the net photosynthetic rate (Pn) of soybeans in the intercropping system with forage mulberry increased by 24.86% (P < 0.01), and the intercellular CO₂ concentration (Ci) increased by 5.48% (P < 0.05). However, no significant differences were observed between the intercropping and sole - cropping systems in terms of chlorophyll content (P > 0.05), stomatal conductance (Gs) (P > 0.05), and transpiration rate (Tr) (P > 0.05).
3.6. Nitrogen Metabolism Changes in Soybean
This is example 1 of an The NH₄⁺ - N generated by nitrogen fixation in root nodules is assimilated through the GS/GOGAT cycle within the leaves of soybeans (Figure 2a). Intercropping soybeans with forage mulberry enhanced the nitrogenase activity of soybean roots (Figure 2b), along with the content of NH₄⁺ -N and the activities of glutamine synthetase (GS) in soybean leaves at the R1 stage (Figure 2c,d).
Compared to sole - cropping, intercropping with forage mulberry led to a significant increase in nitrogenase activity in nodules by 135.28% (P < 0.01), NH₄⁺ -N content in soybean leaves by 31.13% (P < 0.01), and GS activity in soybean leaves by 19.30% (P < 0.01). Conversely, the glutamate synthase activity (GOGAT) in soybean leaves within the intercropping system with forage mulberry was 24.64% (P < 0.001) lower than that in the sole - cropping system (Figure 2e).
3.7. Transcriptome Analysis
The transcriptome analysis identified 1,462 differentially expressed genes (DEGs) in soybean roots of intercropping with forage mulberry (IN0) compared to sole-cropping (SN0). Among these, 569 DGEs were up-regulated, and 893 DGEs were down-regulated, suggesting that intercropping with forage mulberry modified the expression of genes in soybean root (Figure 3a).
The DEGs were categorized into biological processes, cellular components, and molecular functions based on the gene ontology (GO) terms (Figure 3b). The DEGs enriched in the biological processes mainly included the phosphorus metabolic process, organic acid metabolic process, oxoacid metabolic process, response to organonitrogen compound and response to nitrogen compound. The enriched molecular functions mainly included oxidoreductase activity, organic acid transmembrane transporter activity and carboxylic acid transmembrane transporter activity (Figure 3b). The KEGG enrichment analysis showed that DEGs in SN0 and IN0 were highly enriched in plant-pathogen interaction and isoflavone biosynthesis pathways (Figure 3c).
3.8. Isoflavone Biosynthesis
Flavonoids serve as crucial signalling molecules in the symbiosis between soybean and rhizobium and are synthesised through the isoflavone biosynthesis pathway, which comprises the phenylpropane pathway from phenylalanine to coumarin-CoA, the flavonoid biosynthesis from p-coumarin-CoA to naringenin, and the isoflavone biosynthesis from naringenin to isoflavones (Figure 4). Compared with sole-cropping, intercropping with forage mulberry increased the expression of DEGs related to coenzyme A ligase (4-coumarate: coenzyme A ligase, 4CL), chalcone synthase (CHS), chalcone isomerase (CHI), flavone synthase (FNS), and 2-hydroxyisoflavanone dehydratase (HIDH). This indicates that intercropping with forage mulberyy activated the "isoflavone biosynthesis" pathway and enhanced the metabolism and secretion of flavonoids in the soybean roots compared to sole-cropping, thereby facilitating the biosynthesis of rhizobial nodulation factor (NF) to promote N fixation through root nodulation.
3.9. Redundancy Analysis (RDA)
Redundancy analysis (RDA) of the planting pattern, growth - related parameters, and soil properties indicated that intercropping with forage mulberry had the highest positive value along axis 1, while sole - cropping had the highest negative value along axis 1 (Figure 5). The genes related to the isoflavone pathway, nitrogenase activity, and the main soil properties, namely available phosphorus (AP), available potassium (AK), and soil water content (SWC), were positively correlated with intercropping and negatively correlated with sole - cropping. The growth indices, including grain yield per plant, 100 - seed weight, plant height, stem diameter, fresh weight per plant, dry weight per plant, leaf area, and the soil properties of available nitrogen (AN) and pH value, were positively correlated with sole - cropping and negatively correlated with intercropping.
3.10. Structural Equation Modeling (SEM)
Structural equation modeling (SEM) was used to analyze both the direct associations and indirect and causal linkages among variables for a better understanding (Figure 6). Intercropping with forage mulberry had highly significant negative effects on pH and AN with a path coefficient of -0.940 (P < 0.001) and significant positive effects on the AP, AK and SWC with path coefficients of 0.940 (P < 0.001). The contents of AP and AK had the most significant positive effects on the soybean isoflavone synthesis pathway, with path coefficients of 0.977 (P < 0.001). Moreover, isoflavone synthesis pathways were positively correlated with nodulation traits (β = 0.997, P < 0.001), while nodulation-mediated effects positively regulated nitrogen metabolism in soybean leaf (β = 0.991, P < 0.001), and the nitrogen metabolism positive correlated with the gas exchange parameters in soybean leaf (β = 0.986, P < 0.001). The results also showed a positive and insignificant correlation of the gas exchange parameters with yield (β = 0.595, P > 0.05), and a positive correlation of the intercropping with yield (β=0.960, P > 0.05).
GOF (Goodness of Fit)> 0.600 indicates a model with a good fit. The isoflavone pathway includes genes of 4CL5, 4CL7, CHI3, FNS and HIDH3, while the nodulation traits include the number, fresh weight and dry weight of nodules and nitrogenase activity. The photosynthetic parameters used include net photosynthetic rate (Pn), stomatal conductance (Gs), and transpiration rate (Tr). Other parameters used are soil pH, soil available nitrogen (AN), soil available phosphorus (AP) and soil available potassium (AK), soil water content (SWC). The nitrogen metabolism include the Nitrogenase activity, NH4+-N content, glutamine synthetase activity (GS), glutamate synthase activity (GOGAT). The green arrows indicate positive effects, while the yellow arrows indicate negative effects; ∗indicates P < 0.05, and ∗∗∗indicates P < 0.001.
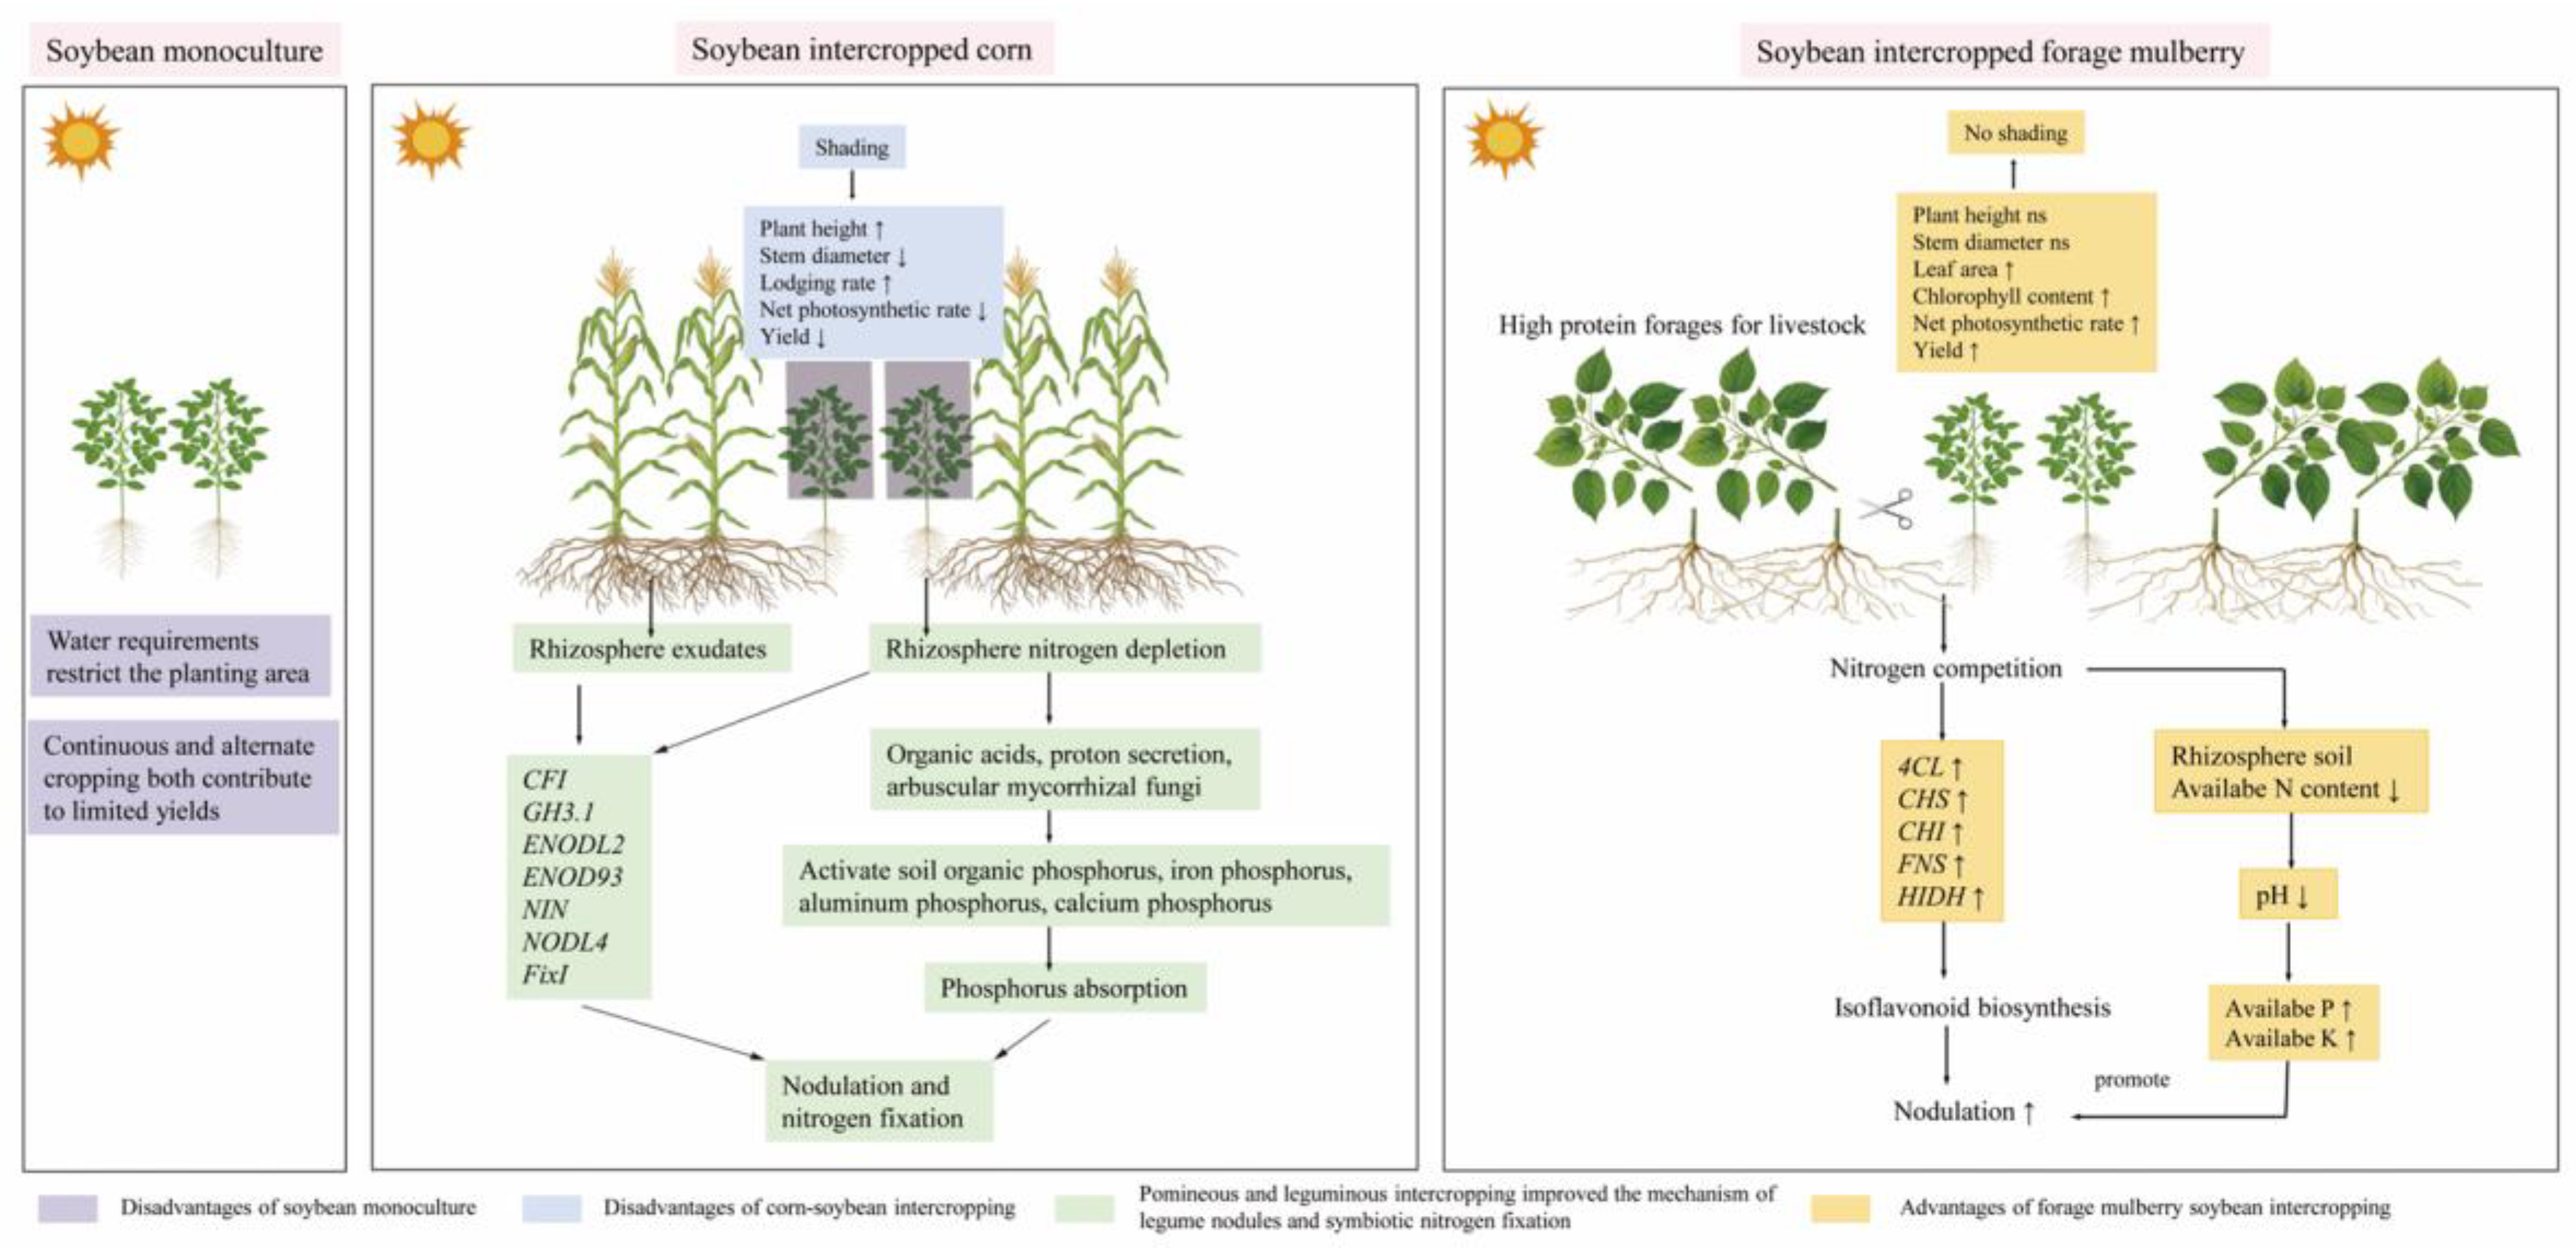
Figure 7.
Underlying mechanisms of intercropping with forage mulberry-induced impacts on soybean growth and nodulation.
Figure 7.
Underlying mechanisms of intercropping with forage mulberry-induced impacts on soybean growth and nodulation.
4. Discussion
4.1. Effects of Intercropping of Mulberry on the Growth of Soybean
Legumes are preferred for intercropping primarily due to their ability to symbiotically fix N, which they utilize and can also be used by adjacent crops [27,28]. While, intercropping with gramineous plants can reduce nitrogen (N) depletion in legumes, improve nodulation for N fixation, and increase N transfer, thereby decreasing the need for chemical fertilizers[8]. So intercropped with legumes greatly conforms to the strategy of reducing N input in agriculture [29]. However, the symbiotic N fixation is an energy-expensive process that depends greatly on shoot photosynthetic processes [30]. The light available to plants is a primary influencing factor in photosynthesis since it provides energy. Moreover, light also serves as an essential signal for biological nitrogen fixation [31]. On the other hand, shading brought by intercropping directly leads to a decline in soybean’s photosynthetic parameters [14], thinning of the stems, elongation of the internodes, increase in plant height, lodging and reduced yields [17,20]. In this study, intercropping with forage mulberry did not hinder the plant height and stem diameter of soybeans. In contrast, it enhanced the chlorophyll content and net photosynthetic rate, thereby increasing the soybean yield. This indicated that the regularly mowed forage mulberry did not exert shading effects on soybeans during the intercropping symbiosis period. To some extent, intercropping with forage mulberry also had beneficial effects on soybean growth and yield.
4.2. Effects of Intercropping on Nodulation Related Indicators
Intercropping with gramineous plants creates a nitrogen - depleted environment. This reduces the "nitrogen repression" on the root systems of leguminous plants by competing for soil nitrogen and also promotes nodulation[32]. Our previous studies found that the contents of available nitrogen content (AN) in the rhizospheric soil of the legumes intercropped with forage mulberry declined, while the number of nodules increased[12,33,34]. Similarly, in this current study, the AN content in the rhizospheric soil of soybeans intercropped with forage mulberry also declined over the three - year period. Therefore, it is likely that the forage mulberry enriched protein was mowed 2-3 times just like gramineous plants to take away a large amount of N elements from the soil, thereby creating an N-deficient environment. When the roots of leguminous plants sense the deficiency in soil N, they secrete flavonoid substances as signals into the soil, which plays the role of a key signaling molecule in symbiosis[35,36].
Intercropping can promote the expression level of CHI genes in pea roots, thereby enhancing the secretion of flavonoids in leguminous crops, which is beneficial in the nodulation of legumes[37]. In this study, intercropping with forage mulberry stimulated the expression of genes encoding the key enzymes, including 4CL, CHS, CHI, FNS, and HIDH, which are involved in the isoflavone biosynthesis in soybean roots. Correspondingly, the nodule traits of soybeans intercropped with forage mulberry are significantly superior to those of soybeans under monoculture. However, the N-fixation in leguminous plants is limited by the contents of the soil P and K[20], the legumes are stimulated to adopt potential P uptake strategies via root-secreting organic acid to meet their high P demand for N fixation[37]. In the present study, intercropping with forage mulberry decreased the rhizospheric soil pH of intercropped soybeans but increased the content of soil AP and AK. Additionally, the gene ontology analysis also showed the significant enrichment of organic acid and ion transmembrane transporter proteins in the intercropped soybeans. Therefore, these findings suggest that intercropping with forage mulberry could potentially stimulate soybean roots to secrete organic acids, consequently enhancing soil phosphorus activity. Meanwhile, ample soil moisture acts as an indispensable medium for the activated phosphorus to penetrate root. Moreover, soil water content (SWC) significantly impacts the nodulation traits of leguminous plants [38]. Specifically, inadequate SWC can impede nodule formation and reduce nodule activity. Shen et al[39] reported that intercropping with maize plants can enhance the SWC in soybean rhizosphere soils. Similarly, intercropping with forage mulberry has been shown to increase the SWC in the rhizosphere soil of soybean roots. The adequate SWC may facilitate the utilization of nitrogen fixed by root nodules, transport it to the leaves, and promote nitrogen metabolism in the leaves.
4.3. Effects of Intercropping on NH₄⁺-N Assimilation in Soybean Leaf
Previous research has demonstrated that the most vigorous stage of nitrogen fixation, transport, and assimilation in soybean leaves occurs at the flowering stage[40]. Therefore, aiming to build upon previous findings, in this experiment, all indicators associated with nitrogen metabolism were assayed during the flowering stage. And, we observed that the nitrogenase activity in soybean root nodules and the NH₄⁺ -N content in leaves in the intercropping system with forage mulberry were higher than those in the sole - cropping system. To investigate the effects of intercropping with forage mulberry on soybean nodulation, nitrogen fertilizer was deliberately omitted to create a nitrogen - limited environment. It is highly likely that the main source of ammonium ions (NH₄⁺) in soybean leaves is the nitrogen fixed via soybean nodulation. Meanwhile, the conversion of NH₄⁺ into glutamine and glutamate depends on the interaction between glutamine synthetase (GS) and glutamate synthase (GOGAT) in the GS - GOGAT cycle[41]. In this experiment, the activity of GS in soybean leaves was found to be higher in the intercropping system with forage mulberry than in the sole - cropping system. Conversely, the activity of GOGAT exhibited an opposite trend. There was no correlation found among the NH₄⁺ content, GS activity, and GOGAT activity in soybean leaves. A possible reason for this is that the function of GS/GOGAT may not be restricted to nitrogen assimilation. The products of GS/GOGAT, glutamine and glutamate, not only participate in amino acid metabolism but also potentially act as signal molecules in various pathways[42]. There are still many gaps in a better understanding of the interactions of GS/GOGAT and the concentration of NH4+ in soybean intercropped with forage mulberry.
4.4. Relationships Between Soybean Growth, Photosynthesis, Soil Physicochemical Indices, Nodulation and Yield
In recent years, there has been an exponential increase in studies examining the effects of agronomic practices on soil microbial communities[43]. However, it remains a challenge to elucidate the relationships between plant phenotypic traits, soil physicochemical properties, plant yield, and plant gene expression, as well as their impact pathways under intercropping conditions[44]. Combining RDA and SEM can help explore the correlations between variables and then delve deeply into their specific cause - effect relationships and the underlying mechanisms [45]. In this study, RDA indicated that on the same coordinate axis, the genes involved in soybean root isoflavone biosynthesis, nodule traits, along with soil AP, AK, and SWC, were positively associated with intercropping patterns but negatively correlated with sole - cropping. Meanwhile, the main soybean growth indices, along with soil pH and AN, were positively related to sole - cropping and negatively related to intercropping. Previous studies have demonstrated that intercropping soybeans with maize exerts a detrimental influence on the photosynthetic traits, soil nitrogen content, and yield of soybeans[44]. On the contrary, our SEM results indicate that the soil P and K content as the main contributors to soybean yield, had the most significant positive effects on isoflavone synthesis and nodulation traits, while the nodulation traits positively related to nitrogen metabilism and photosynthesis in leaves, which in turn affected the soybean yield. Based on the above discussion, we have elucidated the fundamental mechanisms by which forage mulberry promotes the growth of soybeans and established a theoretical framework for enhancing soybean nodulation in the intercropping system (Figure. 7).
5. Conclusions
The presented data elucidate the fundamental mechanisms of forage mulberry in facilitating the growth of soybeans, and formulate theoretical framework for enhancing nodulation in intercropping system. In this experiment, intercropped with forage mulberry did not induce shade stress on soybean. Additionally, intercropping significantly reduced the content of AN and the value of pH in the rhizosphere soil, while enhanced the levels of AP, AK and SWC. Moreover, the intercropping activated the expression of genes encoding key enzymes involved in the “isoflavone biosynthesis“ pathway, including 4CL, CHS, CHI, FNS, and HIDH. Furthermore, the intercropping of forage mulberry significantly increased the number of nodules, and nitrogenase activity in soybean roots, which collectively contributed to higher soybean yields.
Author Contributions
Conceptualization, Xiuli Zhang, Yanbo Hu, and Huihui Zhang; methodology, Xinjie Feng, and Minghui Zhong; data curation, Xinjie Feng and Xuexian Zhao; writing-original draft preparation, Xinjie Feng; writing-review and editing, Xiuli Zhang; visualization, Yanbo Hu; supervision, Huihui Zhang; project administration, Xiuli Zhang; funding acquisition, Xiuli Zhang. All authors read and approved the manuscript.
Funding
This research was founded by the Natural Science Foundation of Heilongjiang Province, China (Grant No. LH2021C009) and the National Natural Science Foundation of China (Grant No. 31600508)
Conflicts of Interest
The authors declare that they have no known competing financial interests or personal relationships that could have appeared to influence the work reported in this paper.
References
- Hu, J.M.; Zhuang, Y.B.; Li, X.C.; Li, X.M.; Sun, C.C.; Ding, Z.J.; Xu, R.; Zhang, D.J. Time-series transcriptome comparison reveals the gene regulation network under salt stress in soybean (Glycine max L.) roots. BMC. Plant. Biol. 2022, 22, 157. [Google Scholar]
- Xue, A.O.; Zhao, M.H.; Zhu, Q.; Li, J.; Zhang, H.J.; Wang, H.Y.; Mei, Y.C.; Li, C.H.; Yao, X.D.; Xie, F.T. Study on plant morphological traits and production characteristics of super high-yielding soybean. J. Integr. Agric. 2013, 7, 1173–1182. [Google Scholar]
- Liu, X.B.; Herbert, S.J. Fifteen years of research examining cultivation of continuous soybean in northeast China: A review. Field. Crops. Res. 2002, 79, 1–7. [Google Scholar] [CrossRef]
- Sun, G.Y.; Zhang, Y.; Chen, H.C.; Wang, L.; Li, M.X.; Sun, X.H.; Fei, S.P.; Xiao, S.F.; Yan, L.; Li, Y.H.; Xu, Y.; Qiu, L.J.; Ma, Y.T. Improving soybean yield prediction by integrating UAV nadir and cross-circling oblique imaging. Eur. J. Agron. 2024, 155, 127134. [Google Scholar] [CrossRef]
- Du, J.B.; Han, T.F.; Gai, J.Y.; Yong, T.W.; Sun, X.; Wang, X.C.; Yang, F.; Liu, J.; Shu, K.; Liu, W.G. Maize-soybean strip intercropping: Achieved a balance between high productivity and sustainability. J. Integr. Agric. 2018, 17, 747–754. [Google Scholar] [CrossRef]
- Maitra, S.; Hossain, A.; Brestic, M.; Skalicky, M.; Sairam, M. Intercropping system-A low input agricultural strategy for food and environmental security. Agronomy 2021, 11, 343. [Google Scholar] [CrossRef]
- Xiao, Y.B.; Li, L.; Zhang, F.S. Effect of root contact on interspecific competition and N transfer between wheat and fababean using direct and indirect N-15 techniques. Plant. Soil. 2004, 262, 45–54. [Google Scholar] [CrossRef]
- Zhang, F.S.; Li, L. Using competitive and facilitative interactions in intercropping systems enhances crop productivity and nutrient-use efficiency. Plant. Soil. 2003, 248, 305–312. [Google Scholar] [CrossRef]
- Fisher, R.F.; Long, S.R. Rhizobium-plant signal exchange. Nature 1992, 357, 655–660. [Google Scholar] [CrossRef]
- Liu, Z.J.; Yang, J.; Long, Y.P.; Zhang, C.; Wang, D.P.; Zhang, X.W.; Dong, W.T.; Zhao, L.; Liu, C.W.; Zhai, J.X.; Wang, E.T. Single-nucleus transcriptomes reveal spatiotemporal symbiotic perception and early response in Medicago. Nat. Plants. 2023, 9, 1734–1748. [Google Scholar] [CrossRef]
- Nasto, M.K.; Alvarez-Clare, S.; Lekberg, Y.; Sullivan, B.W.; Townsend, A.R.; Cleveland, C.C.; Johnson, N. Interactions among nitrogen fixation and soil phosphorus acquisition strategies in lowland tropical rain forests. Ecol. Lett. 2015, 17, 1282–1289. [Google Scholar]
- Li, X.; Sun, M.; Zhang, H.; Xu, N.; Sun, G. Use of mulberry-soybean intercropping in salt-alkali soil impacts the diversity of the soil bacterial community. Microb. Biotechnol. 2016, 9, 293–304. [Google Scholar] [CrossRef] [PubMed]
- Hussain, S.; Pang, T.; Iqbal, N.; Shafiq, I.; Yang, W.Y. Acclimation strategy and plasticity of different soybean genotypes in intercropping. Funct. Plant. Biol. 2020, 47, 592–610. [Google Scholar] [CrossRef] [PubMed]
- Yao, X.D.; Zhou, H.L.; Zhu, Q.; Li, C.H.; Zhang, H.J.; Wu, J.J.; Xie, F.T. Photosynthetic response of soybean leaf to wide light-fluctuation in maize-soybean intercropping system. Front. Plant. Sci. 2017, 8, 1695. [Google Scholar] [CrossRef] [PubMed]
- Hussain, S.; Shafiq, I.; Chattha, M.S.; Mumtaz, M.; Brestic, M.; Rastogi, A.S.; Chen, G.P.; Allakhverdiev, S.I.; Liu, W.G.; Yang, W.y. Effect of Ti treatments on growth, photosynthesis, phosphorus uptake and yield of soybean [Glycine max (L.) Merr.] in maize-soybean relay strip intercropping. Environ. Exp. Bot. 2021, 187, 104476. [Google Scholar]
- Fan, Y.F.; Chen, J.X.; Cheng, Y.J.; Raza, M.A.; Wu, X.L.; Wan, Z.L.; Liu, Q.L.; Wang, R.; Wan, X.C.; Yong, T.W.; Liu, W.G.; Liu, J.; Du, J.B.; Shu, K.; Yang, W.Y.; Yang, F. Effect of shading and light recovery on the growth, leaf structure, and photosynthetic performance of soybean in a maize-soybean relay-strip intercropping system. PLoS. One. 2018, 13, e0198159. [Google Scholar]
- Yang, F.; Huang, S.; Gao, R.C.; Liu, W.G.; Yong, T.W.; Wang, X.C.; Wu, X.L.; Yang, W.Y. Growth of soybean seedlings in relay strip intercropping systems in relation to light quantity and red:far-red ratio. Field. Crops. Res. 2014, 155, 245–253. [Google Scholar]
- Yang, F.; Liu, Q.L.; Cheng, Y.J.; Feng, L.Y.; Wu, X.L.; Fan, Y.F.; Raza, M.A.; Wang, X.C.; Yong, T.W.; Liu, W.G.; Liu, J.; Du, J.B.; Shu, K.; Yang, W.Y. Low red/far-red ratio as a signal promotes carbon assimilation of soybean seedlings by increasing the photosynthetic capacity. BMC. Plant. Biol. 2020, 20, 245–253. [Google Scholar]
- Hussain, S.; Liu, T.; Iqbal, N.; Brestic, M.; Pang, T.; Mumtaz, M.; Shafiq, I.; Li, S.; Wang, L.; Gao, Y.; Khan, A.; Ahmad, I.; Allakhverdiev, S.I.; Liu, W.; Yang, W. Effects of lignin, cellulose, hemicellulose, sucrose and monosaccharide carbohydrates on soybean physical stem strength and yield in intercropping. Photochem. Photobiol. Sci. 2020, 19, 462–472. [Google Scholar]
- Liu, W.G.; Deng, Y.C.; Hussain, S.; Zou, J.L.; Yuan, J.; Luo, L.; Yang, C.Y.; Yuan, X.Q.; Yang, W.Y. Relationship between cellulose accumulation and lodging resistance in the stem of relay intercropped soybean [Glycine max (L.) Merr.]. Field. Crops. Res. 2016, 196, 261–267. [Google Scholar]
- Cheng, B.; Wang, L.; Liu, R.J.; Wang, W.B.; Yu, R.W.; Zhou, T.; Ahmad, I.; Raza, A.; Jiang, S.J.; Xu, M.; Liu, C.Y.; Yu, L.; Wang, W.Y.; Jing, S.Z.; Liu, W.G.; Yang, W.Y. Shade-tolerant soybean reduces yield loss by regulating its canopy structure and stem characteristics in the maize-soybean strip intercropping system. Front. Plant. Sci. 2022, 13, 848893. [Google Scholar] [CrossRef] [PubMed]
- Deng, H.L.; Pan, X.F.; Lan, X.M.; Wang, Q.L.; Xiao, R. Rational maize-soybean strip intercropping planting system improves interspecific relationships and increases crop yield and income in the China Hexi Oasis Irrigation Area. Agronomy 2024, 14, 1220. [Google Scholar] [CrossRef]
- Fehr, W.R. Stage of development descriptions for soybeans Glycine Max (L.) Merrill. Crop, Sci. 1971, 11, 775–947. [Google Scholar] [CrossRef]
- Lu, R.K. Soil and agro-chemistry analytical methods, Agricutural Science and Technology Press: Beijing, China,1999.
- Feng, L.Y.; Raza, M.A.; Li, Z.C.; Chen, Y.K.; Khalid, M.H.B.; Du, J.B.; Liu, W.G.; Wu, X.L.; Song, C.; Yu, L. The Influence of Light Intensity and Leaf Movement on Photosynthesis Characteristics and Carbon Balance of Soybean. Front. Plant. Sci. 2019, 9, 1952. [Google Scholar] [CrossRef] [PubMed]
- Jenkinson, D.S. Chemical tests for potentially available nitrogen in soil. J. Sci. Food. Agric. 1968, 19, 160–168. [Google Scholar] [CrossRef]
- Ledgard, S.F.; Freney, J.R.; Simpson, J.R. Assessing nitrogen transfer from legumes to associated grasses. Soil. Boil. Biochem. 1985, 17, 575–577. [Google Scholar] [CrossRef]
- Pirhofer-Walzl, K.; Rasmussen, J.; Høgh-Jensen, H.; Eriksen, J.; Søegaard, K.; Rasmussen, J. Nitrogen transfer from forage legumes to nine neighbouring plants in a multi-species grassland. Plant. Soil. 2012, 350, 71–84. [Google Scholar] [CrossRef]
- Luo, S.S.; Yu, L.L.; Liu, Y.; Zhang, Y.; Yang, W.T.; Li, Z.X.; Wang, J.W. Effects of reduced nitrogen input on productivity and N2O emissions in a sugarcane/soybean intercropping system. Eur. J. Agron. 2016, 81, 78–85. [Google Scholar] [CrossRef]
- Albrecht, S.L.; Bennett, J.M.; Boote, K.J. Relationship of nitrogenase activity to plant water stress in field-grown soybeans. Field. Crops. Res. 1984, 8, 61–71. [Google Scholar] [CrossRef]
- Wang, T.; Guo, J.; Peng, Y.Q.; Lyu, X.G.; Liu, B.; Sun, S.Y.; Wang, X.L. Light-induced mobile factors from shoots regulate rhizobium-triggered soybean root nodulation. Science 2021, 374, 65–71. [Google Scholar] [CrossRef]
- Lu, M.Y.; Cheng, Z.Y.; Zhang, X.M.; Huang, P.H.; Fan, C.M.; Yu, G.L.; Chen, F.L.; Xu, K.; Chen, Q.S.; Miao, Y.C.; Han, Y.Z.; Feng, X.Z.; Liu, L.Y.; Fu, Y.F. Spatial divergence of PHR-PHT1 modules maintains phosphorus homeostasis in soybean nodules. Plant. Physiol. 2020, 184, 236–250. [Google Scholar] [PubMed]
- Zhang, M.M.; Wang, N.; Zhang, J.Y.; Hu, Y.B.; Cai, D.J.; Guo, J.H.; Wu, D.; Sun, G.Y. Soil physicochemical properties and the rhizosphere soil fungal community in a mulberry/alfalfa intercropping system. Forests 2019, 10, 167. [Google Scholar] [CrossRef]
- Zhang, S.N.; Zhang, Y.Y.; Li, K.N.; Yan, M.; Zhang, J.F.; Yu, M.; Tang, S.; Wang, L.Y.; Qu, H.Y.; Luo, L. Nitrogen mediates flowering time and nitrogen use efficiency via floral regulators in rice. Curr. Biol. 2021, 31, 671–683.e675. [Google Scholar] [PubMed]
- Liu, Y.; Yin, X.; Xiao, J.; Tang, L.; Zheng, Y. Interactive influences of intercropping by nitrogen on flavonoid exudation and nodulation in faba bean. Sci. Rep. 2019, 9, 4818. [Google Scholar] [CrossRef] [PubMed]
- Subramanian, S.; Stacey, G.; Yu, O. Distinct, crucial roles of flavonoids during legume nodulation. Trends. Plant. Sci. 2007, 12, 282–285. [Google Scholar]
- Li, L.; Li, S.M.; Sun, J.H.; Zhou, L.L.; Bao, X.G.; Zhang, H.G.; Zhang, F.S. Diversity enhances agricultural productivity via rhizosphere phosphorus facilitation on phosphorus-deficient soils. P. Natl. Acad. Sci. U.S.A. 2007, 104, 11192–11196. [Google Scholar]
- Carranca, C.; Varennes, A.D.; Rolston, D. Biological nitrogen fixation by fababean, pea and chickpea, under field conditions, estimated by the 15N isotope dilution technique. Eur. J. Agron. 1999, 10, 49–56. [Google Scholar] [CrossRef]
- Shen, L.; Wang, X.Y.; Liu, T.T.; Wei, W.; Zhang, S.; Keyhani, A.B.; Li, L.; Zhang, W. Border row effects on the distribution of root and soil resources in maize–soybean strip intercropping systems. Soil Tillage Research 2023, 233, 105812. [Google Scholar]
- Zhou, H.L.; Zhao, Q.; He, R.; Zhang, W.; Zhang, H.J.; Wang, H.Y.; Ao, X.; Yao, X.D.; Xie, F.T. Rapid effect of enriched nitrogen on soybean nitrogen uptake, distribution, and assimilation during early flowering stage. J. Soil. Sci. Plant. Nut. 2022, 22, 3798–3810. [Google Scholar]
- Liao, H.S.; Chung, Y.H.; Ming, H.H. Glutamate: A multifunctional amino acid in plants. Plant. Sci., 318.
- Forde, B.G.; Lea, P.J. Glutamate in plants: Metabolism, regulation, and signalling. J. Exp. Bot. 2007, 58, 2339–2358. [Google Scholar]
- Zhao, X.H.; Dong, Q.Q.; Han, Y.; Zhang, K.Z.; Shi, X.L.; Yang, X.; Yuan, Y.; Zhou, D.Y.; Wang, K.; Wang, X.G.; Jiang, C.J.; Liu, X.B.; Zhang, H.; Zhang, Z.M.; Yu, H.Q. Maize/peanut intercropping improves nutrient uptake of side-row maize and system microbial community diversity. BMC. Microbiol. 2022, 22, 14. [Google Scholar] [CrossRef] [PubMed]
- Zhang, L.Q.; Feng, Y.D.; Zhao, Z.H.; Bao, Y.B.; Cui, Z.G.; Wang, H.Y.; Li, Q.Z.; Cui, J.H. Macrogenomics-based analysis of the effects of intercropped soybean photosynthetic characteristics and nitrogen-assimilating enzyme activities on yield at different nitrogen levels. Microorganisms 2024, 12, 1220. [Google Scholar] [CrossRef] [PubMed]
- Cui, J.H.; Xia, X.Y.; Zhao, Y.; Liu, M.; Xiao, N.Y.; Guo, S.; Lu, Y.W.; Li, J.X.; Wei, Z.M.; Gao, F.C.; Yang, P.; Li, S.G. Interpreting variety-location-fertilizer interactions to enhance foxtail millet productivity in northern China. Agronomy 2022, 12, 2216. [Google Scholar] [CrossRef]
Figure 1.
This is a figure. Schemes follow the same formatting. Effects of intercropping forage mulberry on soybean photosynthetic parameters at the blooming stage. a: chlorophyll content, b: net photosynthetic rate (Pn), c: intercellular CO2 concentration (Ci), d: transpiration rate (Tr) and e: stomatal conductance (Gs). Sole-cropping without application of nitrogen (SN0); intercropping with forage mulberry and without application of nitrogen (IN0); ns indicates P > 0.05, *indicates P < 0.05, and **indicates P < 0.01.
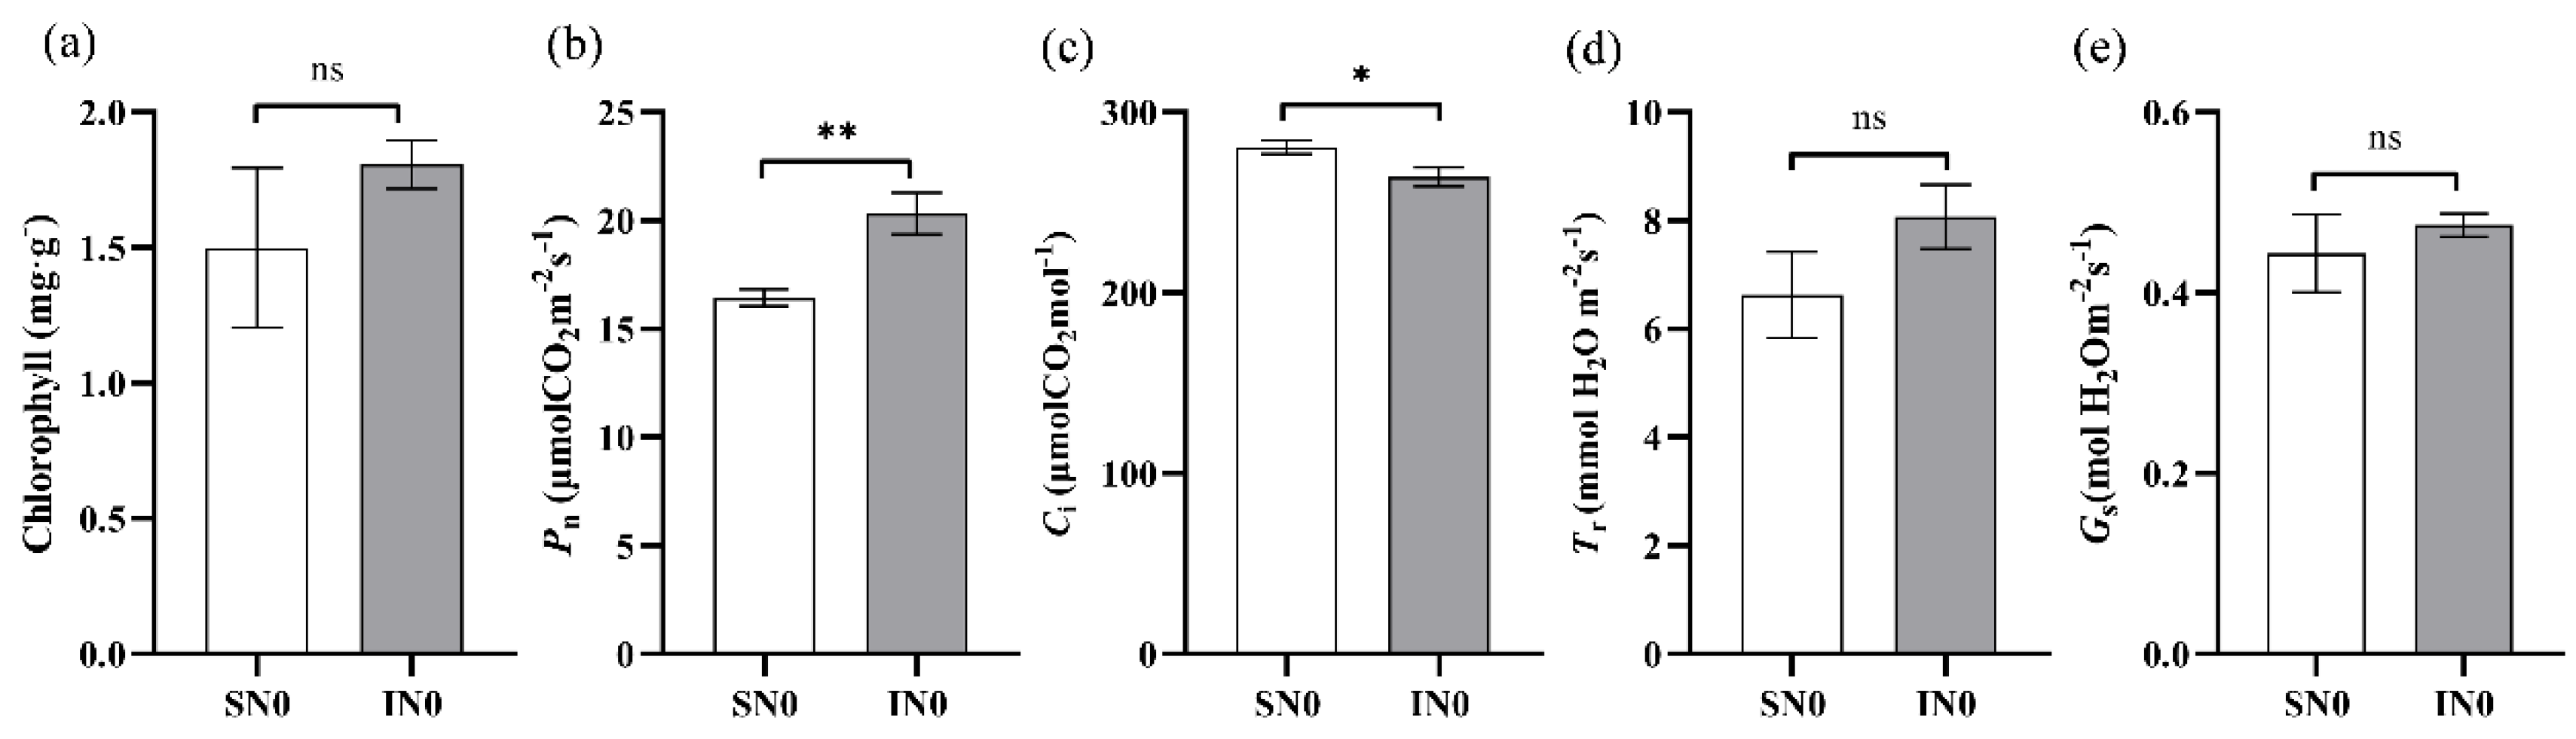
Figure 2.
Effects of intercropping forage mulberry on soybean leaf nitrogen metabolism at the blooming stage. a: ammonia assimilation in leaves, b: Nitrogenase activity, c: NH4+-N content, d: glutamine synthetase activity (GS), e: glutamate synthase activity (GOGAT). Sole-cropping without application of nitrogen fertilizer (SN0); intercropping with forage mulberry and without application of nitrogen fertilizer (IN0); **indicates P < 0.01, and ***indicates P < 0.01.
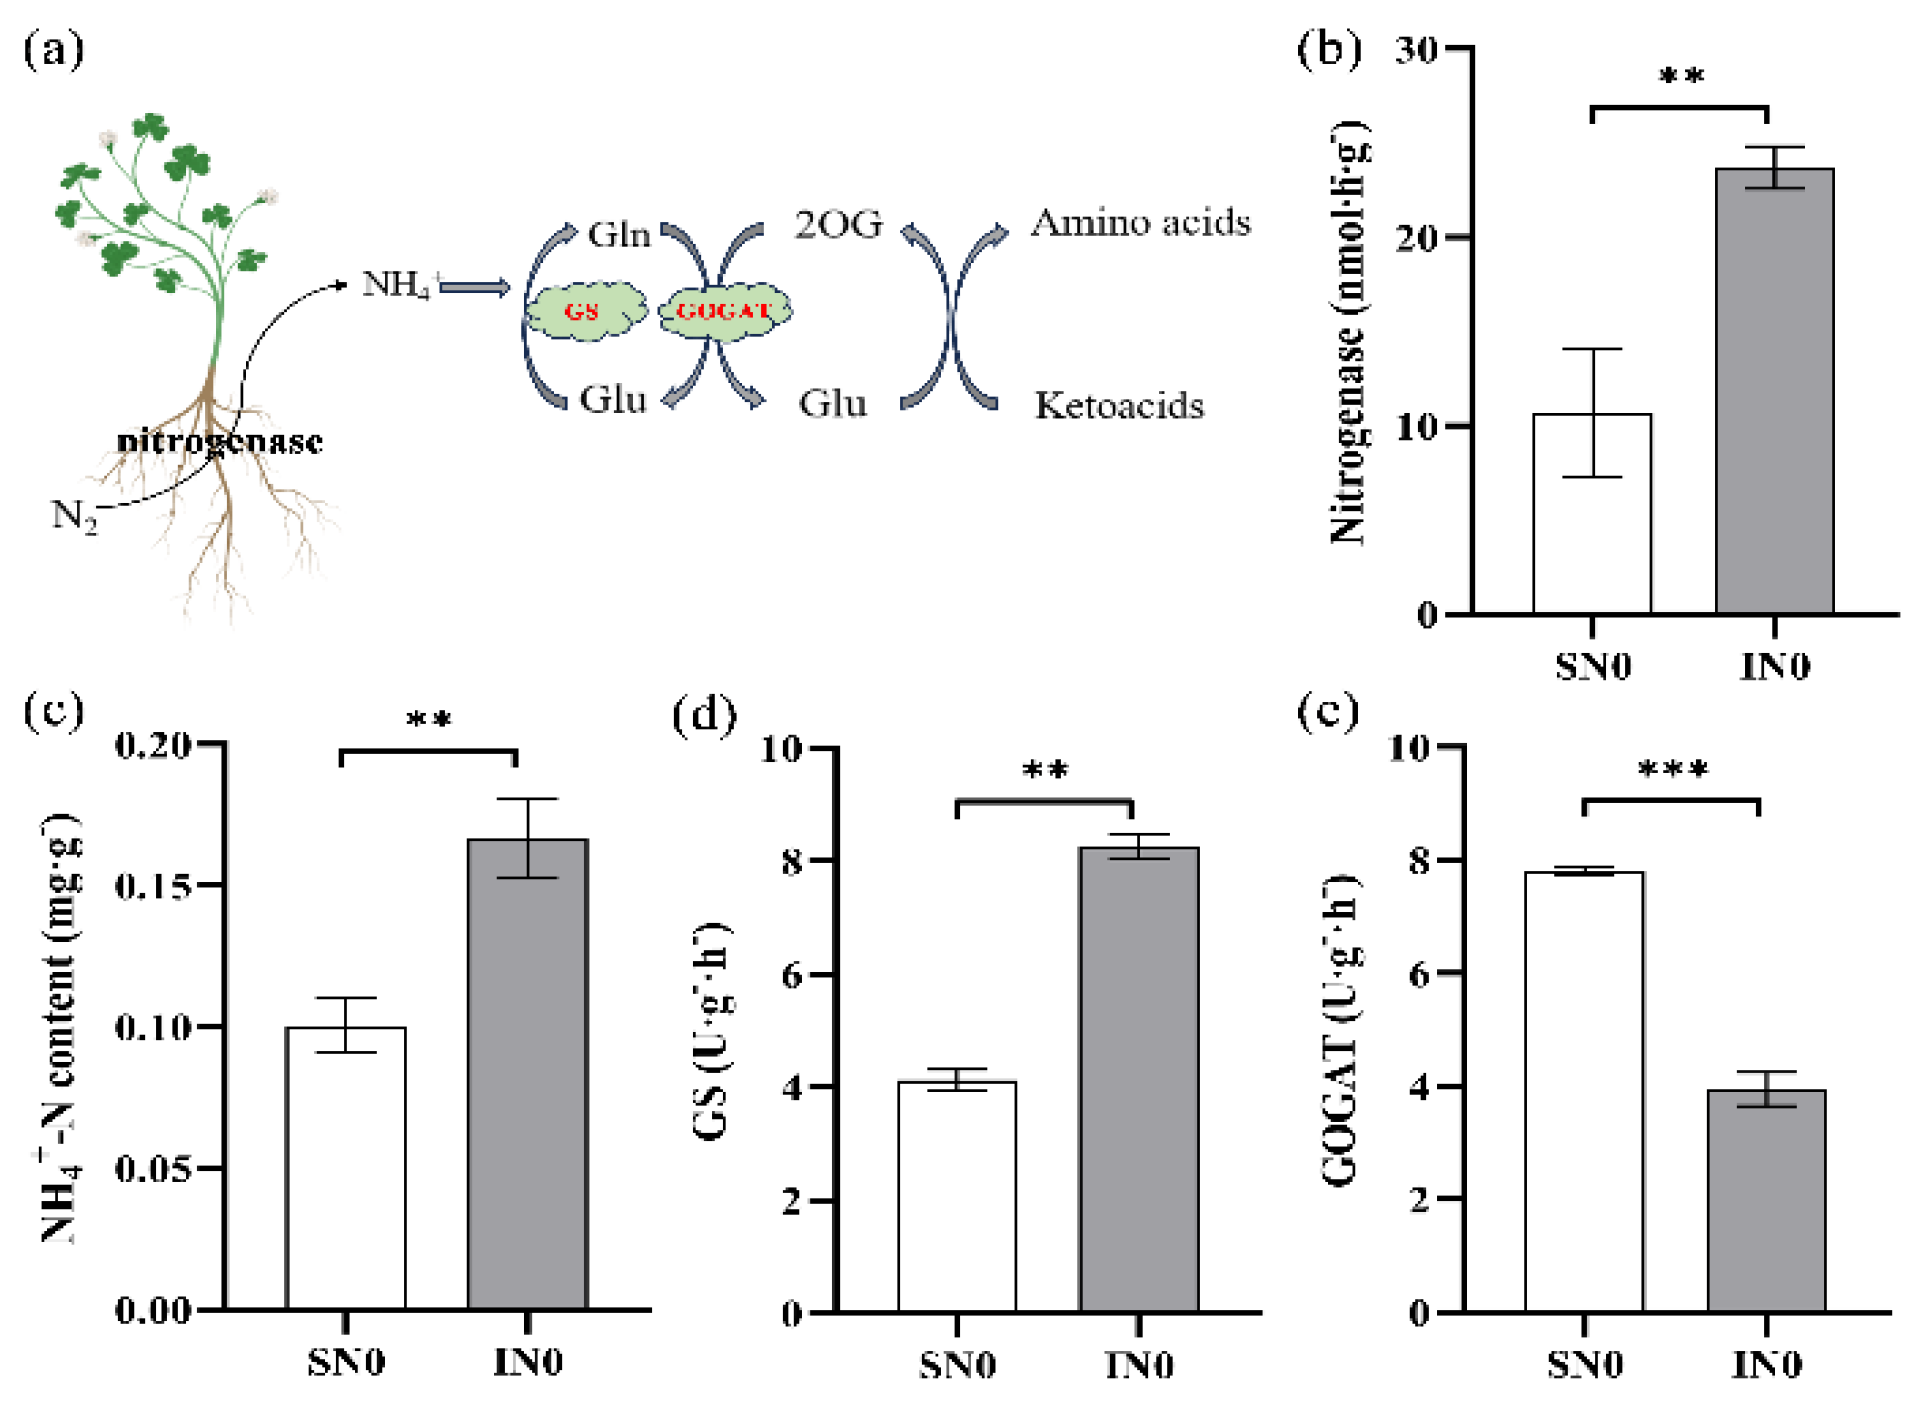
Figure 3.
Transcriptome analysis of soybean roots under different cultivation modes. a: Volcano plot of differentially expressed genes (DEGs), b: Gene ontology enrichment analysis of DEGs in different treatment groups. A1: response to stimulus, A2: response to stress, A3: phosphorus metabolic process, A4: response to endogenous stimulus, A5: response to hormone, A6: cellular response to chemical stimulus, A7: organic acid metabolic process, A8: oxoacid metabolic process, A9: response to organonitrogen compound, A10: response to nitrogen compound, B1: peroxisome, B2: microbody, B3: peroxisomal matrix, B4: microbody lumen, C1: oxidoreductase activity, C2: ion transmembrane transporter activity, C3: anion transmembrane transporter activity, C4: calcium ion binding, C5: organic acid transmembrane transporter activity, C6: carboxylic acid transmembrane transporter activity), c: KEGG enrichment analysis of DEGs in different treatment groups. R1SN0: Sole-cropping without nitrogen fertilizer at blooming stage; R1IN0: intercropping without nitrogen fertilizer at blooming stage.
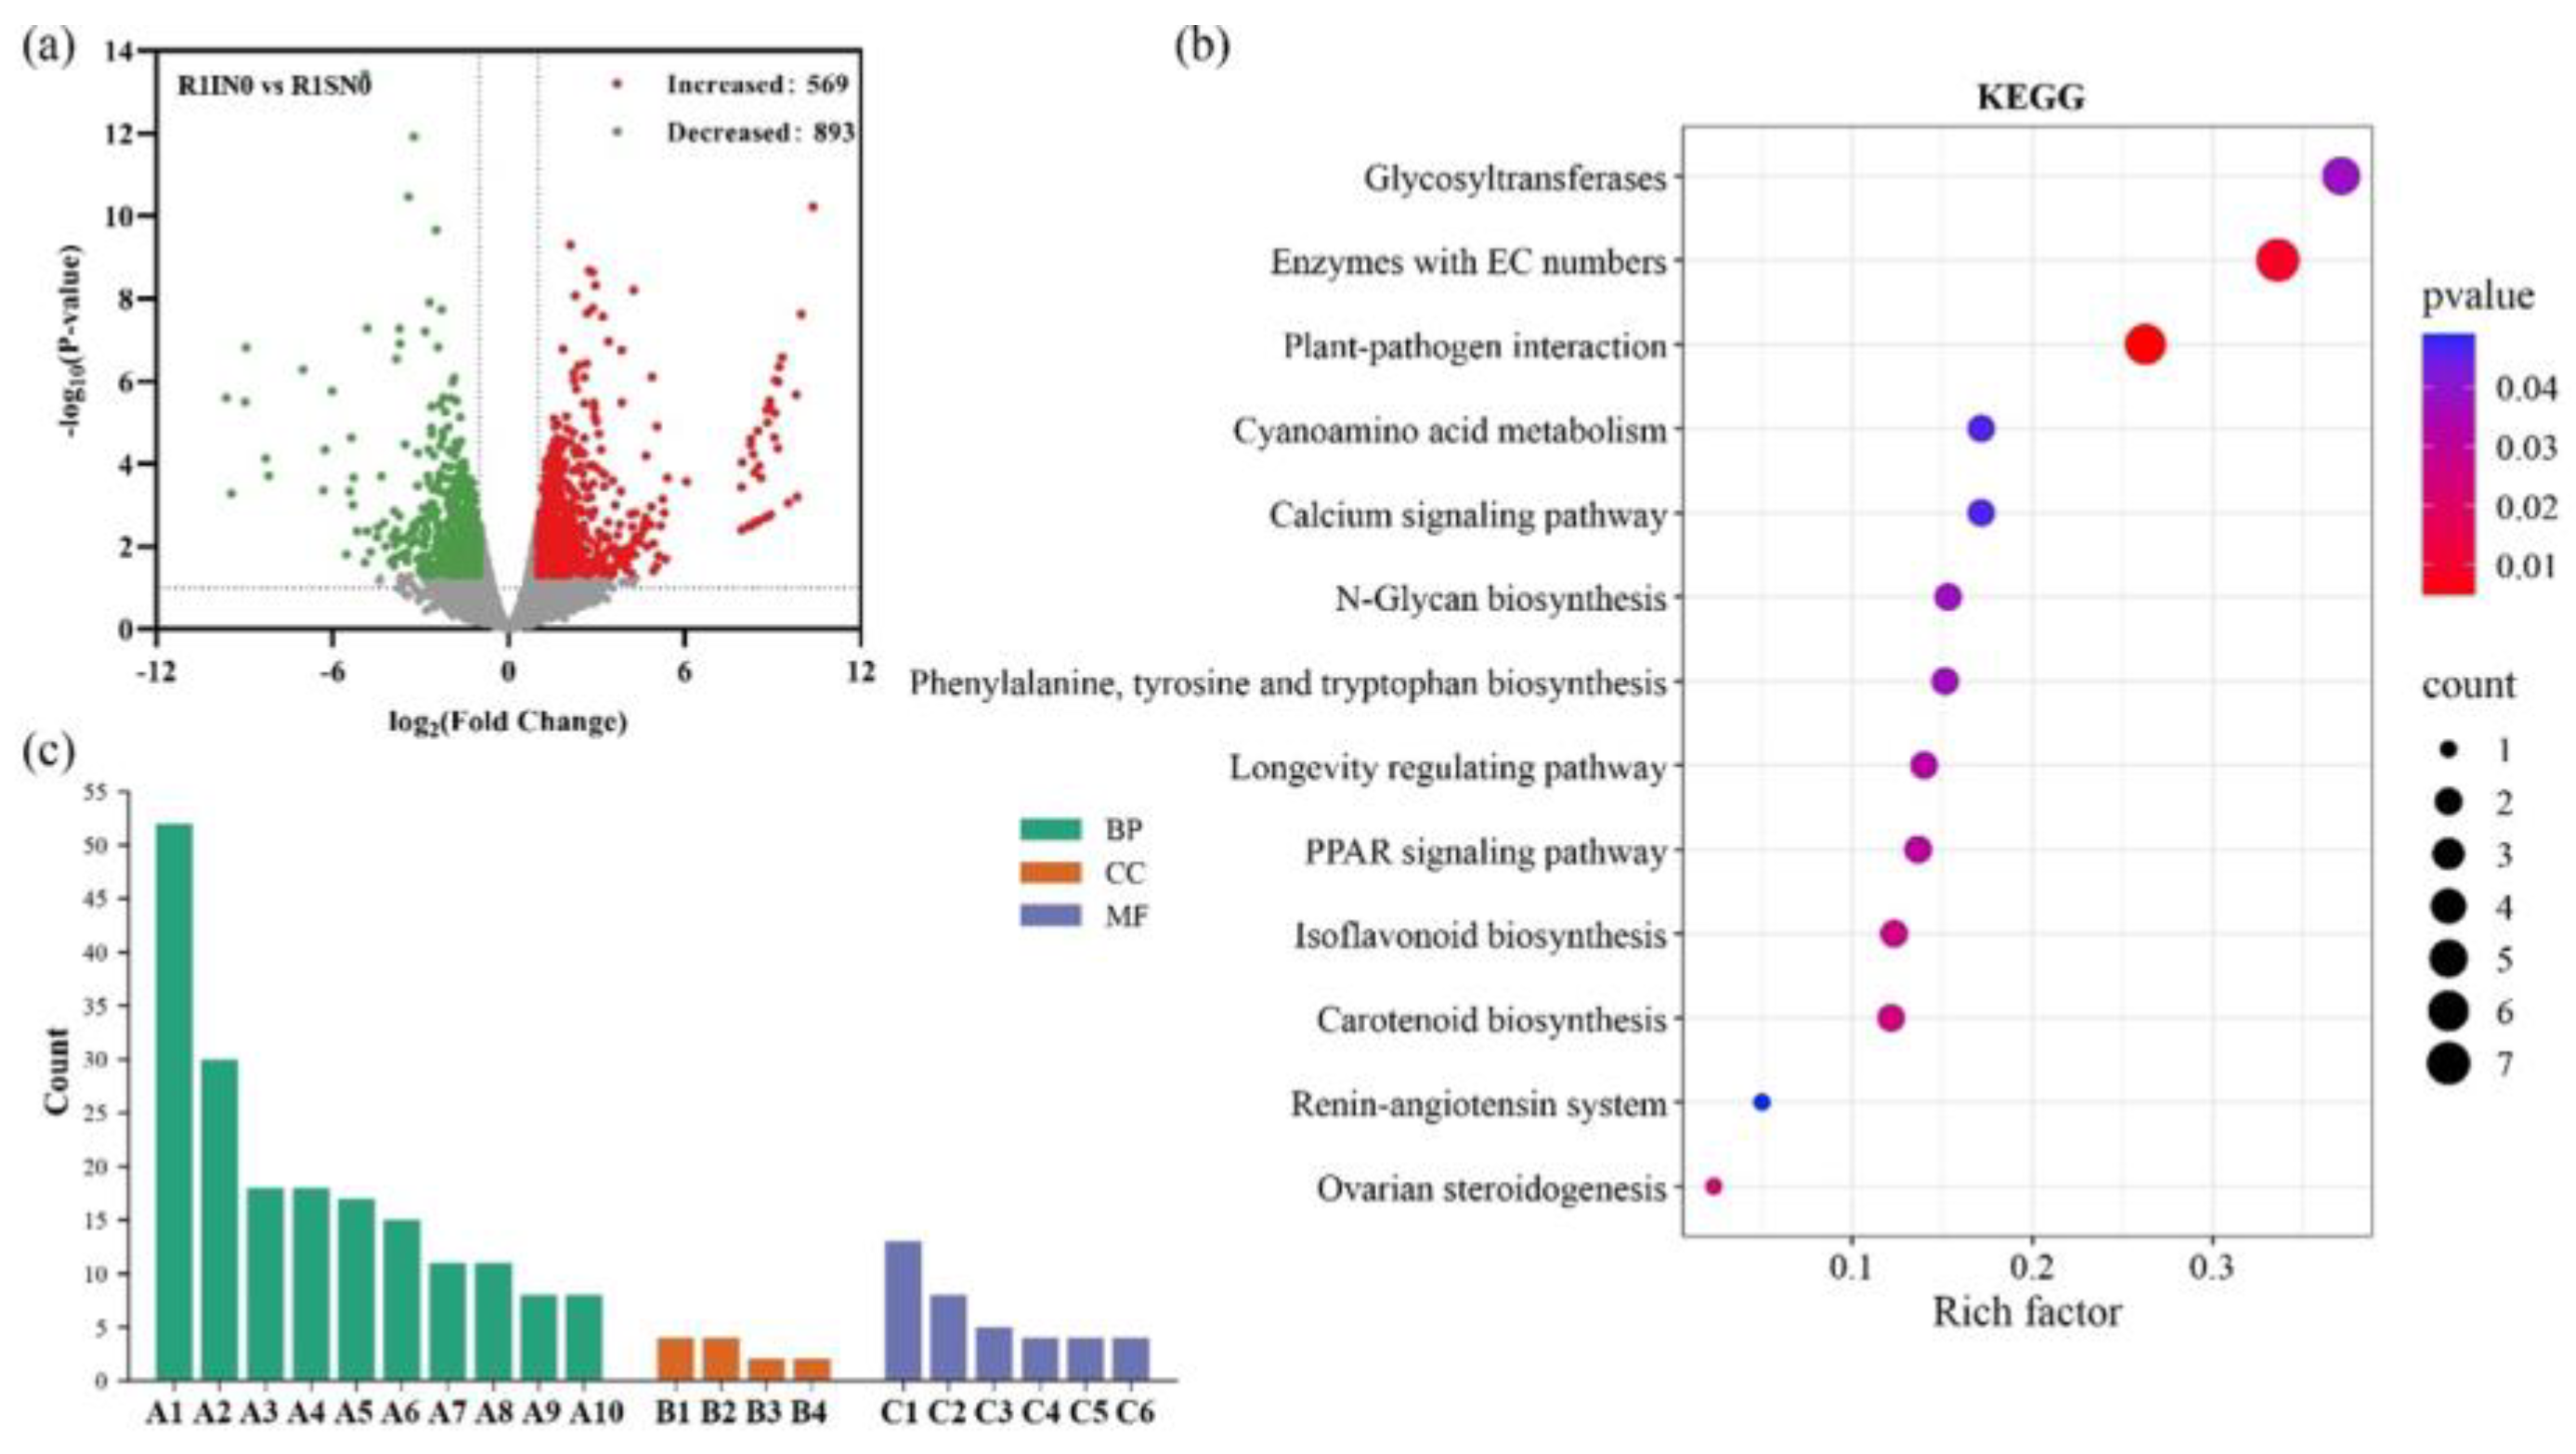
Figure 4.
Transcriptome changes in soybean isoflavone biosynthesis. Note: Heat map showing transcriptional changes in soybean roots. Different colours indicate the intensity of normalization according to the corresponding genes. Sole-cropping without application of nitrogen fertilizer (SN0); intercropping with forage mulberry and without application of nitrogen fertilizer (IN0); PAL: phenylalanine ammonia-lyase, C4H: cinnamate 4-hydroxylase, 4CL: 4-coumarate-CoA ligase, CHS: chalcone synthase, CHI: chalcone isomerase, FNS: flavone synthase, IFS: isoflavone synthase, HIDH: 2-hydroxyisoflavanone dehydratase; 4CL5: Glyma.13g372000, 4CL7: Glyma.10g197800, CHS11: Glyma.01g228700, CHI3: Glyma.06g143000, FNS: Glyma.12g067000, HIDH1: Glyma.02g134100, HIDH2: Glyma.01g239600, HIDH3: Glyma.10g250300.
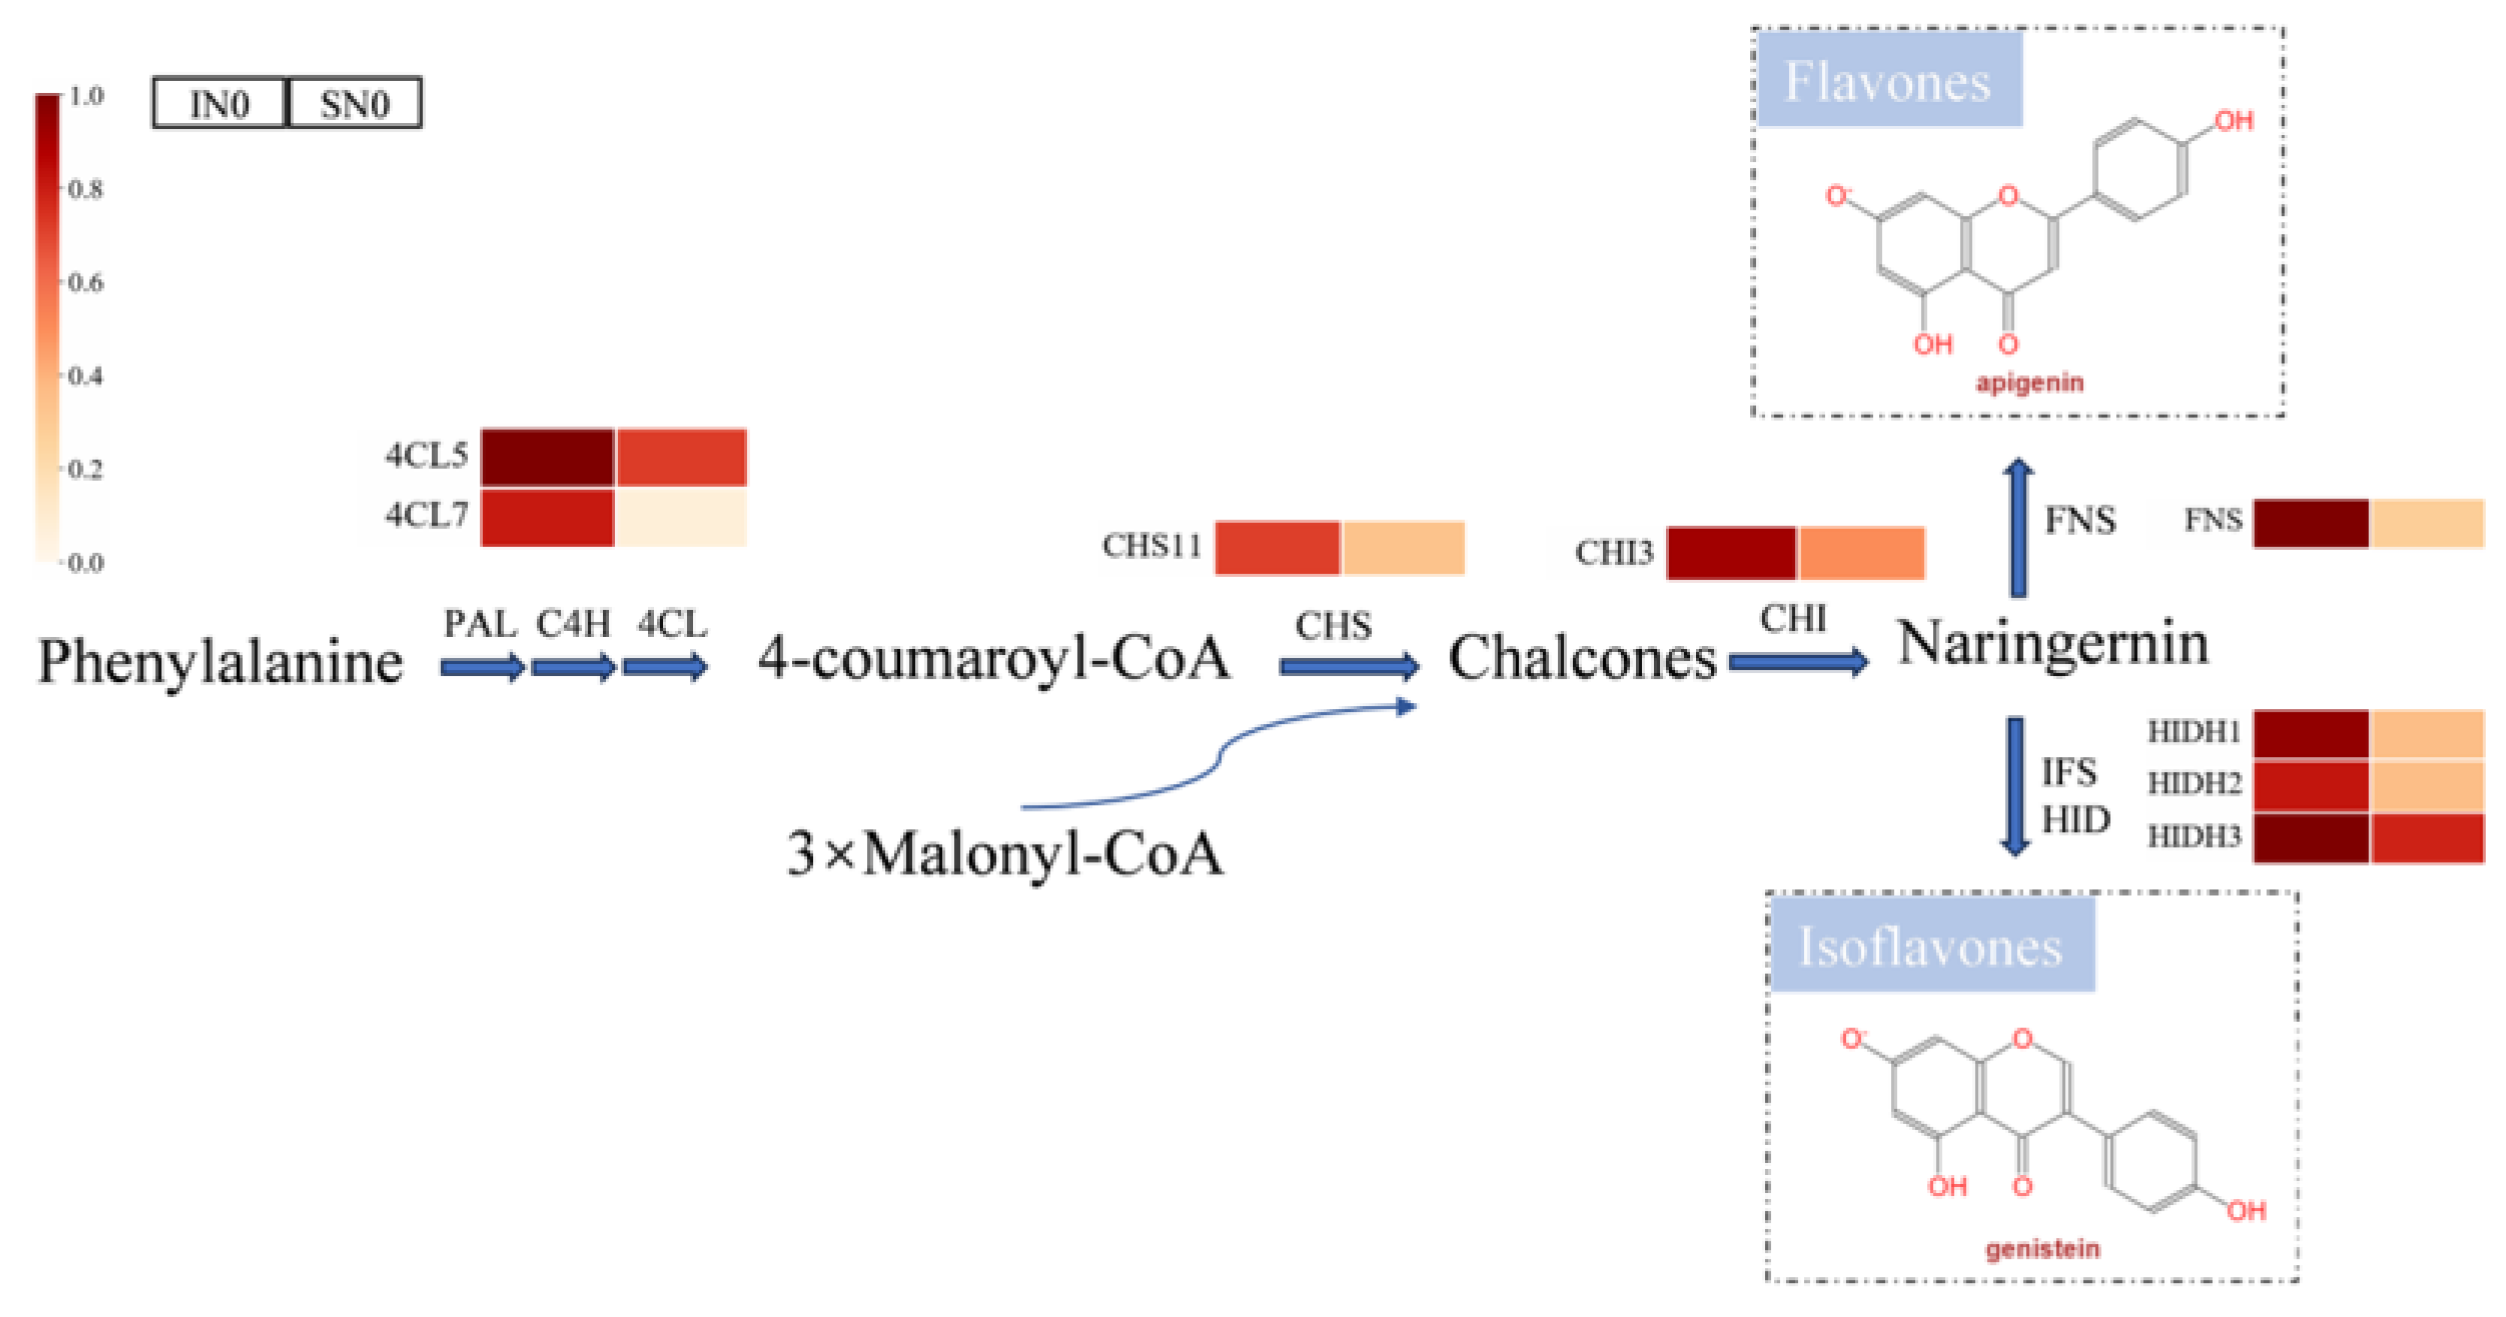
Figure 5.
Ordination plots of redundancy discriminatory analysis (RDA) showing the relationship between SN0 and IN0 treatments and the environmental variables. Note: ○: Sole-cropping without application of nitrogen fertilizer (SN0); □: Intercropping with forage mulberry and without application of nitrogen fertilizer (IN0). Num nod: nodule number per plant, FW nod: fresh weight of the nodules per plant, DW nod: dry weight of the nodules per plant, Fnase: nitrogenase activity, HN4+-N: ammonium nitrogen content, GS: glutamine synthetase activity, GOGAT: glutamate synthase activity, Height: plant height, Stem: stem diameter, LA: leaf area, FW/plant: fresh weight per plant, DW/plant: dry weight per plant, Chl: chlorophyll content, 4CL: 4-coumarate-CoA ligase, CHS: chalcone synthase, CHI: chalcone isomerase, HIDH: 2-hydroxyisoflavanone dehydratase, FNS: flavone synthase, Pn: net photosynthetic rate, Gs: stomatal conductance, Ci: intercellular CO2 concentration, Tr: transpiration rate, pH: pH value of soil, AN: available nitrogen content, AP: available phosphorus content, AK: available potassium content, SWC: soil water content, Grain/pl: Seed yield per plant, Pod num: pod number per plant, Seed num: seed number per plant, 100 SW: 100-seed weight, Yield: yield of soybean per hectare.
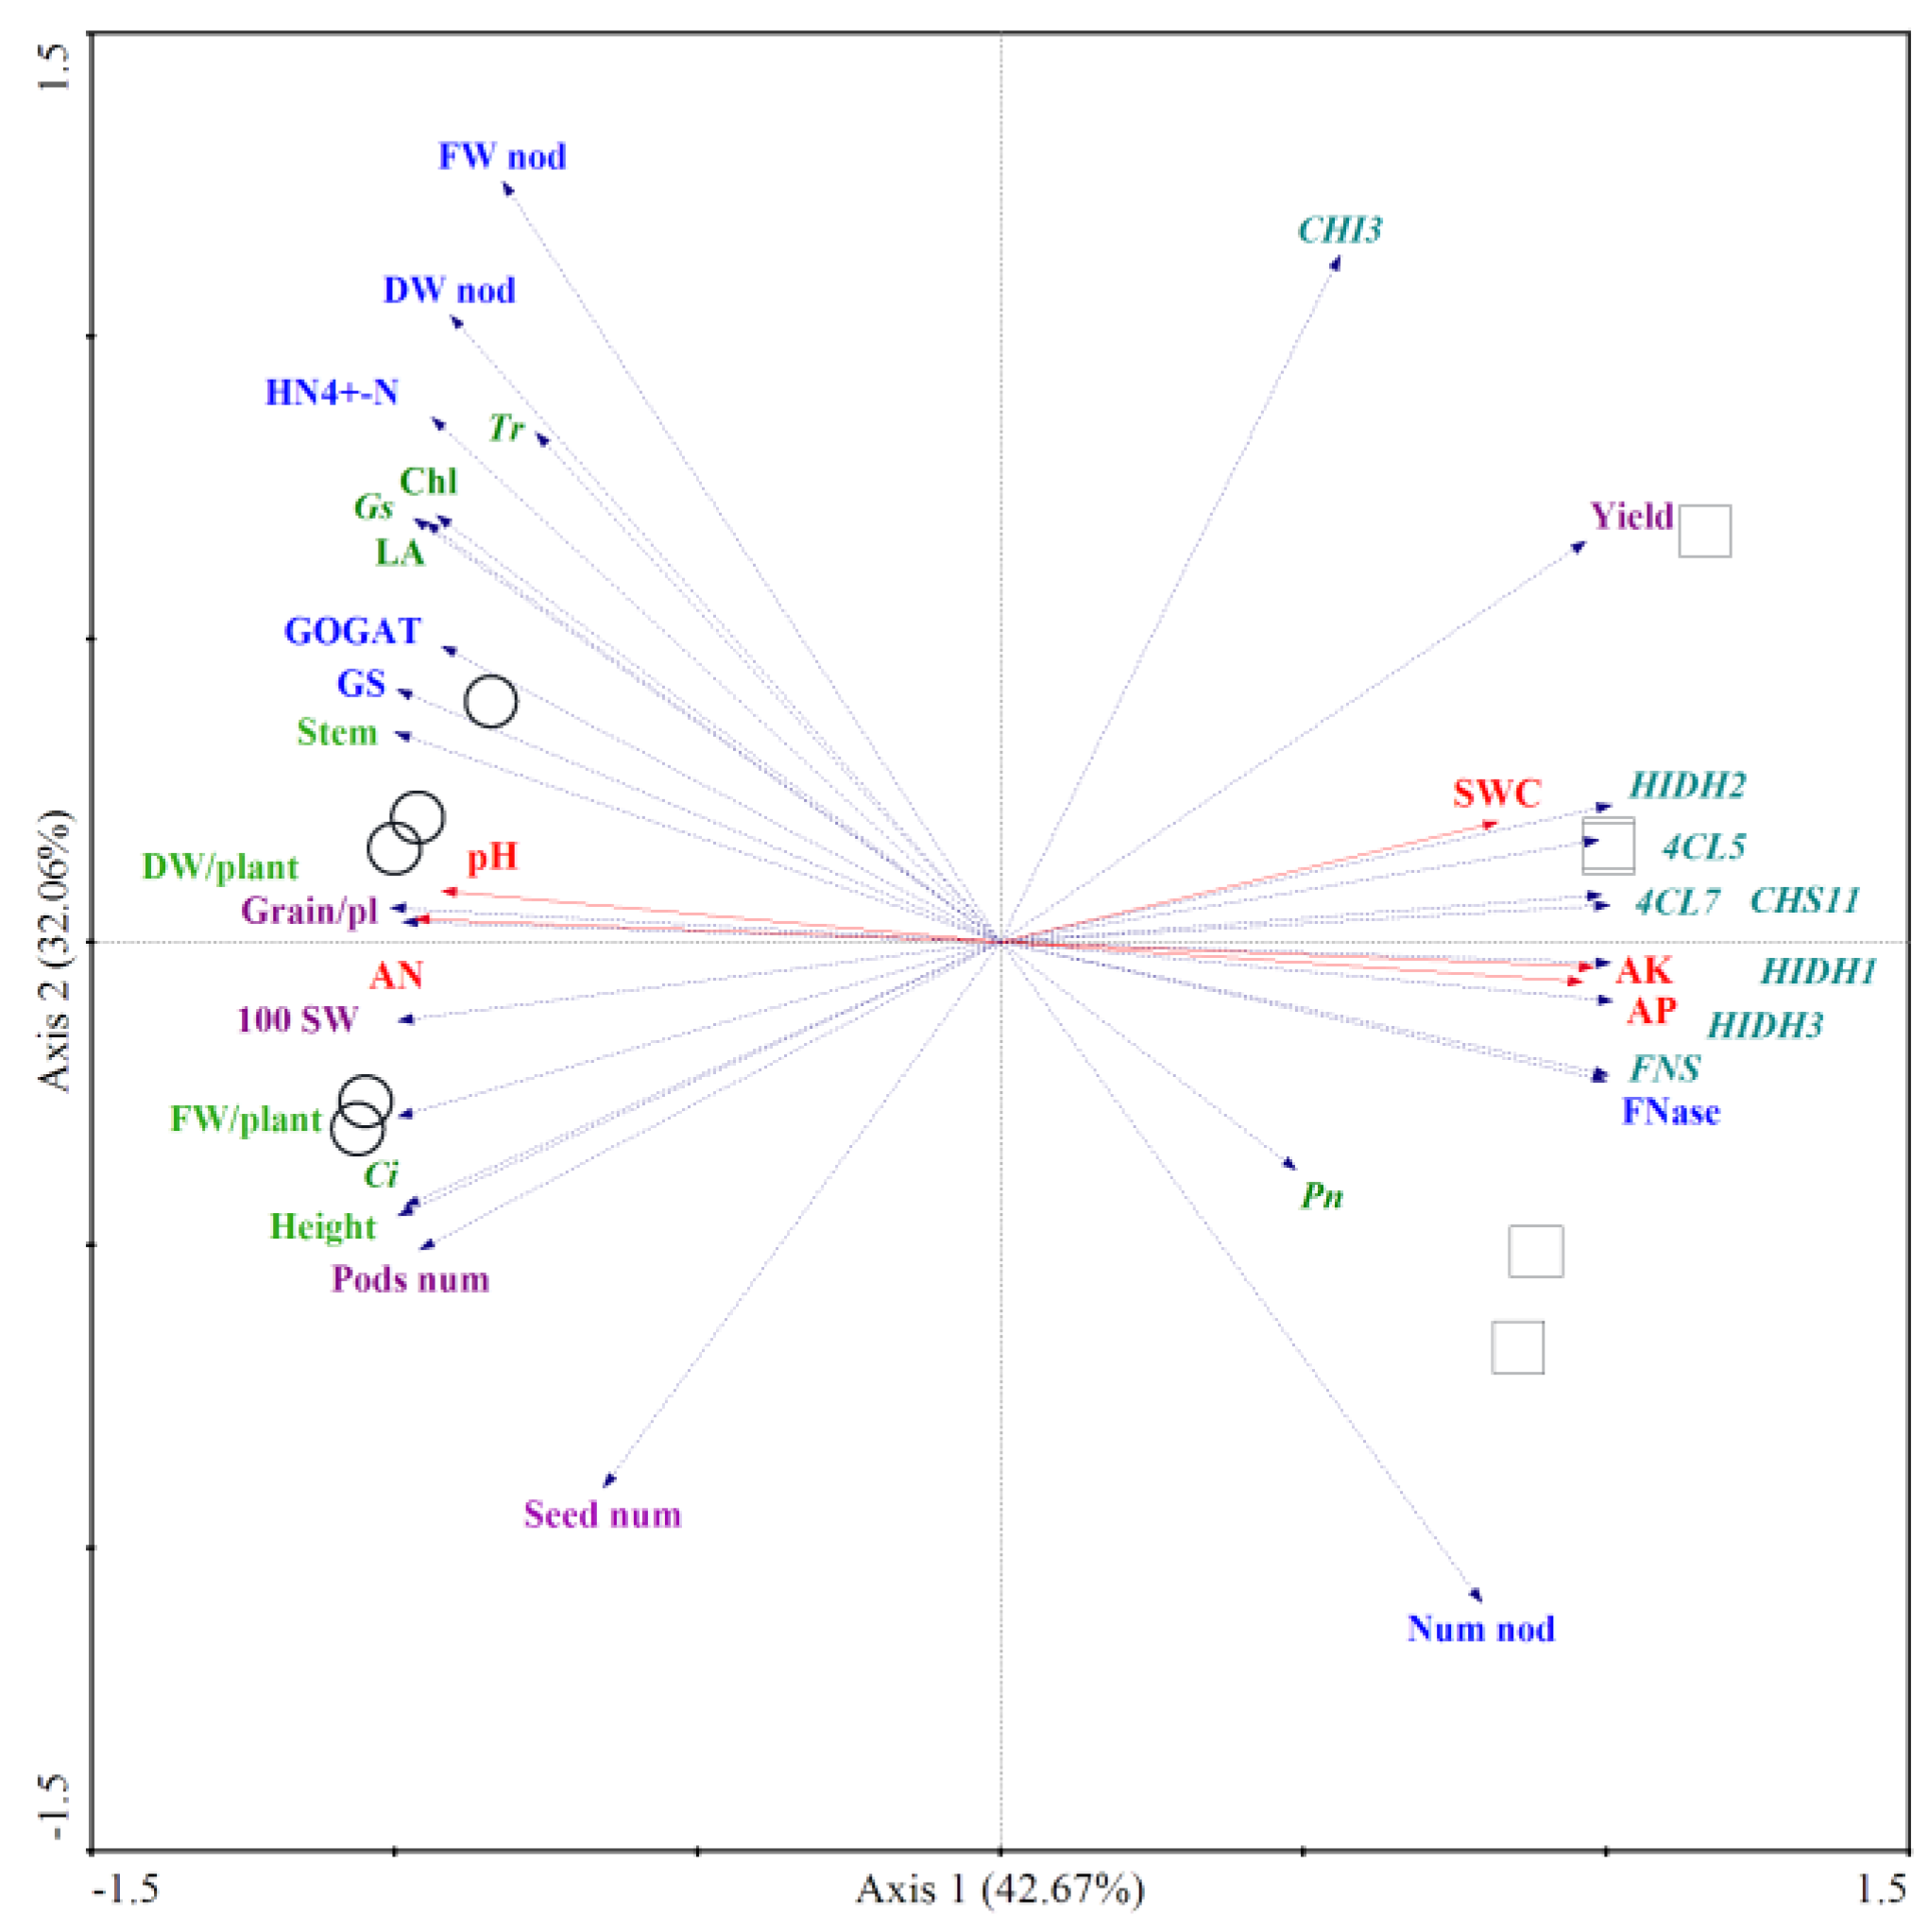
Figure 6.
Structural equation modelling showing the relationship among plant growth parameters, soybean yield, and soil physicochemical characteristics.
Figure 6.
Structural equation modelling showing the relationship among plant growth parameters, soybean yield, and soil physicochemical characteristics.
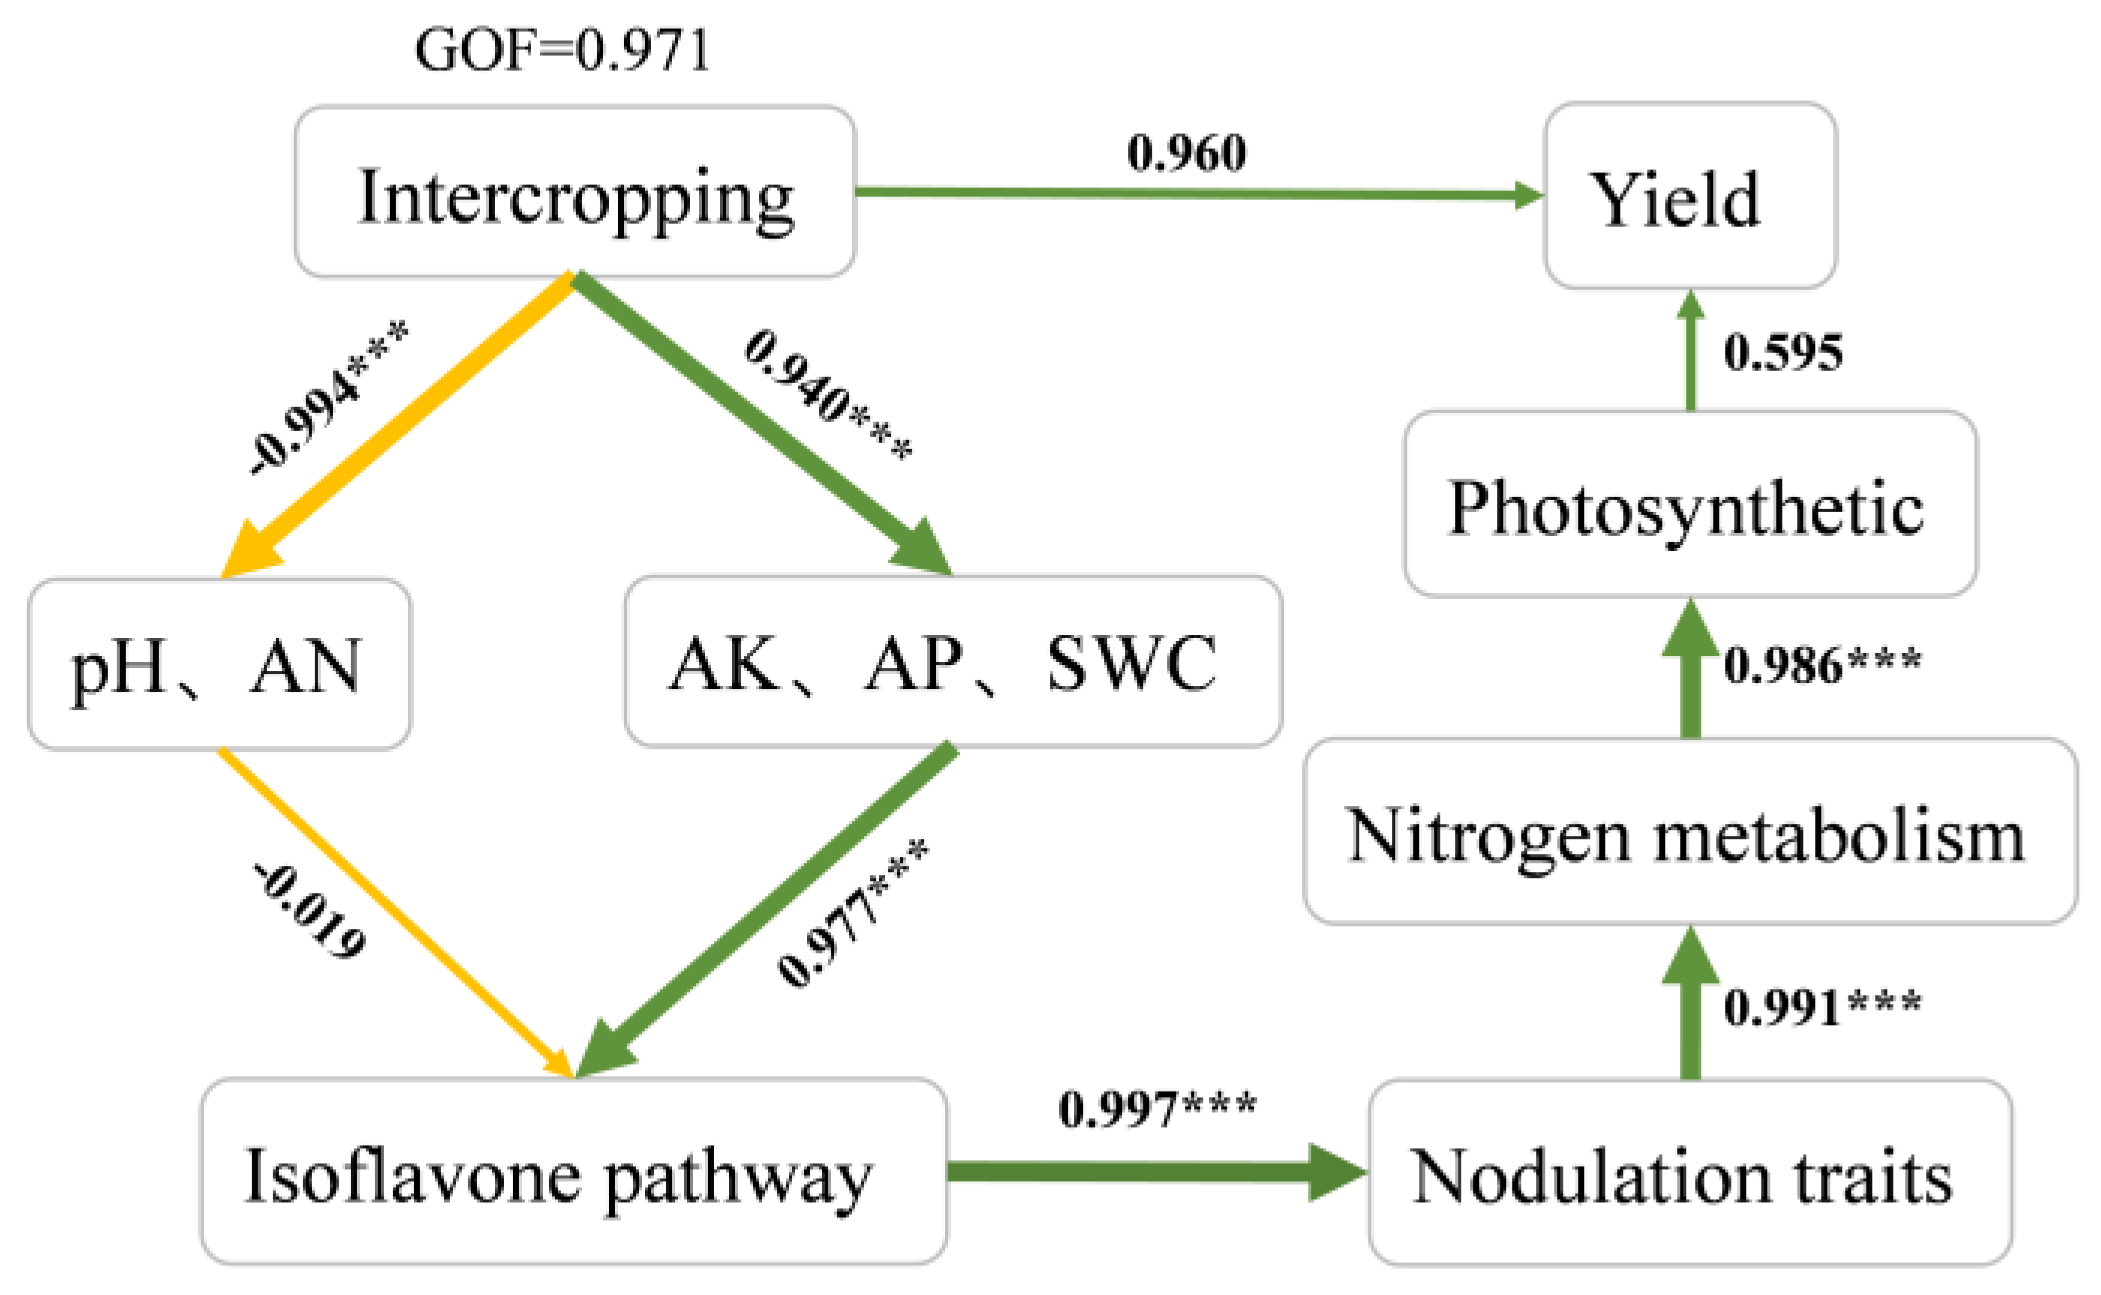

Table 1.
Effects of intercropping mulberry on the growth indices of soybean.
| Treatment |
Plant Height (cm) |
Stem Diameter (mm) |
Leaf Area (cm2) |
Fw of Plant (g/plant) |
DW of Plant (g/plant) |
|||||
| SN0 1 | IN0 2 | SN0 | IN0 | SN0 | IN0 | SN0 | IN0 | SN0 | IN0 | |
| 2021 | 60.50±0.35ab | 61.19±26.33a | 4.67±0.05a | 4.67±0.05a | 19.09±0.42b | 20.08±0.69a | 29.43±0.45c | 31.14±0.29a | 12.88±0.07b | 13.42±0.03a |
| 2022 | 60.56±0.30ab | 60.99±0.67a | 4.68±0.04a | 4.67±0.13a | 19.13±0.30b | 20.68±0.41a | 29.75±0.40b | 31.26±0.38a | 12.88±0.67b | 13.22±0.02a |
| 2023 | 60.12±0.15b | 61.17±0.14a | 4.69±0.03a | 4.66±0.05a | 19.11±0.39b | 20.22±0.80a | 29.78±0.14b | 31.16±0.18a | 12.80±0.90b | 13.29±0.07a |
| Source of variation | F value from two-way ANOVA test | |||||||||
| Pattern | 1.445ns | 3.808ns | 50.075ns | 255.289* | 62.405ns | |||||
| Year | 0.924ns | 1.533ns | 1.268ns | 2.27ns | 1.362ns | |||||
| Pattern×Year | 0.326ns | 0.186ns | 0.776ns | 0.639ns | 1.03ns | |||||
1 Sole-cropping without application of nitrogen fertilizer (SN0); 2 Intercropping with forage mulberry without application of nitrogen fertilizer (IN0); ns indicates P > 0.05, *indicates P < 0.05.
Table 2.
Effects of intercropping mulberry on the yield components of soybean.
| Treatment | Number of pods per plant | Number of seeds per plant |
Grain yield per plant (g) |
100-seeds of weight (g) |
Yield (kg/hm2) |
|||||
| SN01 | IN02 | SN0 | IN0 | SN0 | IN0 | SN0 | IN0 | SN0 | IN0 | |
| 2021 | 58.41±1.14bc | 61.60±0.55a | 150.4±2.97c | 169.4±2.07a | 10.58±0.18b | 11.37±0.55a | 29.43±0.45c | 31.14±0.29a | 2160±56.5a | 2342±88.1b |
| 2022 | 59.20±0.84b | 61.80±0.67a | 154.8±4.76b | 172.4±2.19a | 10.58±0.16b | 11.25±0.27a | 29.75±0.40b | 31.26±0.38a | 2180±20.9a | 2347±105.3b |
| 2023 | 58.20±0.84b | 61.60±0.14a | 155.8±5.22bc | 169.6±2.91a | 10.71±0.15b | 11.55±0.22a | 29.78±0.14b | 31.16±0.18a | 2131±65.9a | 2363±87.1b |
| Source of variation | F value from two-way ANOVA test | |||||||||
| Pattern | 162.769ns | 90.249ns | 227.532* | 216.552* | 97.859ns | |||||
| Year | 2.385ns | 1.556ns | 6.558ns | 4.69ns | 0.254ns | |||||
| Pattern×Year | 0.65ns | 1.801ns | 0.243ns | 1.82ns | 0.502ns | |||||
1 Sole-cropping without application of nitrogen fertilizer (SN0); 2 Intercropping with forage mulberry without application of nitrogen fertilizer (IN0); ns indicates P > 0.05, *indicates P < 0.05.
Table 3.
Effects of intercropping mulberry on the nodules properties of soybean.
| Treatment | Number nodules | FW of nodules (g/plant) | DW of nodules (g/pant) | |||
| SN01 | IN02 | SN0 | IN0 | SN0 | IN0 | |
| 2021 | 39.20±0.84b | 47.60±0.55a | 0.46±0.01b | 0.69±0.01a | 0.12±0.01b | 0.17±0.01a |
| 2022 | 38.00±0.71c | 47.20±0.84a | 0.45±0.01b | 0.71±0.01a | 0.12±0.01b | 0.17±0.01a |
| 2023 | 38.00±1.00c | 47.80±1.30a | 0.46±0.01b | 0.71±0.01a | 0.11±0.01b | 0.17±0.01a |
| Source of variation | F value from two-way ANOVA test | |||||
| Pattern | 507.27* | 1365.81* | 294.646* | |||
| Year | 1.324ns | 0.877ns | 0.212ns | |||
| Pattern×Year | 1.51ns | 5.91ns | 2.717ns | |||
1 Sole-cropping without application of nitrogen fertilizer (SN0); 2 Intercropping with forage mulberry without application of nitrogen fertilizer (IN0); ns indicates P > 0.05, *indicates P < 0.05.
Table 4.
Effects of intercropping mulberry on the physicochemical properties of soybean rhizospheric soils.
Table 4.
Effects of intercropping mulberry on the physicochemical properties of soybean rhizospheric soils.
| Treatment |
Availabe Nitrogen (mg/kg) |
Available Phosphorus (mg/kg) |
Available Potassium (mg/kg) |
SWC (%) |
pH | ||||||
| SN01 | IN02 | SN0 | IN0 | SN0 | IN0 | SN0 | IN0 | SN0 | IN0 | ||
| 2021 | 138.08±0.41 a | 124.34±0.65 c | 257.61±2.51 b | 300.69±4.14 a | 286.74±1.71 b | 343.42±2.81 a | 18.26±0.94 b | 20.73±0.86 a | 6.45±0.04 a | 6.34±0.07 b | |
| 2022 | 137.91±1.57 a | 127.58±0.78 bc | 256.87±3.39 b | 299.21±2.79 a | 287.30±0.92 b | 343.40±1.15 a | 18.41±0.53 b | 20.48±0.65 a | 6.48±0.04 a | 6.28±0.10 b | |
| 2023 | 138.68±1.24 a | 125.76±0.87 ab | 258.66±4.79 b | 300.83±7.94 a | 286.16±1.98 b | 345.01±1.53 a | 18.13±0.88 b | 21.46±0.32 a | 6.46±0.01 a | 6.30±0.04 b | |
| Source of variation | F value from two-way ANOVA test | ||||||||||
| Pattern | 1025.242* | 22934.79* | 46878.507* | 369.304* | 32.58* | ||||||
| Year | 2.801ns | 12.692ns | 0.119ns | 2.077ns | 0.197ns | ||||||
| Pattern×Year | 1.247ns | 0.048ns | 1.637ns | 0.151ns | 1.511ns | ||||||
1 Sole-cropping without application of nitrogen fertilizer (SN0); 2 Intercropping with forage mulberry without application of nitrogen fertilizer (IN0); ns indicates P > 0.05, *indicates P < 0.05.
Disclaimer/Publisher’s Note: The statements, opinions and data contained in all publications are solely those of the individual author(s) and contributor(s) and not of MDPI and/or the editor(s). MDPI and/or the editor(s) disclaim responsibility for any injury to people or property resulting from any ideas, methods, instructions or products referred to in the content. |
© 2025 by the authors. Licensee MDPI, Basel, Switzerland. This article is an open access article distributed under the terms and conditions of the Creative Commons Attribution (CC BY) license (http://creativecommons.org/licenses/by/4.0/).
Copyright: This open access article is published under a Creative Commons CC BY 4.0 license, which permit the free download, distribution, and reuse, provided that the author and preprint are cited in any reuse.


