
Submitted:
27 February 2025
Posted:
28 February 2025
You are already at the latest version
Abstract
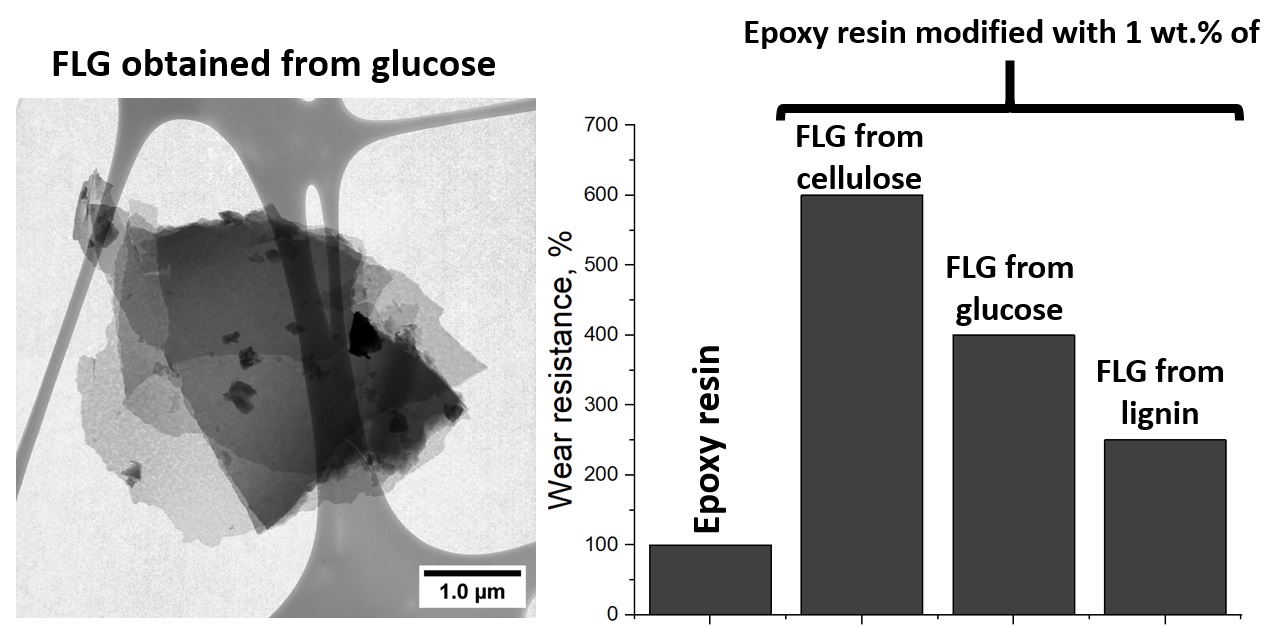
This paper provides the study results of influence of few-layer graphene obtained by self-propagating high-temperature synthesis from various biopolymers on the strength, thermophysical, and tribological properties of epoxy resin. The initial biopolymer's effect on synthesized few-layer graphene's structure is shown. In the studied composites, an increase in the glass transition temperature, thermal conductivity, and compressive strength is observed. The wear resistance of composites five times increase compared to the neat epoxy resin was also found due to a decrease in the coefficient of friction.
Keywords:
graphene
; few‐layer graphene
; epoxy resin
; strength
; wear resistance
; thermal conductivity
; glass transition
1. Introduction
Epoxy resin is one of the most widely used polymer materials and has many applications. Epoxy resin is a polymer used as protective coatings, construction materials, adhesives, etc. [1]. At the same time, developing epoxy resins with new performance properties that could meet the growing modern requirements becomes an increasingly difficult task due to the limited scope of possible combinations of various components [2]. Researchers are increasingly resorting to creating composite materials based on epoxy resins with multiple fillers to improve the performance characteristics of already used brands of epoxy resins. Graphene nanostructures (GNS) are one of the most popular fillers for creating composites based on epoxy resins [3].
Interest in GNS is due to their characteristics. For example, the thermal conductivity of defect-free single-layer graphene is up to 5000 W/(m×K) [4]; its Young's modulus and tensile strength are up to 1 TPa and up to 130 GPa, respectively [5]. Depending on the structure of GNS (lateral size, number of layers, defects, etc.), they inherit the record-breaking characteristics of graphene to one degree or another.
In [6], to improve the performance properties of epoxy resin, the authors used 0.3 wt. % GNP. The authors found that the use of 0.3 wt. % GNP leads to an increase in tensile strength by 70 %, an increase in thermal conductivity by 20 %, but a decrease in compressive strength by 8 %. During comparative tests, the researchers noted that the ultimate effectiveness of GNS supplements depends largely on their specific type. For example, in [7], the authors used GNP and graphene oxide as an additive to epoxy resin. Using 0.6 wt. % of GNP, it was possible to obtain an increase in the tensile strength by 44 % and an increase in Young's modulus by 28 %. The authors obtained similar results using a 1.5-fold lower volume of another additive, graphene oxide (0.4 wt. %), compared to GNP. This study demonstrated the difference in the effectiveness of different types of GNS.
An interesting fact is that to improve the characteristics of epoxy resin; it is not always advisable to use high fractions of GNS. In [8], the authors used two grades of graphene nanoplates (GNPs) with a thickness of < 4 nm (type 1) and 9-12 nm (type 2) in concentrations up to 15 wt. % to increase the Sharpie impact strength and thermal conductivity of the resulting composites. They established that using up to 1 wt. % GNP, it is possible to increase the Sharpie impact strength by 50 % regardless of the type of GNP. To improve the thermal conductivity of the final composites to 200 %, the authors had to use significantly larger fractions of GNP (15 wt. %) of Type 1. In comparison, GNPs of Type 2 showed substantially lower efficiency (an increase in thermal conductivity of only 33 %).
Thus, the researchers concluded that GNS can significantly improve the performance properties of epoxy resin. Still, for their practical use, it is necessary to consider many parameters of the carbon filler (dispersion, number of layers, surface functionalization, lateral particle size, etc.). Despite all the successful results of experiments on using GNS as a filler in epoxy resins, their widespread application in practice has not yet occurred. The lack of implementation of scientific results in the industry is due to the imperfection of methods for synthesizing GNS both according to the "bottom-up" approach and the "top-down" approach [9], which do not allow synthesizing large volumes of high-quality material with a low cost.
One of the key tasks of researchers is to search for new methods for synthesizing GNS that will solve these problems. One of the latest promising approaches to synthesizing GNS is self-propagating high-temperature synthesis (SHS). The essence of the method is to obtain new substances during the movement of a wave of a strong exothermic reaction, in which heat release is localized in a narrow layer and is transmitted from layer to layer by heat transfer [10]. Initially, this method was used to obtain various inorganic compounds, such as carbides of refractory metals [11]. However, scientists also found that it is possible to synthesize GNS under SHS conditions.
In [12], the authors used a mixture of magnesium powder and polyvinyl alcohol/glucose/calcium carbonate/magnesium carbonate powder to synthesize GNS, which was initiated using a red-hot filament in a carbon dioxide atmosphere. The authors of this work have shown that GNS can be obtained from calcium and magnesium carbonate, glucose, and polyvinyl alcohol.
In our previous work [13], demonstrated a new method for synthesizing few-layer graphene under SHS conditions from cyclic biopolymers. This method makes obtaining large volumes of few-layer graphene possible, which does not contain Stone-Wells (S-W) defects in its structure [14]. Due to this feature, few-layer graphene obtained by the SHS method has demonstrated greater efficiency as a modifying additive in creating products from photopolymer resins by Digital Light Processing (DLP) 3D-printing compared to GNS containing S-W defects [15].
This work aimed to study the effectiveness of using few-layer graphene synthesized under SHS conditions from glucose, cellulose, and lignin as a modifying additive in creating polymer composites based on epoxy resin.
2. Materials and Methods
Composites based on epoxy resin were obtained according to the scheme in Figure 1. The initial epoxy resin was mixed with FLG using a top-drive agitator for an hour (40 RPM) at 45 °C. Then the hardener triethylenetetramine was added and the mixture was mixed for 5 minutes. The mixture was then degassed in a vacuum chamber to remove air bubbles formed as a result of mixing. After degassing, the mixture was poured into molds and solidified for 24 hours. The samples were then annealed in a muffle furnace for an hour at 100 °C to complete crosslinking of the epoxy resin. According to this method, samples were synthesized for testing flexural strength with a size of 80 x 12 x 2 mm, for tensile strength with a size of 150 x 10 x 3 mm, for compressive strength with a size of 6 x 5 x 3 mm, for the study of thermal conductivity with diameter d = 20 mm and thickness h = 100 mm, and for the study wear resistance diameter d = 40 and thickness h = 4 mm.
Images of FLG samples were obtained by transmission electron microscopy (TEM) using an FEI Tecnai G2 30 S-TWIN electron microscope (USA, 50 kV). X-ray analysis of FLG was performed on Rigaku smartLAB 3 X-ray diffractometer (Japan, CuKα λ = 0.154051 nm). The IR spectra of FLG were obtained using an Infralume FT-08 spectrometer (Russia) by the method of attenuated total reflectance (ATR) on a PIKE attachment (USA). The Raman spectrum of FLG was studied using a Confotec NR500 spectrometer (Belarus), which has an exciting laser wavelength of 532 nm. The particle sizes of FLG were determined by laser diffraction using Mastersizer 2000 (Great Britain). For measurements, a 50 mg sample was used, which was dispersed in 50 ml of deionized water by stirring for 1 minute. Data on porosity and specific surface area were obtained by low-temperature nitrogen adsorption using Sorbi MS (Russia).
The samples' flexural strength (ISO 178:2010), tensile strength (ISO 527-2:2012), and compressive strength (ISO 604:2002) were measured on a universal testing machine HSL-UT-50PC (China) at a speed of 10 mm/min. The thermal conductivity at 25 °C was determined by the hot filament method on a Tempos (USA). The composites' glass transition temperatures were determined by the DSC method using BK-DSC300L (China), with a scanning speed of 5 °C/min.
Wear resistance and coefficient of friction (steel/polymer) were determined on a universal friction machine UMT-200 (Russia), disk-cylinder friction scheme (Figure 2). The upper body of rotation is pressed against the lower body (the test sample), which is rigidly mounted on the base. When the upper body rotates, the lower body and the base begin to rotate, which presses on the load cell from the data of which the moment of force M is calculated. Further, the coefficient of friction was calculated using the equation:
where M is the moment of force, F is the force of pressing the upper body against the lower one, R1 is the radius of the sample, and R2 is the radius of the friction imprint left by the upper body of rotation. Wear resistance was defined as the moment of destruction of the sample surface during friction with a sharp jump in the value of the coefficient of friction. An IR camera was also used to determine the temperature near the contact point of the friction pair. The pressing force of the upper body of rotation is 45 N, the diameter of the friction contact spot is 10 mm, and the rotation speed is 500 rpm.
µ = (M/F × R1/R2)
3. Results
3.1. FLG from Biopolymers
Synthesized samples of FLG were ground according to the procedure described in the experimental part, which allowed us to obtain a uniform distribution of FLG particles in the epoxy matrix. As a result of grinding, the average particle size for all samples ranged from 240 to 300 nm (Figure 3). It should be noted that a sample of FLG obtained from cellulose has a slightly higher proportion of large particles than the rest of the samples.
Figures 4A, C, and E show TEM images of FLG samples obtained from cellulose, glucose, and lignin. It can be seen that the obtained samples are translucent particles. X-ray images of the obtained samples of FLG are shown in Figures 4, B, D, and F. Based on the peak width (002) at half-height, interplanar distances, and crystallite sizes were calculated: 3.74 Å and 9.28 Å for the cellulose sample, 3.7 Å and 7.89 Å for the glucose sample, and 3.94 Å and 9.4 Å for the lignin sample. Based on these data, according to the Scherrer equation, the number of layers in the samples does not exceed three.
The Raman spectra of FLG samples (Figure 5А) are almost identical: the positions of the D and G bands, as well as their ratios of 1.03, 1.06, and 1.02 for FLG from the cellulose, glucose, and lignin, respectively. The Raman spectrum of the samples is similar to the spectra of graphene oxide and reduced graphene oxide [16]. This fact indicates a large number of defects in the structure of the samples – the presence of heteroatoms, sp3-carbon, and pores in the basal plane of graphene [17].
Figure 5B shows the FTIR spectra of cellulose, lignin, and glucose samples. A C=C coupling band is observed in all the spectra, and the wavenumber of this band depends on the sample and is equal to 1557 cm-1, 1583 cm-1, and 1590 cm-1 for FLG samples from cellulose, glucose, and lignin, respectively. The difference in the band position may be due to sp-3 carbon associated with aromatic cycles [18]. The FTIR spectra also show bands of the OH group: a wide band with a maximum of 1220 cm-1 for the sample from cellulose, three bands at 1351 cm-1, 1212 cm-1, and 1024 cm-1 for the sample from glucose, and bands at 1158 cm-1, and 1093 cm-1 for sample from lignin. In addition, the sample from glucose has a low-intensity band of CN bond at 2220 cm-1. The presence of functional groups on the surface of the samples is due to the synthesis method, in which FLG is the product of the interaction of an organic substrate with ammonium nitrate.
The elemental composition of FLG samples was determined using the EDX method (Table 1). The presence of oxygen and nitrogen in the samples is due to the synthesis method, where the oxidizer NH4NO3 is used as an energy source. On the one hand, the samples have a similar surface composition, suggesting that self-propagating high-temperature synthesis results in a carbon material of a similar type (this is also evident from TEM and X-ray diffraction data). On the other hand, the samples differ in the composition of hydroxyl groups and the position of the C=C bond absorption band, which is probably due to the influence of the structure of the initial substrate and the synthesis of FLG itself. The FTIR method failed to detect functional groups containing nitrogen. However, the FLG sample from glucose exhibits a low-intensity band CN at 2220 cm-1. The bands responsible for the vibrations of nitrogen-containing groups can be hidden in wide bands responsible for the vibrations of hydroxyl groups.
The specific surface area and porosity of FLG are also essential factors in studying the effect of filler on the matrix in composite materials. These data are presented in Table 2. The values of the specific surface area of FLG powders obtained by self-propagating high-temperature synthesis significantly depend on the initial substrate. There are no sufficient grounds for discussing the dependence of the FLG powder structure on the specific surface area and porosity, and only the measured values of the specific surface area and pore volume will be considered.
3.2. Eposy Composites
Using the DSC method, it was found that adding FLG increases the epoxy resin's glass transition temperature (Figure 6A, B, C). When the concentration of FLG is increased to 1 wt.%., the glass transition temperature increases from 93 °C to 100 – 103 °C, depending on the FLG sample's origin. When the glass transition temperature is exceeded, individual segments of the polymer chain become mobile, and the polymer goes from a glassy state to a highly elastic state. An increase in the glass transition temperature with the addition of FLG indicates that FLG obstructs the movement of the polymer chain and needs to give more energy to the polymer to overcome this resistance. Due to functional groups, the FLG probably interacts with the hydroxyl groups of the epoxy resin and the amine groups of the hardener. A similar result was observed in the work devoted to modifying nitrile butadiene rubber by GNS [19].
Figure 6D shows that the thermal conductivity of composites based on epoxy resin modified with FLG is higher than that of pure epoxy resin. When the concentration of FLG is 1 wt. %, the average thermal conductivity of the samples increases to 40 %. Considering the good adhesion of FLG to the matrix due to functional groups at 1 wt. %, one would expect a more significant increase in the thermal conductivity of the composite. For example, in [20], authors also provided a good interaction of reduced graphene oxide obtained by the Hammers method with epoxy resin, which made it possible to get an increase in thermal conductivity by 80 % (25 °C) at 1 wt.%. However, neither in [20] nor in other similar works [21,22] experimentally measured thermal conductivity of composite materials does not correspond to that calculated according to theoretical models, which is usually associated with particle aggregation. Also, we should not forget that when the number of defects in the graphene structure increases and the particle size decreases, its thermal conductivity decreases [23]. Considering the particle size and many defects (according to Raman spectra), the thermal conductivity increases by 40 % at 1 wt. % can be regarded as satisfactory when using FLG obtained by self-propagating high-temperature synthesis.
The strength data of composites based on epoxy resin modified with FLG are shown in Figure 7. It can be seen that the tensile, flexural, and compressive strengths have the same dependences relative to the origin of FLG. An increase in the concentration of FLG leads to a decrease in the tensile strength of the epoxy resin (Figure 7A) and an increase in the Young's modulus (Figure 7B). At a concentration of 1 wt. %, the tensile strength of epoxy resin is reduced by 15 %, while the elastic modulus increases by 30 %. Thus, an epoxy resin-modified FLG breaks down more brittle than pure epoxy resin, which was also noted in other works [24,25]. At the interface between the matrix and FLG, epoxy resin molecules can be structured to some degree to the total volume of the polymer due to adhesion. As a result of this process, stresses arise, and breaks can occur in these areas when stretched.
FLG increases the compressive strength of epoxy resin. At an FLG concentration of 1 wt. %, the compressive strength increases by 40% (Figure 7C) and the Young's modulus by 20 %. (Figure 7D). When compressed, the distance between the molecules decreases, and the polymer chains begin to move perpendicular to the pressure axis. In the movement of molecules, particles of FLG act as obstacles and areas of concentration for polymer molecules, resulting in the self-strengthening of the material.
The bending strength of the epoxy resin increases by 20 % (Figure 7E) at a FLG concentration of 0.25 wt. %. With a further rise in FLG concentration, the composite strength decreases to the initial values of pure epoxy resin. When bending, the upper layers of the sample are compressed, and the lower layers are stretched. Thus, with the introduction of FLG, the decreasing tensile strength is offset by the increasing compressive strength, which practically does not change the bending strength.
FLG can reduce the friction coefficient of the steel/epoxy pair and increase its wear resistance. Figure 8 shows the dependences of the coefficient of friction (μ) on the test time of composites based on epoxy resin modified with FLG obtained from cellulose (Figure 8A), glucose (Figure 8C), and lignin (Figure 8E). The dependence of the temperature in the vicinity of the friction spots on the friction time of composites is based on epoxy resin modified with FLG obtained from cellulose (Figure 8B), glucose (Figure 8D), and lignin (Figure 8F). Introducing FLG obtained from cellulose into the epoxy resin leads to a decrease in the friction coefficient of the steel/epoxy resin pair from 0.37 to 0.31 at concentrations of 0.25 and 0.5 wt. %. Increasing the concentration to 1 wt.% reduces the coefficient of friction to 0.25. At the same time, FLG obtained from cellulose increases the wear resistance of epoxy resin. The neat epoxy resin breaks in 150 seconds after the start of the experiment, and the epoxy resin modified with FLG obtained from cellulose did not break in 600 seconds. The graph of the temperature dependence of composites modified with FLG from cellulose (Figure 8B) shows that with an increase in the concentration of FLG obtained from cellulose, the temperature during friction increases more slowly. At 600 seconds of testing, the temperature near the friction spot for composites is 78 °C, 74 °C, and 68 °C for concentrations of 0.25 wt. %, 0.5 wt.% and 1 wt. %, respectively. The decrease in the coefficient of friction can be attributed to the fact that FLG fills in the surface roughness during friction [26]. The equation can explain slower heating during friction:
where Q – heat generated during friction (J), µ is the coefficient of friction, F is the force of pressing the upper body against the lower one (N), V is the speed (m/sec), t is time (sec). Thus, a decrease in the coefficient of friction led to a reduction in heat generation during friction and, consequently, a decrease in the heating rate.
Q = µ × F × V × t,
The effect of reducing the friction coefficient of the steel/epoxy resin pair when using FLG obtained from glucose is observed only in a concentration equal to 1 wt. % (Figure 8C). The coefficient of friction at 1 wt. % of FLG obtained from glucose decreases from 0.37 to 0.3, and the time to destruction of the sample increases from 150 seconds to 600 seconds. Here, the percolation effect is observed, in which up to a certain concentration, in our case below 1 wt. %, there is no effect on the tribological properties of the epoxy resin. Judging by the structural data presented at the beginning of the discussion, the values of the specific surface area and pore volume can be an influencing parameter in this process. The powder of FLG obtained from glucose has the smallest specific surface area and pore volume compared with samples obtained from lignin and cellulose. It is necessary to consider the total value of the surface of FLG (which must be bonded with epoxy resin) to reduce the coefficient of friction.
The opposite effect is observed when using FLG obtained from lignin (Figure 8E). When it is introduced into an epoxy resin with a concentration equal to 0.25 wt. %, there is a decrease in the coefficient of friction from 0.37 to 0.32 and an increase in wear resistance from 150 to 600 seconds. Increasing the concentration of FLG obtained from lignin from 0.25 wt. % up to 1 wt.% wear resistance decreases from 600 seconds to 375 seconds, which is also reflected in the heating curves (Figure 8F). At the same time, the coefficient of friction remains almost at the same level. In this case, it is impossible to determine the factor that affects the decrease in wear resistance of the composite with an increase in the concentration of FLG obtained from lignin. Wear resistance can be considered a process of surface fatigue, in which, due to friction, microcracks accumulate on the sample surface. When a specific concentration of microcracks is reached, the material is destroyed [27]. FLG reduces the friction coefficient of the steel/epoxy pair, which reduces the mechanical impact on the surface of the epoxy resin.
4. Conclusions
It was found that the initial biopolymer for FLG obtained by self-propagating high-temperature synthesis affects the composition of functional groups and the specific surface area. The structure of the initial biopolymer for FLG synthesis does not affect the Raman spectra of FLG.
The main result is that FLG obtained by self-propagating high-temperature synthesis can reduce the coefficient of friction of epoxy resin and prevent its surface fatigue during friction.
FLG increases the compressive strength of epoxy resin by up to 40 % at 1 wt. %, and this increase is independent of the origin of FLG. This indicates that the main influence in this process is not the structural features of the samples but the amount of FLG in the matrix.
Also, FLG increases the thermal conductivity of epoxy resin by 40 % at 1 wt.% and increases the glass transition temperature from 93 °C to 100 °C, which slightly increases the epoxy resin's temperature stability.
Author Contributions
Conceptualization, N.D., A.A. and A.P.; methodology, A.A..; formal analysis, N.D.; investigation, N.D..; resources, S.V.; data curation, S.V. and A.P.; writing—original draft preparation, N.D. and A.A.; writing—review and editing, S.V. and A.P.; visualization, N.D.; supervision, A.P.; All authors have read and agreed to the published version of the manuscript.
Funding
This work was supported by the Russian Science Foundation grant No. 23-79-10254.
Institutional Review Board Statement
Not applicable.
Data Availability Statement
The data presented in this study are available on request from the corresponding author.
Conflicts of Interest
The authors declare no conflicts of interest.
Abbreviations
The following abbreviations are used in this manuscript:
| FLG | Few layers graphene |
| GNS | Graphene nanostructure |
| GNP | Graphene nanoplates |
References
- Jin, F. L.; Li, X.; Park, S. J. Synthesis and application of epoxy resins: A review. Journal of industrial and engineering chemistry 2015, 29, 1-11.
- Mohan, P. A. Critical review: the modification, properties, and applications of epoxy resins. Polymer-Plastics Technology and Engineering 2013, 52(2), 107-125.
- Fekiač, J.J.; Krbata, M.; Kohutiar, M.; Janík, R.; Kakošová, L.; Breznická, A.; Eckert, M.; Mikuš, P. Comprehensive Review: Optimization of Epoxy Composites, Mechanical Properties, & Technological Trends. Polymers 2025, 17, 271. [CrossRef]
- Balandin, A. A.; Ghosh, S.; Bao, W.; Calizo, I.; Teweldebrhan, D.; Miao, F.; Lau, C. N. Superior thermal conductivity of single—layer graphene. Nano letters 2008, 8(3), 902-907.
- Cao, Q.; Geng, X.; Wang, H.; Wang, P.; Liu, A.; Lan, Y.; Peng, Q. A Review of Current Development of Graphene Mechanics. Crystals 2018, 8, 357. [CrossRef]
- Akter, M.; Ozdemir, H.; Bilisik, K. Epoxy/Graphene Nanoplatelet (GNP) Nanocomposites: An Experimental Study on Tensile, Compressive, and Thermal Properties. Polymers 2024, 16(11), 1483.
- Mirzapour, M.; Cousin, P.; Robert, M.; Benmokrane, B.; Dispersion Characteristics, the Mechanical, Thermal Stability, and Durability Properties of Epoxy Nanocomposites Reinforced with Carbon Nanotubes, Graphene, or Graphene Oxide. Polymers 2024, 16, 1836. [CrossRef]
- Zafeiropoulou, K.; Kostagiannakopoulou, C.; Geitona, A.; Tsilimigkra, X.; Sotiriadis, G.; Kostopoulos, V. On the Multi-Functional Behavior of Graphene-Based Nano-Reinforced Polymers. Materials 2021, 14, 5828. [CrossRef]
- Gutiérrez-Cruz, A.; Ruiz-Hernández, A.R.; Vega-Clemente, J.F.; Daniela Guadalupe Luna-Gazcón; Jessica Campos-Delgado. A review of top-down and bottom-up synthesis methods for the production of graphene, graphene oxide and reduced graphene oxide. J Mater Sci 2022, 57, 14543–14578. [CrossRef]
- Merzhanov A. G. The chemistry of self-propagating high-temperature synthesis. Journal of Materials Chemistry 2004, 14(12), 1779-1786.
- Merzhanov, A. G.; Sharivker, S. Y. Self-propagating high-temperature synthesis of carbides, nitrides, and borides. Materials Science of Carbides, Nitrides and Borides. – Dordrecht: Springer Netherlands 1999. 205-222.
- Lidong, W.; Bing, W.; Pei, D.; Qinghua, M.; Zheng, L.; Fubiao, X.; Jingjie, W.; Jun, L.; Robert, V.; Weidong, F. Large-scale synthesis of few-layer graphene from magnesium and different carbon sources and its application in dye-sensitized solar cells. Materials & Design 2016, 92, 462-470. [CrossRef]
- Voznyakovskii, A. P.; Vozniakovskii, A. A.; Kidalov, S. V. New Way of Synthesis of Few-Layer Graphene Nanosheets by the Self Propagating High-Temperature Synthesis Method from Biopolymers. Nanomaterials 2022, 12(4), 657. [CrossRef]
- Voznyakovskii, A. P.; Neverovskaya, A. A.; Vozniakovskii, A. A.; Kidalov, S. V.; A Quantitative Chemical Method for Determining the Surface Concentration of Stone–Wales Defects for 1D and 2D Carbon Nanomaterials. Nanomaterials 2022, 12(5), 883. [CrossRef]
- Kidalov, S. V.; Voznyakovskii, A. P.; Vozniakovskii, A. P.; Titova, S. I.; Auchynnikau, Y. V. The Effect of Few-Layer Graphene on the Complex of Hardness, Strength, and Thermo Physical Properties of Polymer Composite Materials Produced by Digital Light Processing (DLP) 3D Printing. Materials 2023, 16, 1157. [CrossRef]
- X. Díez-Betriu, S.; Álvarez-García, C.; Botas, P.; Álvarez, J.; Sánchez-Marcos, C.; Prieto, R.; Menéndez, A. de Andrés. Raman spectroscopy for the study of reduction mechanisms and optimization of conductivity in graphene oxide thin films. Journal of Materials Chemistry 2013, 1(41), 6905-6912. [CrossRef]
- Andrea C. Ferrari, Denis M. Basko. Raman spectroscopy as a versatile tool for studying the properties of graphene. Nature Nanotech 2013, 8, 235–246. [CrossRef]
- Ţucureanu, V.; Matei, A.; Avram, A. M. FTIR Spectroscopy for Carbon Family Study. Critical Reviews in Analytical Chemistry 2016, 46(6), 502–520. [CrossRef]
- Vozniakovskii, A. A.; Voznyakovskii, A. P.; Kidalov, S. V.; Otvalko, J.; Neverovskaia, A. Yu. Characteristics and mechanical properties of composites based on nitrile butadiene rubber using graphene nanoplatelets, J. Compos. Mater 2020, 54(23), 3351-3364. [CrossRef]
- Chih-Chun, T.; Chen-Chi, M. M.; Chu-Hua, L.; Shin-Yi, Y.; Shie-Heng, L.; Min-Chien, H.; Ming-Yu, Y.; Kuo-Chan, C.; Tzong-Ming, L. Thermal conductivity and structure of non-covalent functionalized graphene/epoxy composites. Carbon 2011, 49(15), 5107-5116. [CrossRef]
- Fuzhong, W.; Lawrence, T. D.; Yan, Q.; Zhixiong, H. Mechanical properties and thermal conductivity of graphene nanoplatelet/epoxy composites. J Mater Sci 2015, 50, 1082–1093. [CrossRef]
- Yuan-Xiang, F.; Zhuo-Xian, H.; Dong-Chuan, M.; Shu-Shen, L. Thermal conductivity enhancement of epoxy adhesive using graphene sheets as additives. International Journal of Thermal Sciences 2014, 86, 276-283. [CrossRef]
- Zhang, Y.Y.; Cheng, Y.; Pei, Q.X.; Wang, C.M.; Xiang, Y. Thermal conductivity of defective graphene. Physics Letters A 2012, 376, 3668-3672. [CrossRef]
- Long-Cheng, T.; Yan-Jun, W.; Dong, Y.; Yong-Bing, P.; Li, Z.; Yi-Bao, L.; Lian-Bin, W.; Jian-Xiong, J.; Guo-Qiao, L. The effect of graphene dispersion on the mechanical properties of graphene/epoxy composites. Carbon 2013, 60, 16-27. [CrossRef]
- Prolongo, M. G.; Salom, C.; Arribas, C.; Sánchez-Cabezudo, M.; Masegosa, R. M.; Prolongo, S. G. Influence of graphene nanoplatelets on curing and mechanical properties of graphene/epoxy nanocomposites. J Therm Anal Calorim 2016, 125, 629–636. [CrossRef]
- He, Y.; Fan, X.; Huang, Y.; Liu, C.; Zhao, Z.; Zhu, M. Experimental and theoretical evaluations on the parallel-aligned graphene oxide hybrid epoxy composite coating toward wear resistance. Carbon 2024, 217, 118629. [CrossRef]
- Littmann, W. E.; Widner, R. L. Propagation of Contact Fatigue from Surface and Subsurface Origins. J Basic Eng 1966, 88, 624–635. [CrossRef]
- Author 1, A.; Author 2, B. Title of the chapter. In Book Title, 2nd ed.; Editor 1, A., Editor 2, B., Eds.; Publisher: Publisher Location, Country, 2007; Volume 3, pp. 154–196.
Figure 1.
Scheme of synthesis of composites based on epoxy resin.
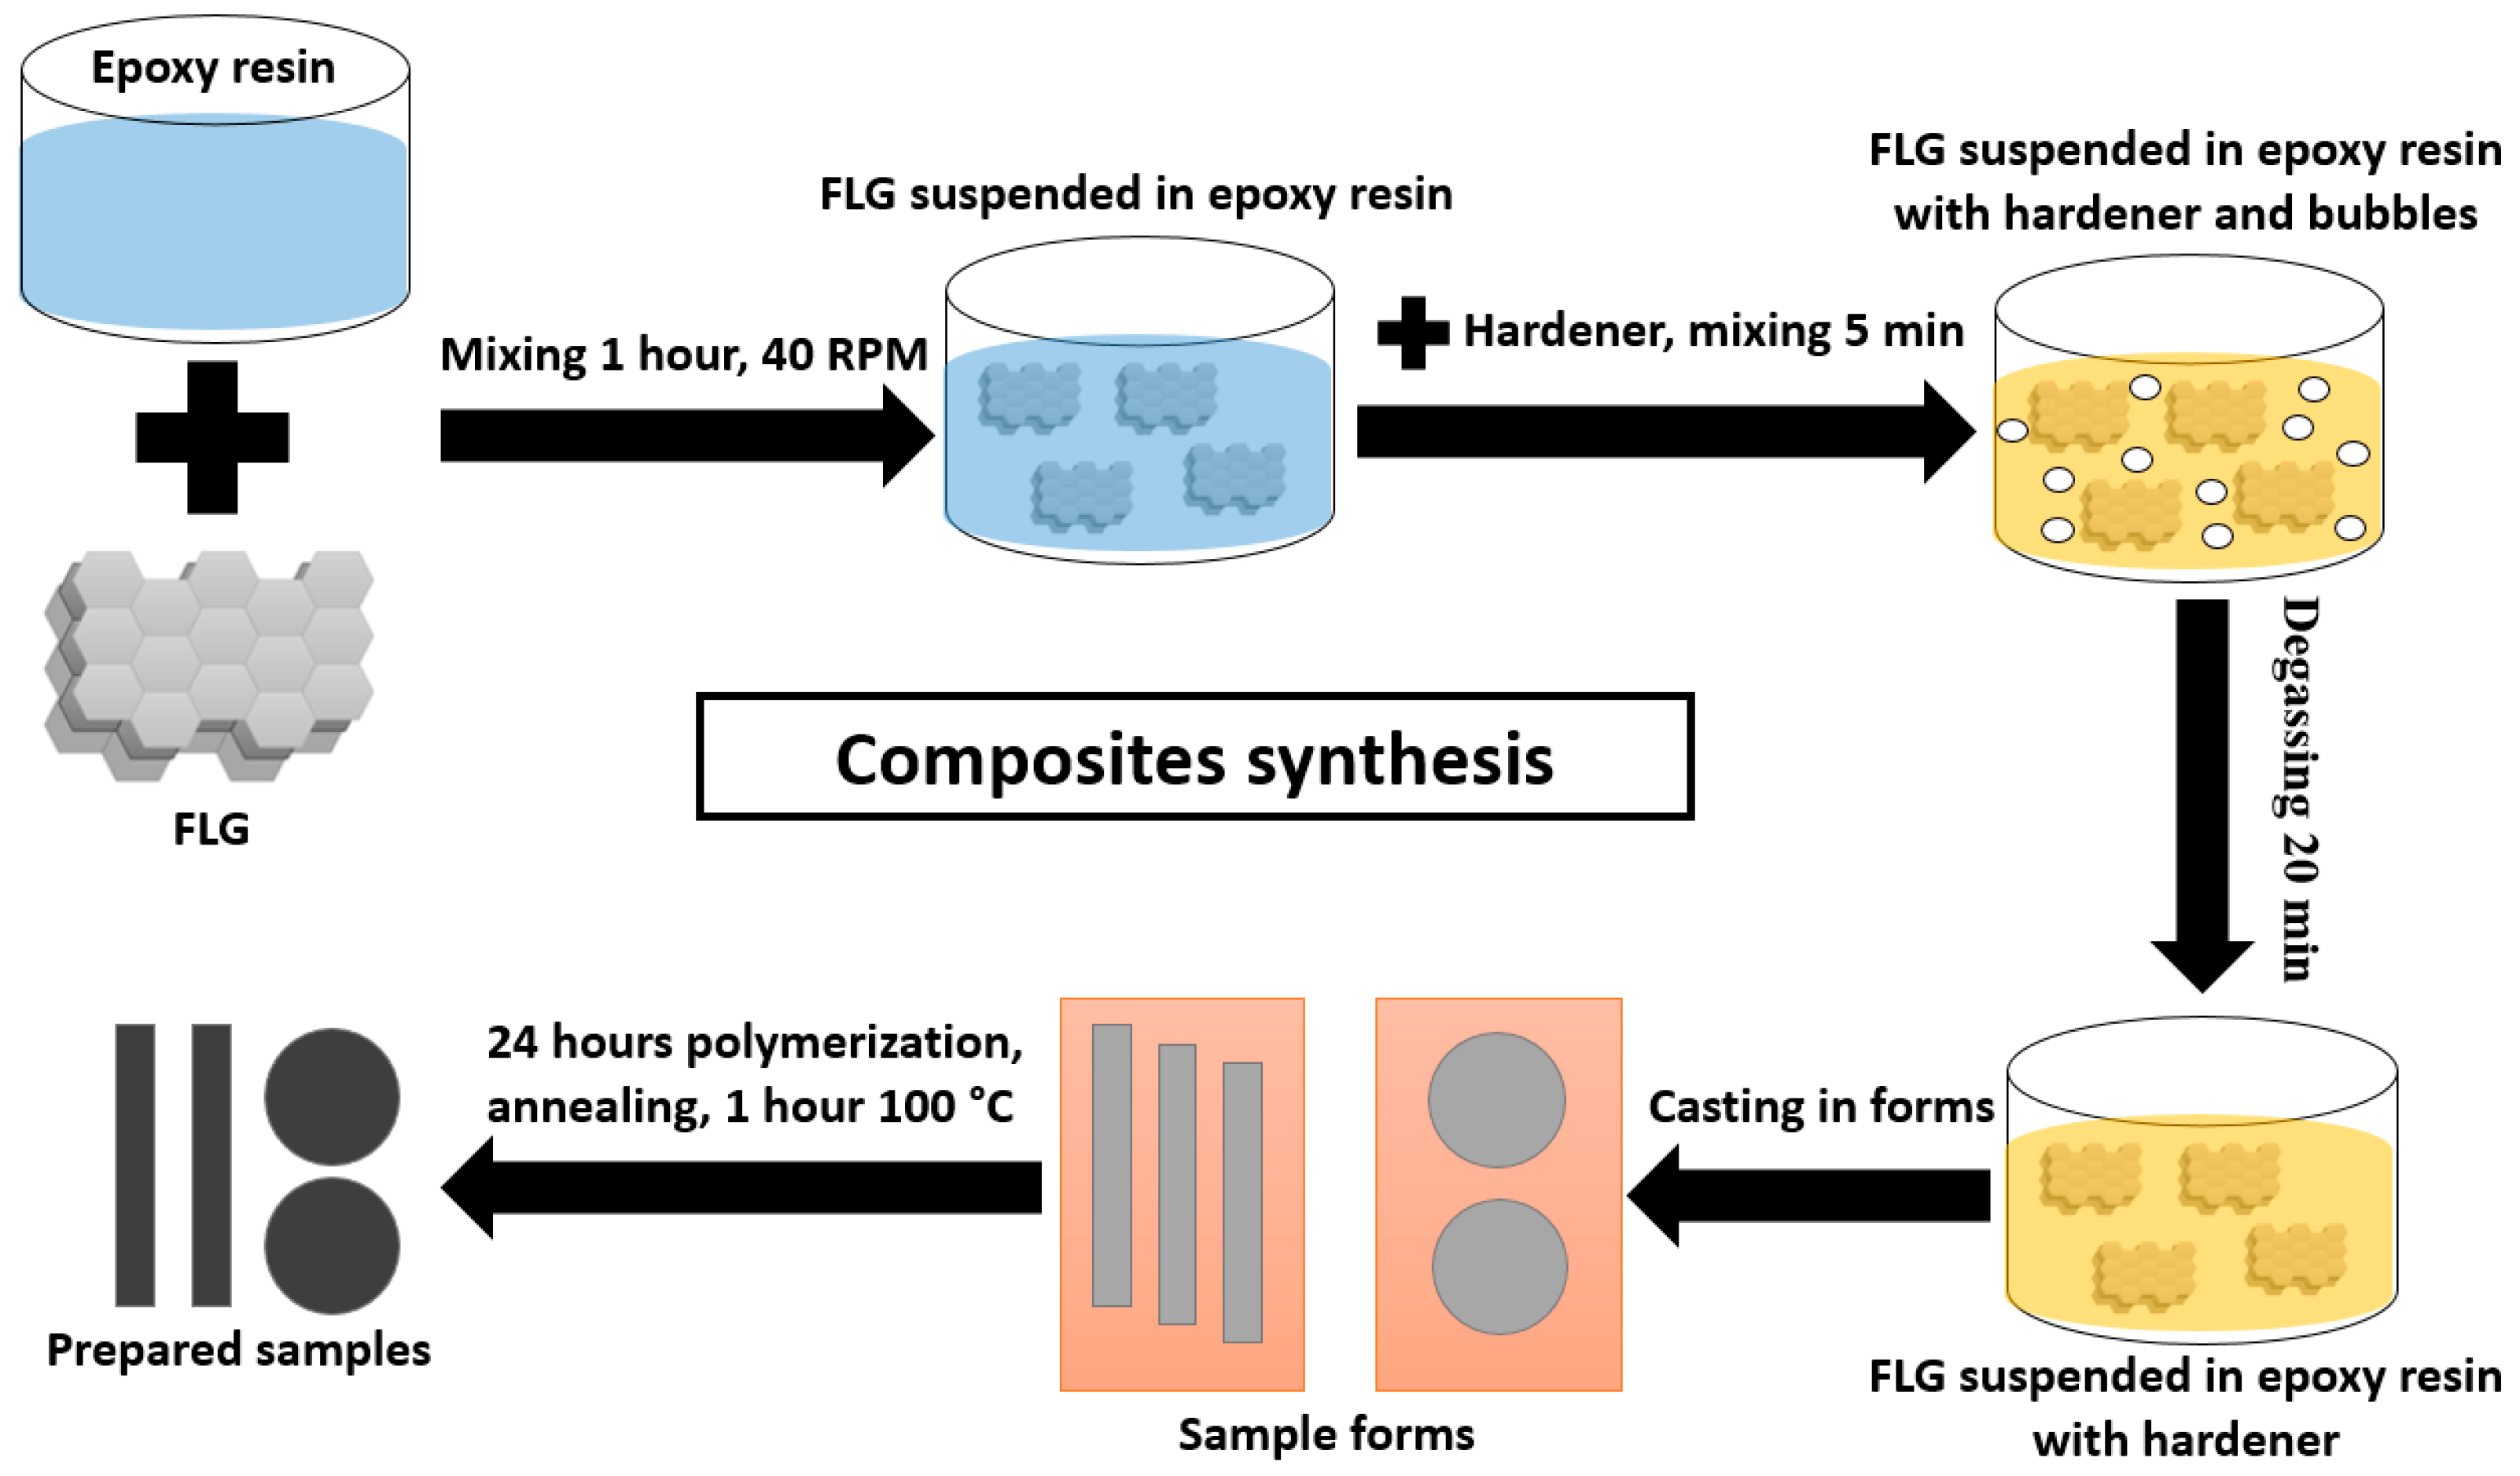
Figure 2.
Scheme of the wear resistance testing.
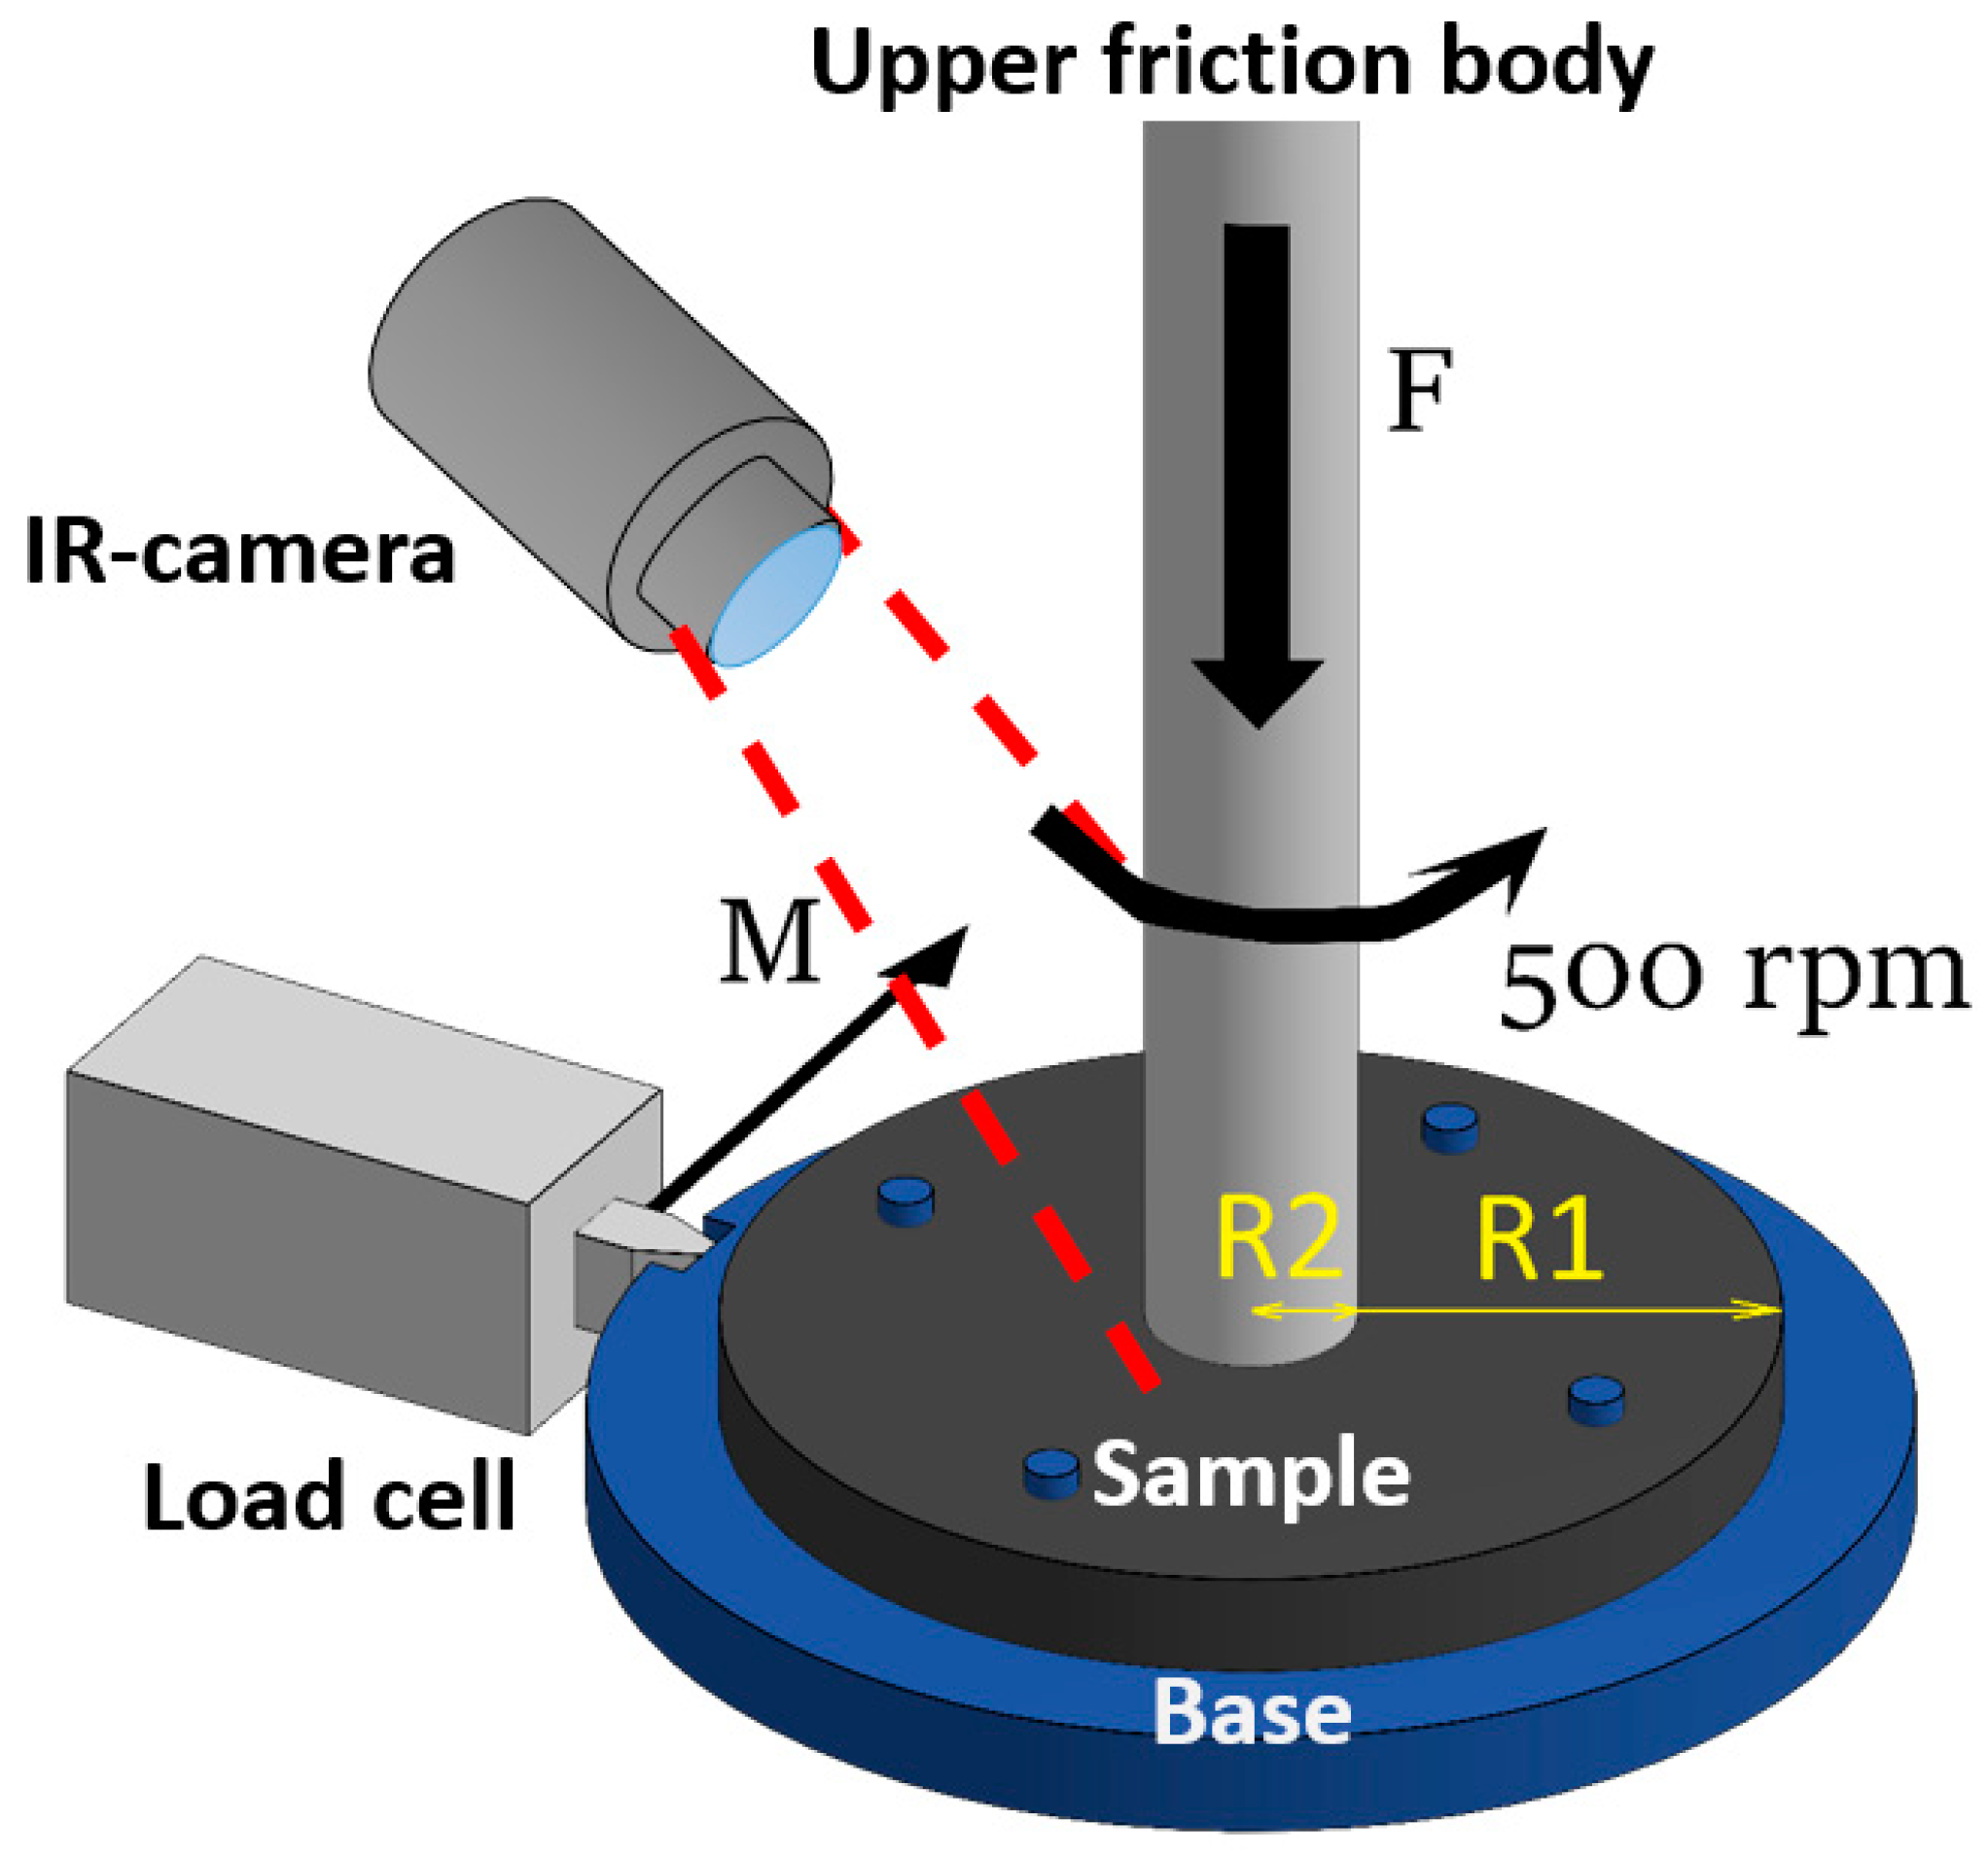
Figure 3.
Particle size distribution of FLG samples obtained from cellulose (1), glucose (2), and lignin (3).
Figure 3.
Particle size distribution of FLG samples obtained from cellulose (1), glucose (2), and lignin (3).
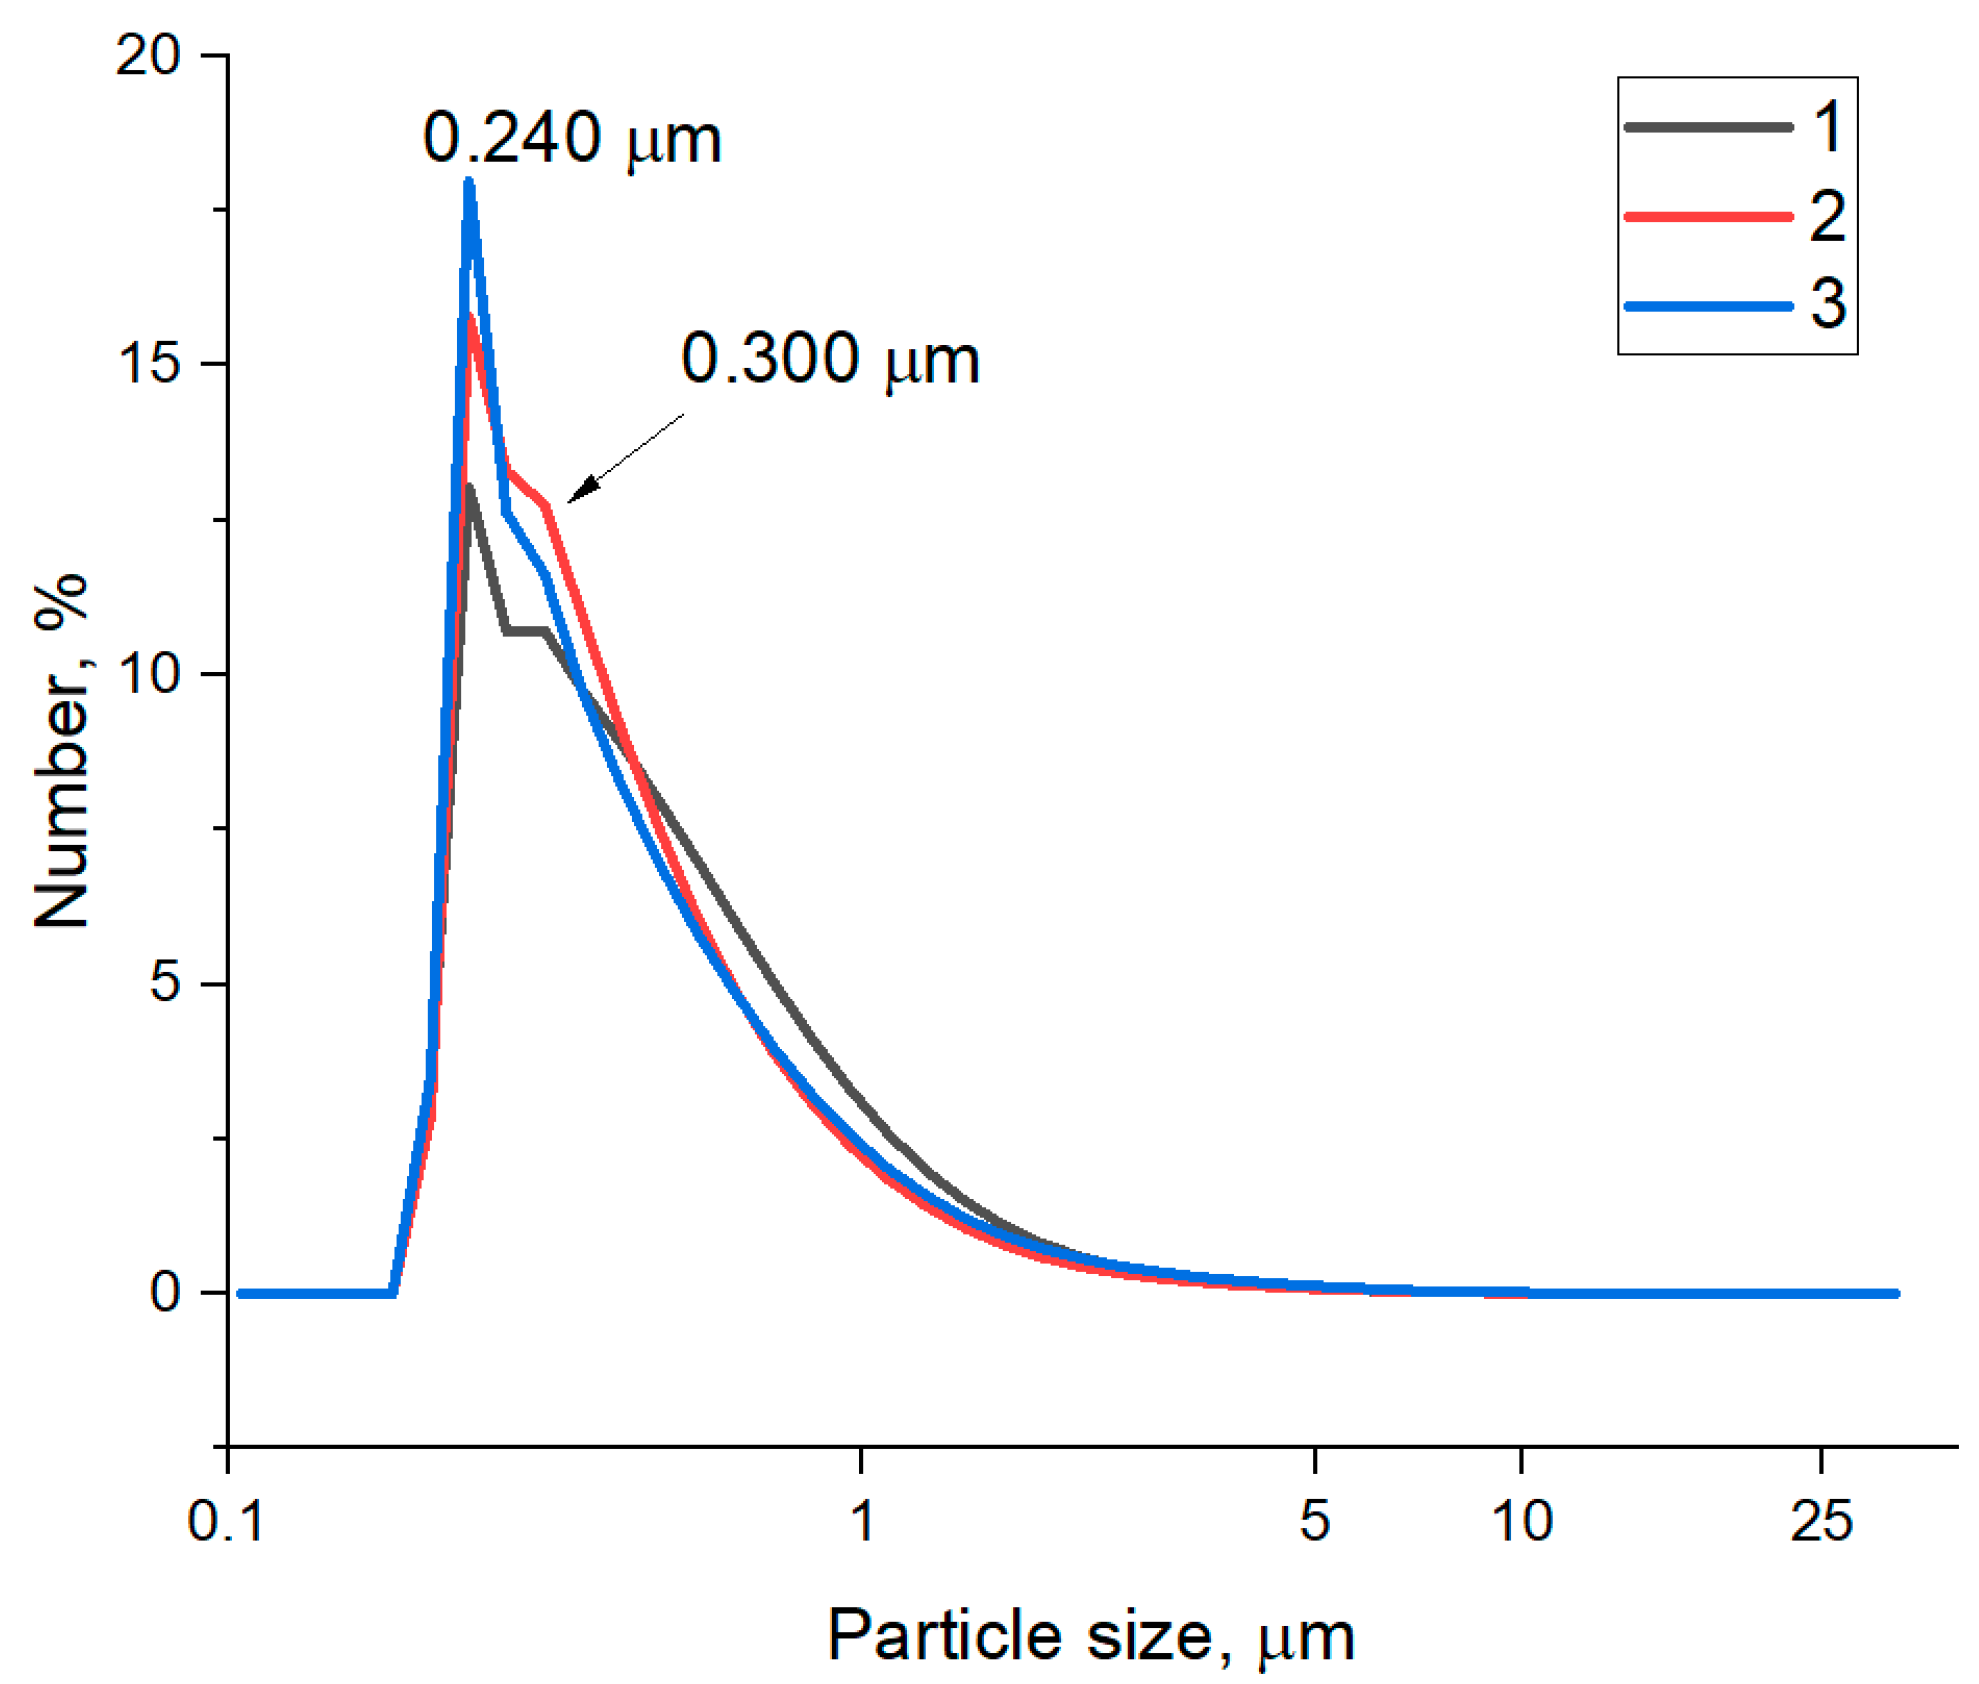
Figure 4.
TEM images of FLG samples obtained from cellulose (A), glucose (C), and lignin (E); X-ray images of FLG samples obtained from cellulose (B), glucose (D), and lignin (F).
Figure 4.
TEM images of FLG samples obtained from cellulose (A), glucose (C), and lignin (E); X-ray images of FLG samples obtained from cellulose (B), glucose (D), and lignin (F).
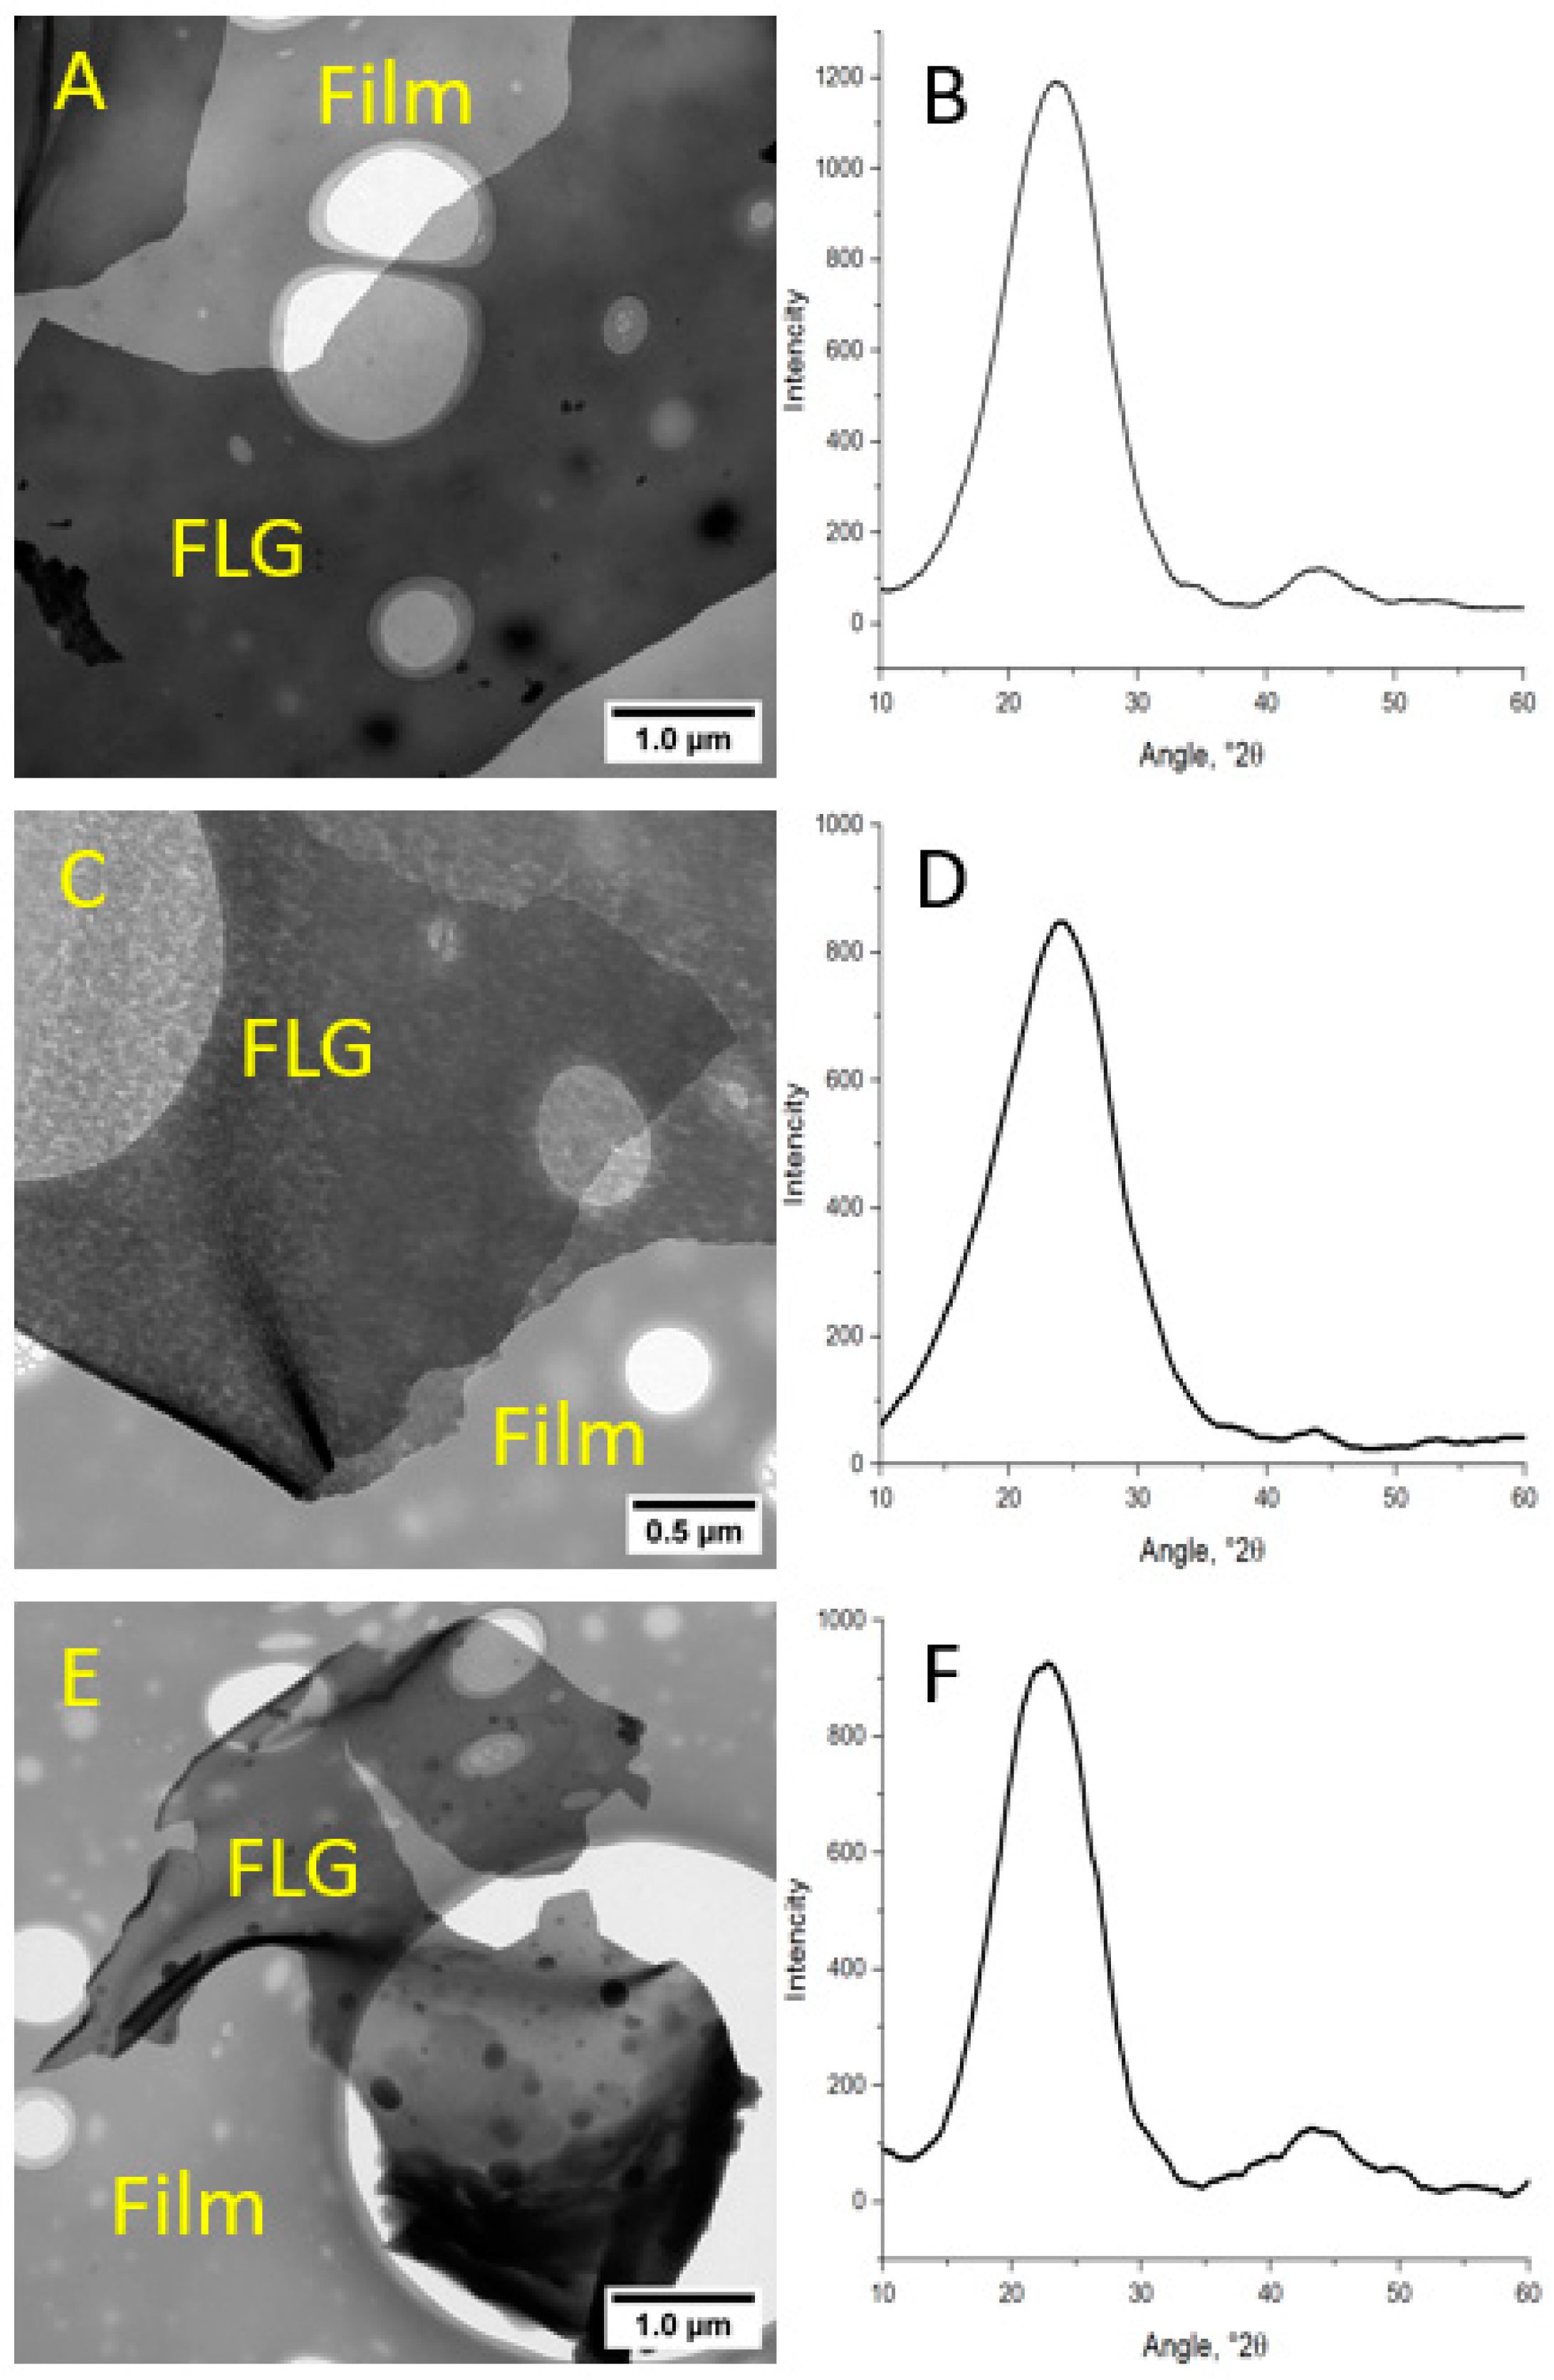
Figure 5.
(A) Raman spectra of FLG from cellulose (1), glucose (2), and lignin (3); (B) FTIR spectra of FLG from cellulose (1), glucose (2) and lignin (3).
Figure 5.
(A) Raman spectra of FLG from cellulose (1), glucose (2), and lignin (3); (B) FTIR spectra of FLG from cellulose (1), glucose (2) and lignin (3).
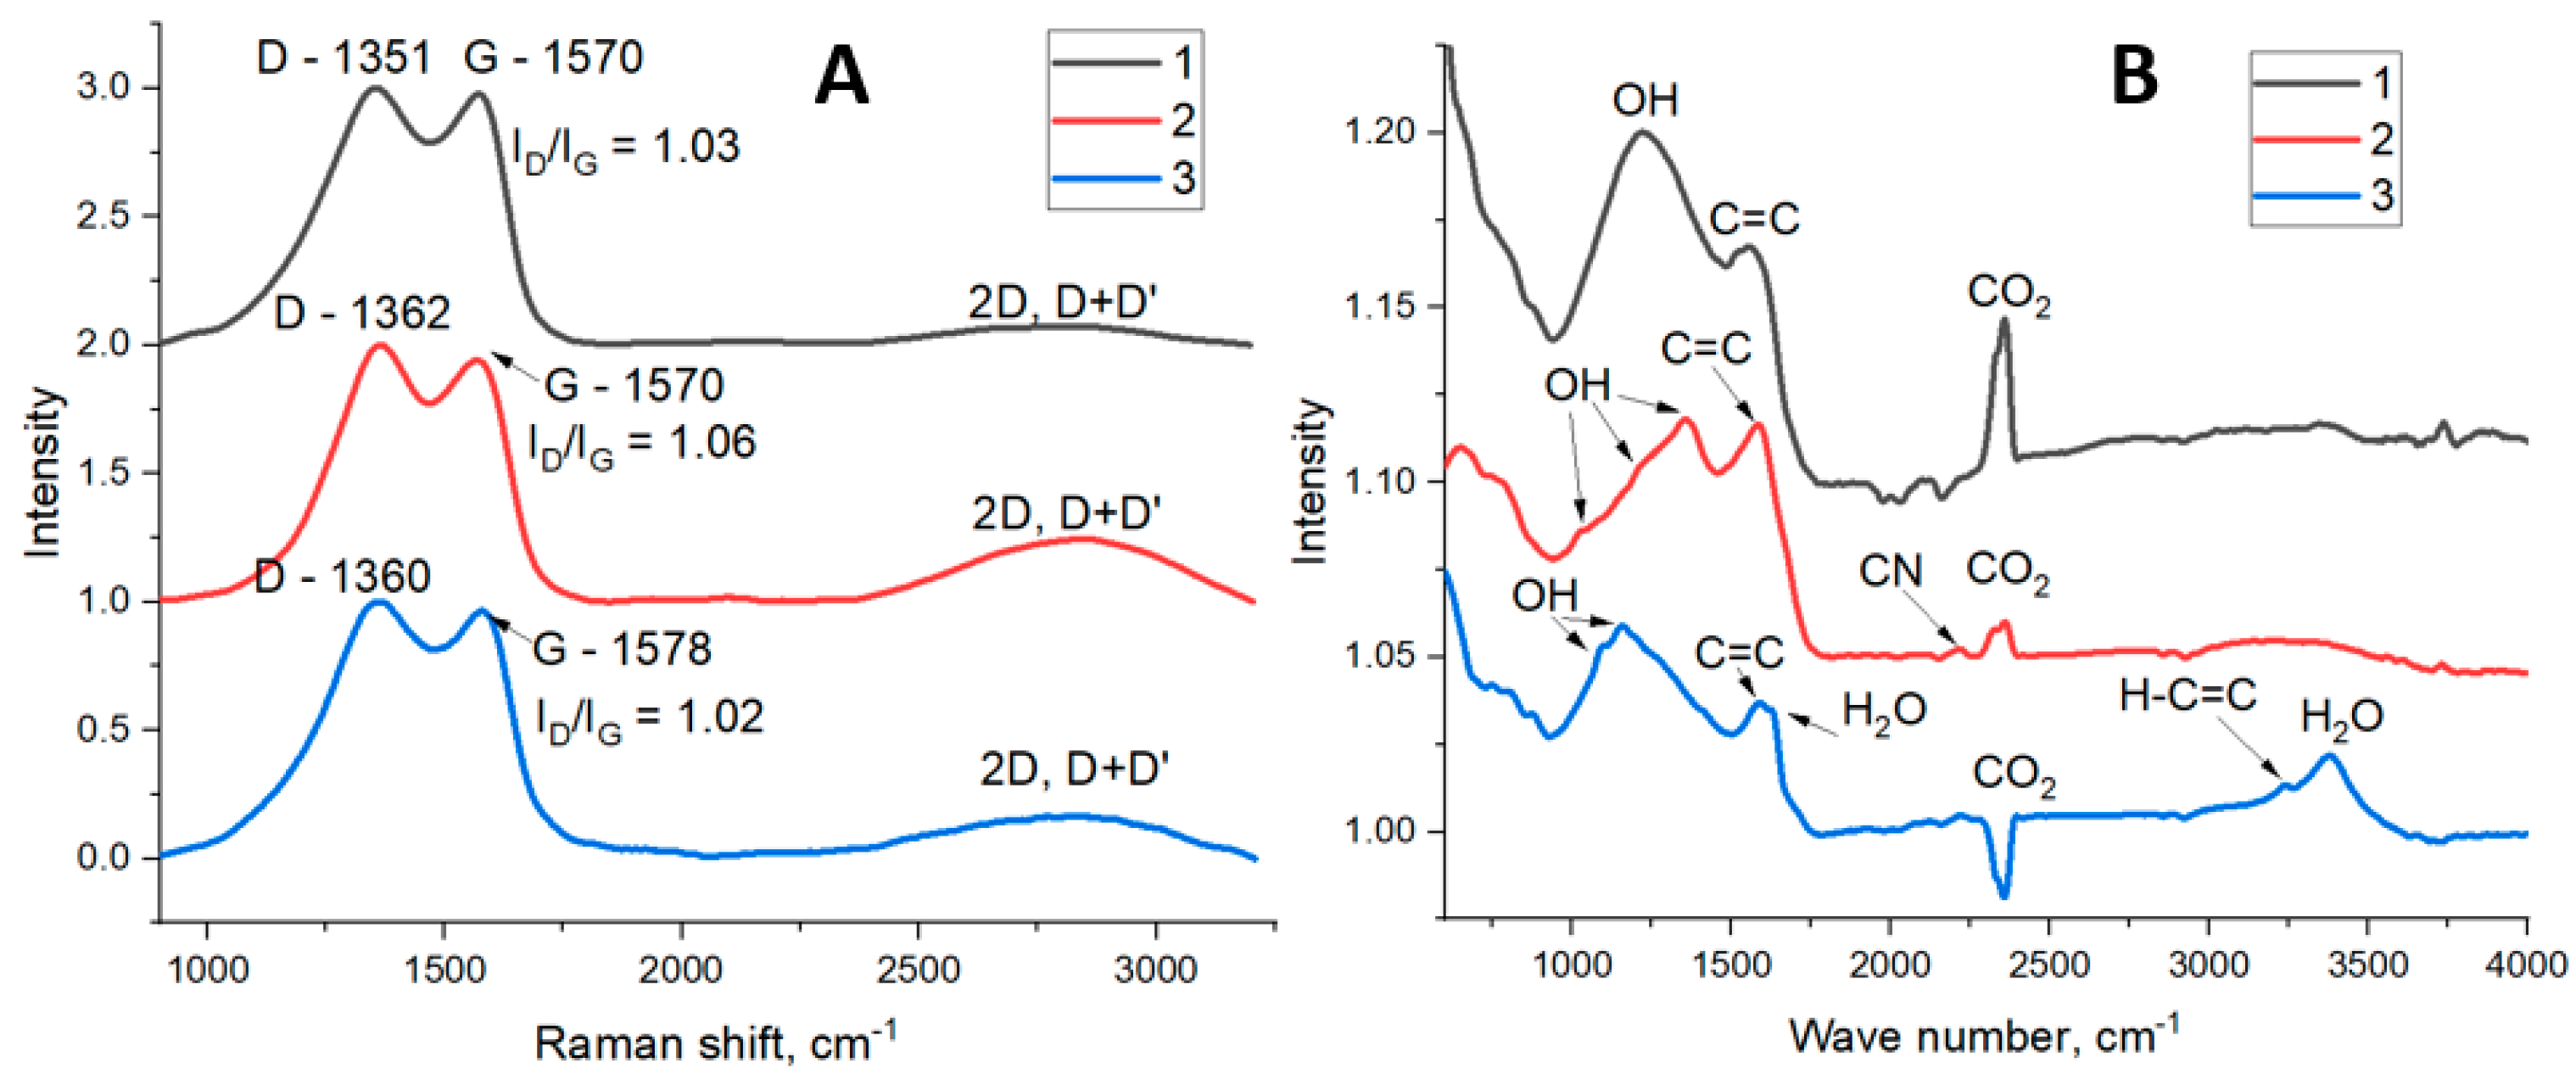
Figure 6.
DSC curves of composites based on epoxy resin modified with FLG obtained from cellulose (A), glucose (B), and lignin (C); (D) Dependence of the thermal conductivity of composites based on epoxy resin on the concentration of FLG obtained from cellulose (1), glucose (2) and lignin (3).
Figure 6.
DSC curves of composites based on epoxy resin modified with FLG obtained from cellulose (A), glucose (B), and lignin (C); (D) Dependence of the thermal conductivity of composites based on epoxy resin on the concentration of FLG obtained from cellulose (1), glucose (2) and lignin (3).
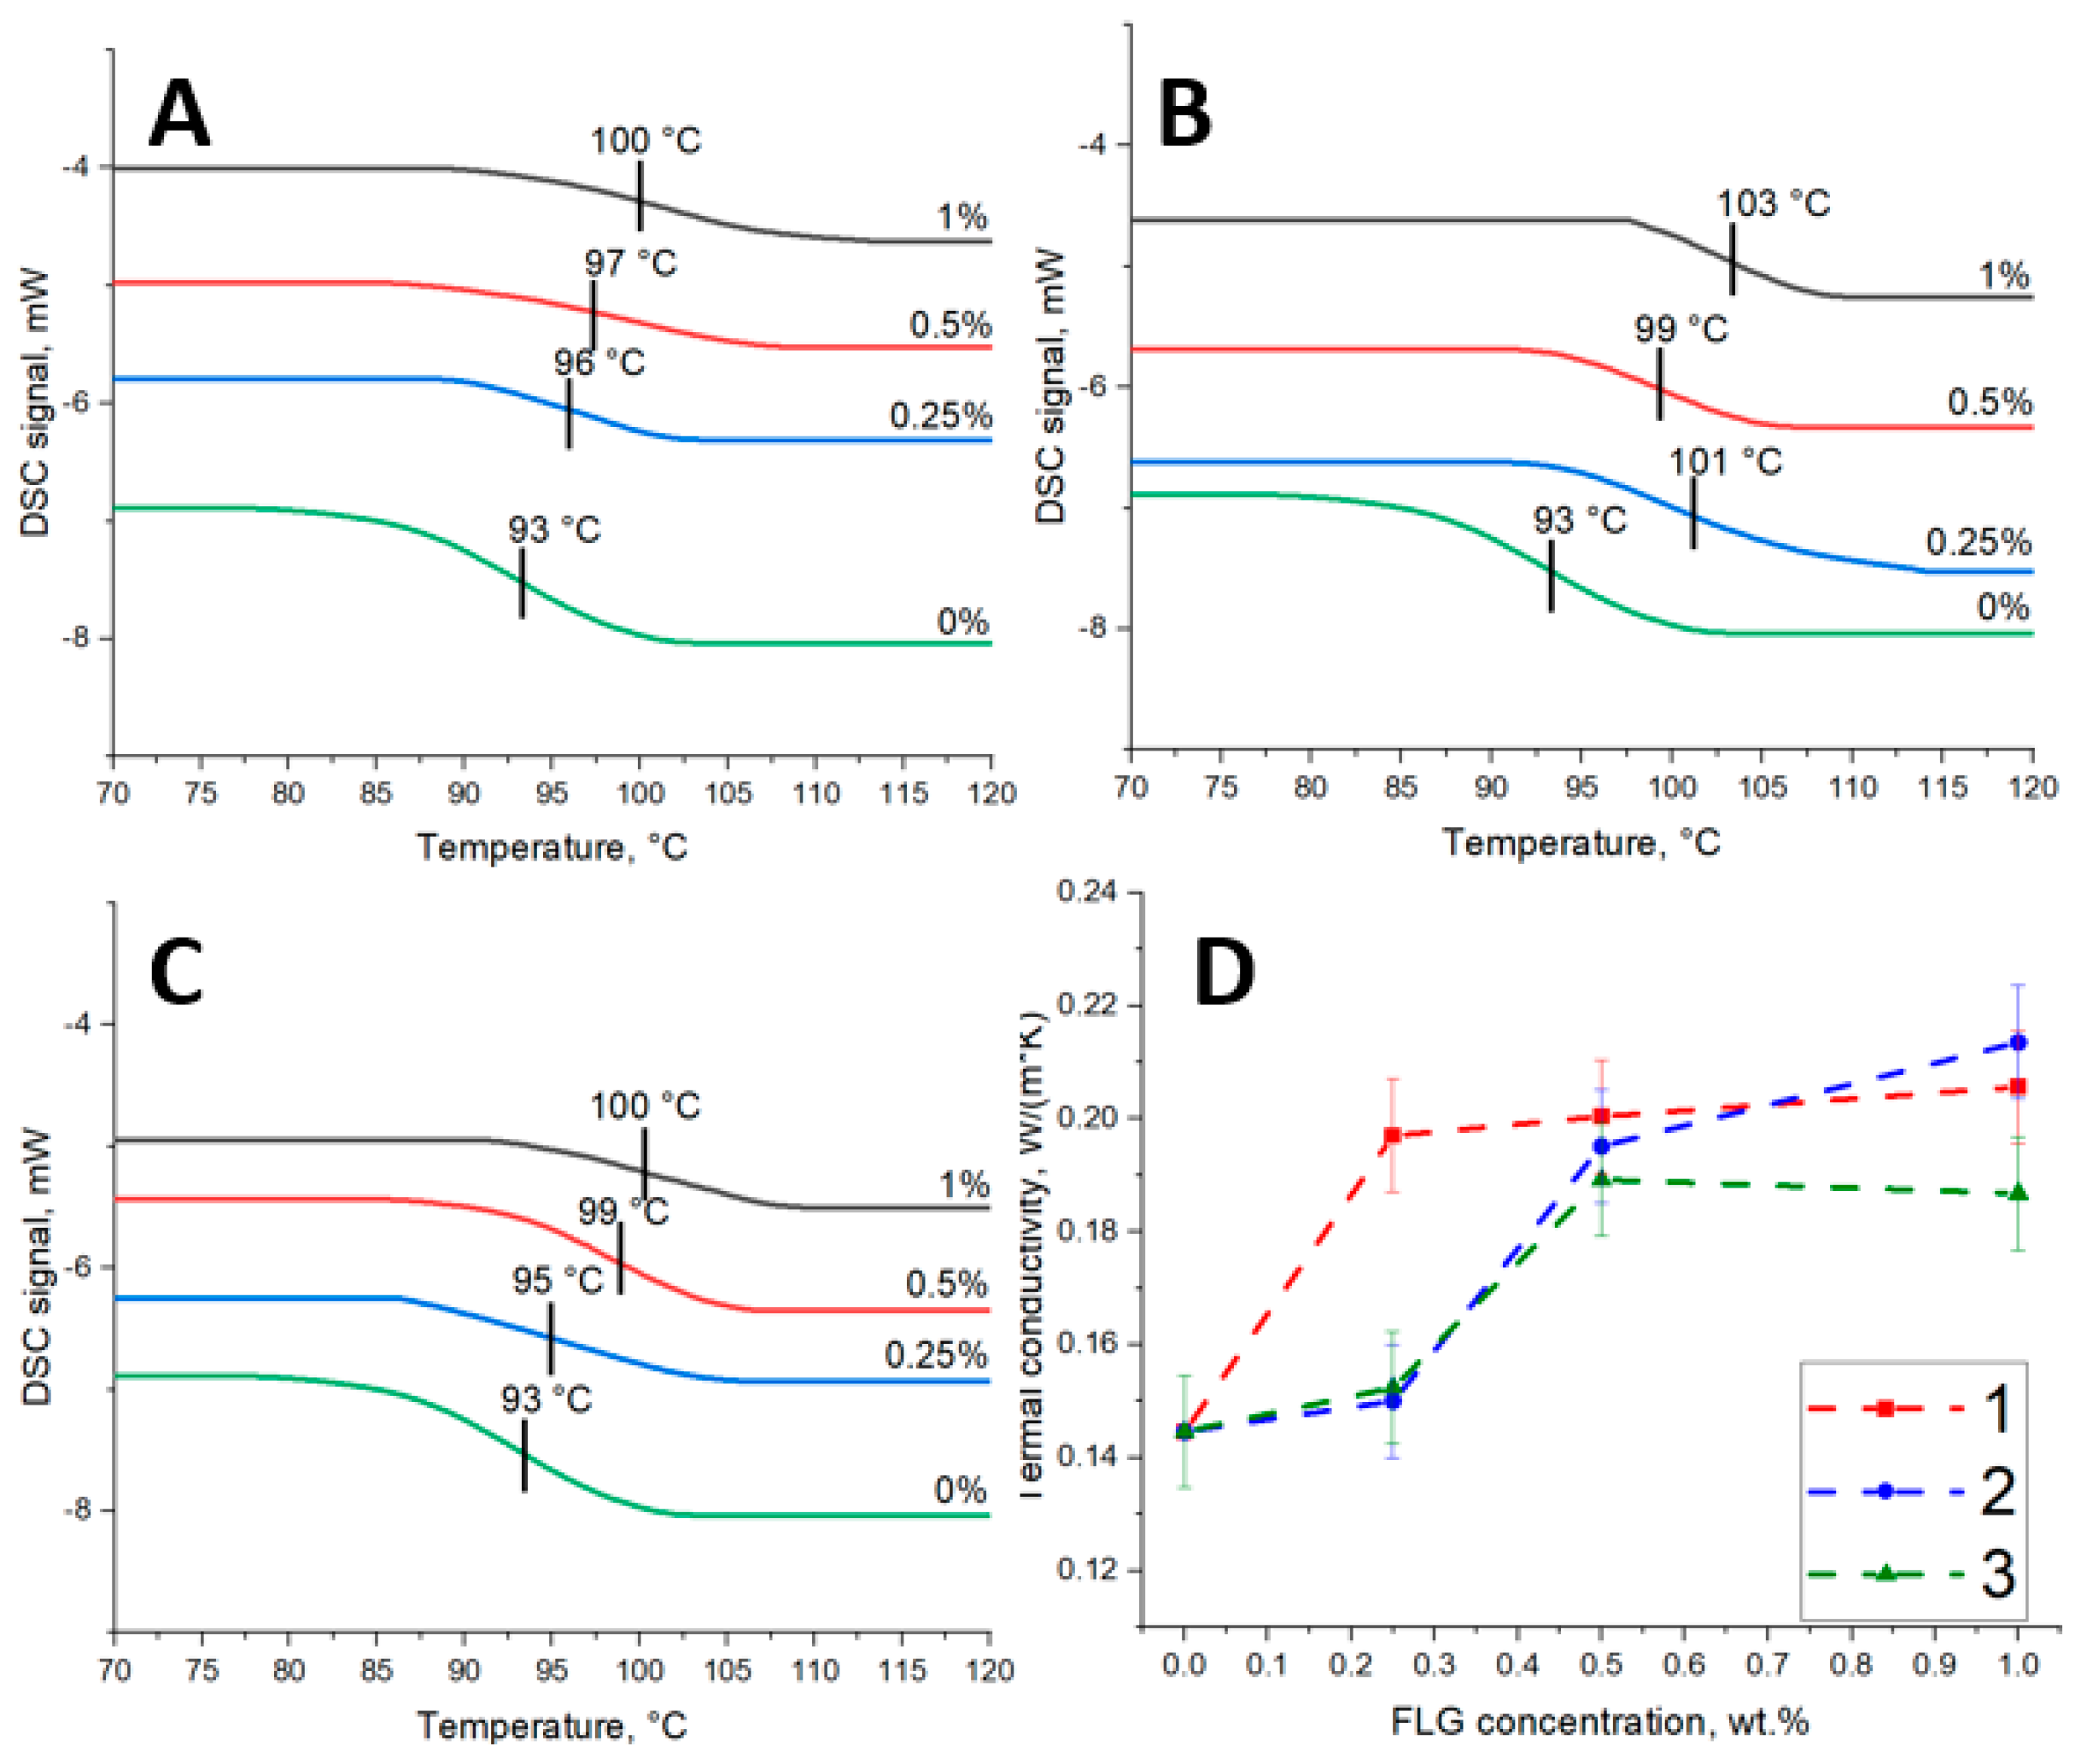
Figure 7.
Dependence of the tensile strength (A), compressive strength (C), bending strength (E), and the elastic modulus of the tensile strength (B), compressive strength (D), and bending strength (F) of epoxy resin on the concentration of FLG obtained from cellulose (1), glucose (2) and lignin (3).
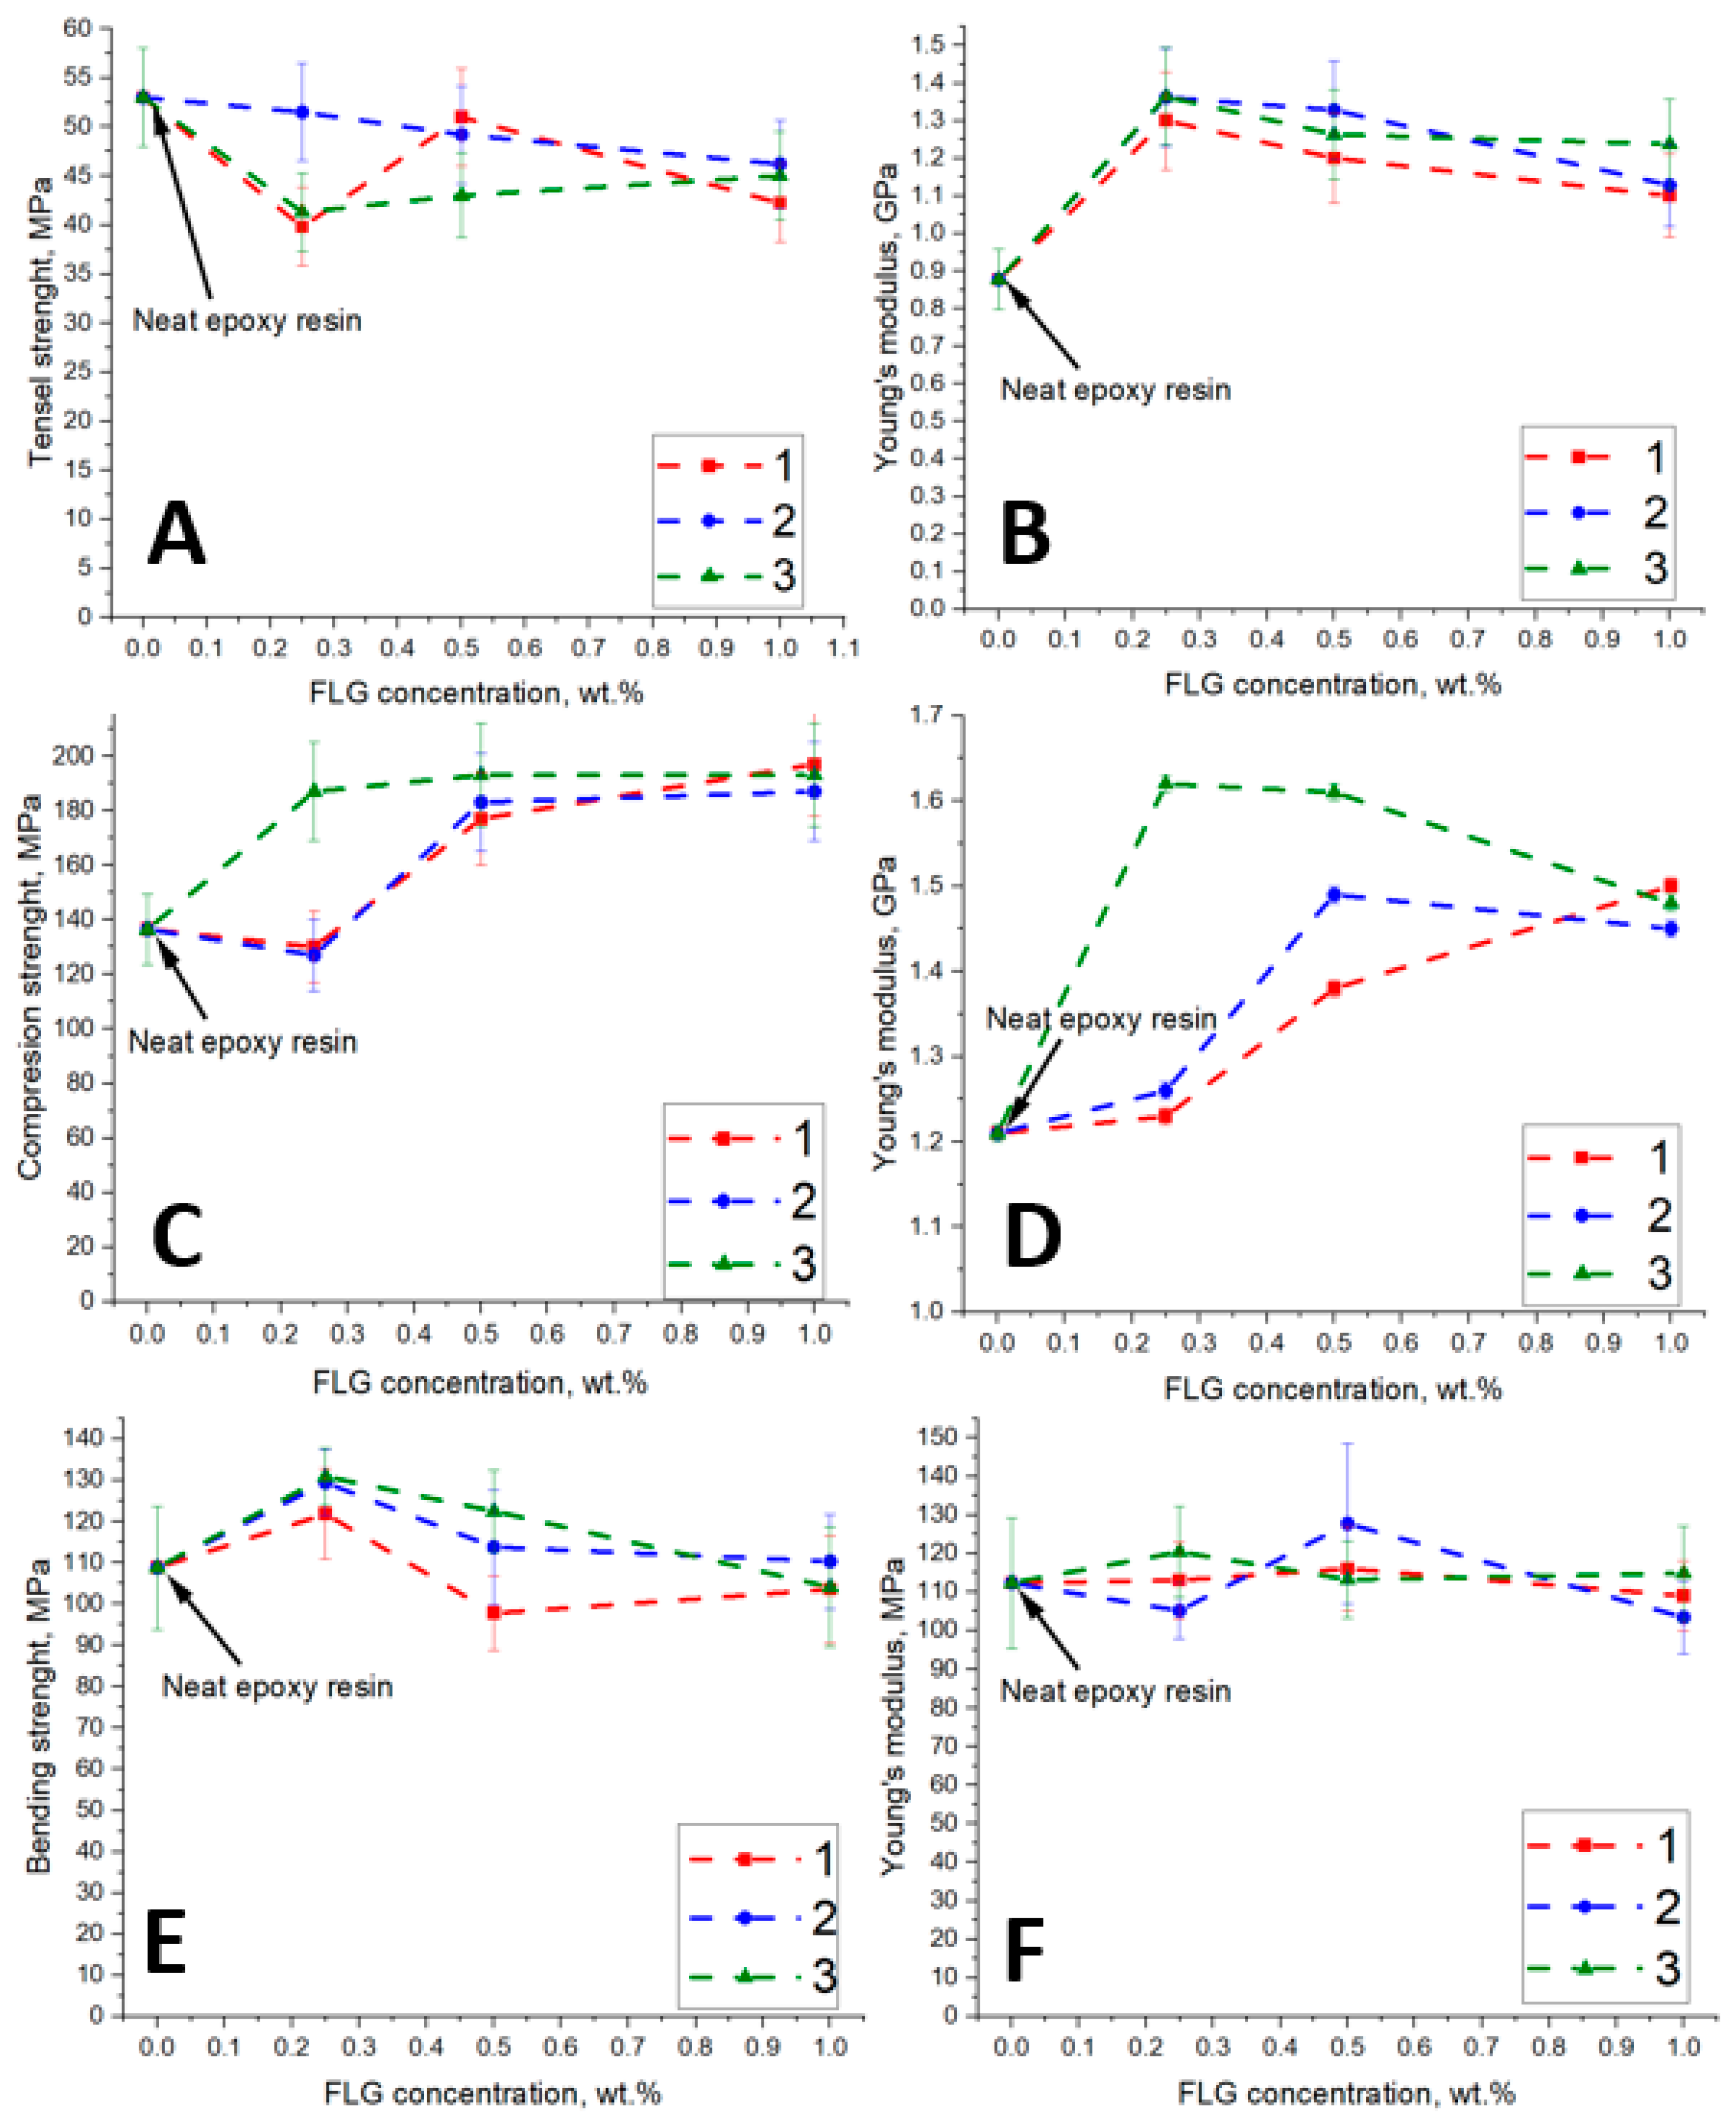
Figure 8.
Dependence of the friction coefficient of the steel/epoxy resin pair on the friction time at a concentration of FLG of 0, 0.25, 0.5, 1 wt. % obtained from cellulose (A), glucose (C) and lignin (E); Dependence of the temperature in the vicinity of the friction contact spot on the friction time at a concentration of FLG of 0, 0.25, 0.5, 1wt. % obtained from cellulose (B), glucose (D) and lignin (F).
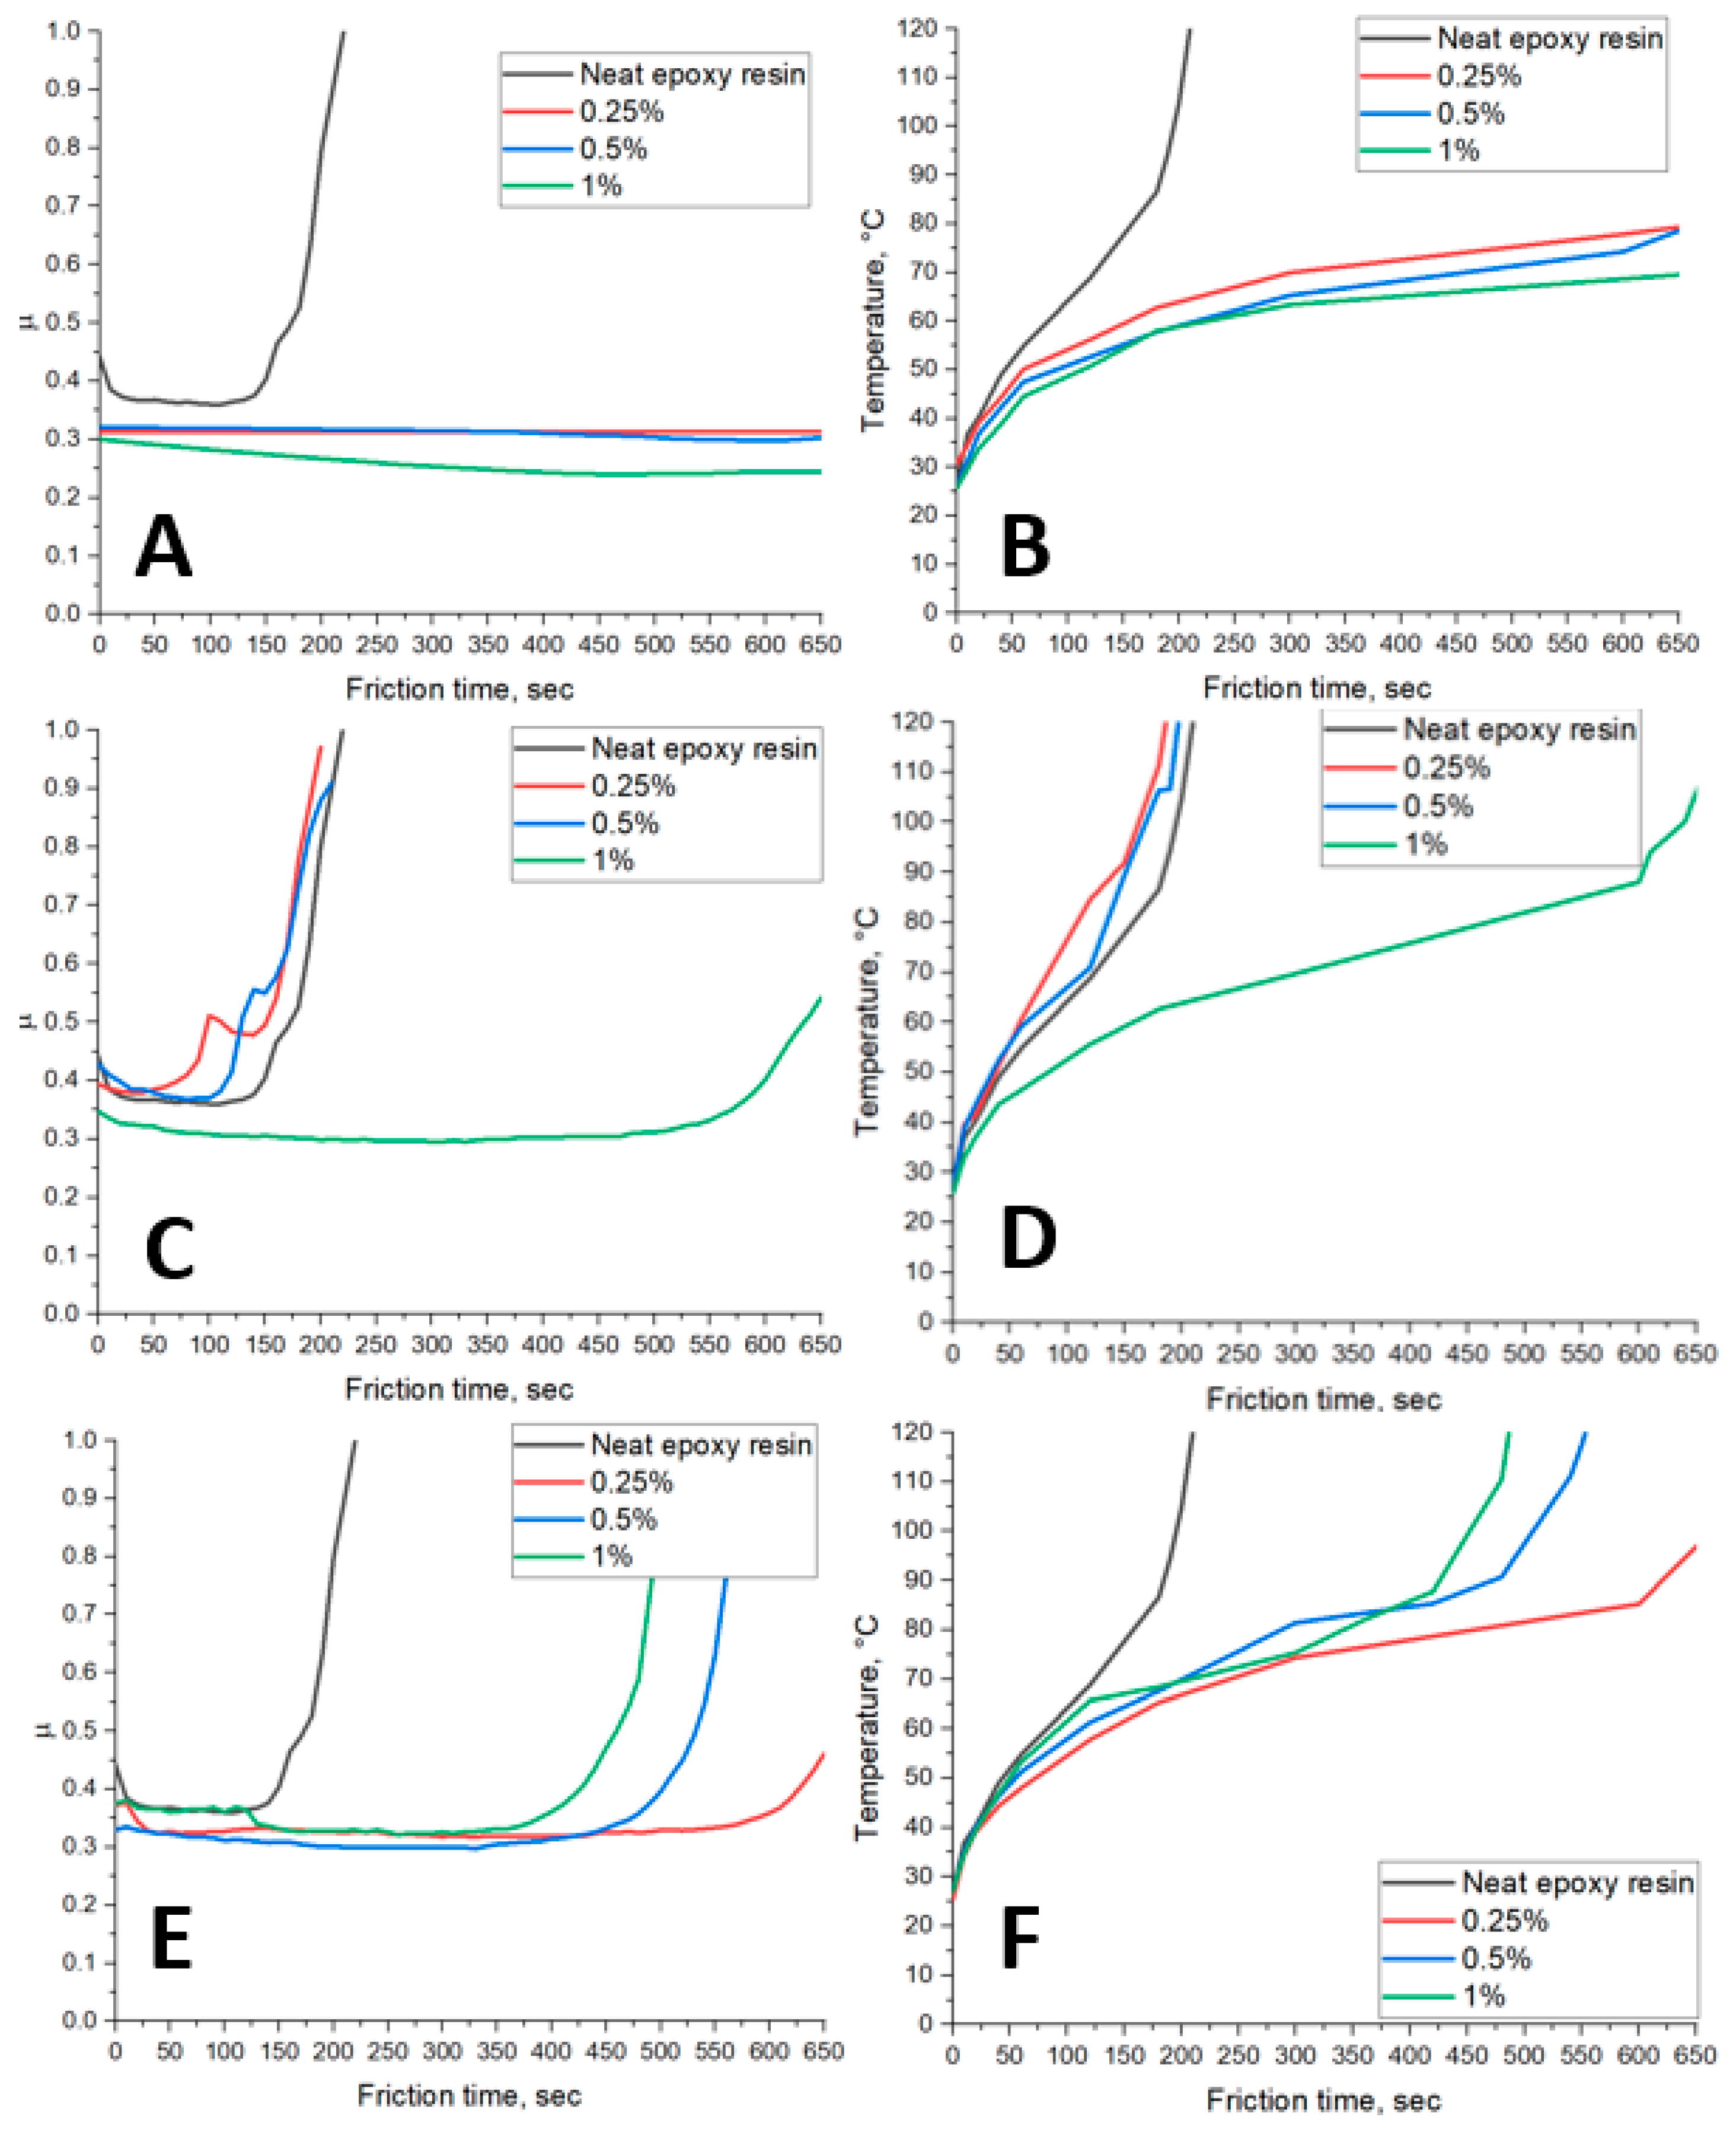

Table 1.
Elemental composition of FLG samples.
| Sample | C, at. % ± 1% | O, at. % ± 1% | N, at. % ± 1% |
|---|---|---|---|
| FLG from cellulose | 84 | 6 | 10 |
| FLG from glucose | 78 | 11 | 11 |
| FLG from lignin | 89 | 7 | 4 |
Table 2.
Specific surface area and pore volume of FLG samples.
| Sample | BET sample, м2/g ± 6% | Vpore, ml/g ± 6% | Vmicro, ml/g ± 6% |
|---|---|---|---|
| FLG from cellulose | 340 | 0.225 | 0.12 |
| FLG from glucose | 75 | 0.109 | 0 |
| FLG from lignin | 238 | 0.188 | 0.05 |
Disclaimer/Publisher’s Note: The statements, opinions and data contained in all publications are solely those of the individual author(s) and contributor(s) and not of MDPI and/or the editor(s). MDPI and/or the editor(s) disclaim responsibility for any injury to people or property resulting from any ideas, methods, instructions or products referred to in the content. |
© 2025 by the authors. Licensee MDPI, Basel, Switzerland. This article is an open access article distributed under the terms and conditions of the Creative Commons Attribution (CC BY) license (http://creativecommons.org/licenses/by/4.0/).
Copyright: This open access article is published under a Creative Commons CC BY 4.0 license, which permit the free download, distribution, and reuse, provided that the author and preprint are cited in any reuse.


