
Submitted:
21 February 2025
Posted:
24 February 2025
You are already at the latest version
Abstract
This study investigates the development and characterization of PBS/EA cellulose and PCL/EA cellulose biocomposites in order to understand their structural, morphological, and thermal properties for sustainable applications. Fourier-transform infrared (FTIR) spectroscopy, X-ray diffraction (XRD), scanning electron microscope (SEM), differential scanning calorimetry (DSC), and thermogravimetric analysis (TGA) were used to analyze these properties. FTIR analysis of PBS/EA cellulose composites showed increased hydroxyl peak intensities, suggesting possible interactions, whereas PCL/EA cellulose composites exhibited no significant interactions. XRD results revealed improved crystallinity in both composites with increased EA cellulose content. SEM images indicated enhanced surface morphology and good interaction in PBS/EA cellulose composites while PCL/EA cellulose composites showed a sea-island morphology, implying poor compatibility. DSC analysis showed that EA cellulose lowered the melting temperature of PBS, while minimal effects were observed in PCL composites. TGA results demonstrated improved thermal stability at lower EA cellulose contents in both PBS and PCL composites. These findings provide valuable insights into the potential of PBS/EA cellulose and PCL/EA cellulose biocomposites as biocompatible and sustainable materials, especially for applications in biomedical and environmentally friendly packaging sectors.
Keywords:
Biopolymer composites
; Eucomis autumnalis cellulose
; Structural and thermal analysis
; Morphological characterization
; Sustainable materials
1. Introduction
Over the past years, there has been an increasing demand for polymeric materials due to their numerous advantages, including low cost, easy processability, durability, and erosion resistance [1]. However, the use of synthetic or non-biodegradable polymers has significantly contributed to atmospheric and environmental pollution. The main issue is synthetic polymeric materials do not degrade but instead accumulate in wildlife habitats and aquatic environments when disposed [2]. The utilization of biodegradable polymers presents a compelling solution to the waste disposal challenges related to petroleum-based plastics. This is primarily attributed to their inherent biodegradability, biocompatibility, and environmental friendliness [3].
Among the various biodegradable polymers, polybutylene succinate (PBS) and polycaprolactone (PCL) stands out as a highly promising aliphatic biodegradable polyester due to their favorable properties. This is primarily attributed to their inherent biodegradability, biocompatibility, and environmental friendliness. Poly (butylene succinate) is synthesized from two monomers: succinic acid and 1,4- butanediol and exhibits good biodegradability, thermal stability and mechanical strength [4,5,6]. PCL is a semicrystalline biodegradable polymer, formed through the process of ring-opening polymerization of ԑ-caprolactone [7]. It demonstrates excellent resistance to liquid solvents, as well as exceptional mechanical and chemical properties, making it more suitable for diverse commercial applications [8]. To further enhance the properties of these two polymers PBS and PCL, the introduction of natural fillers including cellulose has been explored [9,10,11]. Cellulose is regarded as the most abundant organic biopolymer on earth with distinctive properties. It can be mostly acquired from different sources which includes plants, wood cell walls, algae tissues, as well as some species of bacteria [12,13]. Recent studies have focused on cellulose derived from medicinal plants as reinforcement materials because of their eco-friendly nature and availability [14]. Eucomis autumnalis, (known as pineapple lily) is a native medicinal plant abundant in Africa. It is a monocot originating from the kingdom of plantae, under the family of Asparagaceae, subfamily of Scilloideae. The bulbs of this plant have been extensively used in traditional medicine for treatment of variety diseases including respiratory issues, stomach aches, pain, fever and inflammation [15,16]. Recent studies have shown a growing interest in polymer-based composites reinforced with cellulose derived from various medicinal plants [10,14,17]. For instance, studies by Sikhosana et al. [10] and Selikane et al. [18], have explored the use of Eucomis autumnalis cellulose in biopolymers such as PLA and PCL, respectively. These studies demonstrated that cellulose-reinforced composites exhibit significant improvements in stiffness, and dimensional stability, making cellulose an ideal candidate for biopolymer enhancement. The extraction of cellulose from Eucomis autumnalis for biocomposites presents an opportunity to improve material performance and to support sustainable practices by using locally available, biodegradable plant resources.
This study explores the effect of Eucomis autumnalis (EA) cellulose on PBS and PCL by analysing their structural, morphological, and thermal properties. By incorporating EA cellulose into PBS and PCL matrices, we aim to provide comprehensive insights into the interactions between cellulose and these biopolymers. The findings contribute to the growing body of research on cellulose-based biocomposites, highlighting their potential for sustainable and biodegradable material development.
2. Materials and Methods
2.1. Materials
2.1.1. Eucomis autumnalis
The Eucomis autumnalis (EA) plant was collected from the District of Maseru, situated in Lesotho, a country surrounded by South Africa. The taxonomy of this plant shows that it belongs to the kingdom Plantae under the family of Asparagaceae within the genus of Eucomis. Figure 1 (a) is the flowering plant of the E. autumnalis. Only the leaves were used to prepare cellulose in this project.
Extraction of cellulose from Eucomis autumnalis plant leaves
To prepare the plant material, the leaves were stripped, then washed with distilled water, and oven-dried at 40 ℃ for 3 weeks. The dried leaves were then ground into a fine powder using a blender. Figure 1 (b) is the dried fine powder of E. autumnalis leaves.
Delignification and hemicellulose removal
The finely dried powder of E. autumnalis leaves was bleached using 0.7 % (w/v) of sodium chloride solution. The pH of this mixture was then adjusted to 4 using 5 % acetic acid solution. To further remove lignin, the mixture was heated at 100 ℃ in a water bath for 5 hours, then washed with distilled water. The residuals from this mixture were further heated in 250 ml of 5% sodium sulphite solution in a water bath at 100 ℃ for 5 hours, followed by thorough wash with distilled water to completely remove lignin[10].
Isolation of cellulose
The residues from the previous step (delignification), were further treated with 250 ml of 18% (w/v) sodium hydroxide in a water bath set at 100 ℃ for 5 hours to remove hemicellulose. The resultant product obtained by filtration, was washed with distilled water and air-dried. To further remove other impurities, the recovered cellulose was further treated with 50 ml of dimethyl sulfoxide (DMSO), washed with distilled water, and then air-dried. Table 1 shows the chemical composition of cellulose extracted from E. autumnalis leaves. It shows the mass of the ground leaf powder, the mass of cellulose extracted, and the percentage yield of cellulose. From 60.02 grams of ground leaf powder, 23.02 grams of cellulose were extracted, resulting in a 38% cellulose yield. This indicates that 38% of the ground leaf material is composed of cellulose.
2.1.2. Poly (Butylene succinate) (PBS)
Commercial poly (butylene succinate) (PBS) pellets, extended with 1,6-diisocynatohexane was purchased from Sigma-Aldrich in Johannesburg, South Africa. It has a density of 1,3 g cm⁻³, melting temperature of 120 ℃ and weight-average molecular weight of 63 000 g mol-1 [19]
2.1.3. Poly (ԑ-Caprolactone) (PCL)
CapaTM 6500 polycaprolactone (PCL) pellets were purchased from Southern Chemicals in Johannesburg, South Africa. It has a density of 1.10 g cm -3, a glass transition temperature of -61°C and a melting temperature of 60°C, degree of crystallinity of 35.7 %, and weight-average molecular weight of 113,400 g mol-1 [19].
2.2. Sample Preparation
All the samples (neat PBS, neat PCL, their blends, and blend composites) were prepared via solution casting using chloroform (from Consumable & Chemical supplies with an assay of 99.9 %, density of 1.49 g cm-3 and molecular weight of 119.38 g mol-1). Chloroform was used because it dissolved both polymers at room temperature and evaporated easily. To prepare the thin films of neat PBS and PCL, a mass of 0.5 g of each polymer was weighed and dissolved in 15 ml of chloroform. The samples’ solution was then stirred at room temperature for an hour then casted into evaporating dishes and left to dry for 4 hours. The blends of PBS and PCL composites filled with different content of cellulose (1, 3 and 5 wt.%) films were also prepared by weighing different masses that make up to 0.5 g and dissolve in 15 ml of chloroform. The same procedure of stirring the solution for an hour, casting it into the evaporating dishes and dry for 4 hours was also followed. Finally, the thin films were then characterized. Table 2 indicates different compositions of all the prepared samples.
2.3. Sample Characterization
2.3.1. Fourier Transform Infrared (FTIR) Spectroscopy
The samples were analysed using the Perkin Elmer Spectrum 100 series spectrometer fitted with a PIKE MiracleTM ATR, equipped with a diamond crystal. In this machine the wavenumber was set over the range of 450-4000 cm-1, using a resolution of 4 cm-1 and total running of 8 scans.
2.3.2. X-Ray Diffraction (XRD)
X-ray diffraction analyses were done using a Bruke AXS D8 ADVANCED Discover diffractometer powder diffractometer with Cu Kα (1.5418 Å) radiation. Continuous scans of the samples were carried out at 40 mA and 40 kV voltage using a locked coupled at a count interval of 1s. The diffraction spectra were recorded in the 2θ range 20-80o with scan rate of 0.02 ⁰/s.
2.3.3. Scanning Electron Microscopy (SEM)
All prepared samples were surface fractured using liquid nitrogen and morphologies were studied using JSM- 7800F Extreme-resolution Analytical Field Emission SEM. The samples were coated with 5 nm Iridium to ensure that the charge deposited on the surface of the sample by electron beam is earthed.
2.3.4. Differential Scanning Calorimetry (DSC)
A Perkin-Elmer, Pyris 6000 Differential scanning calorimetry was used to characterize the samples. The analysis was performed under nitrogen atmosphere flow (20 ml/min). All samples with a mass (~ 6.70 mg) were subjected to two heating cycles (from 0 to 130 ℃) and one cooling cycle (from 130 to 0 ℃) at a rate of 10 ℃/min. Glass transition temperature, cold crystallization, melting temperature as well as enthalpies were determined from first heating, cooling, and second heating scans. The degree of crystallinity was also calculated using Equation 1 (for neat polymers) and Equation 2 (for the composites).
where Xc is the degree of crystallinity, ΔHm is the melting enthalpy of the measured sample, ΔH⁰m is the melting enthalpy of the 100% crystalline polymer, ϕ is the weight fraction of a polymer in a blend or composites. Values of 200 J/g [20] and 139 J/g [21] for PBS and PCL respectively.
2.3.5. Thermogravimetric Analysis (TGA)
The thermal stability of the neat polymers, blends and composites were carried out on a Perkin-Elmer STA6000 Thermogravimetric analyzer. A mass of ~22 mg samples were heated from 30 - 650 ℃ under flow of nitrogen atmosphere (10℃/min) and the mass loss % was recorded for each of the samples.
3. Results and Discussion
This section may be divided by subheadings. It should provide a concise and precise description of the experimental results, their interpretation, as well as the experimental conclusions that can be drawn.
3.1. Structural Properties
3.1.1. Fourier Transform Infrared (FTIR) Spectroscopy
The results indicate that FTIR successfully identified the functional groups present in neat PBS, PCL, and EA cellulose, as well as in their various composites.
For neat PBS, as shown in Figure 2 and summarized in Table 3, several characteristic peaks were observed. The initial peak at 3000-2845 cm⁻¹ was assigned to C–H bond stretching, followed by a sharp peak between 1713-1710 cm⁻¹ attributed to the stretching vibration of the ester carbonyl group in the crystalline phases of PBS. The peaks at approximately 1264 and 1144 cm⁻¹ correspond to the out-of-plane oscillations of CH₂ and the symmetrical vibration of C–O–C bonds, respectively, which were also reported in similar studies [22,23]. Finally, the peak at 917 cm⁻¹ corresponds to the C–OH bending of carboxylic acid groups in PBS, further confirming its structure. In the case of neat PCL, as depicted in Figure 2, characteristic peaks were observed at 3000 and 2840 cm⁻¹, assigned to CH₂ stretching vibrations. An intense sharp peak at around 1730-1715 cm⁻¹ corresponds to C=O stretching. Additionally, the bands at 1293 and 1240 cm⁻¹ were assigned to C–C and C–O stretching in crystalline and amorphous phases, respectively, while peaks at 1190 and 1170 cm⁻¹ represent the asymmetric and symmetric stretching of C–O–C bonds. For neat EA cellulose, the IR spectrum displayed a broad peak around 4000-2995 cm⁻¹ attributed to O–H stretching and indicating strong hydroxyl group presence. The band at 2890 cm⁻¹ was assigned to C–H stretching of hydrocarbons, and a peak at 1640 cm⁻¹ indicated water absorption, as suggested by previous studies [24]. Bands at 1162 and 1022 cm⁻¹ corresponded to C–O ether stretching, characteristic of EA cellulose.
In Figure 3 (a), the FTIR spectra of neat PBS and its composites with EA cellulose (1, 3, and 5 wt.%) show that for neat PBS, peaks at 2926 cm⁻¹ and 1711 cm⁻¹ correspond to C–H and carbonyl stretching, respectively, while peaks at 1327 and 1158 cm⁻¹ are attributed to CH₂ stretching and C–O–C vibration. The composites displayed an increase in peak intensity around 1711 and 1158 cm⁻¹, suggesting enhanced interaction between EA cellulose and the less crystalline PBS matrix. These findings are consistent with the hypothesis that the hydroxyl groups of EA cellulose interact favourably with the amorphous regions of PBS, allowing stronger interfacial adhesion [25].
In Figure 3 (b), the FTIR spectra of neat PCL and its composites with EA cellulose show that the PCL samples exhibited a characteristic peak around 1730-1715 cm⁻¹ for C=O stretching, with additional peaks at 1364 and 1398 cm⁻¹ for CH₂ bending, and 1291 and 1179 cm⁻¹ for C–C and C–O stretching, respectively. All the composites of PCL showed similar spectral features to neat PCL, with no noticeable changes upon the addition of EA cellulose. This suggests that the addition of EA cellulose does not significantly change the PCL structure. This further indicates limited chemical interaction between PCL and EA cellulose in the composite matrix.
3.1.2. X-Ray Diffraction (XRD)
The XRD was used to study the crystal structure of the prepared samples. As shown in Figure 4, neat PBS exhibits a monoclinic crystal structure, with distinct diffraction peaks at 2θ = ~20.6° and 23.2° representing the crystalline α phase. The broader peak at 44.0° corresponds to the amorphous phase of PBS. This indicates a higher amorphous content than crystalline content, consistent with findings from prior studies [5,26]. Analysis of neat PCL reveals an orthorhombic structure with strong, narrow peaks at 2θ = 21.5° and 23.9°, associated with higher crystallinity as compared to neat PBS. Neat EA cellulose displays characteristic peaks at 2θ = 15.4°, 20.9°, 24.6°, 27.6°, and 32.8°, attributed to a triclinic structure, with broad but intense peaks indicating a balance between crystalline and amorphous phases.
Figure 5 (a) shows neat PBS and its composites with EA cellulose at varying loadings (1, 3, and 5 wt.%). The graph displays shifts in diffraction peaks, with the peak intensity decreasing for the 1 wt.% EA cellulose composite. This reduction and peak shift suggest increased unit cell spacing, resulting in greater amorphous regions within PBS. For 3 and 5 wt.% composites, intense crystalline peaks re-emerge, possibly due to hydrogen bonding between PBS and EA cellulose, promoting alignment of polymer chains and thus increasing crystallinity. The findings align with prior results suggesting that higher EA cellulose content facilitates hydrogen bonding, enhancing crystalline alignment [27,28]. Figure 5 (b) presents the diffraction patterns of neat PCL and its composites. The PCL two primary peaks, observed at 2θ = 21.5° and 23.9°, shift slightly to higher angles and increase in intensity with increased EA cellulose content. This shift corresponds to decreased unit cell spacing within the PCL matrix, enhancing crystallinity across composites.
3.2. Morphological Properties
3.2.1. Scanning Electron Microscopy (SEM)
Morphological analysis is important for understanding the interactions between the components in polymer composites. In this study, SEM was used to examine the morphology of the prepared samples. The SEM images of neat and blended materials are shown in Figure 6. Neat EA cellulose (Figure 6 (a)) displays a fibrous morphology, which is consistent with similar observations reported by Selikane et al.[18]. The SEM image of neat PBS (Figure 6 (b)) shows a rough, porous surface. This morphology agrees with findings by Asif et al. [29], who observed similar features in PBS films produced using the solvent casting method. The neat PCL sample (Figure 6 (c)) exhibited a smooth surface without any pores, which is typical for PCL.
Further morphological studies were conducted on PBS/EA cellulose composites, as shown in Figure 7. SEM images of neat PBS (Figure 7 (a)) revealed a porous surface. However, when EA cellulose was added at 1 wt.% (Figure 7 (b)), the EA cellulose seemed to occupy the pores, making the surface of the PBS smoother. As the content of EA cellulose increased to 3 wt.% (Figure 7 (c)), the fibres became clearly visible and were well-dispersed within the PBS matrix, further reducing the number of visible pores. At 5 wt.% of EA cellulose (Figure 7 (d)), the dispersion of the cellulose fibers was even more pronounced, with the fibers well distributed and the surface pores almost completely closed. This suggests that EA cellulose has a good compatibility with PBS due to the hydrophilicity of PBS, as evidenced by the improved dispersion and reduced pore size. This further indicates a good interaction between PBS and EA cellulose as observed on FTIR results (Figure 3 (a))
In the case of PCL/EA cellulose composites, as shown in Figure 8, neat PCL (Figure 8 (a)) still exhibited a smooth surface. With the addition of 1 wt.% EA cellulose (Figure 8 (b)), the morphology of PCL remained largely unchanged, but the cellulose appeared to be situated on the surface of the PCL, indicating poor adhesion between the two components. At higher EA cellulose content of 3 wt.% (Figure 8 (c)) and 5 wt.% (Figure 8 (d)), the SEM images revealed the formation of cracks and pores in the PCL matrix. At 5 wt.% EA cellulose, a sea-island morphology was observed, which was attributed to the pulling out of the cellulose fibers, leaving behind pores and scratches in the PCL surface. These results indicate poor interaction between PCL and EA cellulose. Selikane et al. [18] also reported similar findings.
3.3. Thermal Properties
3.3.1. Differential Scanning Microscopy (DSC)
The evaluation of the thermal properties of polymer blend systems is vital in understanding various transitions within these materials. DSC was used to investigate the thermal characteristics of the prepared samples, focusing on key transitions such as melting temperature, crystallization temperature, and associated enthalpies. The DSC cooling curves presented in Figure 9 and 10 as well as Table 4 show the crystallization behaviour of neat PBS and neat PCL. Neat PBS exhibits a crystallization temperature (Tc) around 90.9°C, while PCL crystallizes at a lower temperature, approximately 29.8°C.
Figure 10 (a) and (b) shows the impact of EA cellulose on the cooling curves of PBS and PCL. For PBS and its composites with EA cellulose, the crystallization temperature remains consistent, but the intensity and enthalpy of crystallization decrease as EA cellulose content increases (from -70.1 J/g to -55.6 J/g). This reduction suggests that EA cellulose may act as a plasticizing agent and a crystallization inhibitor, thereby reducing both the crystallization rate and the uniformity of PBS crystals. In Figure 10 (b), the cooling curves for PCL and its composites with EA cellulose show no significant shift in crystallization temperature, which remains relatively stable. However, a decrease in peak intensities and enthalpies occurs with no clear order based on EA cellulose content, indicating that EA cellulose disrupts crystallization process of PCL without substantially changing the Tc.
The DSC thermograms of neat PBS and PCL are shown in Figure 11 For neat PBS, two melting peaks are observed. This indicates the presence of a crystalline structure that forms regions with varying degrees of organization. The first melting peak, occurring at approximately 107.4 ℃, corresponds to the melting of smaller, less ordered crystallites, while the second peak at around 115.4 ℃ is attributed to the melting of larger, more ordered crystalline regions. This observation suggests the heterogeneity of the crystalline structure in PBS. Yoo et al. [30] reported similar observations with double melting peaks for PBS, attributing the first peak to the melting of original crystallites and the second peak to the melting of recrystallized ones. The enthalpies for these peaks were found to be 12.4 J/g and 35.5 J/g, respectively, with a calculated degree of crystallinity (Xc) of 31.6%. In contrast, neat PCL displayed only a single melting peak at 57.6 ℃, with a higher degree of crystallinity (40.0%) compared to PBS. This result was also confirmed by X-ray Diffraction (XRD) analysis, which revealed that PCL was more crystalline than PBS.
In Figure 12 (a), the DSC curves of neat PBS and its composites with EA cellulose at various loadings (1, 3, and 5 wt.%) are shown. The addition of EA cellulose to PBS resulted in a slight decrease in the melting temperature of PBS for all the composites. The addition of 1 wt.% of EA cellulose caused the PBS peaks to become more intense but also broader, which was attributed to the melting of imperfect crystals due to the introduction of EA cellulose. For the composites with 3 and 5 wt.% EA cellulose, the peaks became narrower but less intense, and the enthalpy and Xc decreased with increasing EA cellulose content. This suggests that EA cellulose inhibits the crystallization and arrangement of PBS crystals, leading to a reduction in the crystalline phase and a decrease in Xc. The reduction in the melting temperature indicates that EA cellulose has a plasticizing effect on PBS, increasing the free volume within PBS chains. This phenomenon was also observed in the SEM images (Figure 7). Shi et al. [25] reported similar findings, noting a decrease in Tm and ΔHm of PBS upon the addition of EA cellulose triacetate (CT). This was attributed to the restriction of molecular movement and hindrance of crystallization caused by CT. For neat PCL and its composites with EA cellulose (1, 3, and 5 wt.%), the DSC curves are shown in Figure 12 (b). The results reveal that the presence of EA cellulose did not significantly affect the melting temperature of PCL. However, there was a noticeable decrease in the intensities, enthalpies, and degree of crystallinity as the content of EA cellulose increased. Studies [31,32,33] have reported similar negligible effects of cellulose on the Tm of PCL. The melting enthalpy of PCL decreased from 55.6 J/g to 47.6 J/g with increasing loadings of EA cellulose, indicating that EA cellulose reduces the lamellae thickness of PCL crystals, resulting in less perfect crystal formation.
3.3.2. Thermogravimetric Analysis (TGA)
The thermal stability of the investigated samples was assessed using TGA, with a temperature range from 30 to 650 °C at a heating rate of 10 °C min-1. The results, as shown in Table 5 and Figure 13 and Figure 14, and 15, demonstrate the thermal degradation characteristics of various materials. Neat PBS begins to degrade at 347.9 °C and reaches its maximum decomposition temperature of 402.2 °C, with a residue of approximately 0.8%. This indicates that PBS has relatively low thermal stability compared to other materials tested. Neat PCL, on the other hand, exhibits a higher degradation onset at 360.9 °C, with its maximum decomposition occurring at 413.2 °C and a residue of 0.9%, making it more thermally stable than PBS. In contrast, neat EA cellulose shows a two-step degradation process. The first step occurs between 28 and 100 °C, attributed to the loss of absorbed and adsorbed water. The second degradation phase begins at 267 °C and extends to 344.4 °C, reflecting the breakdown of both cellulosic and non-cellulosic materials. The residue from EA cellulose is significantly higher, around 15%, highlighting its higher content of non-volatile materials.
PBS/EA cellulose and PCL/EA cellulose composites exhibit differing behavior depending on the cellulose content. For example, in the PBS/EA cellulose composites (Figure 14), the addition of EA cellulose reduces the thermal stability, especially at higher loadings of 3 and 5 wt.%. These concentrations disrupt the polymer chain movement within PBS, leading to reduced crystallinity and thermal stability. Similarly, the PCL/EA cellulose (Figure 15) composites behave similarly, with the 1 wt.% EA cellulose composite showing improved thermal stability over neat PCL, while higher cellulose loadings (3 and 5 wt.%) result in decreased thermal stability due to the disruption of crystalline structure of PCL.
4. Conclusions
Overall, this study provides valuable insights into the structural, thermal, and morphological properties of PBS/EA cellulose and PCL/EA cellulose composites, highlighting their potential for sustainable and biocompatible applications. FTIR analysis revealed increased hydroxyl peak intensities in PBS/EA cellulose composites. This suggested possible interactions between the two components, while no significant interactions were observed in PCL/EA cellulose composites. XRD results indicated an improvement in crystallinity with increasing cellulose content in both systems. SEM analysis showed good dispersion of EA cellulose in PBS. This suggested strong interfacial interaction, whereas PCL/EA cellulose composites exhibited a sea-island morphology, indicating poor compatibility. DSC results demonstrated that adding EA cellulose lowered the melting temperature of PBS, while its effect of PCL composites was minimal. TGA analysis further confirmed improved thermal stability at lower EA cellulose loadings in both composites. These findings contribute to the growing body of research on cellulose-based biocomposites and provide valuable insights into the role of EA cellulose in modifying the properties of PBS and PCL. It also paves the way for their use in environmentally friendly and biodegradable materials.
Author Contributions
Conceptualization, F.K. and T.G.; methodology, F.K.; validation, M.M., M.M. and T.G.; formal analysis, F.K., M.M., M.M., T,G.; investigation, F.K.; resources, T.G, M.M; data curation, F.K; writing—original draft preparation, F.K.; writing—review and editing, T,G; supervision, M.M, M.M, T.G.; project administration, M.M.; funding acquisition, T.G.
Funding
This research was funded by National Research Foundation (NRF) Thuthuka Programme, grant number TTK2204264865, as well as NRF Sasol Inzalo Foundation, grant number PMDS22062427103.
Data Availability Statement
Data required are available upon request.
Conflicts of Interest
The authors declare no conflicts of interest.
Abbreviations
The following abbreviations are used in this manuscript:
| EA | Eucomis autumnalis |
| PBS | Poly (butylene succinate) |
| PCL | Poly(caprolactone) |
| FTIR | Fourier-transform infrared spectroscopy |
| XRD | X-ray Diffraction |
| SEM | Scanning electron microscopy |
| DSC | Differential scanning calorimetry |
| TGA | Thermogravimetric analysis |
References
- Filiciotto, L.; Rothenberg, G. Biodegradable Plastics: Standards, Policies, and Impacts. ChemSusChem 2021, 14, 56–72. [Google Scholar] [CrossRef] [PubMed]
- Bartl, A. Textile Waste. Waste: A Handbook for Management 2011, 167–179. [CrossRef]
- Samir, A.; Ashour, F.H.; Hakim, A.A.A.; Bassyouni, M. Recent Advances in Biodegradable Polymers for Sustainable Applications. Npj Mater Degrad 2022, 6, 1. [Google Scholar] [CrossRef]
- Peñas, M.I.; Pérez-Camargo, R.A.; Hernández, R.; Müller, A.J. A Review on Current Strategies for the Modulation of Thermomechanical, Barrier, and Biodegradation Properties of Poly (Butylene Succinate) (PBS) and Its Random Copolymers. Polymers (Basel) 2022, 14. [Google Scholar] [CrossRef]
- Laura, A.; Seggiani, M.; Lazzeri, A.; Vito, G.; Patrizia, C. A Brief Review of Poly ( Butylene Succinate ) ( PBS ) and Its Main and Applications. Polymer (Guildf) 2022, 14, 23. [Google Scholar]
- Rafiqah, S.A.; Khalina, A.; Harmaen, A.S.; Tawakkal, I.A.; Zaman, K.; Asim, M.; Nurrazi, M.N.; Lee, C.H. A Review on Properties and Application of Bio-based Poly(Butylene Succinate). Polymers (Basel) 2021, 13, 1–28. [Google Scholar] [CrossRef] [PubMed]
- Azimi, B.; Nourpanah, P.; Rabiee, M.; Arbab, S. Poly (ε-Caprolactone) Fiber: An Overview. J Eng Fiber Fabr 2014, 9, 74–90. [Google Scholar] [CrossRef]
- Mofokeng, J.P.; Luyt, A.S. Dynamic Mechanical Properties of PLA/PHBV, PLA/PCL, PHBV/PCL Blends and Their Nanocomposites with TiO2 as Nanofiller. Thermochim Acta 2015, 613, 41–53. [Google Scholar] [CrossRef]
- Chen, J.; Huang, Y.; Deng, L.; Jiang, H.; Yang, Z.; Yang, R.; Wu, D. Preparation and Research of PCL/Cellulose Composites: Cellulose Derived from Agricultural Wastes. Int J Biol Macromol 2023, 235, 123785. [Google Scholar] [CrossRef]
- Sikhosana, S.T.; Gumede, T.P.; Malebo, N.J.; Ogundeji, A.O.; Motloung, B. The Influence of Cellulose Content on the Morphology, Thermal, and Mechanical Properties of Poly(Lactic Acid)/Eucomis Autumnalis Cellulose Biocomposites. Polym Eng Sci 2023, 63, 1411–1422. [Google Scholar] [CrossRef]
- Celebi, H.; Ilgar, M.; Seyhan, A.T. Evaluation of the Effect of Isocyanate Modification on the Thermal and Rheological Properties of Poly(ε-Caprolactone)/Cellulose Composites. Polymer Bulletin 2022, 79, 4941–4955. [Google Scholar] [CrossRef]
- Seddiqi, H.; Oliaei, E.; Honarkar, H.; Jin, J.; Geonzon, L.C.; Bacabac, R.G.; Klein-Nulend, J. Cellulose and Its Derivatives: Towards Biomedical Applications; Springer Netherlands, 2021; Vol. 28; ISBN 1057002003.
- Müller, A.; Zink, M.; Hessler, N.; Wesarg, F.; Müller, F.A.; Kralisch, D.; Fischer, D. Bacterial Nanocellulose with a Shape-Memory Effect as Potential Drug Delivery System. RSC Adv 2014, 4, 57173–57184. [Google Scholar] [CrossRef]
- Sikhosana, S.T.; Gumede, T.P.; Malebo, N.J.; Ogundeji, A.O.; Motloung, B. Medicinal Plants as a Cellulose Source for the Fabrication of Poly(Lactic Acid) Composites: A Mini-Review. Polymers from Renewable Resources 2023, 14, 44–57. [Google Scholar] [CrossRef]
- Taylor, J.L.S.; van Staden, J. The Effect of Age, Season and Growth Conditions on Anti-Inflammatory Activity in Eucomis Autumnalis (Mill.) Chitt. Plant Extracts. Plant Growth Regul 2001, 34, 39–47. [Google Scholar] [CrossRef]
- Ndhlala, A.R.; Mulaudzi, R.B.; Kulkarni, M.G.; Van Staden, J. Effect of Environmental Factors on Seedling Growth, Bulb Development and Pharmacological Properties of Medicinal Eucomis Autumnalis. South African Journal of Botany 2012, 79, 1–8. [Google Scholar] [CrossRef]
- Selikane, D.G.A.; Gumede, T.P.; Shingange, K.; Malevu, T.D. A Brief Overview on the Extraction of Cellulose from Medicinal Plants for Advanced Applications. Materials Science Forum 2022, 1059 MSF, 81–85. [Google Scholar] [CrossRef]
- Selikane, D.G.; Gumede, T.P.; Shingange, K.; Malevu, T.D.; Ngwenya, M.; Kumalo, F. Characterization of Polycaprolactone / Eucomis Autumnalis Cellulose Composite : Structural , Thermal , and Mechanical Analysis. 2024, 65, 45–58.
- Gumede, T.P.; Luyt, A.S.; Tercjak, A.; Müller, A.J. Isothermal Crystallization Kinetics and Morphology of Double Crystalline PCL/PBS Blends Mixed with a Polycarbonate/MWCNTs Masterbatch. Polymers (Basel) 2019, 11, 682. [Google Scholar] [CrossRef] [PubMed]
- Platnieks, O.; Gaidukovs, S.; Barkane, A.; Sereda, A.; Gaidukova, G.; Grase, L.; Thakur, V.K.; Filipova, I.; Fridrihsone, V.; Skute, M.; et al. Bio-Based Poly(Butylene Succinate)/Microcrystalline Cellulose/Nanofibrillated Cellulose-Based Sustainable Polymer Composites: Thermo-Mechanical and Biodegradation Studies. Polymers (Basel) 2020, 12, 1–20. [Google Scholar] [CrossRef]
- Mofokeng, J.P.; Luyt, A.S. Thermochimica Acta Dynamic Mechanical Properties of PLA / PHBV, PLA / PCL, PHBV / PCL Blends and Their Nanocomposites with TiO 2 as Nano Fi Ller. Sens Actuators B Chem 2015, 613, 41–53. [Google Scholar] [CrossRef]
- Wang, S.; Xing, Q. Study on Properties and Biocompatibility of Poly (Butylene Succinate) and Sodium Alginate Biodegradable Composites for Biomedical Applications. Mater Res Express 2022, 9, 85403. [Google Scholar] [CrossRef]
- de Matos Costa, A.R.; Crocitti, A.; de Carvalho, L.H.; Carroccio, S.C.; Cerruti, P.; Santagata, G. Properties of Biodegradable Films Based on Poly(Butylene Succinate) (Pbs) and Poly(Butylene Adipate-Co-Terephthalate) (Pbat) Blends. Polymers (Basel) 2020, 12, 1–17. [Google Scholar] [CrossRef]
- Hospodarova, V.; Singovszka, E.; Stevulova, N. Characterization of Cellulosic Fibers by FTIR Spectroscopy for Their Further Implementation to Building Materials. Am J Analyt Chem 2018, 09, 303–310. [Google Scholar] [CrossRef]
- Shi, K.; Liu, Y.; Hu, X.; Su, T.; Li, P.; Wang, Z. Preparation, Characterization, and Biodegradation of Poly(Butylene Succinate)/Cellulose Triacetate Blends. Int J Biol Macromol 2018, 114, 373–380. [Google Scholar] [CrossRef]
- Phiri, M.J.; Mofokeng, J.P.; Phiri, M.M.; Mngomezulu, M.; Tywabi-Ngeva, Z. Effect of PCL and Compatibility Contents on the Morphology, Crystallization and Mechanical Properties of PLA/PCL Blends. Heliyon 2023, 9. [Google Scholar] [CrossRef]
- Radhakrishnan, S.; Thorat, S.; Desale, A.; Desai, P.; Kulkarni, M.B. Structure and Properties of PBS/PBAT Blends and Nanocomposites. IOP Conf Ser Mater Sci Eng 2022, 1248, 012013. [Google Scholar] [CrossRef]
- Yu, H.Y.; Qin, Z.Y.; Liu, Y.N.; Chen, L.; Liu, N.; Zhou, Z. Simultaneous Improvement of Mechanical Properties and Thermal Stability of Bacterial Polyester by Cellulose Nanocrystals. Carbohydr Polym 2012, 89, 971–978. [Google Scholar] [CrossRef] [PubMed]
- Asif, M.; Arman, M.; Muzamil, L.; Khan, A.; Ahmed, H.; Quddusi, M. Studying the Effect of NHAP on the Mechanical and Surface Properties of PBS Matrix. Journal of Polymer Research 2021. [Google Scholar] [CrossRef]
- Yoo, E.S.; Im, S.S. Melting Behavior of Poly(Butylene Succinate) during Heating Scan by DSC. J Polym Sci B Polym Phys 1999, 37, 1357–1366. [Google Scholar] [CrossRef]
- Chen, J.; Huang, Y.; Deng, L.; Jiang, H.; Yang, Z.; Yang, R.; Wu, D. Preparation and Research of PCL/Cellulose Composites: Cellulose Derived from Agricultural Wastes. Int J Biol Macromol 2023, 235, 123785. [Google Scholar] [CrossRef] [PubMed]
- de Oliveira Aguiar, V.; de Fatima Vieira Marques, M. Composites of Polycaprolactone with Cellulose Fibers: Morphological and Mechanical Evaluation. Macromol Symp 2016, 367, 101–112. [Google Scholar] [CrossRef]
- Mi, H.Y.; Jing, X.; Peng, J.; Salick, M.R.; Peng, X.F.; Turng, L.S. Poly(ε-Caprolactone) (PCL)/Cellulose Nano-Crystal (CNC) Nanocomposites and Foams. Cellulose 2014, 21, 2727–2741. [Google Scholar] [CrossRef]
Figure 1.
(a) A flowering plant of E. autumnalis, (b) Dried fine powder of E. autumnalis leaves [10]. [Open access].
Figure 1.
(a) A flowering plant of E. autumnalis, (b) Dried fine powder of E. autumnalis leaves [10]. [Open access].
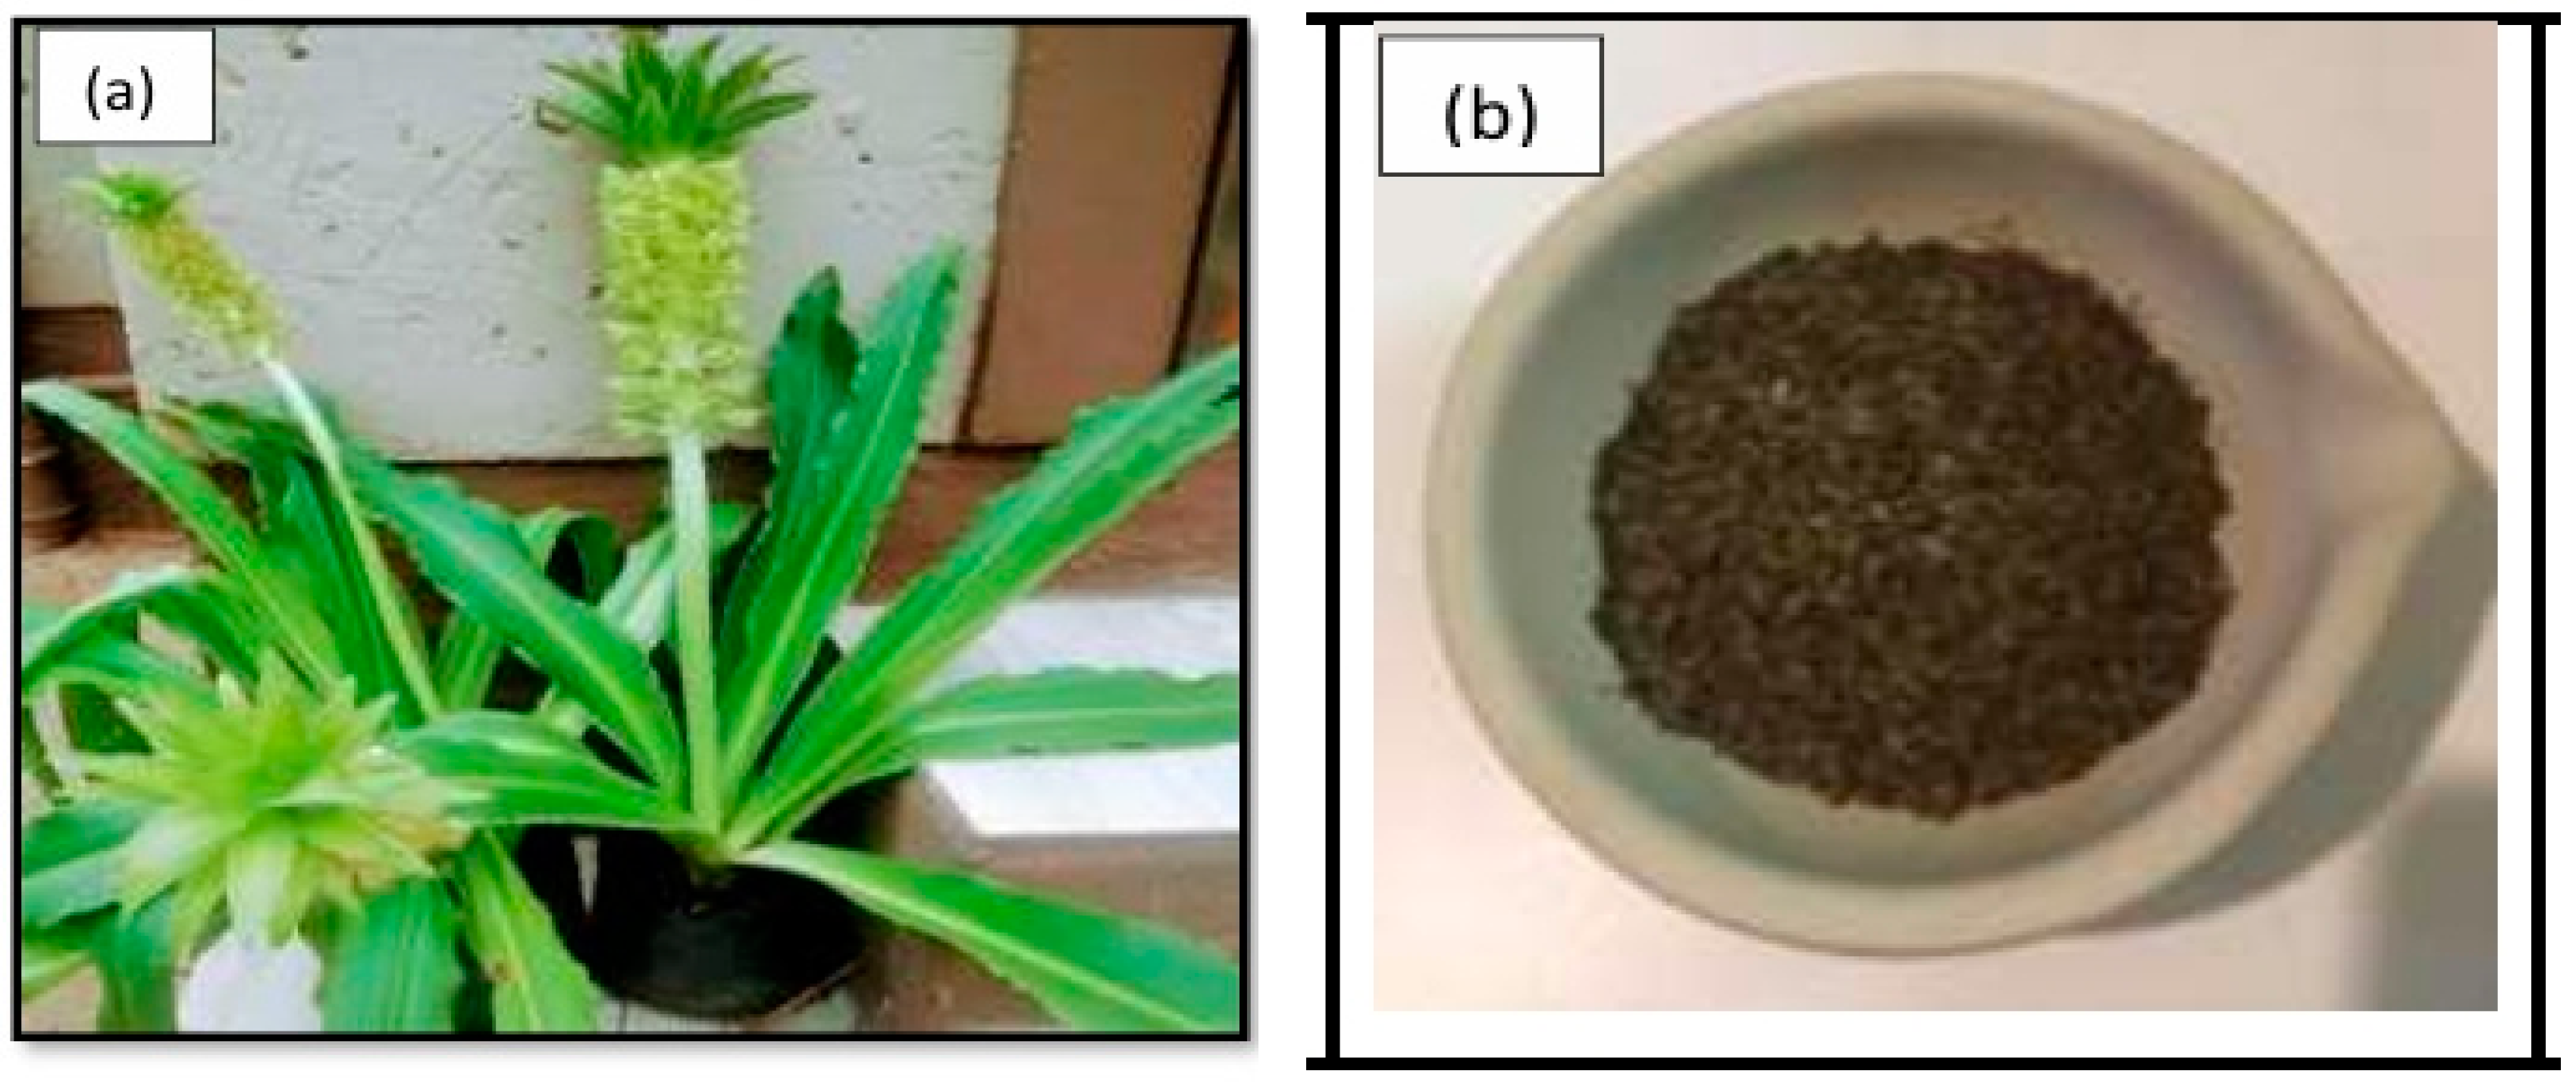
Figure 2.
FTIR spectra of neat PBS, neat PCL and neat EA cellulose.
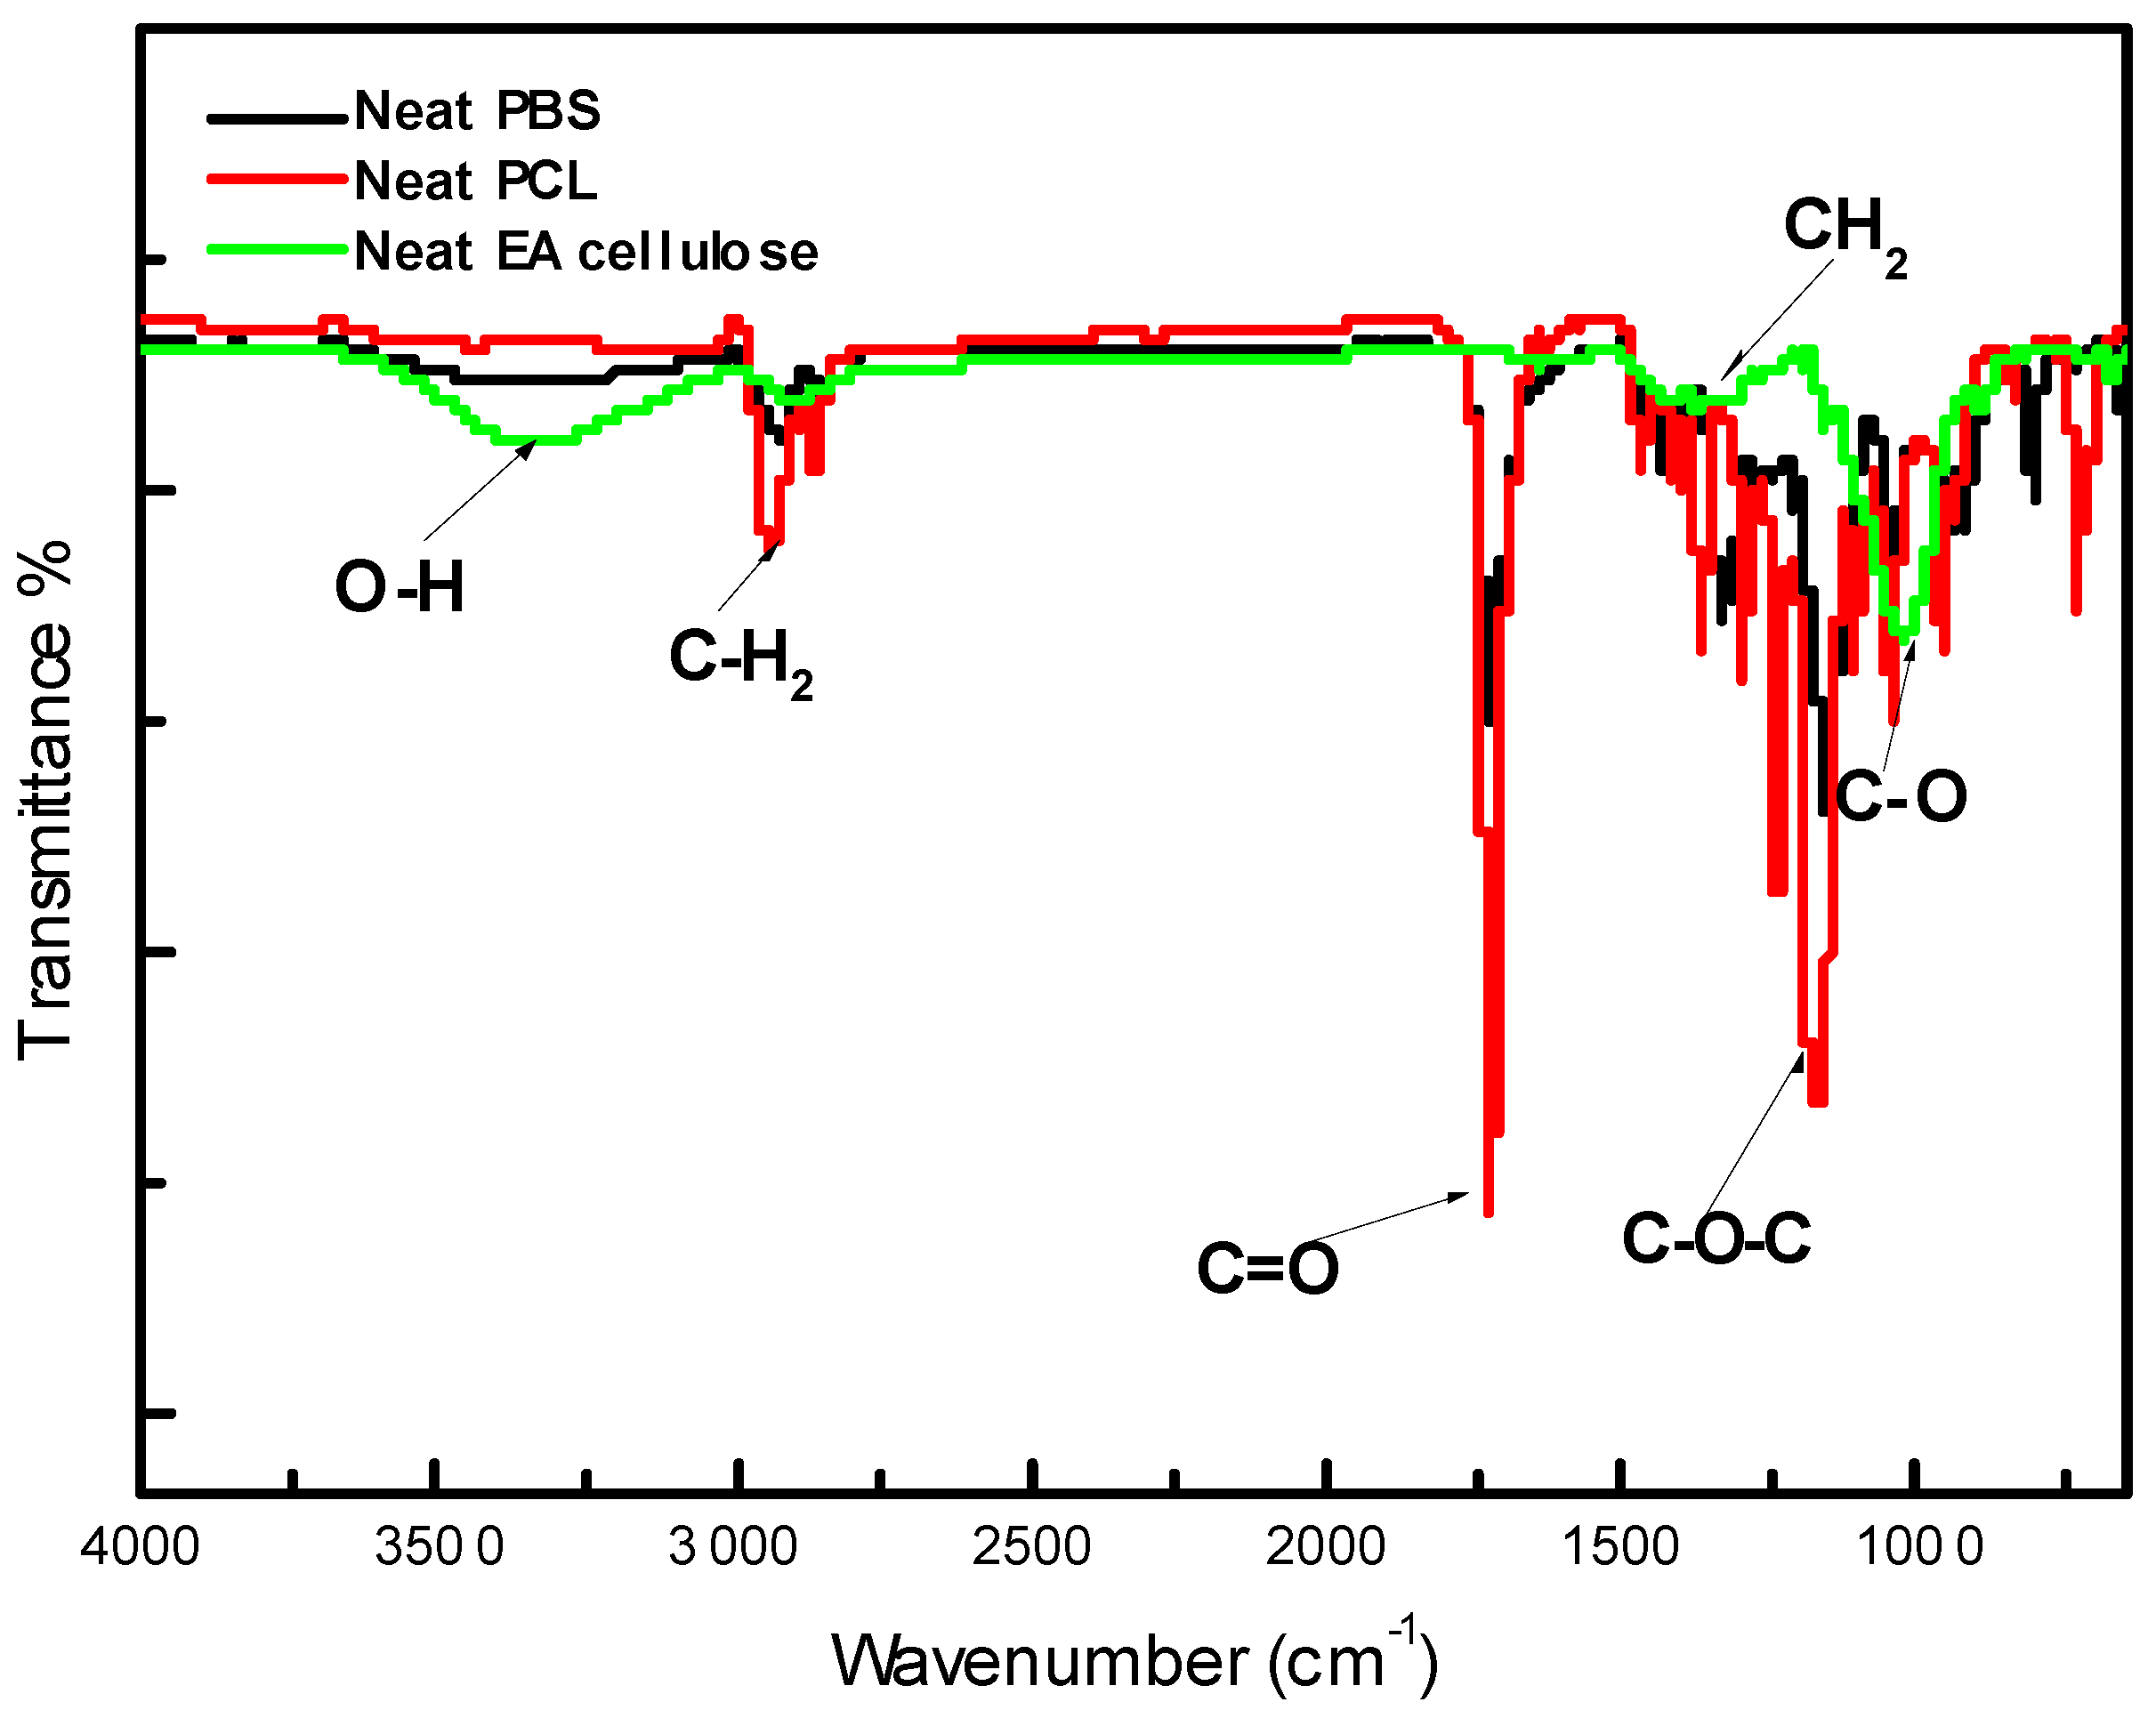
Figure 3.
FTIR spectra of (a) neat PBS and its composites with EA cellulose (b) neat PCL and its composites with EA cellulose at (1, 3 and 5 wt.%).
Figure 3.
FTIR spectra of (a) neat PBS and its composites with EA cellulose (b) neat PCL and its composites with EA cellulose at (1, 3 and 5 wt.%).
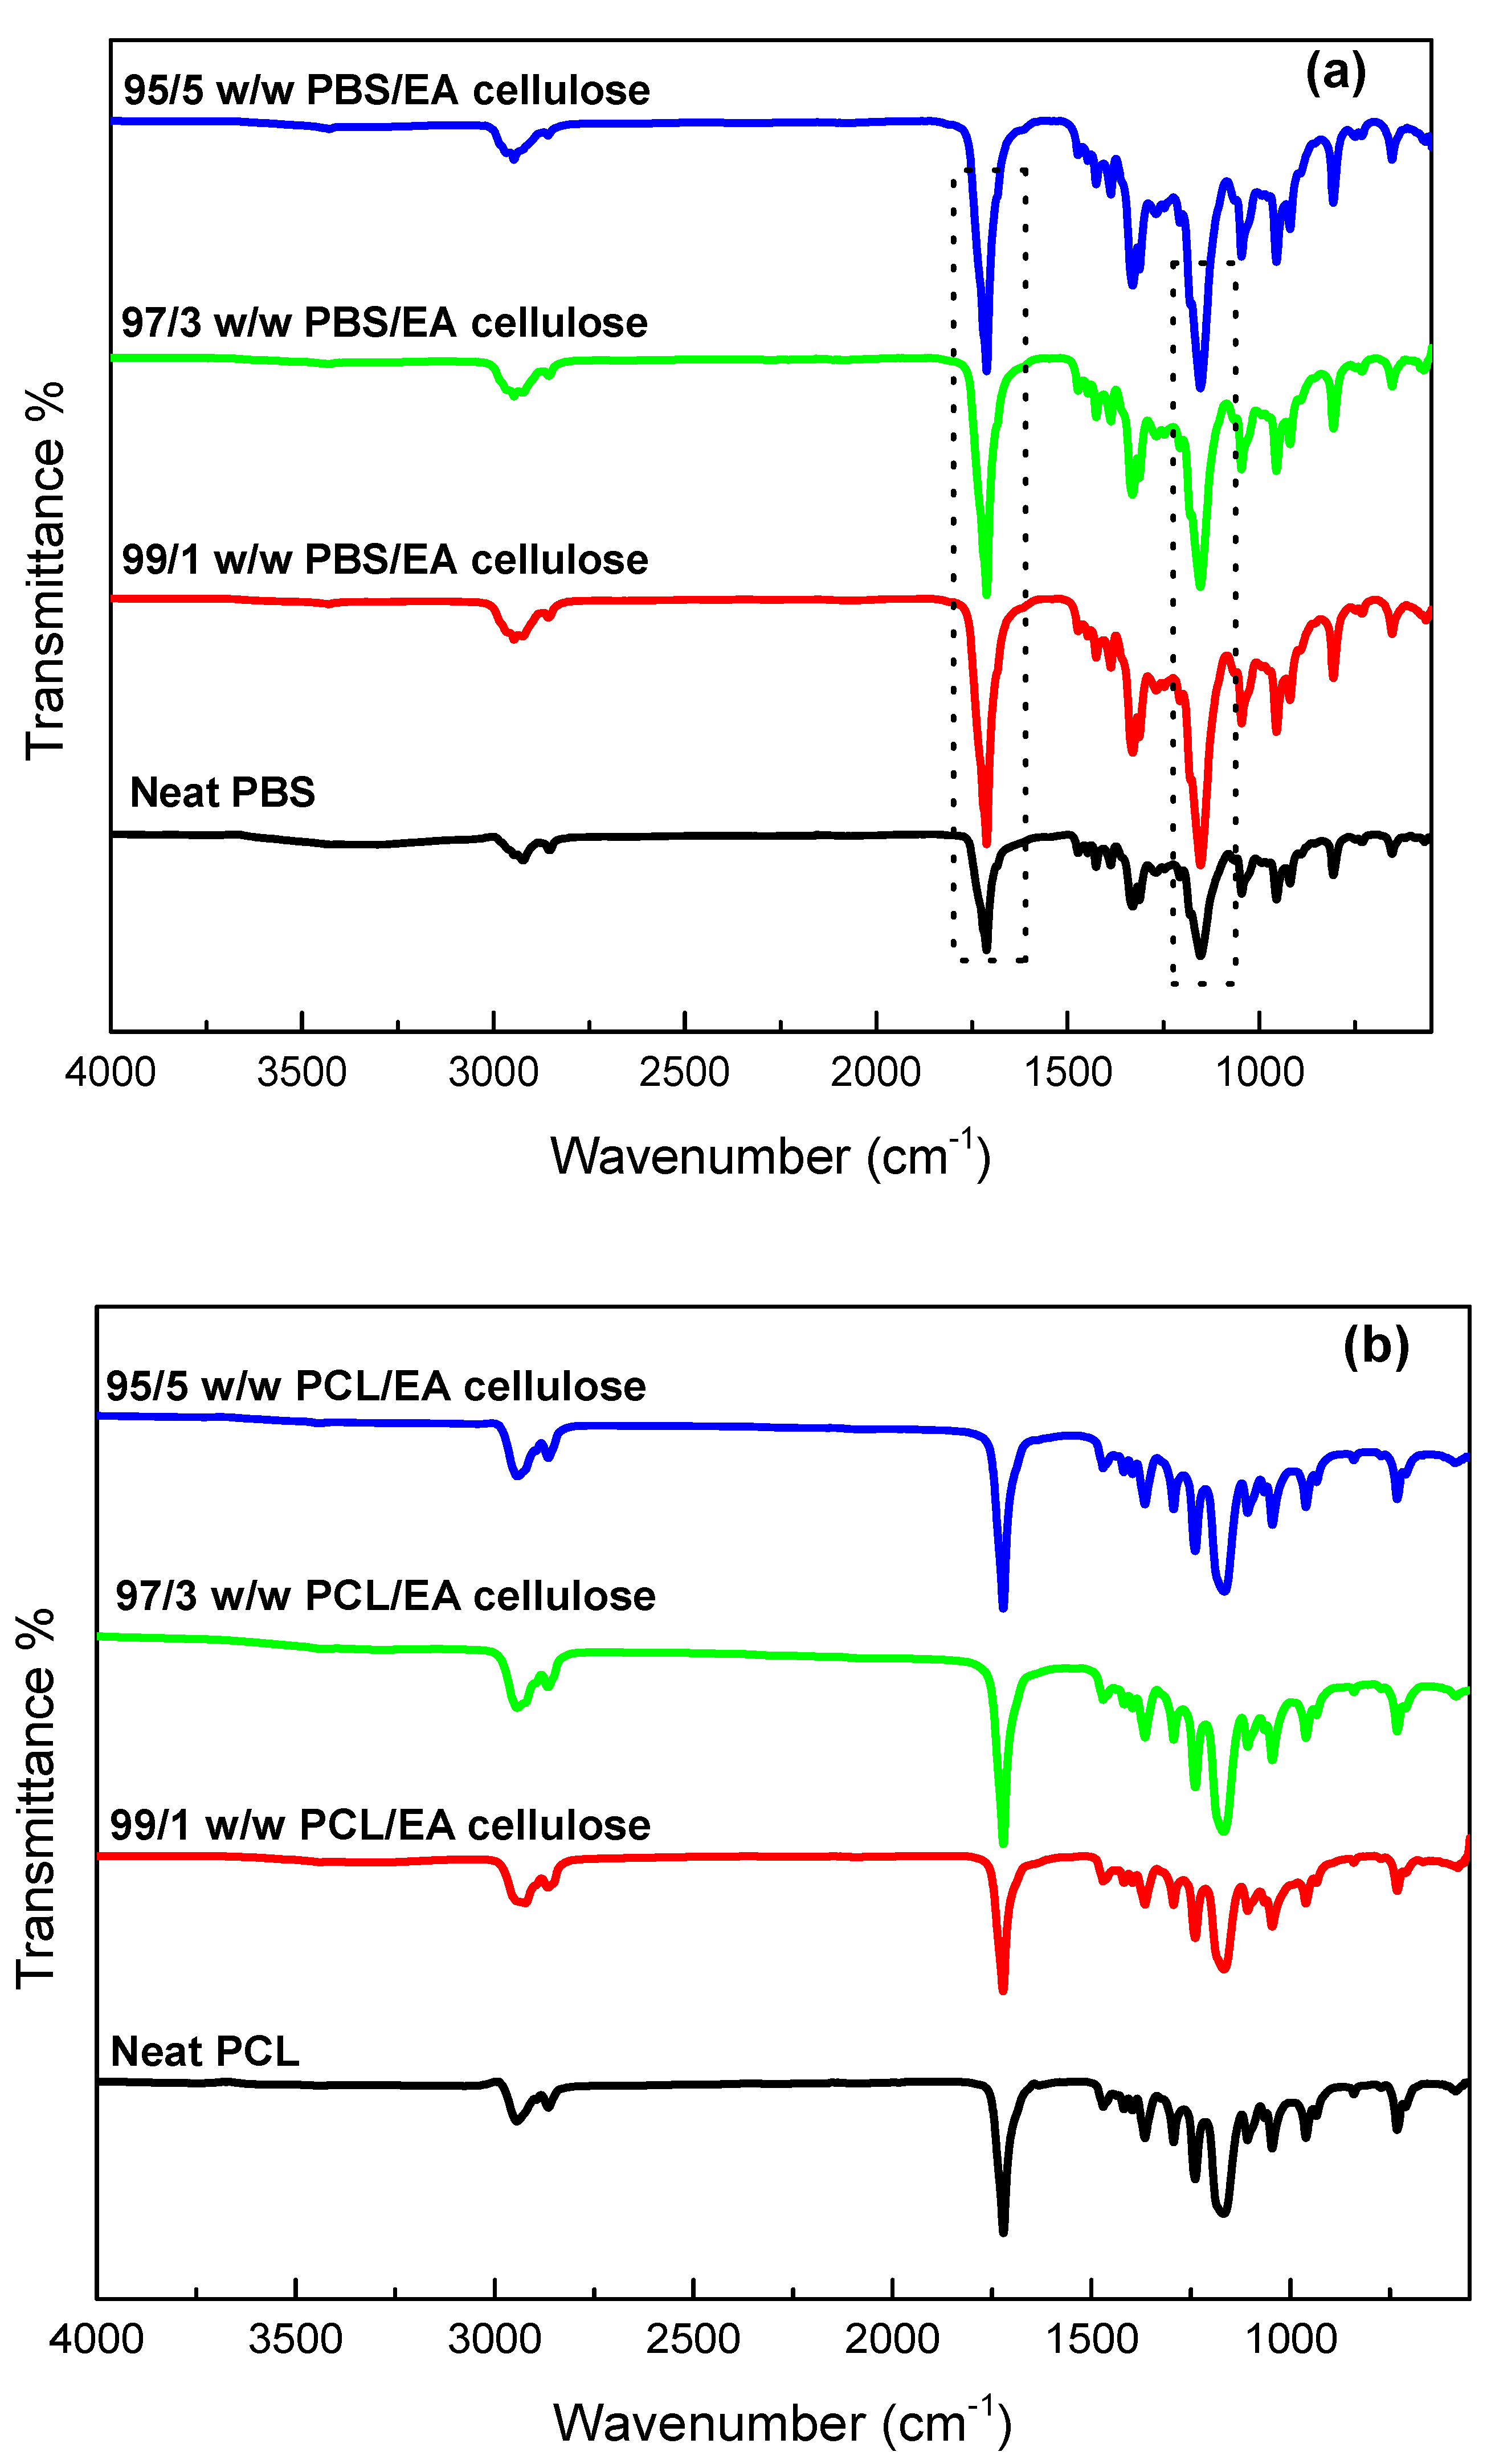
Figure 4.
XRD patterns of neat PBS, neat PCL and neat EA cellulose.
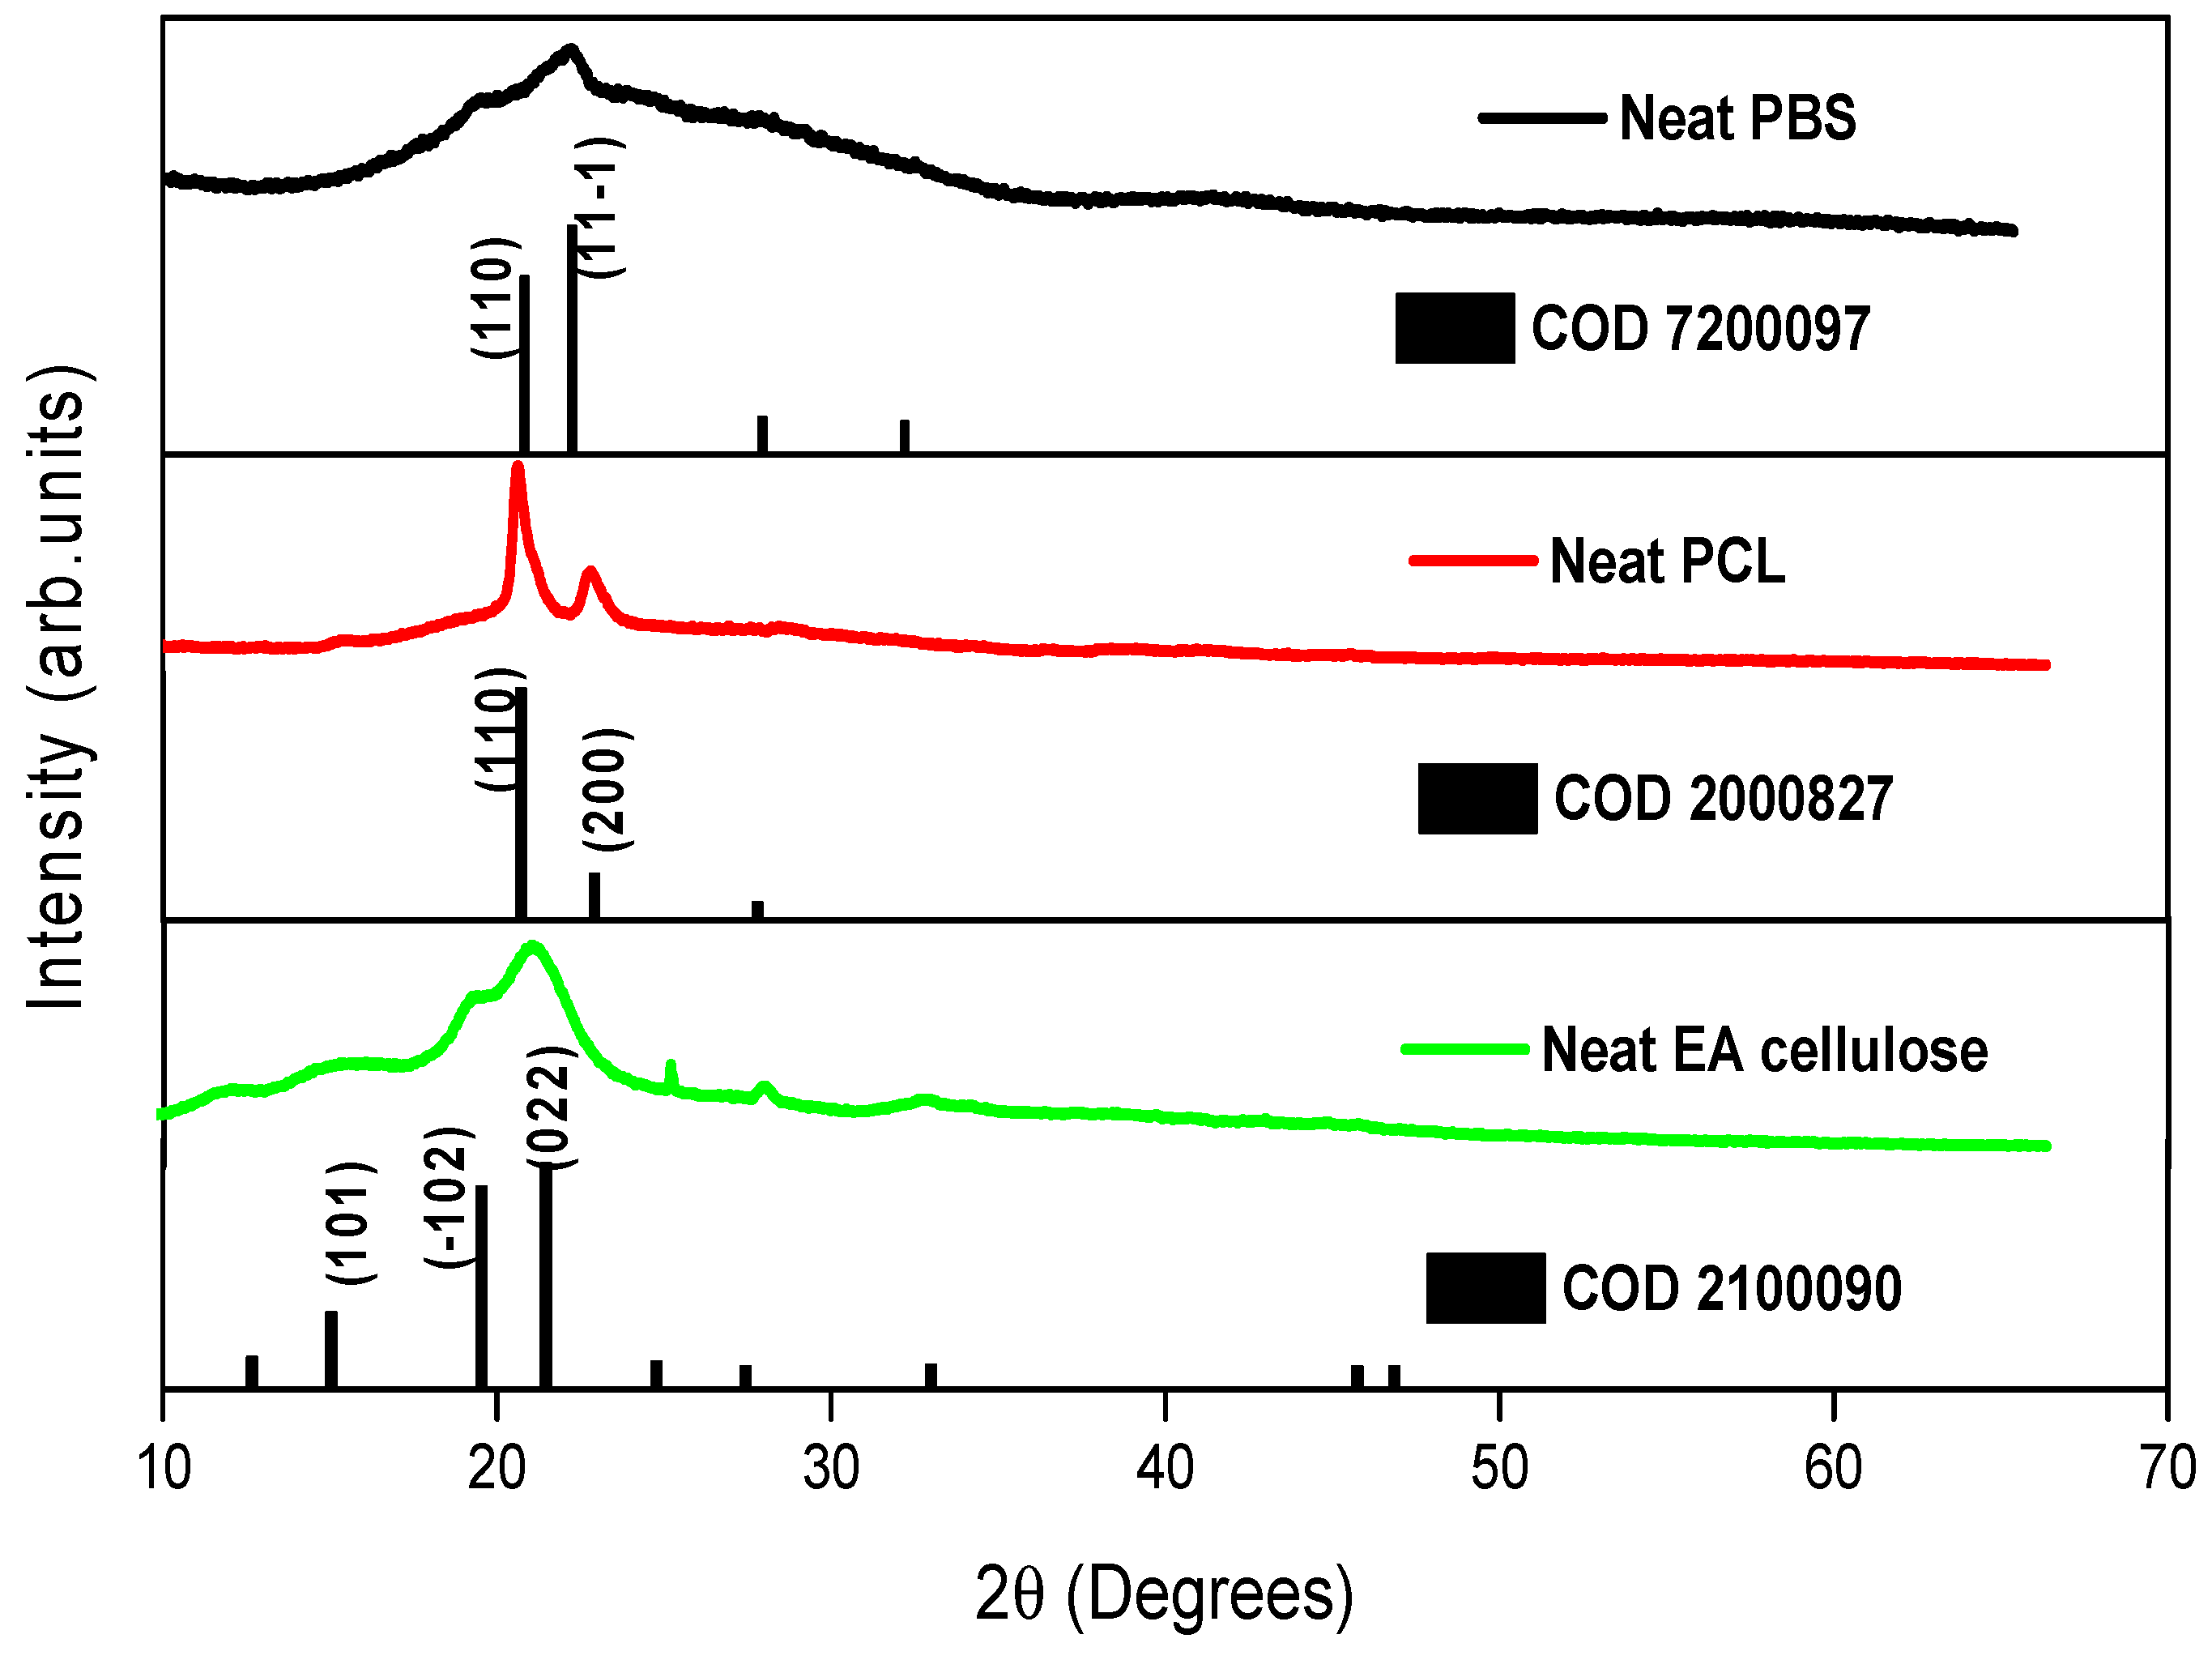
Figure 5.
XRD patterns of (a) neat PBS and its composites with EA cellulose (b) neat PCL and its composites with EA cellulose at (1, 3, and 5 wt.%).
Figure 5.
XRD patterns of (a) neat PBS and its composites with EA cellulose (b) neat PCL and its composites with EA cellulose at (1, 3, and 5 wt.%).
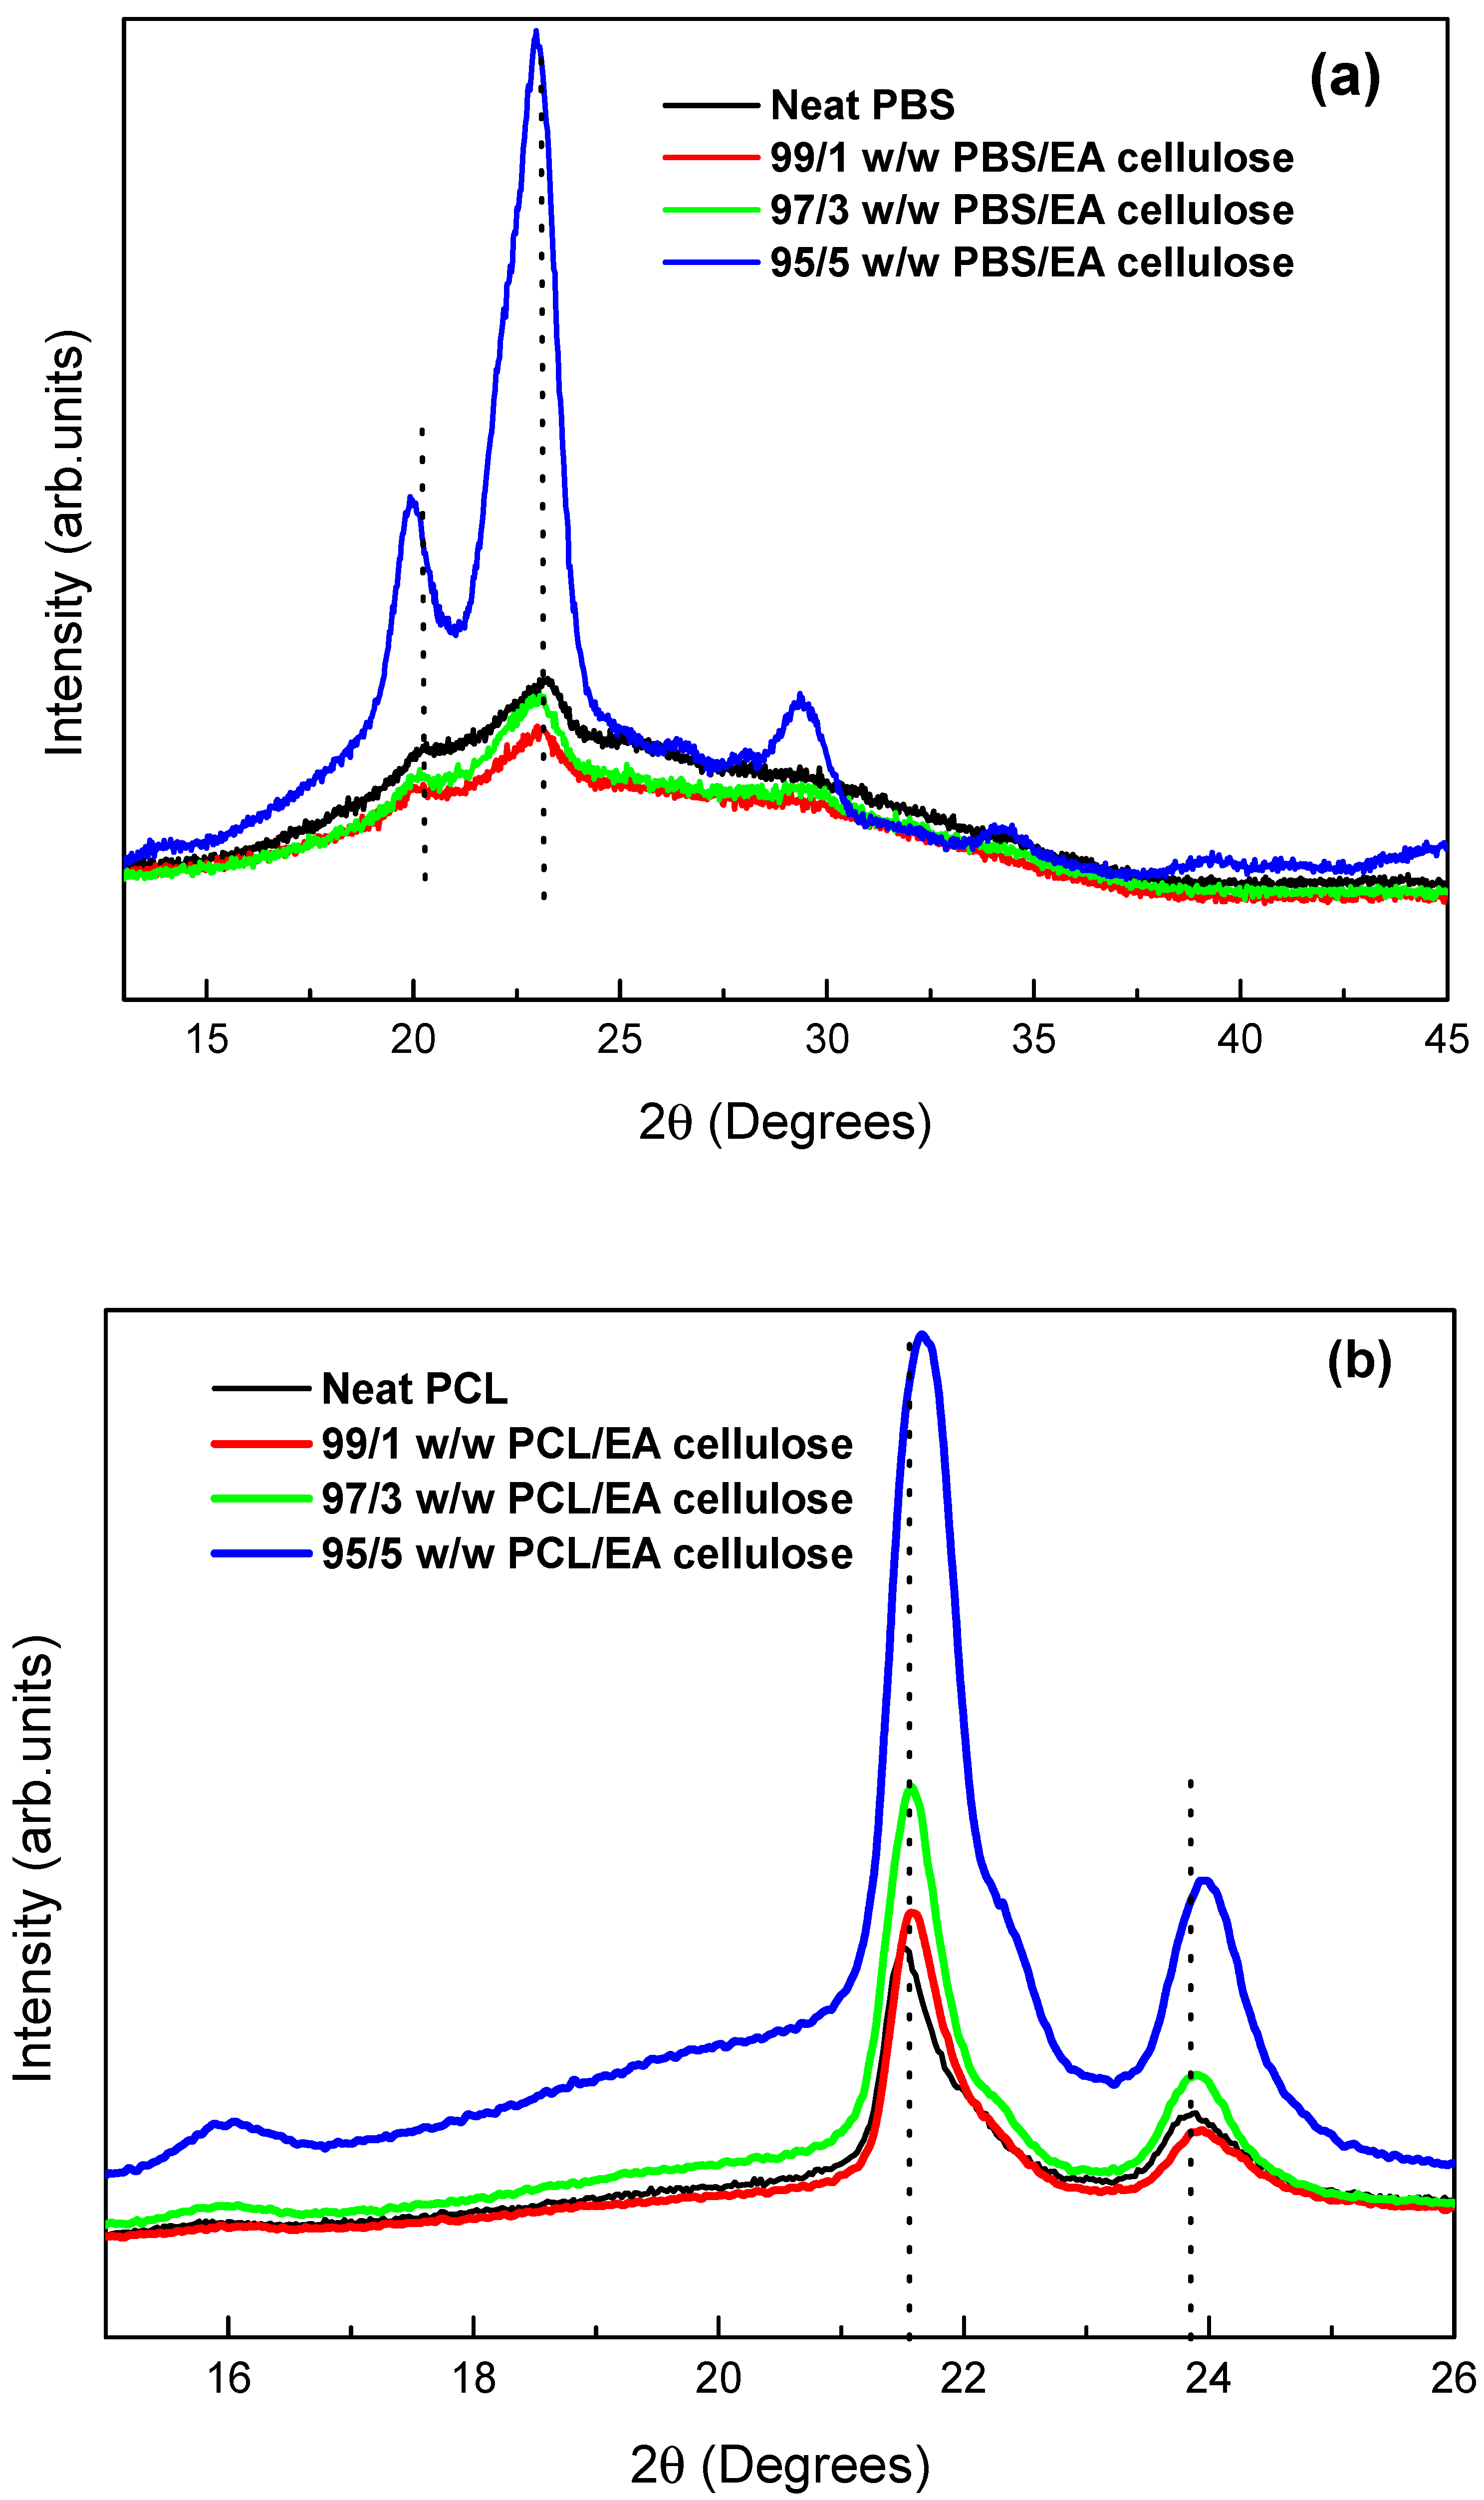
Figure 6.
SEM images of (a) neat EA cellulose, (b) neat PBS, and (c) neat PCL.
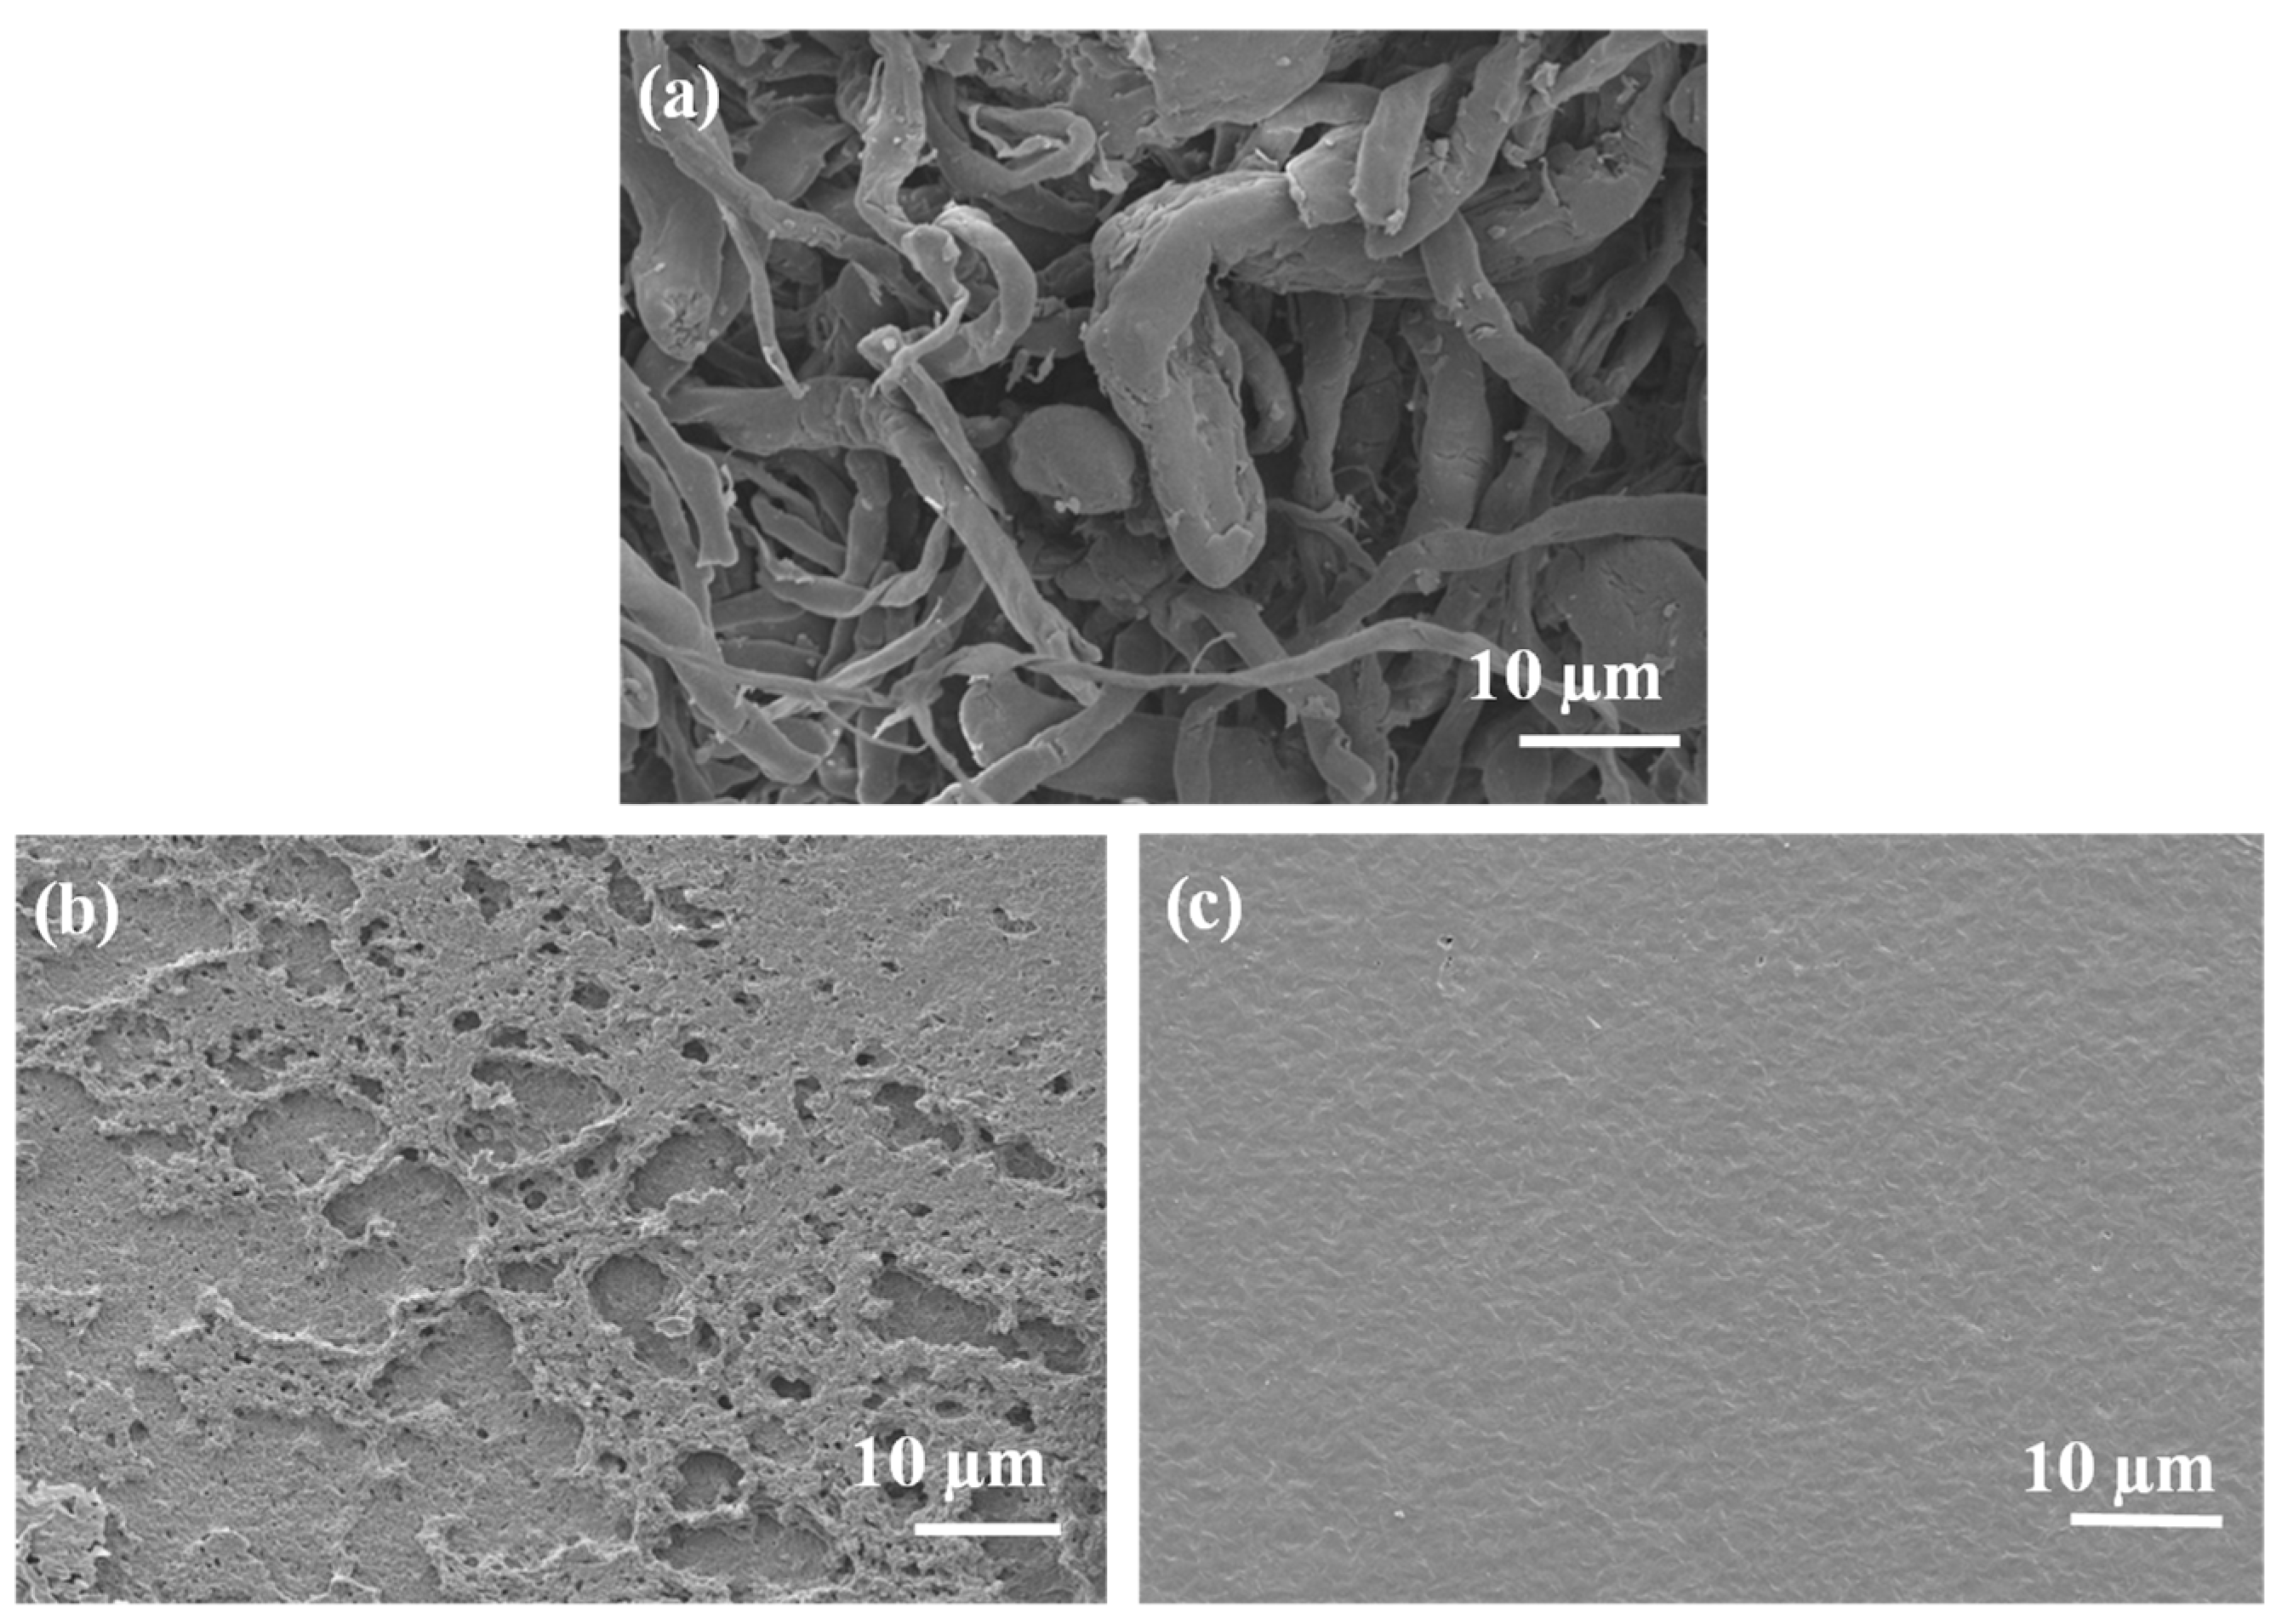
Figure 7.
SEM images of (a) neat PBS, (b) 99/1 w/w PBS/EA cellulose, (c) 97/3 w/w PBS/EA cellulose and (d) 95/5 w/w PBS/EA cellulose.
Figure 7.
SEM images of (a) neat PBS, (b) 99/1 w/w PBS/EA cellulose, (c) 97/3 w/w PBS/EA cellulose and (d) 95/5 w/w PBS/EA cellulose.
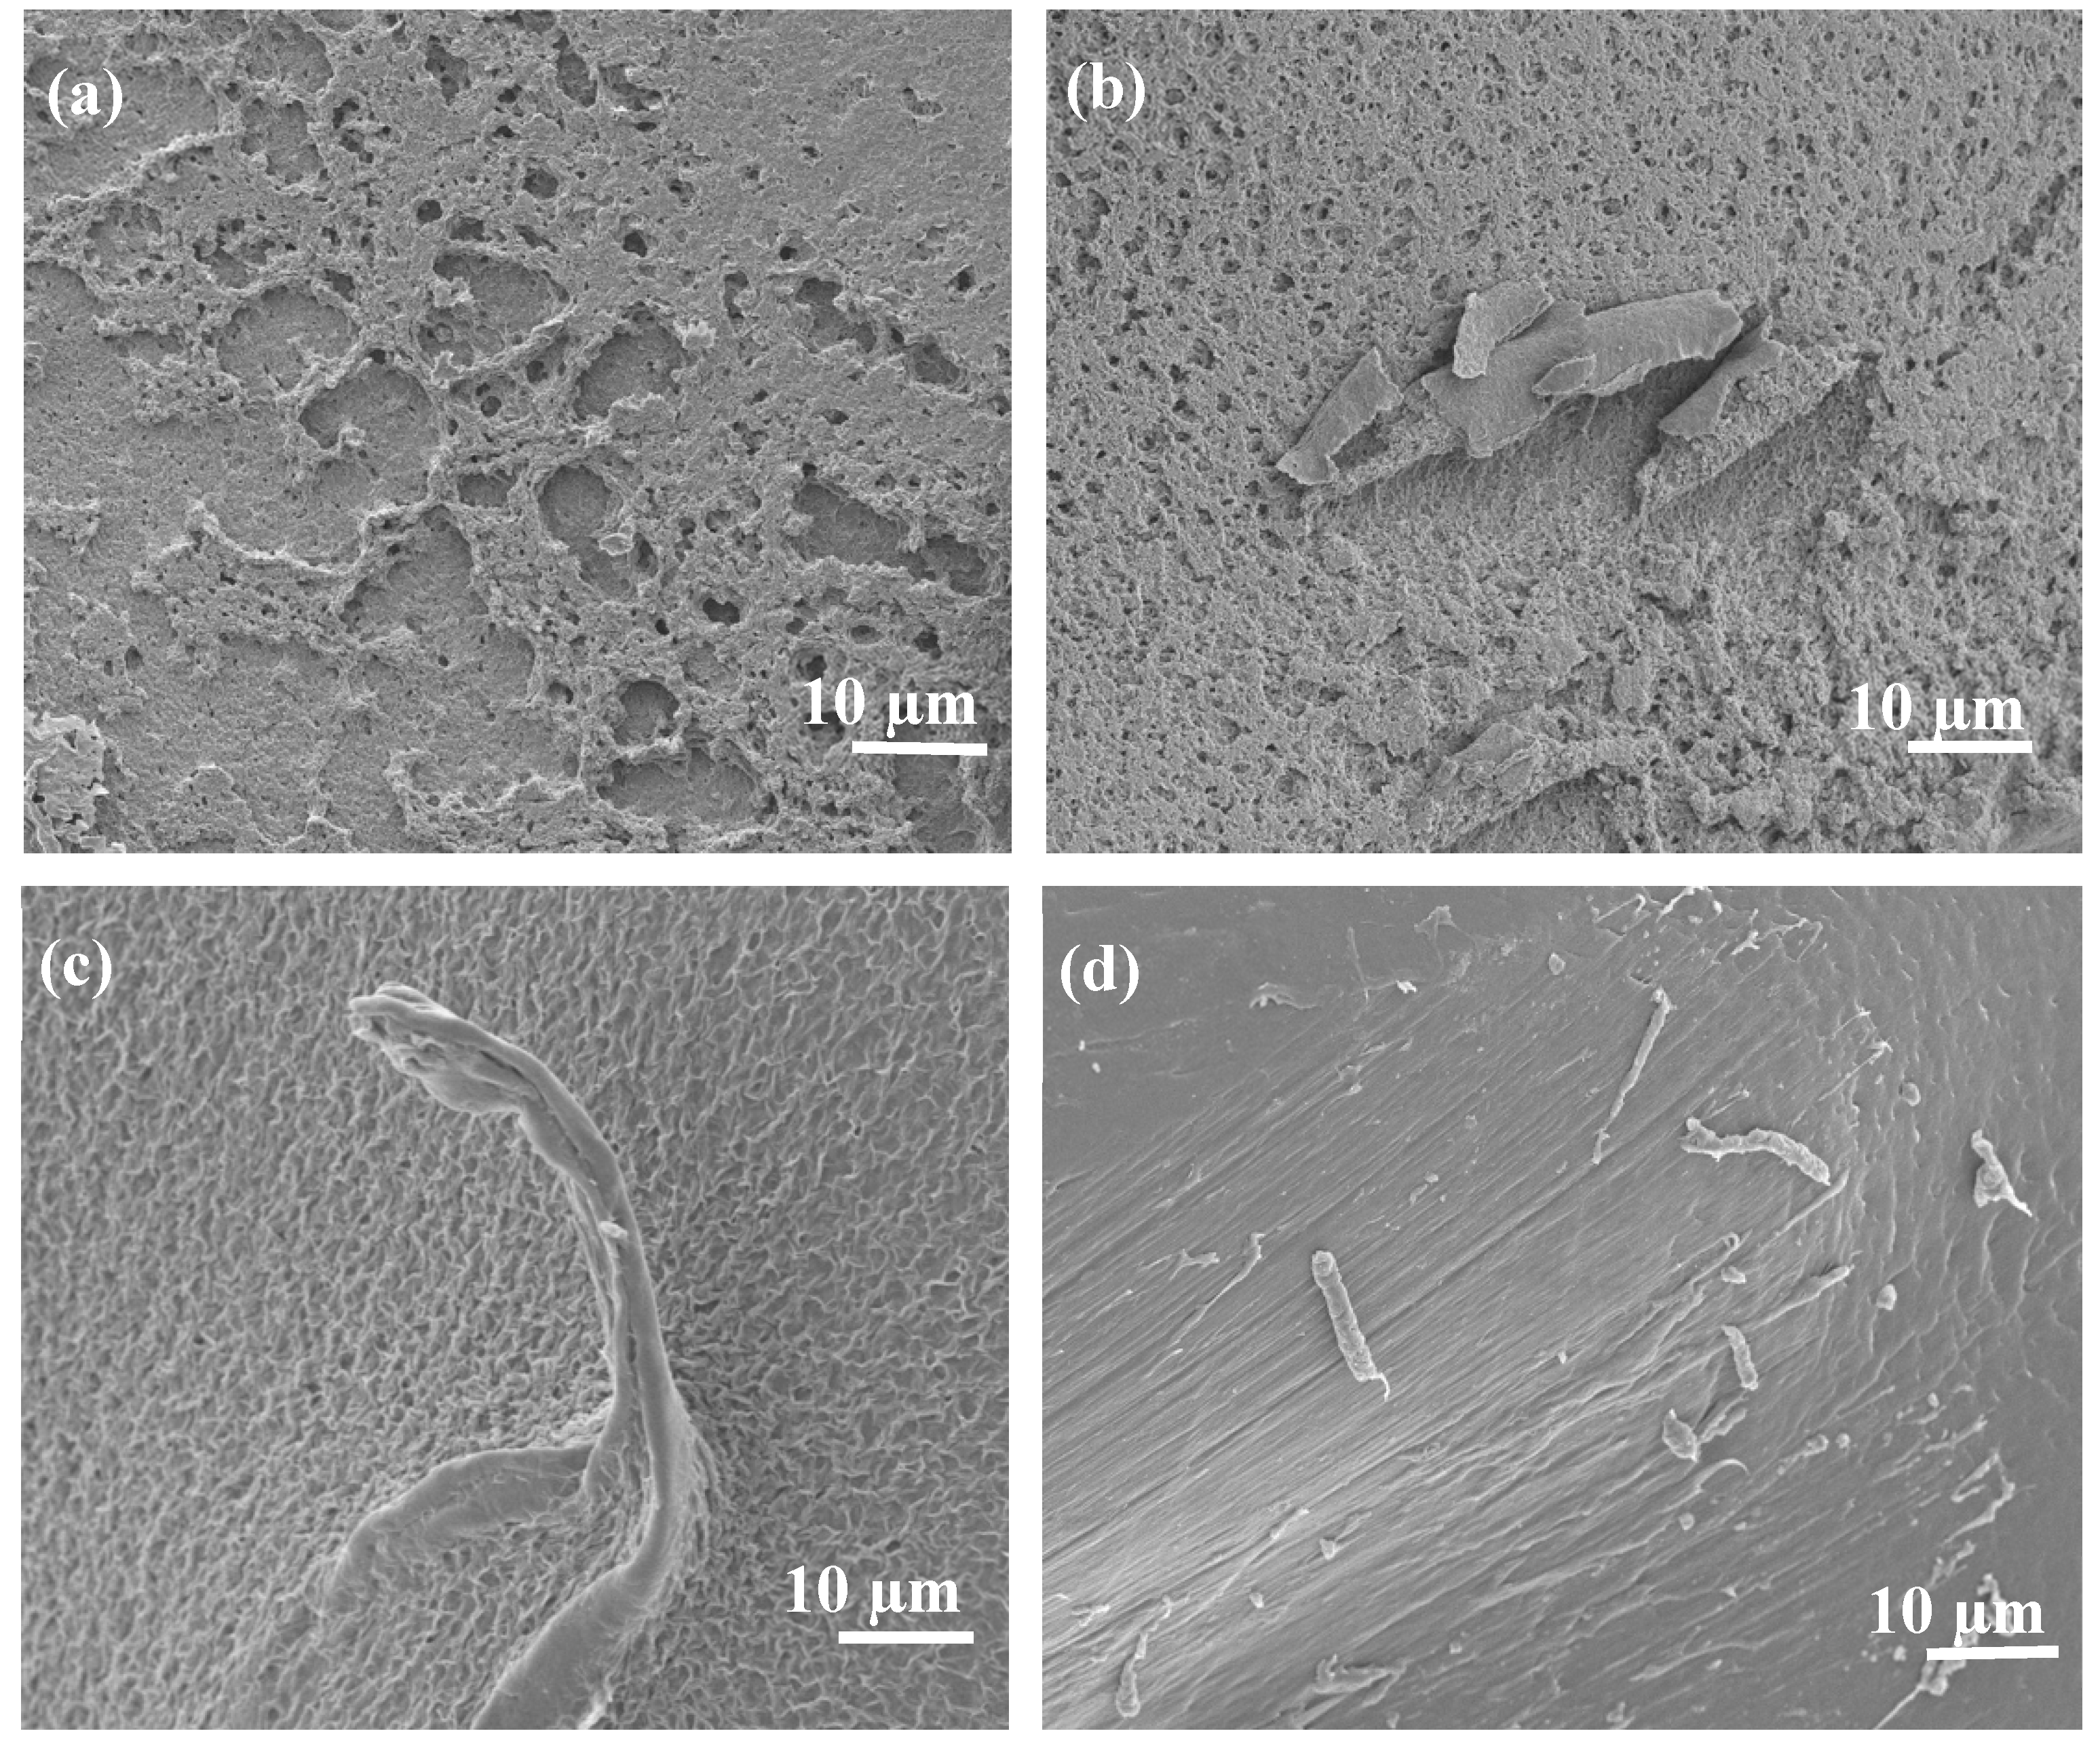
Figure 8.
SEM images of (a) neat PCL, (b) 99/1 w/w PCL/EA cellulose, (c) 97/3 w/w PCL/EA cellulose, and (d) 95/5 w/w PCL/EA cellulose.
Figure 8.
SEM images of (a) neat PCL, (b) 99/1 w/w PCL/EA cellulose, (c) 97/3 w/w PCL/EA cellulose, and (d) 95/5 w/w PCL/EA cellulose.
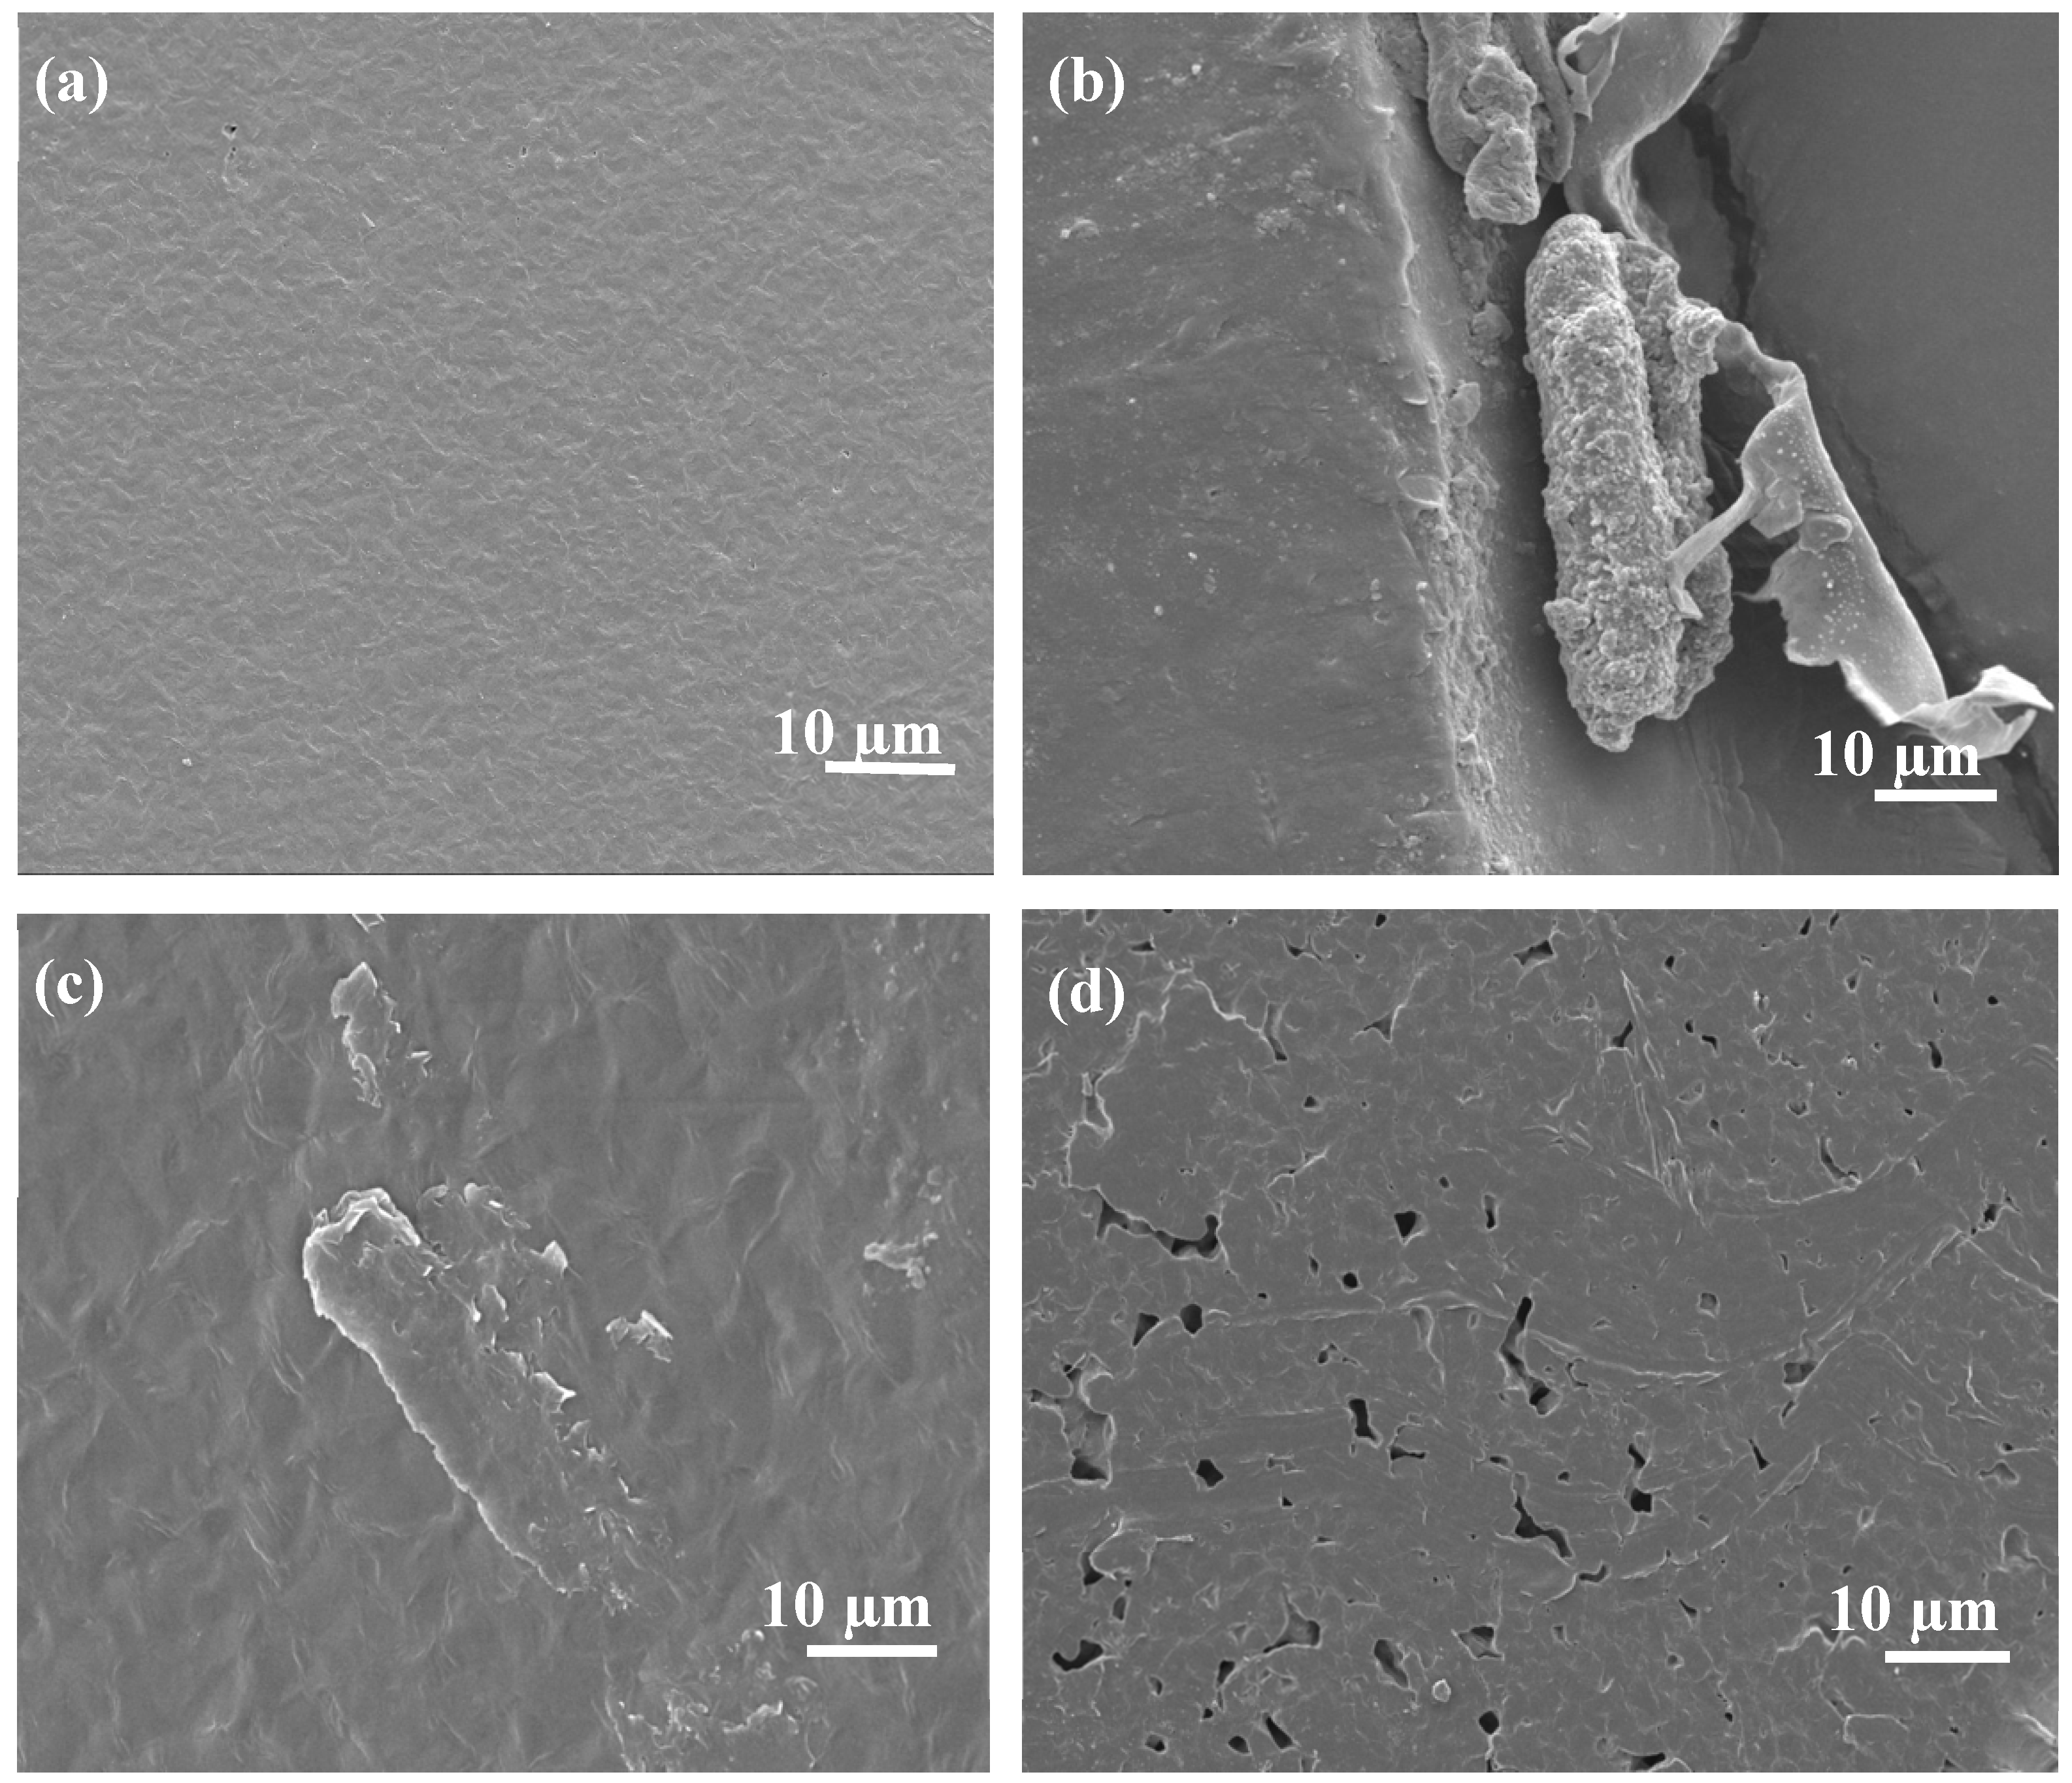
Figure 9.
DSC cooling curves of neat PBS and PCL.
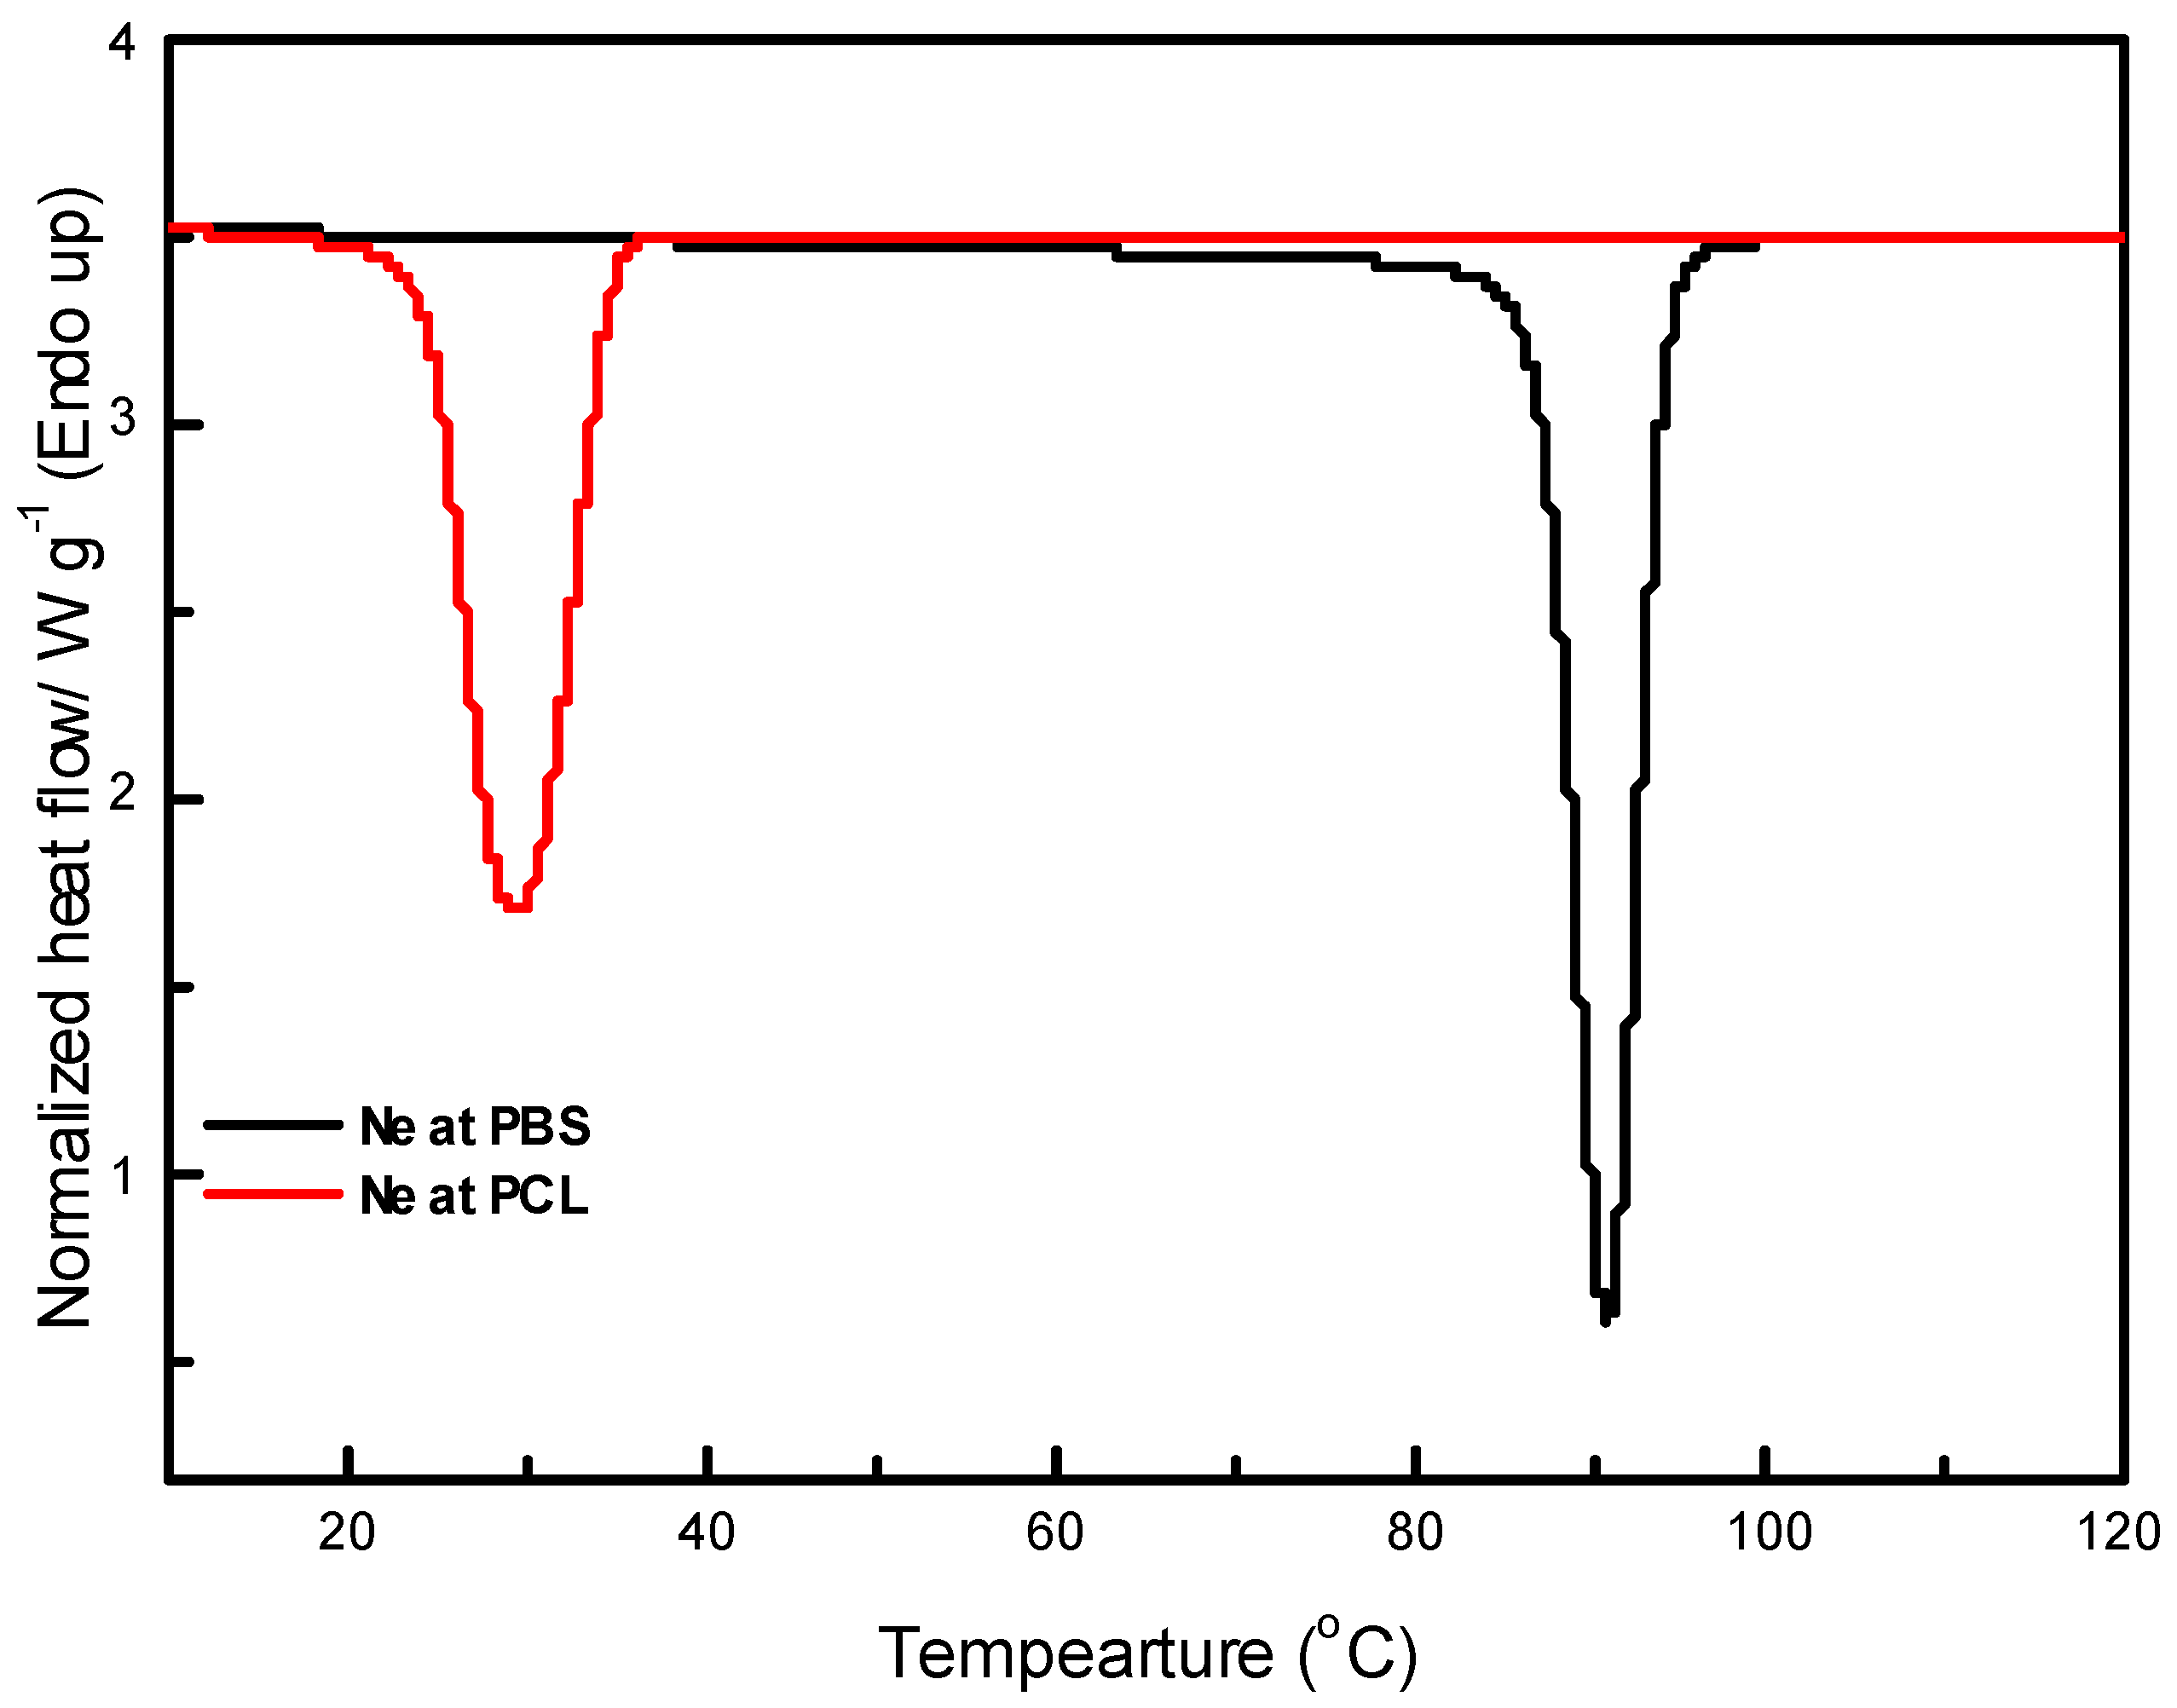
Figure 10.
DSC cooling curves of (a) neat PBS and its composites with EA cellulose (b) neat PCL and its composites with EA cellulose at (1, 3 and 5 wt.%).
Figure 10.
DSC cooling curves of (a) neat PBS and its composites with EA cellulose (b) neat PCL and its composites with EA cellulose at (1, 3 and 5 wt.%).
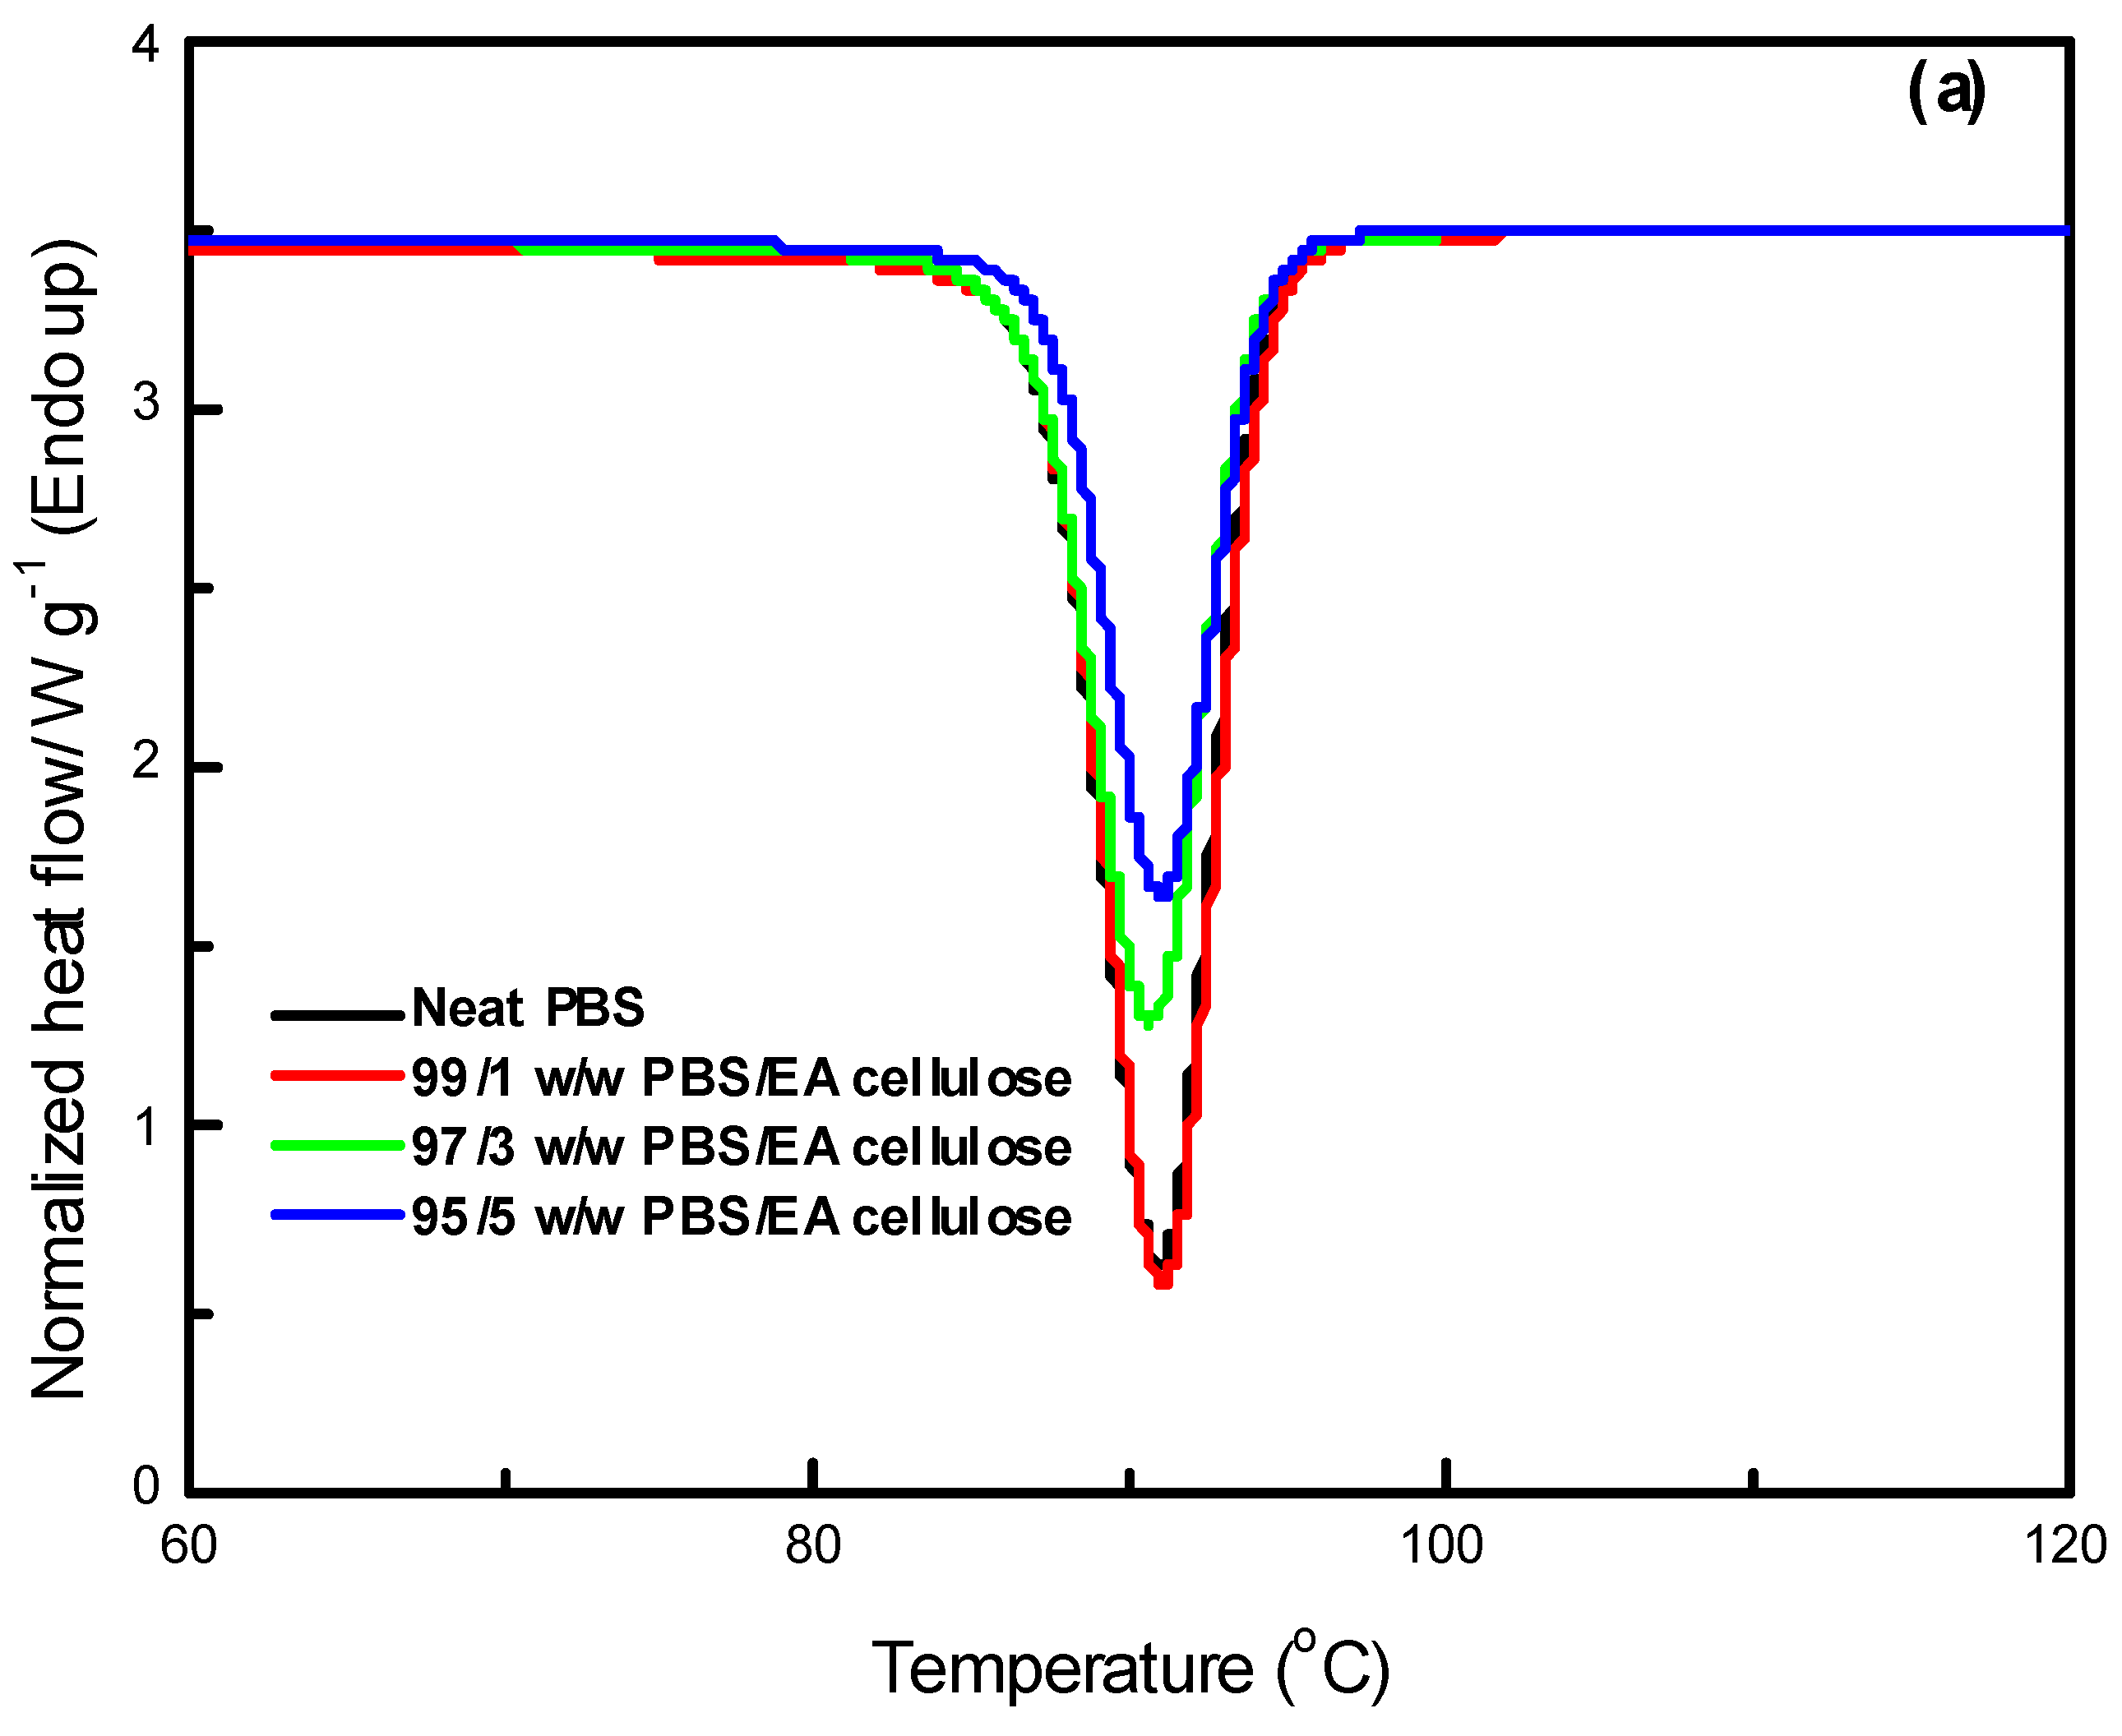
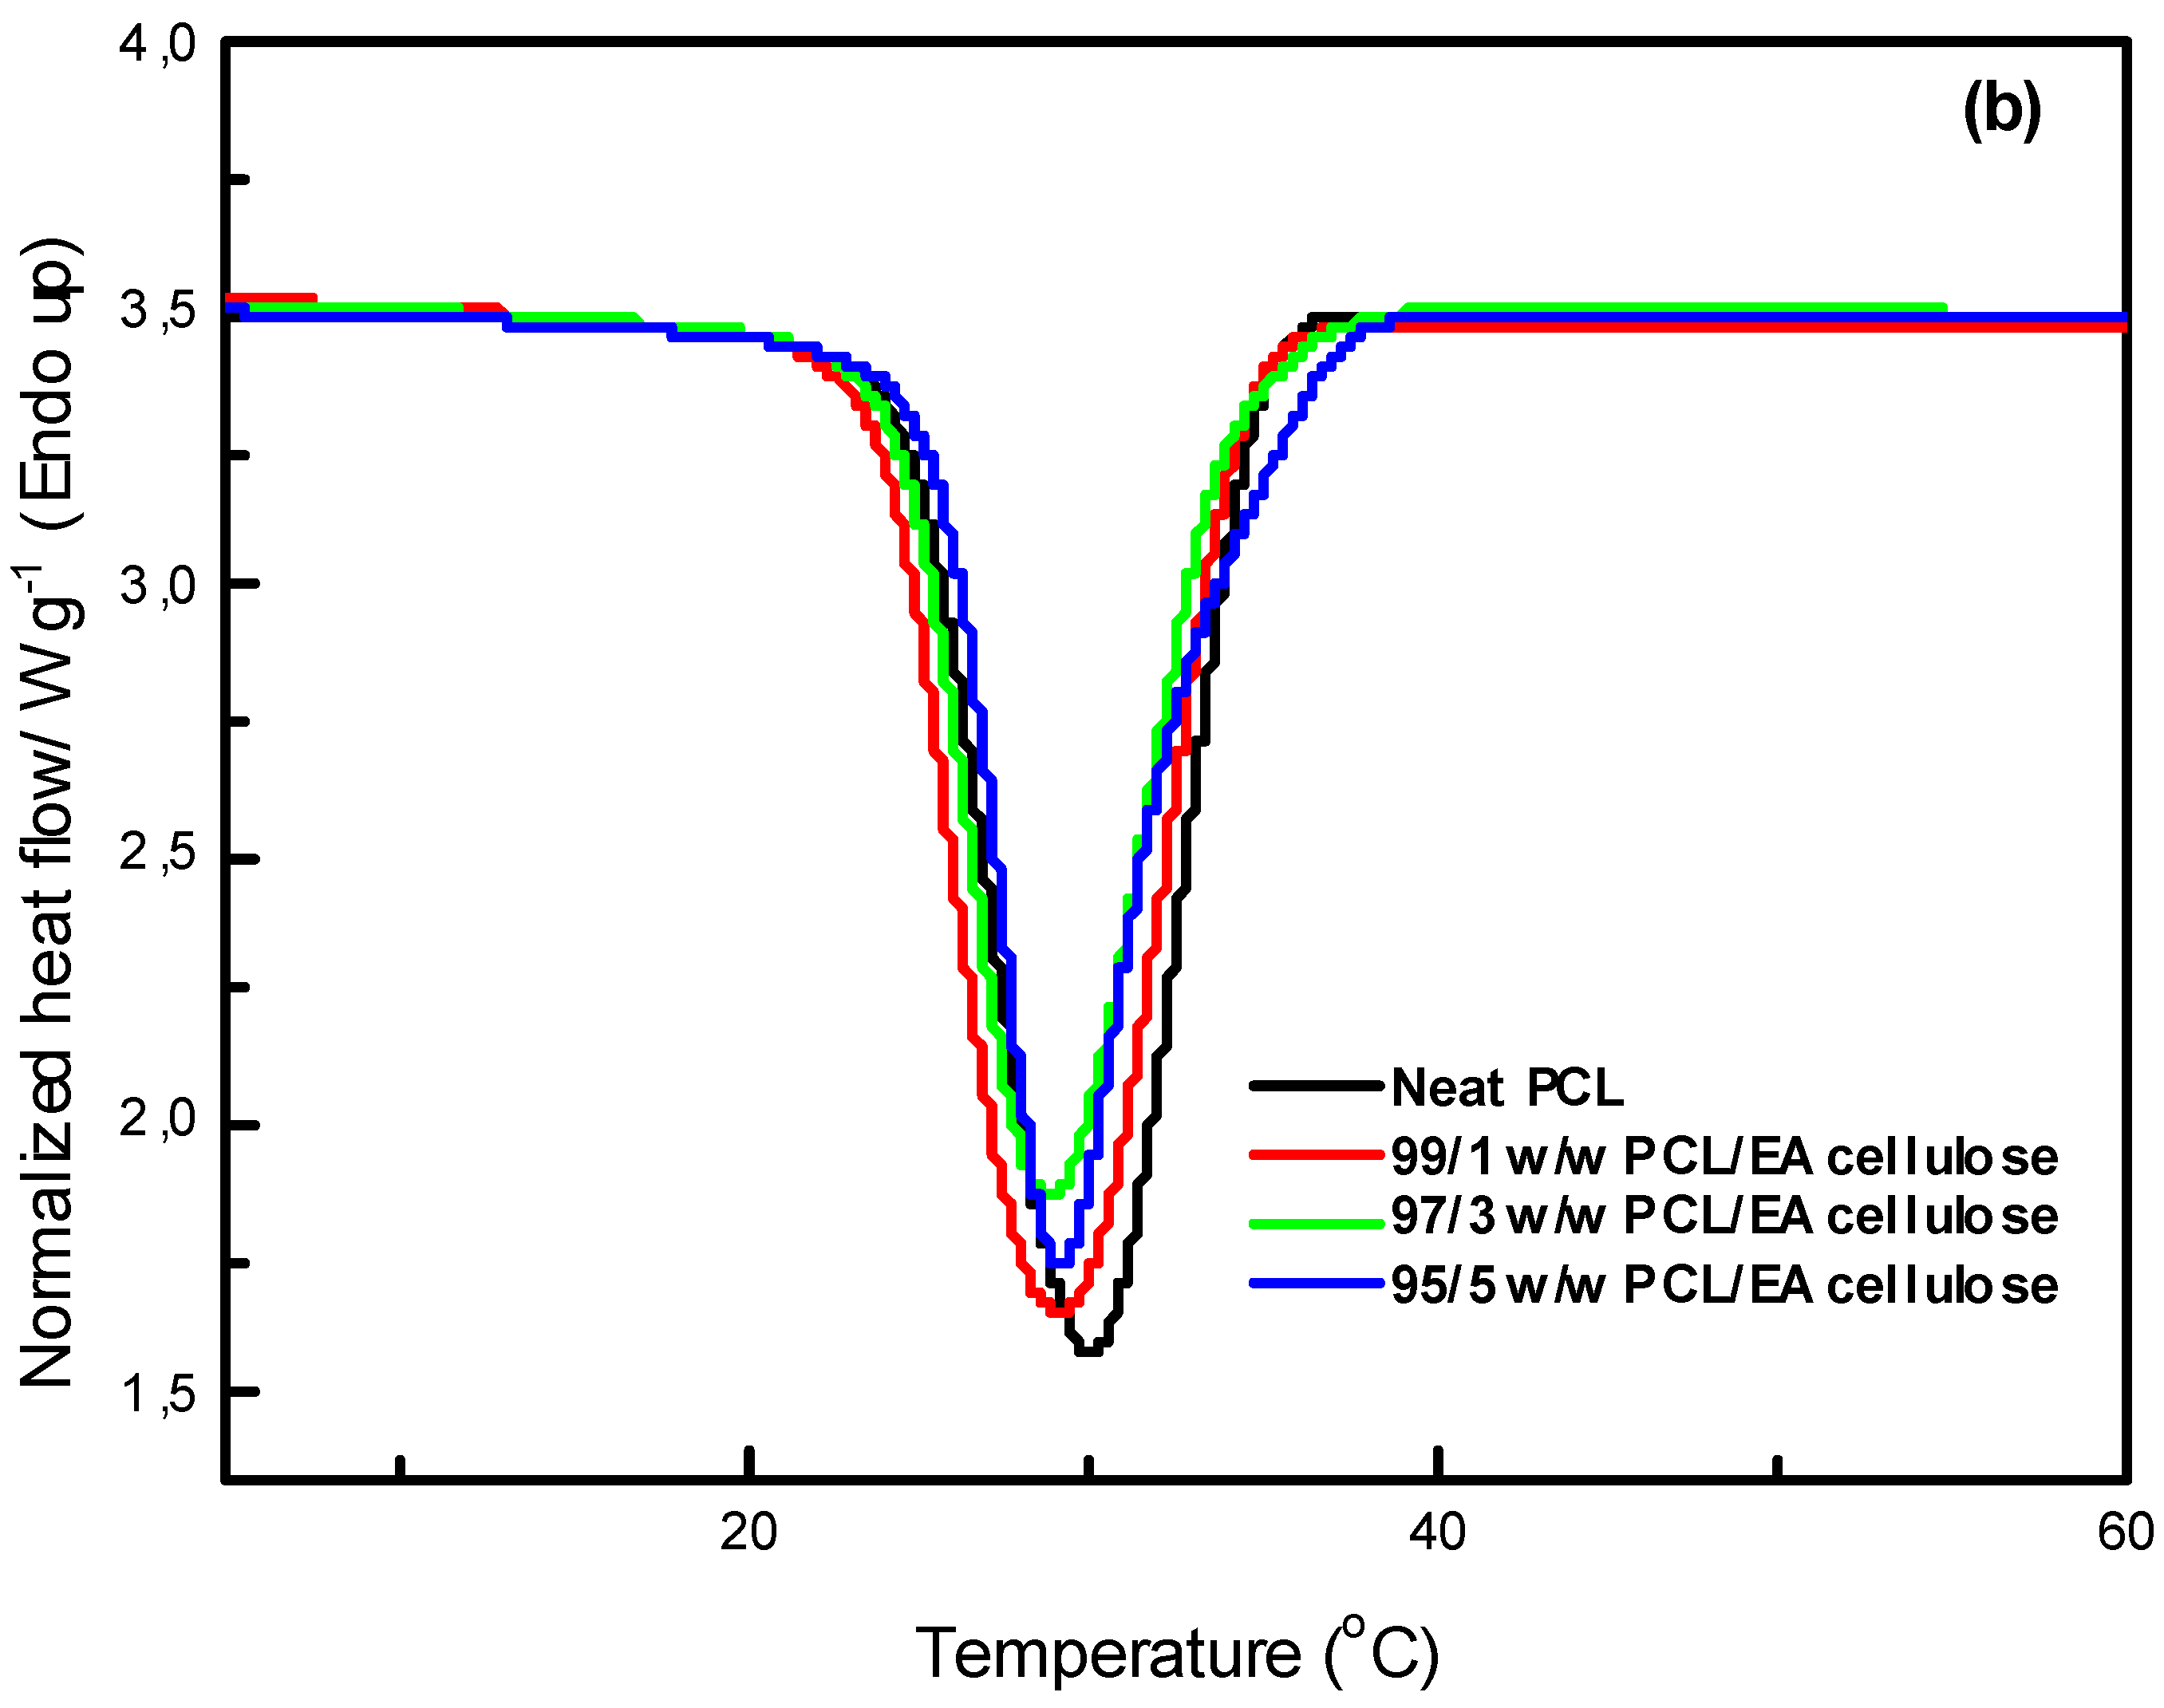
Figure 11.
DSC heating curves of neat PBS and neat PCL.
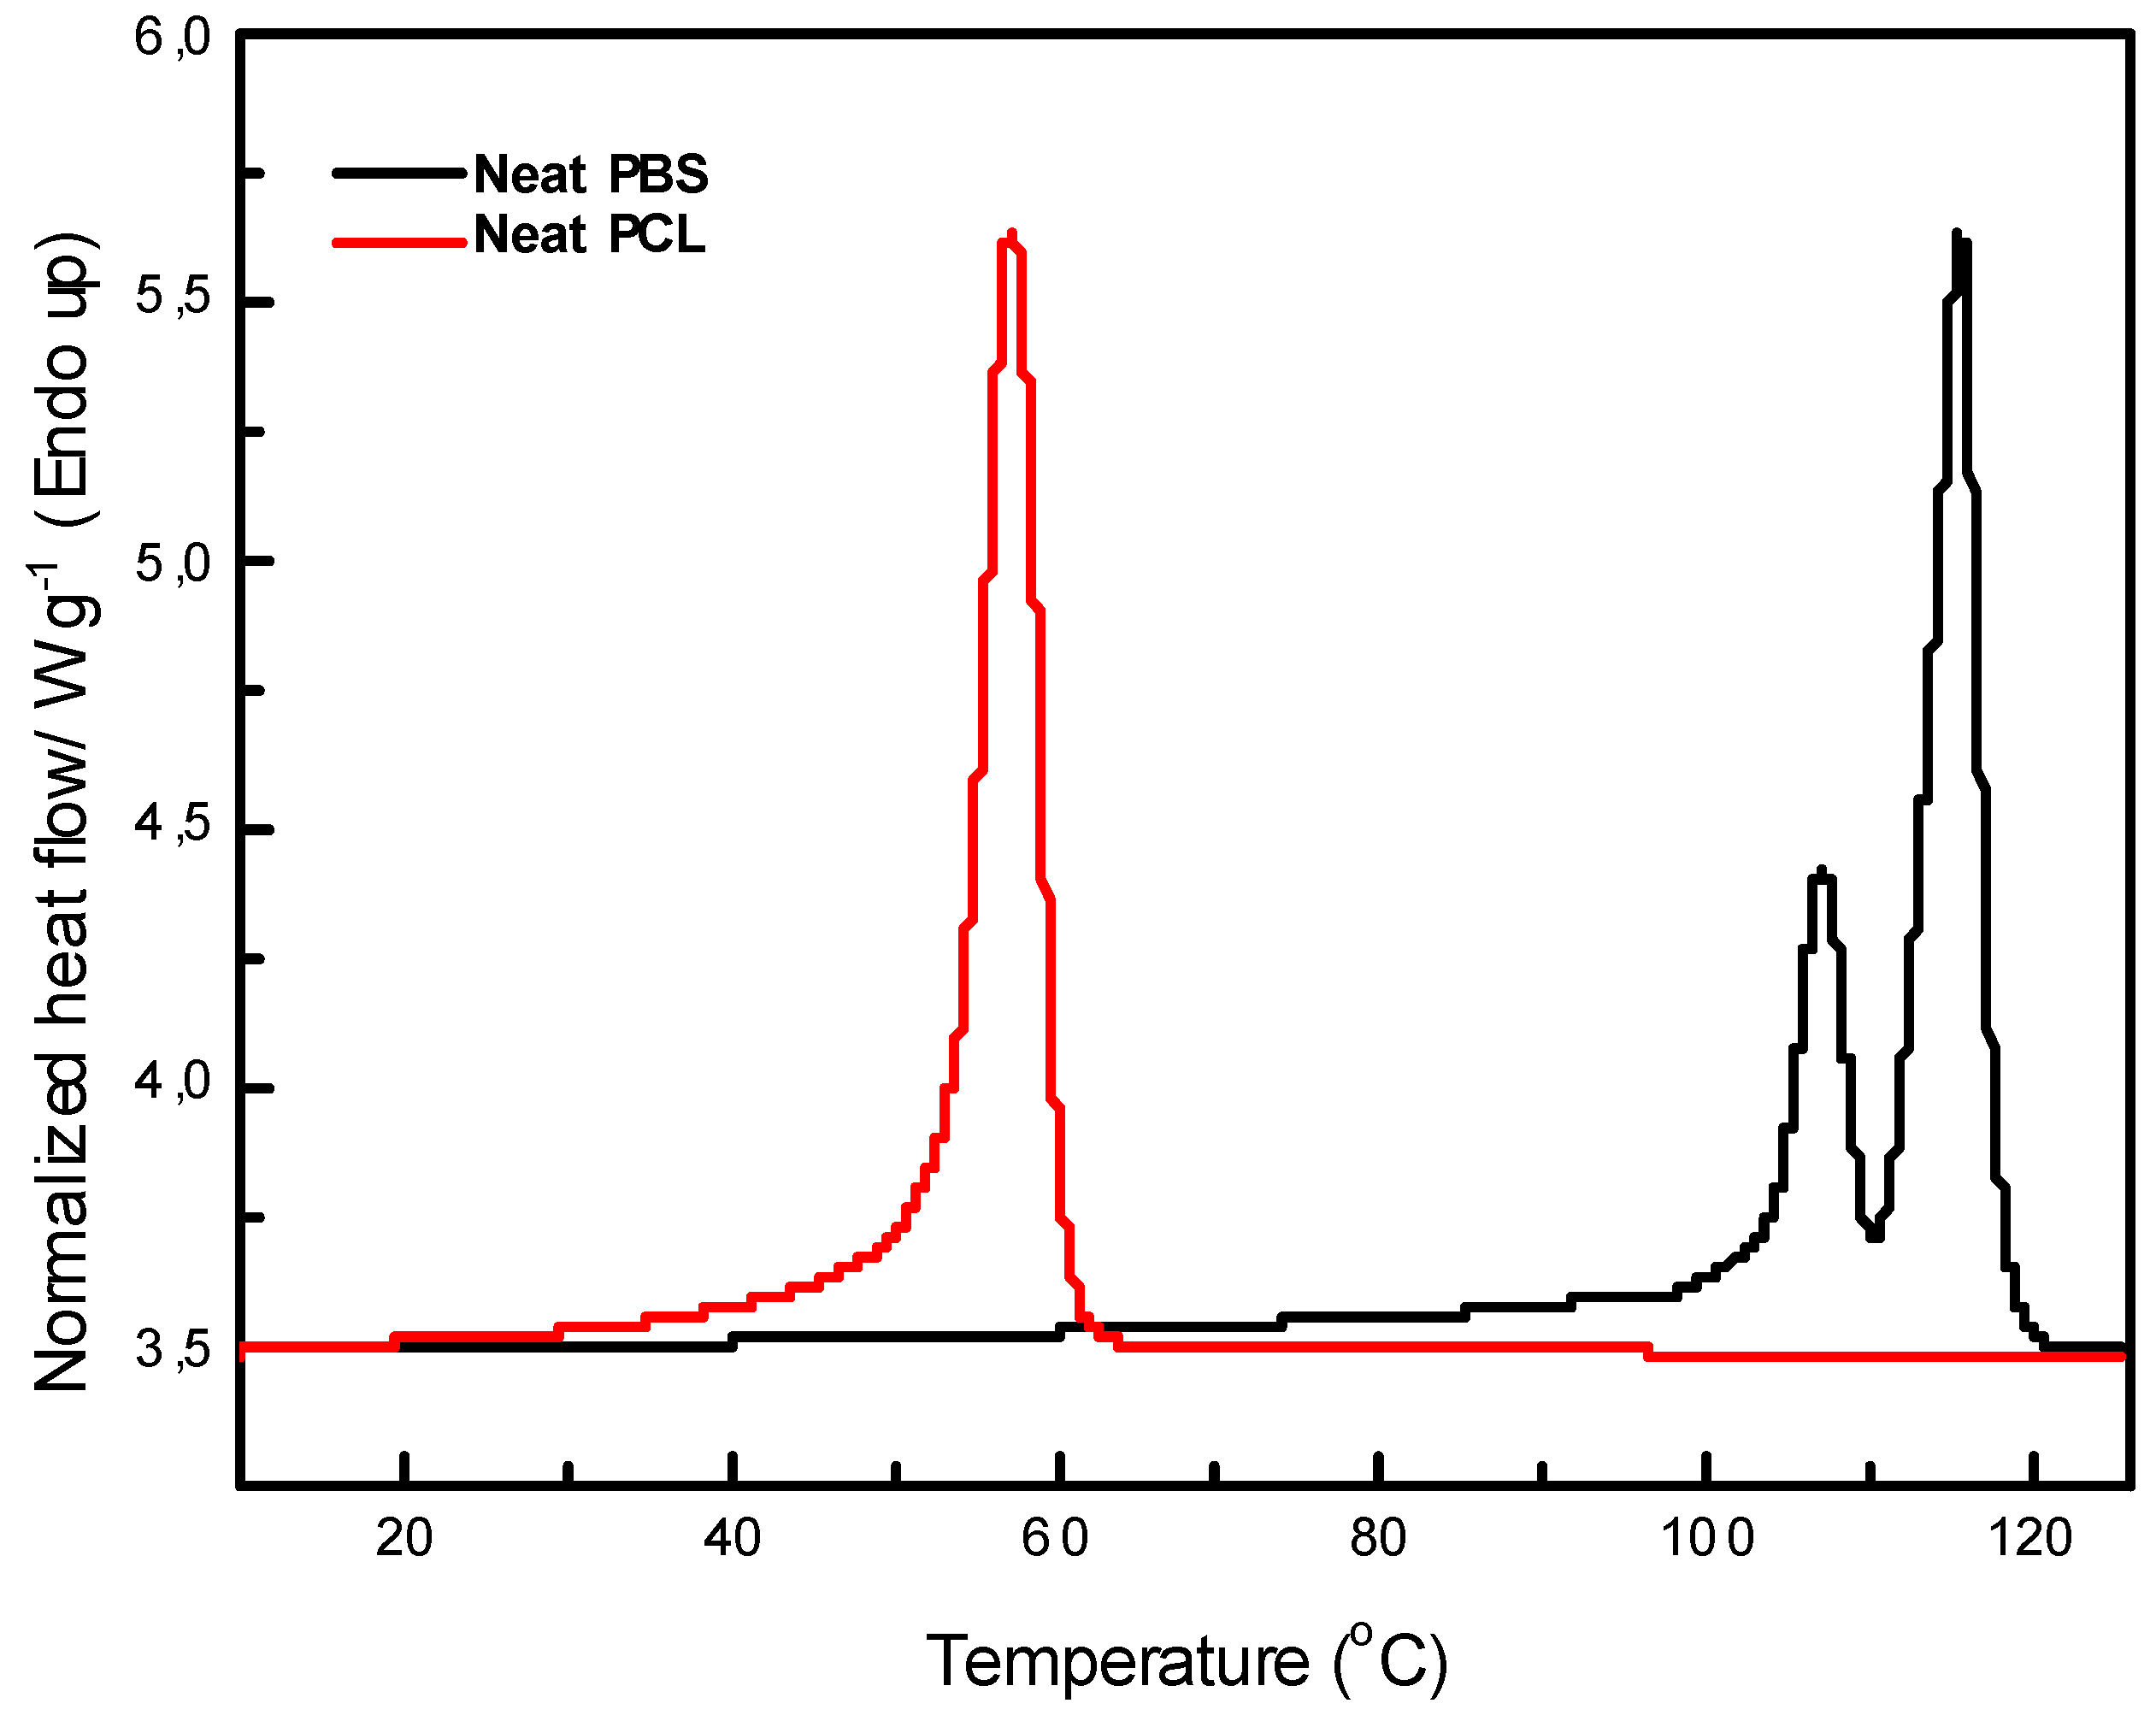
Figure 12.
DSC heating curves of (a) neat PBS and its composites with EA cellulose(b) neat PCL and its composites with EA cellulose at (1, 3 and 5 wt.%).
Figure 12.
DSC heating curves of (a) neat PBS and its composites with EA cellulose(b) neat PCL and its composites with EA cellulose at (1, 3 and 5 wt.%).
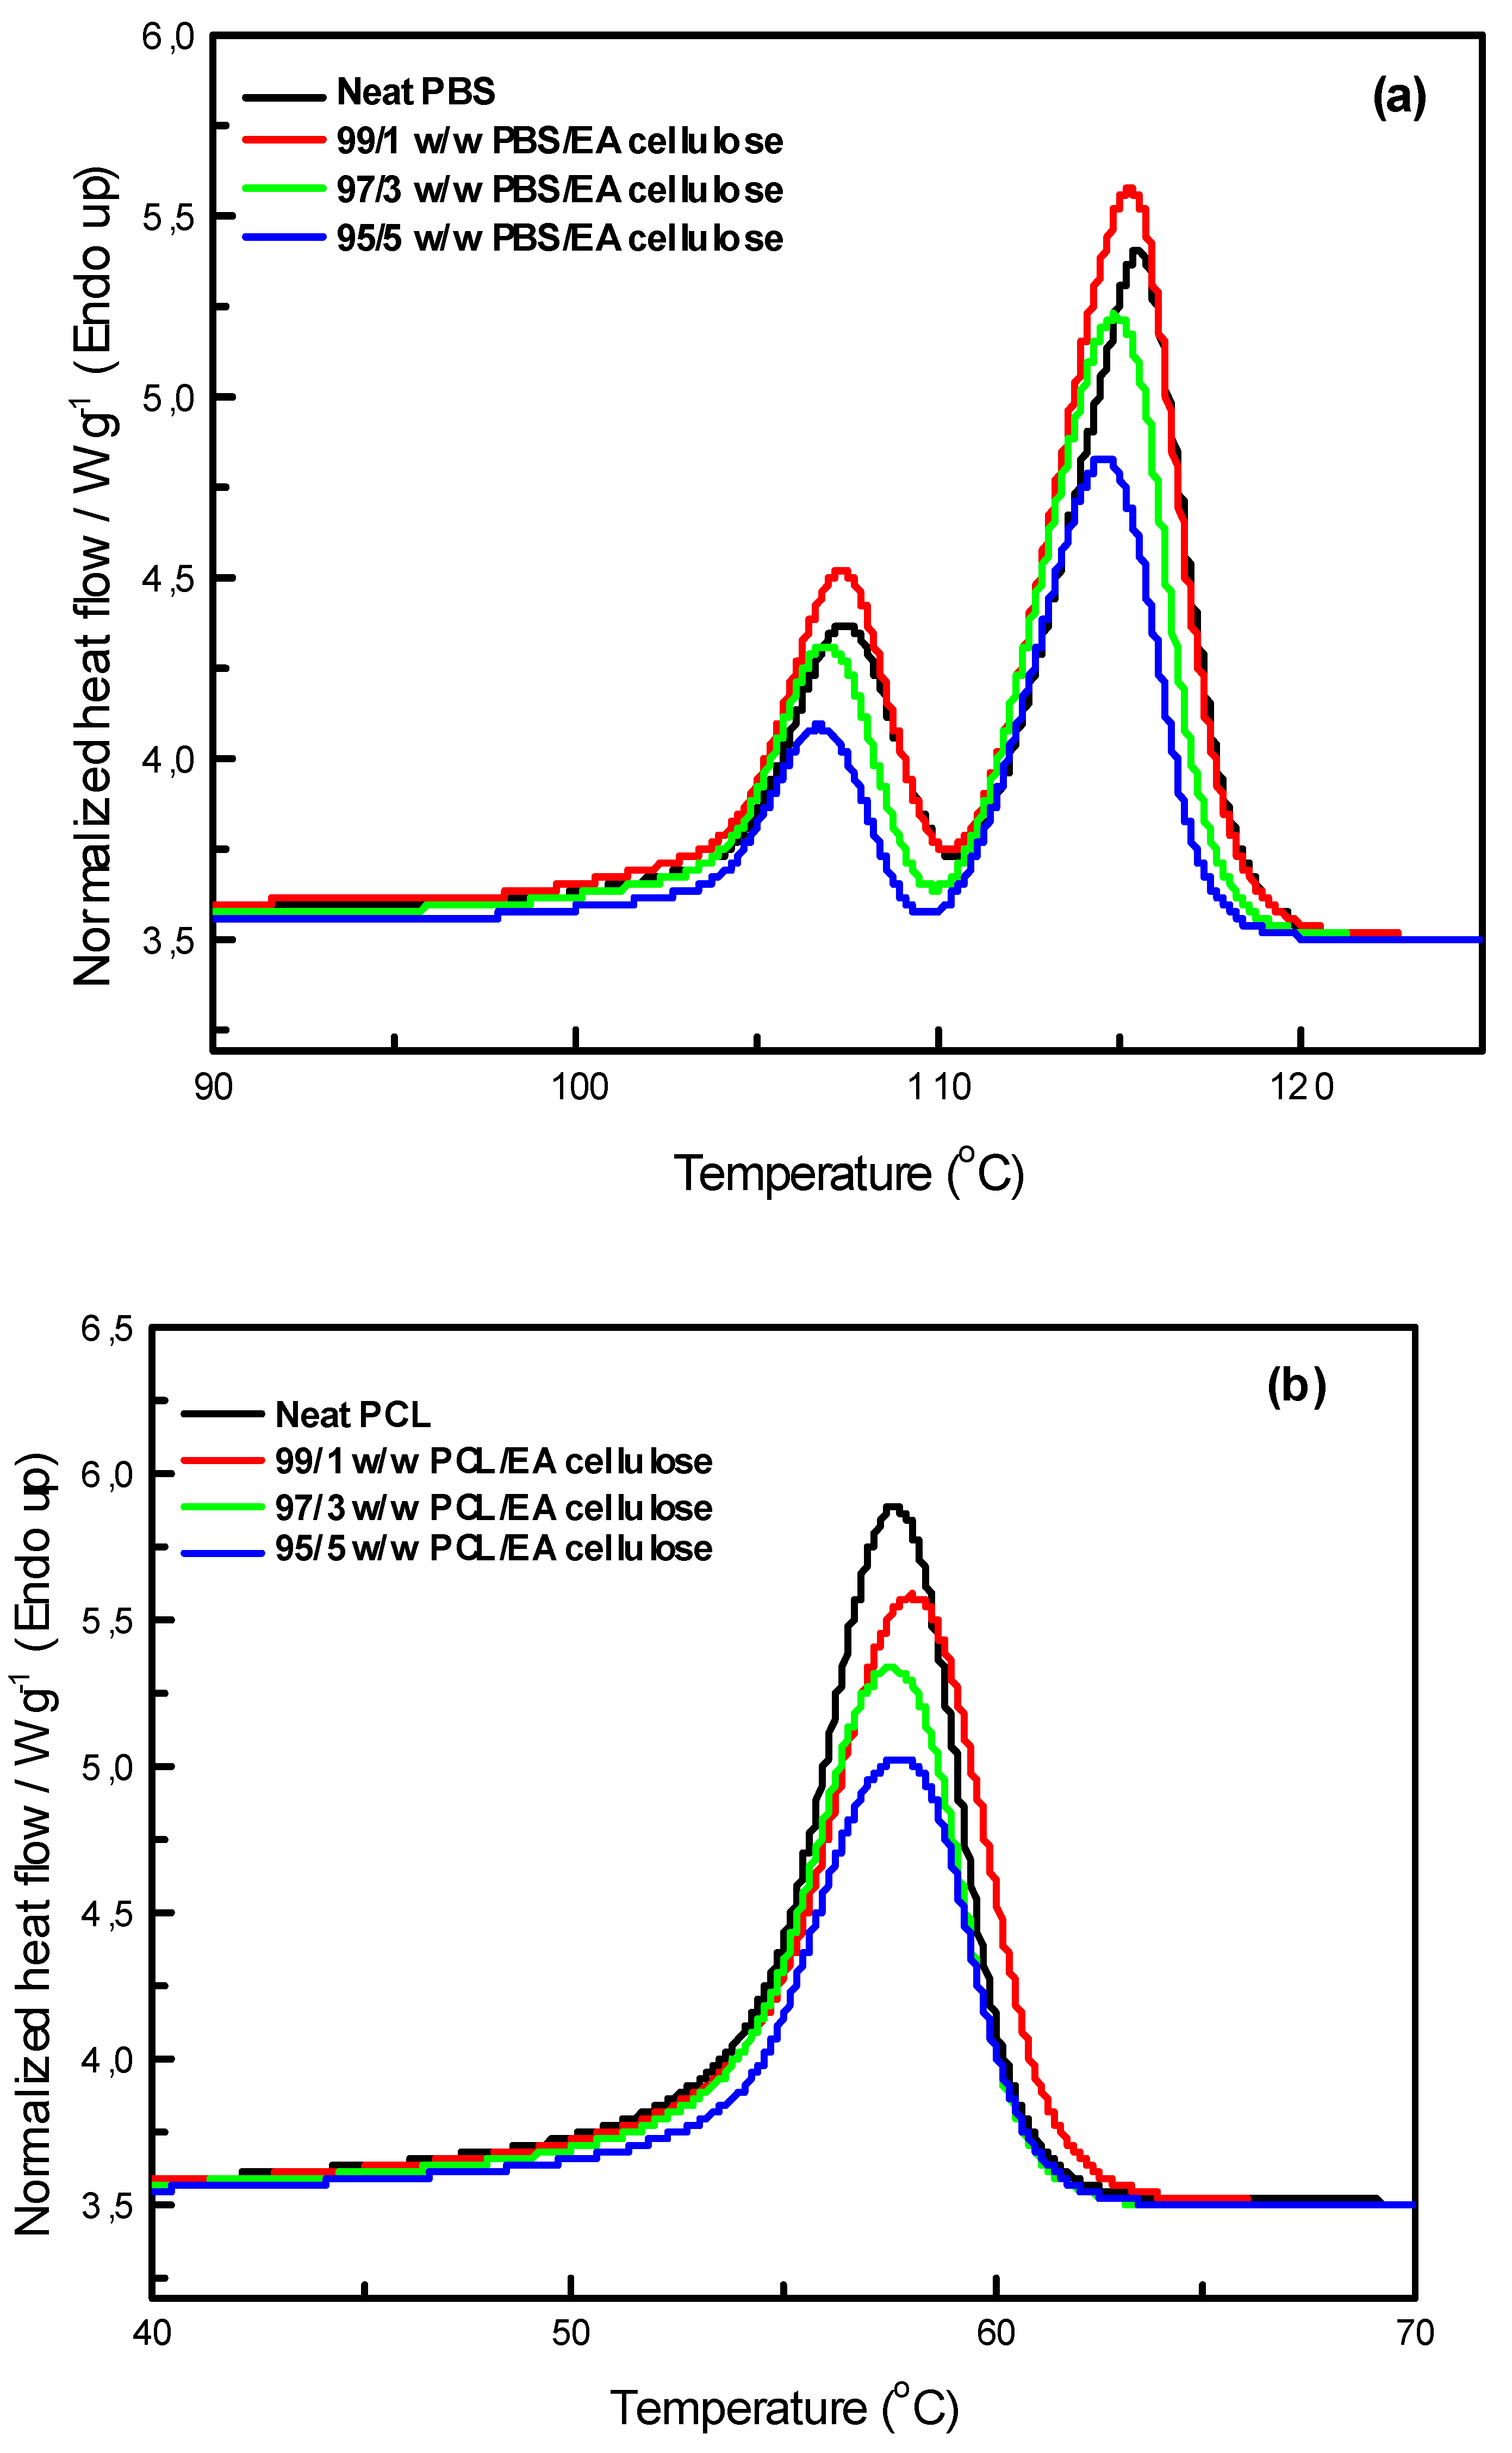
Figure 13.
(a) TGA curves, (b) TGA derivative curves for neat PBS, PCL and neat EA cellulose.
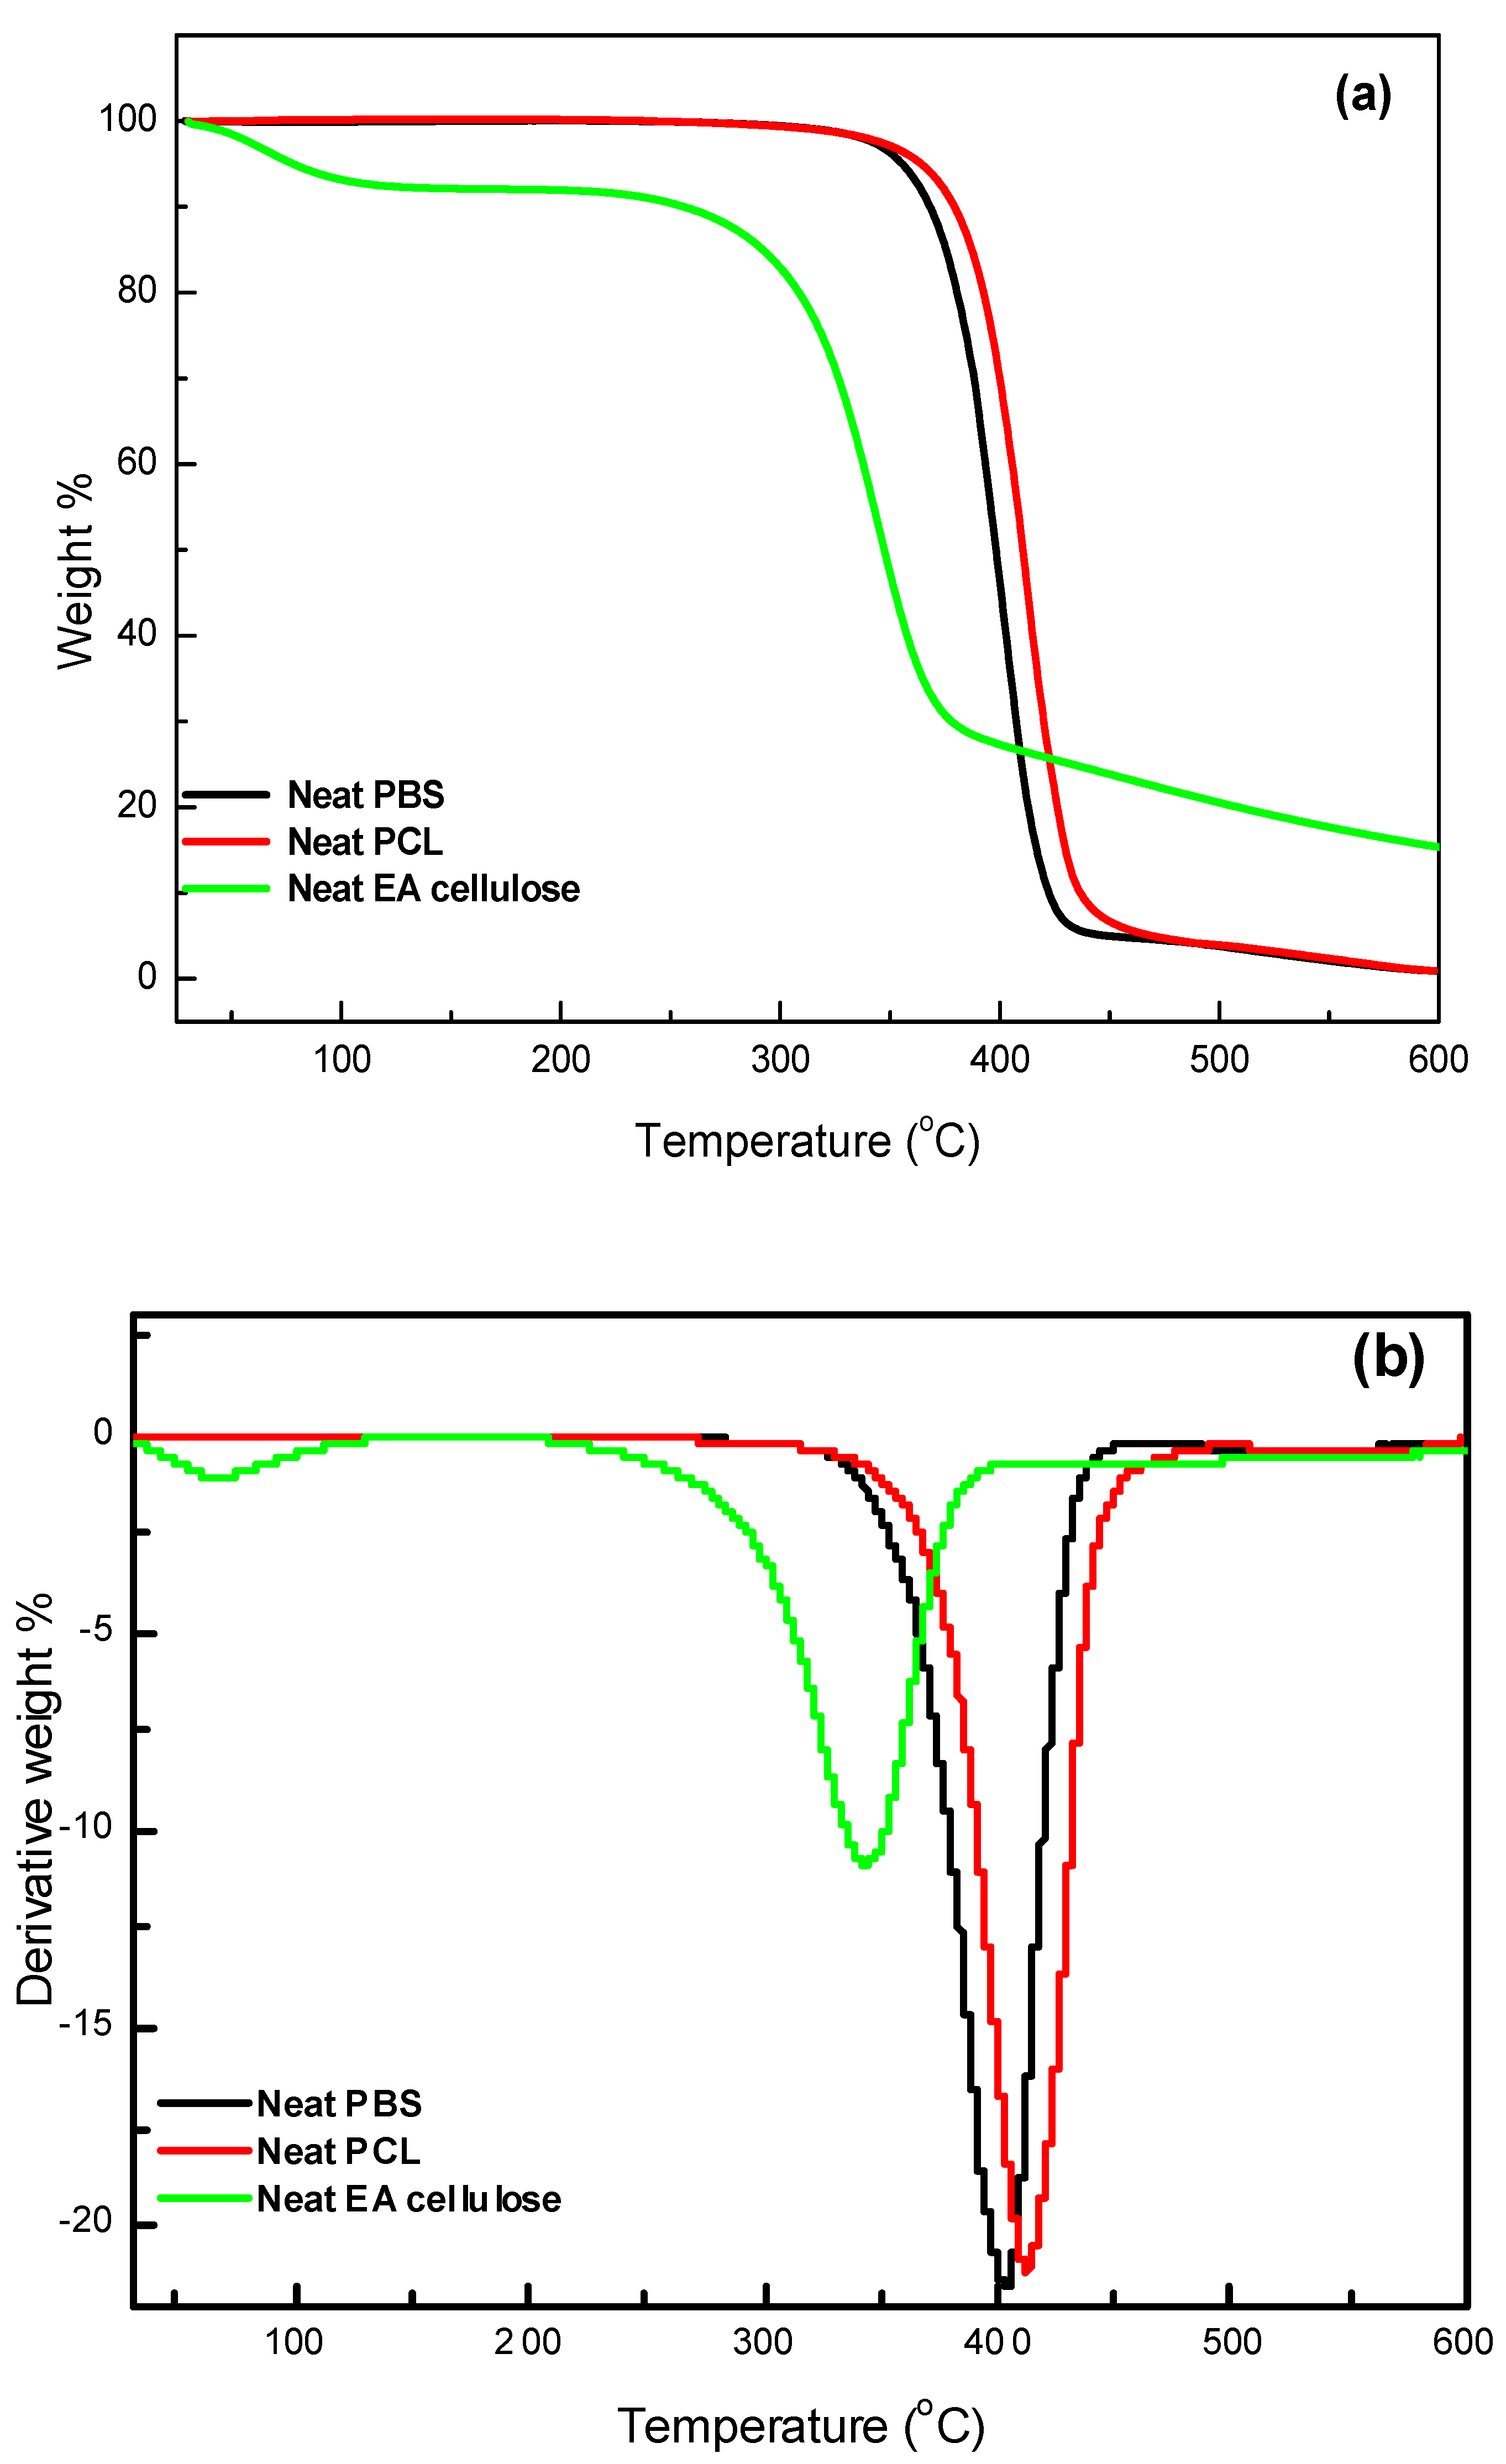
Figure 14.
(a) TGA curves, (b) DTG curves for neat PBS and its composites with (1, 3 and 5 wt.%) of EA cellulose.
Figure 14.
(a) TGA curves, (b) DTG curves for neat PBS and its composites with (1, 3 and 5 wt.%) of EA cellulose.
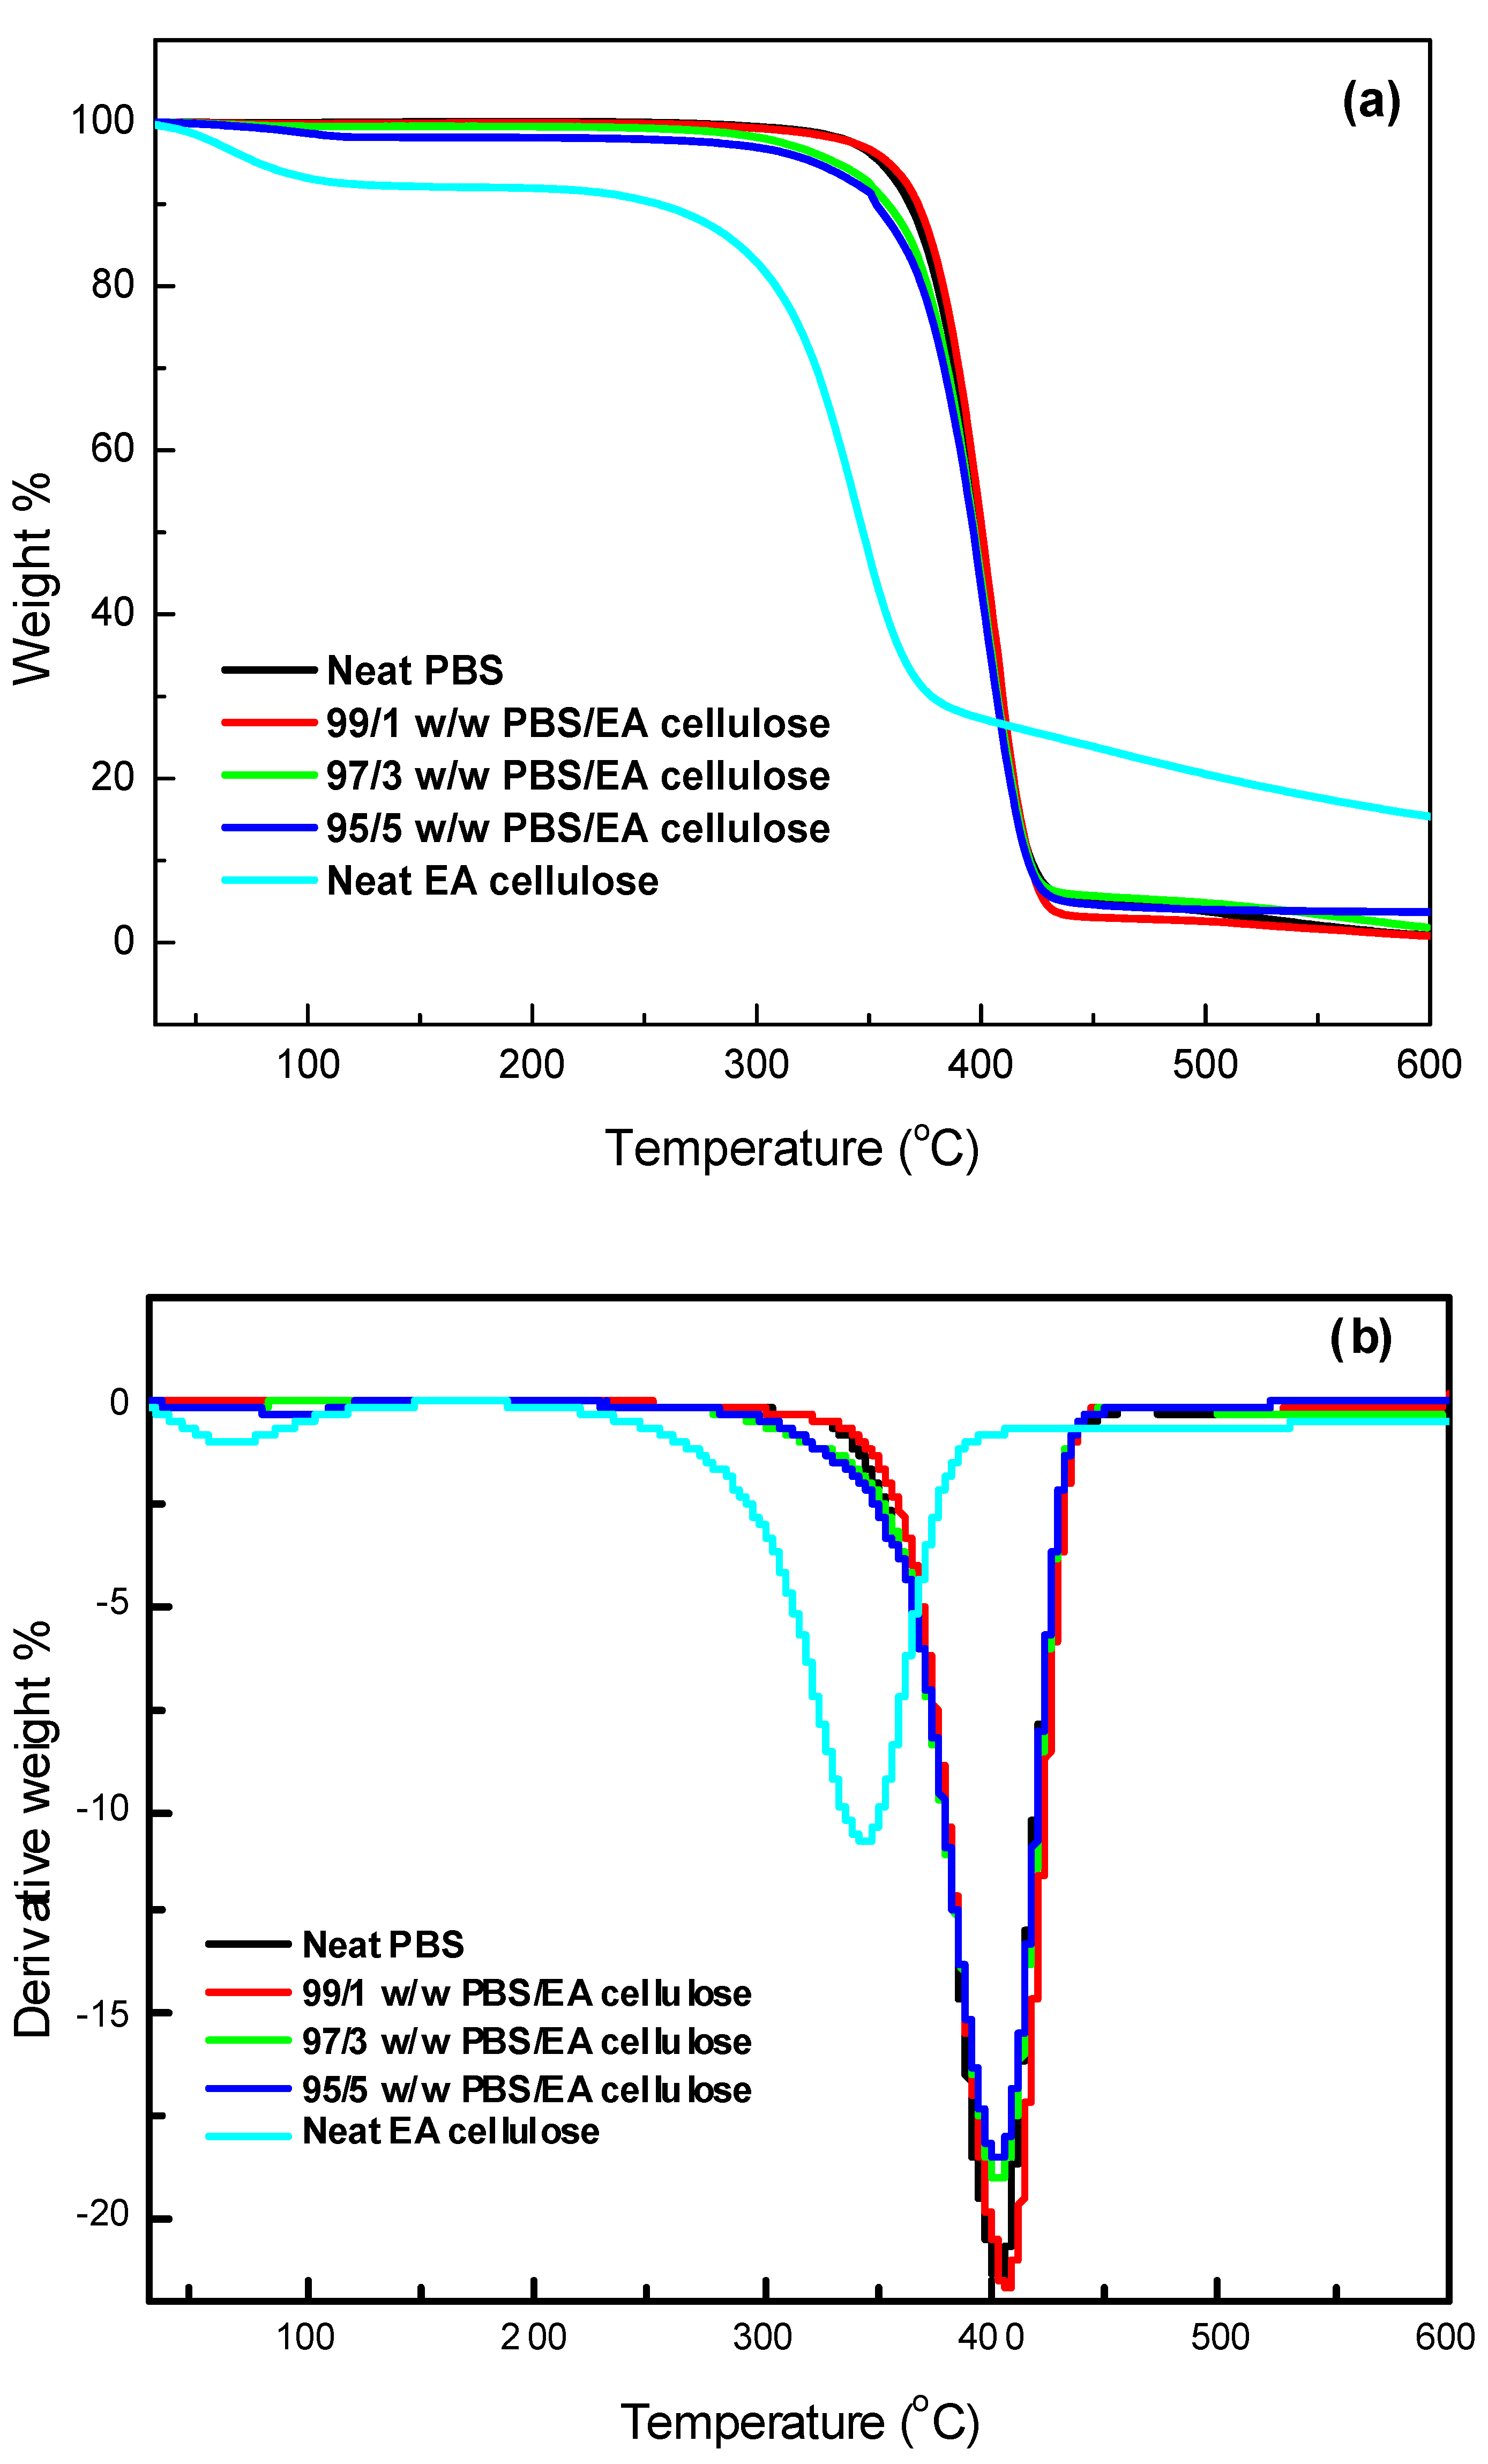
Figure 15.
(a) TGA curves, (b) DTG curves for neat PCL and its composites with (1, 3, and 5 wt.%) of EA cellulose.
Figure 15.
(a) TGA curves, (b) DTG curves for neat PCL and its composites with (1, 3, and 5 wt.%) of EA cellulose.
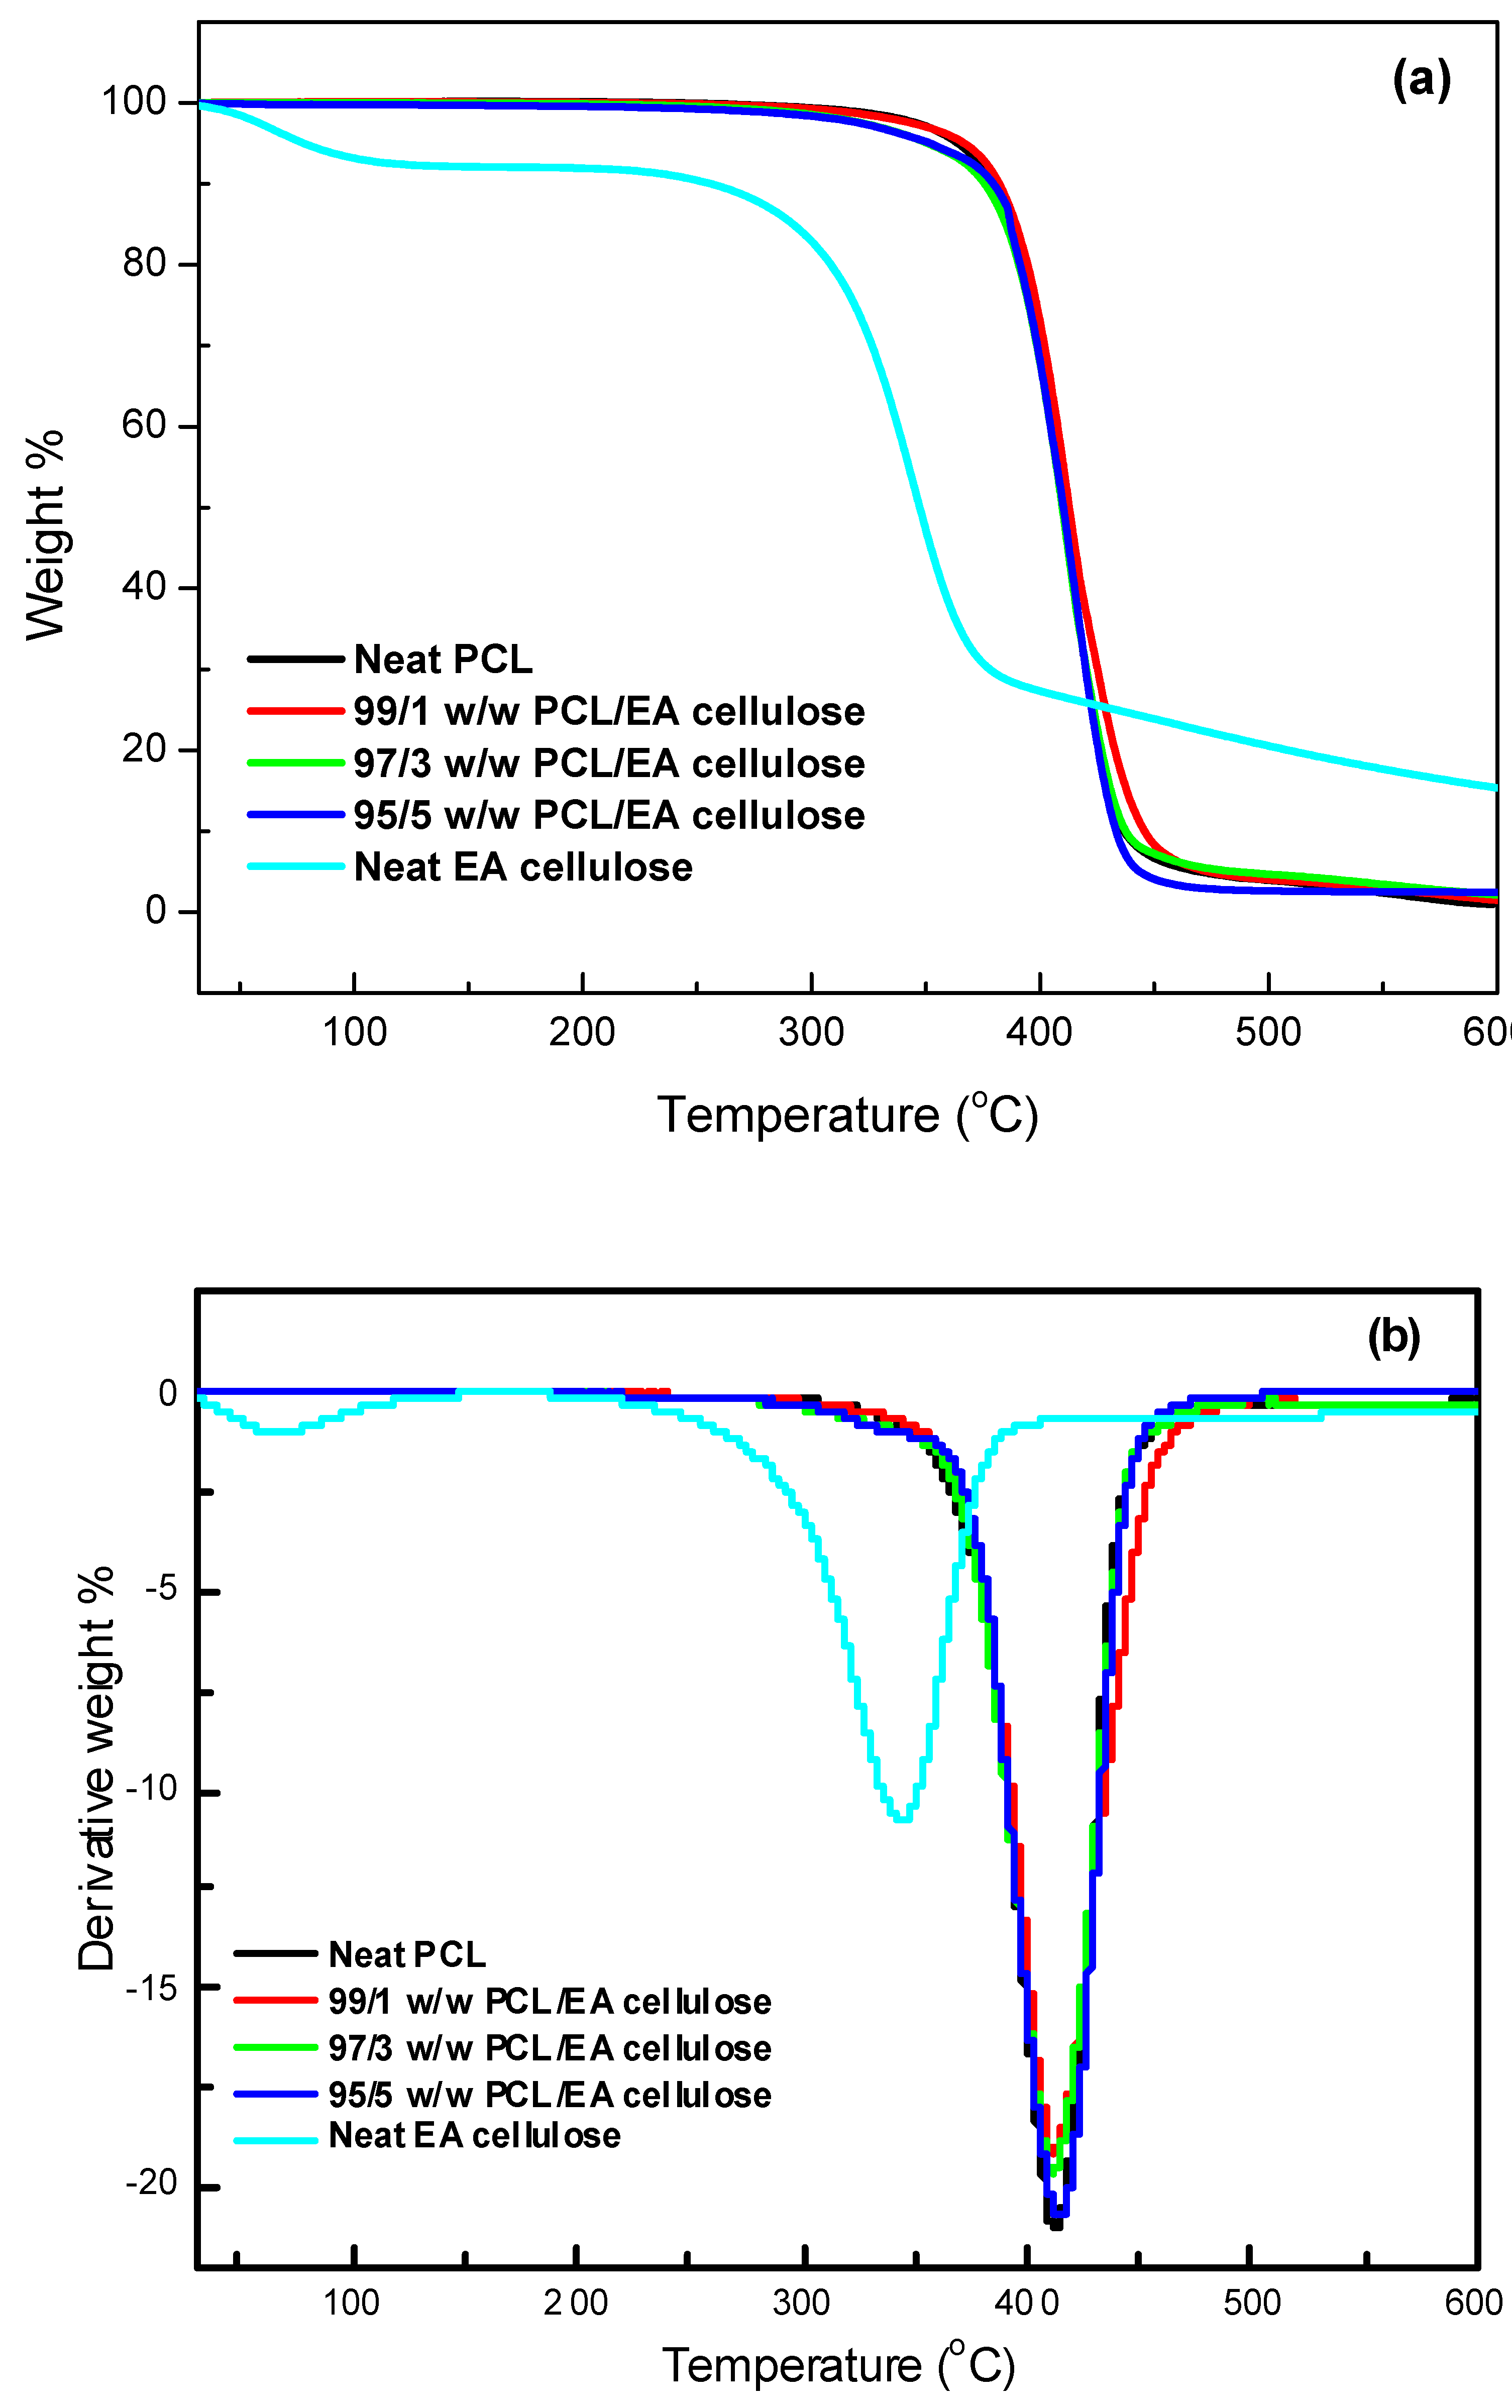

Table 1.
Extraction yield of cellulose from E. autumnalis leaf powder.
| Sample | Mass of the ground powder (g) | Mass of cellulose (g) | % yield of cellulose |
| Cellulose from the leaves | 60.02 | 23.02 | 38 |
Table 2.
Weight % of the components in the samples.
| PBS | PCL | EA cellulose |
| 100 | 0 | 0 |
| 99 | 0 | 1 |
| 97 | 0 | 3 |
| 95 | 0 | 5 |
| 0 | 100 | 0 |
| 0 | 99 | 1 |
| 0 | 97 | 3 |
| 0 | 95 | 5 |
Table 3.
FTIR analysis of neat PBS, PCL and EA cellulose.
| Materials | Assignment | Wavenumber (cm-1) |
| PBS | C-H stretching C=O stretching vibration -CH2 stretching -C-O-C symmetrical vibration C-OH bending |
2926 1711 1327 1158 917 |
| PCL | -CH2 stretching C=O stretching C-C and C-O stretching -C-O-C asymmetrical and symmetrical |
3000-2840 1730-1715 1291 and 1179 1190 and 1170 |
| EA cellulose | -OH stretching C-H stretching C-O stretching |
4000-2995 2890 1162-1022 |
Table 4.
Summary of DSC data for all prepared samples.
| SAMPLES | Tm /℃ | ∆Hm / J/g | Tc / ℃ | ∆Hc /J/g | Xc / % |
| Neat PBS | 107.4b ± 0.1 115.7c ± 0.2 |
14b ± 0.6 39c ± 2.9 |
90.2b ± 0.0 | 70b ± 2.4 | 27.5b |
| 99/1 w/w PBS/EA cellulose | 107.3b± 0.1 115.5c± 0.2 |
15b ± 0.8 41c ± 1.6 |
92.0b ± 0.3 | 72b ± 2.5 | 28.4b |
| 97/3 w/w PBS/EA cellulose | 107.2b ± 0.2 115.4c± 0.2 |
11b ± 1.1 31c ± 1.7 |
90.9b ± 0.2 | 57b ± 2.6 | 21.3b |
| 95/5 w/w PBS/EA cellulose | 106.9b ± 0.2 114.9c ± 0.1 |
12b ± 1.3 32c ± 3.0 |
91.0b ± 0.2 | 56b ± 1.4 | 23.0b |
| Neat PCL | 57.6a ± 0.2 | 56a ± 2.6 | 29.8a ± 0.4 | 68a ± 1.8 | 40.0a |
| 99/1 w/w PCL/EA cellulose | 57.8a ± 0.2 | 55a ± 0.6 | 28.9a ± 1.5 | 64a ± 1.5 | 39.7a |
| 97/3 w/w PCL/EA cellulose | 57.4a ± 0.2 | 51a ± 4.7 | 28.6a ± 0.2 | 62a ± 4.2 | 38.0a |
| 95/5 w/w PCL/EA cellulose | 57.9a ± 0.4 | 48a ± 4.5 | 29.3a ± 0.6 | 53a ± 0.9 | 36.0a |
Table 5.
Summary of TGA and DTG results for all investigated samples.
| SAMPLES | Tonset / ℃ | T50% / ℃ | Tmax / ℃ | Char / mass% |
| Neat EA cellulose | 85.69 309.03 |
344.16 | 83.42 344.79 |
15.3 |
| Neat PBS | 347.85 | 397.03 | 402.17 | 0.8 |
| 99/1 w/w PBS/EA cellulose | 374.78 | 401.03 | 406.16 | 0.2 |
| 97/3 w/w PBS/EA cellulose |
372.13 | 397.01 | 403.81 | 1.4 |
| 95/5 w/w PBS/EA cellulose | 371.79 | 394.25 | 403.08 | 4.2 |
| Neat PCL | 360.87 | 409.65 | 413.17 | 0.9 |
| 99/1 w/w PCL/EA cellulose | 368.59 | 410.20 | 411.80 | 1.4 |
| 97/3 w/w PCL/EA cellulose |
373.74 | 410.57 | 412.08 | 1.8 |
| 95/5 w/w PCL/EA cellulose | 382.30 | 409.31 | 414.55 | 3.0 |
Disclaimer/Publisher’s Note: The statements, opinions and data contained in all publications are solely those of the individual author(s) and contributor(s) and not of MDPI and/or the editor(s). MDPI and/or the editor(s) disclaim responsibility for any injury to people or property resulting from any ideas, methods, instructions or products referred to in the content. |
© 2025 by the authors. Licensee MDPI, Basel, Switzerland. This article is an open access article distributed under the terms and conditions of the Creative Commons Attribution (CC BY) license (http://creativecommons.org/licenses/by/4.0/).
Copyright: This open access article is published under a Creative Commons CC BY 4.0 license, which permit the free download, distribution, and reuse, provided that the author and preprint are cited in any reuse.


