
Submitted:
21 February 2025
Posted:
24 February 2025
You are already at the latest version
Abstract
This study provides a comprehensive analysis of the development of mountain entrepreneurship within the food and tourism sectors, contributing to the body of research dedicated to the evolution of mountain businesses in Europe. The investigation focused on the available mountain entrepreneurship indicators from the Eurostat database, covering a sample of 15 European countries: Austria, Bulgaria, Croatia, the Czech Republic, France, Germany, Greece, Italy, Poland, Portugal, Romania, Slovakia, Slovenia, Spain, and Sweden. Through statistical methods, the countries analyzed were integrated into common models, allowing for the derivation of conclusions that are representative of European mountain entrepreneurship. The results indicate a stable and sustainable mountain entrepreneurial environment, with positive implications for both the food and tourism sectors, reflecting a favorable trend within European business contexts. This analysis highlights the growth and strengthening potential of mountain entrepreneurship, providing an empirical foundation for future policies and strategies in the field.
Keywords:
food and tourism entrepreneurship
; mountain european entrepreneurship
; european mountain series analysis
Introduction and Literature Review
In the third paper of the series dedicated to European mountain entrepreneurship (the authors' series can be found under European Mountain Series Analysis 2025 and European Mountain Series Forecasting 2025), the authors highlight the significance of developing the food and tourism sectors to ensure the sustainability of high-altitude regions. The research is based on Eurostat indicators from the European business demographics index, specifically the mountain area section (I1-I28), with explanations of the indicators available at DOI: https://doi.org/10.5281/zenodo.14713867.
In a study on consumer behavior regarding local food products in the Italian Alps, an attempt was made to observe how the use of indigenous dishes stimulates spending in less favored mountain communities. The study, based on 507 responses to a questionnaire, reveals a paradox concerning the net turnover of local mountain entrepreneurs: while consumer spending increases, entrepreneurs’ incomes remain limited to certain financial thresholds. Only intervention from European, central, and local governance has managed to break the cycle of entrepreneurs’ incomes being capped at specific thresholds. Thus, local products can represent sustained added value, provided there are appropriate local policies supporting them. (Duglio et al., 2022)
Another study examining consumer perception of local mountain food products demonstrates the high value of mountain businesses among young people. The study, conducted through a questionnaire applied to 4,079 students, shows that mountain products represent a fundamental category of all food types (cheese, meat, honey, fruits, and vegetables). The research posits that all stages of the supply chain should be independently developed in mountain areas. It demonstrates that the mountain agro-food economy is a key pillar, not only for economic resilience but also for stimulating social and environmental spheres. Within this context, mountain products form the foundational pillar of the mountain economy. Similar to other studies, this one emphasizes the importance of mountain policies in developing the mountain economy and business environment. (Bonadonna et al., 2022)
A study on the European mountain economy found that small farms and businesses primarily ensure local food security, especially under conditions of complexity, instability, and unpredictability. It also observed that strong collective action contributes to the adaptive capacity of small farms. Specific to the development of European mountain agriculture, studies show that the participatory method predominantly supports European agriculture. This research also reinforces the need for appropriate mountain policies, particularly in light of the insularity phenomenon commonly found in some European mountain areas. Furthermore, the study highlights the importance of mountain products and businesses in ensuring food security and superior nutrition from a qualitative standpoint. (Ortiz-Miranda et al., 2022)
A study examining the relationship between systemic practices and production in small artisanal food businesses shows that in a rural region of Germany, local practices are maintained through teleoaffective structures and socio-material arrangements. The same study reveals that this specific niche mode supports cooperation within the niche while hindering cooperation outside it. The research concludes that local production and networking practices lead to a unique niche path for business development. (Tuitjer, 2022)
Italian researchers have emphasized the importance of developing mountain products as niche products. Mountain agriculture represents a defining source of ecosystem services such as biodiversity, culture, and traditions. Certain food subsectors, particularly dairy, show considerable economic decline, impacting both the business sector and quality of life. The research by Staffolani et al. (2022) shows that a holistic approach to mountain issues addresses numerous ecosystemic shortcomings. It was observed that the most important factor in developing mountain businesses is the uniqueness or rarity of mountain products. The study highlighted the additional financial interest in mountain products, particularly those that are labeled, with a substantial willingness to pay for local, specialized products from high-altitude regions. (Staffolani et al., 2022)
A group of mountain researchers from Spain observed the importance of sustainability in mountain areas, especially in addressing depopulation, which is more common than in low-altitude areas. In their research, Vidal-Matzanke and Vidal-González (2022) noted the reversal of the depopulation process through reversal strategies that led to a significant increase in sports tourism. Mountain entrepreneurs who combined mountain businesses with offers in sports tourism substantially increased the added value of their benefits. The study, which involved 16 semi-structured interviews, clearly indicated the increase in competitiveness through the provision of sports products and services. It was noted that the symbiosis of locally specific offers from both public and private governance ensures high sustainability through the presence of sports products and services. (Vidal-Matzanke & Vidal-González, 2022)
Skiing, the most practiced sport in mountain areas, is affected by climate change and the predicted reduction in snow, requiring urgent actions. The results of a study conducted by Colasante et al. (2024) highlight the importance of engaging stakeholders and the relevance of mountain strategies, such as zero-emission lodges, energy communities, and zero-emission ski lifts. The same research suggests the need for political interventions to protect mountain tourism, including financing the conversion of facilities, expanding mountain infrastructure, and rewarding tourists who choose certified zero-emission resorts. (Colasante et al., 2024)
Methodology
This study, conducted through a methodological approach based on the analysis of specialized literature, develops a statistical analysis that integrates the modeling and simulation of statistical data using Microsoft Excel and SPSS. The analyzed data come from the Eurostat meta-index, with the results presented in Table 1 and the histograms of the study, covering the period 2021-2022.
The frequency analysis method allows for the identification of the methodological conditionalities associated with each indicator of mountain entrepreneurship. The study includes a set of 28 indicators (I1-I28, according to Table 1), and the analysis is performed at the group level of countries.
The countries included in the sample, evaluated based on the cumulative percentages for each indicator, return the following distributed results: Austria (6.7%), Bulgaria (13.3%), Croatia (20.0%), the Czech Republic (26.7%), France (33.3%), Germany (40.0%), Greece (46.7%), Italy (53.3%), Poland (60.0%), Portugal (66.7%), Romania (73.3%), Slovakia (80.0%), Slovenia (86.7%), Spain (93.3%), and Sweden (100.0%).
This methodological framework allows for the extraction of relevant conclusions regarding the dynamics of mountain entrepreneurship in the analyzed countries, highlighting the distribution and behavior of the selected indicators.
In the analysis of histograms, the focus is on identifying distributions and statistical trends. The data are processed through frequency analysis methods, and the generated histograms (see resulting histograms) enable the visualization of the distribution of each indicator. The analysis process includes the following steps:
- Data Processing: Raw data, imported into Excel and SPSS, are carefully organized for analysis. Calculations, based on the absolute and relative frequencies for each indicator, return distributions graphically represented in the form of histograms.
- Distribution Analysis: Histograms are used to identify the type of distribution (left-skewed, Gaussian, or right-skewed) and to determine the general trends of the indicators. This step also involves calculating descriptive statistics, such as the mean, median, standard deviation, etc.
- Comparison Between Countries: The data are aggregated at the national level, and the cumulative percentages for each country are used to compare the evolution of indicators across different EU member states.
- Validation of Results: The results are calibrated by comparing them with specialized literature and verifying the consistency of the data within the statistical tools used.
This methodology provides a clear understanding of the distribution and trends of the studied indicators, forming a solid foundation for interpreting the results and formulating economic recommendations.

Table 1.
Frequency Statistics for Indicators I1-I28.
| I1.2021 | I1.2022 | I2.2021 | I2.2022 | I3.2021 | I3.2022 | I4.2021 | I4.2022 | I5.2021 | I5.2022 | I6.2021 | I6.2022 | |||||
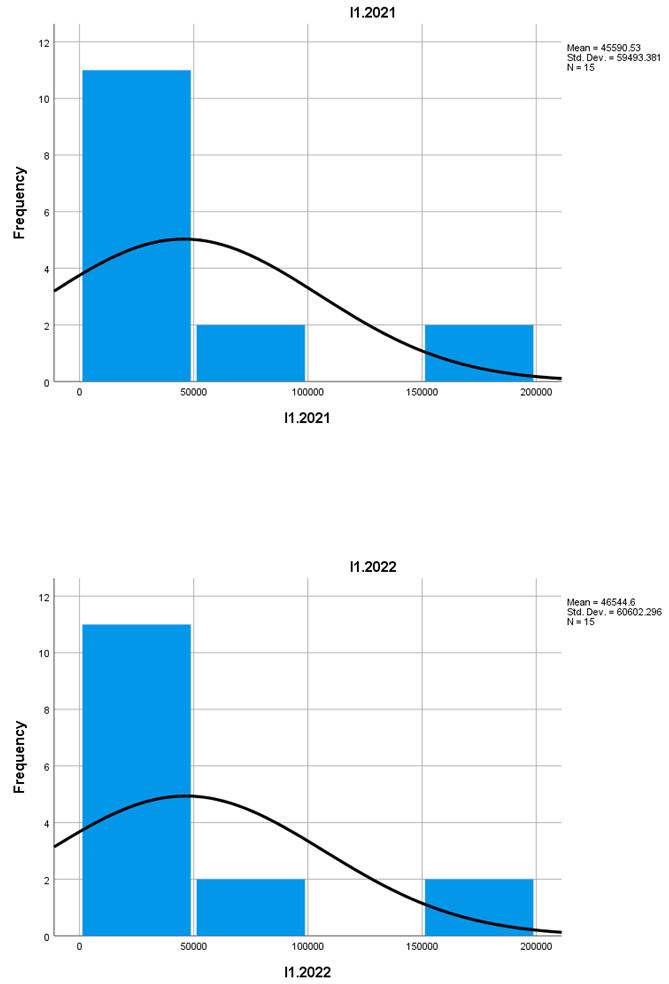
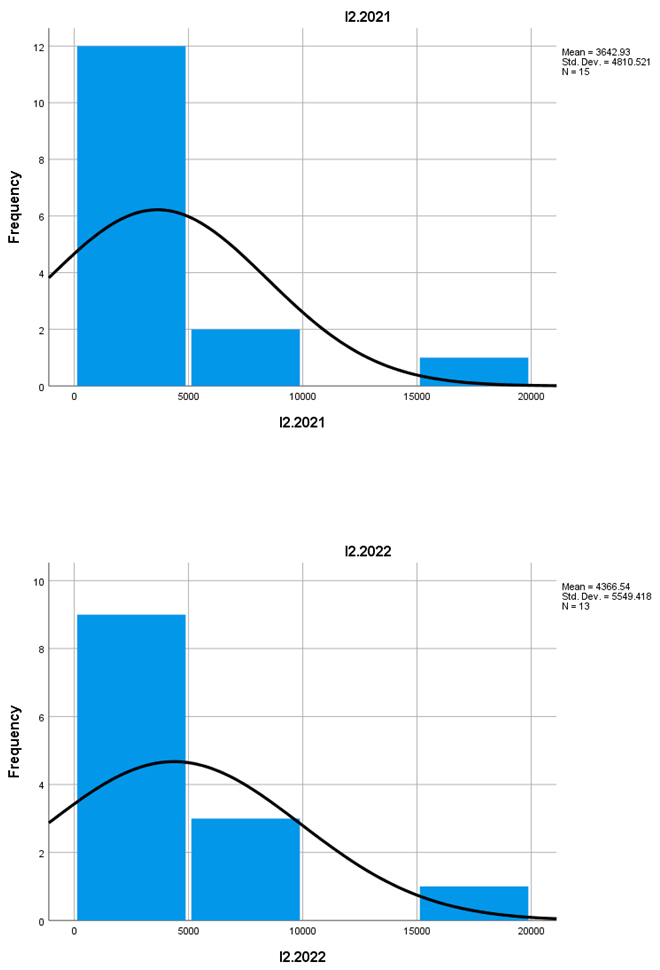
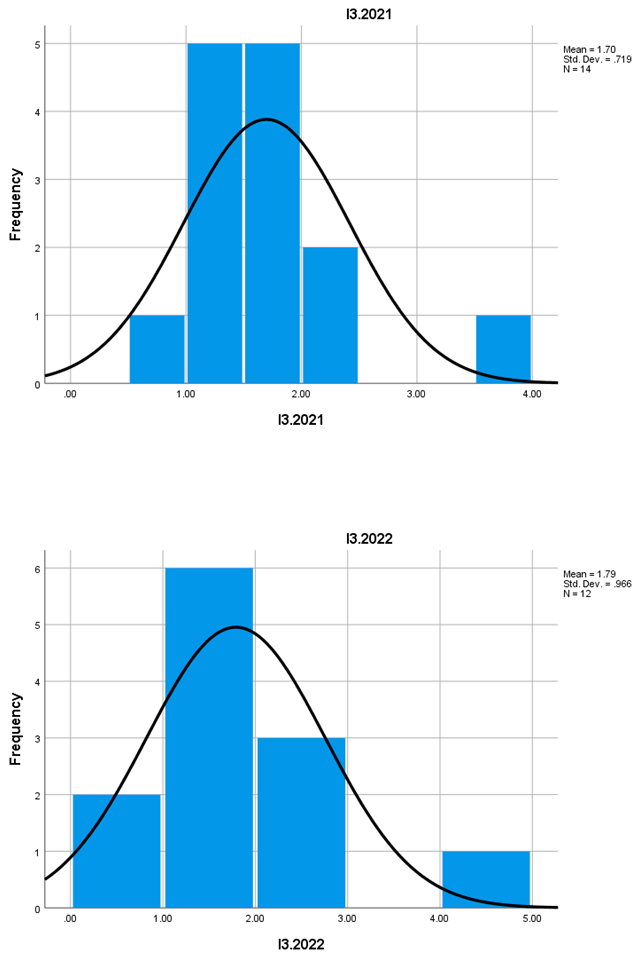
| Mean | 45590.53 | 46544.60 | 3642.93 | 4366.54 | 1.6971 | 1.7900 | 1.00 | 1.00 | 3013.80 | 4091.00 | 61.5857 | 66.3525 | ||||
| Std. Error of Mean | 15361.125 | 15647.446 | 1242.071 | 1539.132 | 0.19225 | 0.27891 | 0.000 | 0.000 | 1099.372 | 1565.708 | 19.38997 | 22.86714 | ||||
| Median | 16421.00 | 16421.00 | 1540.00 | 1559.00 | 1.6650 | 1.7700 | 1.00 | 1.00 | 1555.00 | 1778.00 | 33.2750 | 28.0600 | ||||
| Mode | 794a | 667a | 49a | 60a | .94a | .65a | 1 | 1 | 48a | 1505 | 3.08a | 2.83a | ||||
| Std. Deviation | 59493.381 | 60602.296 | 4810.521 | 5549.418 | 0.71932 | 0.96616 | 0.000 | 0.000 | 4257.850 | 5645.240 | 72.55061 | 79.21410 | ||||
| Skewness | 1.852 | 1.830 | 2.339 | 1.893 | 1.657 | 1.943 | 2.544 | 2.580 | 1.648 | 1.374 | ||||||
| Std. Error of Skewness | 0.580 | 0.580 | 0.580 | 0.616 | 0.597 | 0.637 | 0.580 | 0.616 | 0.580 | 0.616 | 0.597 | 0.637 | ||||
| Kurtosis | 2.509 | 2.427 | 5.801 | 3.590 | 3.711 | 5.348 | 6.554 | 7.179 | 1.832 | 0.670 | ||||||
| Std. Error of Kurtosis | 1.121 | 1.121 | 1.121 | 1.191 | 1.154 | 1.232 | 1.121 | 1.191 | 1.121 | 1.191 | 1.154 | 1.232 | ||||
| Range | 193651 | 197290 | 18150 | 19213 | 2.74 | 3.79 | 0 | 0 | 16041 | 20893 | 225.63 | 221.96 | ||||
| Minimum | 794 | 667 | 49 | 60 | 0.94 | 0.65 | 1 | 1 | 48 | 37 | 3.08 | 2.83 | ||||
| Maximum | 194445 | 197957 | 18199 | 19273 | 3.68 | 4.44 | 1 | 1 | 16089 | 20930 | 228.71 | 224.79 | ||||
| Sum | 683858 | 698169 | 54644 | 56765 | 23.76 | 21.48 | 15 | 13 | 45207 | 53183 | 862.20 | 796.23 | ||||
| Percentiles | 25 | 11250.00 | 12111.00 | 1014.00 | 1013.50 | 1.1575 | 1.1000 | 1.00 | 1.00 | 853.00 | 1177.50 | 11.9700 | 11.9475 | |||
| 50 | 16421.00 | 16421.00 | 1540.00 | 1559.00 | 1.6650 | 1.7700 | 1.00 | 1.00 | 1555.00 | 1778.00 | 33.2750 | 28.0600 | ||||
| 75 | 71104.00 | 75354.00 | 4888.00 | 8074.00 | 1.9950 | 2.0925 | 1.00 | 1.00 | 2368.00 | 5019.00 | 89.2250 | 102.4775 | ||||
| I7.2021 | I7.2022 | I8.2021 | I8.2022 | I10.2021 | I10.2022 | I12.2021 | I12.2022 | I13.2021 | I13.2022 | I14.2021 | I14.2022 | I15.2022 | I16.2021 | I16.2022 | ||
| Mean | 2681.13 | 2866.54 | 6.2487 | 6.3054 | 81.69 | 119.80 | 16.2367 | 19.8838 | 8.8807 | 9.8800 | 7.3547 | 10.0046 | 1.2592 | 195035.00 | 227685.31 | |
| Std. Error of Mean | 888.389 | 1066.519 | 0.49449 | 0.47856 | 20.007 | 52.417 | 1.28940 | 2.02621 | 0.82793 | 0.91219 | 0.64898 | 1.39889 | 1.58134 | 67790.735 | 84579.140 | |
| Median | 990.00 | 1150.00 | 6.0200 | 6.3400 | 78.00 | 52.00 | 16.1300 | 18.9500 | 8.7600 | 9.5400 | 6.9100 | 9.6000 | 1.8100 | 72128.00 | 63500.00 | |
| Mode | 36a | 36a | 3.08a | 3.17a | 28 | 21a | 8.45a | 10.86a | 3.98a | 4.79a | 2.59a | 4.82a | -15.99a | 3729a | 3206a | |
| Std. Deviation | 3440.714 | 3845.388 | 1.91513 | 1.72546 | 72.138 | 165.756 | 4.99384 | 7.30561 | 3.20654 | 3.28896 | 2.51349 | 5.04377 | 5.70159 | 262552.387 | 304954.426 | |
| Skewness | 2.028 | 2.061 | 0.821 | 0.507 | 1.918 | 2.568 | 0.075 | 0.818 | 0.891 | 1.350 | 0.579 | 1.166 | -2.482 | 1.816 | 1.569 | |
| Std. Error of Skewness | 0.580 | 0.616 | 0.580 | 0.616 | 0.616 | 0.687 | 0.580 | 0.616 | 0.580 | 0.616 | 0.580 | 0.616 | 0.616 | 0.580 | 0.616 | |
| Kurtosis | 4.018 | 4.025 | 0.941 | 1.203 | 4.606 | 6.928 | -0.819 | -0.314 | 1.664 | 4.250 | 1.153 | 0.538 | 7.979 | 2.487 | 1.417 | |
| Std. Error of Kurtosis | 1.121 | 1.191 | 1.121 | 1.191 | 1.191 | 1.334 | 1.121 | 1.191 | 1.121 | 1.191 | 1.121 | 1.191 | 1.191 | 1.121 | 1.191 | |
| Range | 12416 | 13218 | 7.05 | 6.93 | 266 | 542 | 15.88 | 22.46 | 12.98 | 13.89 | 10.06 | 16.09 | 23.98 | 870077 | 936659 | |
| Minimum | 36 | 36 | 3.08 | 3.17 | 16 | 21 | 8.45 | 10.86 | 3.98 | 4.79 | 2.59 | 4.82 | -15.99 | 3729 | 3206 | |
| Maximum | 12452 | 13254 | 10.13 | 10.10 | 282 | 563 | 24.33 | 33.32 | 16.96 | 18.68 | 12.65 | 20.91 | 7.99 | 873806 | 939865 | |
| Sum | 40217 | 37265 | 93.73 | 81.97 | 1062 | 1198 | 243.55 | 258.49 | 133.21 | 128.44 | 110.32 | 130.06 | 16.37 | 2925525 | 2959909 | |
| Percentiles | 25 | 835.00 | 740.50 | 4.6400 | 5.1500 | 28.00 | 34.00 | 12.2200 | 14.2100 | 6.1700 | 8.6900 | 6.0500 | 5.8100 | 0.5950 | 33534.00 | 35144.50 |
| 50 | 990.00 | 1150.00 | 6.0200 | 6.3400 | 78.00 | 52.00 | 16.1300 | 18.9500 | 8.7600 | 9.5400 | 6.9100 | 9.6000 | 1.8100 | 72128.00 | 63500.00 | |
| 75 | 4724.00 | 4152.00 | 6.7700 | 7.1950 | 107.00 | 127.75 | 19.2200 | 24.8800 | 10.5100 | 11.1150 | 8.2700 | 12.6000 | 4.1400 | 243577.00 | 386082.00 | |
| I17.2021 | I17.2022 | I18.2021 | I18.2022 | I19.2021 | I19.2022 | I20.2021 | I20.2022 | I21.2021 | I21.2022 | I22.2021 | I22.2022 | |||||
| Mean | 7398.21 | 9432.33 | 3.7593 | 3.6733 | 5136.07 | 7243.23 | 8962.64 | 9655.75 | 6307.38 | 6747.46 | 2.8200 | 3.7092 | ||||
| Std. Error of Mean | 3121.949 | 4027.219 | 0.33484 | 0.45512 | 2281.184 | 3152.118 | 3170.816 | 3895.591 | 2499.732 | 2664.882 | 0.31053 | 0.54240 | ||||
| Median | 2653.50 | 2935.00 | 3.7600 | 3.7400 | 2650.50 | 2253.00 | 3295.00 | 2677.00 | 2320.00 | 2567.00 | 3.0050 | 3.6300 | ||||
| Mode | 1193 | 59a | 1.49a | 4.31 | 122a | 56a | 111a | 102a | 60a | 79a | .85a | 1.62a | ||||
| Std. Deviation | 11681.263 | 13950.695 | 1.25284 | 1.57657 | 8535.411 | 11365.125 | 11864.107 | 13494.723 | 9012.913 | 9608.368 | 1.16190 | 1.95566 | ||||
| Skewness | 2.560 | 1.715 | 0.063 | 0.647 | 2.872 | 2.531 | 1.486 | 1.456 | 1.921 | 1.804 | -0.197 | 0.939 | ||||
| Std. Error of Skewness | 0.597 | 0.637 | 0.597 | 0.637 | 0.597 | 0.616 | 0.597 | 0.637 | 0.616 | 0.616 | 0.597 | 0.616 | ||||
| Kurtosis | 7.024 | 1.637 | -0.059 | 0.142 | 8.467 | 6.497 | 0.754 | 0.572 | 3.124 | 2.384 | -0.753 | 0.328 | ||||
| Std. Error of Kurtosis | 1.154 | 1.232 | 1.154 | 1.232 | 1.154 | 1.191 | 1.154 | 1.232 | 1.191 | 1.191 | 1.154 | 1.191 | ||||
| Range | 43011 | 40464 | 4.71 | 5.16 | 31900 | 40414 | 35386 | 38701 | 29835 | 30823 | 3.84 | 6.34 | ||||
| Minimum | 85 | 59 | 1.49 | 1.73 | 122 | 56 | 111 | 102 | 60 | 79 | 0.85 | 1.62 | ||||
| Maximum | 43096 | 40523 | 6.20 | 6.89 | 32022 | 40470 | 35497 | 38803 | 29895 | 30902 | 4.69 | 7.96 | ||||
| Sum | 103575 | 113188 | 52.63 | 44.08 | 71905 | 94162 | 125477 | 115869 | 81996 | 87717 | 39.48 | 48.22 | ||||
| Percentiles | 25 | 1193.00 | 1445.50 | 2.9100 | 2.1050 | 1087.00 | 1511.50 | 1547.75 | 1626.75 | 1200.00 | 1281.00 | 2.0475 | 1.9400 | |||
| 50 | 2653.50 | 2935.00 | 3.7600 | 3.7400 | 2650.50 | 2253.00 | 3295.00 | 2677.00 | 2320.00 | 2567.00 | 3.0050 | 3.6300 | ||||
| 75 | 9720.25 | 14545.50 | 4.8775 | 4.3100 | 3510.75 | 7089.00 | 15439.50 | 22016.50 | 10000.00 | 10601.00 | 3.7575 | 4.7550 | ||||
| I23.2021 | I23.2022 | I24.2021 | I24.2022 | I25.2021 | I25.2022 | I26.2021 | I26.2022 | I27.2021 | I27.2022 | I28.2021 | I28.2022 | |||||
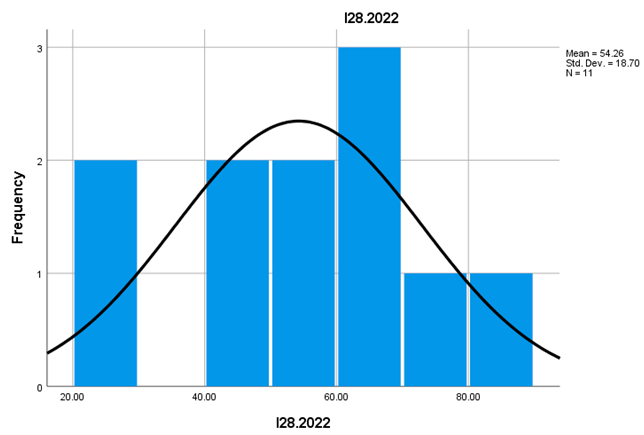
| Mean | 4.6693 | 4.5133 | 37.0315 | 37.5200 | 153193.73 | 183170.69 | 4480.15 | 6512.55 | 2709.58 | 3806.92 | 49.8177 | 54.2636 | ||||
| Std. Error of Mean | 0.34375 | 0.34614 | 6.93524 | 5.70450 | 53674.486 | 68720.149 | 2245.990 | 3076.317 | 1491.393 | 1839.800 | 6.36311 | 5.63827 | ||||
| Median | 4.8100 | 4.3750 | 30.0400 | 32.1000 | 53152.00 | 56354.00 | 1090.00 | 1954.00 | 1045.50 | 897.50 | 51.2000 | 55.0200 | ||||
| Mode | 2.17a | 2.40a | 4.92a | 14.38a | 3318a | 2875a | 70a | 29a | 79a | 29a | 15.83a | 20.44a | ||||
| Std. Deviation | 1.28621 | 1.19907 | 25.00538 | 19.76098 | 207880.389 | 247774.022 | 8098.031 | 10202.990 | 5166.335 | 6373.255 | 22.94253 | 18.70004 | ||||
| Skewness | -0.131 | 0.106 | 0.507 | 1.138 | 1.976 | 1.687 | 2.480 | 1.687 | 2.993 | 2.457 | -0.210 | -0.682 | ||||
| Std. Error of Skewness | 0.597 | 0.637 | 0.616 | 0.637 | 0.580 | 0.616 | 0.616 | 0.661 | 0.637 | 0.637 | 0.616 | 0.661 | ||||
| Kurtosis | 0.020 | -0.260 | -0.918 | 0.795 | 3.688 | 2.253 | 6.276 | 1.424 | 9.351 | 6.309 | -1.496 | -0.035 | ||||
| Std. Error of Kurtosis | 1.154 | 1.232 | 1.191 | 1.232 | 1.121 | 1.191 | 1.191 | 1.279 | 1.232 | 1.232 | 1.191 | 1.279 | ||||
| Range | 4.81 | 4.08 | 80.08 | 66.71 | 732914 | 802380 | 27996 | 27861 | 18296 | 21820 | 66.52 | 60.39 | ||||
| Minimum | 2.17 | 2.40 | 4.92 | 14.38 | 3318 | 2875 | 70 | 29 | 79 | 29 | 15.83 | 20.44 | ||||
| Maximum | 6.98 | 6.48 | 85.00 | 81.09 | 736232 | 805255 | 28066 | 27890 | 18375 | 21849 | 82.35 | 80.83 | ||||
| Sum | 65.37 | 54.16 | 481.41 | 450.24 | 2297906 | 2381219 | 58242 | 71638 | 32515 | 45683 | 647.63 | 596.90 | ||||
| Percentiles | 25 | 3.8600 | 3.7725 | 14.5400 | 22.9900 | 23390.00 | 24652.00 | 321.00 | 318.00 | 269.50 | 241.75 | 27.5100 | 49.1000 | |||
| 50 | 4.8100 | 4.3750 | 30.0400 | 32.1000 | 53152.00 | 56354.00 | 1090.00 | 1954.00 | 1045.50 | 897.50 | 51.2000 | 55.0200 | ||||
| 75 | 5.6350 | 5.3825 | 59.5350 | 49.4500 | 202788.00 | 323533.00 | 5101.50 | 9677.00 | 1969.75 | 4737.25 | 68.8600 | 69.7700 | ||||
a. Multiple modes exist. The smallest value is shown.
Results
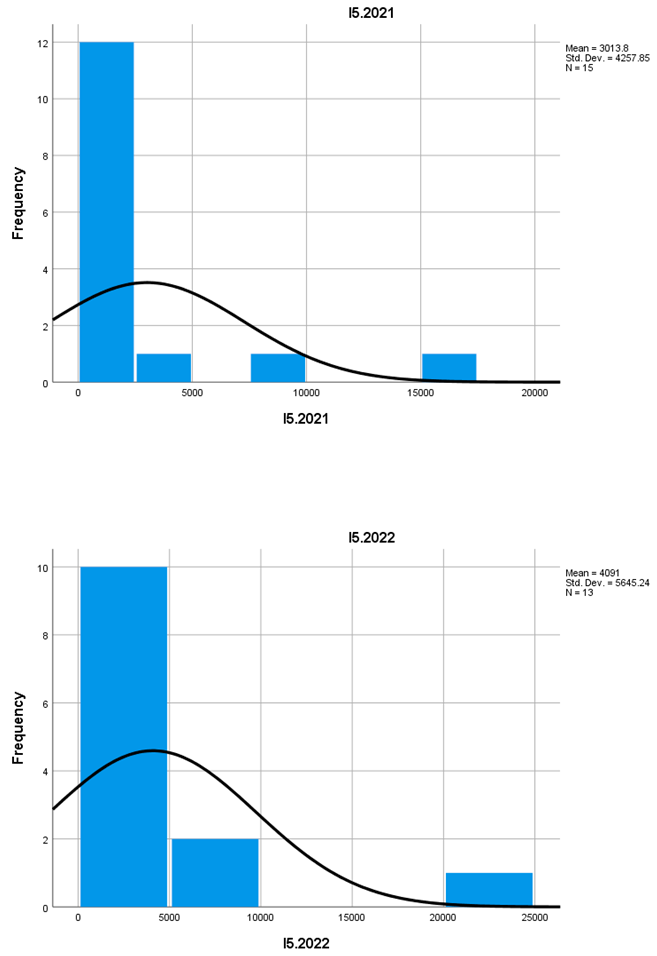
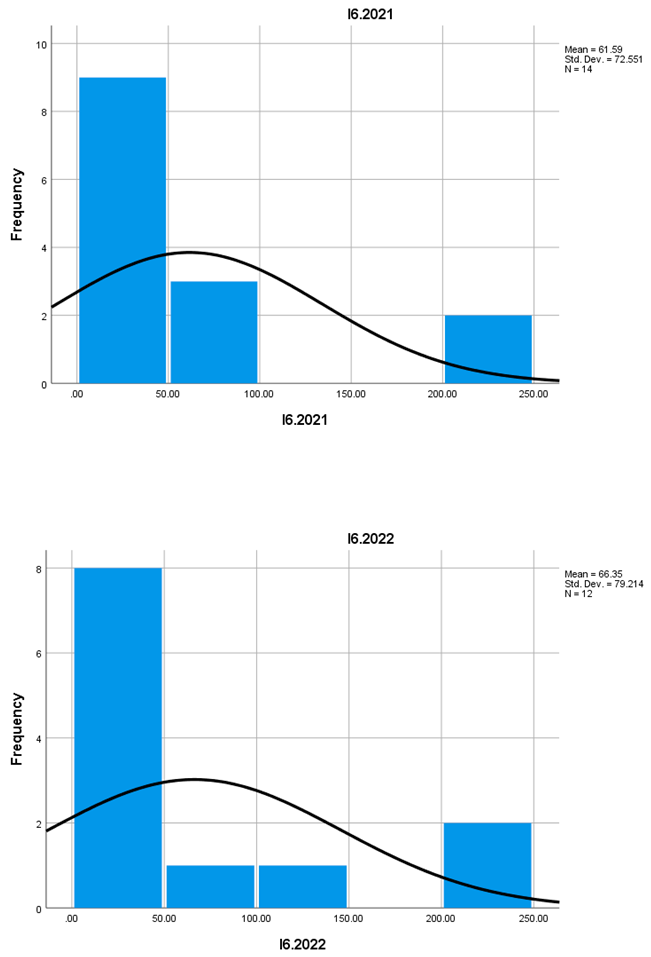
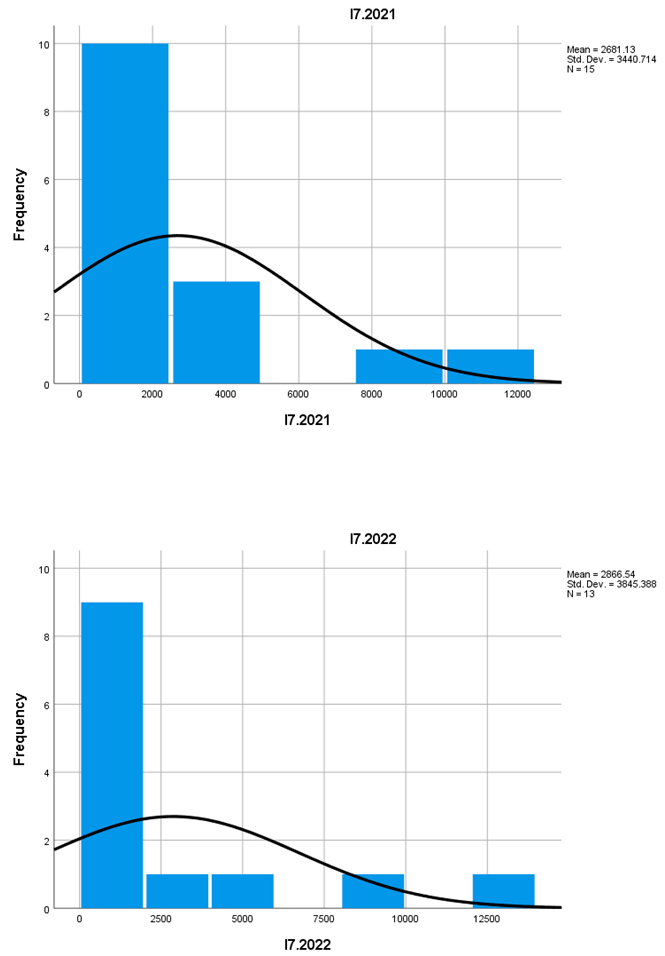
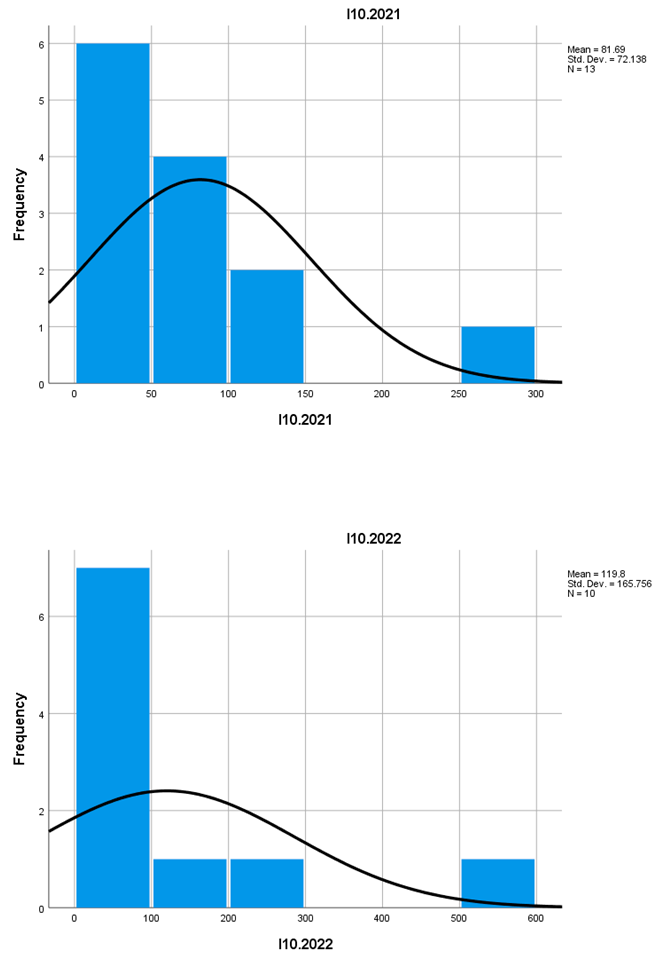
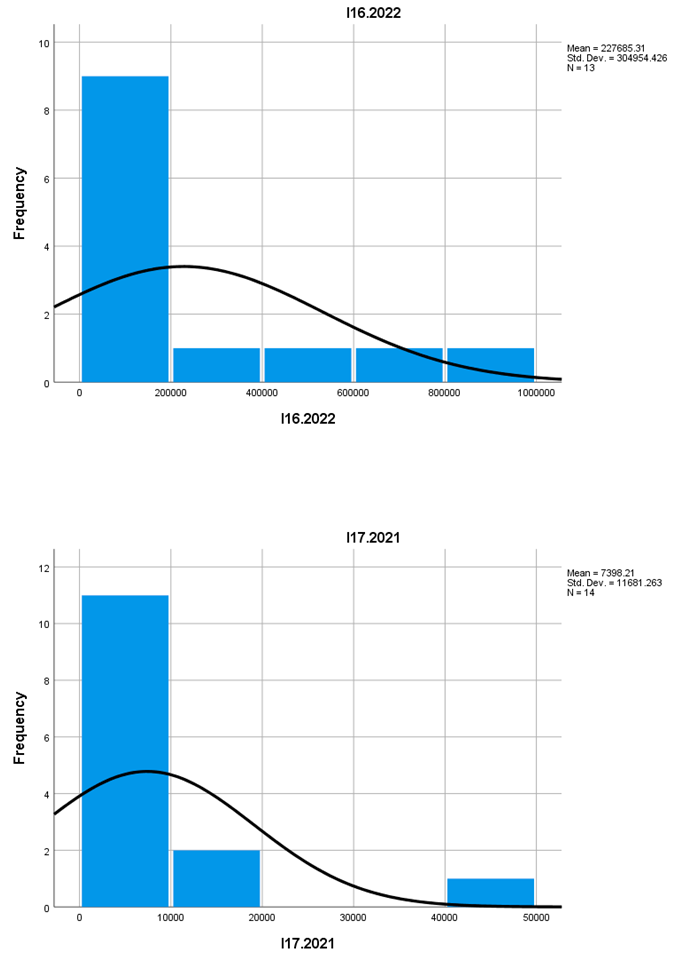
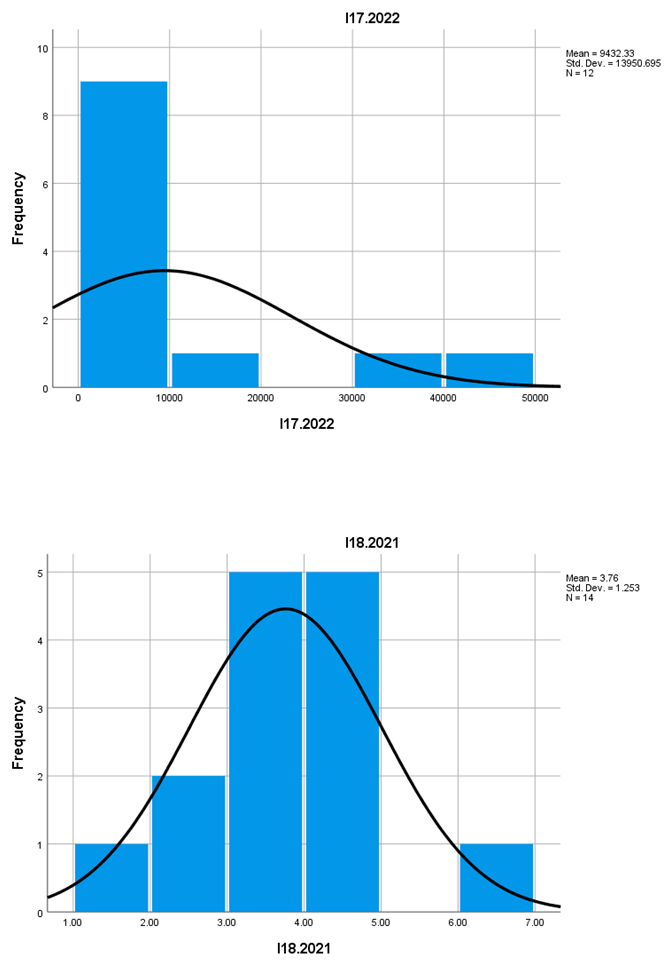
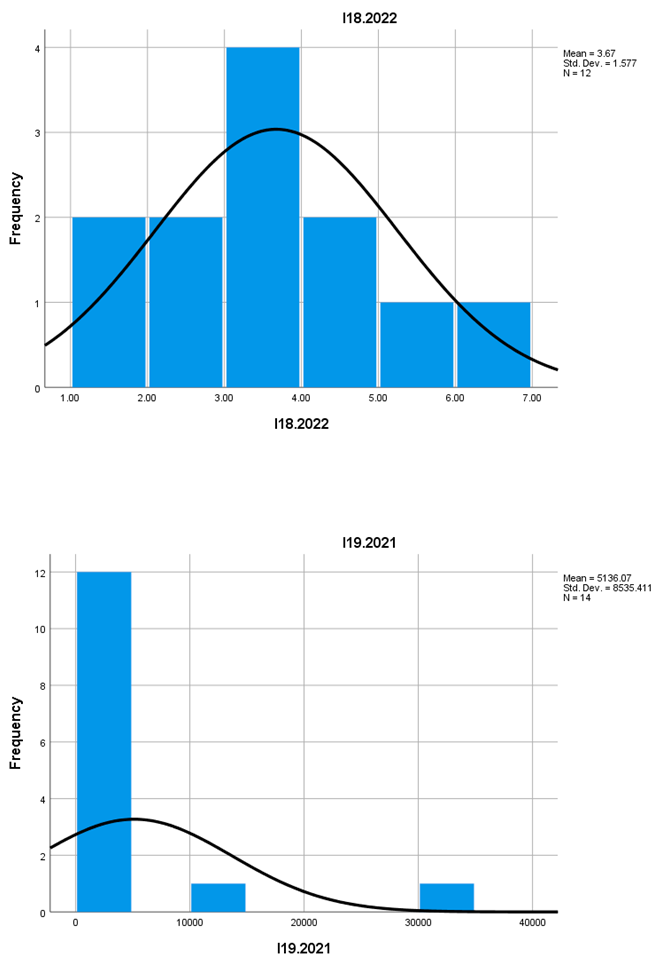
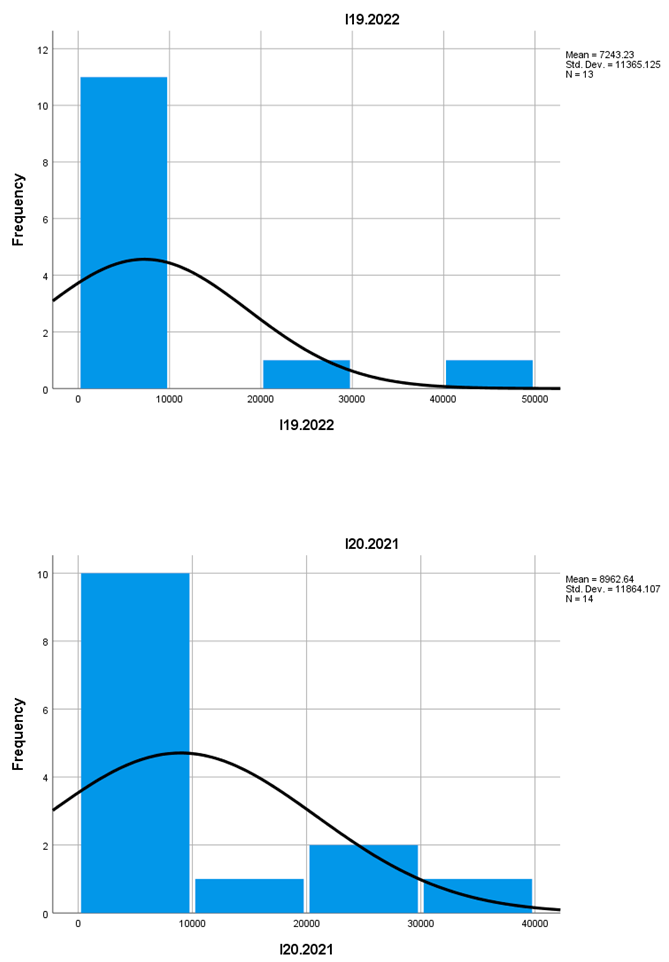
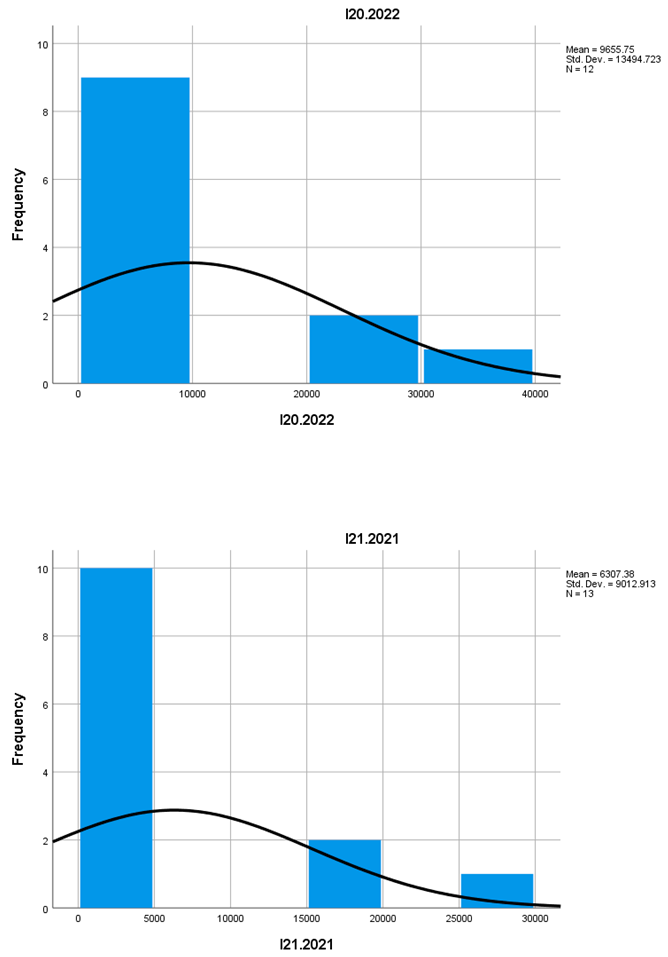
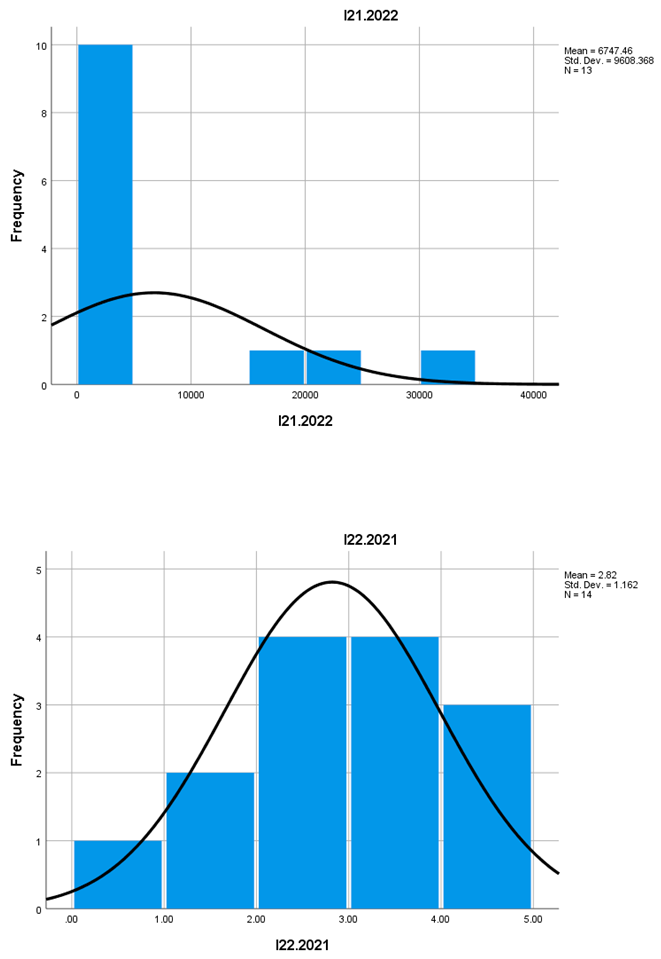
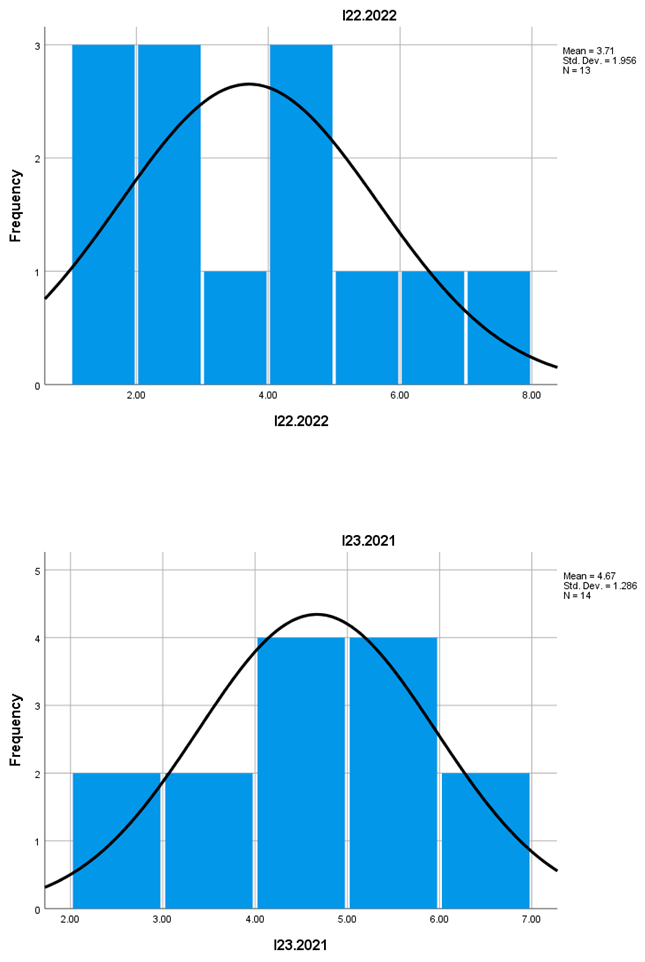
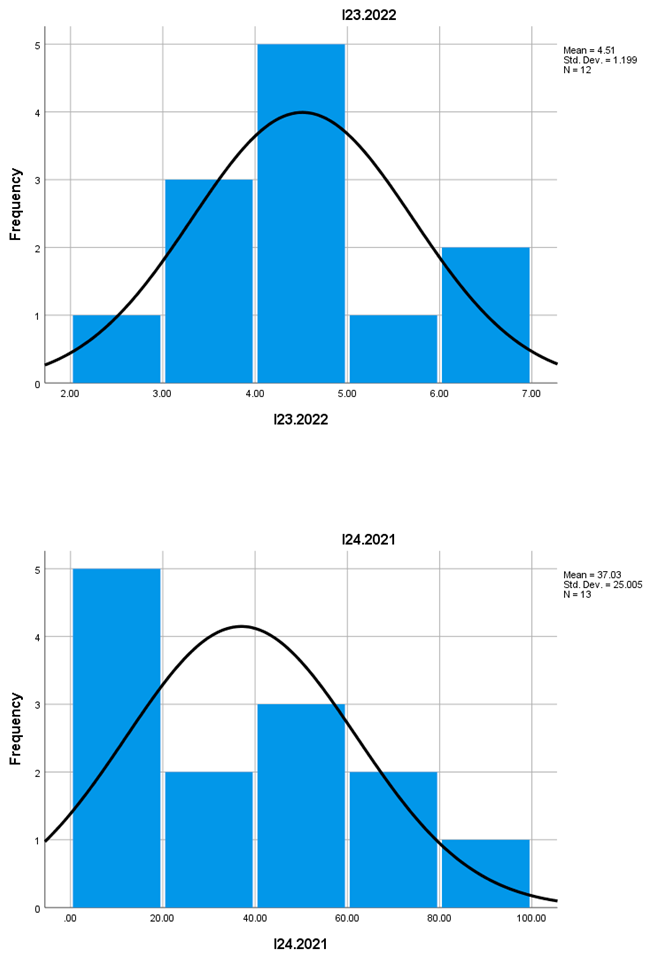
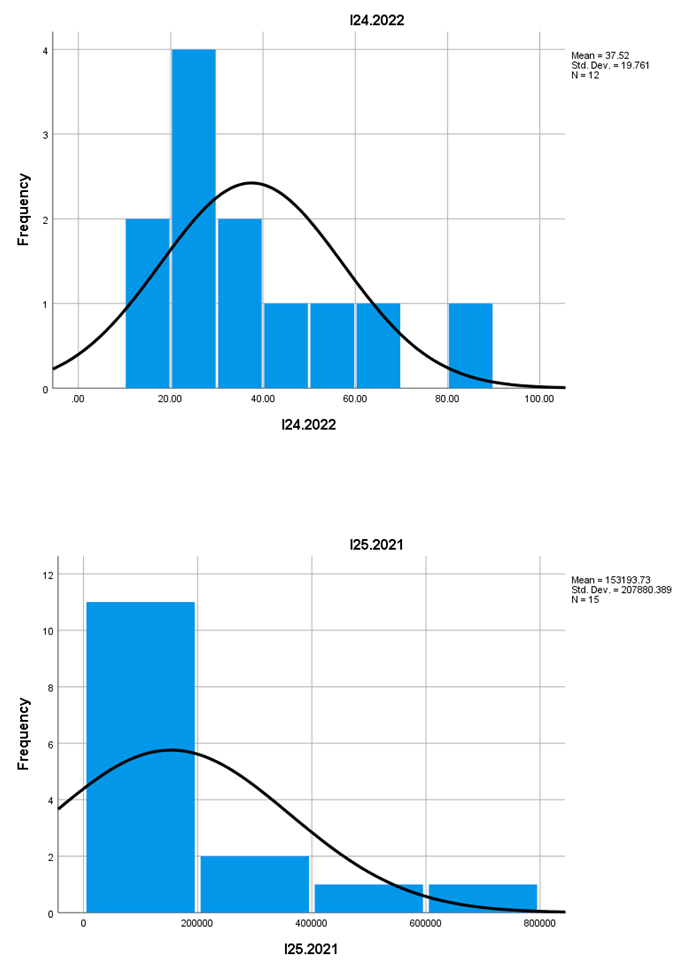
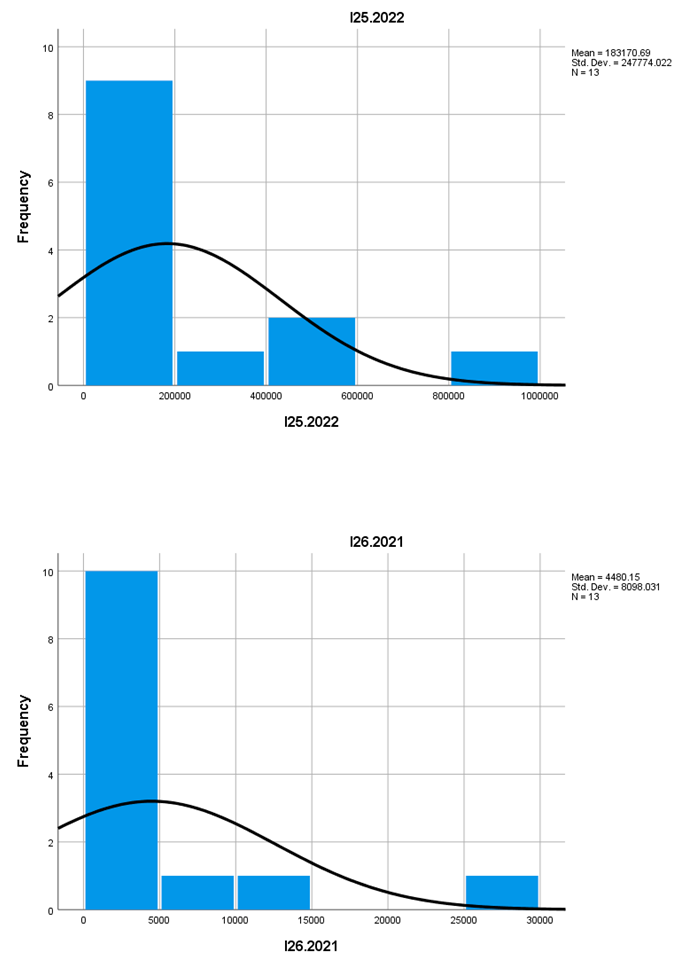
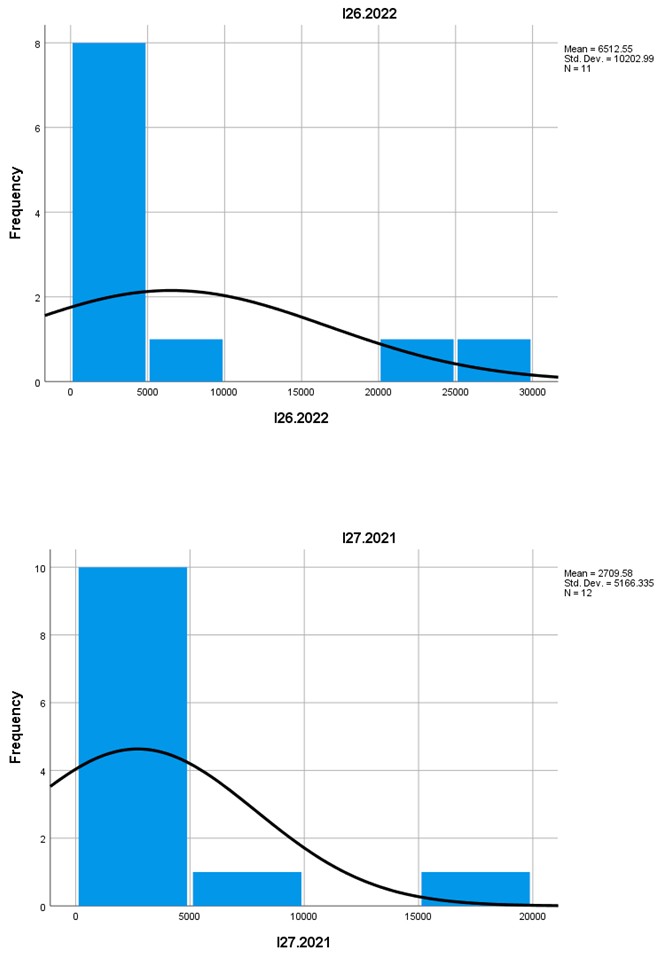
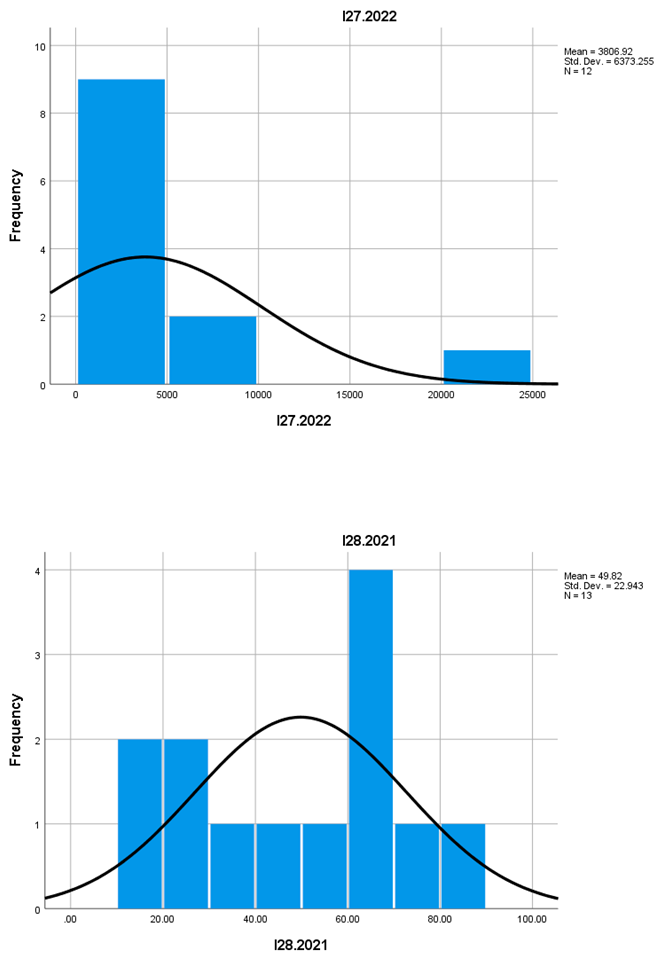
Following the analysis of the histograms generated based on Eurostat data, significant trends have been identified in the evolution of the economic and social indicators of mountain entrepreneurship in the food and tourism sectors (see histograms below).
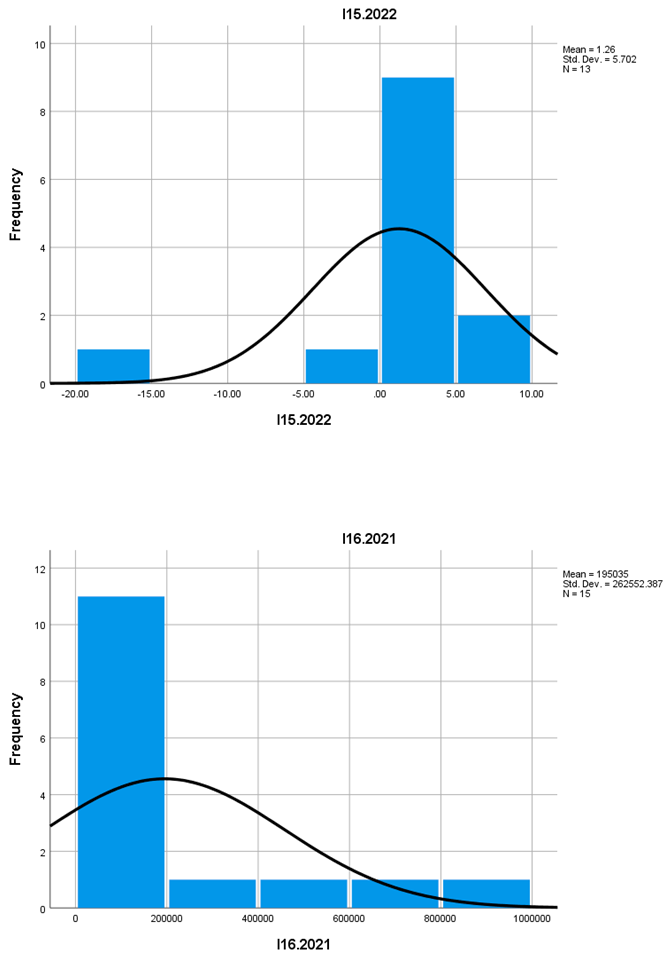
The majority of indicators—namely I1, I2, I5, I6, I7, I10, I16, I17, I19, I20, I21, I25, I26, and I27—exhibit left-skewed distributions, suggesting a decreasing trend in their values over time. This pattern indicates a progressive decline in the number of mountain enterprises within the studied sectors, accompanied by a reduction in the rate of new business formation and a decrease in employability and workforce absorption in mountainous regions.
These trends reflect structural and economic pressures that impact the sustainability of entrepreneurship in these areas.
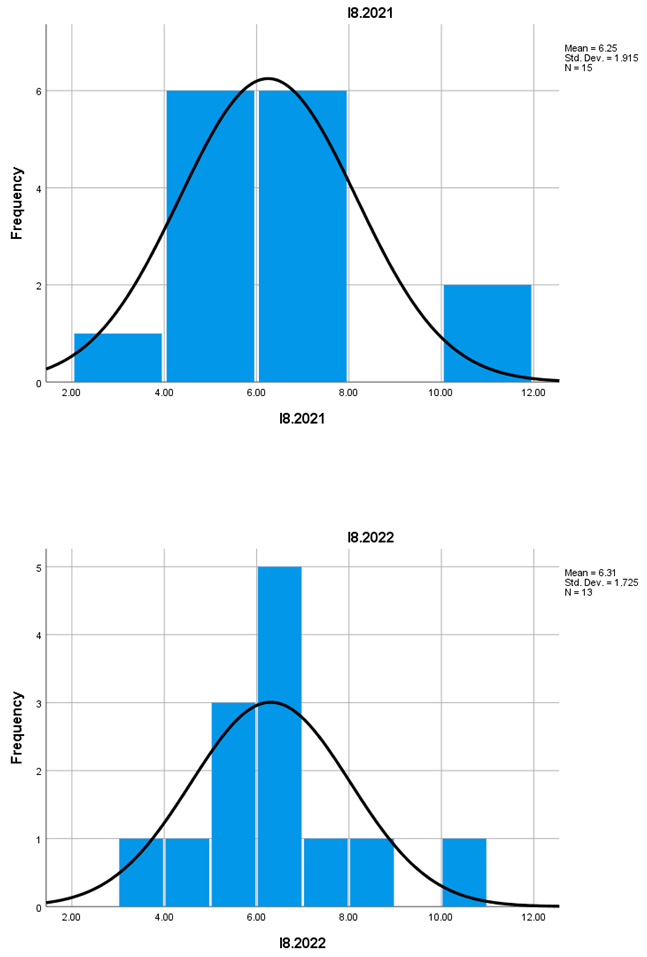
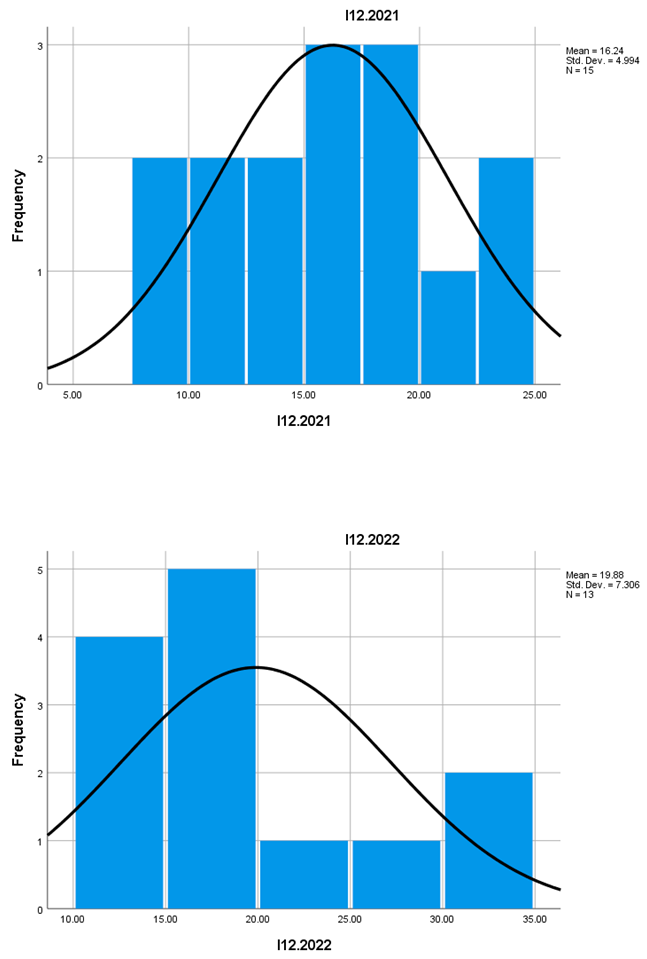
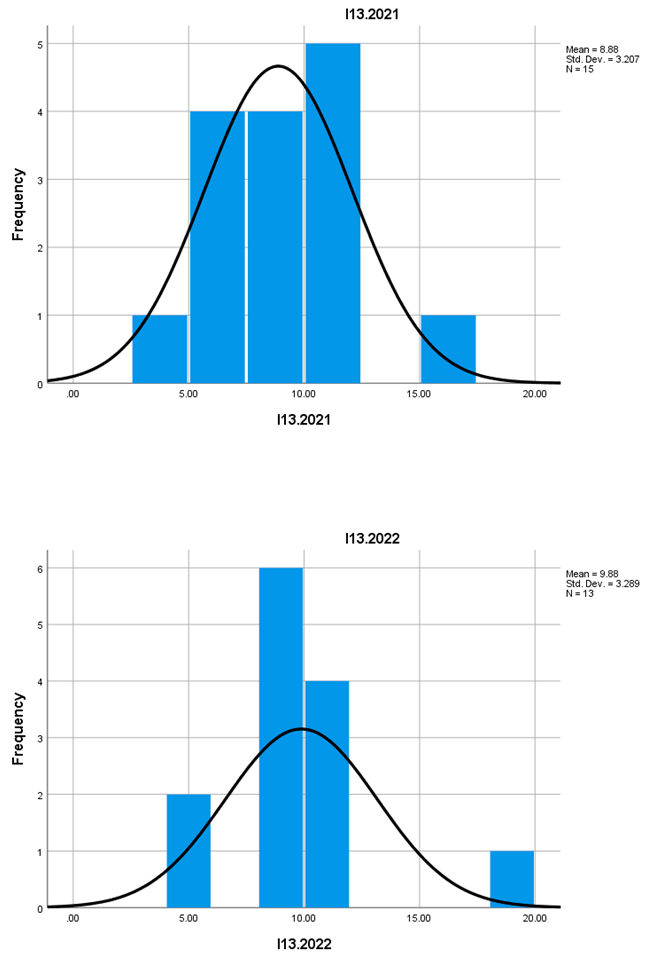
Conversely, a group of indicators—namely I3, I8, I12, I13, I14, I18, I22, I23, I24, and I28—display Gaussian distributions, characterized by the presence of an equilibrium point or a local maximum/minimum.
The Gaussian shape of these distributions suggests a relative stability around central values, indicating that while the number of mountain enterprises is declining, the overall state of entrepreneurship in these sectors remains positive.
This trend may result from the intrinsic development of existing businesses, as well as from increased turnover, which partially offsets the numerical decline of enterprises.
A distinct pattern is observed in indicator I15, which exhibits a right-skewed distribution. This configuration indicates a growing trend in the indicator's values as the independent variable increases, suggesting an exponential or rational growth pattern.
In the context of mountain entrepreneurship, this rightward orientation reflects a net increase in economic activity within the studied sectors, potentially driven by favorable external factors or business-stimulating policies implemented in mountain areas.
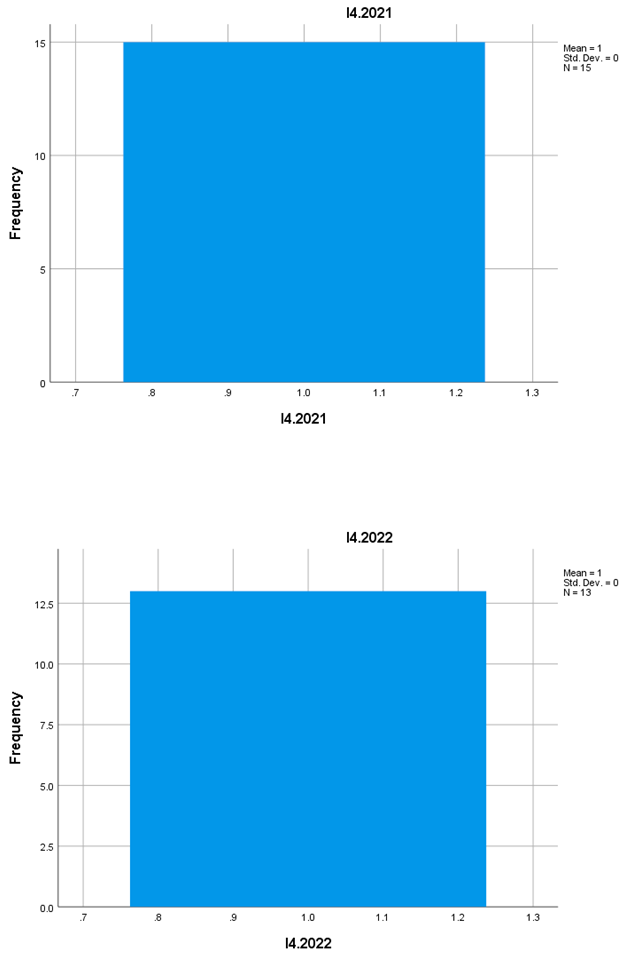
Regarding indicator I4, it stands out due to its specificity, measuring the employability rate within discontinued enterprises. The indicator highlights a constant level of unemployment in mountain areas, reflecting a persistent structural issue despite the changes observed in other indicators.
This stability suggests that while certain aspects of the mountain economy may experience improvements, workforce employment remains a significant challenge, necessitating targeted interventions to stimulate job creation and reduce unemployment.
The analysis of all histograms reveals a diversity of trends in the evolution of mountain entrepreneurship. While some indicators reflect a decline in the number of enterprises and employability, others indicate stability or even growth in economic activity.
These results underscore the necessity for differentiated policies that consider regional specificities and the diverse dynamics of economic and social indicators.
Concluzii
European mountain entrepreneurship in the food and tourism sectors is characterized by stability and sustainability, exerting a beneficial impact on both mountain and non-mountain businesses.
The results indicate positive developments in certain indicators, despite their negative influence on the business environment in the food and tourism sectors within mountainous regions.
The number of active enterprises is declining, accompanied by a reduction in the rate of new business formation.
The intensity of economic activity in the mountain sector is increasing, along with employment levels and workforce absorption.
Mountain food and tourism sectors maintain their sustainability through intrinsic rather than extrinsic growth, reflecting an internal adaptation to economic and structural challenges.

References
- Bonadonna, A.; Duglio, S.; Bollani, L.; Peira, G. Mountain Food Products: A Cluster Analysis Based on Young Consumers’ Perceptions. Sustainability 2022, 14, 12511. [Google Scholar] [CrossRef]
- Colasante, A.; D'Adamo, I.; Massis, A. De; Italiano, S. An exploratory study of stakeholder views on the sustainable development of mountain tourism. Sustainable Development 2024, 32, 3722–3735. [Google Scholar] [CrossRef]
- Duglio, S.; Bonadonna, A.; Letey, M. The contribution of local food products in fostering tourism for marginal mountain areas: An exploratory study on Northwestern Italian Alps. Mountain Research and Development 2022, 42, R1–R10. [Google Scholar] [CrossRef]
- Eurostat. Business demography and high growth enterprises by NACE Rev. 2 activity and other typologies [urt_bd_hgn__custom_15325082]. 2025. [Google Scholar]
- Ortiz-Miranda, D.; Moreno-Pérez, O.; Arnalte-Mur, L.; Cerrada-Serra, P.; Martinez-Gomez, V.; Adolph, B.; Yeboah, R. The future of small farms and small food businesses as actors in regional food security: A participatory scenario analysis from Europe and Africa. Journal of Rural Studies 2022, 95, 326–335. [Google Scholar] [CrossRef]
- Tuitjer, G. Growing beyond the niche? How machines link production and networking practices of small rural food businesses. Entrepreneurship & Regional Development 2022, 34, 471–485. [Google Scholar]
- Staffolani, G.; Bentivoglio, D.; Finco, A. Consumers’ purchasing determinants towards mountain food products. Sustainability 2022, 14, 8282. [Google Scholar] [CrossRef]
- Vidal-Matzanke, A.; Vidal-González, P. Hiking accommodation provision in the mountain areas of Valencia Region, Spain: a tool for combating the depopulation of rural areas. Journal of Sport & Tourism 2022, 26, 165–184. [Google Scholar]
Disclaimer/Publisher’s Note: The statements, opinions and data contained in all publications are solely those of the individual author(s) and contributor(s) and not of MDPI and/or the editor(s). MDPI and/or the editor(s) disclaim responsibility for any injury to people or property resulting from any ideas, methods, instructions or products referred to in the content. |
© 2025 by the authors. Licensee MDPI, Basel, Switzerland. This article is an open access article distributed under the terms and conditions of the Creative Commons Attribution (CC BY) license (http://creativecommons.org/licenses/by/4.0/).
Copyright: This open access article is published under a Creative Commons CC BY 4.0 license, which permit the free download, distribution, and reuse, provided that the author and preprint are cited in any reuse.


