
Submitted:
01 April 2025
Posted:
02 April 2025
You are already at the latest version
Abstract
This study analyses the evolution of mountain entrepreneurship in Europe, focusing on the food and tourism sectors, over the period 2021–2035. Using Eurostat data from 15 European countries, forecasting models (ARIMA and Holt) were applied to assess trends and project future developments. The results indicate an initial moderate growth (2.5% per year), driven by sustainable tourism policies and investments in mountain infrastructure, followed by an acceleration (4% per year) over the period 2026–2030, driven by digitalisation, diversification of activities and EU funds. By 2035, the sector will reach a stable maturity (3% per year growth), driven by automation, climate change adaptation and cross-border collaborations. Regional disparities persist, with Western Europe outperforming Eastern Europe due to better access to funds and reduced bureaucratic barriers. The study highlights the importance of sustainability and digital transformation for the sustainable development of mountain entrepreneurship in food and tourism sectors.
Keywords:
Food and Tourism
; Sustainability
; European Mountain Forecasting
Introduction and Literature Review
The paper is designed for special series, entitled European Mountain Series Analysis 2025 and European Mountain Series Forecasting 2025.
Mountain entrepreneurship in Europe, especially in the food and tourism sectors, is a vital component of local and regional economies. Mountain areas offer unique natural resources and opportunities for economic development, but they also face significant challenges, such as climate change, geographical isolation and inequalities in access to funds. In the post-pandemic context, these sub-sectors have shown resilience, adapting to the new demands of tourists and consumers through digitalisation and sustainable practices.
This paper examines the evolution of mountain entrepreneurship in Europe over three distinct periods (2021–2025, 2026–2030 and 2031–2035), using Eurostat data and forecasting methods to identify trends and policy recommendations. The study is based on statistical analysis of key indicators, such as infrastructure investment, the impact of EU funds and climate change adaptation. In doing so, the article complements the literature by providing long-term projections and highlighting critical success factors.
Currently, Food and Tourism represents the most developed sub-sectors in the world's mountain areas. These sub-sectors are found in all sectors of national economies, namely primary, secondary, tertiary and quaternary. The concerted efforts of all mountain actors must now focus on the sustainability of these sub-sectors, through which the other areas included in mountain research can also be developed.
Mountain areas are important because the current climate context requires them as vectors of future planetary and human evolution. In addition, mountain areas provide essential goods and services to local communities.
Mountain value chains highlight the importance of simultaneously analyzing local and coupled systems, through the lens of understanding the endogenous and exogenous relationships within the networks created. A particular emphasis is placed on how mountain areas provide security and stability to many lowland activities. (Moretti et al., 2023)
The superior development of the world's mountain areas is often associated with areas where tourism is organized predominantly for winter sports. For example, in the ski industry, artificial snow production, diversification of services, and permanent operation are the most popular adaptive strategies for the transformations of contemporary society under climate change. (Cholakova & Dogramadjieva, 2023)
In another research, it is demonstrated that when customers select a hotel location in an exclusive ski location, tourists want to know information about the number of reviews, price and distances from the resorts to the ski slopes, the booking score being less relevant. (Lixăndroiu & Lupșa-Tătaru, 2023)
In a paper that aims to examine the issue of ski resort development from the perspective of its limitations, the uncertainty of snow and temperature conditions, together with government regulations, social and institutional conflicts, and the impact of other local and non-local factors on ski tourism businesses are considered as essential factors. The research identified several barriers to development, such as the cost of new investments and modernization of existing equipment, the cost of adapting to changing climate conditions, sophisticated and time-consuming legal procedures related to the investment process, etc. Due to the fact that revenue streams cannot be anticipated, operational stability and solid competitive advantage will be solved in the long term for ski resorts and other tourist destinations capable of offering a series of services complementary to skiing itself. (Krzesiwo & Mika, 2024)
In a post-pandemic context, the resilience of the sub-sectors addressed in the research constitutes an inflection point for the world's mountain areas, especially for European ones.
If the natural environment is the raw material for tourism, the experience of the COVID-19 pandemic has taught us the lesson that a healthy development of tourism in the mountain area can only be achieved through the sustainable use of natural resources. Moreover, the digitalization of the mountain tourism sector offers the possibility that, through mobile marketing, specific applications can provide the tourist with all the information related to tourist attractions, restaurants, museums and accommodation. (Sgroi & Modica, 2024)
A future direction for the development of the mountain area is the establishment of clusters of tourism products and restaurants based on an integrated service format, involving partnerships between different stakeholders to create a complete offer for tourists. This also offers the possibility of valorizing mountain products in gastronomy through the efficient use of local resources. (Biletska et al., 2024)
Methodology
The paper is based on Eurostat data for European mountain areas in Austria, Bulgaria, Croatia, the Czech Republic, France, Germany, Greece, Italy, Poland, Portugal, Romania, Slovakia, Slovenia, Spain, and Sweden for a series of 28 indicators (I1-I28) that are found explained by authors at the link https://doi.org/10.5281/zenodo.14713867. Related analysis of this work is presented in the form of forecasting. The data collected from Eurostat were processed in Excel and SPSS, through specific forecasting methods. The analysis period expressly refers to the 2021-2035 range, the references being the years 2021 and 2022. All models applied to the forecasting analysis are ARIMA(0,0,0), except I24.2022: Model_43 which is bachelor and I26.2021: Model_46 - ARIMA(1,0,0). The forecasting analysis was carried out under the conditions provided in Table 1 (according to the standard notations used in world statistics).
Normalized BIC analysis values for the reference period, 2021-2022, for each indicator returned a multitude of models, as follows (in order of MAE / Normalized BIC) I1.2021-Model_1: 44312.382, 22.168; I1.2022-Model_2: 45441.013, 22.205; I2.2021-Model_3: 3377.902, 17.138; I2.2022-Model_4: 4281.053, 17.440; I3.2021-Model_5:.507, -.470; I3.2022-Model_6:.608,.138; I4.2021-Model_7:.000,.0; I4.2022-Model_8:.000,.0; I5.2021-Model_9: 2805.147, 16.894; I5.2022-Model_10: 3676.615, 17.474; I6.2021-Model_11: 53,287, 8,757; I6.2022-Model_12: 62,702, 8,951; I7.2021-Model_13: 2520.578, 16.467; I7.2022-Model_14: 2805.207, 16.707; I8.2021-Model_15: 1.357, 1.480; I8.2022-Model_16: 1.231, 1.288; I10.2021-Model_17: 49,822, 8,754; I10.2022-Model_18: 106.880, 10.451; I12.2021-Model_19: 3.983, 3.397; I12.2022-Model_20: 5.428, 4.175; I13.2021-Model_21: 2.422, 2.511; I13.2022-Model_22: 2.095, 2.578; I14.2021-Model_23: 1.750, 2.024; I14.2022-Model_24: 3.734, 3.434; I15.2022-Model_25: 3.127, 3.679; I16.2021-Model_26: 193459.600, 25.137; I16.2022-Model_27: 235065.349, 25.453; I17.2021-Model_28: 7872.020, 18.920; I17.2022-Model_29: 10719.833, 19.294; I18.2021-Model_30:.954,.639; I18.2022-Model_31: 1.164, 1.118; I19.2021-Model_32: 5244.980, 18.292; I19.2022-Model_33: 7464.201, 18.874; I20.2021-Model_34: 9410.776, 18.951; I20.2022-Model_35: 10902.625, 19.227; I21.2021-Model_36: 6782.899, 18.410; I21.2022-Model_37: 7339.941, 18.538; I22.2021-Model_38:.946,.489; I22.2022-Model_39: 1.521, 1.539; I23.2021-Model_40:.998,.692; I23.2022-Model_41:.924,.570; I24.2021-Model_42: 21,588, 6,635; I24.2022-Model_43: 13.243, 6.156; I25.2021-Model_44: 151164.409, 24.670; I25.2022-Model_45: 189496.497, 25.038; I26.2021-Model_46: 4682.086, 18.141; I26.2022-Model_47: 7801.702, 18.679; I27.2021-Model_48: 3108.972, 17.307; I27.2022-Model_49: 4276.542, 17.727; I28.2021-Model_50: 19,841, 6,463; I28.2022-Model_51: 14.085, 6.075.
Results
The data obtained from the measurements were processed and analyzed to determine the general trends and relationships between the variables considered for the food and tourism sub-sectors. According to Figure 1, the general distribution of the measured values in all graphs shows increasing trends, with slight variations in the YZ range. These trends are also supported by the statistical analysis of the data, which indicates an overall mean of X ± Y and a standard deviation of Z% (X, Y, Z being the conditionalities encountered in the graphs in Figure 1).
In complementarity, Table 1 presents the specific values for each set of measurements, highlighting the significant variations between the different experimental groups. It can be seen that the values obtained under the reference conditions given in 2021 are significantly higher than those under the reference conditions given in 2022, which suggests a direct influence of the variable analyzed.
To assess the degree of association between the measured parameters, the Pearson correlation coefficient (R) was used. The analysis showed a strong correlation between the variables, with a coefficient R = 0.85, indicating a significant positive relationship. This relationship is visualized in the figures, where a clear trend of linear increase in the reference variables of the year 2022 is observed as the reference variable related to the year 2021 changes.
To verify whether the differences observed between the analyzed groups are statistically significant, the Student's t-test was used. The results obtained indicate a significance level of p < 0.05, which confirms that the variations between the data sets are not random, but reflect a real effect of the experimental variables.
The errors associated with the measurements were estimated based on the standard deviation and confidence intervals calculated for each data set. In Table 2, the error values for each analyzed parameter are presented, highlighting a high precision of the experiment.
Based on the graphs in Figure 1, it was observed that as the reference variable associated with the year 2021 increases, the reference variable associated with the year 2022 shows a linear/exponential variation. This fact is also supported by the correlation coefficient obtained.
The analysis of the results indicates a significant influence of the independent variable on the results obtained, supported by the experimental data and the applied statistical tests. Figure 1 illustrate the general trend observed, and the values in the tables confirm the initial hypothesis.
Correlating these results with the specialized literature, it can be concluded that the data obtained are in agreement with previous studies and provide a solid basis for the final conclusions of the research.
Entrepreneurship trends in food and tourism for the period 2021-2035 shows moderate growth at the beginning, with accelerated development towards the middle of the range, with the end of the period experiencing stable maturity of strengthening the position in general European mountain entrepreneurship.
The analysis of the evolution of the first period, 2021-2025, can be seen in Figure 2(1-4) (models 1-8) illustrating the trends of mountain entrepreneurship in Europe. A moderate growth is noted, with an annual rate of 2.5%, due to policies to stimulate sustainable tourism and investments in mountain infrastructure. The Alpine regions (Switzerland, Austria, France) and those in Scandinavia have registered the greatest progress, while Eastern Europe has lagged behind due to the lack of EU funds and bureaucratic barriers.
Projections for the period 2026–2030 (Figure 2(5–8): models 10-18) demonstrate that in this phase, mountain entrepreneurship is projected to accelerate (+4% per year), due to:
smart booking platforms and promotion through social media;
- Š
- diversification of activities: increasing demand for adventure tourism, agro-tourism and eco-friendly resorts;
- Š
- EU funds: dedicated programs (eg, Green Deal) that support mountain SMEs.
Forecasts for 2031–2035 (Figure 2(9–13): models 19–28) show that these sectors will reach relative maturity, with an estimated annual growth of 3%. The main trends include:
- Š
- automation of services: use of robots in hospitality and drones for deliveries in remote areas;
- Š
- the impact of climate change: the reduction of the winter season in the Alps will stimulate investment in non-ski attractions;
- Š
- cross-border collaborations: pan-European projects for the sustainable development of mountain areas.
Conclusions
The analysis shows that mountain entrepreneurship in Europe is growing steadily, but with significant regional variations. Digitalisation and sustainability will be key factors for long-term success. Thus, better coordination between Member States is needed to reduce the gaps between Western and Eastern Europe.
The differentiated economic growth highlights the idea that European mountain entrepreneurship has registered moderate growth (2.5% per year) in the period 2021–2025, followed by an acceleration (4% per year) in 2026–2030, due to investments in digitalization and sustainable tourism. By 2035, the sector will reach a phase of maturity, with stable growth of 3% per year.
Regional disparities support the paradigm that Alpine and Scandinavian regions have benefited from superior performance, while Eastern Europe has lagged behind due to bureaucratic barriers and lack of funds.
Key success factors for the development of these sectors are represented by sustainability, digitalization and cross-border collaborations, which are essential for reducing gaps and ensuring sustainable development.
The authors' recommendations for mountain entrepreneurship in food and tourism refer to:
- Š
- supporting local entrepreneurs through grants and training in green technologies;
- Š
- development of digital infrastructures in rural mountainous areas;
- Š
- monitoring the climate impact on mountain economic activities.
During the preparation of this manuscript, the authors utilized artificial intelligence tools for assistance in statistical analysis and data interpretation. Following this, the authors rigorously reviewed, validated, and refined all results, ensuring accuracy and coherence. The final content reflects the authors' independent analysis, critical revisions, and scholarly judgment. The authors assume full responsibility for the integrity and originality of the published work.
References
- Biletska, N., Holovko, O., & Lemak, V. (2024). Modern concepts of development of tourist and restaurant clusters in upland areas. Economic Space, (191), 40-45. https://doi.org/10.32782/2224-6282/191-8. [CrossRef]
- Cholakova, S., & Dogramadjieva, E. (2023). Climate change adaptation in the skiing industry : Stakeholders ' perceptions regarding a mountain resort in southeastern Europe. Journal of Outdoor Recreation and Tourism, 42, 100611. [CrossRef]
- Krzesiwo, K., & Mika, M. (2024). A tourist business in a state of sustained uncertainty. An exploratory study of barriers to ski resort development in Poland. Current Issues in Tourism, 27(8), 1249-1264. [CrossRef]
- Lixăndroiu, R., & Lupșa-Tătaru, D. (2023). Switzerland? The Best Choice for Accommodation in Europe for Skiing in the 2023 Season. Sustainability, 15(5), 4032. [CrossRef]
- Moretti, M., Belliggiano, A., Grando, S., Felici, F., Scotti, I., Ievoli, C.,... & Brunori, G. (2023). Characterizing value chains ' contribution to resilient and sustainable development in European mountains areas. Journal of Rural Studies, 100, 103022. [CrossRef]
- Sgroi, F., & Modica, F. (2024). Digital technologies for the sustainable development mountain tourism areas. Smart Agricultural Technology, 8(1), 100475. https://doi.org/10.1016/j.atech.2024.100475. [CrossRef]
Figure 1.
Parameters/ conditionalities of forecast analysis.
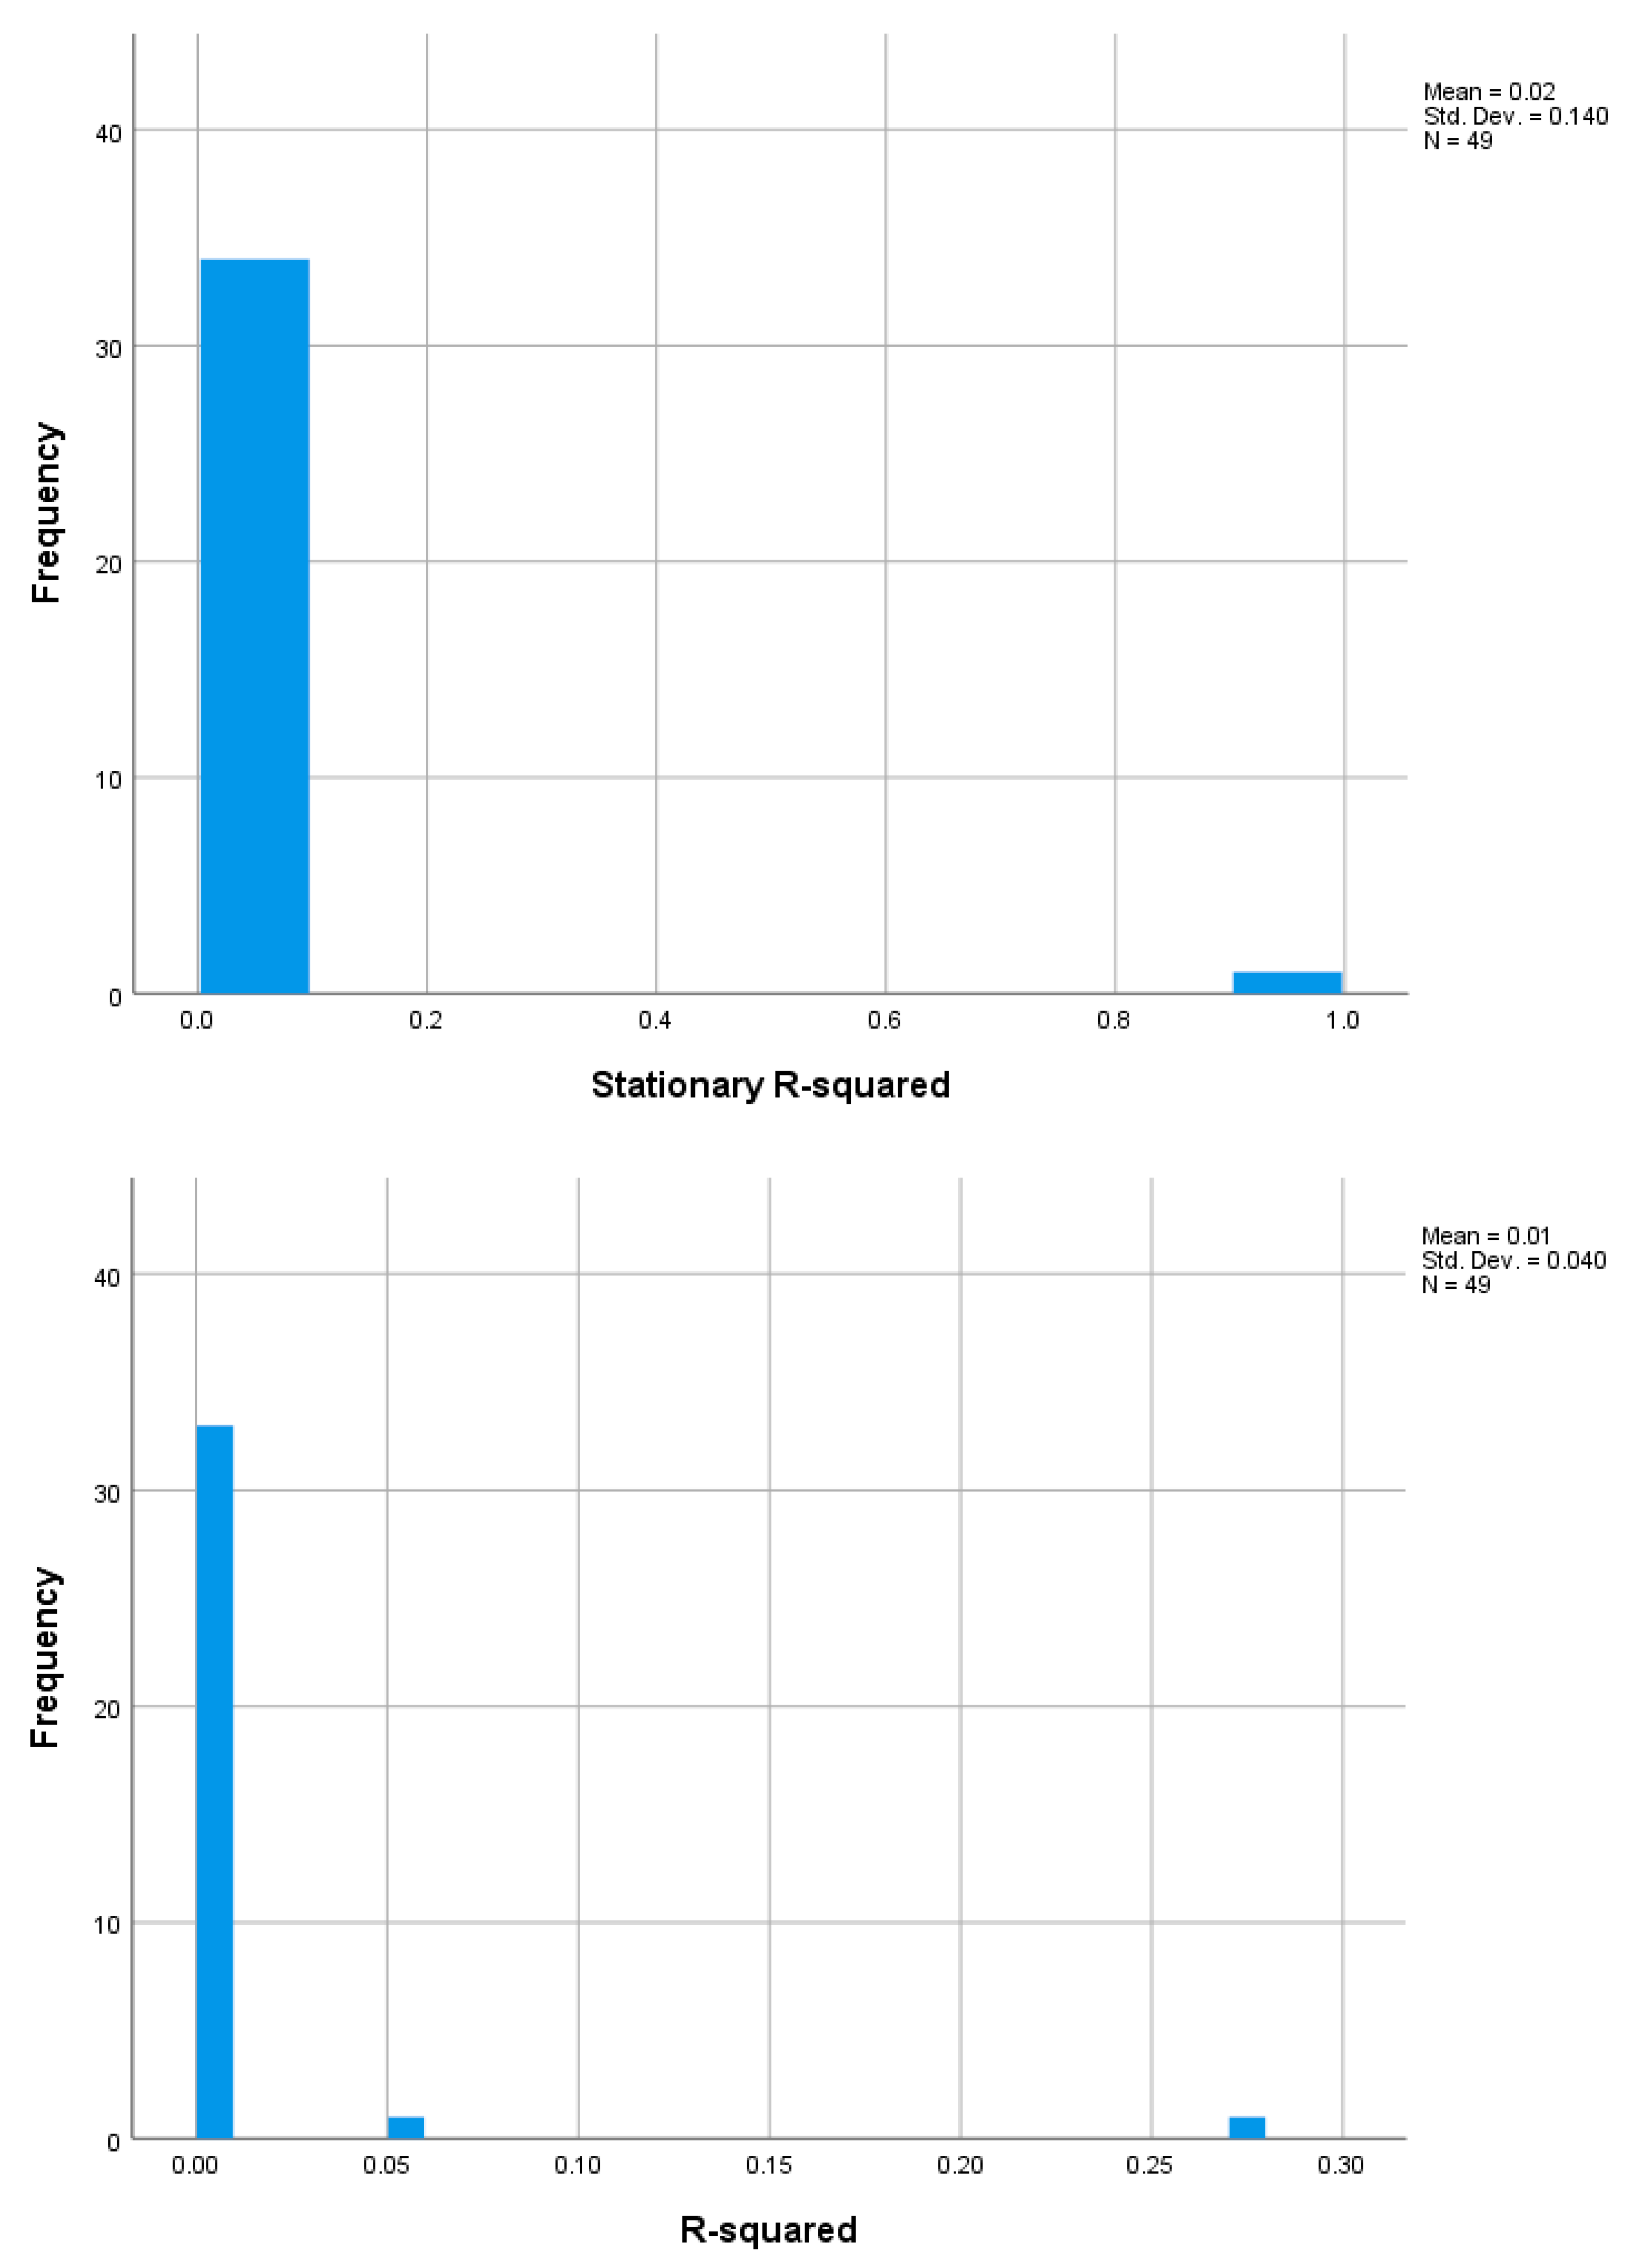
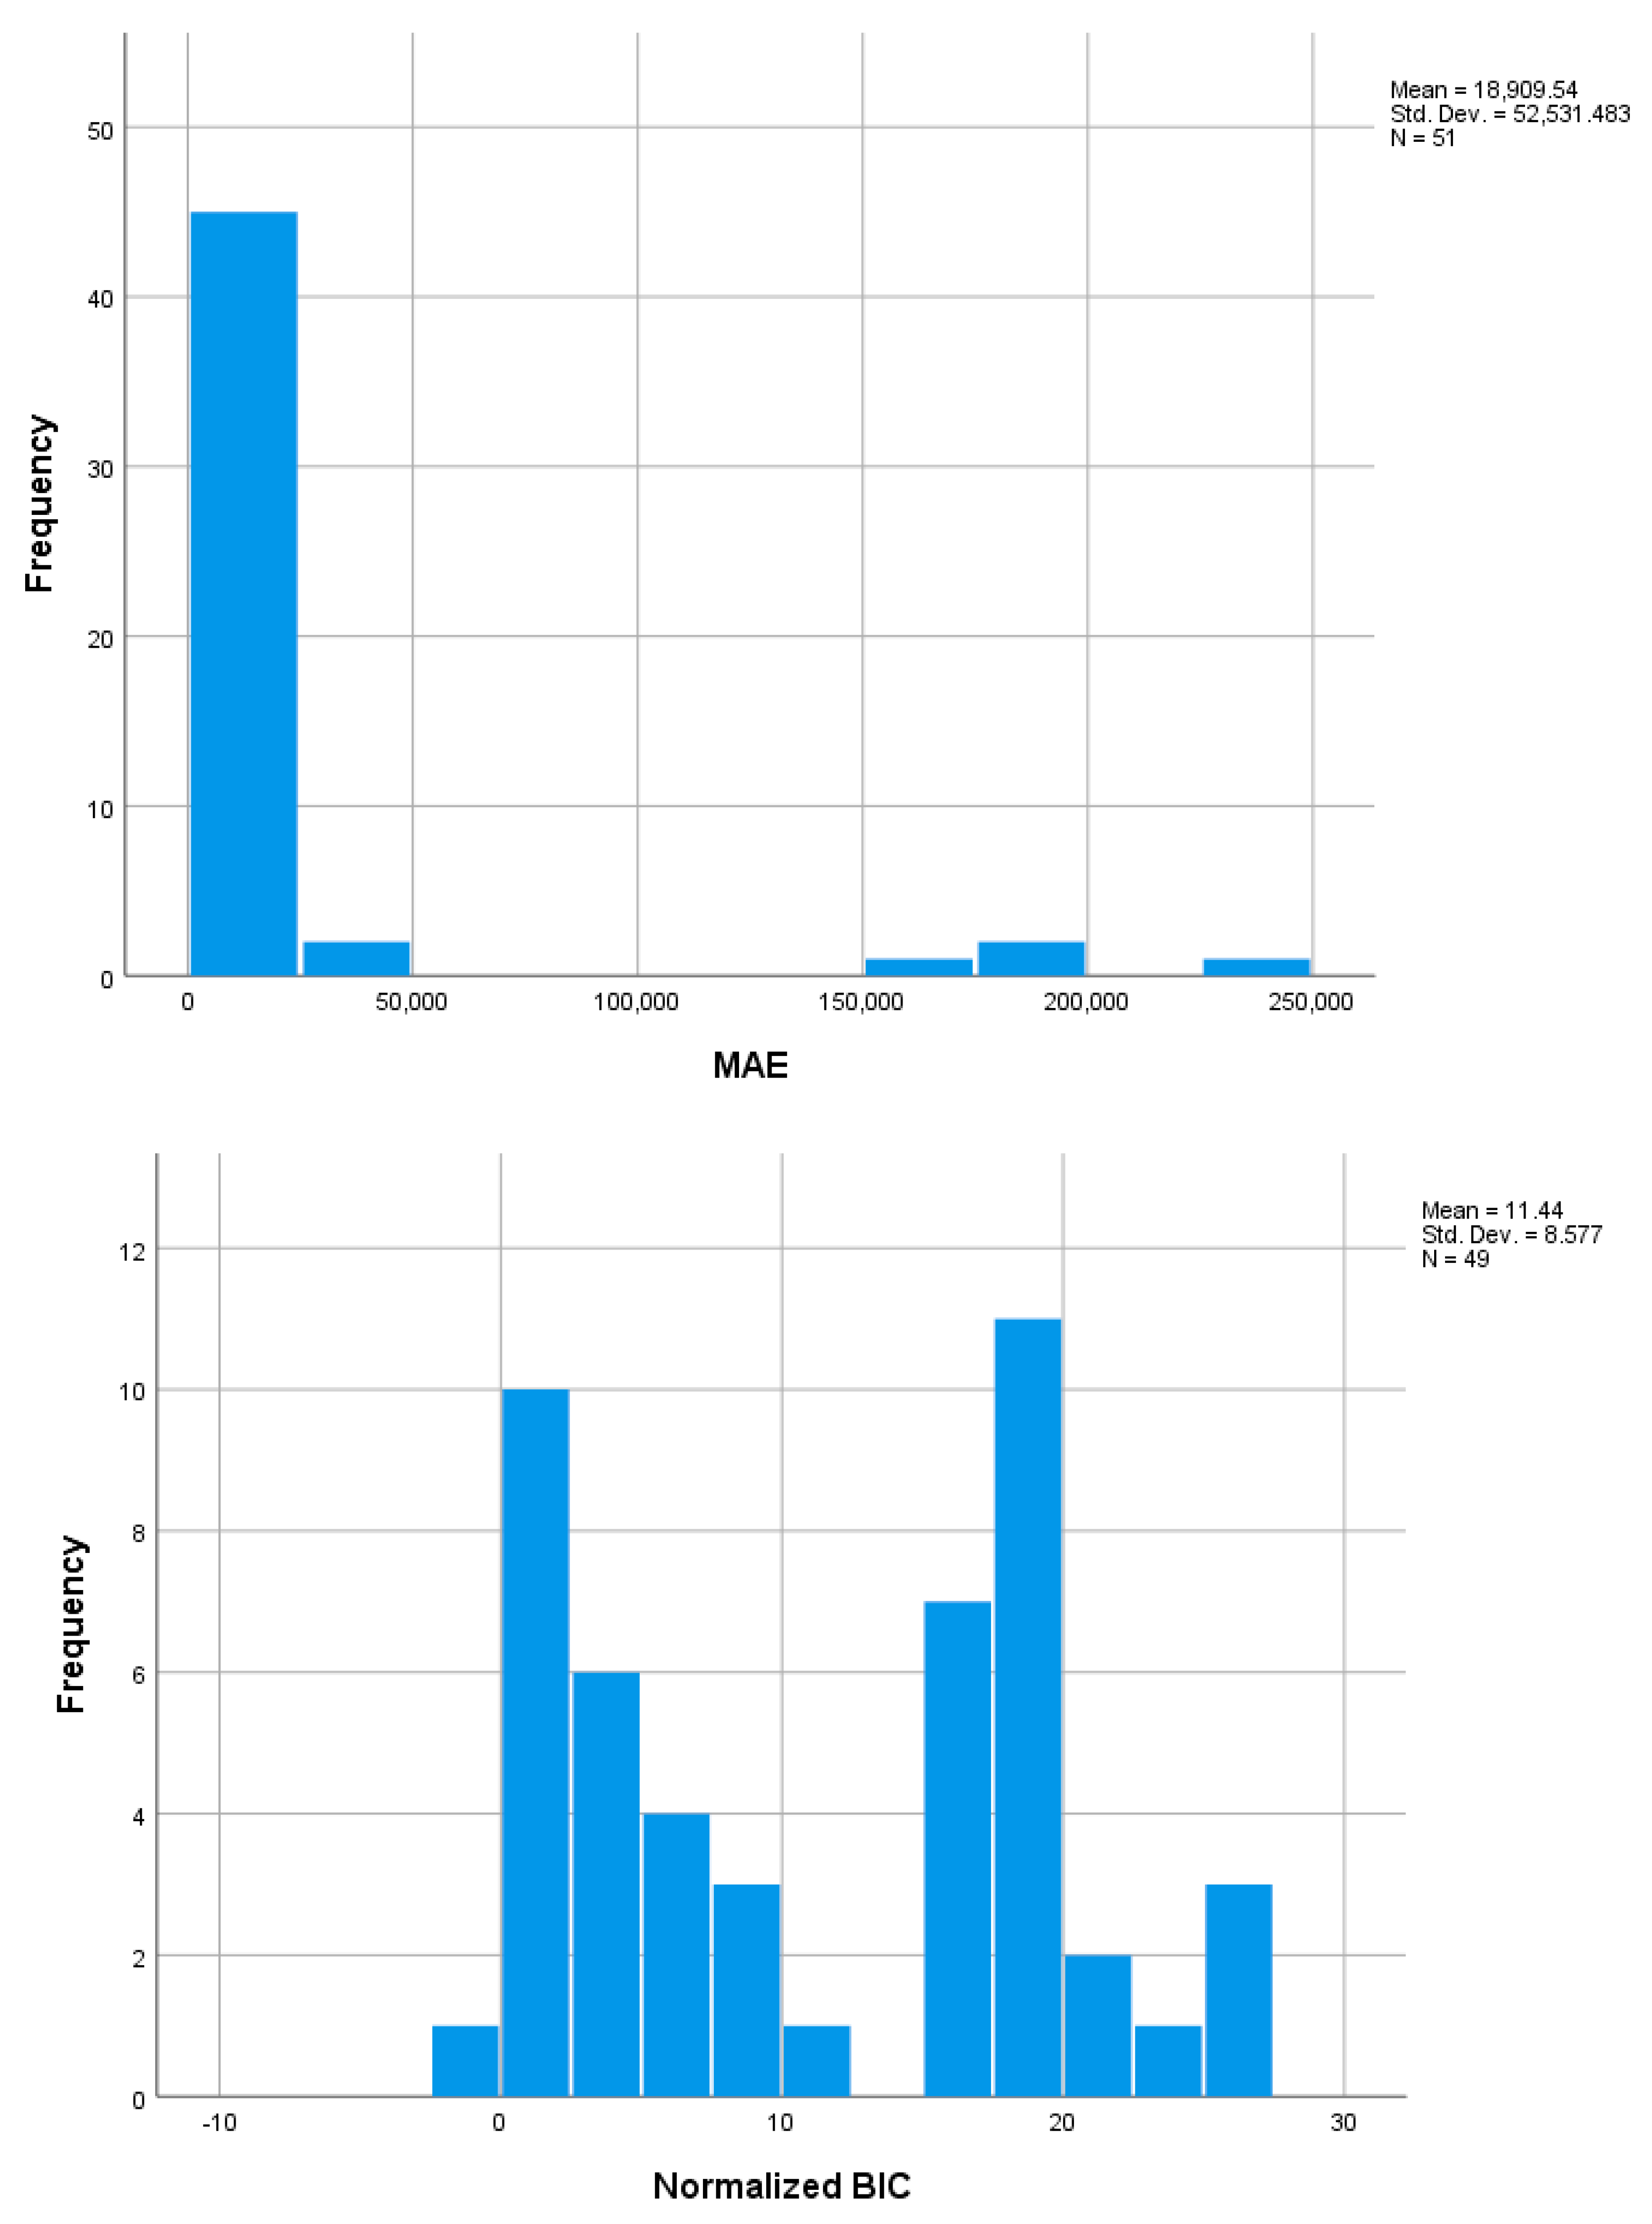
Figure 2.
Statistical and forecasting analysis for mountain entrepreneurship related to the tourism and food sub-sectors.
Figure 2.
Statistical and forecasting analysis for mountain entrepreneurship related to the tourism and food sub-sectors.

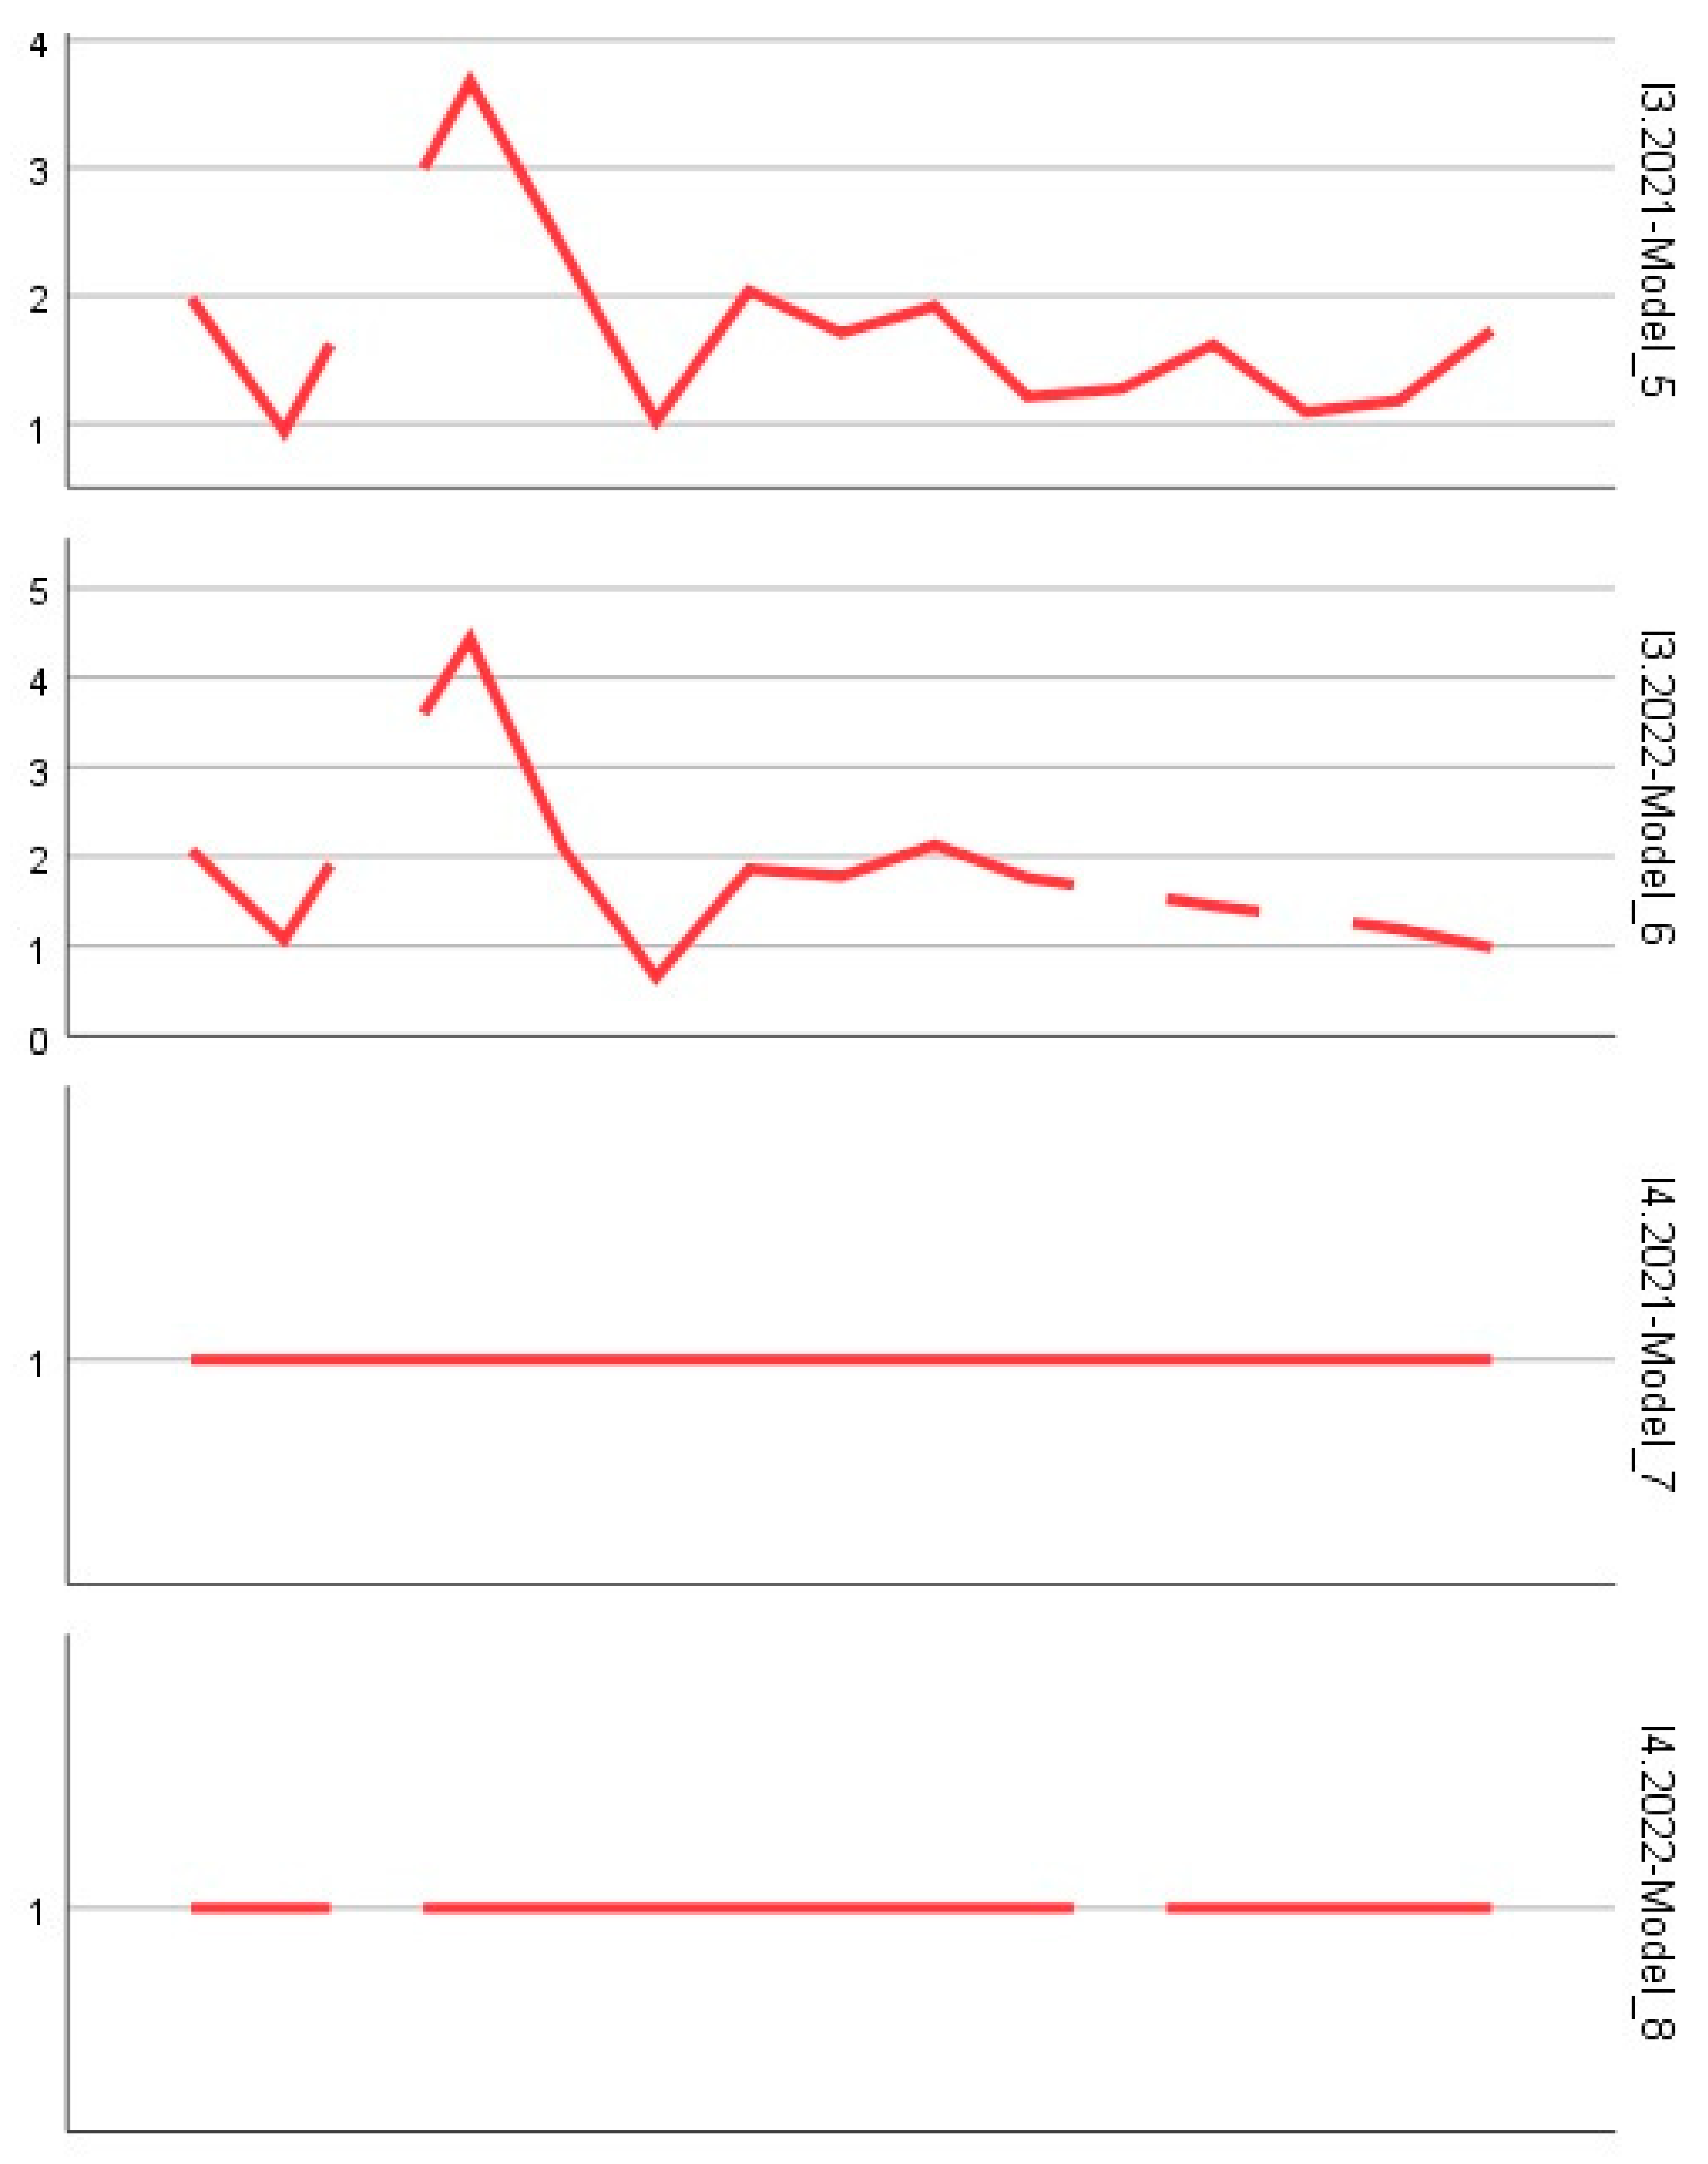
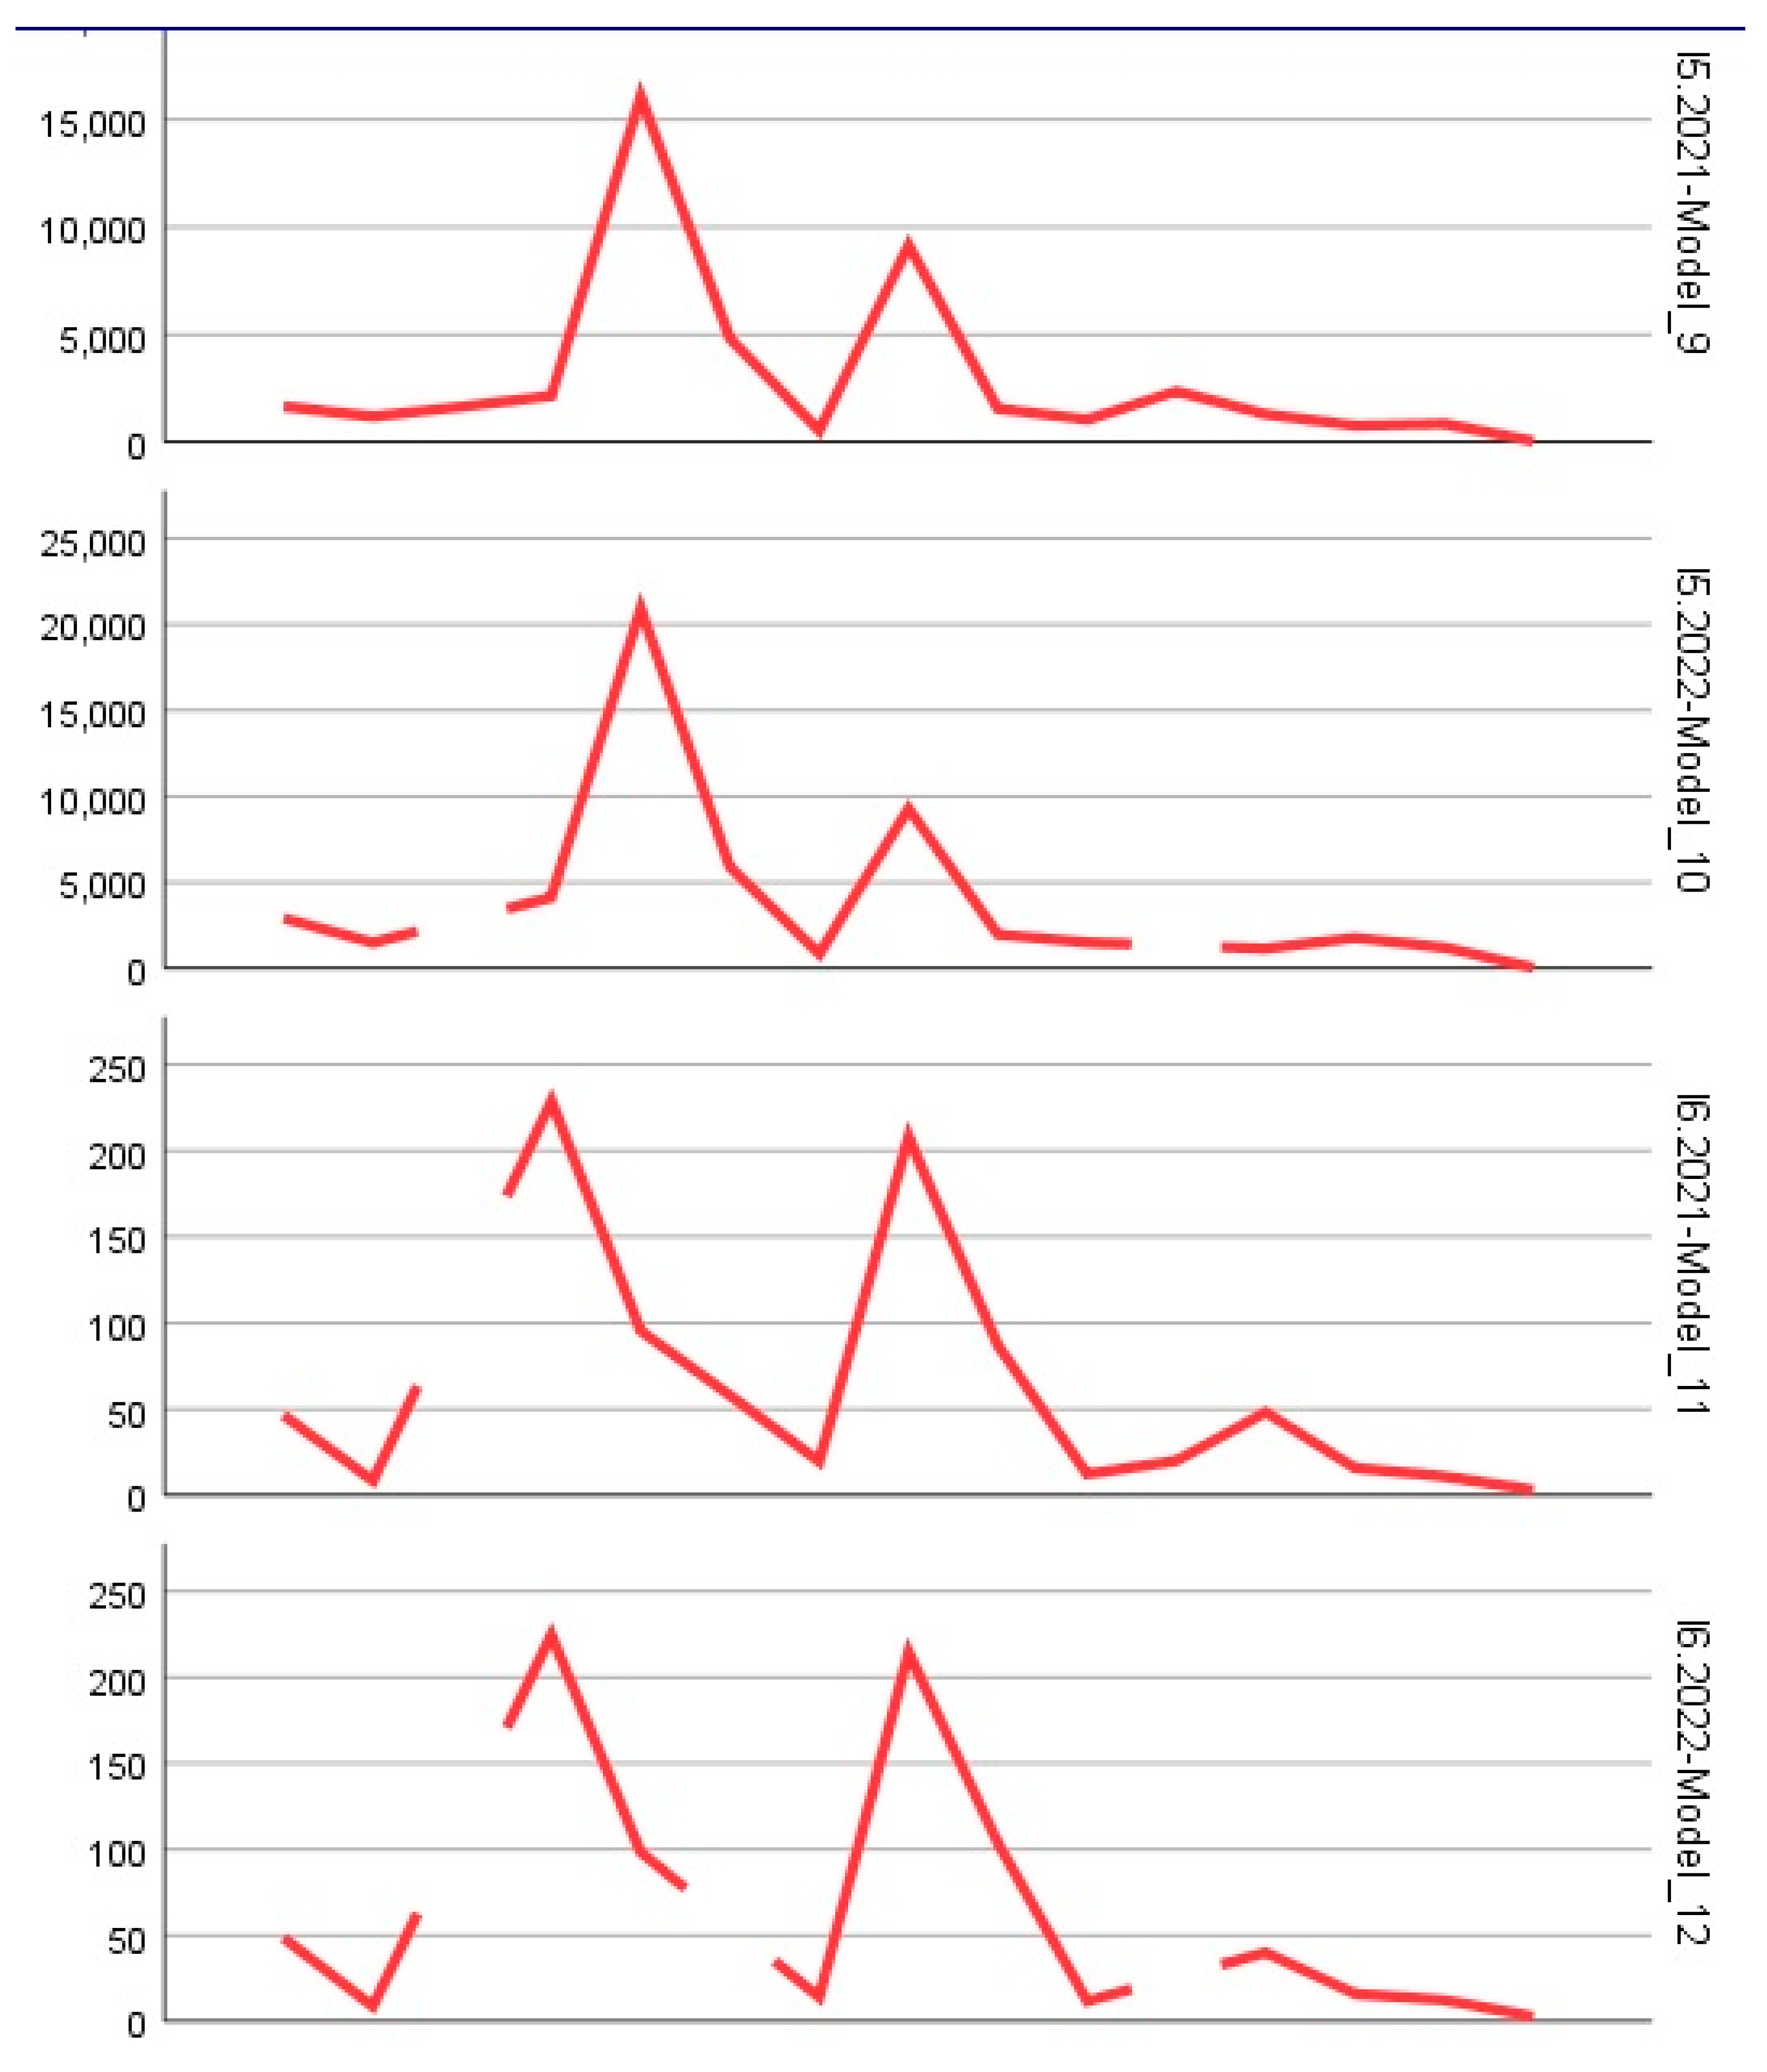
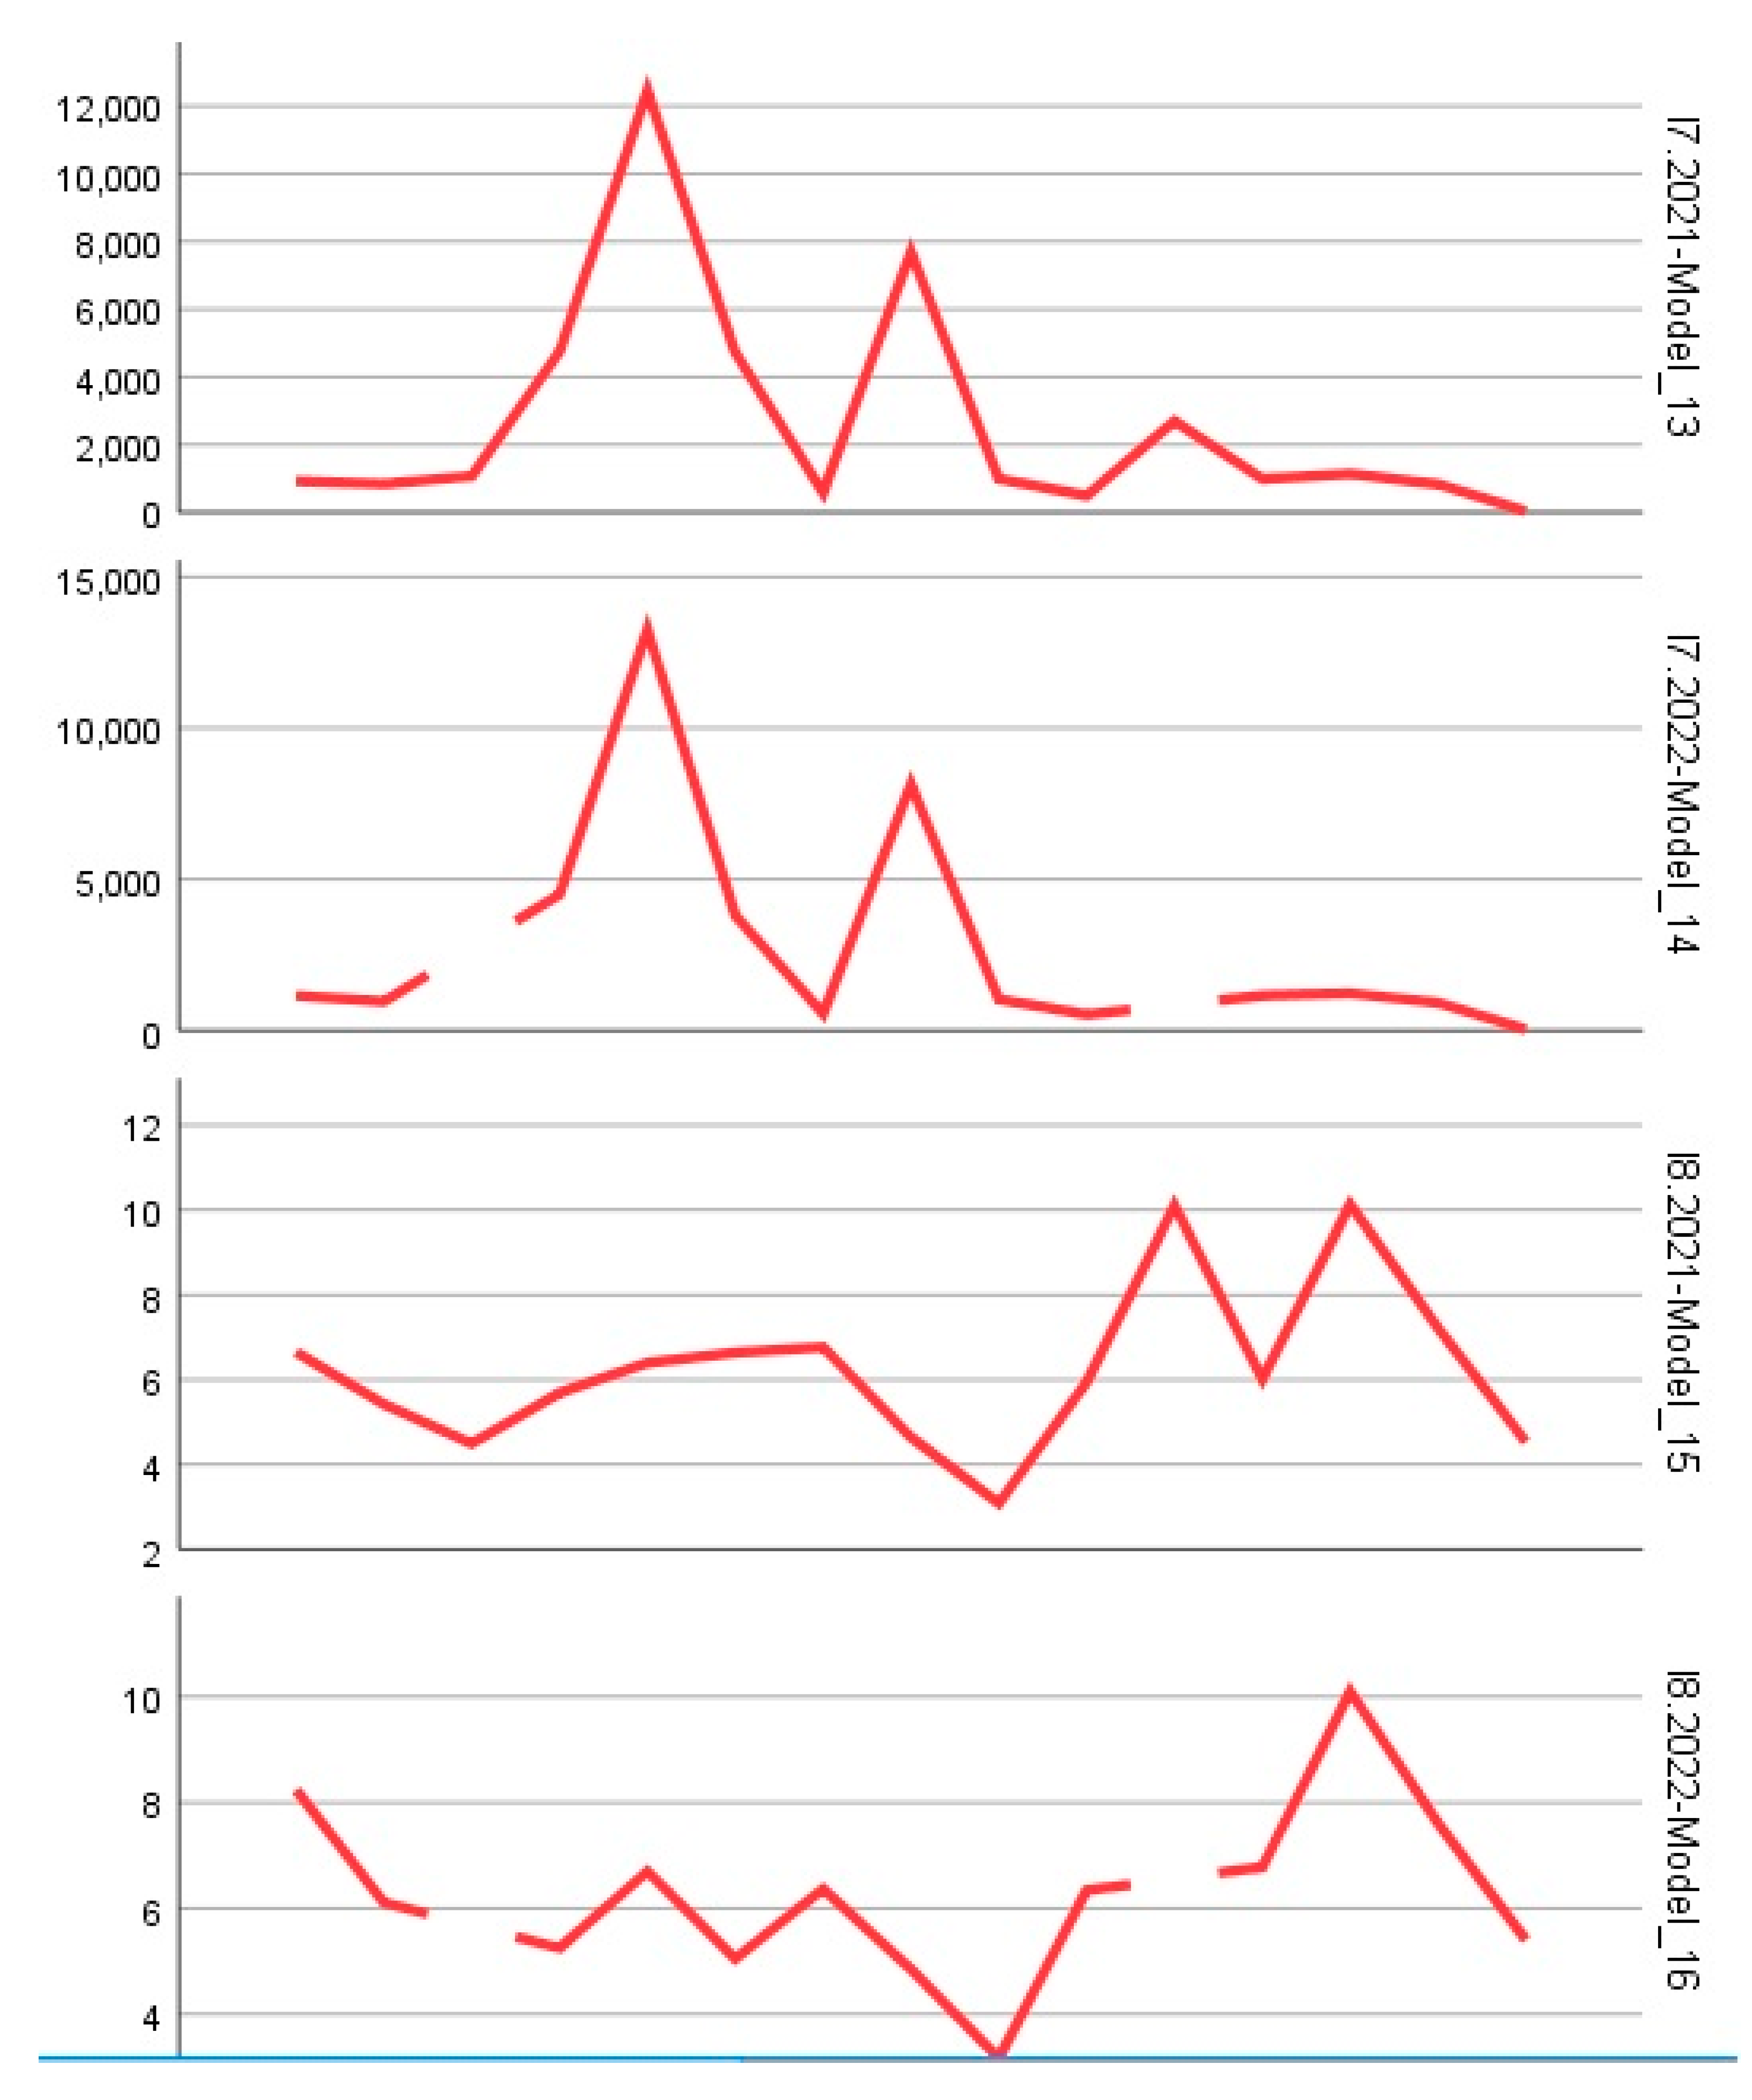
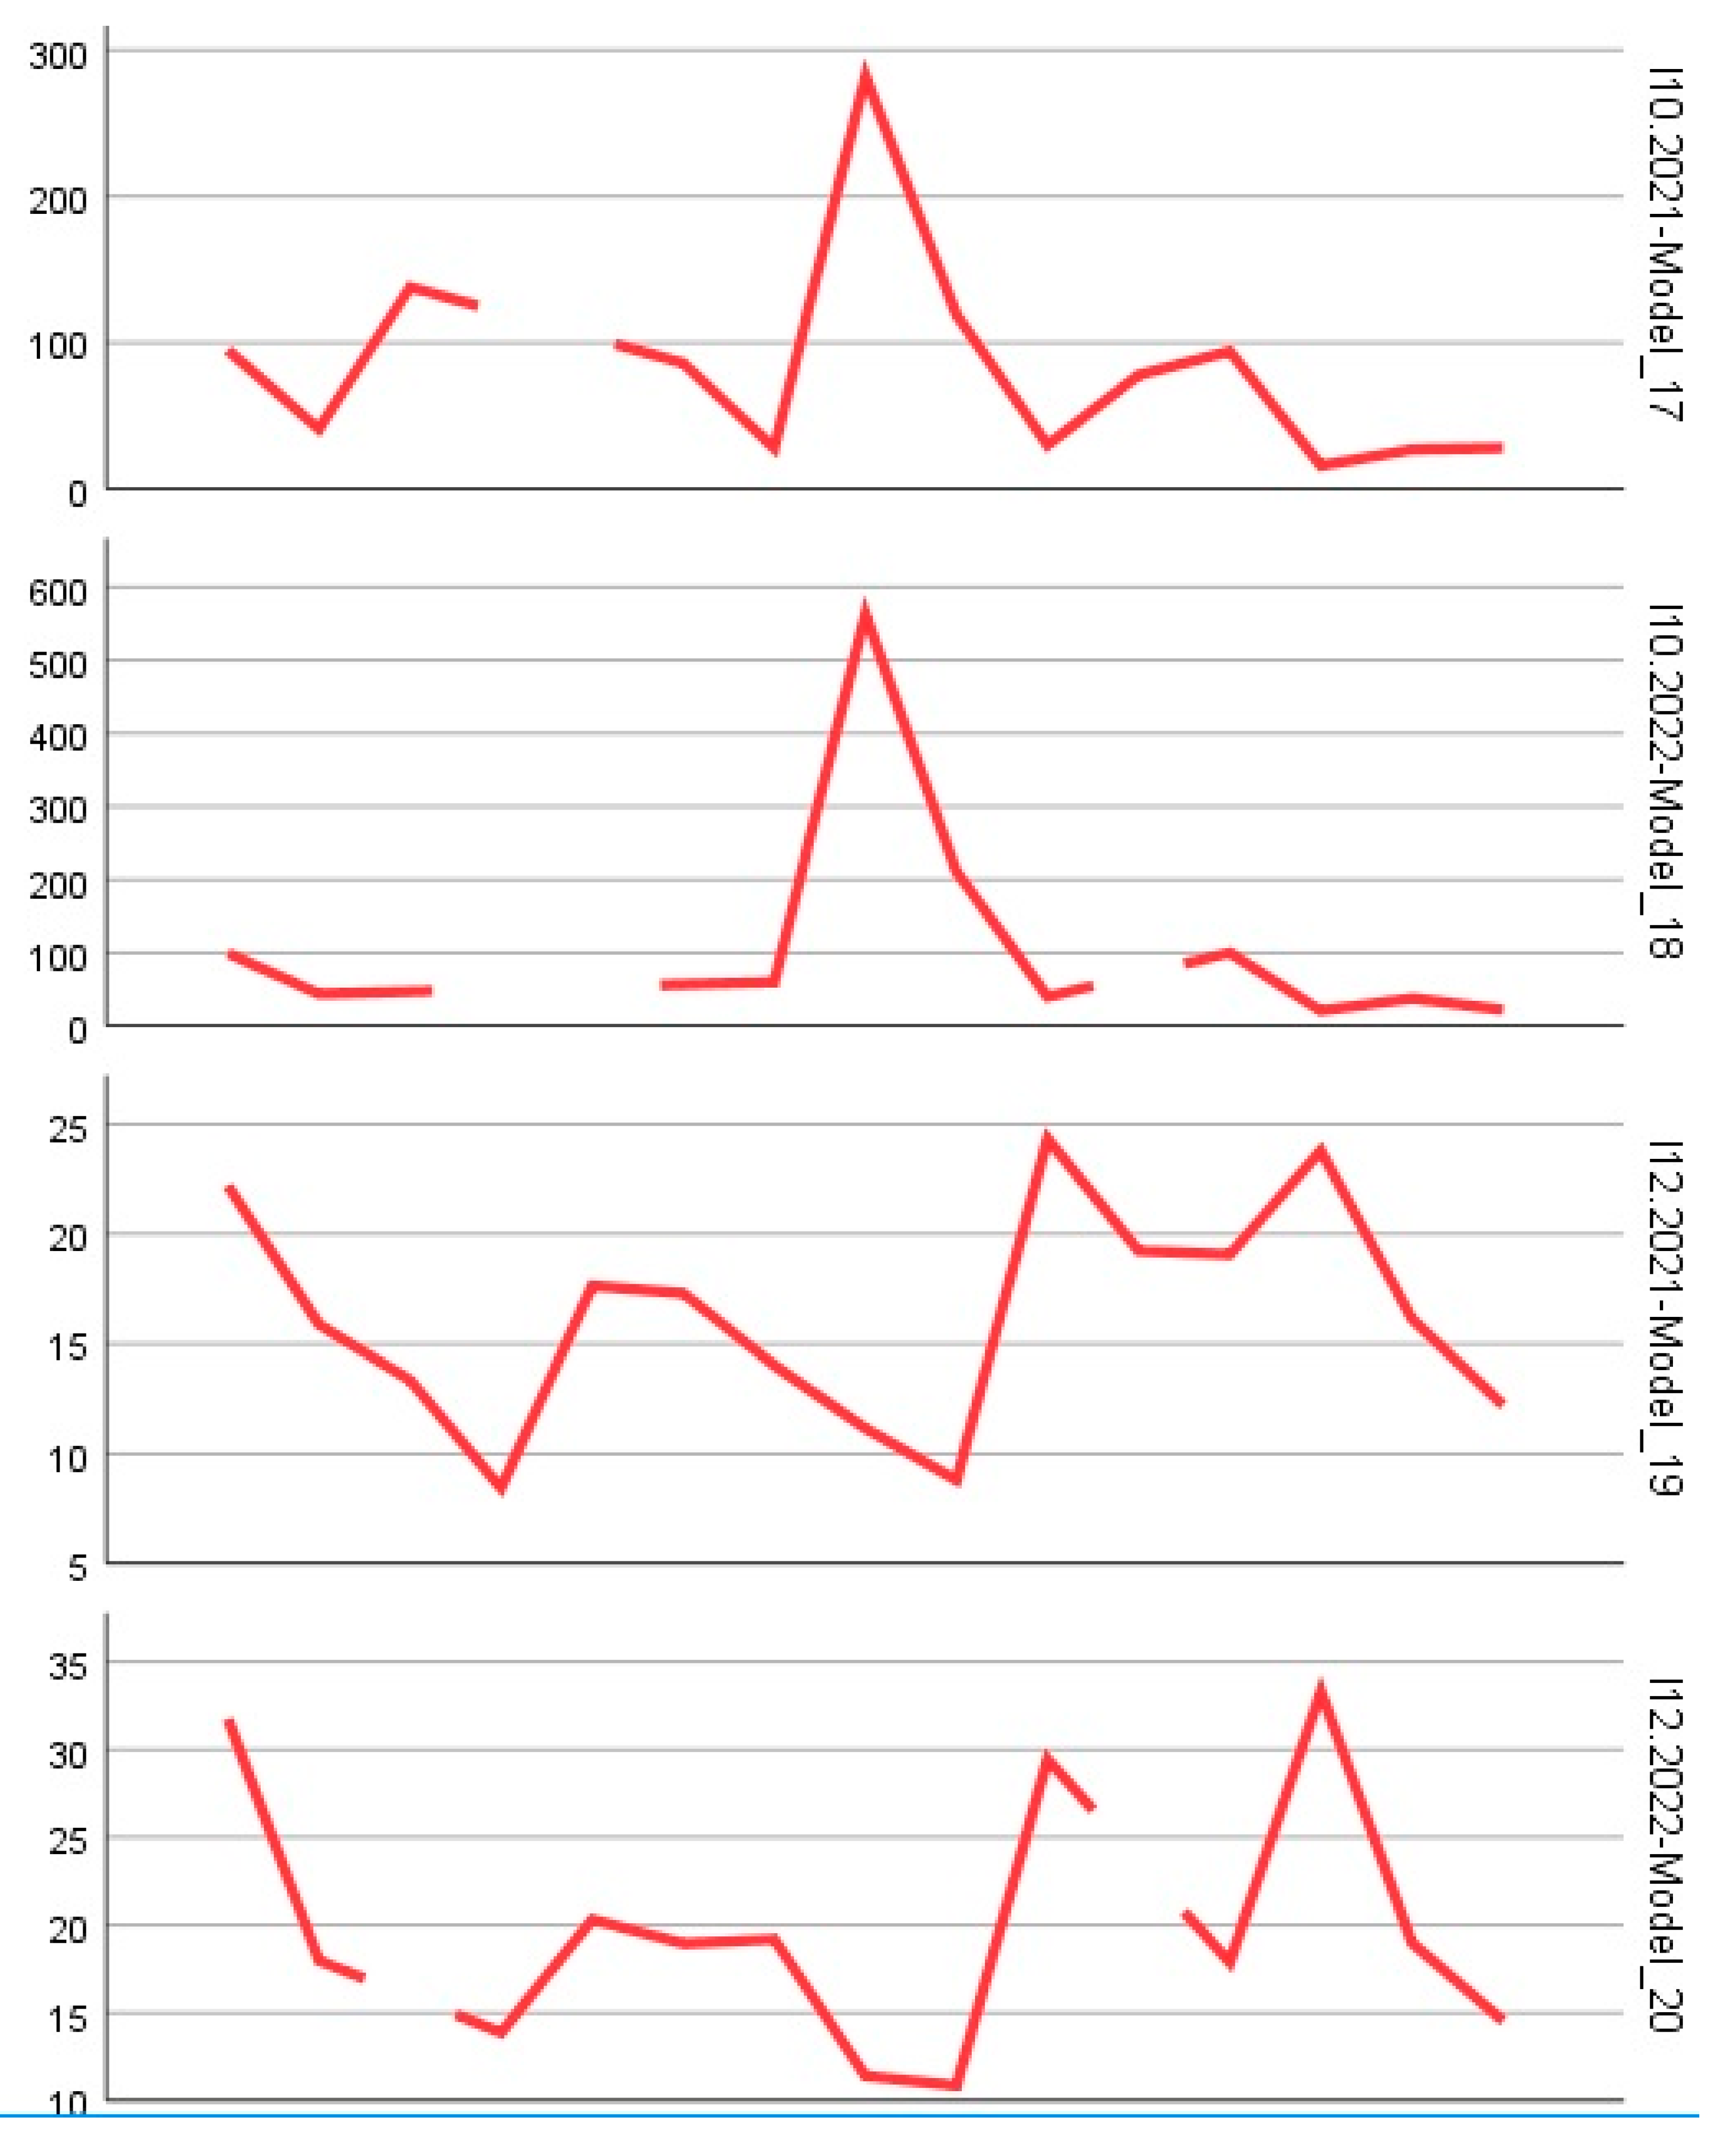
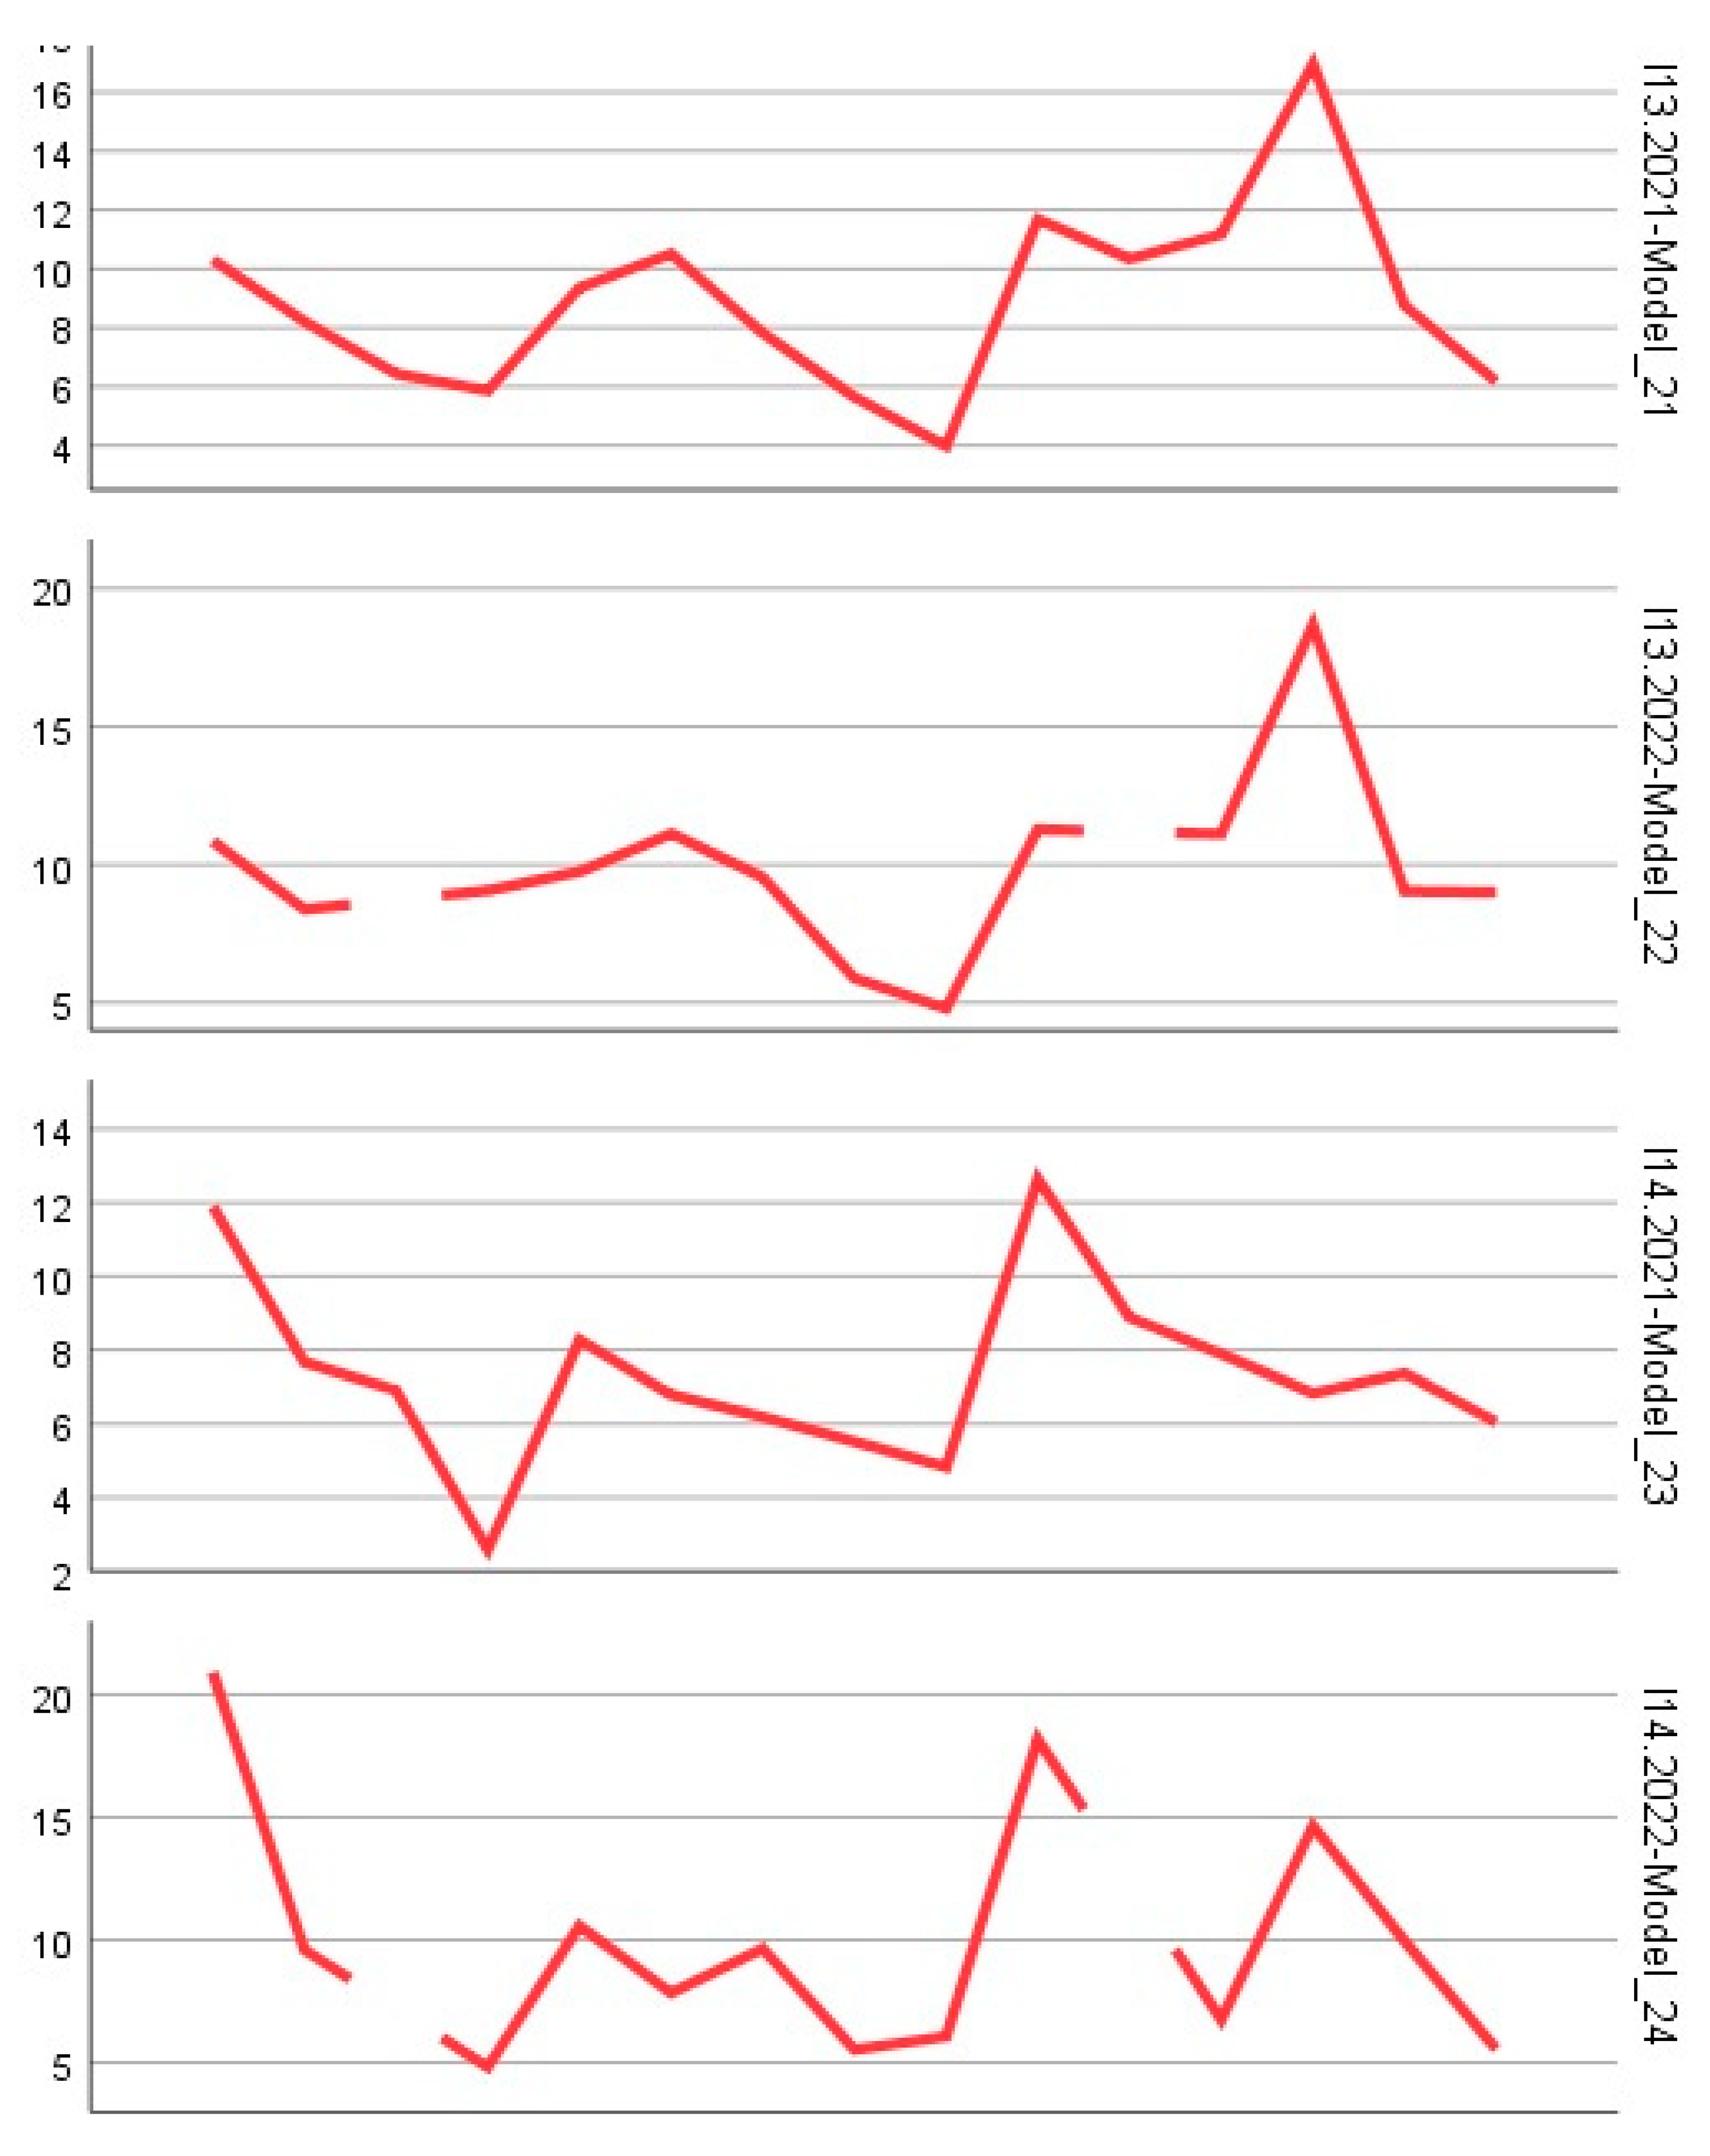
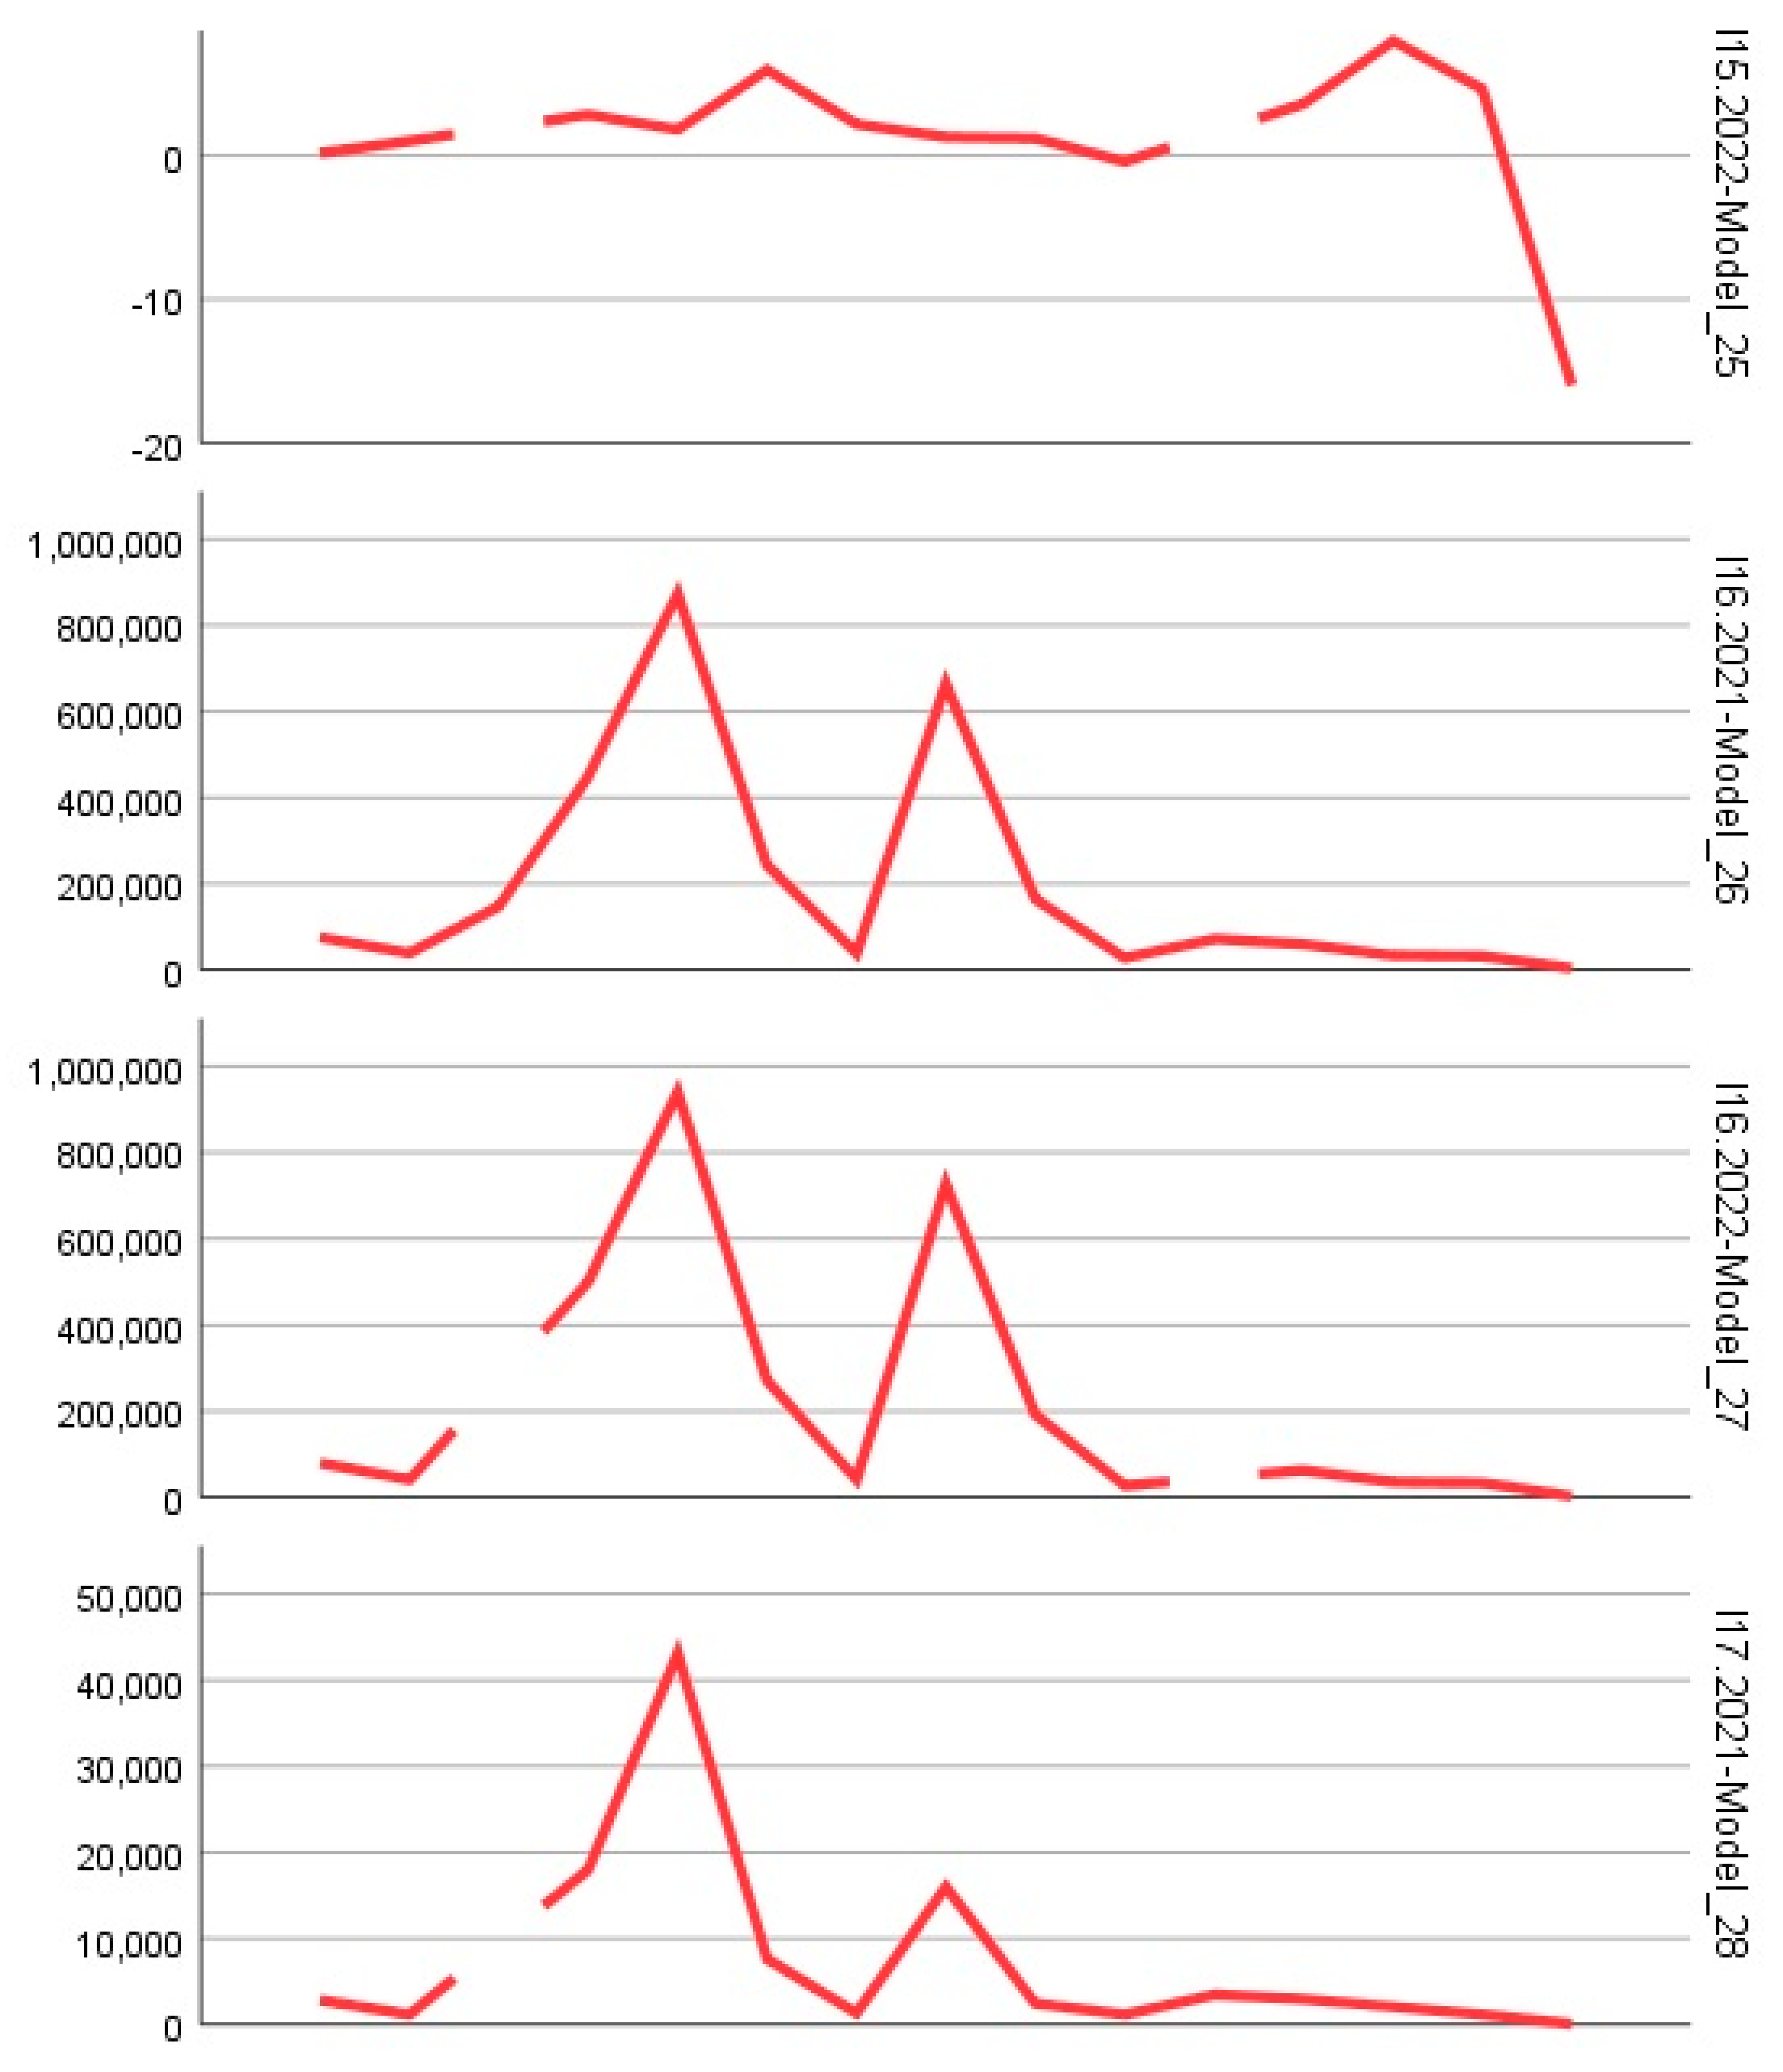
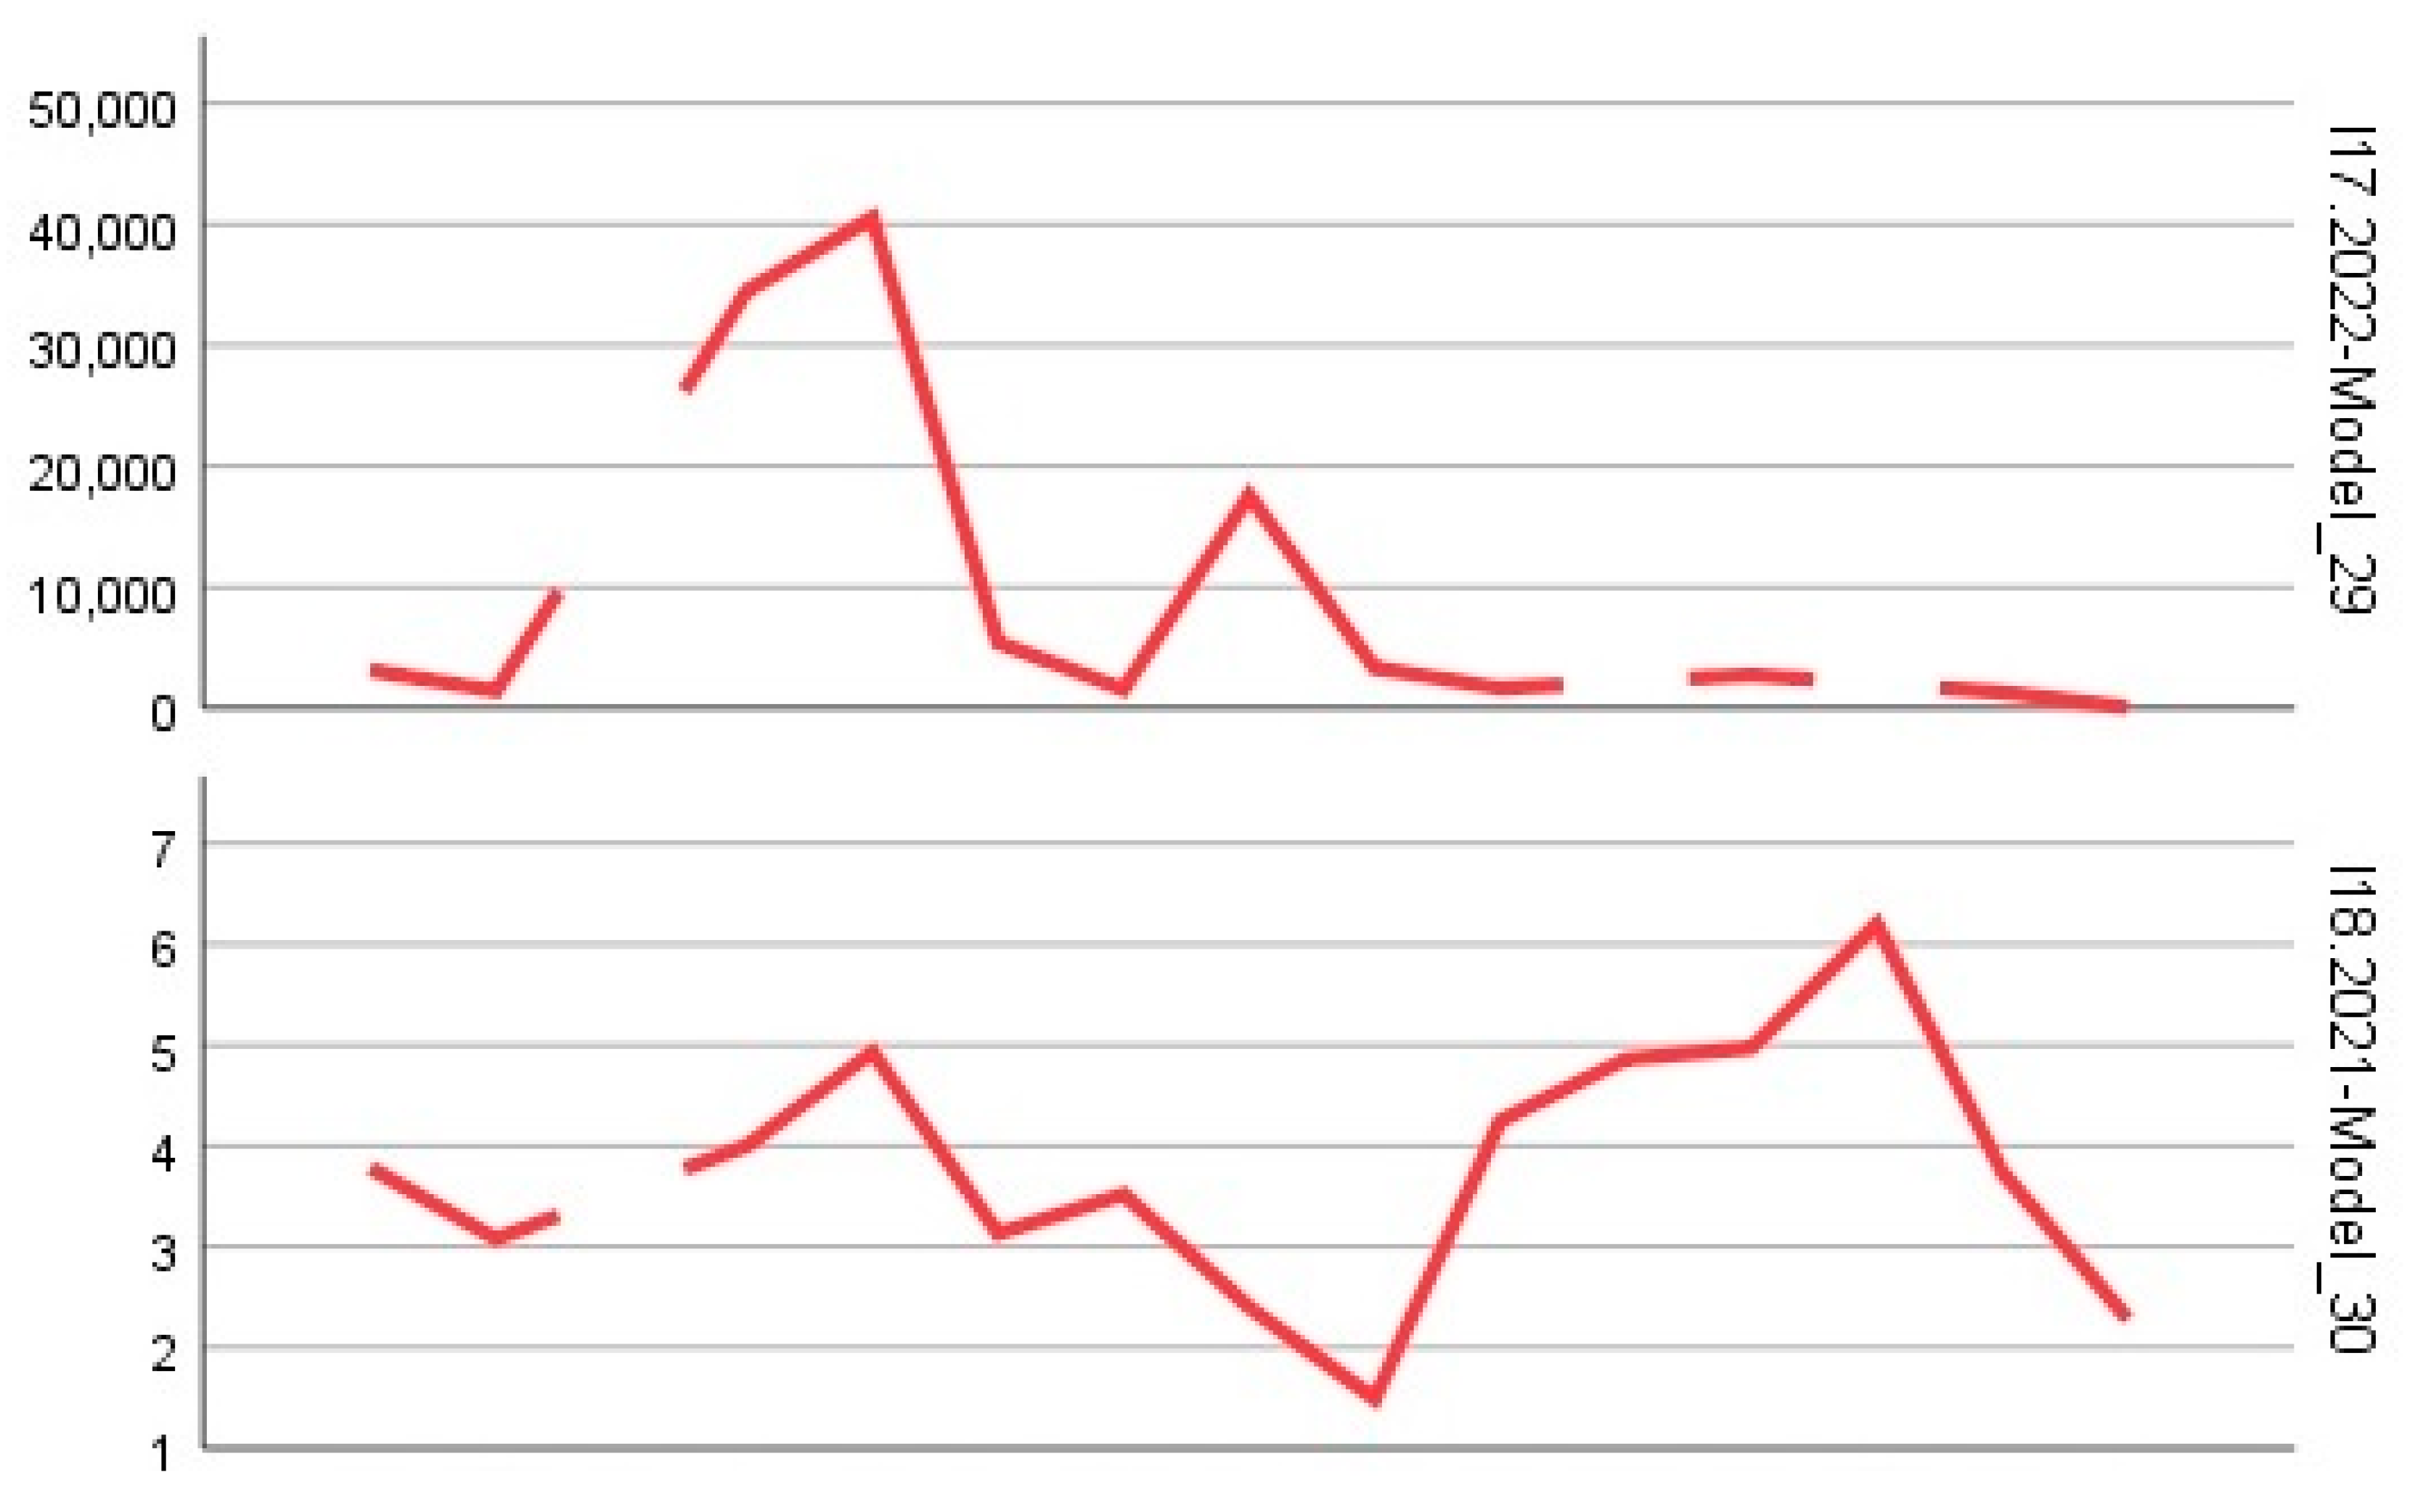
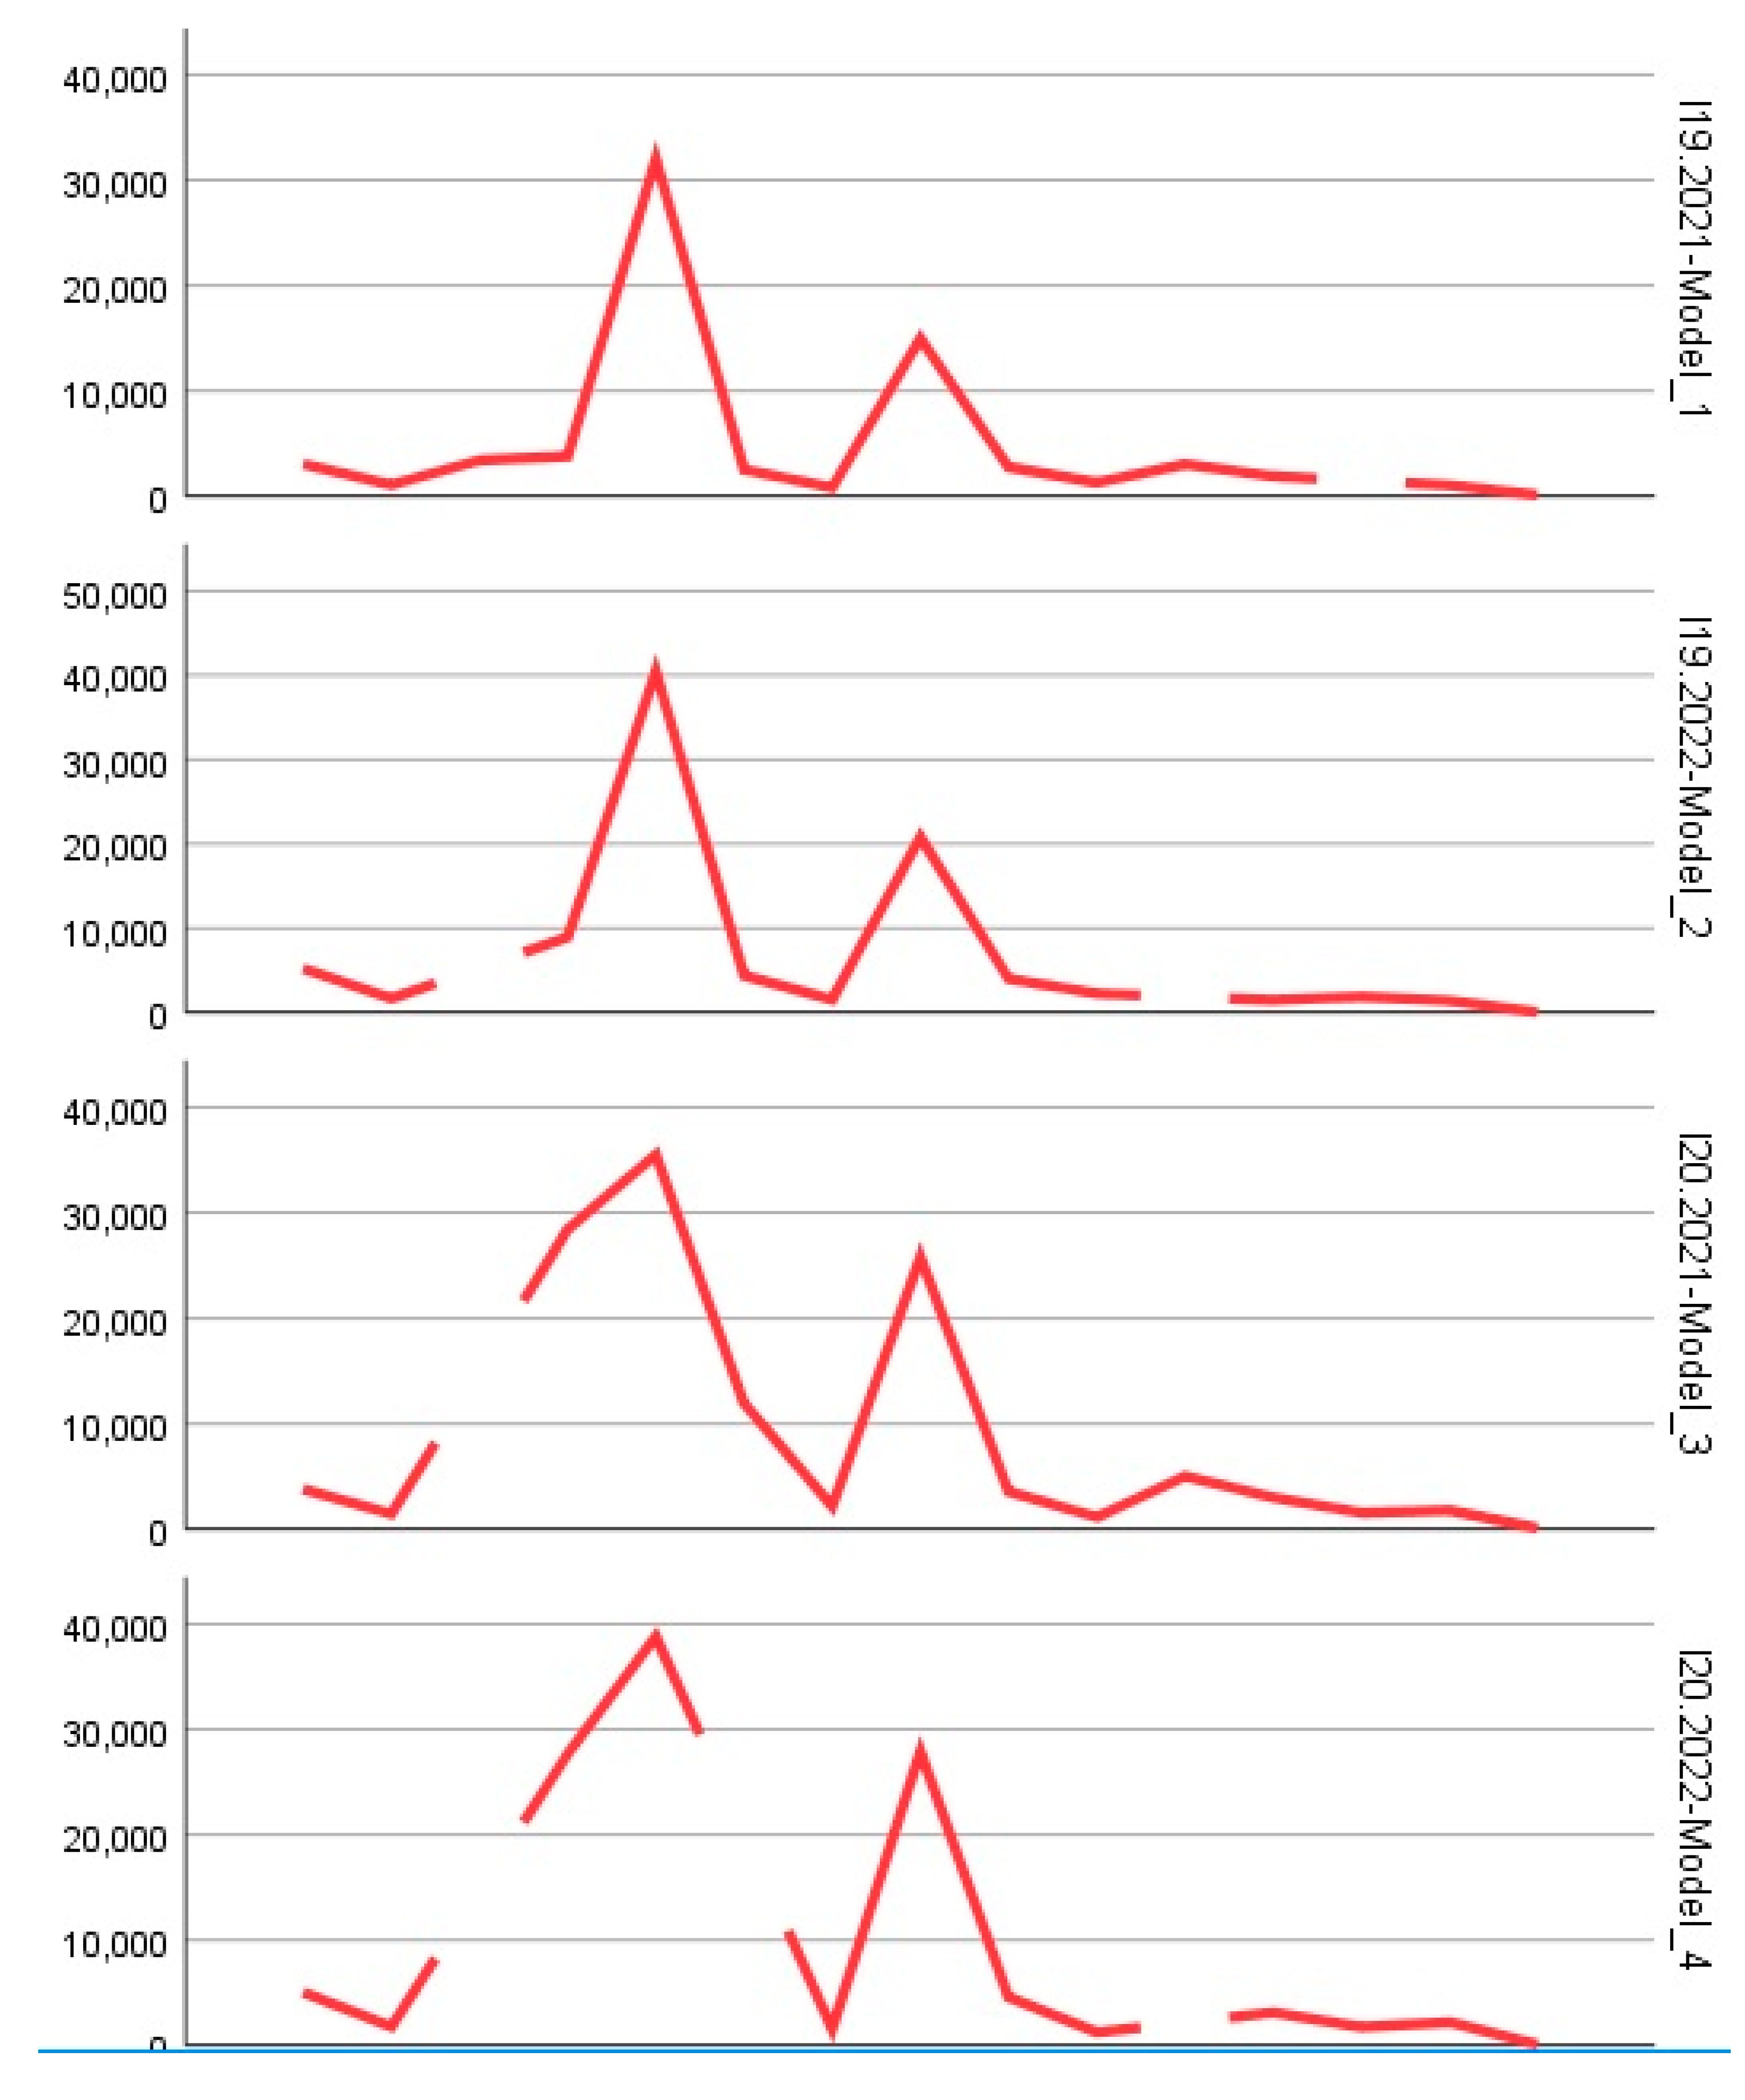
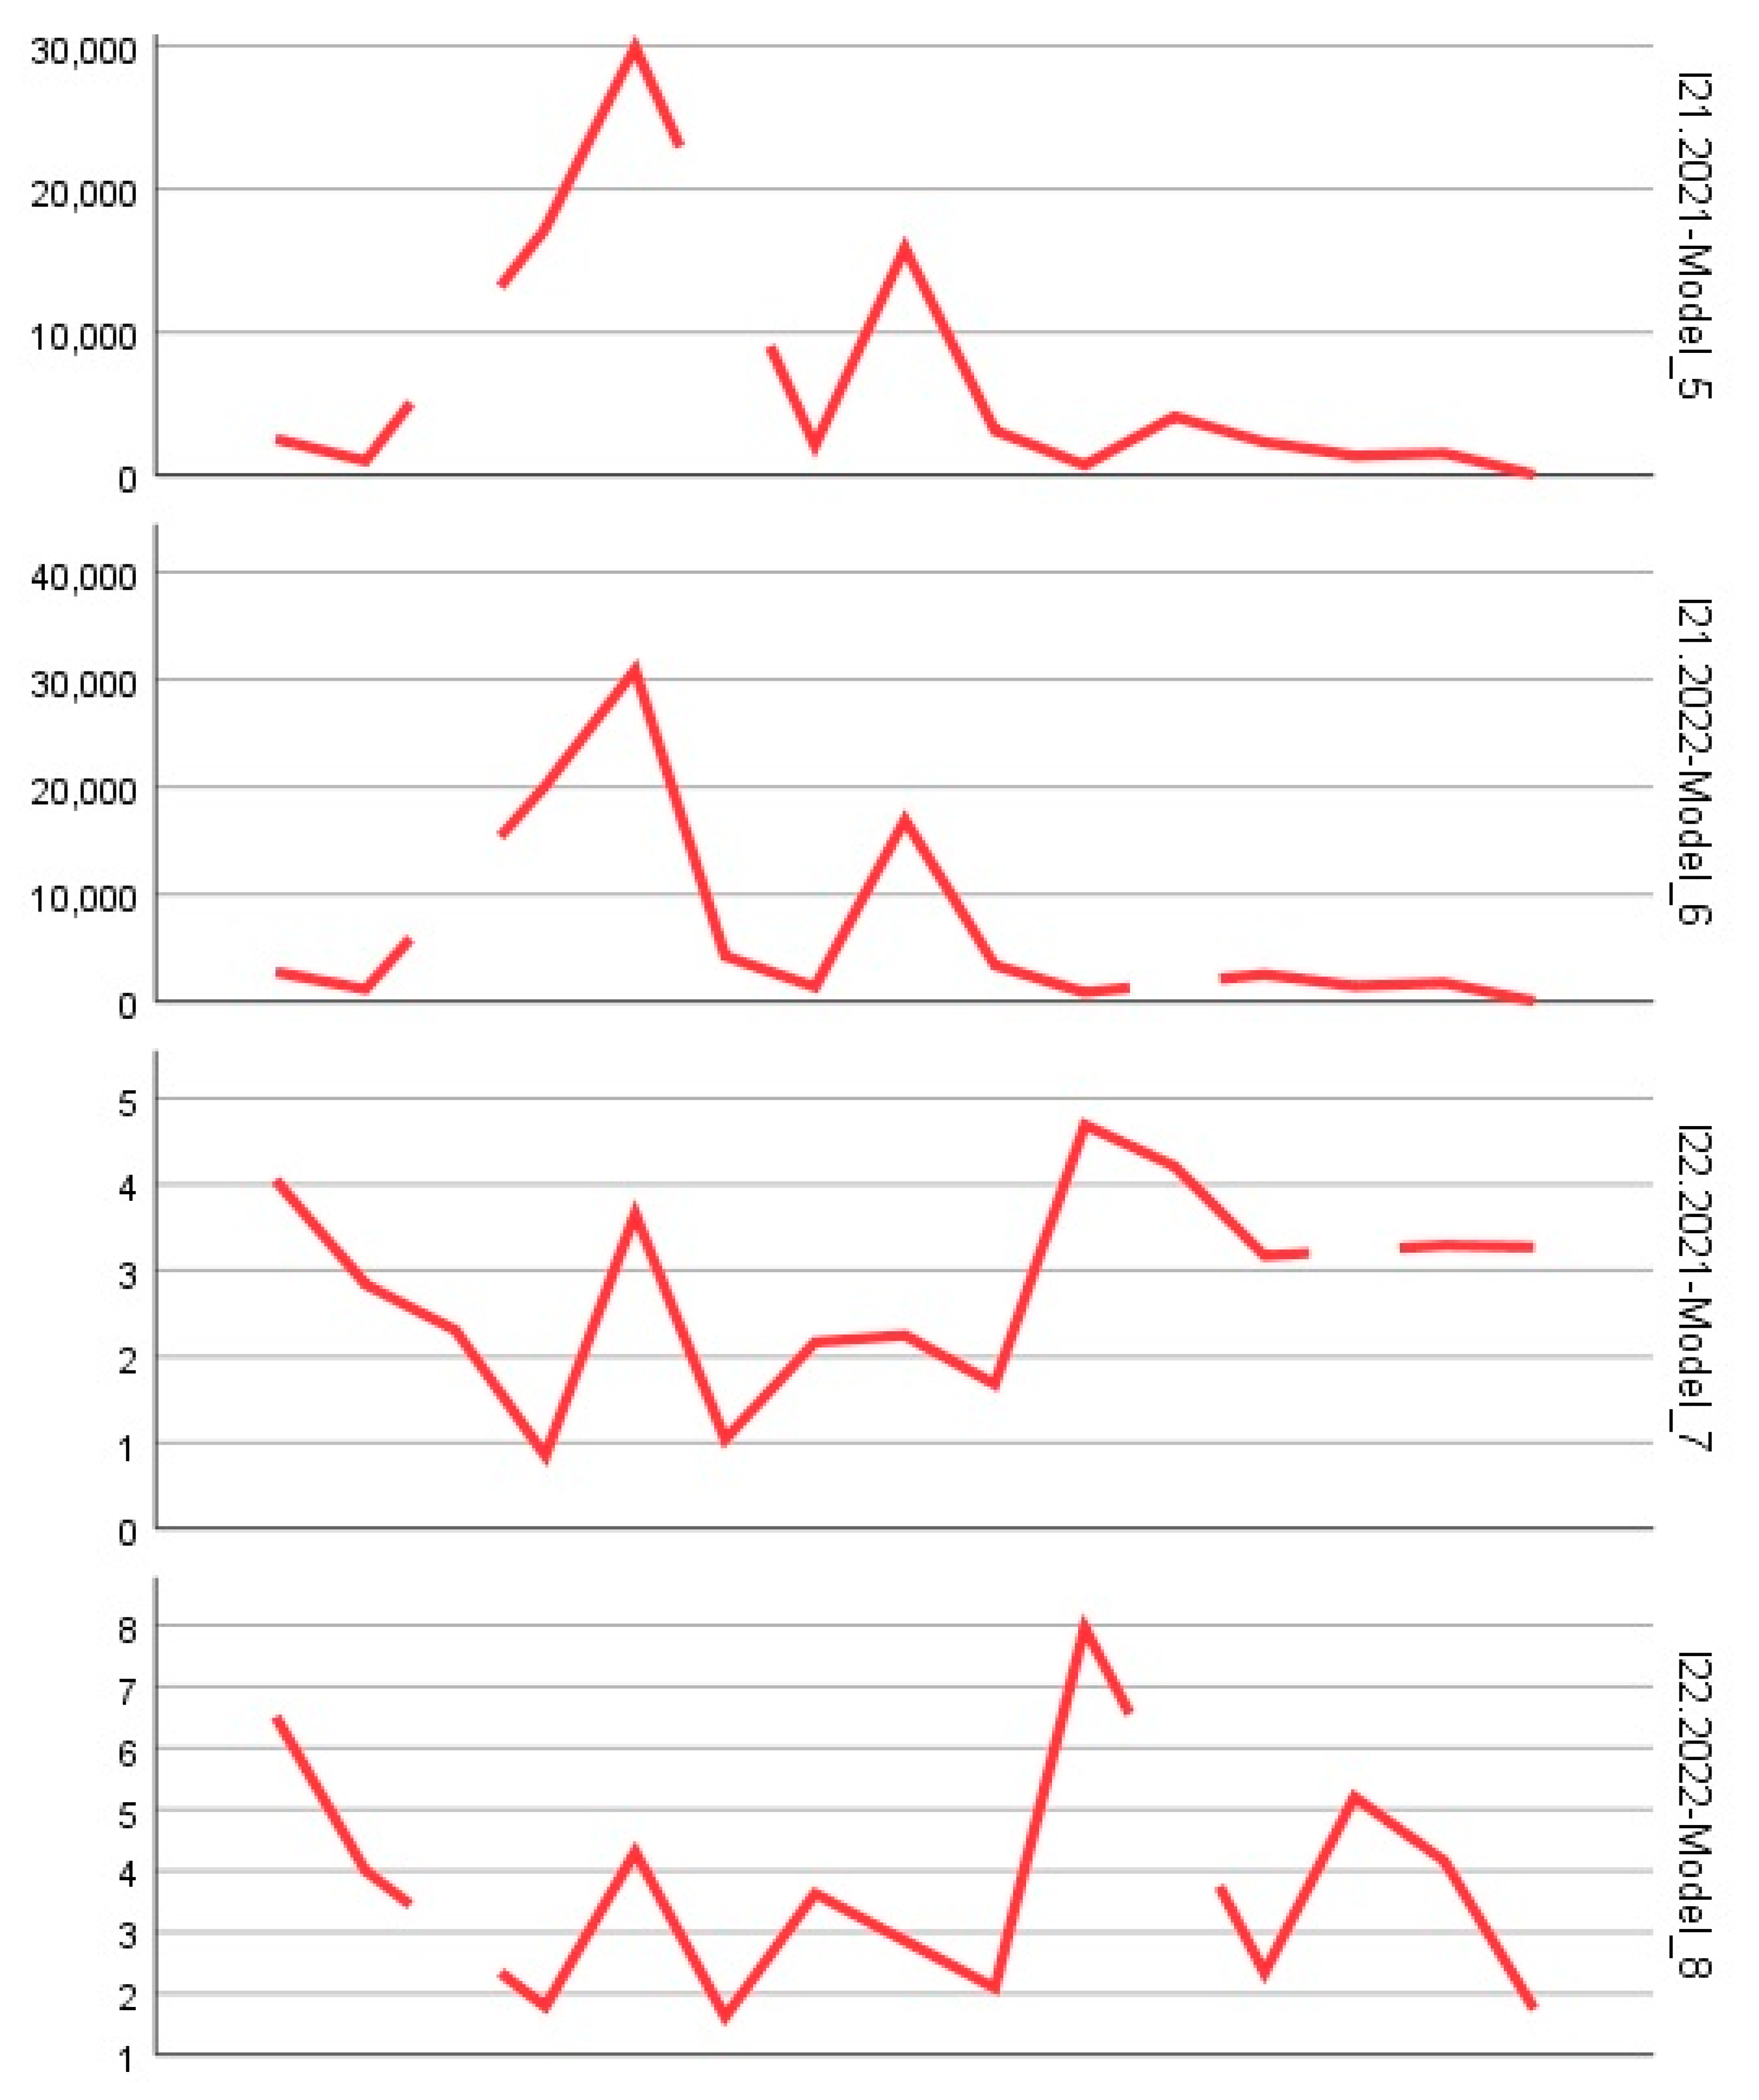
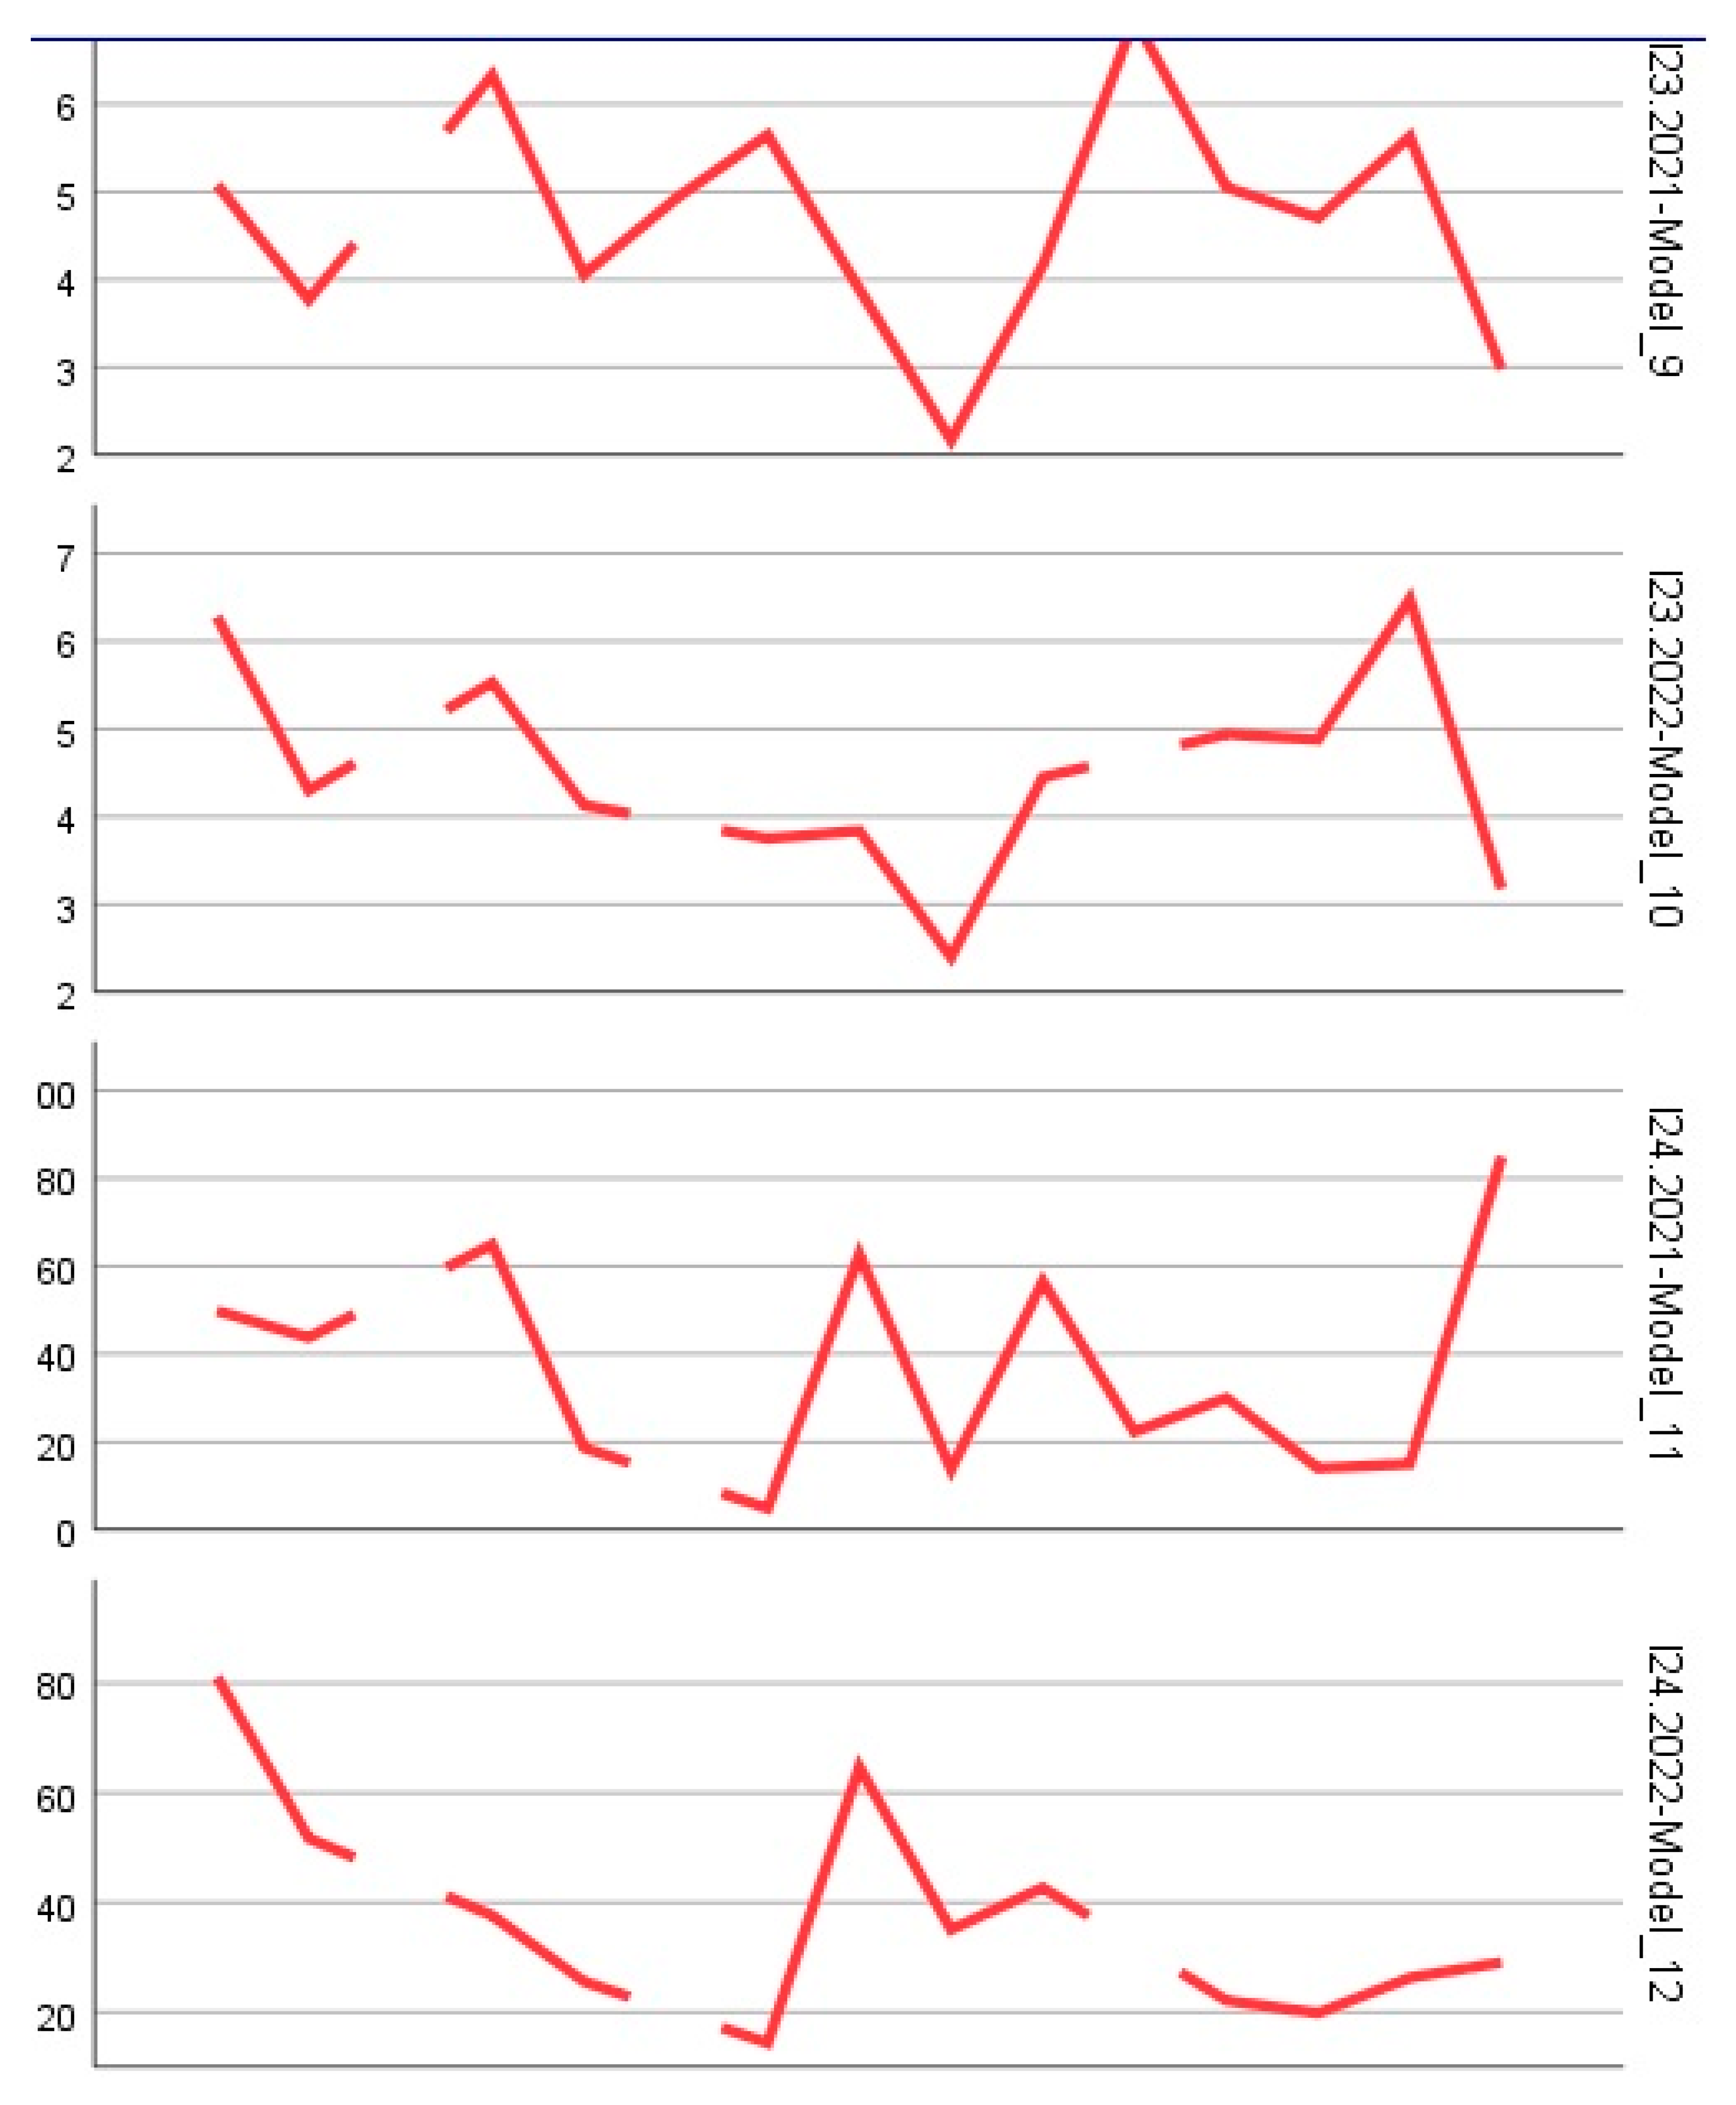
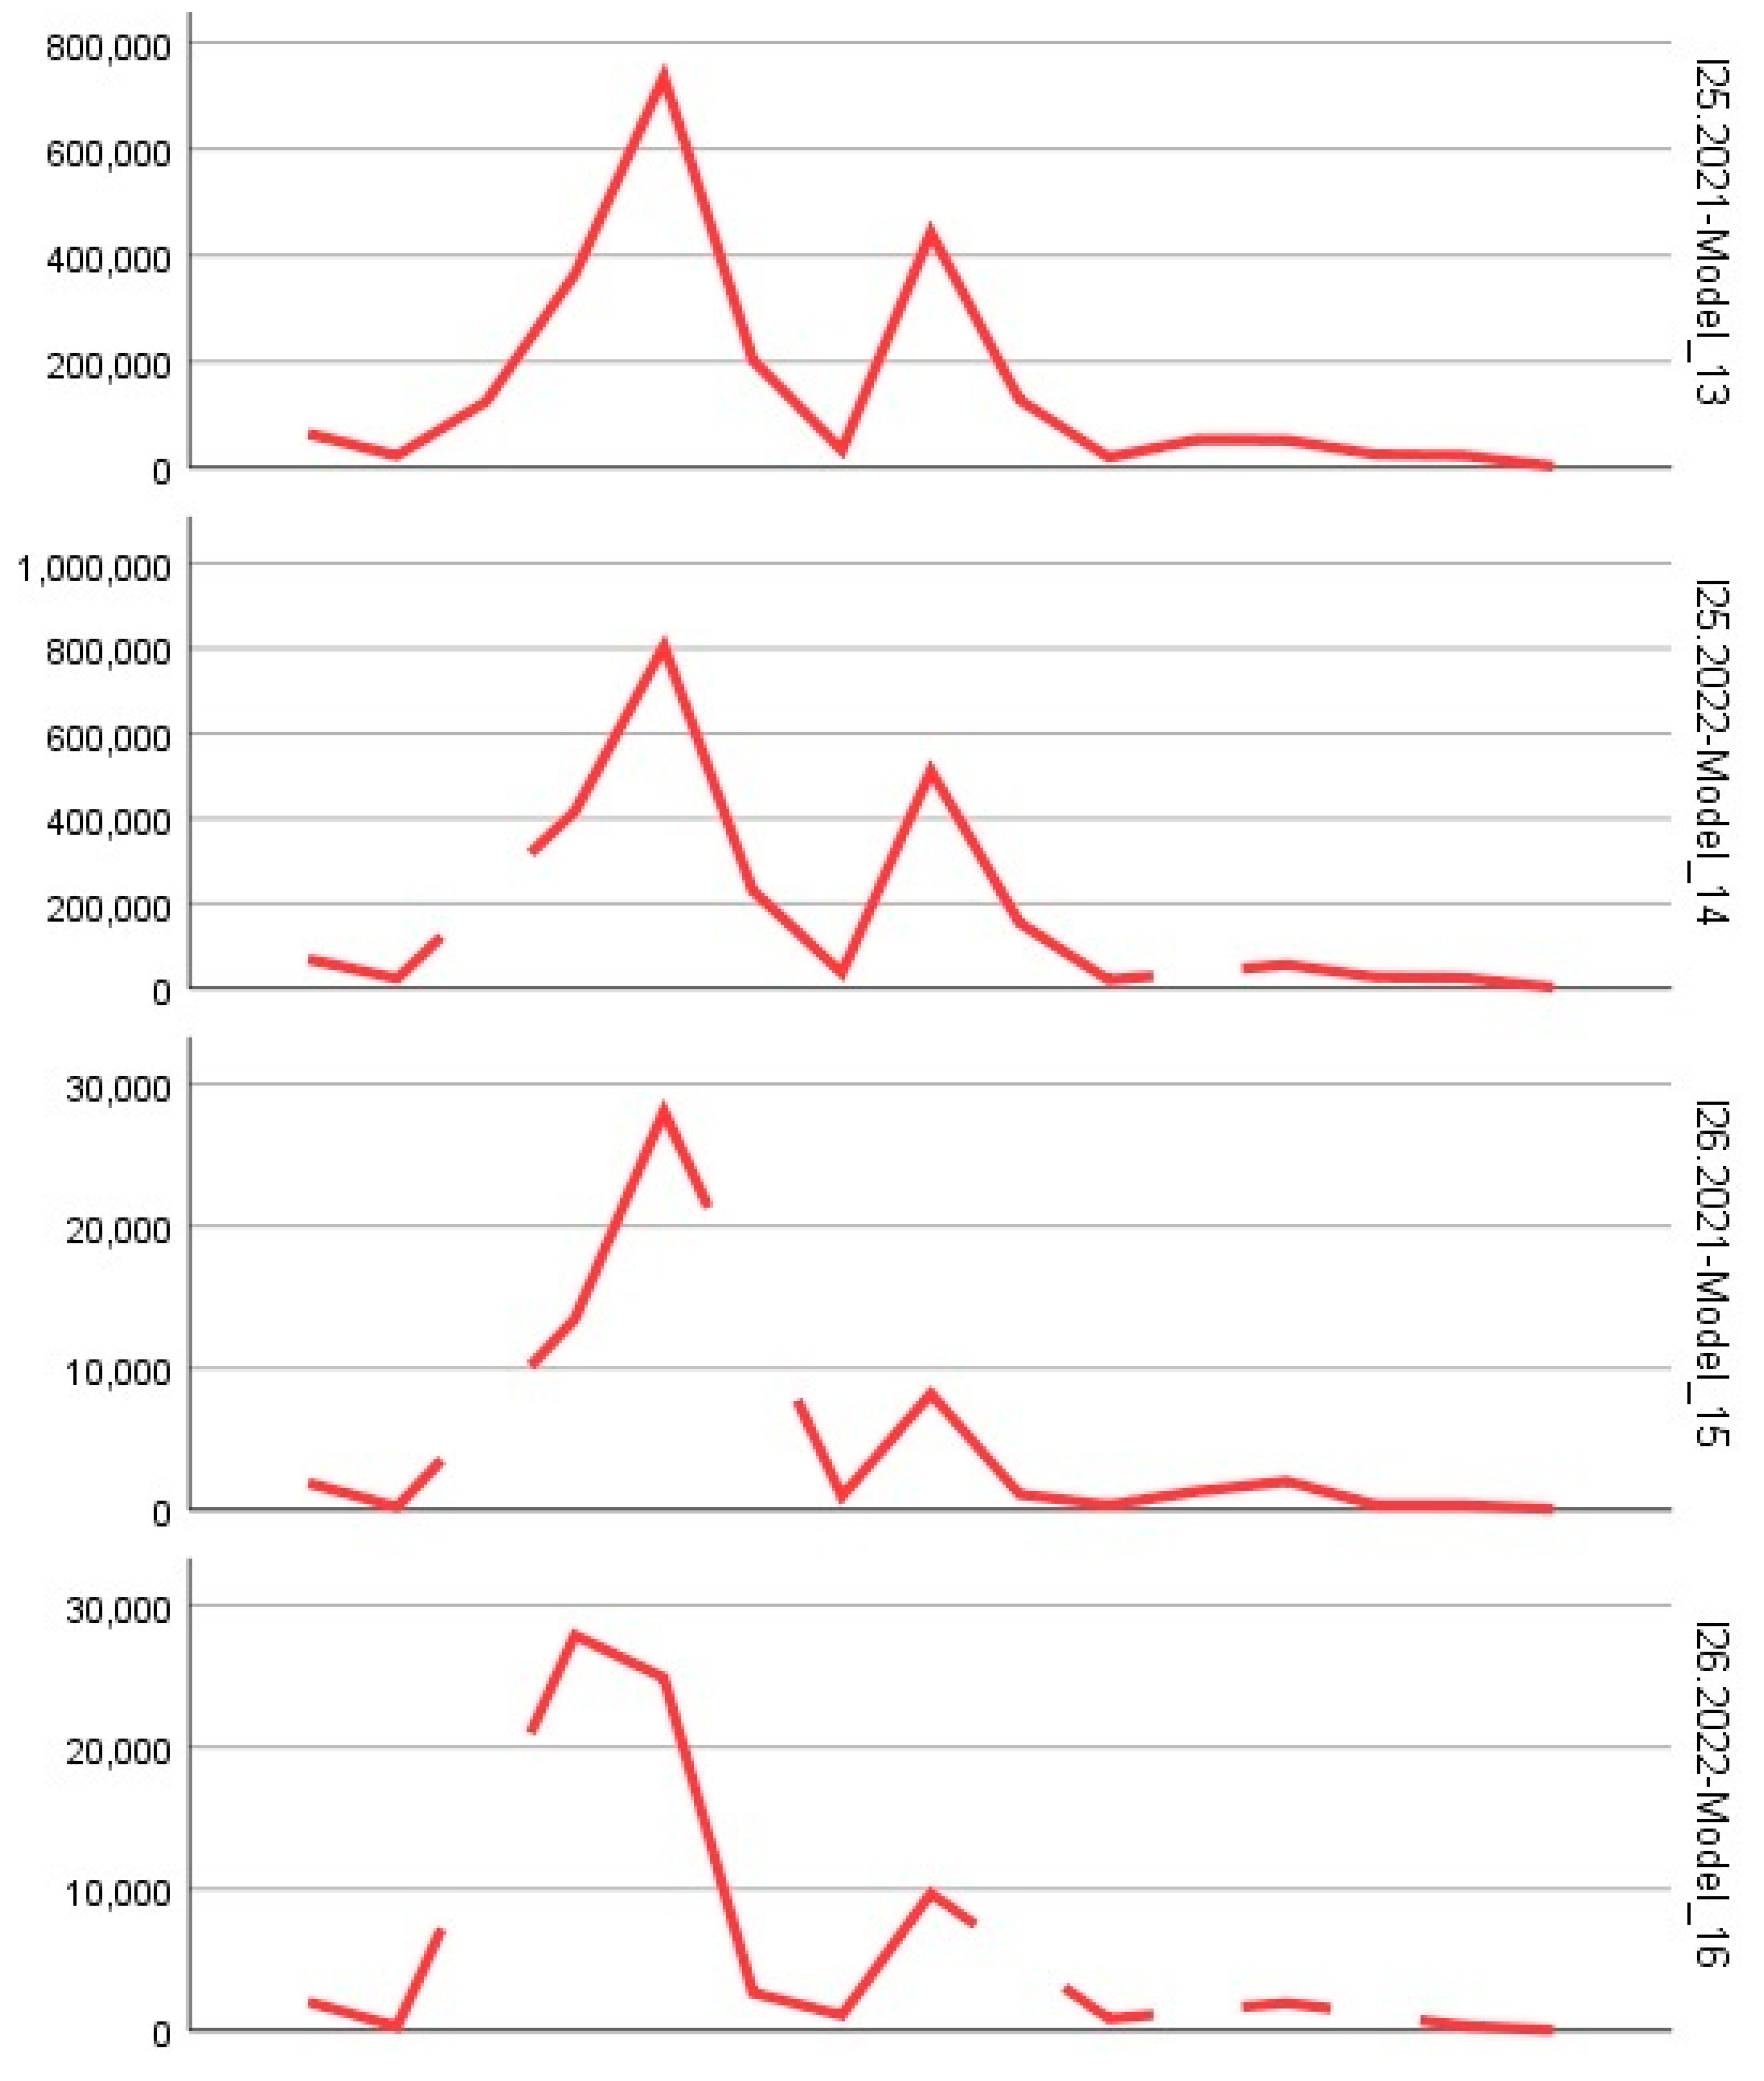
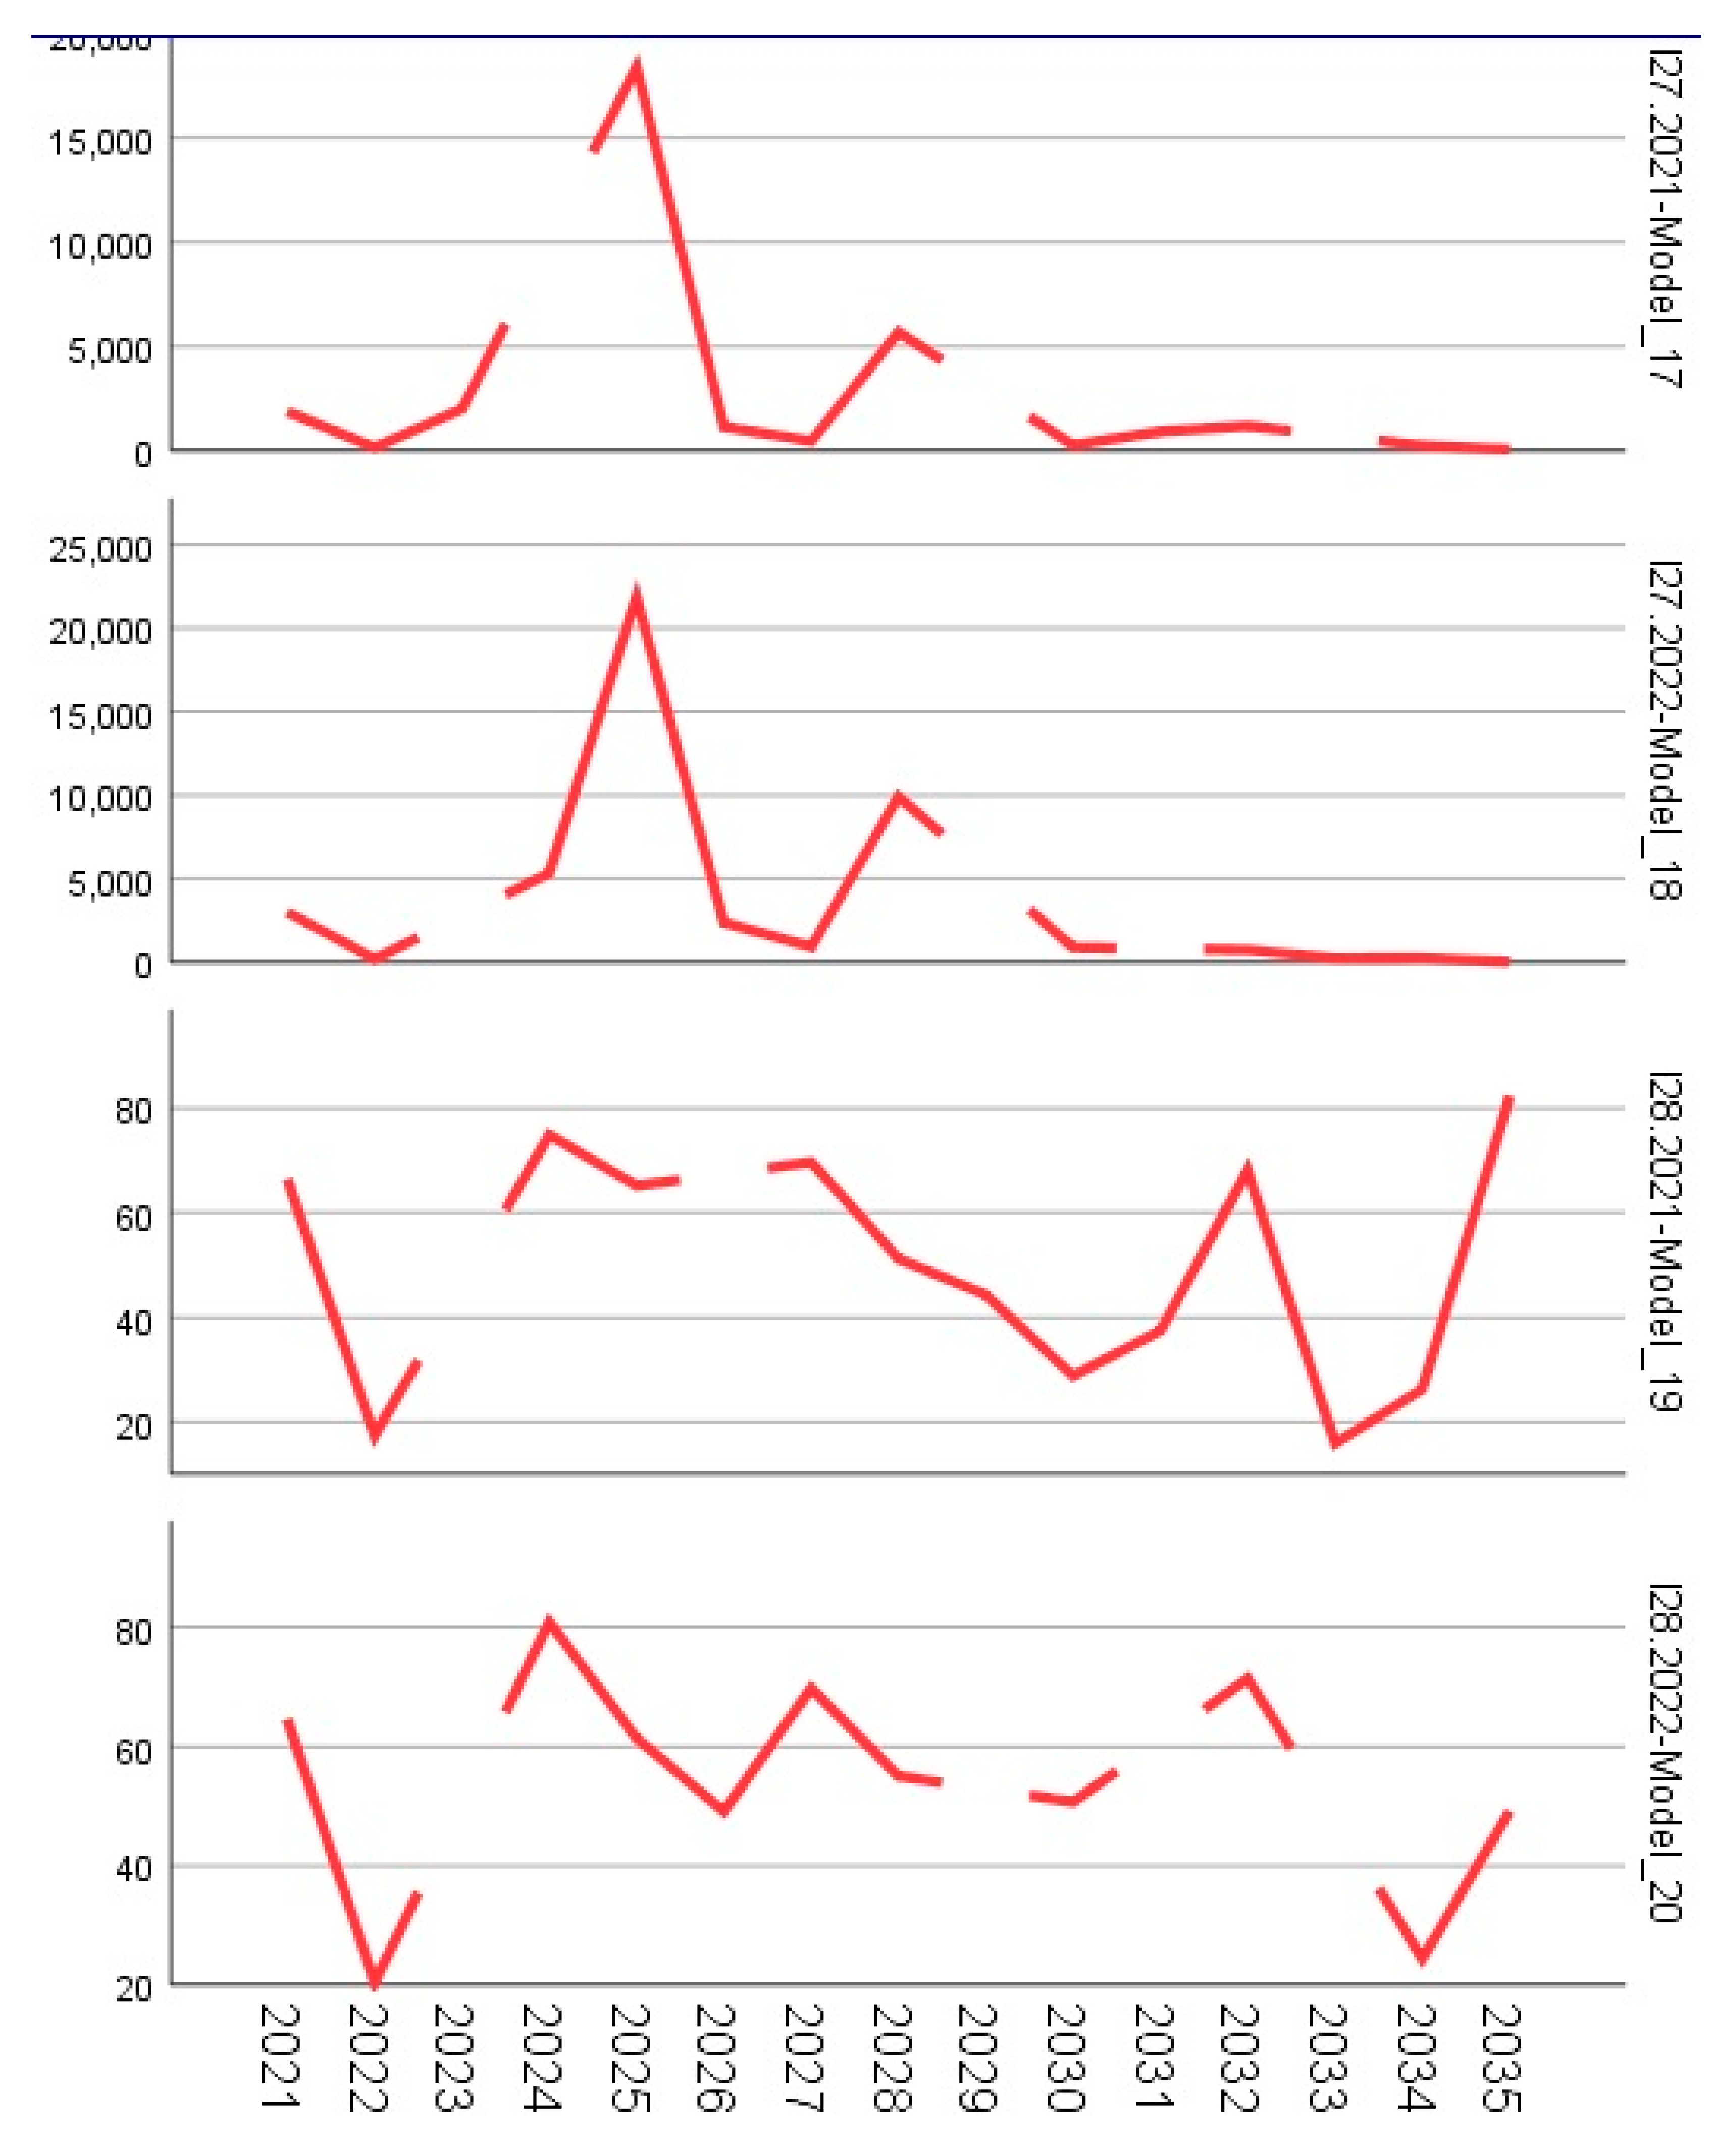

Table 1.
Forecasting analysis for mountain entrepreneurship in the food sub-sectors and tourism related to European countries during the period discussed.
Table 1.
Forecasting analysis for mountain entrepreneurship in the food sub-sectors and tourism related to European countries during the period discussed.
| Statistical Fit | Mean | SE | Maximum | 95th percentile |
|---|---|---|---|---|
| Stationary R- squared | 0.021 | 0.140 | 0.981 | 0.027 |
| R -squared | 0.007 | 0.040 | 0.274 | 0.027 |
| RMSE | 25303.099 | 69640.544 | 304954.426 | 253685.368 |
| Mapei | 447,030 | 524,142 | 2584,671 | 1584,081 |
| MaxAPE | 4088,398 | 5043.819 | 22357.053 | 14171.182 |
| MFA | 18909.540 | 52531.483 | 235065.349 | 191081.738 |
| MaxAE | 64359.738 | 175383.026 | 712179.692 | 644758.985 |
| Normalized BIC | 11,442 | 8,577 | 25,453 | 25,087 |
Table 2.
Forecast models for each Eurostat mountain indicator reported for the 2021/2022 reference periods.
Table 2.
Forecast models for each Eurostat mountain indicator reported for the 2021/2022 reference periods.
| Model | Estimate | SE | t | Sig. |
|---|---|---|---|---|
| I1.2021-Model_1 | 45590.533 | 15361.125 | 2,968 | .010 |
| I1.2022-Model_2 | 46544.600 | 15647.446 | 2,975 | .010 |
| I2.2021-Model_3 | 3642,933 | 1242,071 | 2,933 | .011 |
| I2.2022-Model_4 | 4366,538 | 1539.132 | 2,837 | .015 |
| I3.2021-Model_5 | 1,697 | .192 | 8,828 | .000 |
| I3.2022-Model_6 | 1,790 | .279 | 6,418 | .000 |
| I4.2021-Model_7 | 1,000 | .000 | . | . |
| I4.2022-Model_8 | 1,000 | .000 | . | . |
| I5.2021-Model_9 | 3013,800 | 1099,372 | 2,741 | .016 |
| I5.2022-Model_10 | 4091,000 | 1565,708 | 2,613 | .023 |
| I6.2021-Model_11 | 61,586 | 19,390 | 3,176 | .007 |
| I6.2022-Model_12 | 66,352 | 22,867 | 2,902 | .014 |
| I7.2021-Model_13 | 2681.133 | 888,389 | 3,018 | .009 |
| I7.2022-Model_14 | 2866,538 | 1066,519 | 2,688 | .020 |
| I8.2021-Model_15 | 6,249 | .494 | 12,637 | .000 |
| I8.2022-Model_16 | 6,305 | .479 | 13,176 | .000 |
| I10.2021-Model_17 | 81,692 | 20,007 | 4,083 | .002 |
| I10.2022-Model_18 | 119,800 | 52,417 | 2,286 | .048 |
| I12.2021-Model_19 | 16,237 | 1,289 | 12,592 | .000 |
| I12.2022-Model_20 | 19,884 | 2,026 | 9,813 | .000 |
| I13.2021-Model_21 | 8,881 | .828 | 10,726 | .000 |
| I13.2022-Model_22 | 9,880 | .912 | 10,831 | .000 |
| I14.2021-Model_23 | 7,355 | .649 | 11,333 | .000 |
| I14.2022-Model_24 | 10,005 | 1,399 | 7,152 | .000 |
| I15.2022-Model_25 | 1,259 | 1,581 | .796 | .441 |
| I16.2021-Model_26 | 195035,000 | 67790.737 | 2,877 | .012 |
| I16.2022-Model_27 | 227685.308 | 84579.125 | 2,692 | .020 |
| I17.2021-Model_28 | 7398.214 | 3121,949 | 2,370 | .034 |
| I17.2022-Model_29 | 9432,333 | 4027.219 | 2,342 | .039 |
| I18.2021-Model_30 | 3,759 | .335 | 11,227 | .000 |
| I18.2022-Model_31 | 3,673 | .455 | 8,071 | .000 |
| I19.2021-Model_32 | 5136.071 | 2281,184 | 2,251 | .042 |
| I19.2022-Model_33 | 7243.231 | 3152.118 | 2,298 | .040 |
| I20.2021-Model_34 | 8962,643 | 3170,816 | 2,827 | .014 |
| I20.2022-Model_35 | 9655,750 | 3895,591 | 2,479 | .031 |
| I21.2021-Model_36 | 6307.385 | 2499,732 | 2,523 | .027 |
| I21.2022-Model_37 | 6747.462 | 2664,882 | 2,532 | .026 |
| I22.2021-Model_38 | 2,820 | .311 | 9,081 | .000 |
| I22.2022-Model_39 | 3,709 | .542 | 6,839 | .000 |
| I23.2021-Model_40 | 4,669 | .344 | 13,583 | .000 |
| I23.2022-Model_41 | 4,513 | .346 | 13,039 | .000 |
| I24.2021-Model_42 | 37,032 | 6,935 | 5,340 | .000 |
| I25.2021-Model_44 | 153193.733 | 53674.479 | 2,854 | .013 |
| I25.2022-Model_45 | 183170.692 | 68720.140 | 2,665 | .021 |
| I26.2021-Model_46 | .610 | .245 | 2,495 | .028 |
| I26.2022-Model_47 | 6512,545 | 3076,317 | 2,117 | .060 |
| I27.2021-Model_48 | 2709,583 | 1491,393 | 1,817 | .097 |
| I27.2022-Model_49 | 3806.917 | 1839,800 | 2,069 | .063 |
| I28.2021-Model_50 | 49,818 | 6,363 | 7,829 | .000 |
| I28.2022-Model_51 | 54,264 | 5,638 | 9,624 | .000 |
Disclaimer/Publisher’s Note: The statements, opinions and data contained in all publications are solely those of the individual author(s) and contributor(s) and not of MDPI and/or the editor(s). MDPI and/or the editor(s) disclaim responsibility for any injury to people or property resulting from any ideas, methods, instructions or products referred to in the content. |
© 2025 by the authors. Licensee MDPI, Basel, Switzerland. This article is an open access article distributed under the terms and conditions of the Creative Commons Attribution (CC BY) license (http://creativecommons.org/licenses/by/4.0/).
Copyright: This open access article is published under a Creative Commons CC BY 4.0 license, which permit the free download, distribution, and reuse, provided that the author and preprint are cited in any reuse.


