
Submitted:
20 February 2025
Posted:
24 February 2025
You are already at the latest version
Abstract
Foot hyperpronation is a common anatomical misalignment that may contribute to the development of both localized and distant musculoskeletal overuse injuries. Advancements in modern technology may enable the detection of biomechanical changes in dynamic conditions that cannot be captured through conventional foot alignment assessments. The study aimed to investigate potential differences in spatiotemporal, dynamic and center of pressure (COP)-related gait parameters, between individuals with foot hyperpronation (n=21) and those with a neutral foot type (n=21) under various walking conditions, using an instrumented treadmill. These conditions included walking downhill at −20% slope at 3.5 km·h-1, and at −10% slope at 5.0 km·h-1, level (0%) at 5.0 km·h-1, and uphill at +10% slope at 3.5 km·h-1 and +20% slope at 2.5 km·h-1, each lasting five minutes. The results showed no significant differences in stride length and time, foot rotation, step width, cadence, or gait phase durations between the two groups. However, individuals with hyperpronated feet exhibited a more forward and mediolaterally displaced COP, higher vertical ground reaction forces (vGRFs) at the midfoot, and lower vGRFs at the lateral forefoot. Instrumented treadmills enable clinicians and sports scientists to detect specific traits in individuals with foot hyperpronation, which would otherwise go undetected through static assessments.
Keywords:
Spatiotemporal parameters
; COP position
; gait analysis
; vertical ground reaction forces
; capacitive sensors
1. Introduction
Close kinetic chain foot hyper - or over - pronation refers to a common misalignment of the foot characterized by an excessive inward rolling of the foot, often accompanied by a flattening of the medial arch during weight-bearing activities [1]. This misalignment primarily affects the subtalar joint, the main site of normal pronation [2], and influences all joints distal and proximal to it, as the foot, according to the regional interdependence model is part of an interconnected skeletal system of muscles, tendons, and fascia, linking distant body regions [3]. Foot hyperpronation is typically associated with altered movements of joints located centrally to the subtalar joint, including internal rotation of the tibia, and femur, and pelvis as well as anterior pelvic tilt, while distally, it is linked to hallux valgus [4,5,6]. These biomechanical changes increase stress within the joints of the lower extremity kinetic chain and related structures, often causing musculoskeletal pain due to excessive strain on the surrounding tissues. Ultimately, these changes may predispose individuals to overuse injuries such as plantar fasciitis, shin splints, and knee pain [6,7,8,9,10], exacerbating functional impairments and reducing mobility. Improper positioning of lower limb joints can also significantly alter walking and running patterns, compromising overall biomechanics and increasing the long-term risk of musculoskeletal pathologies such as knee osteoarthritis [11].
Assessing foot hyperpronation is a standard component of clinical evaluation for many healthcare providers, aiming to identify potential injury causes or develop preventive intervention programs. This process often includes evaluating the foot's static posture and alignment through various methods [12], which may not be fully capable of capturing the dynamic nature of foot hyperpronation during functional activities such as gait, where movements occur as part of complex joint motion. Such challenges have been addressed through kinematic analysis methods [13,14,15,16,17], which provide accurate measurements but at the cost of being time-consuming, expensive, and requiring specialized equipment and expertise for data interpretation. In recent years, the introduction of advanced methods, such as sensor technology [18], has provided the necessary validity and reliability in gait analysis [19], comparable to more demanding techniques used in kinematic and kinetic gait analysis, especially in the field of healthcare and medicine [20]. These sensors typically form matrices embedded in insoles, mats, or platforms [18], allowing for the generation of detailed spatial maps of the vertical ground reaction forces (vGRFs) exerted across different regions of the foot during various activities. By operating at high sampling rates [21], they can simultaneously detect rapid changes in vGRFs over time during dynamic movements. Furthermore, if the experimental setup allows, they can also yield information regarding spatiotemporal gait parameters using appropriate algorithms [22]. In this context, some researchers have conducted gait analysis in individuals with hyperpronated feet by recording real-time measurements of the forces exerted by the foot, either using insoles during shod overground walking [23], or during shod and unshod walking on pressure mats [24,25]. Despite the ability to accurately analyze gait, the use of insoles and pressure mats lacks the capability to control gait characteristics and presents several limitations, including fitting and footwear design/type issues (for insoles), as well as space requirements (for mats). Other investigators, in fact, the majority of them, have assessed overground walking using pressure sensor networks with matrices embedded within single-foot pressure platforms [26,27,28,29]. These small-sized platforms are designed to accommodate only one foot at a time, making them suitable for dynamic activities like gait analysis, but not for running analysis. Their focus is often restricted to the stance phase of gait, omitting data from the swing phase and the complete gait cycle and require multiple trials to analyze both feet, increasing variability in measurements. Furthermore, they can alter natural movement patterns as participants must adjust their steps to align with the plate.
By integrating sensor matrices under the running belt of treadmills, also known as instrumented treadmills, clinicians and researchers have been given the opportunity to analyze gait and movement in a manner biomechanically comparable to overground walking [30]. This approach offers detailed spatial, temporal, and dynamic data over complete gait cycles, enabling the identification of inefficiencies or asymmetries by allowing the simultaneous measurement of both steps without requiring users to adjust their natural gait. Additionally, by controlling and standardizing test condition variables such as speed and slope of gait, this method is particularly beneficial for individuals with significant joint misalignments, such as foot hyperpronation. Locomotion on inclined surfaces at varying speeds may impose different demands on the musculoskeletal system compared to level walking, requiring postural adjustments and increased involvement of lower body muscles [31,32]. Yet, studies utilizing instrumented treadmills for gait analysis in individuals with joint misalignments, such as foot hyperpronation, are lacking, and those that do exist often conduct gait analysis on conventional treadmills, relying on pressure-sensing insoles [33] or optoelectric systems [34] for data collection.
The aim of the current study was to investigate the spatial, temporal, and dynamic characteristics of gait in uninjured individuals with foot hyperpronation across various slopes and speeds, utilizing the benefits provided by an instrumented treadmill. By examining these characteristics, this research seeks to advance clinical and sports science practices, providing valuable insights into optimizing performance, preventing injuries, and enhancing rehabilitation.
2. Materials and Methods
2.1. Sample
The study included 42 healthy male (n=22) and female students (n=20) from the local University’s Department of Physical Education and Sport Science. Participants were selected based on their foot type, classified as either neutral (n=21) or hyperpronated (n=21), determined using the Foot Posture Index-6 scale [35]. Individuals with pain, recent lower-limb injuries or surgeries, or conditions affecting the lumbar spine were excluded from the study. Additionally, participants were excluded if they had unilateral foot hyperpronation, unilateral or bilateral foot over-supination, a leg length discrepancy >0.5 mm [36], or trunk rotation >5° during the Adams test (indicative of idiopathic scoliosis [37] (Table 1).
2.2. Testing Procedure
Volunteers visited the department's physical therapy facilities on two separate occasions. During the first visit, anthropometric measurements, including body mass and height, were recorded. Additionally, a comprehensive musculoskeletal assessment was conducted to identify any characteristics that might render participants ineligible for the study. The musculoskeletal assessment included evaluations of leg length [38], ankle dorsiflexion range of motion bilaterally with the weight-bearing lunge test [39], and assessments for scoliosis [37].
Volunteers who were deemed eligible for participation in the study were required to visit the facilities for a second session, during which they performed treadmill walking in random order at a 0% slope (level) at 5.0 km·h-1 (1.39 m·s-1), uphill slopes of +10% and +20% at 3.5 km·h-1 (0.97 m·s-1) and 2.5 km·h-1 (0.69 m·s-1), respectively, and downhill slopes of −10% and −20% at 5.0 kg·h-1 (1.39 m·s-1) and 3.5 kg·h-1 (0.97 m·s-1), respectively. The variation in speeds between conditions reflected natural adaptations in walking speed to the slope of the terrain as determined by Tobler [40,41]. Each walking condition lasted 5 minutes, with data collected during the final 4 minutes to allow participants to accommodate to the respective condition. Before testing, participants completed a 7-minute familiarization session at a speed of 5.0 km·h-1 on a level treadmill surface to become familiar with the treadmill equipment [42]. A 5-minute rest was allowed after the familiarization session, and 5-minute breaks were provided between walking conditions to prevent fatigue. However, additional rest was given if a participant's heart rate, monitored using a Polar H10 heart rate monitor (Polar Electro, Kempele, Finland), exceeded 60% of their maximum heart rate (HRmax = [220 − age] × 0.6) prior to the start of each waking condition. This threshold was consistent with the literature suggesting that such intensity levels are associated with high-demand activities and reduced postural control [43], which could potentially affect normal walking performance, particularly in conditions of extreme incline or decline on the treadmill. Participants were instructed to wear comfortable sportswear and walk unshod with fitted socks to reduce friction between the plantar surface and the treadmill belt. They were also advised to avoid strenuous physical activity prior to testing.
2.3. Instrumentation
Walking conditions were performed using an instrumented treadmill (Pluto® Med, h/p/cosmos® Sports & Medical GmbH, Nussdorf–Traunstein, Germany). The treadmill featured a walking surface measuring 150 cm (L) × 50 cm (W) and was equipped with a platform embedded beneath the surface. This platform contained a matrix of 7,168 capacitive pressure sensors (FDM-THPL-M-3i, Zebris Medical GmbH, Isny, Germany) that are arranged in columns and lines running closely next to each other and distributed across an area of 108.4 cm (L) × 46.4 cm (W) (Resolution of 1.4 sensors·cm−2). The instrumented treadmill featured a speed range of up to 18.0 km·h-1 for uphill walking and up to 5.0 km·h−1 for downhill walking. Its surface supported slope adjustments between 0.1% and 20.0%. Forward belt motion facilitated walking on level and uphill slopes, while reverse belt motion enabled downhill walking. The treadmill was connected to a desktop computer, enabling real-time data transfer as well as storage for subsequent processing and analysis. Additionally, the software provided by the manufacturer enabled remote adjustment and control of the parameters used in the research protocol. The system recorded data at a frequency of 240 Hz. The sensors’ threshold was preset by the manufacturer at 1 N·cm−2.
2.4. Measurement Outcomes
Gait analysis was conducted based on spatial parameters, including stride length, step width, and foot rotation (i.e., the angle between the longitudinal axis of the foot and the direction of walking), as well as temporal parameters such as stride time and cadence.
Cross-group comparisons were performed after normalizing the data by calculating dimensionless numbers for stride length (), stride time ( and cadence (), using Hof’s scaling method, where the average leg length of both legs was used as the constant ( [44]. Stride length was normalized as stride time as and cadence as , where l, t, and f representing the participant’s stride length, stride time and cadence respectively, recorded under each walking condition [44]. The average length of both legs was also used to normalize step width, which was expressed as a percentage of leg length, similar to the approach used in a previous study that utilized stature as constant [13]. The durations of the stance phase and its sub-phases—load response, midstance, and pre-swing—as well as the swing phase of gait were assessed and reported as percentages of the total gait cycle duration. The stance and swing phases refer to the periods within a gait cycle when the foot is in contact with the ground and when it is not, respectively. The load response corresponded to the period between initial ground contact and lifting of the contralateral leg. Mid-stance was the period in which the contralateral leg swings in the air and the body's center of gravity is transported over the loaded foot. The pre-swing includes the period within a gait cycle whose beginning is defined by heel strike of the contralateral side of the body and whose end is defined by toe-off of the side of the body under consideration [45].
The anteroposterior and mediolateral location of the center of pressure (COP) was identified as the intersection point on the cyclogram—a diagram created by connecting the COP trajectories from the forefoot of one side to the rearfoot of the contralateral side during selected gait cycles over time [45].
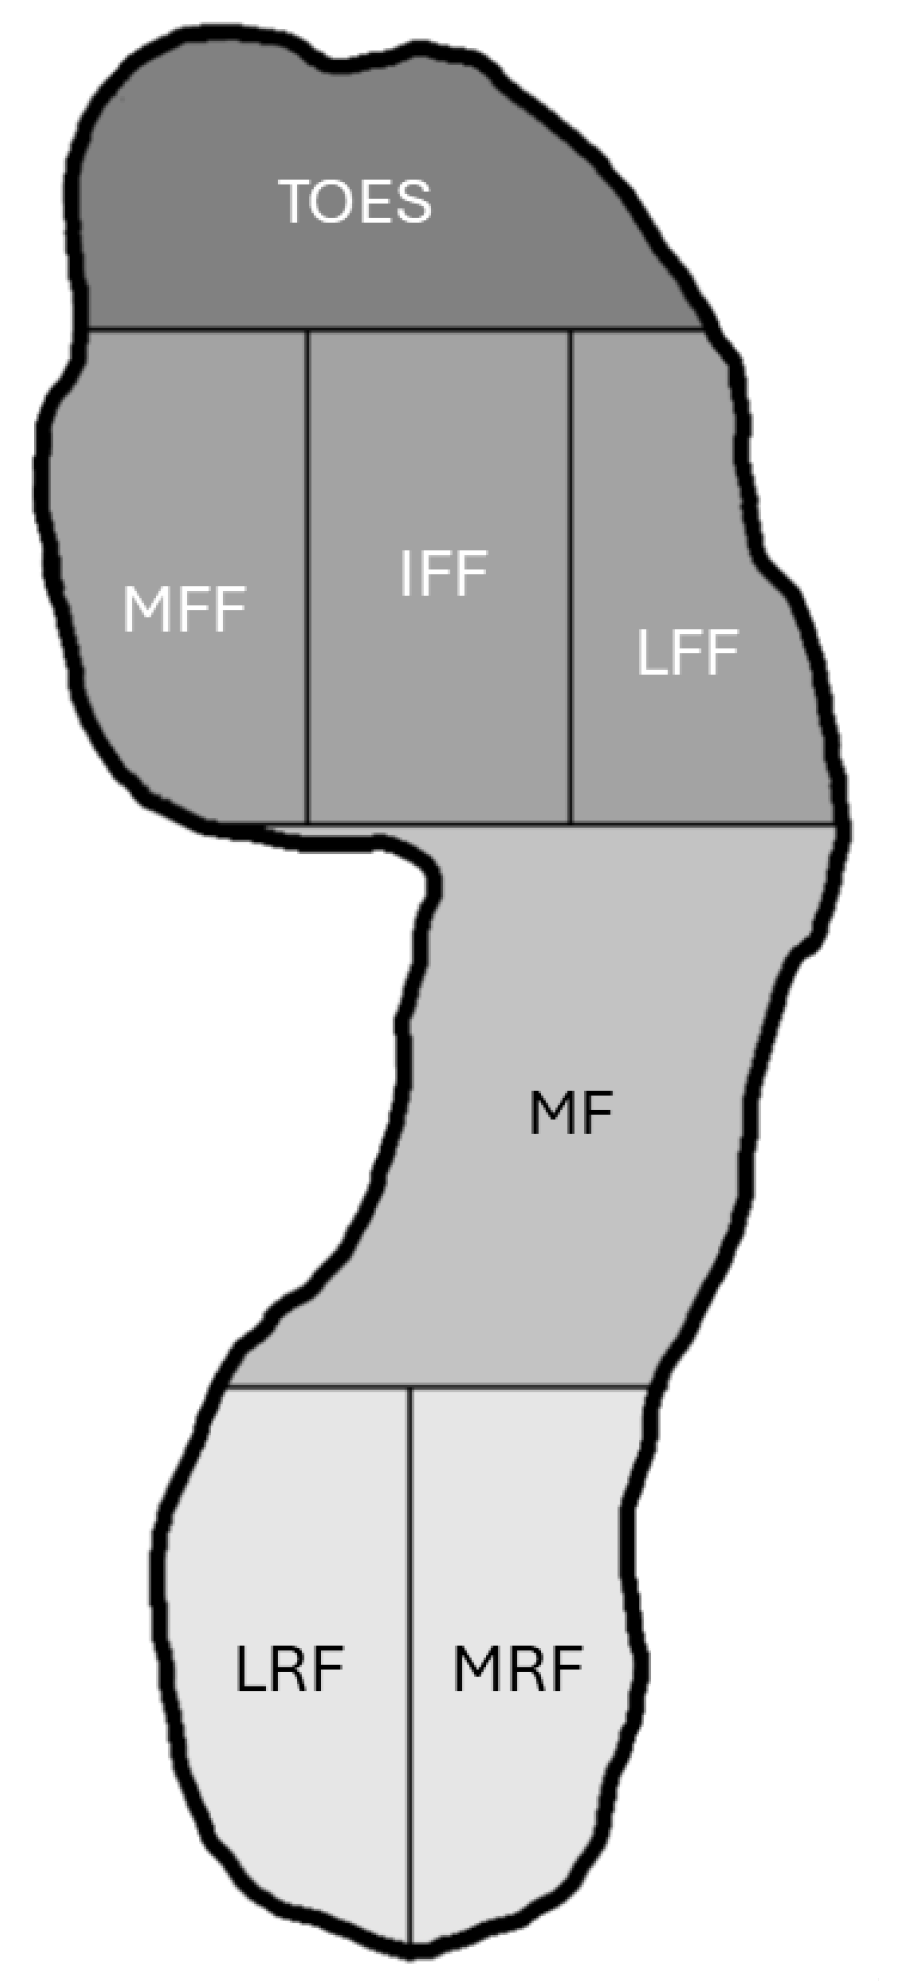
Additionally, the maximum vGRFs exerted on seven distinct plantar surface regions (zones) of the foot were recorded across all walking conditions. These regions were defined as follows: (i) the rearfoot (rear 30% of the foot), subdivided into two equal regions—the medial and lateral rearfoot; (ii) the midfoot (middle 30% of the foot); and (iii) the forefoot (front 40% of the foot), further divided into the toe region (comprising half the length of the forefoot), and the metatarsal region, subdivided vertically into three equal parts: the medial forefoot (first metatarsal), the central forefoot (second and third metatarsals), and the lateral forefoot (fourth and fifth metatarsals) (Figure 1) [45,46].
Figure 1.
Regions of the plantar surface of the foot analyzed for vGRFs. MRF = medial rearfoot; LRF = lateral rearfoot; MF = midfoot; MFF = medial forefoot; IFF = inner forefoot; LFF = lateral forefoot.
Figure 1.
Regions of the plantar surface of the foot analyzed for vGRFs. MRF = medial rearfoot; LRF = lateral rearfoot; MF = midfoot; MFF = medial forefoot; IFF = inner forefoot; LFF = lateral forefoot.
Results were reported as averages for the measured variables derived from all steps taken across each gait condition. For variables involving both limbs (e.g., duration of gait phases, vGRFs), the average value of the right and left limbs was used for statistical analysis.
2.5. Reliability Study
The reliability of spatial, temporal, and dynamic gait parameters as well as the location of COP, was assessed in a subset of 22 participants from the original sample of 42 by repeating the measurements one week after the initial testing under identical gait conditions. Intraclass Correlation Coefficients (ICC 3, k) were used to quantify reliability, employing a two-way mixed-effects model to evaluate absolute agreement across sessions [47]. ICC values >0.5 indicated poor reliability, those between 0.5 and 0.75 suggested moderate reliability, values from 0.75 to 0.9 represented good reliability, and values <0.9 reflected excellent reliability [47].
The ICC values for absolute agreement across all walking conditions were good to excellent, ranging from 0.76 to 0.99 for the spatial variables, 0.76 to 0.97 for the temporal variables, 0.77 to 0.98 for the duration of gait phases, 0.78 to 0.96 for the location of COP, and 0.91 to 1.00 for the vGRFs exerted on various plantar regions of the foot.
2.6. Statistical Analysis
The normality of the data distribution was assessed using the Shapiro–Wilk test and by visually inspecting Q-Q and box plot graphs. Differences between the two groups regarding anthropometric measurements were assessed using independent samples t-tests. Differences in spatiotemporal parameters and gait phase durations between groups (hyperpronated vs. neutral foot type; between-subjects factor) and walking conditions (slope/speed condition; within-subjects factor), as well as the group-by-walking condition interaction, were assessed using a mixed-design two-way ANOVA. A mixed-design ANOVA also was used to assess differences in vGRFs between groups and plantar foot regions (LRF vs. MRF vs. MID vs. LFF vs. IFF vs. MFF vs. TOES), as well as the group-by-plantar foot region interaction. The sphericity of the data was determined based on Mauchly’s Test, where significant Greenhouse–Geisser correction was used. Pairwise comparisons were performed using the Bonferroni adjustment. The statistical analysis of the data was performed with SPSS 29.0 (IBM Corp, Armonk, NY, USA), while the significance level was set at the level of p ≤ 0.05.
3. Results
3.1. Spatial Parameters
Statistical analysis revealed no significant main effect of foot type on normilized stride length and step width, as well as foot rotation. Additionally, the interaction between foot type and walking condition was non-significant for these gait spatial parameters indicating similar responses of foot types across walking conditions (p > 0.05).
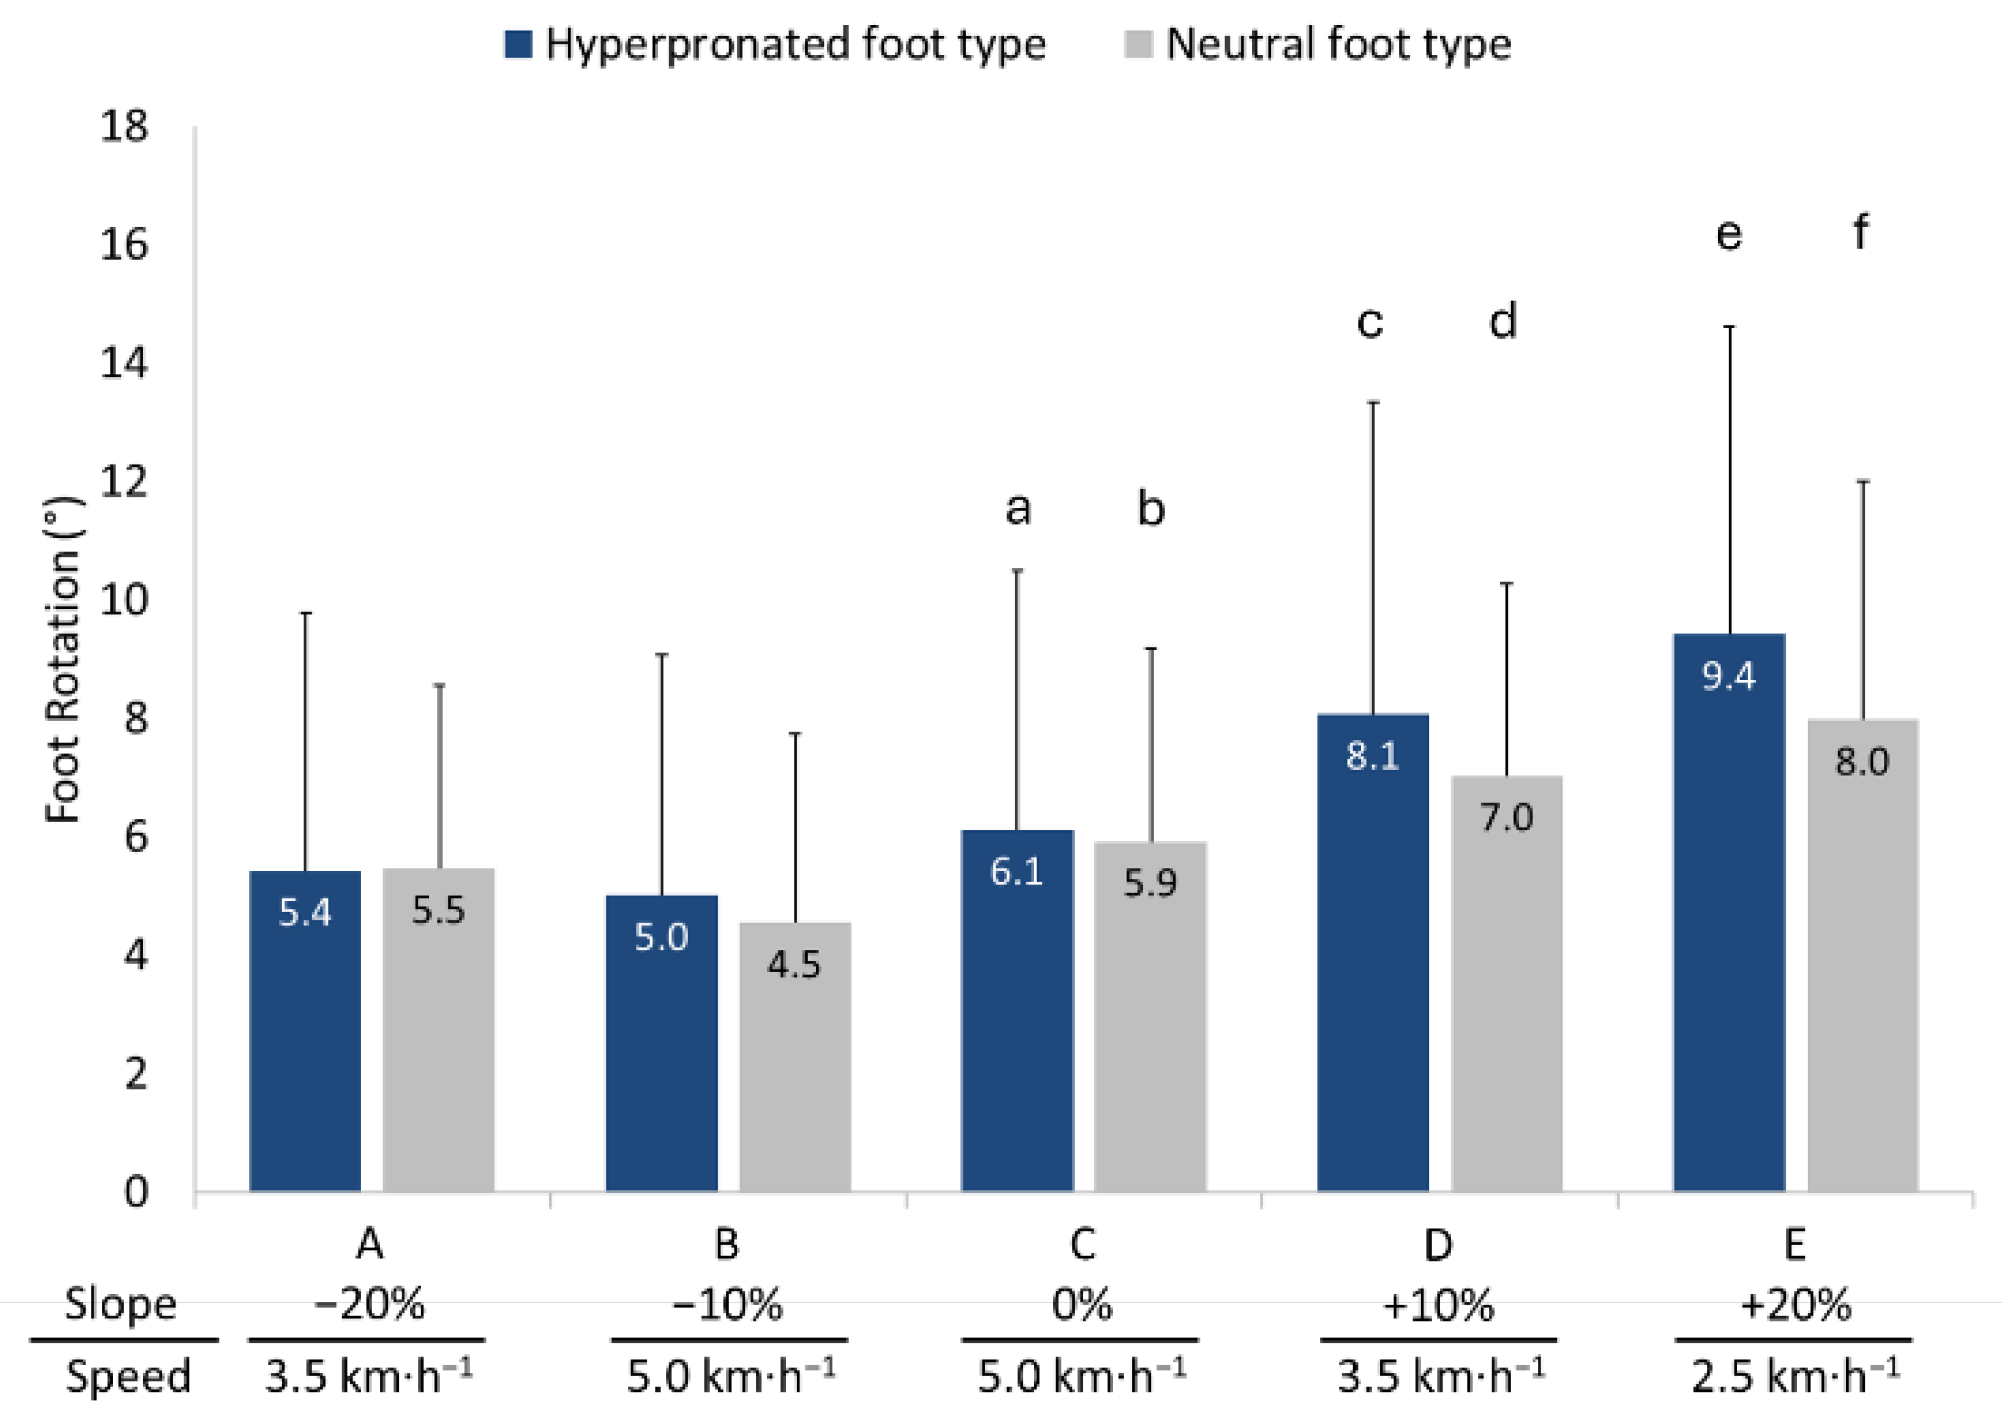
However, a significant main effect of walking condition was observed for normalized stride length (F = 747.566, p < 0.001, partial η² = 0.949), and step width (F = 50.985, p < 0.001, partial η² = 0.560), as well as for foot rotation (F = 44.417, p < 0.001, partial η² = 0.526), regardless of foot type. Stride length was shorter during both downhill and uphill walking conditions compared to level walking. Step width in general was greatest during downhill walking, followed by uphill walking, and level walking. In contrast, foot roation was greater during uphill compared to level and downhill walking. These findings suggest that walking conditions influenced these gait parameters consistently across both groups (please refer to Figures 1 and 2 for pairwise comparisons).
Figure 1.
Means and standard deviations (error bars) for normalized (a) stride length, and (b) step width in individuals with hyperpronated and neutral foot type during downhill (A and B), level (C) and uphill (D and E) walking. Significantly different compared to a A (p < 0.001); b A and B (p < 0.001); c A, B and C (p < 0.001); d B, C and D (p < 0.001); e C and D (p < 0.01); f A (p < 0.001) and B (p < 0.01) walking conditions.
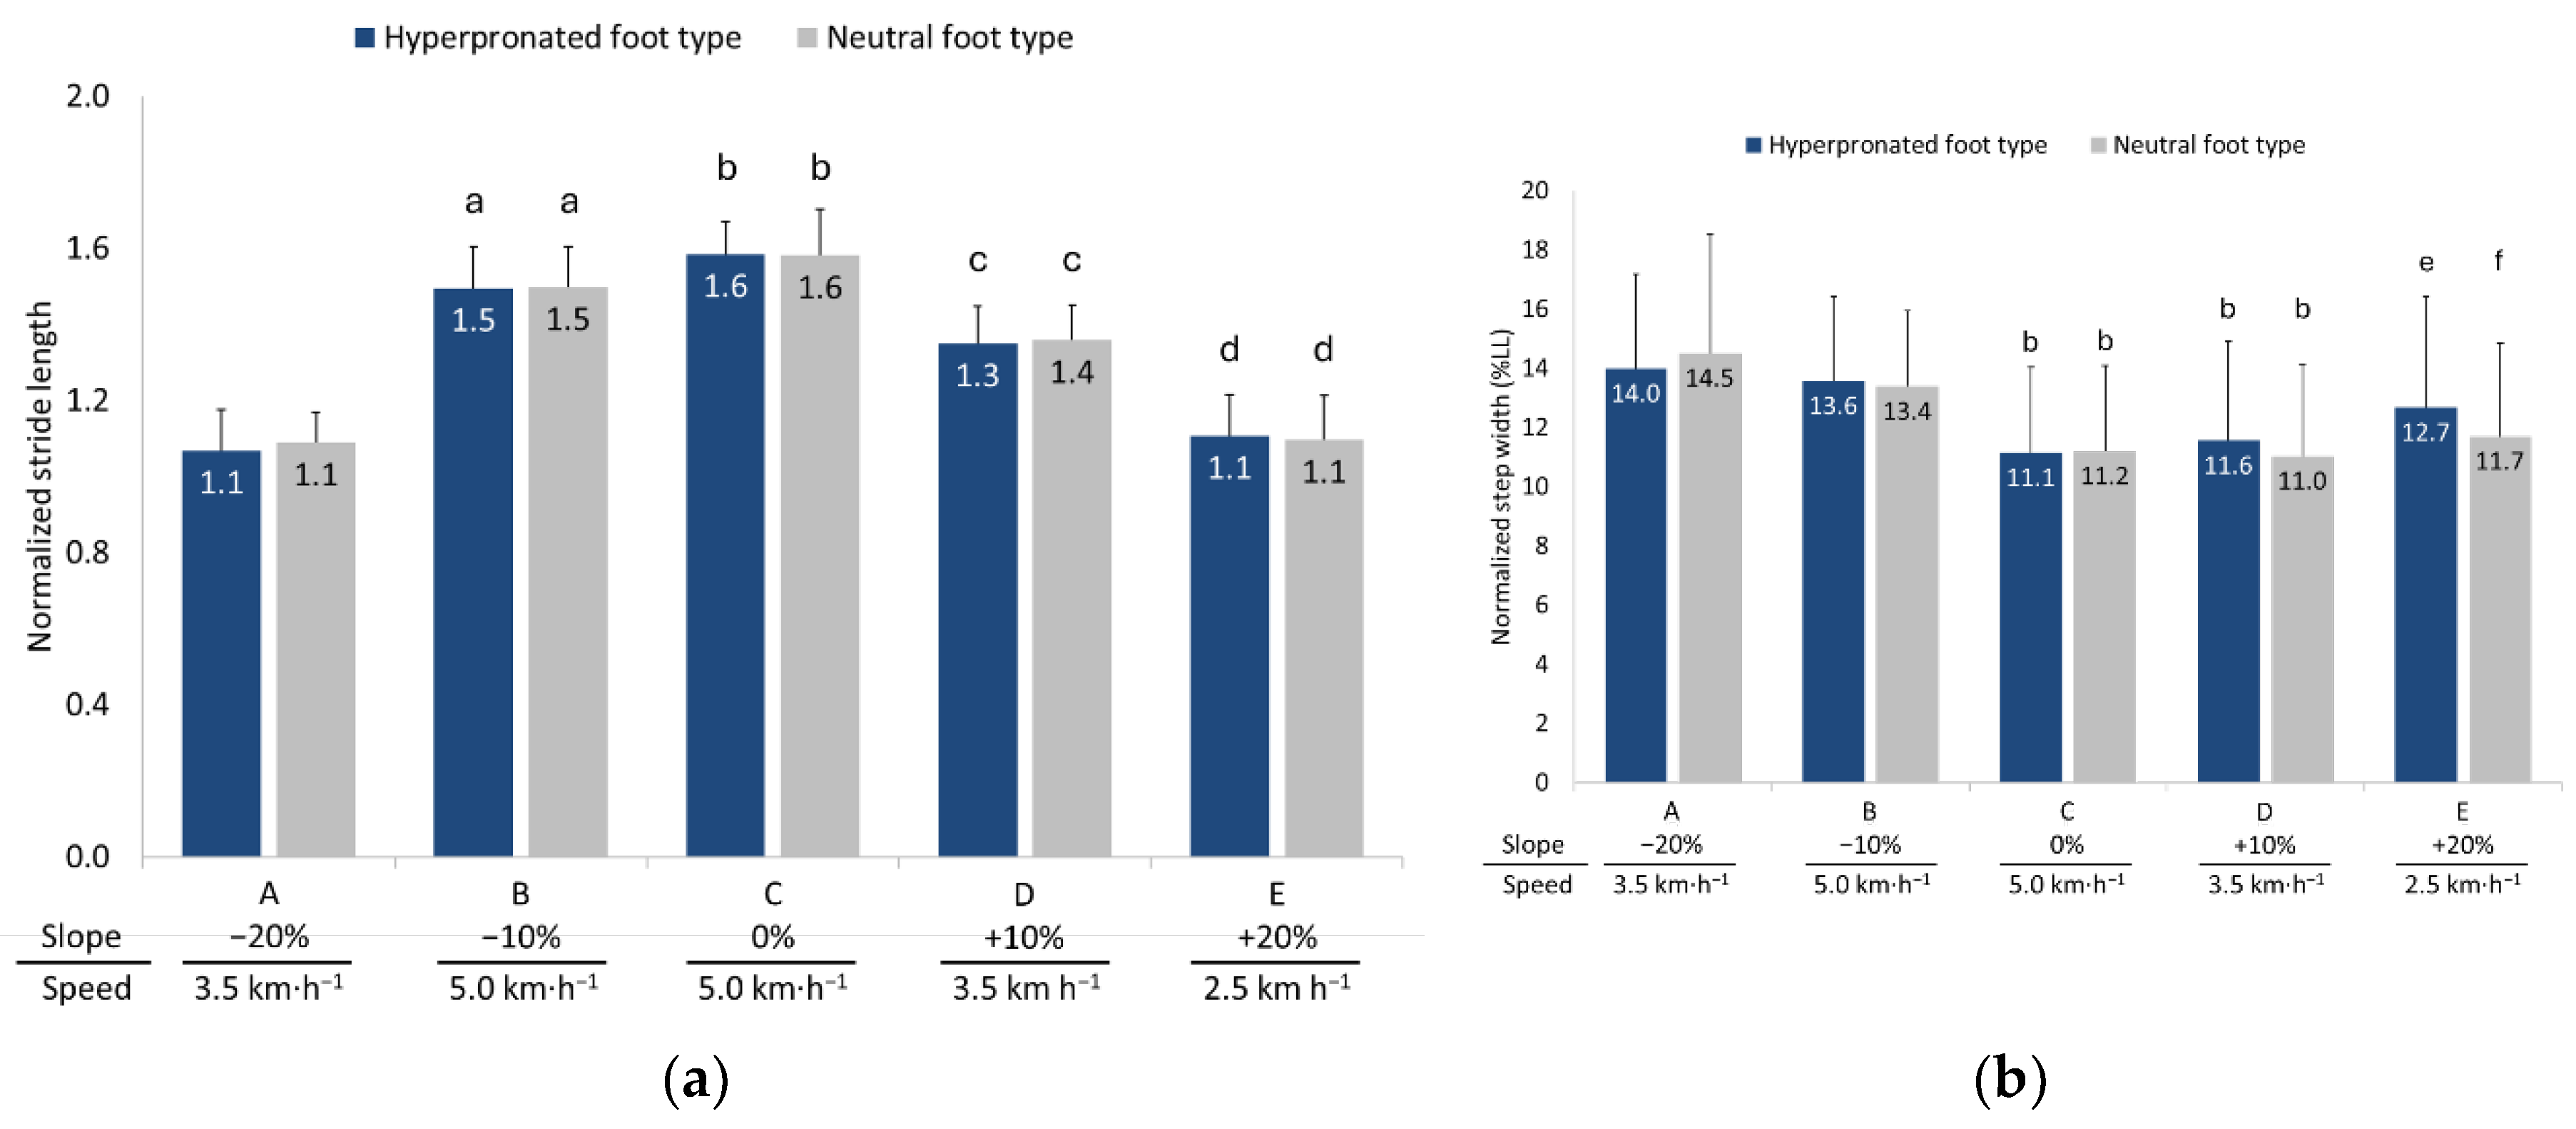
Figure 2.
Means and standard deviations (error bars) for foot rotation in individuals with hyperpronated and neutral foot type during downhill (A and B), level (C) and uphill (D and E) walking. Significantly different compared to a B (p < 0.01); b B (p < 0.001); c A, B and C (p < 0.001); d A (p < 0.05) and B (p < 0.001); e A, B, C and D (p < 0.001); f A and B (p < 0.001), C (p < 0.01) and D (p < 0.05) walking conditions.
3.2. Temporal Parameters
No significant differences were observed between individuals with hyperpronated and neutral foot types regarding normalized stride time and cadence. Furthermore, the interaction between foot type and walking conditions for these parameters was non-significant.
Statistical analysis revealed significant differences across walking conditions for stride time (F = 512.850, p < 0.001, partial η² = 0.928) and cadence (F = 755.967, p < 0.001, partial η² = 0.950), irrespective of foot type. More specifically, stride time was greater during uphill walking conditions compared to level and downhill walking conditions, while cadence was greater during downhill walking conditions compared to level and uphill walking conditions (please refer to Figure 3 for pairwise comparisons).
3.3. Gait Phase Analysis
Statistical analysis revealed no significant differences between individuals with hyperpronated and neutral foot types for the duration of the stance, load response, mid-stance, pre-swing, and swing phases. Similarly, the interaction between foot type and floor inclination was non-significant for the duration of these gait phases.
However, significant differences were observed between walking conditions for the stance phase (F = 638.945, p < 0.001, partial η² = 0.941), load response (F = 638.216, p < 0.001, η² = 0.941), mid-stance (F = 638.130, p < 0.001, η² = 0.941), pre-swing (F = 638.216, p < 0.001, η² = 0.941) and swing phase (F = 638.945, p < 0.001, partial η² = 0.941), irrespective of foot type (please refer to Table 2 for pairwise comparisons).
3.4. Vertical Ground Reaction Forces
A two-way repeated-measures ANOVA revealed a significant main effect of plantar foot region on vGRFs for walking condition A (F = 109.035, p < 0.001, η2 = 0.732), Β (F = 144.729, p < 0.001, η2 = 0.783), C (F = 150.539, p < 0.001, η2 = 0.790), D (F = 157.323, p < 0.001, η2 = 0.797), and E (F = 101.093, p < 0.001, η2 = 0.716). A significant interaction between plantar foot region and foot type on vGRFs was also observed for walking condition A (F = 10.903, p < 0.001, η² = 0.214), B (F = 12.830, p < 0.001, η² = 0.243), C (F = 7.958, p < 0.001, η² = 0.166), D (F = 9.134, p < 0.001, η² = 0.186), and E (F = 6.158, p < 0.001, η² = 0.133). Post hoc analyses using Bonferroni corrections showed that vGRFs exerted on the midfoot were significantly greater in individuals with hyperpronation compared to their counterparts with neutral foot type in all walking conditions. Additionally, vGRFs were significantly lower on the medial and lateral forefoot in the hyperpronated foot type group compared to the neutral foot type group (see Figure 4 for pairwise comparisons). There was no significant main effect of foot type on vGRFs across all walking conditions.
Statistical analysis revealed also significant differences in vGRFs across walking conditions for the lateral rearfoot (F = 89.337, p < 0.001, partial η² = 0.691), medial rearfoot (F = 116.274, p < 0.001, partial η² = 0.744), midfoot (F = 42.535, p < 0.001, partial η² = 0.515), lateral forefoot (F = 50.956, p < 0.001, partial η² = 0.560), inner forefoot (F = 329.992, p < 0.001, partial η² = 0.892), medial forefoot (F = 58.094, p < 0.001, partial η² = 0.592),and toes (F = 71.764, p < 0.001, partial η² = 0.642), regardless of foot type.
3.5. Anteroposterior and Mediolateral Locations of COP
Statistical analysis revealed significant main effect only of walking condition for both the anteroposterior (F = 113.587, p ≤ 0.001, partial η² = 0.740) and mediolateral (F = 15.838, p ≤ 0.01, partial η² = 0.284) locations of COP, irrespective of foot type. Additionally, the interaction between foot type and walking condition was significant for both the anteroposterior (F = 3.779, p ≤ 0.05, partial η² = 0.086) and mediolateral (F = 6.715, p ≤ 0.001, partial η² = 0.144) locations of COP. In general, the COP in individuals with a hyperpronated foot type was projected more anteriorly compared to individuals with a neutral foot type in most walking conditions, with the greatest projection observed during uphill walking (please refer to Figure 5 for pairwise comparisons).
4. Discussion
4.1. Spatiotemporal Parameters and Gait Phase Analysis
The results of the present study revealed that the spatial and temporal gait parameters, as well as the duration of gait phases during various uphill and downhill walking conditions, did not differ between individuals with hyperpronated and neutral foot types. Our findings were consistent with some of those reported in the literature with Hillstrom et al. [48] reporting no significant differences in spatiotemporal gait parameters, including stride length, step length, and cadence, between asymptomatic individuals 18 and 77 years of age with planus and rectus foot types during overground walking across an instrumented mat. The differences between the two groups were also not significant for stance, swing, and double support times unless these variables were normalized by gait cycle time. In this case stance and double support times were statistically, but not clinically, significantly different. Similarly, Farahpour et al. [49], reported no significant differences in average walking speed, stance phase, and step length between male individuals 26 years of age with hyperpronation and those with a neutral foot type, as measured using a motion analysis system during overground walking. In contrast, Rodríguez et al. [34] observed that individuals aged 18–65 with a pronation greater than 6 on the FPI-6 scale demonstrated longer step lengths for both the right and left legs, slower ground contact times, and a reduced cadence compared to individuals with a neutral foot type. These measurements were taken during level treadmill walking at a speed of 4 km·h-1 using an optoelectric sensor system. Other studies, such as the one by Shin et al., [13] reported also different gait characteristics in radiographically determined flatfoot female patients aged 52–80 years. These patients exhibited lower cadence and stride length but showed greater step width, longer step times, and a prolonged stance phase duration in the gait cycle compared to healthy controls with a neutral foot type. The measurements in this study were conducted during overground walking using a 12-camera motion analysis system. Fujishita et al. [23] using an in-shoe plantar pressure measuring system and a wearable inertial sensor found marginally statistically significant greater cadence, lower gait cycle time and similar stance and swing phase of gait expressed as a percentage of gait cycle time between adolescent athletes with rearfoot eversion and control groups according to a leg heel angle of 7°. The differences between studies may be attributed to the multifactorial approach required to monitor gait in individuals with foot hyperpronation, as it is influenced by a combination of factors including the hyperpronation classification method (e.g. radiographic, scale-based, anthropometric [13,34,49]), the subjects' age (young vs. older individuals [13,49]), and the gait analysis technique used (instrumented treadmill, sensor mats, optoelectric systems, motion analysis systems [13,23,34,49]). This difficulty also may depend on whether foot hyperpronation was experimentally induced or acquired [33], and whether the subjects were symptomatic or asymptomatic [49,50].
The spatiotemporal parameters assessed in this study during both level and sloped walking may not have been influenced in the hyperpronated foot type group, as potential musculoskeletal adaptations to this misalignment may not have had sufficient time to develop, possibly due to the young age of the participants, and were therefore limited or absent. Alternatively, any existing adaptations may have compensated for the adverse effects of foot hyperpronation, preventing noticeable changes in gait parameters. In this context, several investigators have demonstrated significant differences in the peak and overall range of motion across the lower limb joints, including the forefoot, midfoot, and rearfoot joints, as well as the knee, hip, and pelvis between individuals with overpronated and neutral foot type [15,17,33,51,52]. However, the kinematic changes between groups were generally small and challenging to compare. It is possible that biomechanical deviations are not substantial enough to disrupt spatiotemporal parameters since hyperpronation primarily affects foot mechanics rather than the overall gait cycle, allowing spatial and temporal elements of gait to stay within normal ranges. Additionally, muscles that support the arch, such as the abductor hallucis [29,53], along with the flexor digitorum brevis and longus [17,54], have demonstrated hypertrophic changes in individuals with foot hyperpronation. These individuals also show increased EMG activity in the long (e.g., tibialis posterior, tibialis anterior, flexor hallucis longus), and short muscles of the foot (e.g., abductor hallucis, flexor digitorum brevis) involved in gait [55,56,57]. Such adaptations may ultimately enhance foot stability, facilitate efficient propulsion, and prevent changes in spatiotemporal gait parameters. This effect is particularly noticeable during uphill walking, where a collapsed medial foot arch in individuals with hyperpronated feet is expected to impact propulsive ability and related spatiotemporal parameters. Because uphill walking requires increased effort to propel forward while countering both higher frictional resistance during toe-off and stronger gravitational forces, compensatory muscle activation plays a key role. Increased activation of the tibialis anterior during the contact phase and the tibialis posterior during midstance and propulsion may enable individuals with foot hyperpronation to offset reduced plantar flexor moments [33], reinforce medial longitudinal arch stability, and ultimately achieve effective propulsion with gait characteristics similar to those of a neutral foot type. The same adaptive neuromuscular mechanism may also apply during downhill walking, where participants decelerated to counteract gravity-assisted propulsion and manage the increased friction demands of heel strike.
Both foot type groups also demonstrated increased outward foot rotation during uphill walking and increased step width during downhill walking compared to level walking. Individuals with hyperpronated feet showed greater, albeit non-significant, outward foot rotation compared to those with neutral feet, likely compensating for the restricted ankle dorsiflexion observed in the present study. This response may be further influenced by the increased activation of the peroneus longus and biceps femoris during uphill walking, which facilitate foot eversion, abduction, and external rotation of the tibia, helping to prevent tripping and improve foot contact for effective propulsion [58,59]. The increased step width during downhill walking was likely a response to heightened lateral instability induced by the ankle joint's open-packed position in plantar flexion during heel strike, combined with eccentric muscle contractions and proprioceptive disturbances that occur during downhill walking [60,61,62].
4.2. Vertical Ground Reaction Forces
Our findings revealed that both groups exhibited similar magnitudes and patterns of vGRFs across all foot regions and walking conditions, with some notable exceptions. Subjects with hyperpronated feet demonstrated greater vGRFs in the midfoot region compared to those with neutral feet. Additionally, significantly lower vGRFs were exerted on the lateral forefoot and, occasionally, on the medial forefoot by subjects with hyperpronated feet compared to their neutral-foot counterparts in nearly all tested gait conditions
Similar to our findings, some researchers have reported increased forces on the entire midfoot region [63] or the medial midfoot region [24] in hyperpronated feet, as well as weak to fair relationships between peak pressure exerted on the medial midfoot and various indices used in the classification of hyperpronation [64]. Other investigators have also reported lower forces and/or pressures under the 4th and 5th metatarsophalangeal joints, anatomical structures located in the lateral forefoot region, thereby supporting our results [24,26,27,48,51]. Our findings did not confirm previous observations of increased peak pressure under the middle region of the forefoot, which include the 2nd and 3rd metatarsophalangeal joints [48,65], and decreased forces on either the entire or the lateral region of the rearfoot [26,27]. Some researchers have shown greater forces and pressures under the hallux [26,28,48,64] and the 2nd toe [48], but these findings could not be supported by our data due to the inability to distinguish between the various regions of the toes.
The increased forces in the midfoot are likely to be due to the misalignment of the subtalar joint and the associated collapse or flattening of the medial longitudinal arch. Kinematic studies have demonstrated significantly higher peak rearfoot eversion [17,51,52] and an increased medial deviation in the trajectory of the center of pressure [29,48]. Furthermore, the ligament laxity resulting from repetitive stress on plantar ligaments, such as the spring ligament [66], may allow the medial longitudinal arch to collapse more easily during gait, as evidenced by the increased relative vertical displacement of the navicular bone [67]. These changes may explain the redistribution of plantar loads, placing greater stress on the midfoot region as the foot compensates for the altered joint alignment and reduced stability. Additionally, as the medial longitudinal arch collapses and the foot excessively pronates, the structures in the inner region of the foot, such as the 2nd and 3rd metatarsophalangeal joints, may become overburdened. This diminishes the forces exerted on structures located in the medial region (1st metatarsophalangeal joint) and, more notably, the lateral regions (4th and 5th metatarsophalangeal joints) of the forefoot [24,26,27] and, consequently, reducing their contribution in supporting body weight during gait.
Comparisons between slopes revealed that midfoot forces were lower during uphill and level walking compared to downhill walking. Excessive pronation facilitates forefoot contact with the ground and, by increasing the relative distance between the calcaneus and metatarsals, imposes greater strain on the plantar fascia while impairing the efficient function of the windlass mechanism [68]. However, increased ankle dorsiflexion during uphill walking facilitates the windlass mechanism by enhancing plantar fascia tension through the stretch of the Achilles tendon, whose collagen fibers envelop calcaneus and integrate into its superficial layers [68,69,70]. These responses may be even more pronounced in individuals with hyperpronated feet, as plantar fascia tension is likely to increase more due to passive stretching of a tighter Achilles tendon, as indicate the reduced range of motion of ankle dorsiflexion exhibited by these individuals compared to those with neutral foot posture in this study. Ultimately, these responses may reduce medial longitudinal arch depression and subsequently lower the vGRFs at the midfoot. In contrast, during downhill walking, the anticipated reduction in ankle dorsiflexion range [69] may decrease the tensile loading of the Achilles tendon on the plantar fascia [71]. This increased compliance may lead to greater medial longitudinal arch depression, ultimately contributing to higher vGRFs. Clinically, this finding suggests that downhill walking may intensify repetitive loading, potentially leading to plantar fascia pathology, a common injury in individuals with hyperpronated feet [68,71,72].
The significantly lower vGRFs exerted on the lateral and occasionally on the medial, regions of the forefoot, remained lower in individuals with hyperpronation compared to those with a neutral foot during all walking conditions. These regions, along with the inner forefoot, generally exhibited greater vGRFs during level and uphill walking compared to downhill walking. Conversely, the vGRFs exerted on the rearfoot was greater during downhill compared to uphill walking. These findings highlight the crucial role of the forefoot in facilitating propulsion during uphill walking and the heel in absorbing impact for deceleration during downhill walking, despite hyperpronation-related alterations in vGRF distribution across foot regions [73].
4.3. Anteroposterior and Mediolateral Locations of COP
Our findings demonstrated a significant interaction between foot type and walking condition for both the anteroposterior and mediolateral locations of the COP. The COP was located more anteriorly in the hyperpronated foot group across all but uphill walking at the maximum slope, compared to individuals with neutral foot type. To the best of the authors' knowledge, no other studies have determined the COP based on a cyclograph, which involves connecting the COP trajectories from the forefoot of one side to the rearfoot of the contralateral side during selected gait cycles. Consequently, direct comparisons with previous research are not possible. However, the few available studies investigating this biomechanical feature have shown that the COP pathway of the flat feet group tends to be abnormal, moving straight from the heel to the toe without the medial shifting in the forefoot that is typically observed in individuals with a neutral foot type [27]. Other investigators have shown that increased foot pronation displaces the COP posteriorly, [33], which contrasts with the findings of the present study. Our findings indicate an anterior shift of the COP in the hyperpronated foot group across most tested gait conditions, coinciding with an increased exertion of vGRFs further toward the forefoot compared to the neutral foot type group, a response that has been observed in both current and previous findings [24,26]. The forward location of the COP was further amplified during uphill walking, likely due to a more pronounced forward shift of the center of mass ahead of the foot's center. This shift may occur as the trunk leans forward in an attempt to enhance forward propulsion relative to the center of support against gravity, counterbalancing the increased gravitational forces acting on the body during uphill walking [69,74].
The results of the present study also showed significant mediolateral displacement of the COP in individuals with hyperpronation, but not in those with neutral feet. These results are aligned with recent data reported in healthy individuals tested under similar walking conditions [73]. Such responses likely reflect the need for greater lateral adaptations to maintain balance and stability on inclined surfaces in the hyperpronated foot type group. Individuals with hyperpronated feet are expected to demonstrate plastic deformation of the passive stabilizers of the subtalar joint due to the long-term effects of foot misalignment, with subsequent effects on joint proprioception [66,75,76]. This may potentially affect the mediolateral stability of the foot, particularly under more demanding conditions such as uphill and downhill walking.
4.4. Limitations
The results of this study should be evaluated considering certain limitations related to the sample characteristics and the methodology of the study, which may affect the generalizability of the findings. The participants in our study were young, asymptomatic, and physically active individuals, factors that could potentially limit the applicability of the results to older individuals, those with symptoms, and less active populations. Previous studies have indicated that beyond the adaptations expected from repetitive loading due to foot misalignment, older individuals are likely to exhibit muscle atrophy in the arch-supporting muscles such as the abductor hallucis and flexor hallucis brevis muscles [77]. These muscles may also be less developed in inactive individuals compared to the more developed muscles typically found in healthy, athletically active individuals [17,78,79], such as the participants in our study, affecting foot stability and, consequently, the ability to maintain an undisturbed gait. Additionally, the presence of symptoms can affect gait kinematics and the related parameters, even if the symptoms are manifested more centrally (e.g., lower back pain) [49]. Furthermore, participants were assessed barefoot, which may alter the results, as footwear is a significant variable influencing gait mechanics in individuals with hyperpronation [25]. The classification of hyperpronation was another limitation, as inconsistencies exist among tests regarding the identification of affected individuals [80]. Finally, our findings should be interpreted within the context of the specific technique used for gait analysis, as different methods may produce varying results [81].
4.5. Clinical Significance
Treadmill-based gait analysis offers valuable insights for several groups interested in understanding the effects of hyperpronated feet. Using instrumented treadmills physical therapists may be enabled in identifying individuals with hyperpronated feet, to monitor patients' progress and adjust rehabilitation programs effectively [82]. Sports scientists and trainers may benefit from the controlled environment of a treadmill to personalize training for maximizing performance and injury prevention [83]. Furthermore, orthotic specialists can evaluate the performance of custom or prefabricated orthotics and footwear designers can analyze the interaction of hyperpronated feet with various shoes under dynamic conditions, leading to better support for individuals with hyperpronated feet [84,85].
5. Conclusions
Our findings revealed that spatiotemporal gait parameters during both level and sloped walking remained unchanged in individuals with hyperpronated feet, indicating the presence of potential compensatory mechanisms that facilitate the maintenance of a relatively stable and controlled gait cycle despite structural deviations. However, the observed increase in vGRFs exerted on the midfoot is clinically significant, as it suggests altered load distribution and impact forces, which could lead to long-term musculoskeletal injuries in the foot and other centrally located weight-bearing joints of the lower limb. Understanding these factors aids clinicians in developing more targeted interventions, such as orthotic support or specific strengthening exercises, to mitigate potential adverse effects while preserving functional gait.
Author Contributions
Conceptualization, N.K. and D.M.; methodology, N.K and D.M.; formal analysis, N.K. and I.K; investigation, N.K.; resources, D.M.; data curation, I.K.; writing—original draft preparation, D.M.; writing—review and editing, D.M.; visualization, D.M.; supervision, D.M.; project administration, N.K. All authors have read and agreed to the published version of the manuscript.
Funding
This research received no external funding.
Institutional Review Board Statement
The study was conducted according to the guidelines of the Declaration of Helsinki and approved by the Bioethics Committee of the School of Physical Education and Sport Science of the National and Kapodistrian University of Athens (Reg. No 1486/15-02-2023).
Data Availability Statement
The data presented in this study are available upon request from the corresponding author.
Conflicts of Interest
The authors declare no conflicts of interest.
References
- Horwood, A.M.; Chockalingam, N. Defining Excessive, over, or Hyper-Pronation: A Quandary. Foot 2017, 31, 49–55.
- Brosky, J.A.; Balazsy, J.E. Functional Anatomy of the Foot and Ankle. In Orthopaedic Physical Therapy Secrets: Third Edition; Elsevier Inc., 2017; pp. 581–586 ISBN 9780323286855.
- Sueki, D.G.; Cleland, J.A.; Wainner, R.S. A Regional Interdependence Model of Musculoskeletal Dysfunction: Research, Mechanisms, and Clinical Implications. Journal of Manual & Manipulative Therapy 2013, 21, 90–102. [CrossRef]
- Riegger-Krugh, C.; Keysor, J.J. Skeletal Malalignments of the Lower Quarter: Correlated and Compensatory Motions and Postures. Journal of Orthopaedic & Sports Physical Therapy 1996, 23, 164–170. [CrossRef]
- Yazdani, F.; Razeghi, M.; Karimi, M.T.; Raeisi Shahraki, H.; Salimi Bani, M. The Influence of Foot Hyperpronation on Pelvic Biomechanics during Stance Phase of the Gait: A Biomechanical Simulation Study. Proc Inst Mech Eng H 2018, 232, 708–717. [CrossRef]
- Powers, C.M. The Influence of Altered Lower-Extremity Kinematics on Patellofemoral Joint Dysfunction: A Theoretical Perspective. Journal of Orthopaedic & Sports Physical Therapy 2003, 33, 639–646. [CrossRef]
- Neal, B.S.; Griffiths, I.B.; Dowling, G.J.; Murley, G.S.; Munteanu, S.E.; Franettovich Smith, M.M.; Collins, N.J.; Barton, C.J. Foot Posture as a Risk Factor for Lower Limb Overuse Injury: A Systematic Review and Meta-analysis. J Foot Ankle Res 2014, 7. [CrossRef]
- Hintermann, B.; Nigg, B.M. Pronation in Runners. Sports Medicine 1998, 26, 169–176. [CrossRef]
- Pérez-Morcillo, A.; Gómez-Bernal, A.; Gil-Guillen, V.F.; Alfaro-Santafé, J.; Alfaro-Santafé, J.V.; Quesada, J.A.; Lopez-Pineda, A.; Orozco-Beltran, D.; Carratalá-Munuera, C. Association between the Foot Posture Index and Running Related Injuries: A Case-Control Study. Clinical Biomechanics 2019, 61, 217–221. [CrossRef]
- Kaufman, K.R.; Brodine, S.K.; Shaffer, R.A.; Johnson, C.W.; Cullison, T.R. The Effect of Foot Structure and Range of Motion on Musculoskeletal Overuse Injuries. Am J Sports Med 1999, 27, 585–593. [CrossRef]
- Almeheyawi, R.N.; Bricca, A.; Riskowski, J.L.; Barn, R.; Steultjens, M. Foot Characteristics and Mechanics in Individuals with Knee Osteoarthritis: Systematic Review and Meta-analysis. J Foot Ankle Res 2021, 14. [CrossRef]
- Razeghi, M.; Batt, M.E. Foot Type Classification: A Critical Review of Current Methods. Gait Posture 2002, 15, 282–291. [CrossRef]
- Shin, H.S.; Lee, J.H.; Kim, E.J.; Kyung, M.G.; Yoo, H.J.; Lee, D.Y. Flatfoot Deformity Affected the Kinematics of the Foot and Ankle in Proportion to the Severity of Deformity. Gait Posture 2019, 72, 123–128. [CrossRef]
- Buldt, A.K.; Levinger, P.; Murley, G.S.; Menz, H.B.; Nester, C.J.; Landorf, K.B. Foot Posture Is Associated with Kinematics of the Foot during Gait: A Comparison of Normal, Planus and Cavus Feet. Gait Posture 2015, 42, 42–48. [CrossRef]
- Marouvo, J.; Sousa, F.; Fernandes, O.; Castro, M.A.; Paszkiel, S. Gait Kinematics Analysis of Flatfoot Adults. Applied Sciences (Switzerland) 2021, 11. [CrossRef]
- Okamura, K.; Egawa, K.; Ikeda, T.; Fukuda, K.; Kanai, S. Relationship between Foot Muscle Morphology and Severity of Pronated Foot Deformity and Foot Kinematics during Gait: A Preliminary Study. Gait Posture 2021, 86, 273–277. [CrossRef]
- Zhang, X.; Aeles, J.; Vanwanseele, B. Comparison of Foot Muscle Morphology and Foot Kinematics between Recreational Runners with Normal Feet and with Asymptomatic Over-Pronated Feet. Gait Posture 2017, 54, 290–294. [CrossRef]
- Abdul Razak, A.H.; Zayegh, A.; Begg, R.K.; Wahab, Y. Foot Plantar Pressure Measurement System: A Review. Sensors (Switzerland) 2012, 12, 9884–9912.
- Burnie, L.; Chockalingam, N.; Holder, A.; Claypole, T.; Kilduff, L.; Bezodis, N. Commercially Available Pressure Sensors for Sport and Health Applications: A Comparative Review. Foot 2023, 56.
- Arzehgar, A.; Nia, R.G.N.N.; Hoseinkhani, M.; Masoumi, F.; Sayyed-Hosseinian, S.-H.; Eslami, S. An Overview of Plantar Pressure Distribution Measurements and Its Applications in Health and Medicine. Gait Posture 2025, 117, 235–244. [CrossRef]
- Fallahtafti, F.; Wurdeman, S.R.; Yentes, J.M. Sampling Rate Influences the Regularity Analysis of Temporal Domain Measures of Walking More than Spatial Domain Measures. Gait Posture 2021, 88, 216–220. [CrossRef]
- Veilleux, L.N.; Raison, M.; Rauch, F.; Robert, M.; Ballaz, L. Agreement of Spatio-Temporal Gait Parameters between a Vertical Ground Reaction Force Decomposition Algorithm and a Motion Capture System. Gait Posture 2016, 43, 257–264. [CrossRef]
- Fujishita, H.; Ikuta, Y.; Maeda, N.; Komiya, M.; Morikawa, M.; Arima, S.; Sakamitsu, T.; Obayashi, H.; Fukuhara, K.; Ushio, K.; et al. Effects of Rearfoot Eversion on Foot Plantar Pressure and Spatiotemporal Gait Parameters in Adolescent Athletes. Healthcare (Switzerland) 2023, 11. [CrossRef]
- Chuckpaiwong, B.; Nunley, J.A.; Mall, N.A.; Queen, R.M. The Effect of Foot Type on In-Shoe Plantar Pressure during Walking and Running. Gait Posture 2008, 28, 405–411. [CrossRef]
- Mei, Q.; Gu, Y.; Xiang, L.; Yu, P.; Gao, Z.; Shim, V.; Fernandez, J. Foot Shape and Plantar Pressure Relationships in Shod and Barefoot Populations. Biomech Model Mechanobiol 2020, 19, 1211–1224. [CrossRef]
- Buldt, A.K.; Forghany, S.; Landorf, K.B.; Levinger, P.; Murley, G.S.; Menz, H.B. Foot Posture Is Associated with Plantar Pressure during Gait: A Comparison of Normal, Planus and Cavus Feet. Gait Posture 2018, 62, 235–240. [CrossRef]
- Han, J.T.; Koo, H.M.; Jung, J.M.; Kim, Y.J.; Lee, J.H. Differences in Plantar Foot Pressure and COP between Flat and Normal Feet During Walking. J Phys Ther Sci 2011, 23, 683–685. [CrossRef]
- Ledoux, W.R.; Hillstrom, H.J. The Distributed Plantar Vertical Force of Neutrally Aligned and Pes Planus Feet. Gait Posture 2002, 15, 1–9. [CrossRef]
- Wong, Y.S. Influence of the Abductor Hallucis Muscle on the Medial Arch of the Foot: A Kinematic and Anatomical Cadaver Study. Foot Ankle Int 2007, 28, 617–620. [CrossRef]
- Semaan, M.B.; Wallard, L.; Ruiz, V.; Gillet, C.; Leteneur, S.; Simoneau-Buessinger, E. Is Treadmill Walking Biomechanically Comparable to Overground Walking? A Systematic Review. Gait Posture 2022, 92, 249–257.
- Kim, M.-K. Foot Pressure Analysis of Adults with Flat and Normal Feet at Different Gait Speeds on an Ascending Slope. J Phys Ther Sci 2015, 27, 3767–3769. [CrossRef]
- Kim, M.-K.; Lee, Y.-S. A Three-Dimensional Gait Analysis of People with Flat Arched Feet on an Ascending Slope. J Phys Ther Sci 2014, 26, 1437–1440. [CrossRef]
- Resende, R.A.; Pinheiro, L.S.P.; Ocarino, J.M. Effects of Foot Pronation on the Lower Limb Sagittal Plane Biomechanics during Gait. Gait Posture 2019, 68, 130–135. [CrossRef]
- Requelo-Rodríguez, I.; Castro-Méndez, A.; Jiménez-Cebrián, A.M.; González-Elena, M.L.; Palomo-Toucedo, I.C.; Pabón-Carrasco, M. Assessment of Selected Spatio-Temporal Gait Parameters on Subjects with Pronated Foot Posture on the Basis of Measurements Using Optogait. A Case-Control Study. Sensors 2021, 21. [CrossRef]
- Redmond, A.C.; Crosbie, J.; Ouvrier, R.A. Development and Validation of a Novel Rating System for Scoring Standing Foot Posture: The Foot Posture Index. Clinical Biomechanics 2006, 21, 89–98. [CrossRef]
- Knutson, G.A. Anatomic and Functional Leg-Length Inequality: A Review and Recommendation for Clinical Decision-Making. Part I, Anatomic Leg-Length Inequality: Prevalence, Magnitude, Effects and Clinical Significance. Chiropr Osteopat 2005, 13, 11. [CrossRef]
- Bunnell, W.P. An Objective Criterion for Scoliosis Screening. The Journal of Bone & Joint Surgery, Am vol 1984, 66, 1381–1387.
- Farahmand, B.; Ebrahimi Takamjani, E.; Yazdi, H.R.; Saeedi, H.; Kamali, M.; Bagherzadeh Cham, M. A Systematic Review on the Validity and Reliability of Tape Measurement Method in Leg Length Discrepancy. Med J Islam Repub Iran 2019, 33, 46. [CrossRef]
- Powden, C.J.; Hoch, J.M.; Hoch, M.C. Reliability and Minimal Detectable Change of the Weight-Bearing Lunge Test: A Systematic Review. Man Ther 2015, 20, 524–532. [CrossRef]
- Tobler, W. Three Presentations on Geographical Analysis and Modeling: Non- Isotropic Geographic Modeling; Speculations on the Geometry of Geography and Global Spatial Analysis. Technical Report 1993, 93.
- Pingel, T.J. Modeling Slope as a Contributor to Route Selection in Mountainous Areas. Cartogr Geogr Inf Sci 2010, 37, 137–148. [CrossRef]
- Meyer, C.; Killeen, T.; Easthope, C.S.; Curt, A.; Bolliger, M.; Linnebank, M.; Zörner, B.; Filli, L. Familiarization with Treadmill Walking: How Much Is Enough? Sci Rep 2019, 9, 1–10. [CrossRef]
- Paillard, T. Effects of General and Local Fatigue on Postural Control: A Review. Neurosci Biobehav Rev 2012, 36, 162–176. [CrossRef]
- Hof, A.L. Scaling Gait Data to Body Size. Gait Posture 1996, 4, 222–223. [CrossRef]
- Zebris medical GmbH Software Manual Zebris FDM 2.0.x; Am Galgenbühl 14, D-88316 Isny im Allgäu, Germany, 2022;.
- Cao, Y.; Zhuang, H.; Zhang, X.; Guo, R.; Pang, H.; Zheng, P.; Xu, H. Impact of Foot Progression Angle on Spatiotemporal and Plantar Loading Pattern in Intoeing Children during Gait. Sci Rep 2024, 14. [CrossRef]
- Koo, T.K.; Li, M.Y. A Guideline of Selecting and Reporting Intraclass Correlation Coefficients for Reliability Research. J Chiropr Med 2016, 15, 155–163. [CrossRef]
- Hillstrom, H.J.; Song, J.; Kraszewski, A.P.; Hafer, J.F.; Mootanah, R.; Dufour, A.B.; Chow, B.S.; Deland, J.T. Foot Type Biomechanics Part 1: Structure and Function of the Asymptomatic Foot. Gait Posture 2013, 37, 445–451. [CrossRef]
- Farahpour, N.; Jafarnezhad, A.A.; Damavandi, M.; Bakhtiari, A.; Allard, P. Gait Ground Reaction Force Characteristics of Low Back Pain Patients with Pronated Foot and Able-Bodied Individuals with and without Foot Pronation. J Biomech 2016, 49, 1705–1710. [CrossRef]
- Barton, C.J.; Levinger, P.; Webster, K.E.; Menz, H.B. Kinematics Associated with Foot Pronation in Individuals with Patellofemoral Pain Syndrome: A Case-control Study. J Foot Ankle Res 2011, 4. [CrossRef]
- Dodelin, D.; Tourny, C.; L’Hermette, M. The Biomechanical Effects of Pronated Foot Function on Gait. An Experimental Study. Scand J Med Sci Sports 2020, 30, 2167–2177. [CrossRef]
- Wang, Y.; Qi, Y.; Ma, B.; Wu, H.; Wang, Y.; Wei, B.; Wei, X.; Xu, Y. Three-Dimensional Gait Analysis of Orthopaedic Common Foot and Ankle Joint Diseases. Front Bioeng Biotechnol 2024, 12. [CrossRef]
- Okamura, K.; Egawa, K.; Ikeda, T.; Fukuda, K.; Kanai, S. Relationship between Foot Muscle Morphology and Severity of Pronated Foot Deformity and Foot Kinematics during Gait: A Preliminary Study. Gait Posture 2021, 86, 273–277. [CrossRef]
- Sakamoto, K.; Kudo, S. Morphological Characteristics of Intrinsic Foot Muscles among Flat Foot and Normal Foot Using Ultrasonography. Acta Bioeng Biomech 2020, 22, 161–166. [CrossRef]
- Gray, E.G.; Basmajian, J. V. Electromyography and Cinematography of Leg and Foot (“Normal” and Flat) during Walking. Anat Rec 1968, 161, 1–15. [CrossRef]
- Murley, G.S.; Menz, H.B.; Landorf, K.B. Foot Posture Influences the Electromyographic Activity of Selected Lower Limb Muscles during Gait. J Foot Ankle Res 2009, 2. [CrossRef]
- Hunt, A.E.; Smith, R.M. Mechanics and Control of the Flat versus Normal Foot during the Stance Phase of Walking. Clinical Biomechanics 2004, 19, 391–397. [CrossRef]
- Kwon, Y.; Shin, G. Foot Kinematics and Leg Muscle Activation Patterns Are Altered in Those with Limited Ankle Dorsiflexion Range of Motion during Incline Walking. Gait Posture 2022, 92, 315–320. [CrossRef]
- Mohammadi, R.; Phadke, C.P. Effects of Treadmill Incline and Speed on Peroneus Longus Muscle Activity in Persons with Chronic Stroke and Healthy Subjects. Gait Posture 2017, 54, 221–228. [CrossRef]
- Duchateau, J.; Enoka, R.M. Neural Control of Lengthening Contractions. Journal of Experimental Biology 2016, 219, 197–204. [CrossRef]
- Jalaleddini, K.; Nagamori, A.; Laine, C.M.; Golkar, M.A.; Kearney, R.E.; Valero-Cuevas, F.J. Physiological Tremor Increases When Skeletal Muscle Is Shortened: Implications for Fusimotor Control. Journal of Physiology 2017, 595, 7331–7346. [CrossRef]
- Hiemstra, L.A.; Lo, I.K.Y.; Fowler, P.) Effect of Fatigue on Knee Proprioception: Implications for Dynamic Stabilization. Journal of Orthopaedic & Sports Physical Therapy 2001, 31, 59–605.
- Buldt, A.K.; Allan, J.J.; Landorf, K.B.; Menz, H.B. The Relationship between Foot Posture and Plantar Pressure during Walking in Adults: A Systematic Review. Gait Posture 2018, 62, 56–67. [CrossRef]
- Jonely, H.; Brismée, J.-M.; Sizer, P.S.; James, C.R. Relationships between Clinical Measures of Static Foot Posture and Plantar Pressure during Static Standing and Walking. Clinical Biomechanics 2011, 26, 873–879. [CrossRef]
- Rao, S.; Song, J.; Kraszewski, A.; Backus, S.; Ellis, S.J.; Md, J.T.D.; Hillstrom, H.J. The Effect of Foot Structure on 1st Metatarsophalangeal Joint Flexibility and Hallucal Loading. Gait Posture 2011, 34, 131–137. [CrossRef]
- Bednarczyk, E.; Sikora, S.; Kossobudzka-Górska, A.; Jankowski, K.; Hernandez-Rodriguez, Y. Understanding Flat Feet: An in-Depth Analysis of Orthotic Solutions. Journal of Orthopaedic Reports 2024, 3, 100250. [CrossRef]
- Cornwall, M.W.; McPoil, T.G. Relative Movement of the Navicular Bone During Normal Walking. Foot Ankle Int 1999, 20, 507–512. [CrossRef]
- Bolgla, L.A.; Malone, T.R. Plantar Fasciitis and the Windlass Mechanism: A Biomechanical Link to Clinical Practice. J Athl Train 2004, 39, 77–82.
- Strutzenberger, G.; Leutgeb, L.; Claußen, L.; Schwameder, H. Gait on Slopes: Differences in Temporo-Spatial, Kinematic and Kinetic Gait Parameters between Walking on a Ramp and on a Treadmill. Gait Posture 2022, 91, 73–78. [CrossRef]
- Zwirner, J.; Zhang, M.; Ondruschka, B.; Akita, K.; Hammer, N. An Ossifying Bridge – on the Structural Continuity between the Achilles Tendon and the Plantar Fascia. Sci Rep 2020, 10. [CrossRef]
- Cheung, J.T.M.; Zhang, M.; An, K.N. Effect of Achilles Tendon Loading on Plantar Fascia Tension in the Standing Foot. Clinical Biomechanics 2006, 21, 194–203. [CrossRef]
- Taunton, J.E.; Ryan, M.B.; Clement, D.B.; McKenzie, D.C.; Lloyd-Smith, D.R. Plantar Fasciitis: A Retrospective Analysis of 267 Cases. Physical Therapy in Sport 2002, 3, 57–65. [CrossRef]
- Kafetzakis, I.; Konstantinou, I.; Mandalidis, D. Effects of Hiking-Dependent Walking Speeds and Slopes on Spatiotemporal Gait Parameters and Ground Reaction Forces: A Treadmill-Based Analysis in Healthy Young Adults. Applied Sciences 2024, 14, 4383. [CrossRef]
- Leroux, A.; Fung, J.; Barbeau, H. Postural Adaptation to Walking on Inclined Surfaces: I. Normal Strategies. Gait Posture 2002, 15, 64–74.
- Solomonow, M. Ligaments: A Source of Musculoskeletal Disorders. J Bodyw Mov Ther 2009, 13, 136–154. [CrossRef]
- Pereira, B.S.; Andrade, R.; Espregueira-Mendes, J.; Marano, R.P.C.; Oliva, X.M.; Karlsson, J. Current Concepts on Subtalar Instability. Orthop J Sports Med 2021, 9. [CrossRef]
- Mickle, K.J.; Angin, S.; Crofts, G.; Nester, C.J. Effects of Age on Strength and Morphology of Toe Flexor Muscles. Journal of Orthopaedic and Sports Physical Therapy 2016, 46, 1065–1070. [CrossRef]
- Tanaka, T.; Suga, T.; Imai, Y.; Ueno, H.; Misaki, J.; Miyake, Y.; Otsuka, M.; Nagano, A.; Isaka, T. Characteristics of Lower Leg and Foot Muscle Thicknesses in Sprinters: Does Greater Foot Muscles Contribute to Sprint Performance? Eur J Sport Sci 2019, 19, 442–450. [CrossRef]
- Kaneda, K.; Maeda, N.; Ikuta, Y.; Tashiro, T.; Tsutsumi, S.; Arima, S.; Sasadai, J.; Suzuki, Y.; Morikawa, M.; Komiya, M.; et al. The Features of Foot Morphology and Intrinsic Foot Muscle Property in Adolescent Swimmers: An Ultrasound-Based Study. J Hum Kinet 2023, 88, 95–103. [CrossRef]
- Langley, B.; Cramp, M.; Morrison, S.C. Clinical Measures of Static Foot Posture Do Not Agree. J Foot Ankle Res 2016, 9. [CrossRef]
- Chevalier, T.L.; Hodgins, H.; Chockalingam, N. Plantar Pressure Measurements Using an In-Shoe System and a Pressure Platform: A Comparison. Gait Posture 2010, 31, 397–399. [CrossRef]
- Mousavi, S.H.; Khorramroo, F.; Jafarnezhadgero, A. Gait Retraining Targeting Foot Pronation: A Systematic Review and Meta-Analysis. PLoS ONE 2024, 19. [CrossRef]
- Tartaruga, M.P.; Brisswalter, J.; Peyré-Tartaruga, L.A.; Alberton, C.L.; Cadore, E.L.; Tiggemann, C.L.; Silva, E.M.; Kruel, L.F.M.; Ávila, A.O.V.; Coertjens, M. The Relationship between Running Economy and Biomechanical Variables in Distance Runners. Res Q Exerc Sport 2012, 83, 367–375. [CrossRef]
- Esmaeili, A.; Hosseininejad, S.E.; Jafarnezhadgero, A.A.; Dionisio, V.C. The Interaction Effect of Different Footwear Types and Static Navicular Drop or Dynamic Ankle Pronation on the Joint Stiffness of the Lower Limb during Running. Gait Posture 2024, 108, 28–34. [CrossRef]
- Genova, J.M.; Gross, M.T. Effect of Foot Orthotics on Calcaneal Eversion During Standing and Treadmill Walking for Subjects With Abnormal Pronation. Journal of Orthopaedic & Sports Physical Therapy 2000, 30, 664–675. [CrossRef]
Figure 3.
Means and standard deviations (error bars) for normalized (a) stride time and (b) cadence in individuals with hyperpronated and neutral foot type during downhill (A and B), level (C) and uphill (D and E) walking. Significantly different compared to a A (p < 0.001); b B (p < 0.001); c A, B and C (p < 0.001); d A, B, C and D (p < 0.001) walking conditions.
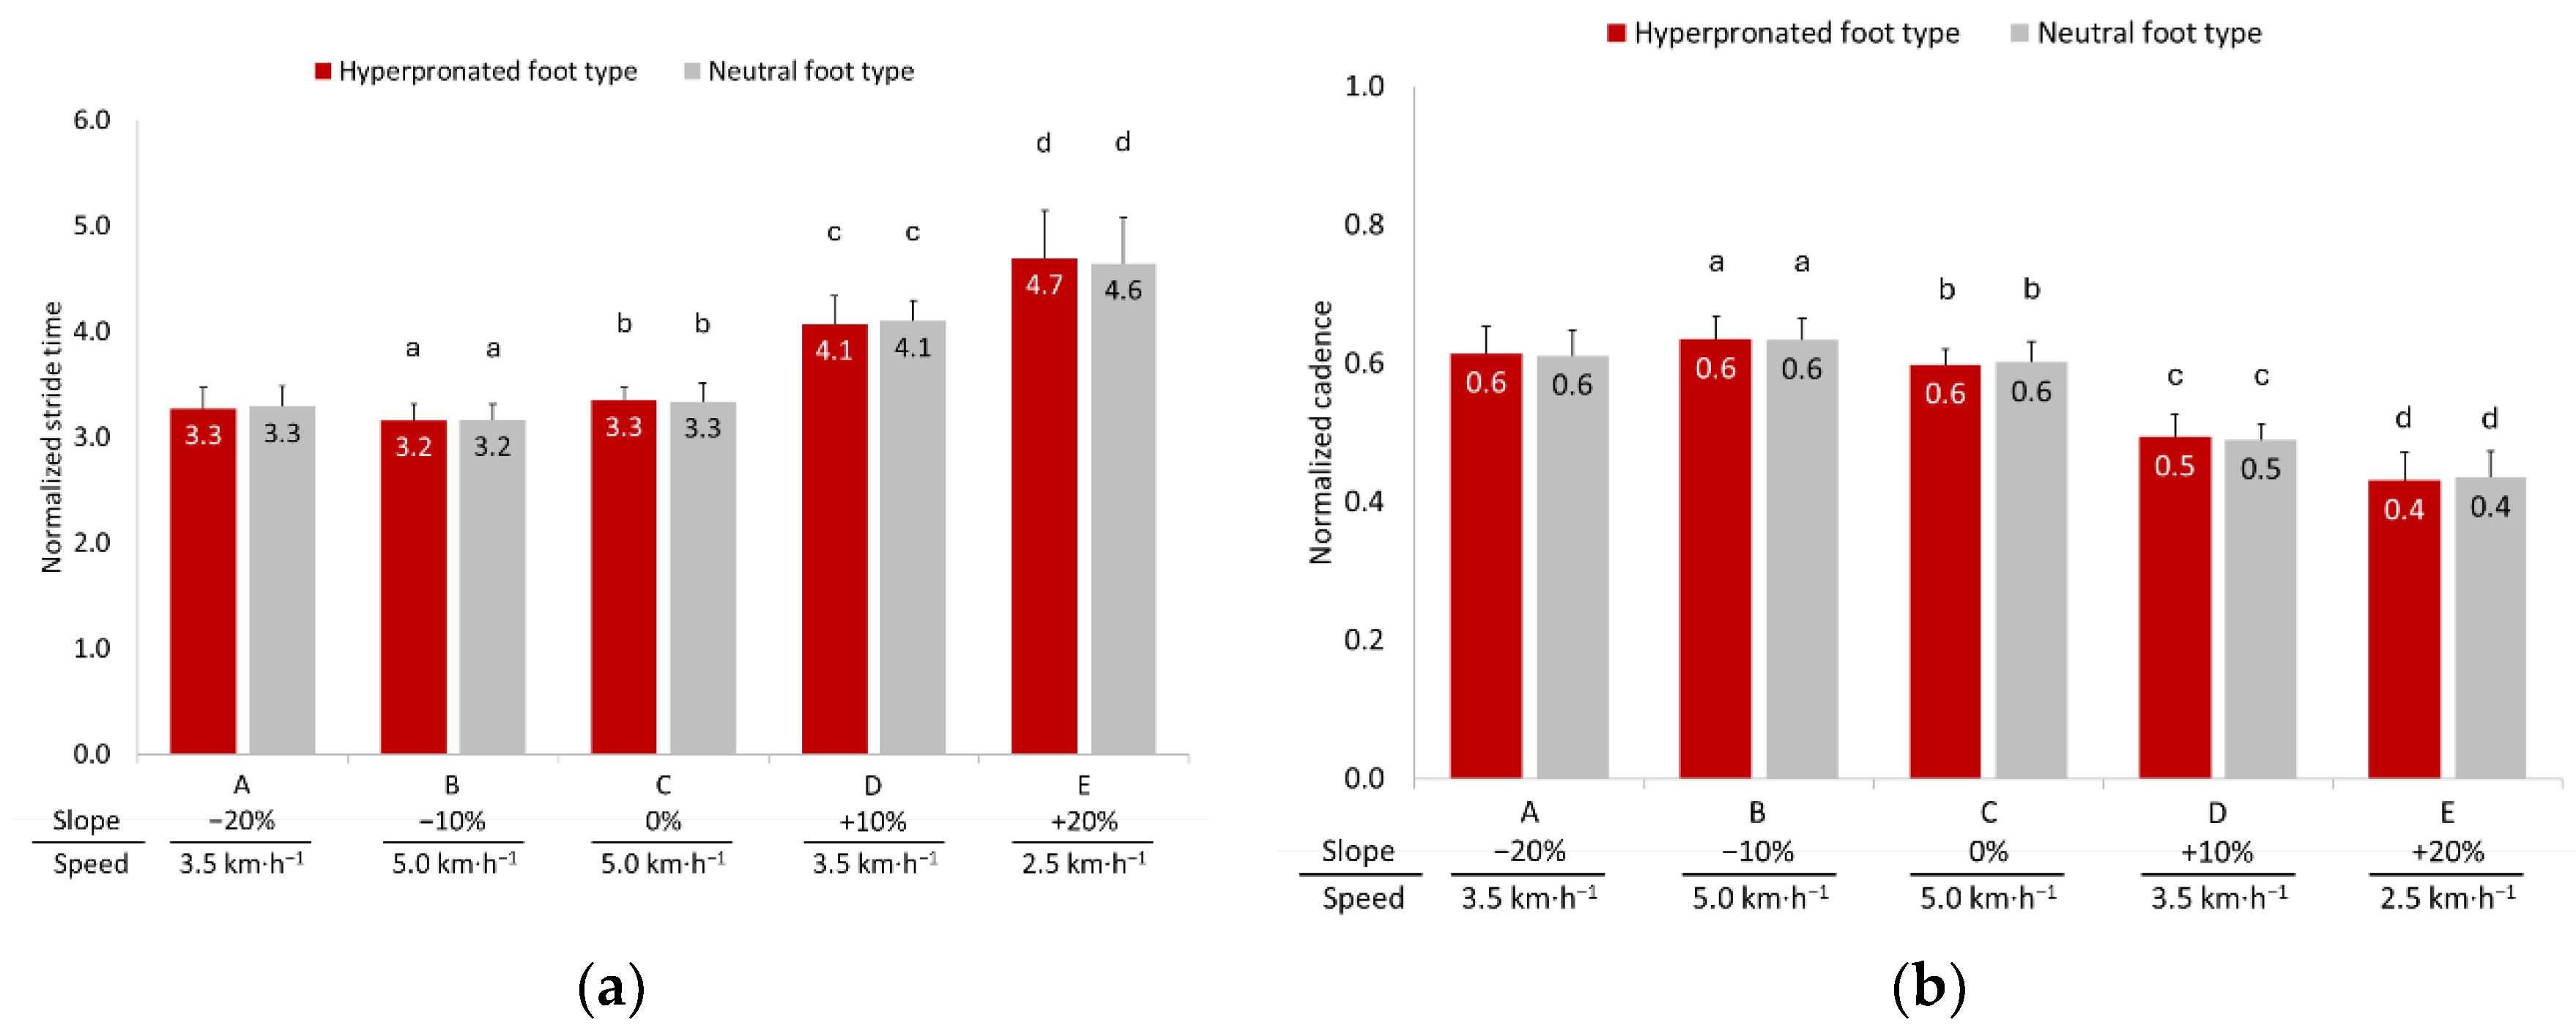
Figure 4.
Means and standard deviations (error bars) and pairwise comparisons for maximum vertical ground reaction forces (vGRFs) normalized to body mass (BM) across plantar foot regions during walking under condition (a) −20% slope, 3.5 km·h⁻¹ (A); (b) −10% slope, 5.0 km·h⁻¹ (B); (c) 0% (level), 5.0 km·h⁻¹ (C); (d) +10% slope, 3.5 km·h⁻¹ (D) and (e) +20% slope, 2.5 km·h⁻¹ (E) in individuals with hyperpronated and neutral foot types. LRF = Lateral Rearfoot; MRF = Medial Rearfoot; MIF = Midfoot; LFF = Lateral Forefoot; IFF = Inner Forefoot; MFF = Medial Forefoot. * p < 0.05; ** p < 0.01; *** p < 0.001.
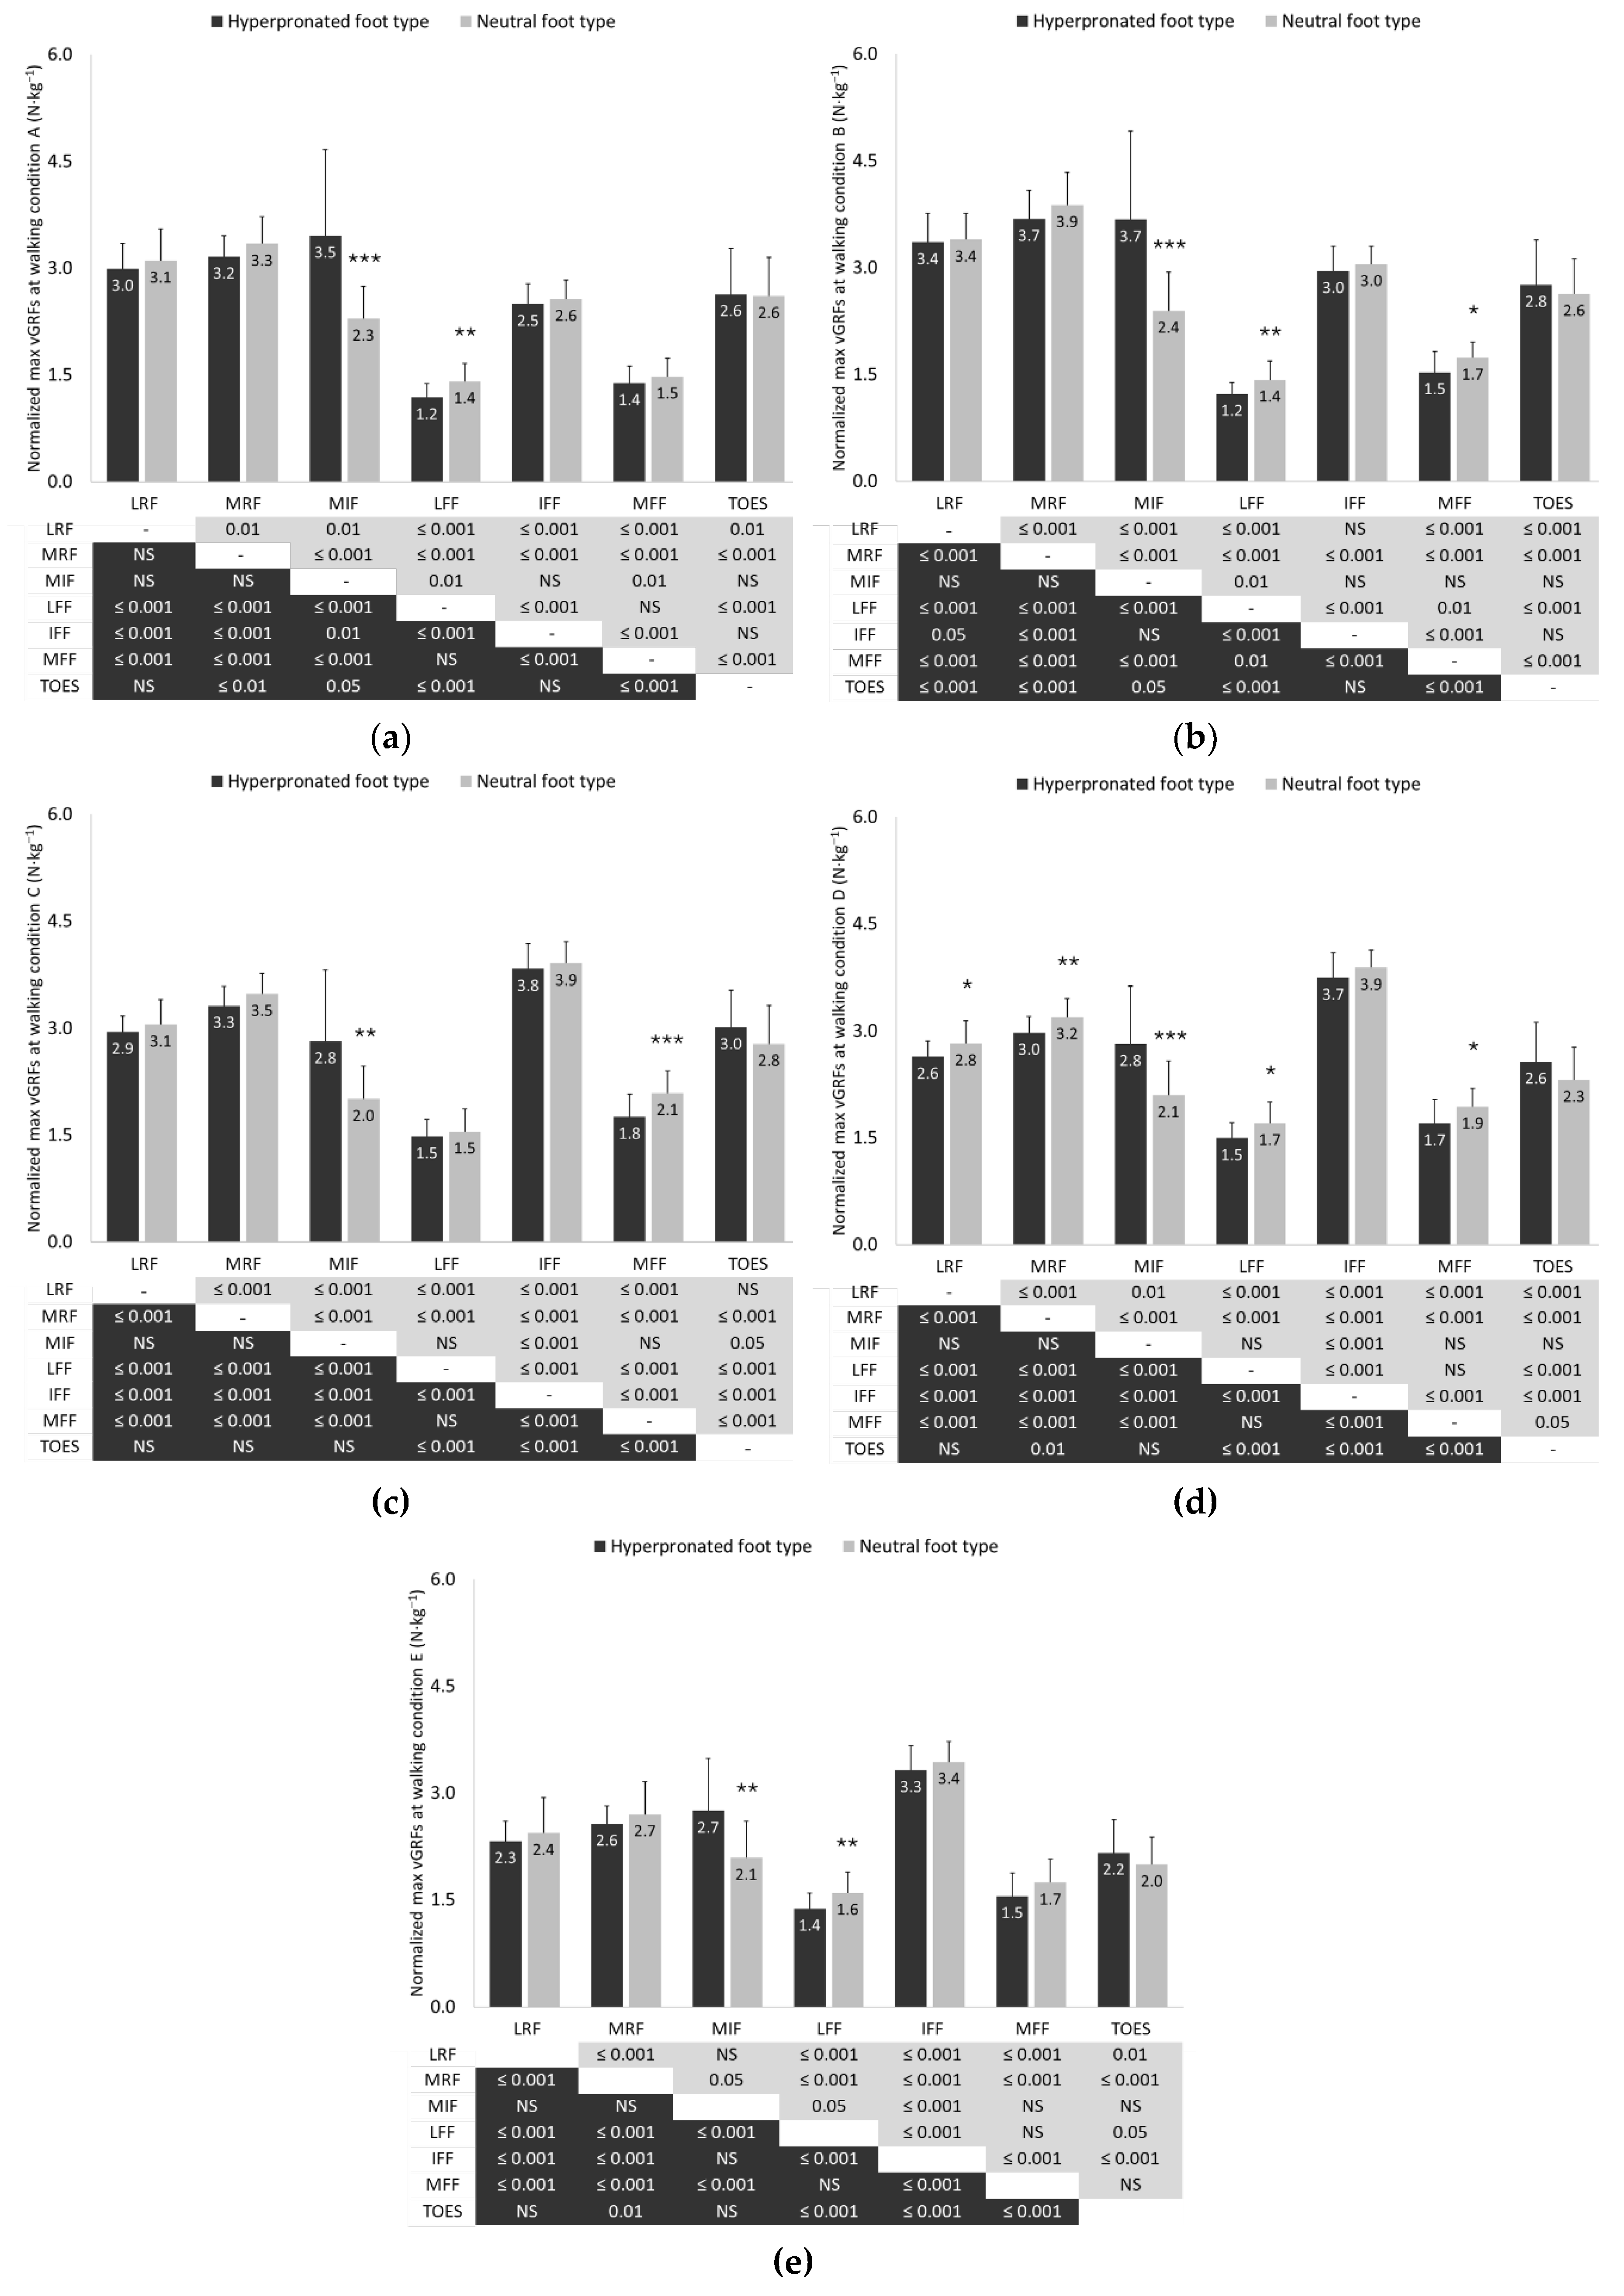
Figure 5.
Means and standard deviations (error bars) of the (a) anteroposterior and (b) mediolateral center of pressure (COP) location in individuals with hyperpronated and neutral foot type during downhill (A and B), level (C) and uphill (D and E) walking. Negative numbers on the vertical axis of the graphs indicate the posterior and left locations of the COP in the anteroposterior and mediolateral axes, respectively. Significantly different compared to a A (p < 0.05); b B and C (p < 0.001); c A, B, C and D (p < 0.001); d A and B (p < 0.001); e A (p < 0.05) and B (p < 0.001) walking conditions. * p < 0.05; ** p < 0.01.
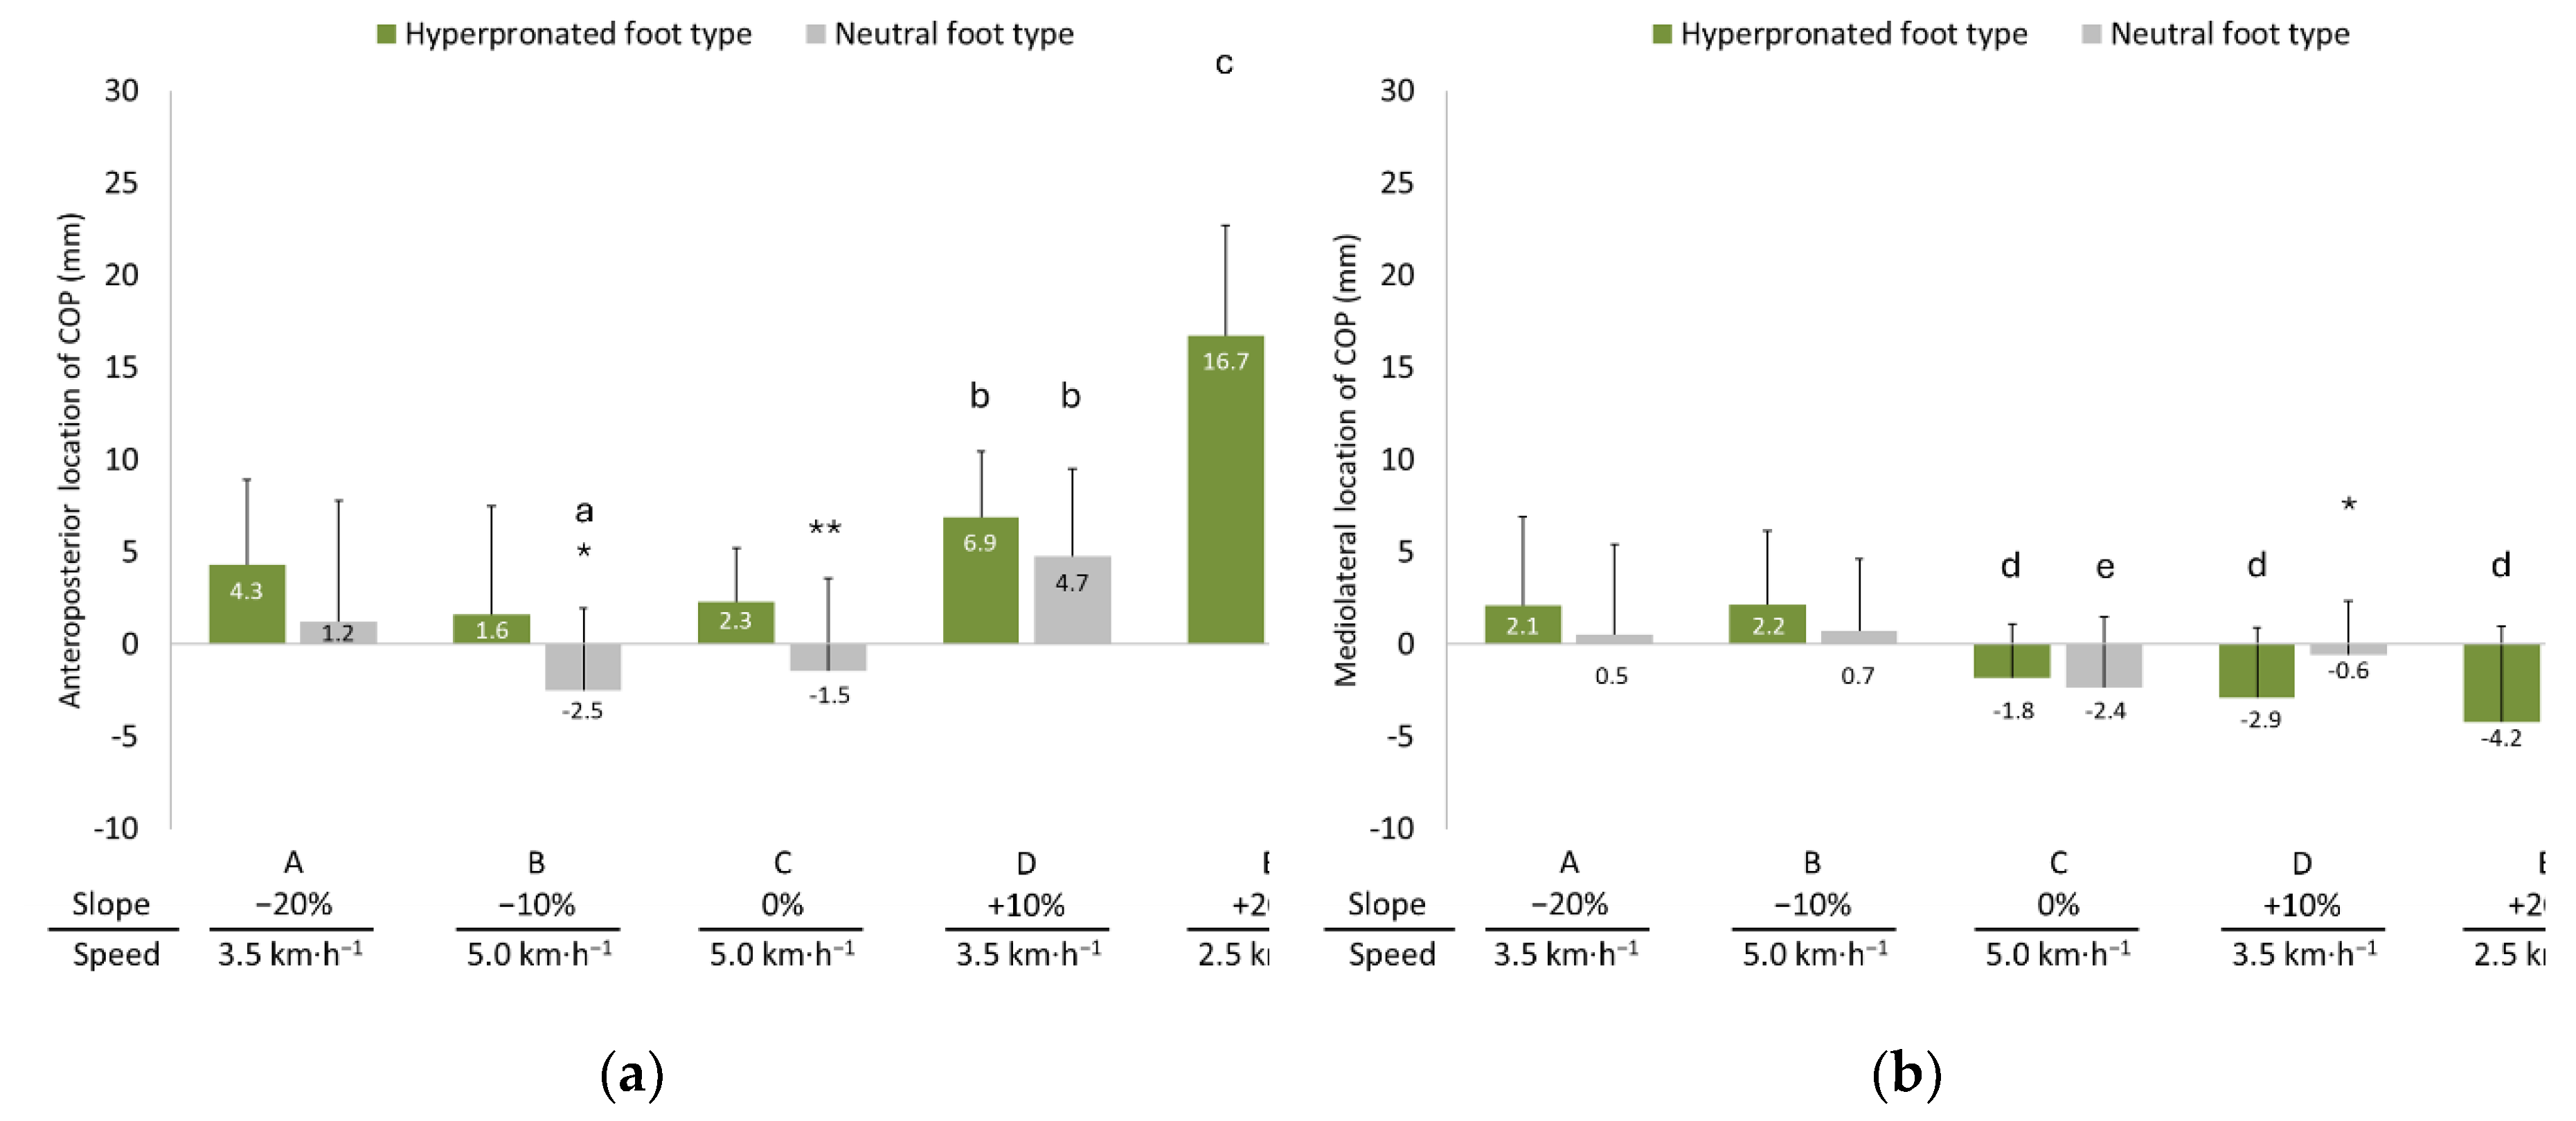

Table 1.
Means ± standard deviations of anthropometric measurements of the study sample in individuals with hyperpronated and neutral foot type.
Table 1.
Means ± standard deviations of anthropometric measurements of the study sample in individuals with hyperpronated and neutral foot type.
| Side | Groups | |||
|---|---|---|---|---|
| HFT (n=21) | NFT (n=21) | Total (n=42) | ||
| Sex (M/F) | 11/10 | 11/10 | 22/20 | |
| Age (yrs) | 24.4 ± 2.7 | 23.8 ± 3.1 | 24.1 ± 2.9 | |
| Body Mass (kg) | 71.0 ± 14.3 | 68.5 ± 9.7 | 69.8 ± 12.1 | |
| Height (m) | 1.7 ± 0.1 | 1.7 ± 0.1 | 1.7 ± 0.1 | |
| Body Mass Index (kg·m-1) | 20.5 ± 3.3 | 19.9 ± 2.3 | 20.2 ± 2.9 | |
| FPI-6 score | R | 10.6 ± 1.1 | 2.4 ± 1.5 ** | 6.5 ± 4.3 |
| L | 10.5 ± 0.9 | 2.6 ± 1.3 ** | 6.5 ± 4.2 | |
| Leg length | R | 88.7± 6.1 | 87.0 ± 4.0 | 87.8 ± 5.1 |
| L | 88.7± 6.1 | 87.0 ± 4.1 | 87.8 ± 5.2 | |
| Ankle dorsi flexion (°) | R | 53.8 ± 5.1 | 50.0 ± 6.0 * | 51.9 ± 5.8 |
| L | 53.6 ± 5.5 | 50.0 ± 5.8 * | 51.8 ± 5.9 | |
Note: HFT = Hyperpronated foot type; NFT = Neutral foot type; *p < 0.05; **p<0.001.
Table 2.
Means ± standard deviations of the duration of stance phase, swing phase and double-standing phase in individuals with hyperpronated and neutral foot type during downhill (A and B), level (C) and uphill (D and E) walking.
Table 2.
Means ± standard deviations of the duration of stance phase, swing phase and double-standing phase in individuals with hyperpronated and neutral foot type during downhill (A and B), level (C) and uphill (D and E) walking.
| Gait Phases | Group | Walking conditions (slope/speed) | ||||
| A | B | C | D | E | ||
| −20% | −10% | 0% | +10% | +20% | ||
| 3.5 km·h-1 | 5.0 km·h-1 | 5.0 km·h-1 | 3.5 km·h-1 | 2.5 km·h-1 | ||
| Stance phase (%LL) | HFT | 62.4 ± 0.9 | 60.8 ± 0.6 a | 61.8 ± 0.9 b | 64.6 ± 0.9 d | 66.6 ± 1.0 e |
| NFT | 62.9 ± 1.1 | 60.9 ± 1.1 a | 61.7 ± 1.1 c | 64.7 ± 1.3 d | 67.5 ± 1.6 e | |
| Load response (%LL) | HFT | 12.4 ± 0.9 | 10.8 ± 0.6 a | 11.8 ± 0.9 b | 14.6 ± 0.9 d | 16.6 ± 1.0 e |
| NFT | 12.9 ± 1.1 | 10.9 ± 1.1 a | 11.7 ± 1.1 c | 14.7 ± 1.3 d | 17.5 ± 1.6 e | |
| Mid-stance (%LL) | HFT | 37.6 ± 0.9 | 39.2 ± 0.6 a | 38.2 ± 0.9 b | 35.4 ± 0.9 d | 33.4 ± 1.0 e |
| NFT | 37.1 ± 1.1 | 39.1 ± 1.1 a | 38.3 ± 1.1 c | 35.3 ± 1.3 d | 32.5 ± 1.6 e | |
| Pre-swing (%LL) | HFT | 12.4 ± 0.9 | 10.8 ± 0.6 a | 11.8 ± 0.9 b | 14.6 ± 0.9 d | 16.6 ± 1.0 e |
| NFT | 12.9 ± 1.1 | 10.9 ± 1.1 a | 11.7 ± 1.1 c | 14.7 ± 1.3 d | 17.5 ± 1.6 e | |
| Swing phase (%LL) | HFT | 37.6 ± 0.9 | 39.2 ± 0.6 a | 38.2 ± 0.9 b | 35.4 ± 0.9 d | 33.4 ± 1.0 e |
| NFT | 37.1 ± 1.1 | 39.1 ± 1.1 a | 38.3 ± 1.1 c | 35.3 ± 1.3 d | 32.5 ± 1.6 e | |
Note: HFT = Hyperpronated foot type; NFT = Neutral foot type; LL = Leg length. Significantly different compared to a A (p < 0.001), b A (p < 0.05) and B (p < 0.001), c A and B (p < 0.001), d A, B, and C (p < 0.001); e A, B, C and D (p < 0.001) walking conditions.
Disclaimer/Publisher’s Note: The statements, opinions and data contained in all publications are solely those of the individual author(s) and contributor(s) and not of MDPI and/or the editor(s). MDPI and/or the editor(s) disclaim responsibility for any injury to people or property resulting from any ideas, methods, instructions or products referred to in the content. |
© 2025 by the authors. Licensee MDPI, Basel, Switzerland. This article is an open access article distributed under the terms and conditions of the Creative Commons Attribution (CC BY) license (http://creativecommons.org/licenses/by/4.0/).
Copyright: This open access article is published under a Creative Commons CC BY 4.0 license, which permit the free download, distribution, and reuse, provided that the author and preprint are cited in any reuse.


