
Submitted:
18 July 2024
Posted:
19 July 2024
You are already at the latest version
Abstract
Many studies utilize sensors to measure foot plantar pressure and analyze gait patterns, often focusing on assessing weight-bearing symmetry or asymmetry compared to control groups. However, a critical question arises: does the selection of the control group significantly impact study outcomes? Does chronic low back pain affect foot plantar pressure measurements? This experimental study involved 23 participants, including healthy individuals and those without foot disorders but with chronic low back pain. Dynamic foot pressure measurements were conducted using the Ortopiezometr, and data were analyzed using the "Steps" program. Participants were divided into two groups: Group 1 comprised completely healthy individuals, while Group 2 consisted of individuals without foot problems but with moderate chronic low back pain. The findings highlight a prevalence of energy release in the forefoot sensors compared to the hindfoot for both the right and left legs in most cases. Even among healthy volunteers, achieving perfect symmetry in the maximum values on the sensors for the right and left feet was a challenge. Results showed no statistically significant differences in energy released on specific sensors or duration of gait phases between the groups. Essentially, this suggests that foot pressure patterns are comparable between healthy individuals and those with low back pain. The use of sensor-equipped inserts for pedobarographic examinations indicates that, in cases of degenerative changes in the lumbar and sacral spine without accompanying acute pain, gait patterns resemble those of the healthy population.
Keywords:
foot
; gait
; low back pain
1. Introduction
Researchers (both engineers and surgeons) investigating the relationship between foot structure and lower limb biomechanics employ various techniques, including kinematic tests, electromyography, and foot pressure analysis (both static and dynamic) [1,2,3,4,5,6,7]. Gait analysis, often conducted in specialized labs, provides precise measurements but is limited by artificial conditions [1,8]. Every-day variations in walking speed, a crucial factor, are often overlooked. Both static and dynamic methods are utilized to assess foot loading, with pedobarographic examinations offering static in-sights and dynamic methods, like walking on sensor-equipped mats, capturing natural gait. How-ever, gait laboratory conditions may alter individuals' walking styles. To address this, insole sensors offer a practical and affordable solution for examining patients in conditions resembling natural gait [1,6].
Understanding the forces within the foot-ground system, specifically the ground reaction forces (GRF), is pivotal in gait analysis. Directly assessing the strength of muscles engaged during walking is a challenge, but tools like electromyography (EMG) can help evaluate the timing and intensity of muscle activity [9,10]. However, these methods don't provide a non-invasive means to ex-amine the actual force. Applying Newton's third law, the reaction to the forces generated by muscles during foot-ground contact manifests as a ground reaction force (GRF) in the opposite direction. While we can measure GRF by placing sensors on the ground or platform, a more efficient approach involves situating them on the insole of the shoe, ensuring direct contact with the foot [6,11,12,13]. This approach facilitates a more accurate and practical assessment of the forces in the dynamic interplay between the foot and the ground during walking.
Numerous studies employ sensors to measure foot plantar pressure and analyze gait patterns [1,11,14,15,16]. In each research endeavour, the focus is often on assessing the symmetry or asymmetry of weight bearing within the study group in comparison to a control group. However, a crucial inquiry arises: does the selection of the control group significantly impact the study outcomes? Does chronic low back pain alter the results of foot plantar pressure measurements?
2. Materials and Methods
In this experimental study, 23 participants, including both healthy individuals and those without foot disorders but with chronic low back pain, were involved. Inclusion criteria comprised consenting adults, and the study received approval from the local Bioethics Committee (No 1072.6120.72.2022). Patients with acute back pain were excluded.
Dynamic foot pressure measurements were conducted using the Ortopiezometr, a device with 8 piezoelectric sensors strategically placed in anatomical zones following Blomgren and Lorkowski [17,18,19].
The primary component of our pressure sensors consists of a 110 μm thick polarized PVDF film with printed CuNi electrodes. This particular film was chosen over other investigated piezoelectric polymers such as PE, PP, and PET, owing to its excellent mechanical durability. It's worth noting that pyroelectric signals can interfere with piezoelectric signals. To mitigate this effect, a resistor-capacitor RC high-pass filter was integrated into the developed system. Each insole (right and left) contained 8 sensors. The gathered data are wirelessly transmitted to a personal computer from an electronic circuit securely attached to the shoe. Simultaneously, waveforms depicting the forces applied to each sensor are acquired. The design of the shoe insole effectively eliminates the influence of foil stretching, preventing any undesirable deformations. Standardized trainers were worn by volunteers (same model, different sizes) to eliminate shoe-induced gait pattern variations. Data, wirelessly transmitted to a computer, were collected in a 20-meter corridor where participants walked multiple times at self-determined fast/slow speeds. The first and last three steps were excluded from evaluation to mitigate the impact of unstable gait patterns.
The acquired data underwent analysis using the "Steps" program, developed in Visual Basic for Ap-plications within MS Excel. The program logged output voltage (in volts) from 8 transducers, proportionate to the applied force during each step. The calculated energy (E) represented the foot pressure on the ground during walking. Quantitative assessment of the results was facilitated by measuring power, defined as the energy generated in transducers per unit of time. This assessment considered both the power of foot strike and the duration of foot contact with the ground (Figure 1, Figure 2, Figure 3 and Figure 4).
Each footstep was divided into distinct phases:
Heel Phase (t1): From heel contact with the surface until heel pressure on the ground is zero. The average power for this phase was calculated by dividing the energy produced on the transducers during this phase by t1.
Front Phase (t2): From the moment heel pressure on the ground is zero until the end of foot contact with the ground. This corresponds to the ankle rocker and forefoot rocker phases as per Perry's classification.
Stance Phase (t3): Combines the first two phases, covering the entire duration of contact between the foot and the ground. The duration of this phase is labeled as t3 = t1 + t2.
Stride Phase (t4): Encompasses the entire period between the first heel contact with the ground and the next heel contact.
In order to answer the questions, statistical analyzes were performed using the IBM SPSS Statistics version 29 package. It was used to analyze basic descriptive statistics, the Mann Whitney U test and the Wilcoxon signed-rank test. The classic threshold of α = 0.05 was assumed as the level of statistical significance.
3. Results
The tested volunteers were divided into two groups. Group 1 consisted of totally healthy people while group 2 gathered people without any foot problems, but with chronic low back pain of moder-ate intensity. Chronic low back pain resulted from spondylarthrosis and/or lumbar discopathy. These patients took painkillers occasionally. There was no exacerbation of the pain at the time of research, neither neurologic deficits.
Demographic data are collected in Table 1.
The obtained results are presented in table 2. E1 denotes the energy released on sensor 1 on either the right or left leg (R-E1 and L-E1), while E2 signifies the energy released on the forefoot sensors of the respective legs. The percentages L% and R% indicate the proportion of the duration of the stride during which the individual is exclusively standing on the left or right leg.
The findings highlight a prevalence of energy release in the forefoot sensors compared to the hind-foot for both the right and left legs in most cases. Although the maximum force value on sensor 1 generally surpassed the values obtained on the forefoot sensors, its shorter duration resulted in a distinct energy reading, calculated as the area under the curve (Figure 5).
It's interesting to note that even among healthy volunteers, achieving perfect symmetry in the maximum values on the sensors for the right and left feet is a challenge. Human variability is quite natural.
During the initial stage of the statistical analyses, we examined whether there existed statistically significant variances between individuals who were healthy and those with lower back pain (LBP) concerning both E1 and E2 energy. The Mann Whitney U test was employed for this purpose. The outcomes of the test revealed no statistically significant differences for any of the comparisons. In essence, this implies that there are no discernible distinctions in terms of foot pressure between healthy individuals and those with LBP (table 3).

Table 3.
Results of group comparisons between healthy people and people with LBP in terms of foot pressure energy (the Mann Whitney U test).
Table 3.
Results of group comparisons between healthy people and people with LBP in terms of foot pressure energy (the Mann Whitney U test).
| Group 1 (n = 13) |
Group 2 (n = 10) |
||||||||||
| dependent variable | mean rank | Me | Min | Max | mean rank | Me | Min | Max | U | pa | η² |
| Right foot | |||||||||||
| E1 | 10,54 | 58,00 | 31,10 | 188,80 | 13,90 | 143,15 | 39,10 | 249,10 | 46,00 | 0,257 | 0,06 |
| E2 | 12,19 | 144,00 | 58,40 | 215,50 | 11,75 | 129,90 | 73,30 | 207,20 | 62,50 | 0,879 | <0,01 |
| Left foot | |||||||||||
| E1 | 10,46 | 102,80 | 19,00 | 270,40 | 14,00 | 138,10 | 66,20 | 342,10 | 45,00 | 0,232 | 0,07 |
| E2 | 10,92 | 146,80 | 80,00 | 378,30 | 13,40 | 211,95 | 39,50 | 354,70 | 51,00 | 0,410 | 0,03 |
Adnotation. a – exact p value.
Subsequently, a Wilcoxon signed-rank test was executed to assess the disparity in energy release on the sensors between the right and left foot. This analysis was conducted independently for group 1 and group 2. To refine the precision of the obtained p-values, a correction was implemented using the Benjamini-Hochberg procedure. The findings did not reveal statistically significant differences in the energy released on the sensors between the right and left foot.
The rhythm of steps serves as a clear indicator of gait symmetry and the absence of limping. Hence, the examination extended to the loading duration of the forefoot and hindfoot within both groups 1 and 2. The assessment involved determining the percentage of loading on the forefoot and hindfoot, relative to the step time. Once again, the Mann Whitney U test was employed for statistical analysis. The test results yielded no significant differences. Consequently, it can be concluded that there are no significant differences between healthy individuals and those with LBP concerning the timing of forefoot and hindfoot loading (table 4). The duration of standing on one leg was comparable for both legs, indicating a symmetrical gait, too.
Table 4.
Results of group comparisons between healthy people and people with LBP in terms of forefoot and hindfoot loading time.
Table 4.
Results of group comparisons between healthy people and people with LBP in terms of forefoot and hindfoot loading time.
| Group 1 (n = 13) |
Group 2 (n = 10) |
||||||||||
| Time (as a % of the stride) | mean rank | Me | Min | Max | mean rank | Me | Min | Max | U | pa | η2 |
| Right foot | |||||||||||
| T1 | 10,31 | 30,20 | 21,10 | 40,90 | 14,20 | 33,45 | 22,70 | 45,70 | 43,00 | 0,186 | 0,08 |
| T2 | 13,46 | 31,90 | 20,90 | 42,90 | 10,10 | 29,10 | 18,90 | 39,60 | 46,00 | 0,257 | 0,06 |
| T3 | 11,23 | 61,10 | 59,50 | 65,90 | 13,00 | 62,50 | 59,00 | 70,50 | 55,00 | 0,563 | 0,02 |
| Left foot | |||||||||||
| T1 | 10,77 | 30,90 | 22,10 | 40,90 | 13,60 | 35,80 | 22,10 | 50,00 | 49,00 | 0,343 | 0,04 |
| T2 | 13,08 | 32,60 | 23,60 | 38,40 | 10,60 | 27,70 | 14,80 | 39,90 | 51,00 | 0,410 | 0,03 |
| T3 | 10,69 | 60,60 | 56,50 | 65,20 | 13,70 | 62,05 | 56,50 | 65,70 | 48,00 | 0,313 | 0,05 |
Adnotation. a – exact p value.
4. Discussion
The extended lifespan often brings about a higher likelihood of experiencing various health issues, including those related to the feet. The estimated point prevalence of 20% for combined foot/ankle/toe pain on most days is comparable to prevalence estimates for pain in other body sites. There's a recognized higher likelihood of foot and ankle pain development in females, often at-tributed to gender-related differences in footwear characteristics [20]. Across studies, it appears that foot and/or ankle pain is more prevalent in females than males, with forefoot and toes more commonly affected. However, it's essential to note that footwear is just one aspect of biomechanical investigation, with other factor playing important roles, too.
The demand for affordable and reliable wearable healthcare solutions is on the rise, driven by the increasing costs of traditional healthcare services [21,22]. These wearables, facilitated by advancements in miniaturized sensors and wireless technologies, can provide long-term telemonitoring for individuals with limited access to healthcare. An example is an insole-based gait monitoring system, offering a cost-effective way to monitor gait patterns and foot health in daily life, potentially enabling early disease detection and reducing the need for frequent expensive healthcare visits [22,23].
Understanding gait, being a basic form of human locomotion, is fundamental to comprehending normal foot function during movement, crucial for treatment approaches and comparisons. The connection between gait, foot health, and overall well-being is evident.
Insoles systems are recognized as an effective tool for diagnostic and/or therapeutic actions. Such systems can be helpful in detecting possible sites of plantar ulcerations by locating the areas of maximum pressure. Individuals with diabetic neuropathy (DN) tend to experience higher maximum plantar pressures compared to diabetics without neuropathy as well as those with poor glycemic control [24,25,26]. Another example, early-stage Parkinson's disease may manifest as smaller, shuffling steps and difficulties in various aspects of walking. A device for monitoring and quantitatively assessing foot health can be immensely valuable in identifying anomalies in plantar pressure, activity, and gait characteristics, especially in early disease stages or during lower-limb rehabilitation [22,27].
Over time, researchers have crafted diverse insole systems equipped with sensors. We believe pin-pointing the ideal placement and quantity of sensors is crucial for maintaining precision and reliability in plantar pressure measurements across a diverse range of individuals. While it's essential to assess repeatability within a specific group, ensuring the device's measurement consistency across the broader population—spanning different genders and age groups, including females and older adults—is equally vital. Additionally, the foot's pressure distribution undergoes changes with age, and disparities between males and females arise from morphological variations in foot structure [22].
That's why ensuring a well-designed control group is crucial. The issue of having a noncomparable control group has been raised across various medical fields [28]. Aine et al. raised concerns about the health of the control group in their aging study, discovering moderate to severe white matter hyper-intensities and/or cortical volume loss that correlated with poor performance on memory tasks, a key aspect of their research [29]. They also emphasized the unreliability of self-report from study participants, despite clear inclusion/exclusion criteria. They concluded that establishing a control group for comparison with other clinical populations poses a challenge [29].
While it may sound simple in theory, the practical implementation is complex. The key challenge when determining the control group is ensuring that the only difference between the control group and the intervention group is the intervention being tested. Therefore, researchers must meticulously compare the control and intervention groups to identify any differences unrelated to the intervention [30].
The number of research projects on foot plantar pressure and gait analysis in various disorders is increasing nowadays. Our population is aging, many research concern problems among the older, eg with diabetes, back pain, etc.
Researchers utilize age-matched control groups to account for the potential influence of age-related factors on their study outcomes. In older participants, back pain may manifest regardless of the presence or absence of foot disorders. It is widely recognized that acute back pain can impact walking speed, causing individuals with lower back pain to move more slowly than those without pain, as noted by Lee. Interestingly, when prompted to walk at their maximum speed, individuals with acute pain demonstrate the capability to match the walking speed and withstand comparable vertical ground reaction forces as their pain-free counterparts. Conversely, individuals experiencing pain radiating to the leg exhibit slower walking speeds than their pain-free counterparts under both con-trolled and self-selected walking speeds [31]. Notably, when allowed to choose their preferred walking speed, these individuals employ additional strategies to further reduce vertical ground reaction forces, as observed in Lee's research [31].
Furthermore, spinal deformities leading to coronal and sagittal trunk imbalance typically result in plantar pressure asymmetry, characterized by a larger pressure center (COP) swing area, as high-lighted by Wen [32]. Pregnant women experiencing back pain exhibit altered walking patterns, indicating a connection between disability and plantar pressure. Additionally, there is a correlation be-tween the intensity of pain and the contact area of the feet in pregnant women [33].
Smith et al tried to answer the question if people with walk differently [34]. Although this is a meticulous meta-analysis, the analyzed papers concern various back pain: chronic, with exacerbations, waiting for surgery, etc. Their study's conclusions as well as results of other authors highlight that individuals experiencing persistent lower back pain exhibit distinctive walking patterns compared to those without back issues [34,35]. differences are particularly notable in spatiotemporal characteristics, inter-segmental coordination patterns, and paraspinal muscle activation. Individuals with persistent LBP tend to opt for a slower walking pace than those without back pain. The observed mean difference in walking speed surpasses values considered clinically meaningful across various studies in adults. Notably, fear avoidance and pain anticipation were identified as significant predictors of reduced walking speed in individuals with persistent LBP, as observed by Al Obaidi et al [36]. Additionally, individuals with LBP showed a reduction in stride length, although this difference did not exceed reported values for minimal detectable change. It is suggested that individuals with LBP may adopt a strategy of slower walking velocity and slightly reduced stride length to mitigate the kinematic and kinetic demands of walking [34]. On the other hand the differences in duration of single limb support, cadence and step width revealed no statistical significance.
Our findings indicate that moderate low back pain does not have a discernible impact on both gait and plantar foot pressure. It is our perspective that distinguishing between acute symptoms and chronic moderate low back pain is crucial. We suggest incorporating a control group design for foot plantar pressure measurements, involving volunteers experiencing moderate chronic back pain would not produce potential bias.
In our study, after analyzing the distribution of pressure on the plantar side of the feet among the participants, we found no discernible differences between individuals with chronic degenerative changes in the spine and those without. The tests were conducted with careful consideration of timing to ensure objective assessment and minimize errors stemming from the participants' focus during testing. Nevertheless, questions persist regarding the movement speed of individuals with spinal degenerative changes. Comparing these two groups doesn't provide insight into the pre-existing movement speed or exact gait patterns before the onset of these changes. Despite these uncertainties, it's rea-sonable to assume that within each group, there are individuals at varying stages of spinal degeneration, with many being unaware of it. Most individuals primarily notice and address musculoskeletal pathologies associated with pain. Our observations suggest that in the absence of spinal pain, the gait patterns revealed through pedobarographic examination closely resemble those of the healthy population.
Each pedobarographic examination result represents a simplified snapshot of the intricate process known as the gait mechanism. Currently, only a fraction of the parameters involved are recorded. Analyzing a broader range of parameters would necessitate more sophisticated research techniques, potentially including the utilization of artificial intelligence [37,38].highlighted.
5. Conclusions
The use of inserts with sensors for pedobarographic examinations allows us to conclude that in the case of degenerative changes in the lumbar and sacral spine without accompanying pain, the gait pattern is similar to that in the healthy population.
Author Contributions
Conceptualization, BJ, EK, JL and TP.; methodology, BJ, EK,GK,KZ.; software, BJ.; validation, BJ,EK and JL.; formal analysis, BJ and EK.; investigation, BJ,EK,PG,GK,KZ, SD and TP.; resources and data curation, BJ,EK,GK,KZ, SD, and TP.; writing—original draft preparation, all.; writing—review and editing, BJ, EK and JL.; visualization, BJ and EK.; supervision, BJ and JL.; project administration, BJ.; funding acquisition, EK and PG. All authors have read and agreed to the published version of the manuscript.
Funding
Please add: This study was supported by the National Centre for Research and Development (NCBR) - grant number POIR.04.01.04-00-0034/19-00.
Institutional Review Board Statement
The study was conducted in accordance with the Declaration of Helsinki, and approved by the Bioethical Committee of the Jagiellonian University (No 1072.6120.72.2022, date: 25 May 2022).
Informed Consent Statement
Informed consent was obtained from all subjects involved in the study.
Data Availability Statement
The data presented in this study are available on request from the corresponding author due to ethical reasons.
Acknowledgments
The authors would like to thank Mr. Andrzej Cichocki for making electric measurements and to all the employees of the Łukasiewicz Research Network-Institute of Microelectronics and Photonics Laboratory. Authors would like to thank Jakub Adamczyk and Michal Swist for collecting data. The authors would like to thank Mrs Anna Wadelska Kaczmarek and pogotowiestatystyczne.pl for her help with statistical analysis.).
Conflicts of Interest
The authors declare no conflicts of interest.
References
- Burnie, L.; Chockalingam, N.; Holder, A.; Claypole, T.; Kilduff, L.; Bezodis, N. Commercially available pressure sensors for sport and health applications: A comparative review. Foot 2023, 56, 102046. [Google Scholar] [CrossRef] [PubMed]
- Jasiewicz, B.; Klimiec, E.; Młotek, M.; Guzdek, P.; Duda, S.; Adamczyk, J.; Potaczek, T.; Piekarski, J.; Kołaszczyński, G. Quantitative Analysis of Foot Plantar Pressure During Walking. Med Sci. Monit. 2019, 25, 4916–4922. [Google Scholar] [CrossRef] [PubMed]
- Klöpfer-Krämer, I.; Brand, A.; Wackerle, H.; Müßig, J.; Kröger, I.; Augat, P. Gait analysis – Available platforms for outcome assessment. Injury 2020, 51, S90–S96. [Google Scholar] [CrossRef] [PubMed]
- Lorkowski, J.; Gawronska, K. Pedobarography in Physiotherapy: A Narrative Review on Current Knowledge. Adv Exp Med Biol. 2022;1375:13-22. [CrossRef] [PubMed]
- Lorkowski, J.; Grzegorowska, O.; Kotela, I. Zastosowanie badania pedobarograficznego do oceny biomechaniki stopy i stawu skokowo-goleniowego u osób dorosłych – doświadczenia własne [The Use of Pedobarographic Examination to Biomechanical Evaluation of Foot and Ankle Joint in Adult - Own Experience]. Ortop. Traumatol. Rehabil. 2015, 17, 207–213. [Google Scholar] [CrossRef] [PubMed]
- Abdul Razak, A.H.; Zayegh, A.; Begg, R.K.; Wahab, Y. Foot Plantar Pressure Measurement System: A Review. Sensors 2012, 12, 9884–9912. [Google Scholar] [CrossRef] [PubMed]
- Speight, S.; Reel, S.; Stephenson, J. Can the F-Scan in-shoe pressure system be combined with the GAITRite® temporal and spatial parameter-recording walkway as a cost-effective alternative in clinical gait analysis? A validation study. J. Foot Ankle Res. 2023, 16, 1–8. [Google Scholar] [CrossRef] [PubMed]
- Kröger, I.; Müßig, J.; Brand, A.; Pätzold, R.; Wackerle, H.; Klöpfer-Krämer, I.; Augat, P. Recovery of gait and function during the first six months after tibial shaft fractures. Gait Posture 2021, 91, 66–72. [Google Scholar] [CrossRef] [PubMed]
- Baker, R. The history of gait analysis before the advent of modern computers. Gait Posture 2007, 26, 331–342. [Google Scholar] [CrossRef] [PubMed]
- Sterzing, T.; Frommhold, C.; Rosenbaum, D. In-shoe plantar pressure distribution and lower extremity muscle activity patterns of backward compared to forward running on a treadmill. Gait Posture 2016, 46, 135–141. [Google Scholar] [CrossRef]
- Spooner, S.K.; Smith, D.K.; A Kirby, K. In-shoe pressure measurement and foot orthosis research: a giant leap forward or a step too far? J. Am. Podiatr. Med Assoc. 2010, 100, 518–529. [Google Scholar] [CrossRef]
- Park, J.; Kim, M.; Hong, I.; Kim, T.; Lee, E.; Kim, E.-A.; Ryu, J.-K.; Jo, Y.; Koo, J.; Han, S.; et al. Foot Plantar Pressure Measurement System Using Highly Sensitive Crack-Based Sensor. Sensors 2019, 19, 5504. [Google Scholar] [CrossRef] [PubMed]
- Prasanth, H.; Caban, M.; Keller, U.; Courtine, G.; Ijspeert, A.; Vallery, H.; von Zitzewitz, J. Wearable Sensor-Based Real-Time Gait Detection: A Systematic Review. Sensors 2021, 21, 2727. [Google Scholar] [CrossRef] [PubMed]
- Karkokli, R.; McConville, K.M. Design and development of a cost effective plantar pressure dis-tribution analysis system for the dynamically moving feet. Conf Proc IEEE Eng Med Biol Soc. 2006;2006:6008-11. [CrossRef]
- Okawara, H.; Sawada, T.; Hakukawa, S.; Nishizawa, K.; Okuno, M.; Nakamura, M.; Hashimoto, T.; Nagura, T. Footsteps required for reliable and valid in-shoe plantar pressure assessment during gait per foot region in people with hallux valgus. Gait Posture 2022, 97, 21–27. [Google Scholar] [CrossRef] [PubMed]
- Osorio, R.; Pastene, F.; Ortega, P.; Aqueveque, P. Gait Subphases Classification Based on Hidden Markov Models using in-shoes Capacitive Pressure Sensors: Preliminary Results. Annu Int Conf IEEE Eng Med Biol Soc. 2022 Jul;2022:756-759. [CrossRef]
- Blomgren, M.; Turan, I.; Agadir, M. Gait analysis in hallux valgus. J. Foot Surg. 1991, 30, 70–1. [Google Scholar] [PubMed]
- Jasiewicz, B.; Klimiec, E.; Guzdek, P.; Kołaszczyński, G.; Piekarski, J.; Zaraska, K.; Potaczek, T. Investigation of Impact of Walking Speed on Forces Acting on a Foot–Ground Unit. Sensors 2022, 22, 3098. [Google Scholar] [CrossRef]
- Lorkowski, J. [Methodology of pedobarographic examination--own experiences and review of literature]. Przeglad Lekarski 2006, 23–7. [Google Scholar]
- Thomas, M.J.; Roddy, E.; Zhang, W.; Menz, H.B.; Hannan, M.T.; Peat, G.M. The population prevalence of foot and ankle pain in middle and old age: A systematic review. Pain 2011, 152, 2870–2880. [Google Scholar] [CrossRef]
- Jiang, W.; Majumder, S.; Kumar, S.; Subramaniam, S.; Li, X.; Khedri, R.; Mondal, T.; Abolghasemian, M.; Satia, I.; Deen, M.J. A Wearable Tele-Health System towards Monitoring COVID-19 and Chronic Diseases. IEEE Rev. Biomed. Eng. 2021, 15, 61–84. [Google Scholar] [CrossRef] [PubMed]
- Subramaniam, S.; Majumder, S.; Faisal, A.I.; Deen, M.J. Insole-Based Systems for Health Monitoring: Current Solutions and Research Challenges. Sensors 2022, 22, 438. [Google Scholar] [CrossRef]
- Majumder, S.; Mondal, T.; Deen, M.J. A Simple, Low-Cost and Efficient Gait Analyzer for Wearable Healthcare Applications. IEEE Sensors J. 2018, 19, 2320–2329. [Google Scholar] [CrossRef]
- Altayyar, S.S. Bare Foot and In-shoe Plantar Pressure in Diabetic Males and Females – Is There Difference? Med Devices: Évid. Res. 2021; 14, 271–276. [Google Scholar] [CrossRef]
- Stess, R.M.; Jensen, S.R.; Mirmiran, R. The Role of Dynamic Plantar Pressures in Diabetic Foot Ulcers. Diabetes Care 1997, 20, 855–858. [Google Scholar] [CrossRef] [PubMed]
- Totaganti, M.; Kant, R.; Yadav, R.K.; Khapre, M. Static and Dynamic Foot Pressure Changes Among Diabetic Patients With and Without Neuropathy: A Comparative Cross-Sectional Study. Cureus 2023, 15, e45338. [Google Scholar] [CrossRef] [PubMed]
- Coutinho, E.S.F.; Bloch, K.V.; Coeli, C.M. One-year mortality among elderly people after hospitalization due to fall-related fractures: comparison with a control group of matched elderly. Cad. de Saude publica 2012, 28, 801–805. [Google Scholar] [CrossRef] [PubMed]
- Dodd, L.E.; Freidlin, B.; Korn, E.L. Platform Trials — Beware the Noncomparable Control Group. New Engl. J. Med. 2021, 384, 1572–1573. [Google Scholar] [CrossRef] [PubMed]
- Aine, C.; Sanfratello, L.; Adair, J.; Knoefel, J.; Qualls, C.; Lundy, S.; Caprihan, A.; Stone, D.; Stephen, J. Characterization of a normal control group: Are they healthy? NeuroImage 2013, 84, 796–809. [Google Scholar] [CrossRef] [PubMed]
- Fetzer, S.J. Considering the Control Group. J. PeriAnesthesia Nurs. 2019, 34, 450–451. [Google Scholar] [CrossRef] [PubMed]
- Lee, C.E.; Simmonds, M.J.; Etnyre, B.R.; Morris, G.S. Influence of pain distribution on gait character-istics in patients with low back pain: part 1: vertical ground reaction force. Spine 2007, 32, 1329–1336. [Google Scholar] [CrossRef] [PubMed]
- Wen, J.-X.; Yang, H.-H.; Han, S.-M.; Cao, L.; Wu, H.-Z.; Yang, C.; Li, H.; Chen, L.-L.; Li, N.-N.; Yu, B.-H.; et al. Trunk balance, head posture and plantar pressure in adolescent idiopathic scoliosis. Front. Pediatr. 2022, 10, 979816. [Google Scholar] [CrossRef]
- Oliveira, G.V.d.S.; Filho, A.V.D.; Dibai, D.B.; Silva, F.d.M.A.M.; Firmo, W.d.C.A.; Garcia, R.A.d.S.; de Carvalho, S.T.R.F.; Gonçalves, M.C.; Barbosa, J.M.A.; Rêgo, A.S. Correlation between baropodometric variables, disability, and intensity of low back pain in pregnant women in the third trimester. J. Bodyw. Mov. Ther. 2020, 25, 24–27. [Google Scholar] [CrossRef] [PubMed]
- Smith, J.A.; Stabbert, H.; Bagwell, J.J.; Teng, H.-L.; Wade, V.; Lee, S.-P. Do people with low back pain walk differently? A systematic review and meta-analysis. J. Sport Heal. Sci. 2022, 11, 450–465. [Google Scholar] [CrossRef]
- Anukoolkarn, K.; Vongsirinavarat, M.; Bovonsunthonchai, S.; Vachalathiti, R. Plantar Pressure Dis-tribution Pattern during Mid-Stance Phase of the Gait in Patients with Chronic Non-Specific Low Back Pain. J Med Assoc Thai. 2015 Sep;98(9):896-901. [PubMed]
- Al-Obaidi, S.M.; Al-Zoabi, B.; Al-Shuwaie, N.; Al-Zaabie, N.; Nelson, R.M. The influence of pain and pain-related fear and disability beliefs on walking velocity in chronic low back pain. Int. J. Rehabilitation Res. 2003, 26, 101–108. [Google Scholar] [CrossRef]
- Lorkowski, J.; Kolaszyńska, O.; Pokorski, M. Artificial Intelligence and Precision Medicine: A Perspective. Adv Exp Med Biol. 2022:1375:1-11. [CrossRef]
- Truong, P.H.; You, S.; Ji, S.-H.; Jeong, G.-M. Adaptive Accumulation of Plantar Pressure for Ambulatory Activity Recognition and Pedestrian Identification. Sensors 2021, 21, 3842. [Google Scholar] [CrossRef] [PubMed]
Figure 1.
Left foot touching the ground (midstance) and the corresponding point on the foot plantar pressure graph.
Figure 1.
Left foot touching the ground (midstance) and the corresponding point on the foot plantar pressure graph.
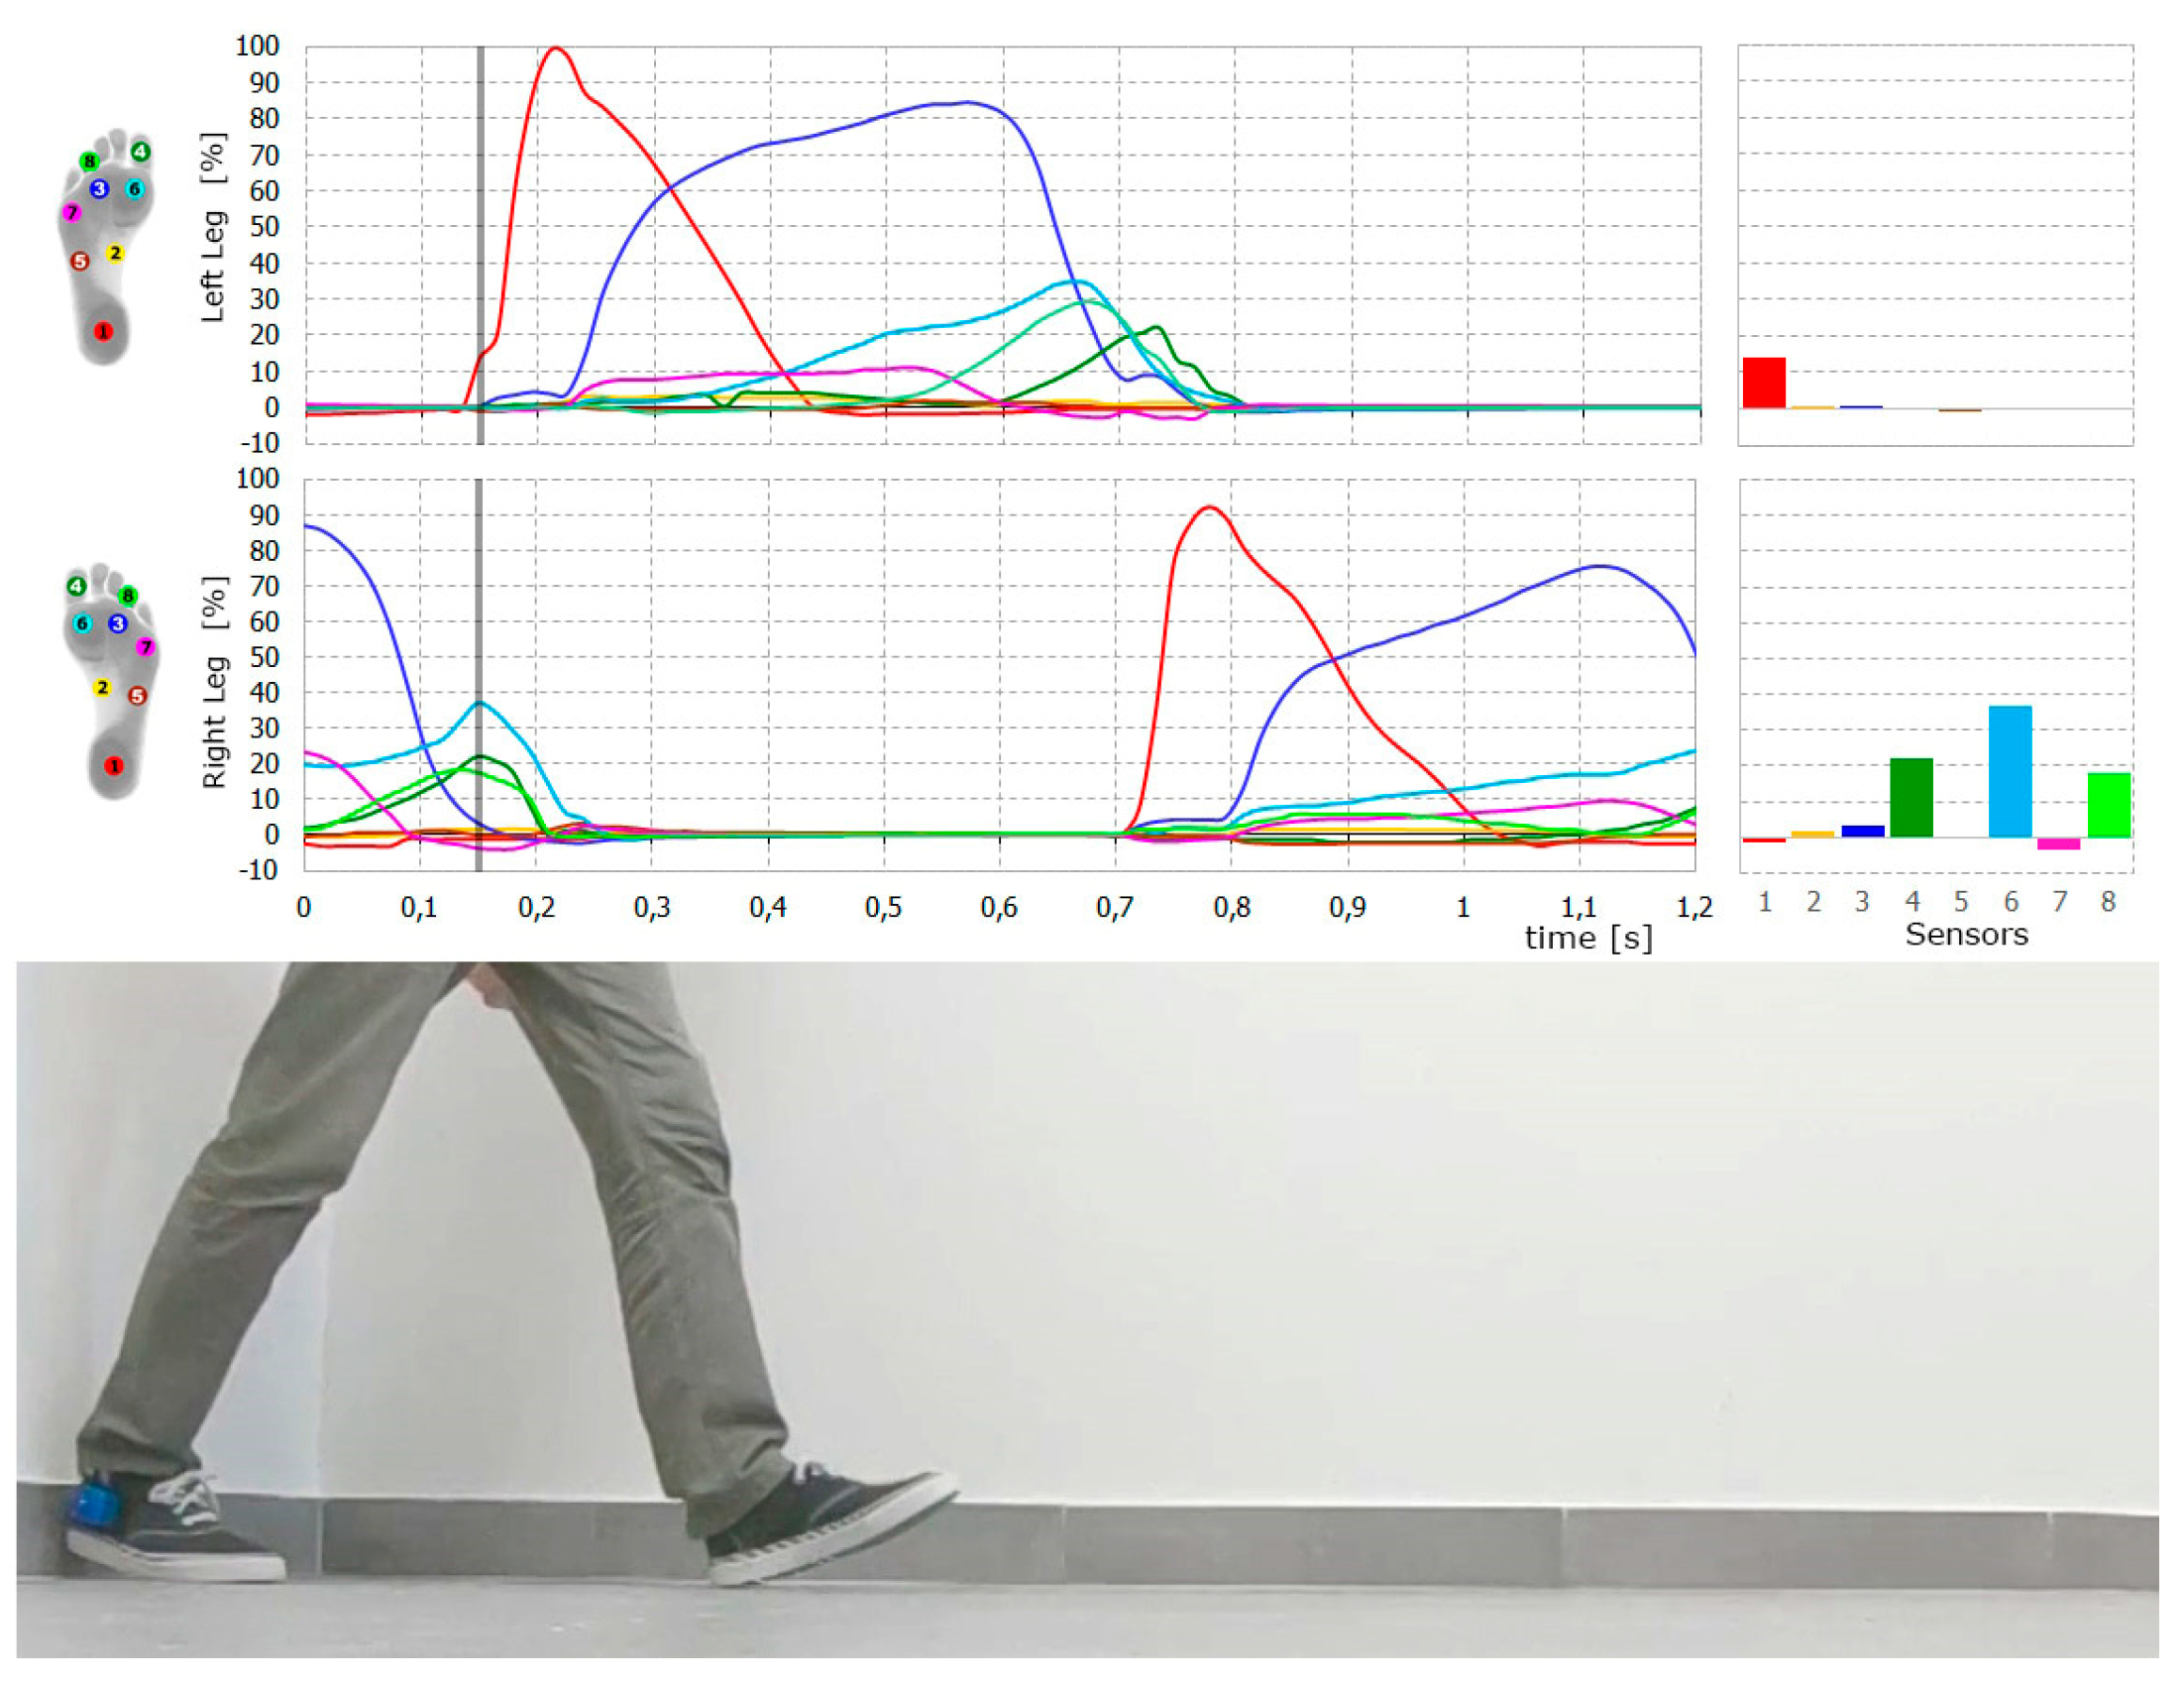
Figure 2.
Beginning of swing phase (toe-off) and the corresponding point on the foot plantar pressure graph.
Figure 2.
Beginning of swing phase (toe-off) and the corresponding point on the foot plantar pressure graph.
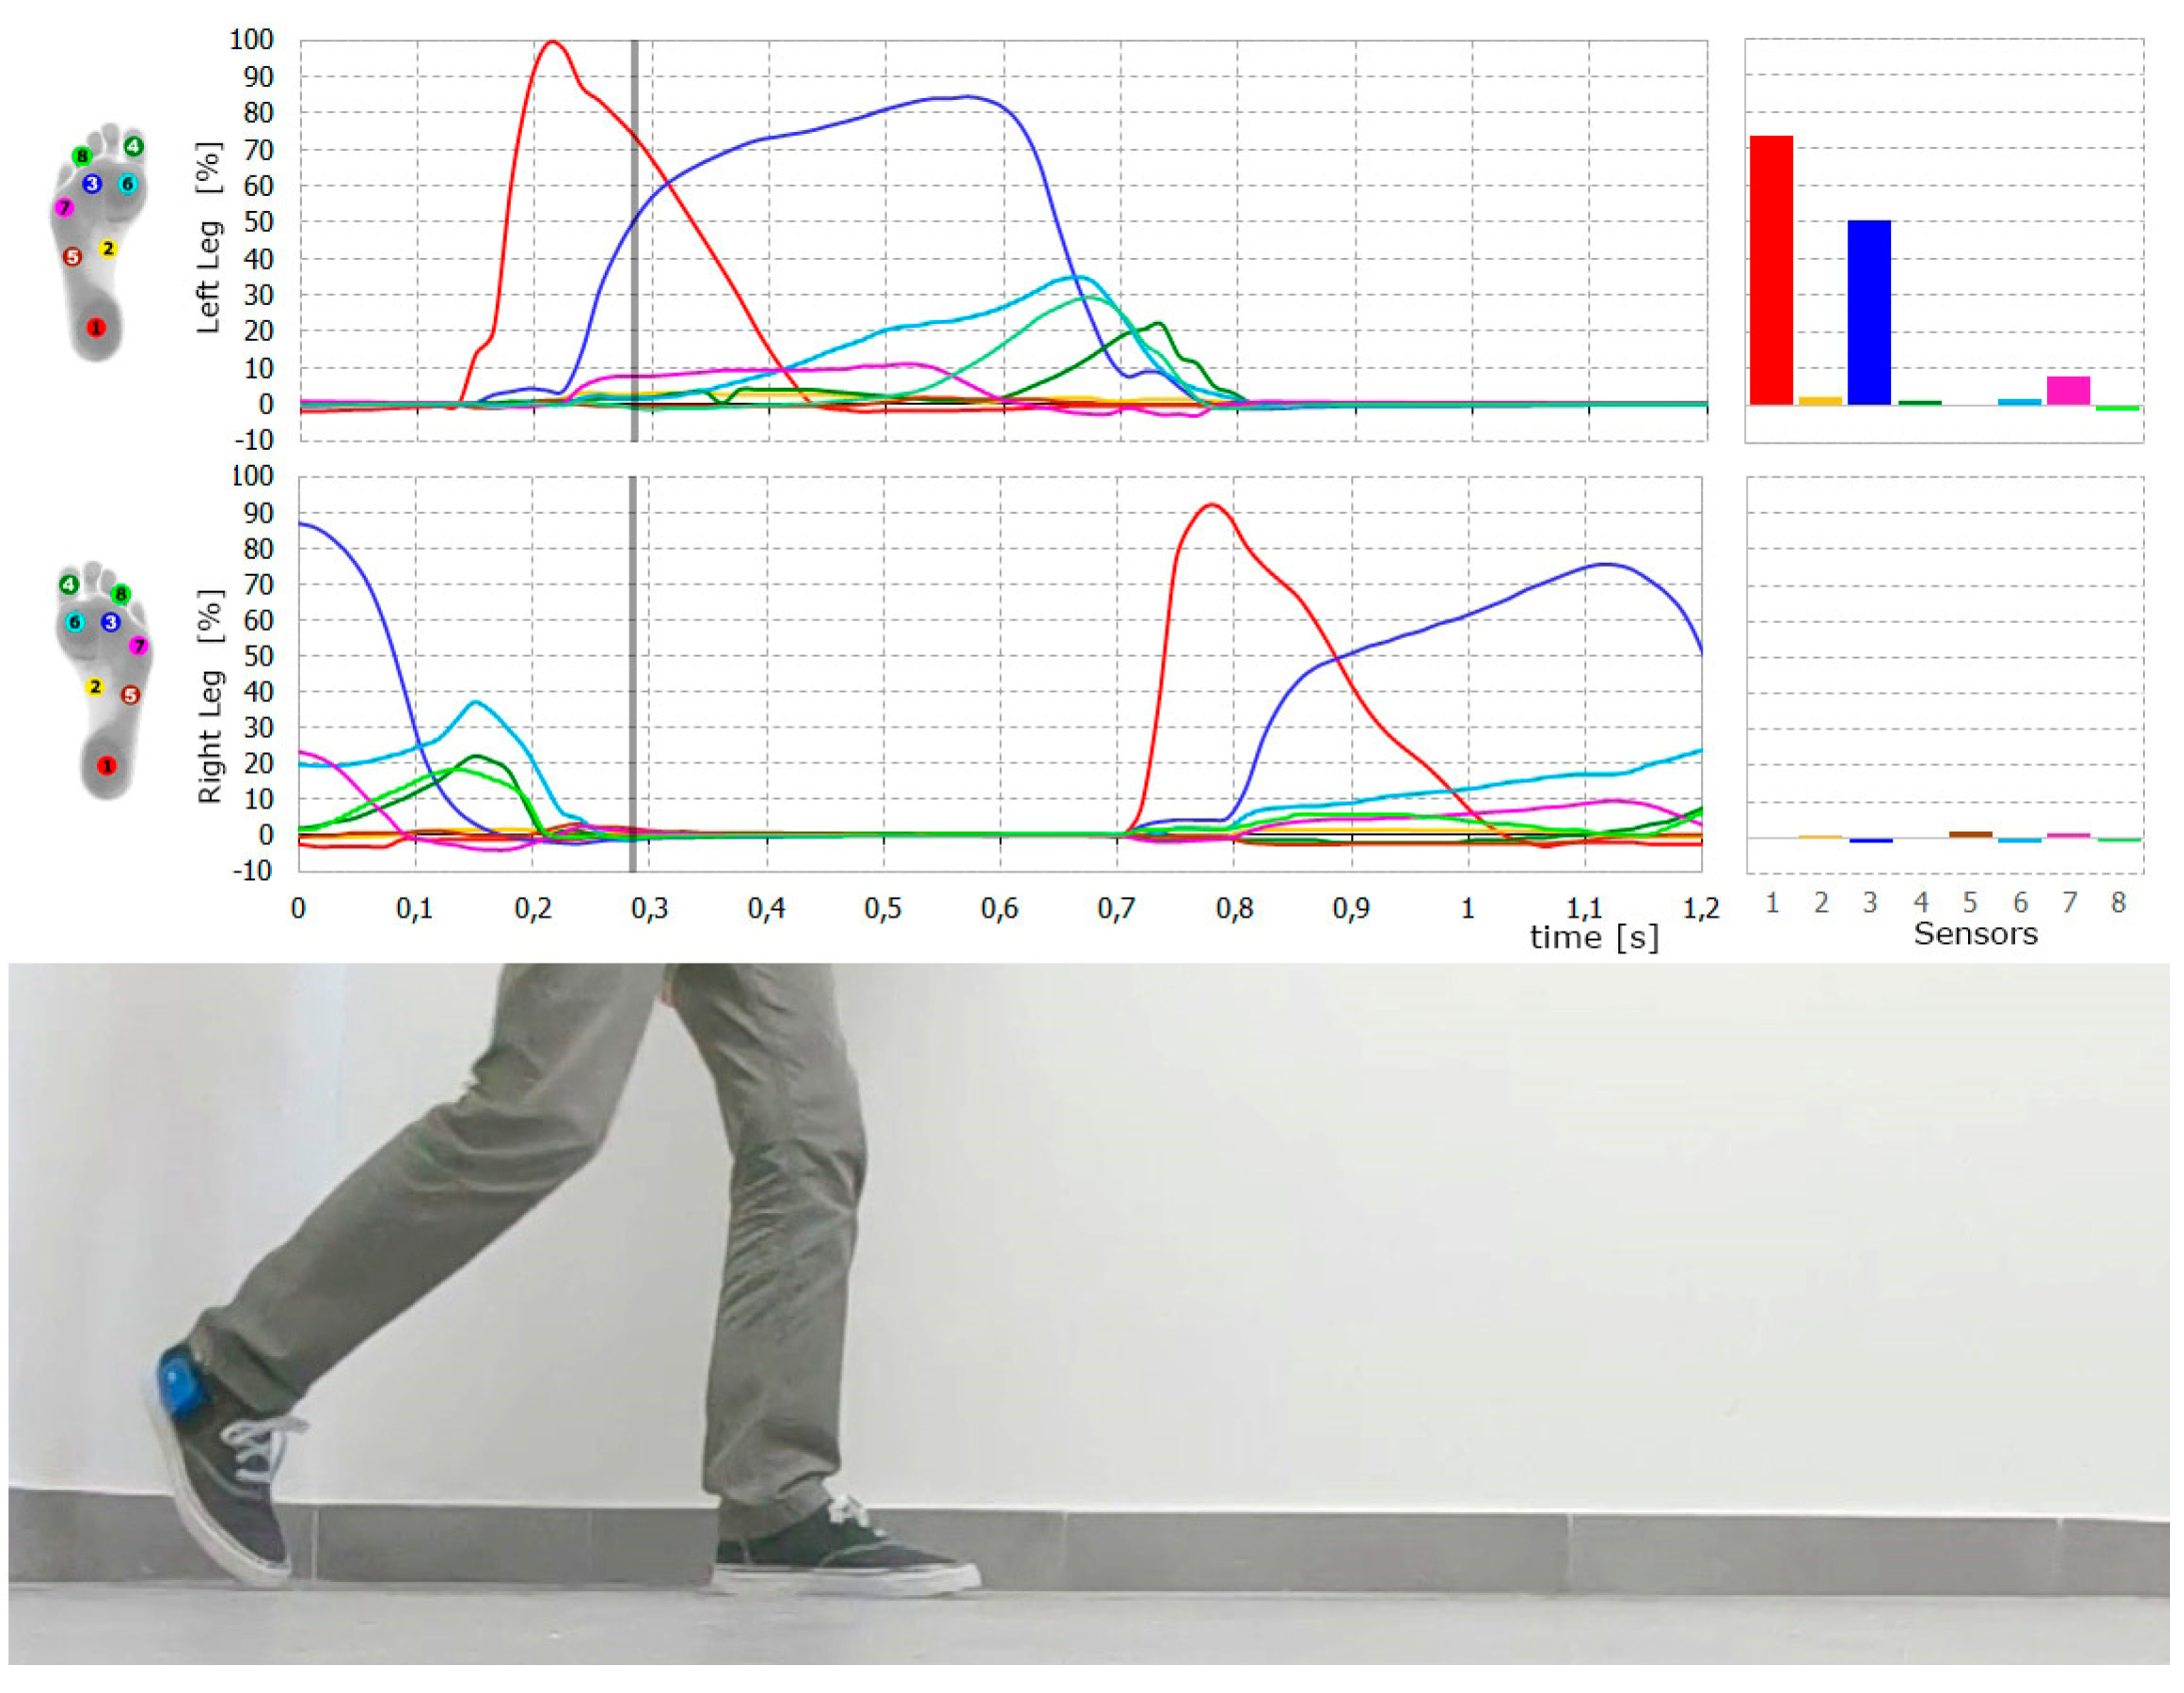
Figure 3.
End of swing phase (terminal swing) of the right foot and the corresponding point on the foot plantar pressure graph.
Figure 3.
End of swing phase (terminal swing) of the right foot and the corresponding point on the foot plantar pressure graph.
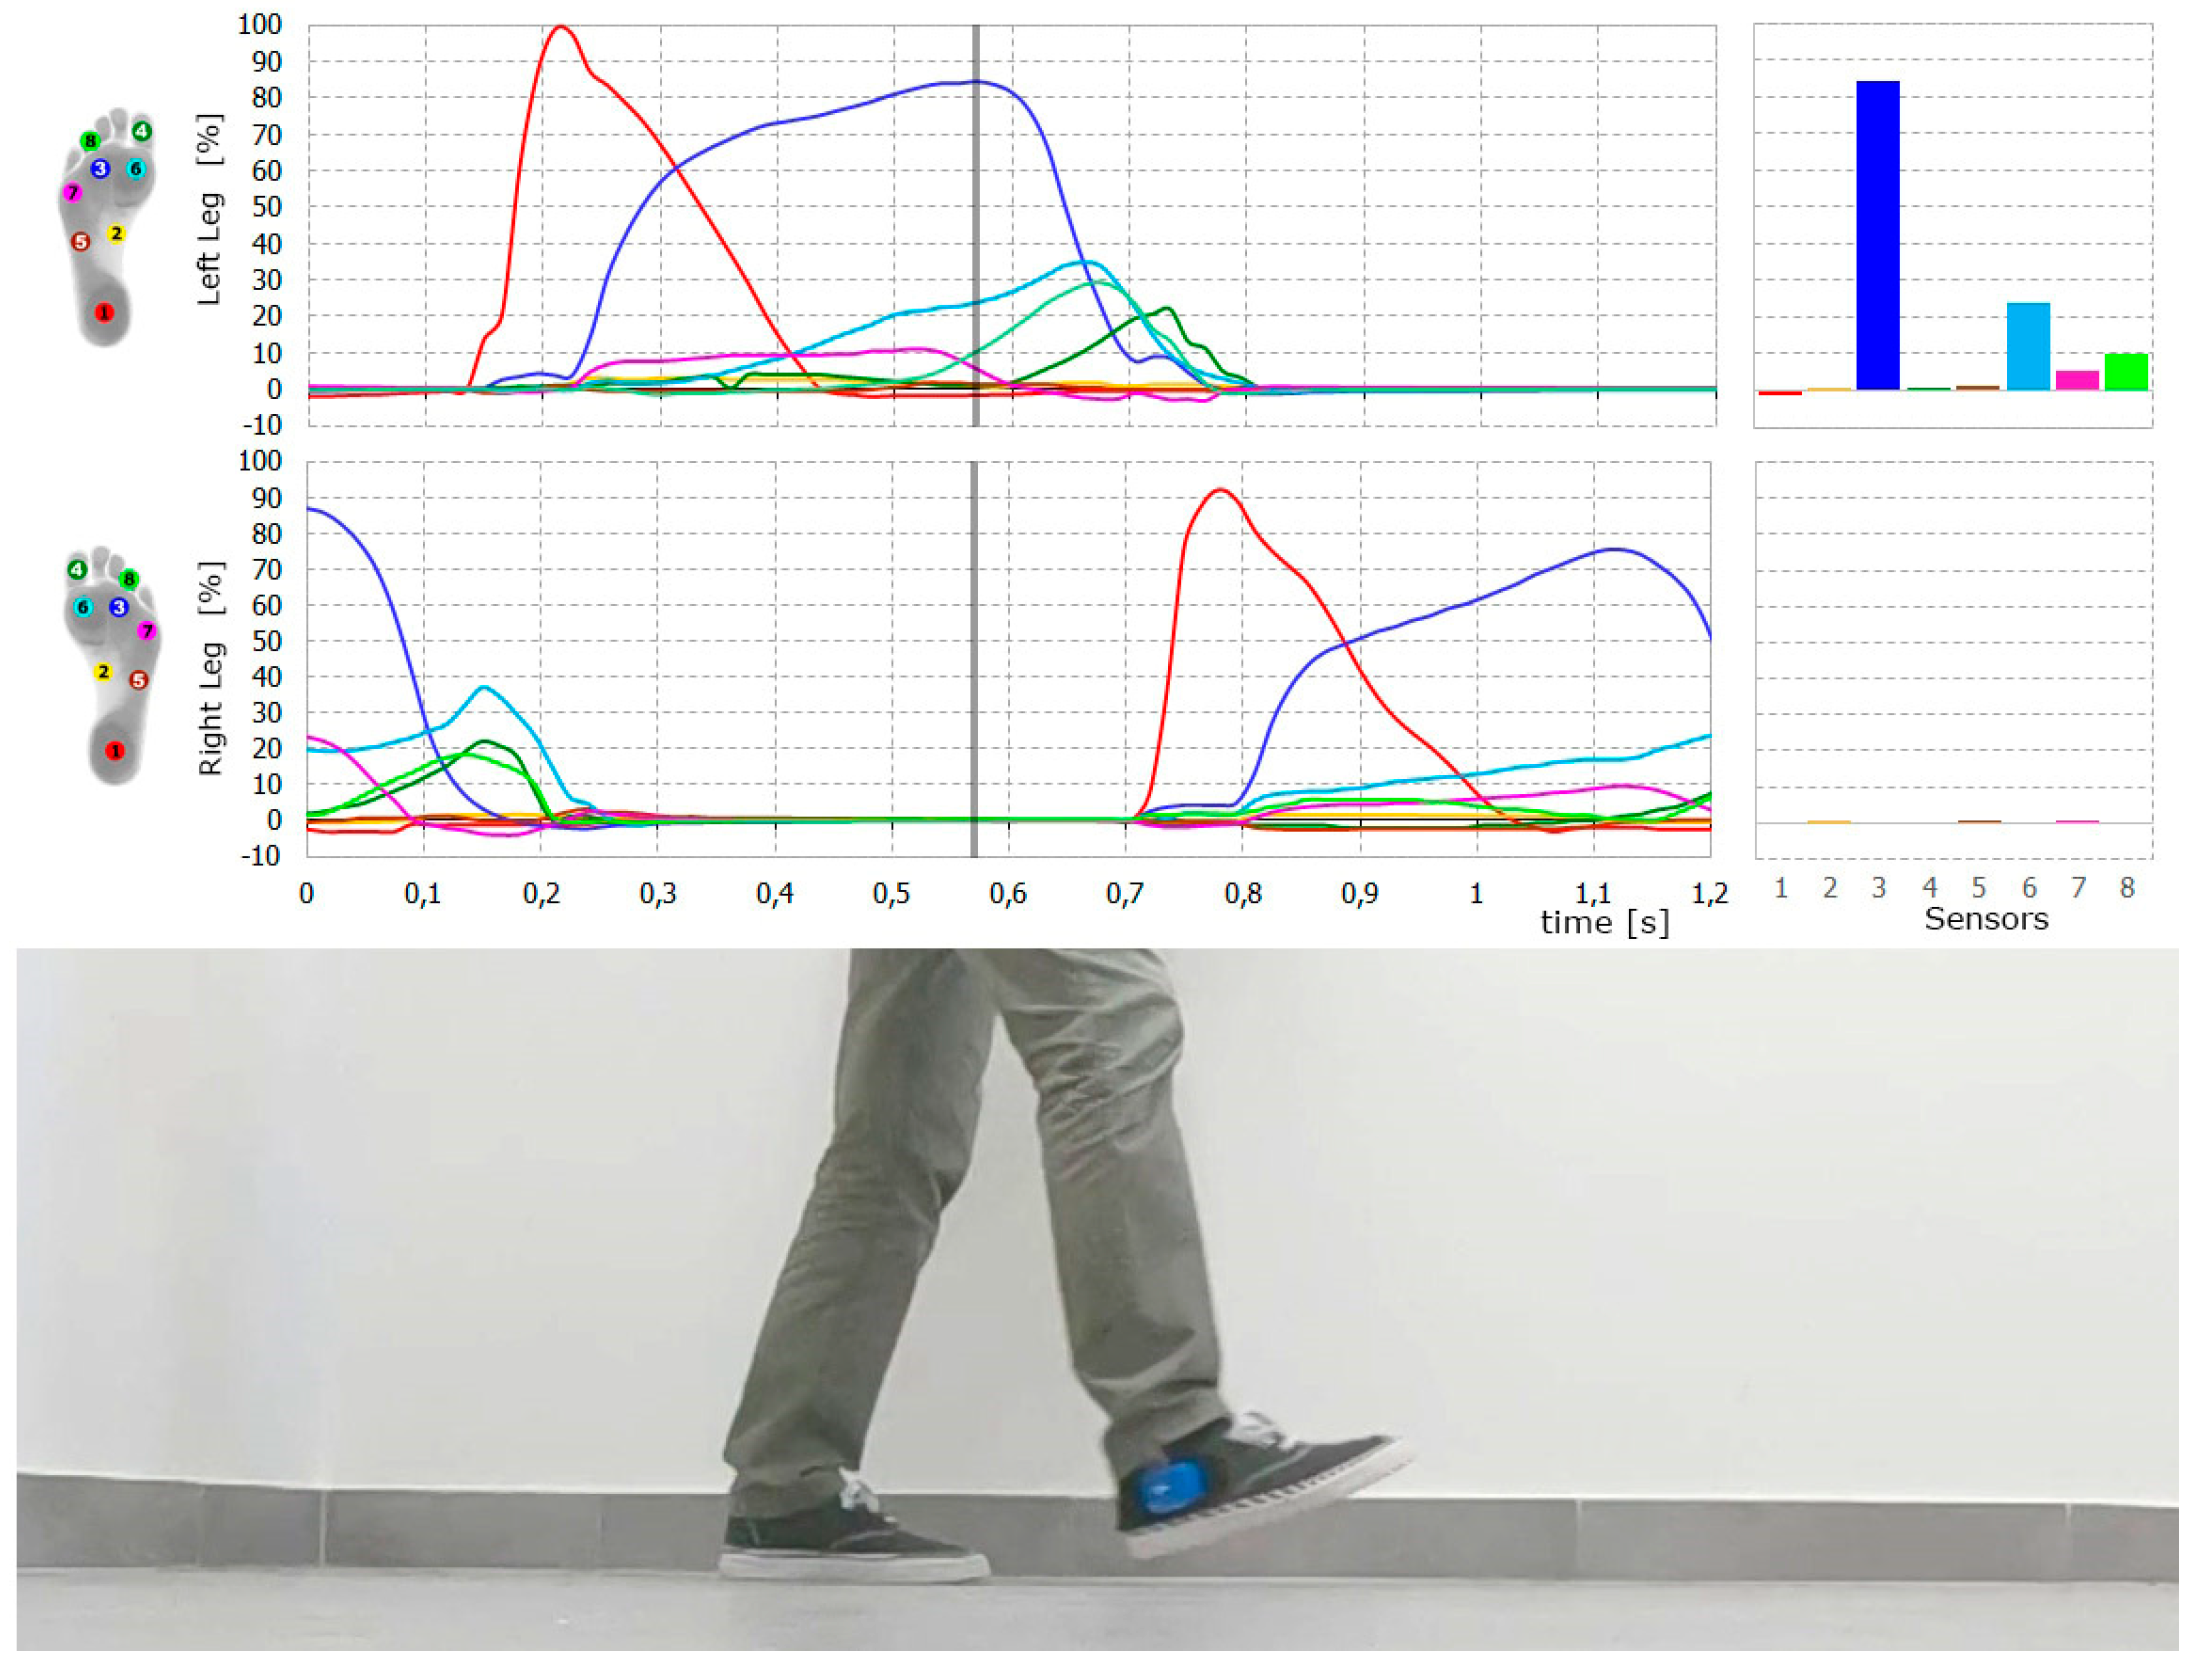
Figure 4.
Beginning of the stance phase (right foot heel strike) and the corresponding point on the foot plantar pressure graph.
Figure 4.
Beginning of the stance phase (right foot heel strike) and the corresponding point on the foot plantar pressure graph.
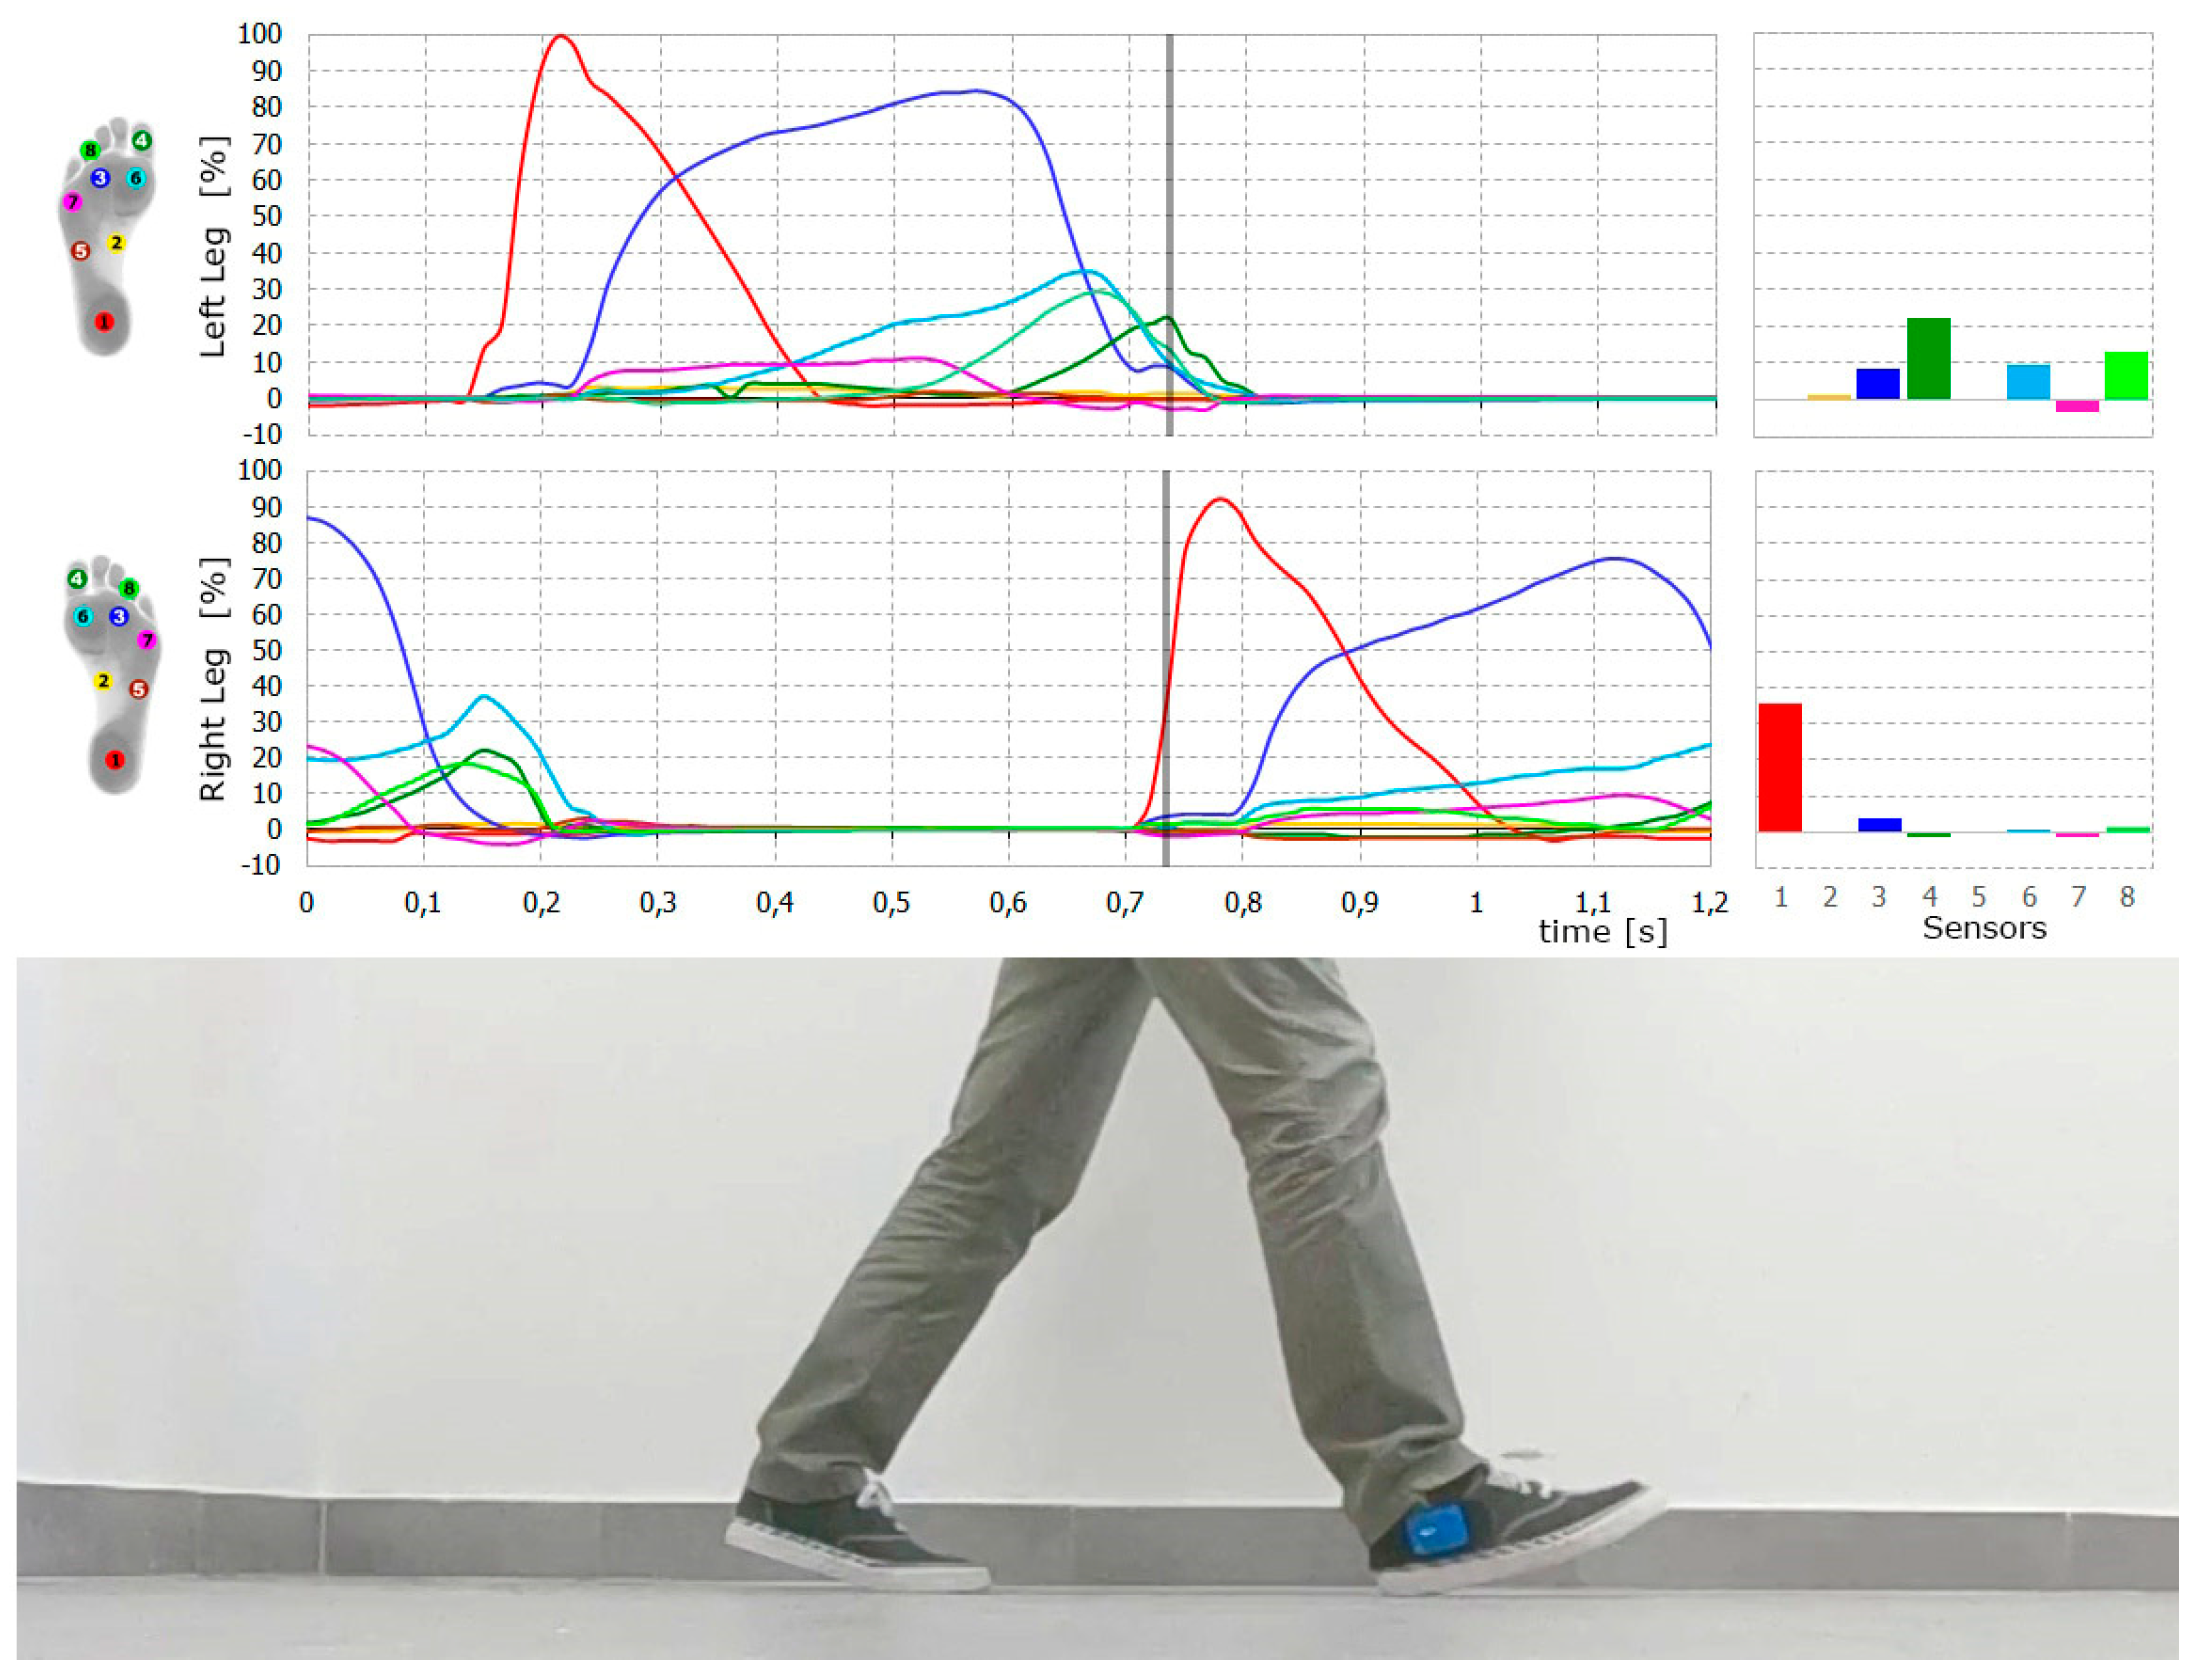
Figure 5.
Stride: average values of foot plantar pressure.
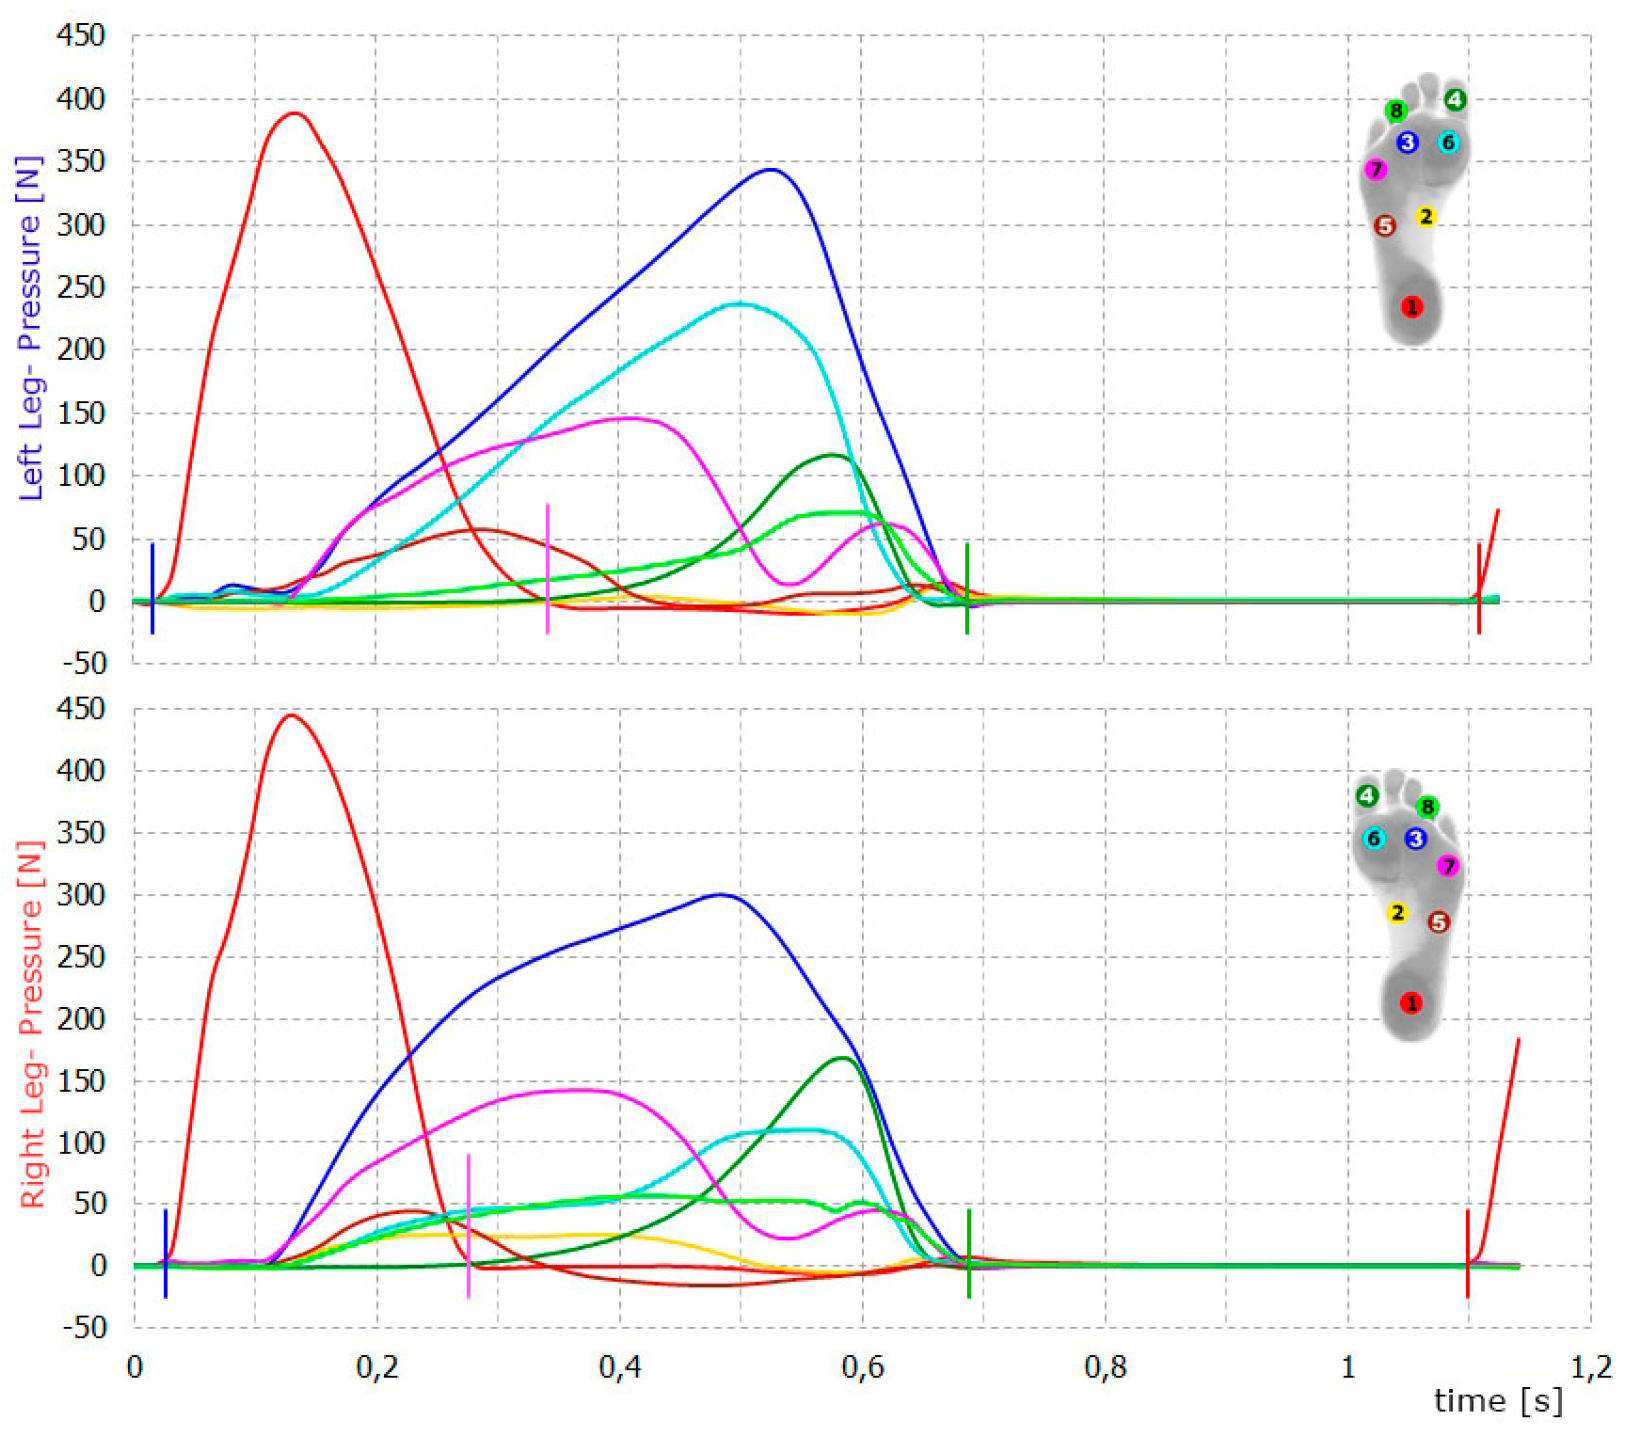
Table 1.
Demographic data.
| Group 1 | Group 2 | |
| No of participants | 13 | 10 |
| Age (yrs) | 44.8 ± 14.50 | 61.3 ± 7.1 |
| BMI (kg) | 25.4 ± 6.7 | 28.8 ± 5.5 |
Table 2.
Basic descriptive statistics with the Shapiro-Wilk test result.
| dependent variable | M | Me | SD | Sk. | Kurt. | Min. | Max. | W | p |
| Group 1 | |||||||||
| R - E1 | 90,84 | 58,00 | 58,42 | 0,73 | -1,11 | 31,10 | 188,80 | 0,85 | 0,026 |
| R - E2 | 135,27 | 144,00 | 56,45 | -0,11 | -1,61 | 58,40 | 215,50 | 0,91 | 0,188 |
| L - E1 | 112,58 | 102,80 | 60,13 | 1,32 | 3,61 | 19,00 | 270,40 | 0,89 | 0,105 |
| L - E2 | 166,32 | 146,80 | 98,83 | 1,48 | 1,20 | 80,00 | 378,30 | 0,78 | 0,004 |
| L %a | 10,62 | 11,25 | 3,64 | -2,55 | 7,48 | 0,00 | 13,40 | 0,70 | <0,001 |
| R %a | 10,46 | 10,85 | 4,07 | -1,45 | 3,59 | 0,00 | 15,20 | 0,86 | 0,047 |
| R - t1 | 29,35 | 30,20 | 6,06 | 0,18 | -0,72 | 21,10 | 40,90 | 0,94 | 0,483 |
| R - t2 | 32,46 | 31,90 | 6,72 | -0,05 | -1,07 | 20,90 | 42,90 | 0,96 | 0,761 |
| R - t3 | 61,75 | 61,10 | 1,92 | 1,09 | 0,51 | 59,50 | 65,90 | 0,90 | 0,121 |
| L - t1 | 30,74 | 30,90 | 5,17 | 0,28 | 0,02 | 22,10 | 40,90 | 0,99 | 0,997 |
| L - t2 | 30,71 | 32,60 | 4,91 | -0,12 | -1,42 | 23,60 | 38,40 | 0,93 | 0,340 |
| L - t3 | 61,45 | 60,60 | 2,33 | -0,29 | 0,38 | 56,50 | 65,20 | 0,95 | 0,575 |
| Group 2 | |||||||||
| R - E1 | 127,04 | 143,15 | 65,86 | 0,26 | -0,37 | 39,10 | 249,10 | 0,93 | 0,436 |
| R - E2 | 136,57 | 129,90 | 42,52 | 0,16 | -0,51 | 73,30 | 207,20 | 0,94 | 0,552 |
| L - E1 | 161,86 | 138,10 | 90,57 | 0,96 | 0,04 | 66,20 | 342,10 | 0,90 | 0,207 |
| L - E2 | 196,13 | 211,95 | 95,70 | -0,18 | -0,39 | 39,50 | 354,70 | 0,98 | 0,946 |
| L % | 11,54 | 11,60 | 2,01 | 0,24 | -1,73 | 9,40 | 14,40 | 0,87 | 0,097 |
| R % | 12,11 | 12,05 | 1,27 | 0,06 | -1,82 | 10,60 | 13,90 | 0,90 | 0,201 |
| R - t1 | 34,13 | 33,45 | 8,44 | 0,13 | -1,15 | 22,70 | 45,70 | 0,90 | 0,247 |
| R - t2 | 28,86 | 29,10 | 6,35 | 0,08 | 0,04 | 18,90 | 39,60 | 0,94 | 0,527 |
| R - t3 | 62,83 | 62,50 | 3,30 | 1,36 | 2,79 | 59,00 | 70,50 | 0,87 | 0,097 |
| L - t1 | 34,16 | 35,80 | 8,53 | 0,19 | 0,00 | 22,10 | 50,00 | 0,96 | 0,756 |
| L - t2 | 28,16 | 27,70 | 7,19 | -0,18 | 0,16 | 14,80 | 39,90 | 0,97 | 0,858 |
| L - t3 | 62,31 | 62,05 | 2,75 | -0,78 | 1,19 | 56,50 | 65,70 | 0,91 | 0,310 |
a – lack of data: n = 1. R means right foot, L- left foot. M –mean, Me – median, SD – standard deviation, Sk – skewness, Kurt - kurtosis, W – W statistic (Shapiro Wilk test). Variables t1,t2 and t3 indicate the percentage of the total stride time.
Disclaimer/Publisher’s Note: The statements, opinions and data contained in all publications are solely those of the individual author(s) and contributor(s) and not of MDPI and/or the editor(s). MDPI and/or the editor(s) disclaim responsibility for any injury to people or property resulting from any ideas, methods, instructions or products referred to in the content. |
© 2024 by the authors. Licensee MDPI, Basel, Switzerland. This article is an open access article distributed under the terms and conditions of the Creative Commons Attribution (CC BY) license (http://creativecommons.org/licenses/by/4.0/).
Copyright: This open access article is published under a Creative Commons CC BY 4.0 license, which permit the free download, distribution, and reuse, provided that the author and preprint are cited in any reuse.


