
Submitted:
21 February 2025
Posted:
21 February 2025
You are already at the latest version
Abstract
A project to assess air pollution at the National Archeological Museum in Naples was carried out. The main goal of the project was to develop and test a reliable, yet simple, monitoring system to be adopted at the same time in several exposition rooms. Nitrogen dioxide, hydrogen chloride, nitrous acid, and sulphur dioxide were the chemical species addressed by the technique. Monitoring was simultaneously performed in five rooms and pollutant concentrations were determined using two passive samplers. The sampling time was approximately one month per period. In addition to passive samplers, environmental data loggers were used to obtain temperature and relative humidity data. Results show high concentrations of nitrogen dioxide inside rooms, consistent with those found in outdoor environments and are close to the values calculated considering the air exchange rates, estimated through time gradients of ambient temperature. The minimum values were recorded in a basement room, having a low ventilation rate. The conversion of nitrogen dioxide to real surfaces produces nitric acid and nitrous acid. Large amounts of nitrous acid were found in exposition rooms up to 15 µg/m3, with maximum values in the basement room, where the air exchange rate is limited and the surface-to-volume ratio is the highest among the monitored rooms. Data analysis demonstrate that the system could discriminate between nitrous acid and nitrogen dioxide. The results show that, for the first time, passive samplers can overcome the problem of mutual interference between nitrogen-containing species. It was found that the nitrates and nitrites found in the alkaline passive sampler is not due to the interference of nitrogen dioxide. Nitric acid was also found in the gas phase, likely generated by dissociation of ammonium nitrate in particulate matter. Hydrogen chloride and sulphur dioxide are present at few µg/m3. Nitrous acid is the most relevant acidic species found indoors. The presence of pollutants was discussed in terms of the reliability of the analytical procedure and its significance for indoor air pollution.
Keywords:
indoor pollution
; MANN museum environment
; nitrogen containing pollutants
; passive samplers
; ion chromatography (IC)
1. Introduction
The protection of cultural heritage is one important priority for our society. It is a significant resource for economic growth in terms of services offered to tourism and in terms of cultural exchange. In Italy only, a report updated to 2020 by the Italian National Statistical Institute [1]; indicates that in 2020, 4,265 museums and similar institutions, public and private, were open or partially open, of which 3,337 museums, 295 archaeological areas, and 633 monuments or monumental complexes. In addition, there are a huge number of structures that are not open to the public, but where cultural heritages that require appropriate protection, [1]. Air pollution, in addition to being one of the main causes of hazard to human health, to local and global environment, and to materials, also poses a risk for the conservation of cultural heritage. Indeed, air pollution affects the cultural heritage exhibited outdoor and indoor, causing irreversible damages to the artworks [2].
The major polluting species that may be found inside museums and pose a risk to cultural materials are sulphur dioxide, nitrogen dioxide, nitrogen oxide, ozone, reduced sulphur gases such as hydrogen sulphide, and particulate matter [3]. To effectively protect artworks preserved in museums, it is therefore appropriate to develop monitoring activities with the aim of assessing the nature of contaminants and their concentration levels. This information, coupled with the evaluation of physical parameters such as temperature and relative humidity, can guide towards a more effective prevention of the potential damage to which the artworks may be exposed. Although no standard has been issued for the most common air pollutants of interest for cultural heritage conservation, some limits have been reported [2]. They range from practically zero to a few parts per billion; therefore, the assessment of pollution, especially in indoor environments (museums etc.) requires techniques characterized by sufficient sensitivity and reliability.
To fulfil this requirement, many measurement campaigns have been conducted in museums using analytical systems of different complexity [4-8]. However, these monitoring approaches have two limitations. The first one is derived from the fact that the techniques can be very expensive and require highly specialised personnel, leading to excessive expenses; in addition, they cannot be applied simultaneously in several rooms inside museums where air contaminants may show different concentrations. Secondly, most of these activities are usually carried out along a relatively short period of time. This does not allow the acquisition of data over a wide time horizon, which may be relevant for fully understanding the evolution of air pollution [9,10]. Although the most important museums can afford and perform sophisticated campaigns for the characterization of atmospheric pollutants, the number of sites that require protection and monitoring is very high. Therefore, the complexity and the cost of monitoring exclude many important cultural sites from a proper evaluation of risks posed by air pollution.
A direct solicitation for a very simple, low-cost, and easily adaptable methodology simultaneously in several sites, brought to the development of the monitoring approach discussed here. This approach offers significant opportunity for widespread applications, as it is compatible with reduced budgets, and can provide important and preliminary information for possible and desirable in-depth monitoring and control of atmospheric contaminants. The approach pursued in our strategy is very similar to that established by the EU Directive on ambient air quality (European Union, 2008), [11]. This, in fact, requires that in areas where the air quality does not present sufficiently extensive information, the so-called “Preliminary assessment” by means of indicative measurements should be carried out. This implies the use of less sophisticated systems than those required from the Directive for the areas for which monitoring with certified and an approved system is mandatory [12]. The preliminary assessment then provides data on which the control bodies may plan the final monitoring network in compliance with the Directive.
According to this approach, a simple system based on the use of passive samplers with the aim of monitoring the most important species causing damage to cultural heritage was adopted. The system is based upon the use of Analyst type passive samplers that have been developed for the measurement of acid gases [13] and nitrogen dioxide [14]. This configuration, integrated with an environmental datalogger for the measurement of temperature and relative humidity, have been used for a long time (1 year) monitoring in five rooms of one of the most important Italian museum: the National Archaeological Museum of Naples (MANN). This demonstration project provided useful data related to the presence of pollutants and also gave important and sometime unexpected results about the reliability of the suggested technique, especially when intended for the evaluation of nitrogen dioxide and nitrous acid.
2. Material and Methods
2.1. Monitoring Sites and Monitoring Program
The National Archaeological Museum of Naples (MANN) is an Italian museum extending over an exhibition area of 12,650 m2, and it is considered to be one of the most important archaeological museums in the world. The main exhibitions include Roman sculptures from the Farnese collection, a Pompeian collection that includes many finds from the area of Pompeii and other locations near the Vesuvius volcano [15], and an important Egyptian collection [https://www.electa.it/en/product/guide-to-the-egyptian-collection-in-the-mann/]. The museum is located in the central area of the city of Naples in a historical building with nearby streets characterised by very heavy traffic, causing significant atmospheric pollution episodes. A monitoring station near the museum is always measuring high levels of pollutants, especially nitrogen dioxide. The museum is extended over three floors and a basement. In Figure 1 site of the museum and maps of the ground and underground floors, with the locations of the monitoring sites are shown.
In this demonstration project, the locations were mostly selected considering that the ground level is the most exposed to air pollutants. It includes showrooms and deposits containing statues and marbles that are very sensitive to air pollutants of acidic nature [16,17]. Site E is still located on the ground floor but in a room (restoration laboratories) near the central garden, directly exposed to external air during working periods. Site A is underground, where many stone and marble artworks that are not yet exhibited to the public are stored.
In the above sites measurements were carried out for 9 periods resumed in the next Table 1.
As mentioned before, the average exposure of the samplers for the first eight periods was approximately one month. The 9th period had duration of approximately 4 months. The overall sampling period lasted approximately one year.
2.2. Passive Samplers and Exposition Shield
Analyst® passive samplers have long been used for the monitoring of air pollutants [13] The basic design of this kind of passive sampler is shown in Figure 2.
It is characterised by extensive laboratory evaluation and for high capacity, allowing sampling over extended periods of time (up to several months). The design also includes inlet diffusive screens made by steel and polyester to reduce air turbulence which are known to affect the diffusion mass flow. For this monitoring campaign, a three-place exposition shield was used. Two supports were used to accommodate two passive samplers for the monitoring of acids and nitrogen dioxide respectively. The third support accommodates a data logger for temperature/relative humidity monitoring (see par. 2.6). The shield includes a front steel net that protects the passive samplers from dust and insects and provides a first dumping of air turbulence. This is furtherly reduced by the inlet screens on the passive samplers.
The shields were fixed to the walls inside the rooms where monitoring was performed. They were placed at a height of 3 m in rooms B, C, and D, while in rooms A and D they were operating at approximately 2 m. The shields are characterised by an insignificant visual impact, which is essential for exposition rooms. An example of the exposition in room C is given in the next Figure 3.
2.3. Passive Sampler for Acids
Acids are directly adsorbed onto the active surface of quartz filters (Whatman QM-A) coated with an alkaline solution (1,8% Na2CO3 and 1.8% glycerine in water/ethanol 60/40). This solution is also used for the preparation of passive samplers intended for NO2 (see par. 2.4). Such an active surface is able to collect inorganic and organic acids with high efficiency and retention. After the sampling step, passive samplers were extracted with water and analysed by ion-chromatography (IC). The apparent flow rates used for the calculations of concentration from IC data are shown in Table 2.
These data were used to calculate the gas phase concentration by the concentration of relevant ions extracted from the filter. Since laboratory and field blanks approach zero, the minimum detectable amount of most acids is less than 0,2 ppb for a monthly sampling time. For nitrous and nitric acids, this amount corresponds to less than 0,4 µg/m3 and 0,6 µg/m3 respectively.
Earlier experimental data [13] confirm that the reproducibility of this type of passive sampler is within 10%–15%. This good result is also due to the positive effects of the inlet steel screens that smooth out any air turbulence at the inlet.
Data from passive samplers intended for acids, also include organic acids. However, formic acid was not measured because it was emitted by the plastic shields. Acetic acid was always found below the minimum detectable concentration.
One important point to be taken into account concerns the possibility that nitrogen dioxide interferes with the substrate of the active surface intended for the collection of acids, yielding nitrite and nitrate ions according to the following reaction:
should be taken into account (Eq. 1):
2NO2 + H2O →HONO + HNO3
This reaction generates nitrite and nitrate ions that are retained on the filter, then interfering with the same ions formed by nitrous and nitric acid respectively. Such interference can be very high if the concentration of nitrogen dioxide largely exceeds those of the two acids.
Reaction occurs on all surfaces, and its extent depends on many variables such as the type of surface, pH, and relative humidity. Thus, the extent to which nitrogen dioxide is converted into nitric and nitrous acid is difficult to estimate a priori. However, as it will be shown in the discussion of data, this reaction is practically not occurring on the active surfaces of passive samplers; thus, the devices can measure acidic species with sufficient reliability without the interference of nitrogen dioxide. The starting point is that, in case that reaction (Eq. 1) is occurring on filter, the resulting nitrite and nitrate ions ware irreversibly adsorbed on the surface, yielding a 1:1 ratio. Experimental values of this ratio are never close to 1:1.
Quality control was carried out by analysis of field blanks and replicates of passive samplers used in the monitoring campaign. For each monitoring period, one sampling site was supplemented by a pair of replicates and one field blank, i.e., a passive sampler not exposed. The variability found between replicates was on average less than 6-7%
It is worth observing that the monitoring campaign required just 10 passive samplers per period and then 10 analyses per month. This, in turn, positively reflects the low cost of the simultaneous monitoring activity for the selected five rooms.
2.4. Passive Sampler for Nitrogen Dioxide
Most of passive samplers intended for the monitoring of nitrogen dioxide make use of triethanolamine (TEA) as an active surface. TEA converts nitrogen dioxide into nitrite ions that can be measured by ion chromatography. Although a number of experimental campaigns have been carried out [18], data shows an evident poor reliability in terms of accuracy and precision. The reason of deviations may be attributed to the fact that TEA is not a perfect sink for nitrogen dioxide, as it was demonstrated by using a diffusion denuder [19]. Moreover, TEA collects nitrous acid which may be present in indoor environments at high concentrations, often higher than those of nitrogen dioxide. Since nitrous acid is also converted into nitrite ion, it may cause a 100% interference. The effect of nitrous acid has been largely overlooked since most application of nitrogen dioxide passive samplers was carried out in ambient atmosphere where the presence of nitrous acid is negligible.
The sampler used for collecting nitrogen dioxide in this campaign, was based on an active surface prepared by impregnating a 20-mm carbon paper disk (Envint srl, Montopoli di Sabina, Italy) with the solution described in par. 2,3. This procedure follows the method developed in [20]. As shown in previous studies, alkaline carbon directly converts nitrogen dioxide into nitrite ions that can be analysed by IC. The conversion of NO2 into nitrite ion was also confirmed by Raman spectroscopy [21]. The apparent flow rate for this type of passive sampler for NO2 is 12.3 ± 0.7 ml min-1.
After sampling, the filter disc is removed from the passive sampler, extracted with 5 mL of water for approximately 1 h, and analysed by ion chromatography (Dionex ICS-1000). The procedure is such that, for an exposition of 1 month, the minimum detectable concentration is less than 0,4 µg/m3.
Unfortunately, this kind of passive sampler for nitrogen dioxide was not fully exploited in the field. An interesting report [18] concluded that it can be used for the monitoring of nitrogen dioxide without further details.
The carbon filter paper treatment ensures that the blanks are practically zero, and zero is the field blank. The stability of nitrites on the filter is good, even in the presence of a huge amount of ozone, which could oxidise nitrites into nitrates, causing negative deviations. However, the alkaline carbon paper also adsorbs many other acidic substances. Very likely, nitrous acid (HONO) is included, yielding nitrites and potentially interfering 100% with the measurement of nitrogen dioxide.
The problem of HONO interference has been discussed in several papers, especially those in which triethanolamine was used [22], but it was considered unimportant because the ambient concentrations of HONO are much lower than those of NO2. Unfortunately, for indoor environments, this is not always the case. Some device was also developed to reduce this interference. A paper specifically addressed to this problem [23] describes a device based on three-layer active source. This device is not simple to prepare and to use. So far its use was limited to few applications in achieves and libraries.
Our measurements in MANN demonstrate that HONO is present at concentrations comparable to, and often, larger than that of NO2. As will be shown later, data demonstrate that the interference of HONO with the measurement of NO2 is not significant and that the passive samplers for nitrogen dioxide is free from the interference due to nitrous acid. This is one of the major technical findings for this monitoring campaign.
2.5. Analysis of the Samples
Analysis of the samples was performed by ion chromatography (IC). After exposure, the passive samplers were extracted with 5-mL water and analysed using an ion chromatograph Dionex ICS-1000. The analytical procedure ensures a limit of detection (LOD) and a limit of quantification (LOQ) in ppm are given in Table 3.
Both passive samplers were analysed using the same analytical procedure. Corrections for blanks are not significant and the reproducibility of collocated samplers shows standard deviation of 7%.
It is worth mentioning that, by using the apparent flow rate of pollutants into the passive sampler and for an exposition time of one month (30 days), it is possible to convert LOD and LOQ in ppm into concentrations in µg/m3. From the same table, it is possible to observe that for most of the species of interest, the minimum detectable concentration is well below 1 µg/m3 while reliable quantifications are above a few µg/m3. The analysis of both passive samplers used in this monitoring campaign uses the same procedure. This also reduces the effort required to improve the quality of the data and, clearly, reduce the cost of the monitoring campaign.
2.6. Data Logger
Data loggers (Figure 4) used for this campaign are based on the Honeywell HumidIcon™ Digital Humidity/Temperature sensor HIH8120 (Honeywell 1985 Douglas Drive North Golden Valley, MN 55422, USA).
This sensor ensures an accuracy level of ±2.0 %RH and a temperature accuracy level of ± 0.5 °C; thus, it is very suitable for indoor measurements. The sensor is within a small plastic box that fits the clips used to hold the passive samplers, and can then be placed into the same exposition shield. The data logger is battery operated and programmed to select the sampling frequency and to set up the internal clock. The sampling frequency can be selected from 1 to 60 min. For the specific application, the sampling frequency was 15 min, along which the dataloggers collect one measurement per minute and then average the data. Thus, the data logger records 4 average temperature and humidity data points every hour. At the end of the sampling period programmed for passive samplers, the data loggers were removed and connected to a personal computer from which an Excel file is extracted. After sampling and reading the output files, the data-loggers can be used repeatedly.
2.7. Outdoor Pollution Data
Monitoring of atmospheric pollution in the city of Naples is continuously carried out by the technical authority in charge, in this case, the Regional Agency for Environmental Protection of Campania ARPAC, (https://www.arpacampania.it/).
The Agency manages a monitoring network in compliance with European Union Directives. Data are regularly published at (https://www.arpacampania.it/bollettini). Our interest was in the station “Museo” which is located near the MANN museum. This station provides an hourly average of several pollutants, including nitrogen dioxide. Meteorological data were provided by the station “Osservatorio” in Naples.
3. Results
3.1. Results of the Monitoring Campaign (NO2)
The results from the monitoring campaign are shown in the next Table 4, where data from nitrogen dioxide (expressed in µg/m3) are reported for each period and for each sampling site (room). As mentioned previously, the data were deduced by assuming that the nitrites in the individual alkaline carbon passive samplers are due to the absorption of NO2 only.
Data shows that the average pollutant concentrations in Room A are much lower than those in the other rooms. This result is understandable because site A is located in the basement and intrusion of the outside air is strongly limited.
This is clearly shown in Figure 5, where temperature data from rooms A, B, and E during the four days of sampling period 5 are reported, while the day/night modulation is high for room E (~ 5-6°C), the modulation is much less for room B (about 1-1,5 °C) and close to zero for room A. In fact, as mentioned before, room E is the restoration room with a glass door opening several times during the work time (about 09:00 AM to 05:00 PM) to allow workers and visitors to be in and out. Therefore, considering the temperature trends in the exposition rooms, site A shows the minimum intrusion.
The relationship between outdoor and indoor concentrations is also shown in Table 4. Indoor averages ranged from 11 to 25 µg/m3, whereas the average outdoor concentrations during the sampling periods ranged from 37 to 47 µg/m3. The relationship between indoor and outdoor pollution by NO2 is shown graphically in Figure 6.
Outdoor values are fairly constant along the sampling periods, while indoor data show minimum values during periods from 4 to 7, i.e, during winter. In fact, in this period windows and doors are usually closed, limiting air intrusion from outside. However, as it is shown in Table 4, room E has a similar indoor/outdoor ratio of the other rooms, even though is the most exposed to external air as shown in Figure 6.
3.2. Time Evolution of Outdoor Air Pollution
In order to explain this apparent contradiction, Figure 7 shows an example of the time evolution of NO2 pollution in the city of Naples, as recorded by the monitoring station near the museum on the day January 15, 2022, when high NO2 concentrations were observed. A typical trend was an increase in nitrogen dioxide concentration in the morning, coinciding with an increase in vehicular traffic, reaching a high value of more than 100 µg/m3. In late morning, atmospheric turbulence is experienced: air from the free troposphere dilutes the ground air, and the concentration of air is drastically reduced. In the late afternoon, the atmospheric stability was restored, and the pollutant concentration increased again to high values. Overnight, the reduction in traffic emissions decreases the pollutant concentration. Atmospheric turbulence developing in the afternoon is also responsible for the fumigation of ozone, which reaches maximum values. Therefore, even though room E is exposed to outdoor air, the outdoor atmosphere is depleted of nitrogen dioxide. It is worth stressing that the turbulence period in which air pollution is relatively low is about 3-4 hours in winter and about 7 hours in summer.
The behaviour shown in Figure 7 is typical of periods in which synoptic meteorological situation is dominated by high pressure. The air advected from aloft from late morning to late afternoon, as said, is rich in ozone that shows maximum values just during the clean air window, (see Figure 8).
Ozone fumigation led to ground concentrations up to 100 µg/m3 (about 50 ppb) and, in some instance, even more. As is well known, ozone is another polluting species that may impact several types of materials. Indoor concentrations of ozone are usually low and were not recorded during this campaign. Since most of the artworks saved in the museum consist of stone and marble sculptures, the effect of ozone is not very significant. On the contrary, ozone produces well documented damages on other artworks such as paints, [24-26]. According to the preliminary nature of the monitoring campaign, ozone is one of the best candidates for a future monitoring protocol.
From the data already shown in Figure 7 and Figure 8, it is possible to understand the evolution of HONO in the outdoor environment. Nitrogen dioxide starts to increase in concentration at approximately 07:00 in the morning. However, at that time, the ozone concentration was low or near zero because it is consumed in the boundary layer. In any case, the solar radiation intensity in the photodissociation range useful for ozone (wavelength between 240 and 320 nm) is not sufficient to promote the formation of OH∙ radicals necessary to start photochemical processes. However, OH∙ radicals are easily provided by HONO, which is formed on real surfaces (see Eq (1)), [27]. This explains the formation of NO2 in the morning by NO oxidation. In this study, no outdoor HONO measurements were carried out.
3.3. Other Indoor Pollutants
As said before, the experimental apparatus adopted for sampling in the museum provides information about the presence of indoor HONO. This species was collected on alkaline quartz fiber filters and detected as nitrite. The results for HONO during the sampling campaigns are shown in the following Figure 9a, which shows the averages for sites B, C, and D, compared with the average NO2 concentrations.
The amount of HONO found in the three rooms is about 1/3 to 1/10 that of nitrogen dioxide. No clear correlation is between the two pollutants along the sampling period. The same graph for rooms A and E are shown below in Figure 9b,c, respectively.
While room E shows about the same figures of the average values in Figure 8a, data in room A shows that the amount of HONO and that of NO2 are more or less the same and, in some instance, the concentration of HONO is higher than that of NO2. Concentration levels for sulphur dioxide are shown in the next Figure 10, which show average data on the three sampling sites B, C and D.
They are within a few µg/m3 and do not show a definite trend. The average concentration in the site A, like NO2, is less than the average of the other four sampling sites. This indicates that sulphur dioxide is coming from air outside the museum. Unfortunately, sulphur dioxide levels measured by the Naples monitoring network approach values that are near the minimum detectable concentration. Therefore, no direct comparison between the two sets of data is possible. The amount of SO2 is within the range 1-3 µg/m3. The next Figure 11 shows the measured concentrations of HNO3 as detected through the alkaline quartz passive sampler.
The Figure 11 shows the concentrations found in site A with the average concentrations found for the other four sites B, C, D, and E. As expected, the concentrations found at site A were much lower because of the limited air exchange with the ambient atmosphere and because of the high deposition velocity for this species [28]. Even for HNO3, no data are available for external ambient air. However, the data seem quite reasonable and coherent with those for NO2.
Figure 12 shows the concentration trend of Hydrogen chloride that is monitored by chloride ions found on the fiber glass sampler.
Hydrogen chloride shows very low concentration, if compared to those recorded for nitric acid. These measurements are based on the amount of chloride ions found in the glass fiber filter, so it is expected that they are affected by some uncertainty due to ubiquitous presence of chloride ions.
4. Discussion
This chapter is dedicated to a discussion of the results and has been organized into sub-paragraphs, each concerning the individual measured species. Emphasis is placed on nitrogen-containing compounds because they are in relatively high concentrations, causing fast deterioration of the exposed artwork.
Dataloggers are essential in monitoring the evolution of temperature and relative humidity in the exposition rooms. However, they are also valuable because they provide data to estimate the evolution of pollutants entering the museum (Ci) from outside (C0). The indoor/outdoor concentration ratio, can be expressed by the following Eq. 2,:
where:
Air-exchange rate, usually expressed as h-1, i.e., exchanges per hours
Volume of the room (m3)
Surface area of the room (m2)
Deposition velocity of the pollutant (mass of the pollutant deposed on a unit surface per unit time).
By knowing the deposition velocity of an individual pollutant and the geometrical characteristics of the exposition rooms (V and S), it is possible to estimate the concentration ratio (indoor to outdoor) if the air exchange rate a is known. As is well known, many pollutants show a time trend that can be followed using equation 2. This is, for instance, the case of ozone that shows a time trend defined by a vertical processes occurring in the atmosphere, causing the fumigation of this pollutant from the free troposphere to the ground (see Figure 7).
In order to estimate Ci, it is necessary to know the term a, air exchange rate. This can be achieved using various techniques [29-31]. However, most of these experimental methods are expensive, time consuming and not simple to implement. According to our main goal, which is to obtain preliminary information on the museum atmospheric environment with simple methods to be reproduced in many locations, we attempted to estimate the air exchange rate by the difference in indoor-outdoor temperatures. In fact, the exposition rooms of MANN are not conditioned. The size of the rooms is such that the visitor effect can be neglected, and the low surface-to-volume ratio is such that the thermal effects of the walls can also be neglected.
In this hypothesis, the indoor air temperature Ti can be expressed as a function of the outdoor temperature To according to Eq. 3:
where dTi is the increase (or decrease) in indoor temperature caused by ventilation of a volume of air dV. To and Ti are the outdoor and indoor temperatures, respectively. Unfortunately, this equation cannot be integrated directly because the variables involved in are both time dependent. The indoor temperature in an unconditioned room, such as those of the MANN museum, will be just the low -pass-filtered outdoor temperature. Therefore, in a steady state, the indoor temperature will be the same as the outdoor temperature. However, the thermal capacity of the surfaces and the poor mixing of outdoor air are such that strong deviations from this simple model can be expected.
Our simple approach starts by assuming that the time trend of indoor temperature follows the external temperature and that the maximum value of room temperature can be used in Eq. (3). Then it is possible to estimate, with the said uncertainties, the value of dV and then the value of a.
Several calculations through the periods of monitoring periods, showed that the term dV/V is about 0,02 with little difference between the exposition rooms and monitoring periods. For instance, in room B (dimensions 36 x 18 x h7 m), the volume is about 4500 m3, while the total surface area is 2000 m2. The ratio S/V=2000/4500=0,44 m-1.
For the term deposition velocity, it is possible to determine the average deposition velocity of all surfaces in a room from Eq. 3, as well as the so-called ‘surface removal rate’ Vd (S/V). This rate is directly comparable to the air exchange rate. The deposition velocity of a particular pollutant varies within different material types and under different conditions, such as changing relative humidity [32]. A study of museum buildings showed a surface removal rate of 0.4 h-1 for a large and open gallery [33]. A surface removal rate of 0.4 h-1 means a deposition velocity of approximately 1 m h-1.
Adapting these data to Eq. 3 and using the value of deposition velocity ranging from 1 to 0,1 h-1 then the estimated Ci/Co ranges from 0,043 to 0,31. The ratio between the NO2 concentrations found in the outdoor and indoor ranges between 0,5 and 0,3, which fits the expected concentration ratios calculated by our simple model.
4.1. Nitrogen Dioxide (NO2)
The average concentrations of NO2 pollutant reported in Table 4 appear to be relatively constant, except for the data from room A. This means that the exposition to this pollutant in rooms B, C, and E are approximately the same. This could not be consistent with the observation that data from site E should be higher because this room is more exposed to external air. However, it should be considered that the room is mostly affected by external air during the work time; while, as shown in Figure 6 and Figure 7 external air pollution is modulated in such a way that during the working time, the concentration of pollutants (except ozone) in the external air is low.
The concentration of nitrogen dioxide in the external air is just a few µg/m3 over the standard fixed by the European Union for the protection of public health at a yearly average of 40 µg/m3 [34].
The ratio between the concentrations found in the outdoor and indoor range was between 2 and 3.5. This result is consistent with similar data found in different museums and other indoor environments where no internal sources of NOx were present [35]. The highest ratios between outdoor and indoor data were found for periods 4 to 7, i.e., in autumn–winter, when most of the atmospheric stability processes are likely to occur and when intrusion from external air is limited by windows and doors closed during this period of the year.
The relatively high levels of air pollutants found inside the museum are associated with the evolution of pollution in the outside environment. As mentioned before, the area of the MANN museum is characterised by intense emissions, especially by vehicles, which cause high concentrations of primary NOx pollutants. These, in turn, when irradiated by sunlight, generate many photochemical pollutants, leading to high concentrations of nitrogen dioxide (as seen in Figure 6).
Nitrogen dioxide concentrations start to increase at approximately 6–7 AM, reaching a level of more than 100 µg/m3. In the late morning through the early afternoon, the concentration drops to low levels, increasing once again in the late afternoon, when it reaches values of more than 120 µg/m3. This behaviour is very similar to that observed in many locations and can be easily explained by considering the time development of the boundary layer. Overnight, the layer is quite stable, and in the early morning, primary pollution increases because of intense traffic. Solar irradiation in the morning provides heating of the ground, resulting in turbulence that causes mixing of ground air with that in the free troposphere. At this time, ozone concentrations increase, whereas nitrogen dioxide concentration decreases because of mixing with relatively clean air advected from the free troposphere. In the late afternoon, solar radiation decreases and a ground-based mixed layer is again established.
In this residual layer, the reactions of radicals are very active, oxidising nitrogen oxides into nitrogen dioxide. Overnight, these reactions are quenched, and the decrease in emission decreases the nitrogen dioxide concentration to low values. In conclusion, two peaks were experienced: one in the morning and the other in the afternoon, with a minimum in the early afternoon. In most cases, the daily maxima occur in the evening, whereas in some cases, they are recorded in the morning. Such general behaviour is reproduced throughout the year, although in summer, due to the more intense solar radiation, the window for clean air advected from the free troposphere is much wider and can be as large as 7 hours, instead of 3–4 hours in winter.
4.2. Sulphur Dioxide (SO2)
Sulfur dioxide has long been considered an important pollutant in museums. Figure 9 shoes that the concentration levels are in the range 1-3 µg/m3 and do not show a definite trend. The average concentration at site A, similar to NO2, was less than the average of the other four sampling sites. This is a clear indication that sulphur dioxide is coming from the air outside the museum. Sulphur dioxide is fairly correlated with nitrogen dioxide (Rsquared=0,77), demonstrating that both of them are coming from intrusion by external air.
Unfortunately, Sulphur dioxide levels measured by the public Naples monitoring network are approaching values near the minimum detectable concentration. Therefore, no direct comparison between the two sets of data is possible.
4.3. Hydrogen Chloride (HCl)
Acids measured using the suggested technique include hydrogen chloride and nitric acid. The latter is reported in Figure 10, which shows the average values found in the data from locations B through D. Data from site A do not show a definite difference from those from other sites. For HCl, (Figure 11) the observed concentrations are about 1 µg/m3. This amount is very close to the minimum detectable concentration and is derived from chloride ions extracted from the quartz alkaline passive sampler. As is well known, contamination may play an important role in the analysis of chlorides; thus, the reported data are not of sufficient reliability for further discussion. However, the data show that HCl does not reach significantly high values; therefore, it does not imply an excessive risk.
4.4. Nitric Acid (HNO3)
Nitric acid shows relatively high concentrations of up to 6 µg/m3 . This species is generated by the reaction of nitrogen dioxide with OH∙ radicals (according to the following Eq. 4):
NO2 + OH∙ → HNO3
Under ambient conditions characterised by intense photochemical activity, the amount in the atmosphere of both NO2 and OH∙ radicals are expected to be high; therefore, the formation of nitric acid is highly probable. It is worth mentioning that nitric acid in ambient air reacts immediately with ammonia, generating ammonium nitrate in particulate matter according to the reversible reaction (Eq. 5):
HNO3 + NH3 ↔ (NH4)NO3
From Figure 10, it appears that HNO3, as expected, shows the highest concentrations during sampling carried out in summer. During this period of the year, the temperature and humidity are such that ammonium nitrate may dissociate back into HNO3 and NH3, [36]. Thus, nitric acid inside the museum may be generated by particulate matter entering the museum from outside. Ammonium nitrate may migrate inside the rooms where thermodynamic conditions for dissociation may be present, i.e., low humidity and high temperature. In order to show some data about the occurrence of thermodynamic conditions leading to the formation of nitric acid from particulate nitrate, we used data from the environmental data loggers. By adapting the formulas already developed in reference [36] for the calculation of the deliquescence humidity (RHD) and the dissociation constant Kn expressed in ppb2, it is possible to estimate the concentrations of nitric acid:
ln Kn =84.6 − 24220/T − 6.1ln (T/298)
ln (RHD)=723.7/T + 1.7037
The evaluation of RHD (Deliquescence Relative Humidity) is the premise for applying relationships/Equations 6 and 7. If the ambient humidity is higher than the RDH, ammonium nitrate is in the deliquescent liquid phase and thus it is not dissociated. From the data from T and RH obtained using data loggers installed in the sampling rooms, Table 5 can be compiled. This shows that the calculated concentration of HNO3 in equilibrium with ammonia is approximately 2 ppb in winter, reaching 8 ppb in summer. Because the range of observed concentrations is between approximately 6 and less than 2 µg/m3, these data are consistent with the calculated [HNO3]eq.
Therefore, the dissociation of ammonium nitrate particulate matter may bring a relatively high amount of this acid inside the museum rooms. It is worth stressing that particulate nitrate does not need to be formed locally because it can be transported over long distances [37].
The evaluation of nitric acid merits additional comments. This species was evaluated using nitrate ions extracted from an alkaline quartz passive sampler. Simultaneously, the alkalinized carbon paper sampler intended for NO2 was also in operation; therefore, it could be expected that the nitrates found in both samplers are the same. However, the behaviour of the samplers with respect to nitric acid was completely different. The average values in the quartz filter show a mean value of 2,14 against 1,94 from the carbon paper. The standard deviation of the first set was 2,14, whereas 1,11 was the value observed for the second set because the nitrates found in the carbon paper filter did not show any time variation. For instance, there were no significant differences between the data collected in room A and those collected in other rooms.
One hypothesis could be the oxidation of collected nitrites by ozone. However, this is in contrast with experimental data that exclude the collected nitrites from being oxidized to nitrate by ozone [20] and, in addition, the amount of indoor ozone is expected to be very low. In another paper, it was shown that the adsorption of peroxy-organic nitrates on alkaline carbon surfaces also yields nitrates [38]. Because the concentration of these species is very low, at least compared with that of nitric acid, this source is to be considered not significant. Thus, the presence of nitrates on the carbon paper sampler has not yet been explained and merits further investigation.
4.5. Nitrous Acid (HONO)
Nitrous acid is a weak acid (Ka=4,0 10-4) that, at least in principle, moderately impacts the conservation of artworks. However, its presence in the indoor environment is a clear evidence of the occurrence of reaction (Eq. 1) that, with nitrous acid, also generates nitric acid, a strong and oxidant acid that has a definite impact on the conservation of exposed materials. In addition, HONO is important for human health because it may generate nitroso-amines [39]. Therefore, investigations into the presence of HONO in the MANN museum are considered of high interest. The sources of indoor HONO, [40] can be essentially caused by:
- -
- the reaction (Eq. 1) occurring on the surfaces followed by HONO desorption, or
- -
- The intrusion of HONO from the external atmosphere.
The extent of reaction (1), depends on the surface, ambient temperature, and relative humidity. Additionally, the reaction is favoured by the surface-to-volume ratio (S/V), which, in ambient air, depends on the height of the mixed layer. After the conversion of NO2, HNO3 is retained on the surfaces, and HONO can be desorbed into the atmosphere. During atmospheric stability conditions, where the surface-to-volume ratio of the boundary layer is high, the formation of HONO leads to noticeable concentrations in ambient air that can reach several pbbs [41].
Consequently, during the early mornings, relevant amounts of HONO may be formed, and thus photolysis into OH∙ radicals may occur. If high concentrations of nitrogen oxides are present, high amounts of nitrogen dioxide may also be generated by reaction radicals. This important aspect should be properly considered in future monitoring initiatives.
Using the same reaction mechanism (Eq. 1), we can postulate the presence of HONO inside museum rooms. Since the formation of HONO depends upon the surfaces and the S/V ratio [41, 42], it is first useful to look into these ratios for the rooms selected as monitoring sites. The amount of HONO, as shown in Figure 3 and Figure 4, ranges from a few through 15 µg/m3 and is only weakly correlated with NO2 that shows concentrations ranging from 10 to 25 µg/m3. The amount of HONO decreased during the last period of monitoring, exhibiting maximum values during the first three periods. This is probably due to an increase in ambient temperature causing a more efficient desorption of HONO formed on surfaces.
If we consider HONO found in room A, characterised by a higher S/V ratio, then the amount of HONO is similar to that of NO2 and sometimes higher, as shown in Figure 4. This confirms the hypothesis that the HONO found in the museum can be attributed mostly to the indoor formation through Eq. 1 on the museum surfaces.
An important point to consider is the possible interference of HONO in the measurement of NO2. In principle, alkaline carbon paper can quantitatively collect nitrogen dioxide and nitrous acid. On the other end, the active surface of the passive sampler intended for collecting acids, collect HONO. In this hypothesis, the true concentration of nitrogen dioxide [NO2]0 is a value lying between [NO2]1 and [NO2]2, where the former is the value from the carbon paper filter and the second is the difference between the value [NO2]1 and the concentration of HONO derived from the quartz alkaline filter:
[NO2]1 < [NO2]0 <[NO2]2 = [NO2]1-[HONO]
Data relevant to rooms B, C, and D show that the term [NO2]2 is constantly less than [NO2]1. However, data from room A, which is characterized by a higher [HONO]/[NO2] ratio, show that the difference is often less than zero. This means that the interference of the HONO is very low. Data of the nitrite/nitrate molar ratios in acid passive samplers are reported in the next Table 6.
As expected, the mean molar ratio is always greater than 1, especially in room A, demonstrating that nitrites and nitrates in the acid filter are not generated by the disproportion of nitrogen dioxide.
This result (nitrous acid collected on the alkaline filter and not on the carbon filter) is not fully unexpected because several acid species, such as formic acid, are not collected by the alkalinised carbon paper filter. As mentioned before, in this campaign formic acid was not detected because it was emitted by the plastic shield used and then collected in high amounts by the quartz alkaline filter. Both passive samplers were exposed in the same container; however, no formate ions were found in the carbon paper filter. Just to give some figure, the equivalent formic acid concentrations found in the glass fiber filter were in the range 60-80 µg/m3, while the amount in the alkaline carbon paper was always zero.
This means that this acid is not adsorbed by the carbon filter. Activated carbon is very effective in removing formic and acetic acids [43,44]. The removal of HONO may follow the same basic mechanism. This hypothesis is now being thoroughly tested through direct proper laboratory and experimental tests.
5. Conclusions
The goal of a simple low-cost monitoring activity and preliminary assessment was fully achieved at the MANN museum in Naples. In five rooms, it was possible to monitor many air pollutants, most of which are crucial for the conservation of exposed art-work objects. Coupling the observations with passive samplers and environmental dataloggers, a complete picture of indoor environment in the museum can be achieved with minimum resources.
The results show that pollutants found in the museum indoor environment often exceed the maximum recommended concentrations for protecting art-work objects. Nitrogen dioxide ranged from 10 to 25 µg/m3.that is from 2 to 3,5 less than the amount found outdoors, and sulphur dioxide was found in the range 1-3 µg/m3. The source of nitrogen dioxide is the intense vehicular traffic in the streets around the building hosting the museum, which releases nitrogen oxides that are converted to nitrogen dioxide.
In addition to nitrogen dioxide, high concentrations of nitrous acid were found. This species is generated on surfaces by the reaction of nitrogen dioxide with water; in fact, the highest amounts were found in rooms where the surface-to-volume ratio is the highest. We were able to demonstrate that the use of alkali impregnated carbon paper for the monitoring of nitrogen dioxide is not affected by the presence of HONO that is, in turn, efficiently measured with the alkali impregnated quartz filter. This is the first time that a measurement of nitrogen dioxide is not affected by nitrous acid and vice versa.
The presence of HONO is of great concern because its formation also implies the formation of nitric acid, an oxidant and corrosive species. HONO may also come directly from ambient air. In fact, the nitrogen dioxide peaks are associated with very shallow mixed layers where the formation of HONO is highly probable. Here, in ambient air, the ratio of the surface to the volume of ambient air is small; thus, the formation is highly enhanced. Moreover, the presence of HONO in the atmosphere triggers early morning photochemical processes, increasing the amount of nitrogen dioxide in the atmosphere. The formation of HONO can be partially controlled using appropriate materials applied to the walls.
Data on gas-phase nitric acid showed maximum concentrations during summer sampling. Because the formation in the ambient atmosphere is the direct oxidation of nitrogen dioxide by hydroxyl radicals, nitric acid can be transported from ambient air to the museum either as nitric acid or as ammonium nitrate. The concentration of this species can be as high as 6 µg/m3. This corresponds to a noticeable mass flow rate for deposition on surfaces.
The sources of nitric acid inside the museum could also be due to the dissociation of particulate ammonium nitrate. Such a reaction, according to the indoor thermodynamic conditions, is highly probable to explain the excess of nitric acid in the exposition rooms. For this reason, a campaign about the content of ammonium nitrate in the gas phase is solicited. Sulphur dioxide data are consistent with the average data found outdoor. However, the concentration of this species appears to be low, if compared to nitrogen dioxide.
More attention should be paid to the presence of other sulphur species (H2S, H2SO4, etc.) in the museum. The experiments carried out inside the MANN offer very clear ideas about the temporal and spatial distribution of the pollutants and experiments that are recommended to clarify the many aspects discussed in this paper.
The simplicity and low cost involved in this activity, compared with the reliability and amount of gained information, make this campaign an example that can be easily replaced in other museums, where such information is not yet available. Our preliminary assessment could be a good example of how to address the problem of indoor museum contamination by external pollution and to evaluate, even in the very first approximation, the risk of exposed art-work objects in thousands of museums and sites where art-work objects are preserved, but where environmental pollution is not considered.
The full evaluation of pollutants is recommended after this preliminary assessment. Priority should be given to particulate matter that should be monitored not only in terms of number or mass concentration but also in terms of basic chemical composition, especially for nitrate and ammonium. In addition, it is recommended to include ozone and hydrogen sulphide in future monitoring campaigns, which are additional important pollutants for the conservation of cultural heritage. These species are also efficiently monitored by passive samplers, maintaining the simplicity and low cost, which were the basic objectives of this project.
Authorship contribution
Federica Valentini: Study conceptualization and design. Supervision. Funding acquisition. Ivo Allegrini: Writing. Formal analysis. Data curation. Funding acquisition. Irene Colasanti: Data curation and design. Supervision. Camilla Zaratti: Formal analysis, Supervision. Andrea Macchia: Writing. Supervision. Cristiana Barandoni: Technical assistance. Anna Neri: Editing, supervision, technical assistance.
Funding sources
This work was supported by a grant for “Economic valorisation of patents in favour of micro, small and medium-sized enterprises", called “Brevetti +”by Italian Ministry for Economic Development. The work was also supported by MANN through the “Eco-Valor” project (Eco-sustainable project for Conservation and Valorisation of colour traces on Marble sculptures) and Tor Vergata brevetti POC-TV.B.POC according to the proof of concepts of the Italian Minister of Economic Development.
Data availability
Data will be made available on request.
Conflicts of Interest
The authors declare no conflicts of interest.
References
- Statistical report on Museums in Italy, 2020, ISTAT,2020.
- Grzywacz, C. M. Monitoring for Gaseous Pollutants in Museum Environments. II Ed., Getty Publications, Los Angeles 2006, 1, ISBN-13: 978-0-89236-851-8.
- Ryhl-Svendsen, M. Indoor air pollution in museums: prediction models and control strategies. Studies in Conservation 2006, 51, 27. [Google Scholar] [CrossRef]
- Fabbri, B. Science and Conservation for Museum collections. Nardini Editore (Kermes Quaderni), Firenze 2012, ISBN-13: 978-0-89236-851-8.
- Chianese, E. , Riccio, A., Duro, I., Trifuoggi, M., Iovino, P., Capasso, S., Barone, G. Measurements for indoor air quality assessment at the Capodimonte Museum in Naples, Italy. Int. J. Environ. Res 2012, 6, 509. [Google Scholar]
- Kraševec, I. , Markelj, J., Elnaggar, A., et al. Indoor air pollutants and their seasonal monitoring in European museums. Heritage Science 2024, 12, 50. [Google Scholar] [CrossRef]
- D’Alvia, L. , Palermo, E., Rossi, S., Delprete, Z. Validation of a low-cost wireless sensor’s node for museum environmental monitoring. Acta Imeko 2017, 6, 45. [Google Scholar] [CrossRef]
- Orawsk, L. , Thai, P. K., Xiaoting, L.,. Akwasi, A.-S., Godwin, A., Alena, B., Bedini, A., Fahe, C., Bryce, C., Dunbabin, M., Gao, J., Hagler, G. S.W, Jayaratne, R., Kumar P., Lau, A. K. H,. Mazaheri, P., Mandana, K.K. L, Zhi, N., Motta, N., et al. Applications of low-cost sensing technologies for air quality monitoring and exposure assessment: How far have they gone? Environment International 2018, 116, 286. [Google Scholar] [CrossRef]
- Askari, H. S. , Hijleh, B. A. Review of museums' indoor environment conditions studies and guidelines and their impact on the museums' artifacts and energy consumption. Building and Environment 2018, 143, 186. [Google Scholar] [CrossRef]
- Hisham, E. , Sura, M., Karenm F., Inji, K., Brett, M. D. The regulations and reality of indoor environmental standards for objects and visitors in museums. Renewable and Sustainable Energy Reviews 2021, 152, 111653. [Google Scholar] [CrossRef]
- European Union 2008. Directive 2008/50/EC of the European Parliament and of the Council of 21 May 2008 on ambient air quality and cleaner air for Europe. https://eur-lex.europa.eu/eli/dir/2008/50/oj/eng.
- Nihan, C. , Matthew, F., Birgit, F. Use of Low-Cost Air Quality Monitoring Devices for Assessment of Road Transport Related Emissions. Transportation Research” Procedia 2019, 41, 762. [Google Scholar] [CrossRef]
- De Santis, F., Fino, A., Vazzana, C., Allegrini, I. Monitoring of atmospheric pollutants by passive sampling for the protection of historic buildings and monuments. Ann. Chim 2001, 91759, PMID–11836953. [Google Scholar] [PubMed]
- De Santis, F. , Allegrini, I., Fazio, M.C., Pasella, D., Piredda, R. Development of a passive sampling technique for the determination of nitrogen dioxide and sulphur dioxide in ambient air. Analitica Chimica Acta 1997, 346, 127. [Google Scholar] [CrossRef]
- Guidobaldi, M. P. Nuove ricerche archeologiche nell'area vesuviana (scavi 2003-2006). Atti del Convegno Internazionale, Roma 2007, ISBN: 9788882654795.
- Ruffolo S.A, La Russa M.F., Rovella N., Ricca M. (2023) “The Impact of Air Pollution on Stone Materials” Environments, 10(7), 119. [CrossRef]
- Biscontin, G., Diana,S., Fassina, V., Marabelli, M. The influence of atmospheric pollutants on the deterioration of mural paintings in the Scrovegni Chapel in Padua. Studies in Conservation 1980, 25, 7, Preprints of the Contributions to the Vienna Congress, Conservation within Historic Buildings.
- Hafkenscheid, T., Fromage, A., Mariette, E., Goelen, M., Hangartner, U., Pfeffer, Plaisance, H., de Santis, F., Saunders, K., Swaans, W., Tang, Y.S., Targa, J., Van Hoek, C. Gerboles, M. Review of the application of diffusive samplers in the European Union for the monitoring of nitrogen dioxide in ambient air. JRC scientific and technical report 2009, EUR 23793 EN. Luxembourg (Luxembourg): OPOCE; 2009. JRC51106, ISBN: 978-92-79-12052-7.
- Vichi, F. , De Santis, F. Triethanolamine (TEA) as a coating for collecting NO2 by using annular diffusion denuders. Environmental Technology 2012, 33, 1065. [Google Scholar] [CrossRef] [PubMed]
- De Santis, F. , Dogeroglu, T., Fino, A., et al. Laboratory development and field evaluation of a new diffusive sampler to collect nitrogen oxides in the ambient air. Anal. Bioanal. Chem. 2002, 373, 901. [Google Scholar] [CrossRef] [PubMed]
- Valentini, F., Allegrini, I. The conversion of NO2 into nitrite ion (NO2-): a Raman spectroscopy evidence, to be published on Analytical Methods 2025.
- Spicer, C.W. , Billick, I.H., Yanagisawa, Y. Nitrous acid interference with passive NO2 measurement methods and the impact on indoor NO2 data. Indoor Air 2001, 11, 156. [Google Scholar] [CrossRef]
- Vichi, F. , Maskova, L., Frattoni, M., Imperiali, A., Smolik, J. Simultaneous measurement of nitrous acid, nitric acid, and nitrogen dioxide by means of a novel multipollutant diffusive sampler in libraries and archives. Heritage Sciences 2016, 4, 4. [Google Scholar] [CrossRef]
- Shaver, C. , Cass, G.R., Druzik, J.R. Ozone and the deterioration of works of art. Environ. Sci. Technology 1983, 17, 748. [Google Scholar] [CrossRef] [PubMed]
- Salmon, L. , Cass, G.R., Bruckman, K., Haber, J. Ozone exposure inside museums in the historic central district of Krakow, Poland. Atmospheric Environment 2000, 34, 3823. [Google Scholar] [CrossRef]
- Sarkhosh, M., Atafar, Z. Atmospheric pollutants: exposure assessment and material damage. Air Pollution, Air Quality, and Climate Change Elsevier 2025, 83-102, ISBN 9780443238161. [CrossRef]
- Zhang, W. , Tong, S., Lin, D., Li, F., Zhang, X., Wang, L., Ji, D., Tang, G., Liu, Z., Hu, B., Ge, M. Atmospheric chemistry of nitrous acid and its effects on hydroxyl radical and ozone at the urban area of Beijing in early spring 2021. Environ. Pollution 2023, 316, 120710. [Google Scholar] [CrossRef]
- Pryor, S.C. , Klemm, O. Experimentally derived estimates of nitric acid dry deposition velocity and viscous sub-layer resistance at a conifer forest. Atmospheric Environment 2004, 38, 2769. [Google Scholar] [CrossRef]
- Biorling, M. , Hjulstad, G. Air exchange rate and internal air flows in a ventilated museum building. E3S Web Conf. 2021, 246, 01003. [Google Scholar] [CrossRef]
- Shinohara, N. , Kataoka, T., Takamine, K., Butsugan, M., Nishijima, H., Gamo, M. Modified Perfluorocarbon Tracer Method for Measuring Effective Multizone Air Exchange Rates. Int. J. Environ. Res. Public Health 2010, 7, 3348–10.3390. [Google Scholar] [CrossRef]
- Thickett, D. , David, F., Luxford, N, Air exchange rate: The dominant parameter for preventive conservation? The Conserv. 2005, 29, 19. [Google Scholar] [CrossRef]
- Grøntoft, T. , Raychaudhuri, M.R. Compilation of tables of surface deposition velocities for O3, NO2 and SO2 to a range of indoor surfaces. Atmos. Environ. 2003, 38, 533. [Google Scholar] [CrossRef]
- Blades, N., Cassar, M., Oreszczyn, T., Croxford, B. Preventive conservation strategies for sustainable urban pollution control in museums. Tradition and Innovation, Advances in Conservation, Contributions to the IIC Melbourne Congress 2000, 24-28.
- European Union 2014, https://www.eea.europa.eu/data-and-maps/figures/nitrogen-dioxide-annual-limit-values-for-the-protection-of-human-health , Created 22 Aug 2014, Published 22 Aug 2014; Last modified 04 Sep 2014.
- Grøntoft, T. The influence of photochemistry on outdoor to indoor NO2 in some European museums. Indoor Air 2022, 32, e12999. [Google Scholar] [CrossRef] [PubMed]
- Stelson, A. , Seinfeld, J.H. Relative humidity and temperature dependence of the ammonium nitrate dissociation constant. Atmospheric Environment 1967, 16, 983. [Google Scholar] [CrossRef]
- Xin, K. , Chen, J., Soyol-Erdene, T. Formation mechanism and source apportionment of nitrate in atmospheric aerosols. APN Science Bulletin 2023, 13, 102. [Google Scholar] [CrossRef]
- Barber, V. P. , Le Mar, L.N., Li, Y., Zheng, J.W., Keutsh, F.N., Kroll, J.H. Enhanced Organic Nitrate Formation from Peroxy Radicals in the Condensed Phase. Environ. Sci. Technol. Lett. 2024, 11, 975. [Google Scholar] [CrossRef]
- Lifang, Z. , et al. Formation of Nitrosamines from the Heterogeneous Reaction of Nitrous Acid and Organic Amines in Indoor Environments. Environ. Sci. Technology 2024, 58, 18881. [Google Scholar] [CrossRef]
- Spataro, F. , Ianniello, A. Sources of atmospheric nitrous acid: state of the science, current research needs, and future prospects. J. Air Waste Management. Assoc. 2014, 64, 1232. [Google Scholar] [CrossRef]
- Liu, C. , Liang, L., Xu, W., Ma, Q. A review of indoor nitrous acid (HONO) pollution: measurement techniques, pollution characteristics, sources and sinks. Sci. Total Enviroment 2024, 921, 171100. [Google Scholar] [CrossRef]
- Febo, A. , Perrino, C., Allegrini, I. Measurement of nitrous acid in Milan, Italy, by DOAS and diffusion denuders. Atmospheric Environment 1996, 30, 3599. [Google Scholar] [CrossRef]
- Grøntoft, T., Lankester, P., Thickett, D. Reduction of acidic pollutant gases inside showcases by the use of activated carbon adsorbers. e-Preservation Science 2015, 12, 28, ISSN: 1581-9280 web edition ISSN: 1854-3928 print edition.
- Cruz, A. J. , Pires, J., Carvalho, A. P., De Carvalho, M. B. Comparison of adsorbent materials for acetic acid removal in showcases. Journal of Cultural Heritage 2008, 9, 244. [Google Scholar] [CrossRef]
Figure 1.
(1): External view of the museum building. (2): Underground map with monitoring site A in room 45 (Named Cavaiuole) that represents the underground deposit of the statues, not exhibited in the Museum. (3): Ground floor map with sampling sites B and C is the room 26 where the Farnesina collection is shown, D site where the Tyrannicides are exhibited; E is the outdoor restoration laboratories of marble sculptures.
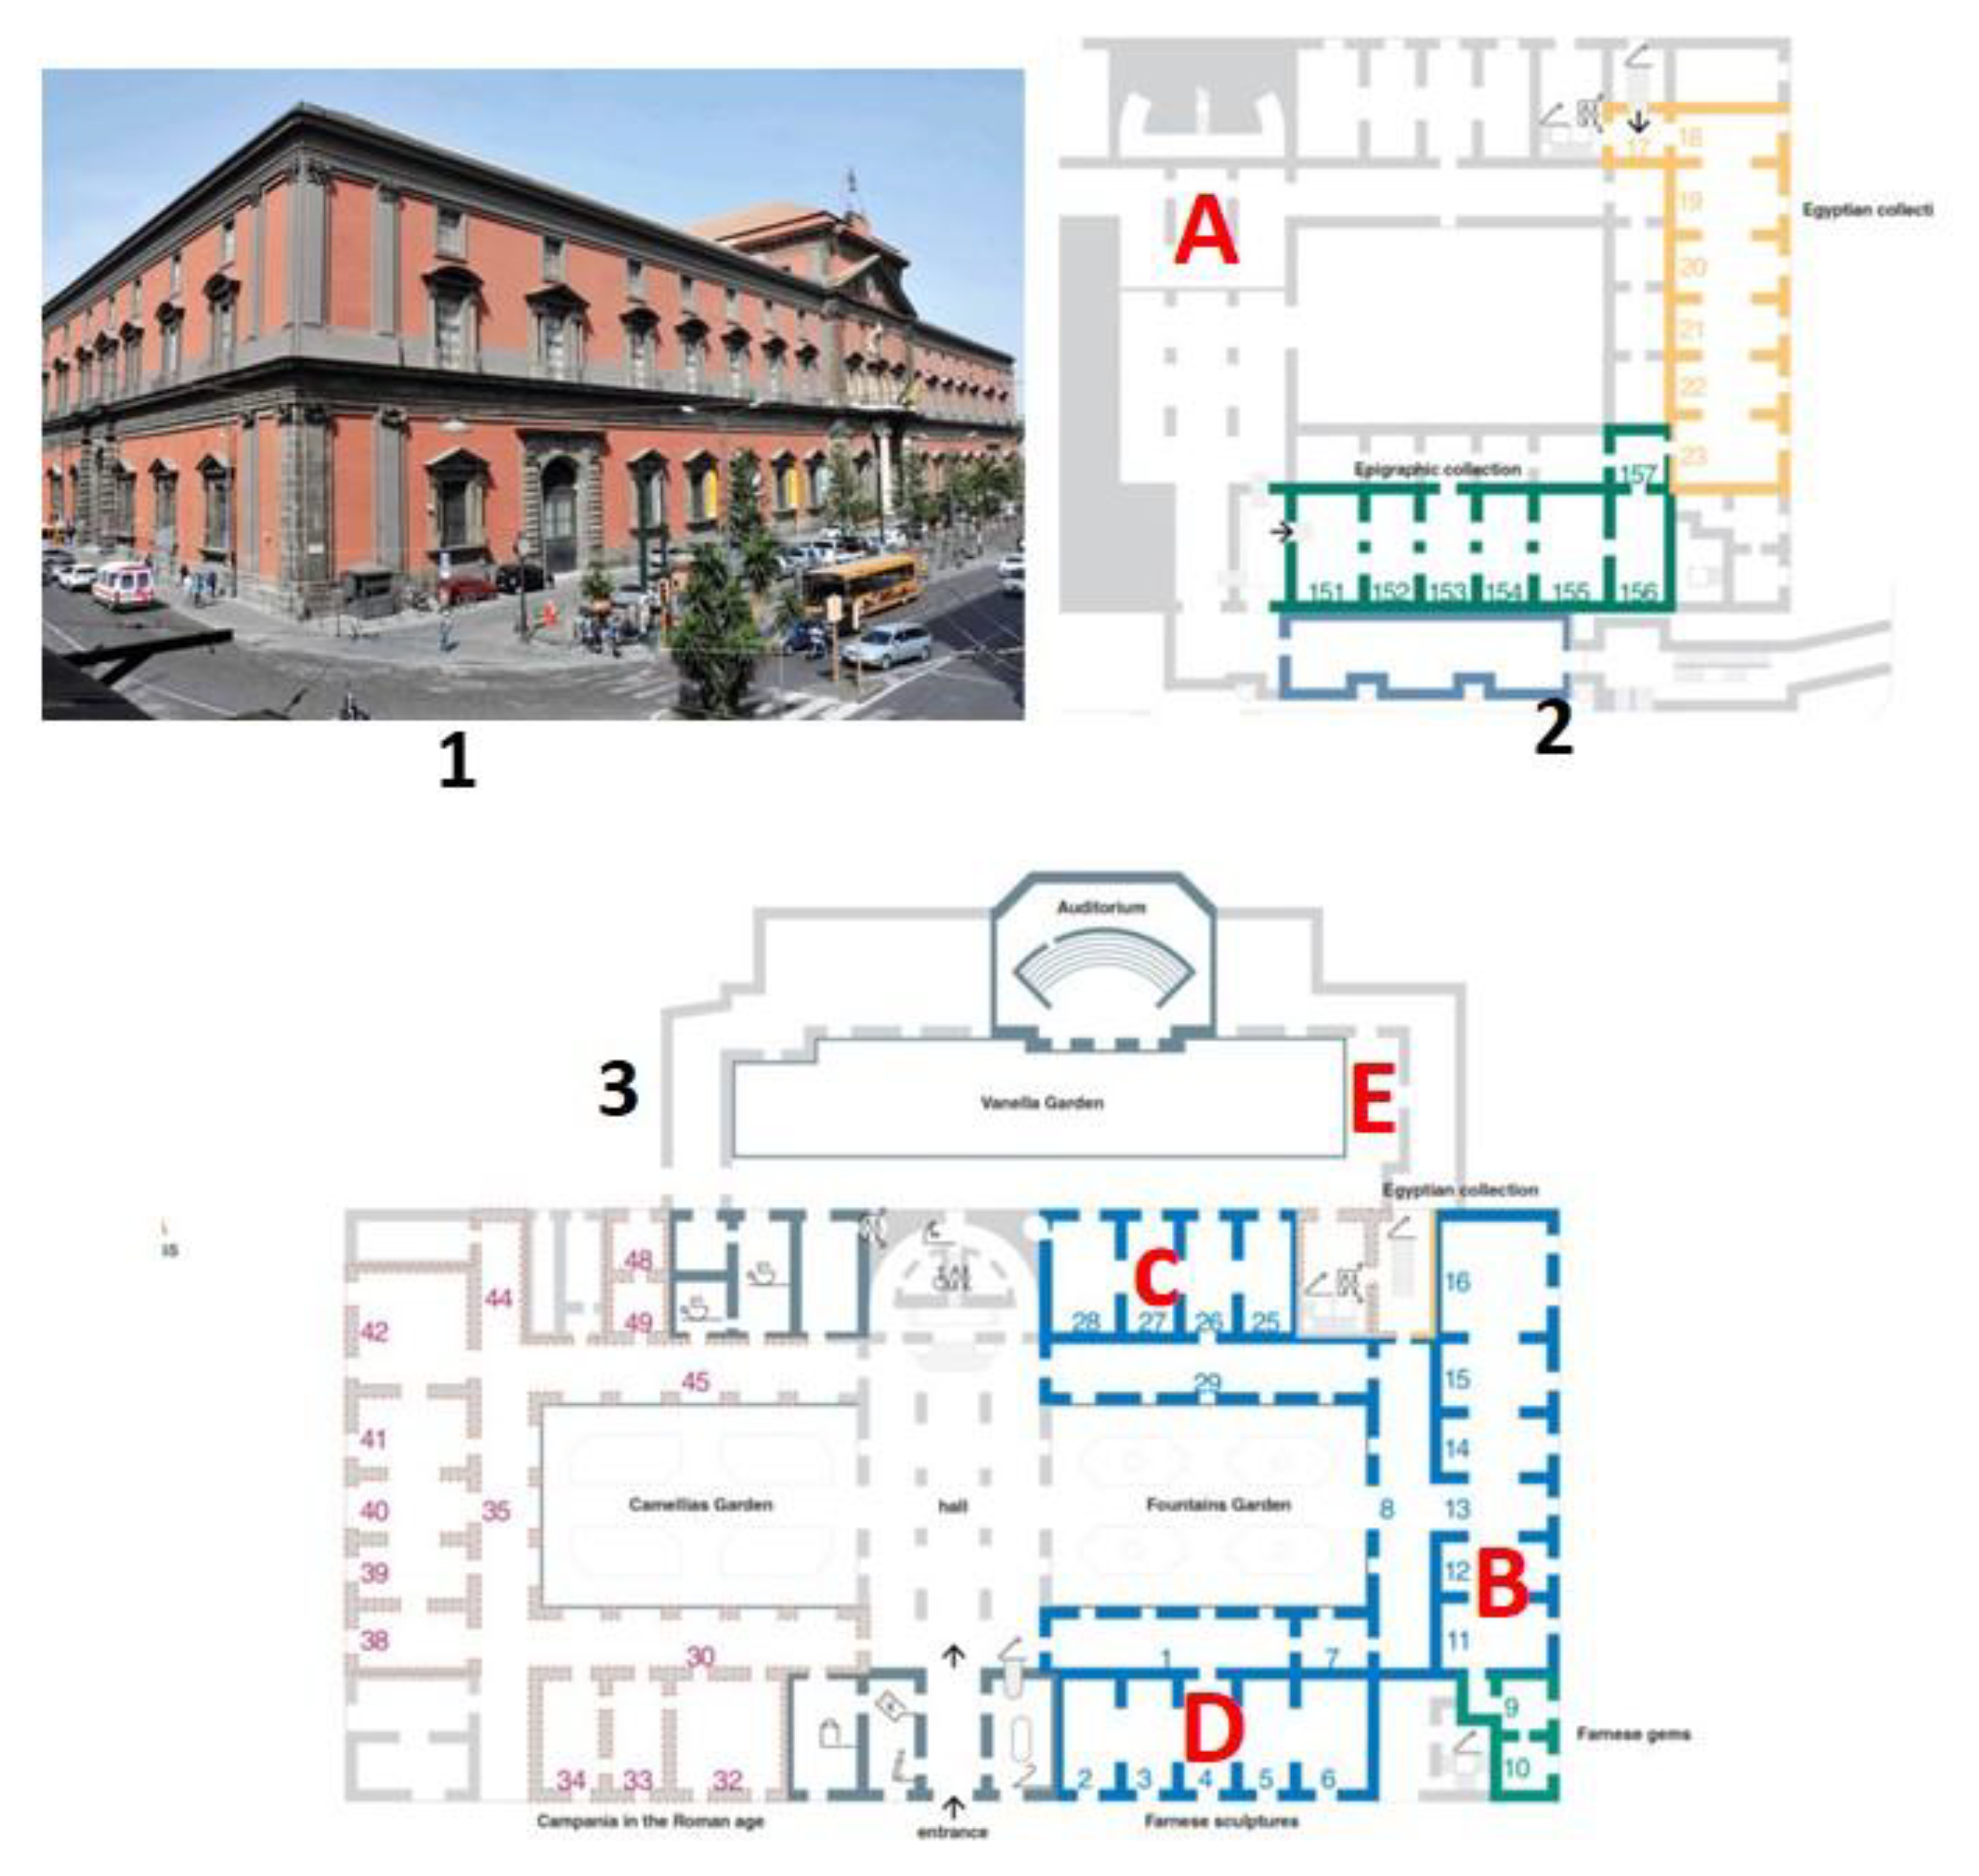
Figure 2.
Scheme of the Analyst passive sampler.
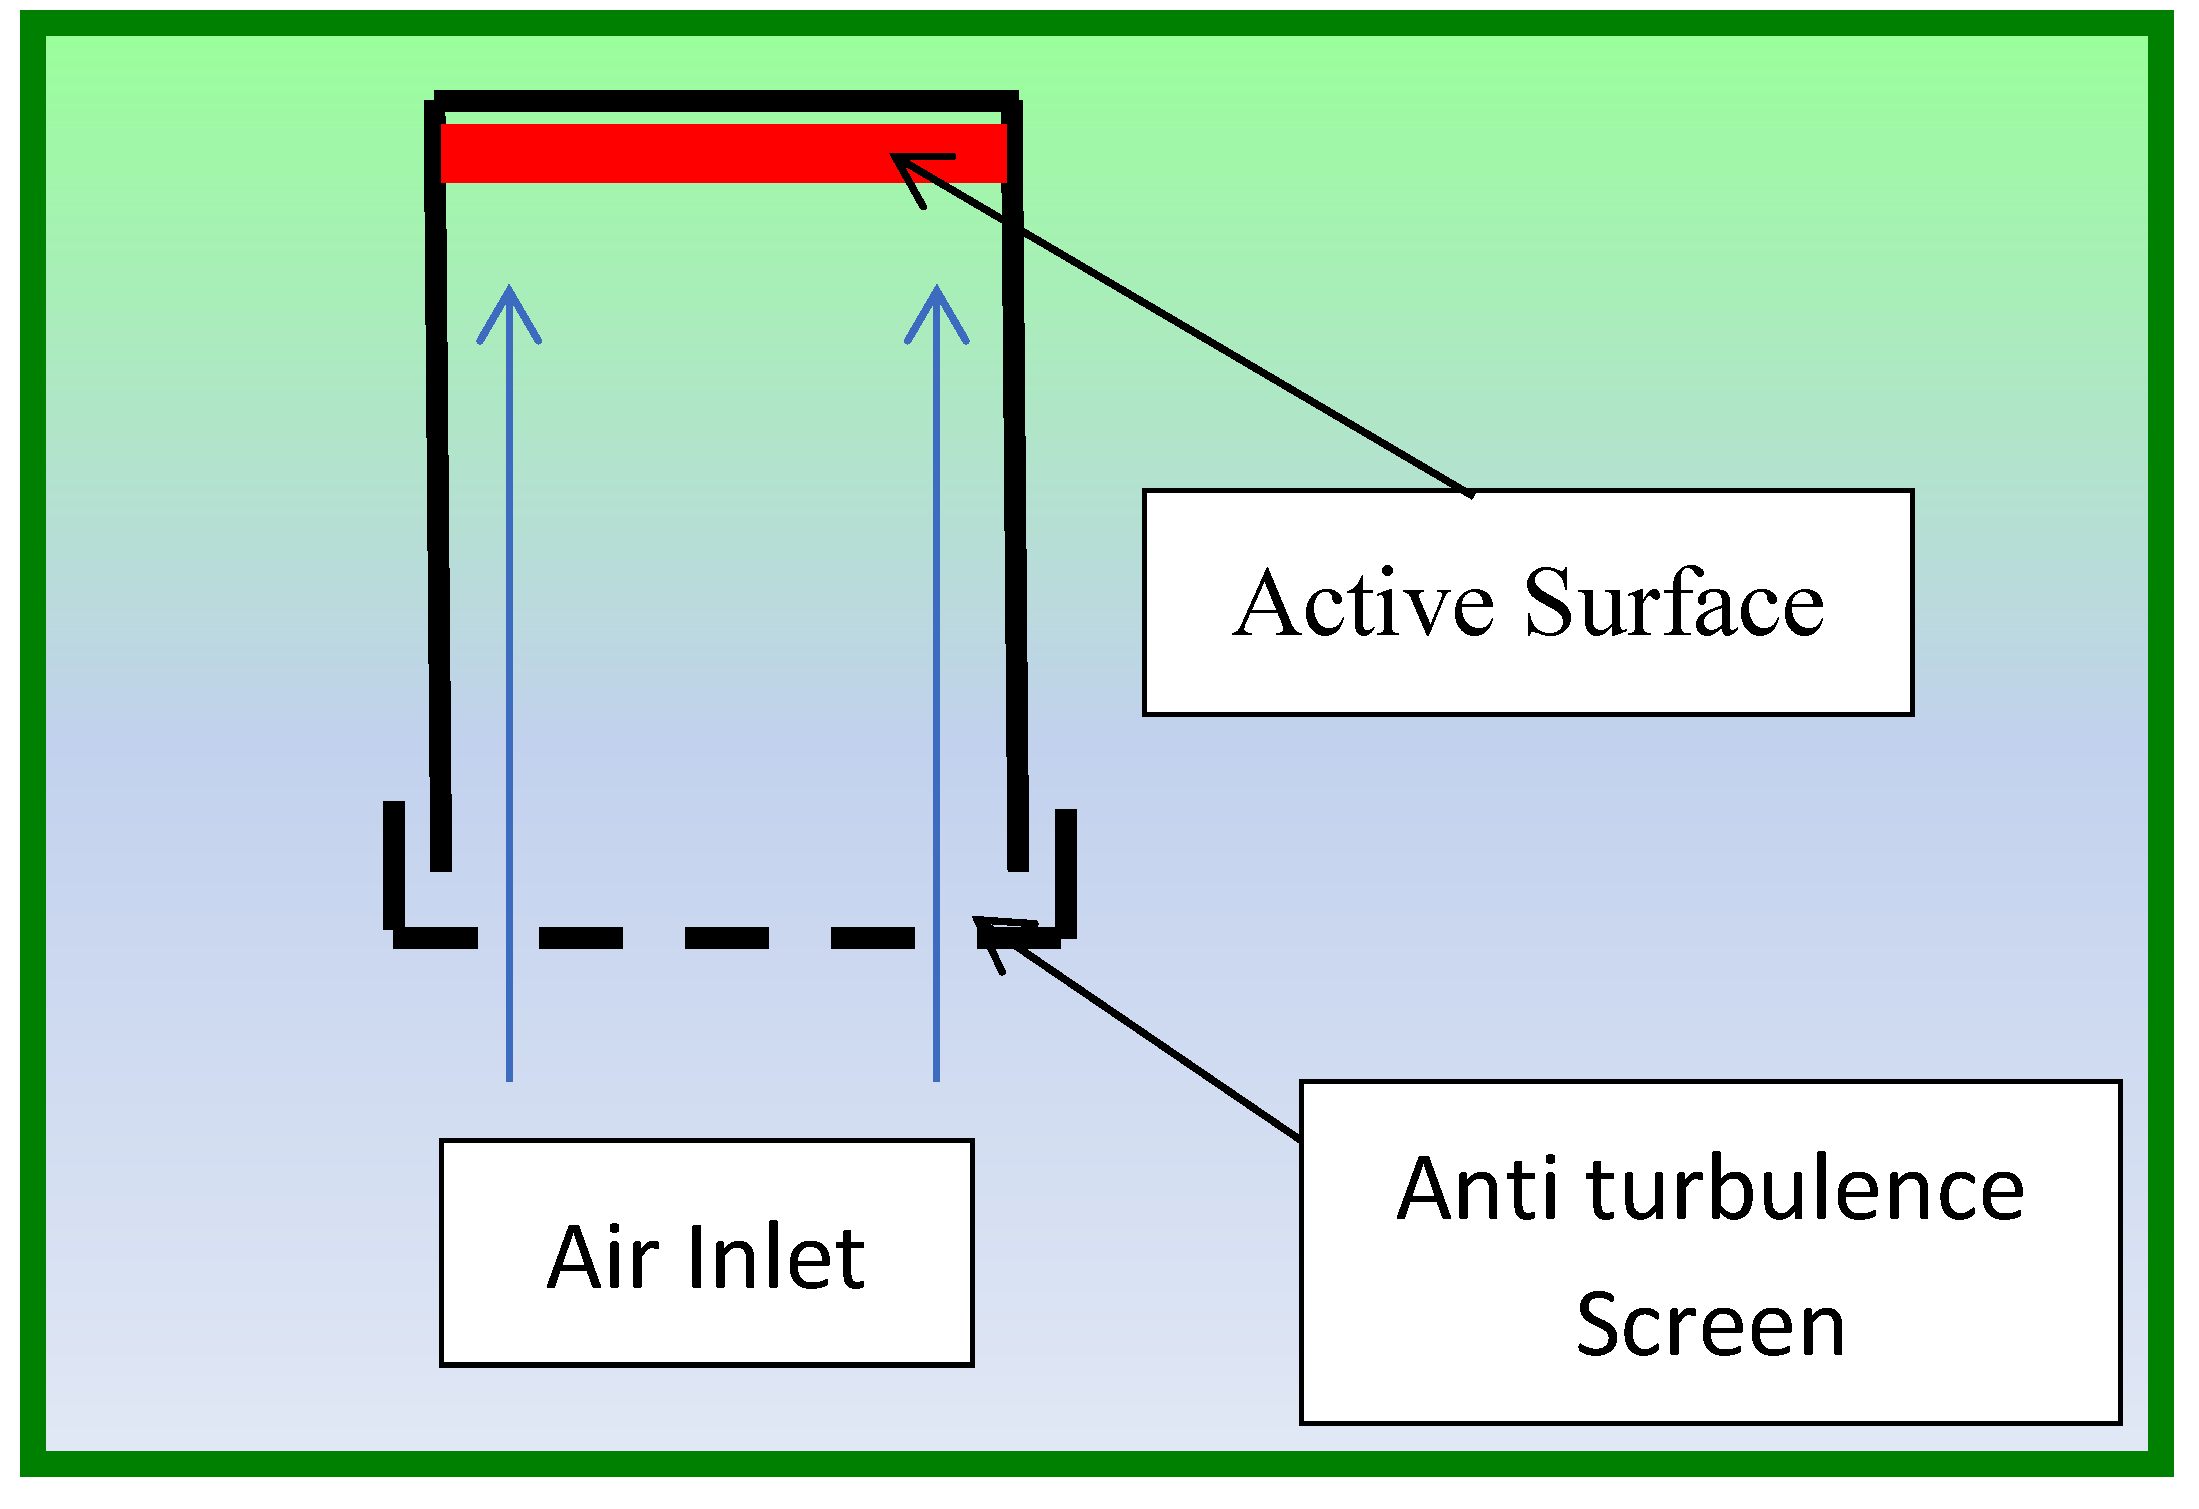
Figure 3.
The exposure shield for two passive samplers and one environmental datalogger is shown in room C.
Figure 3.
The exposure shield for two passive samplers and one environmental datalogger is shown in room C.
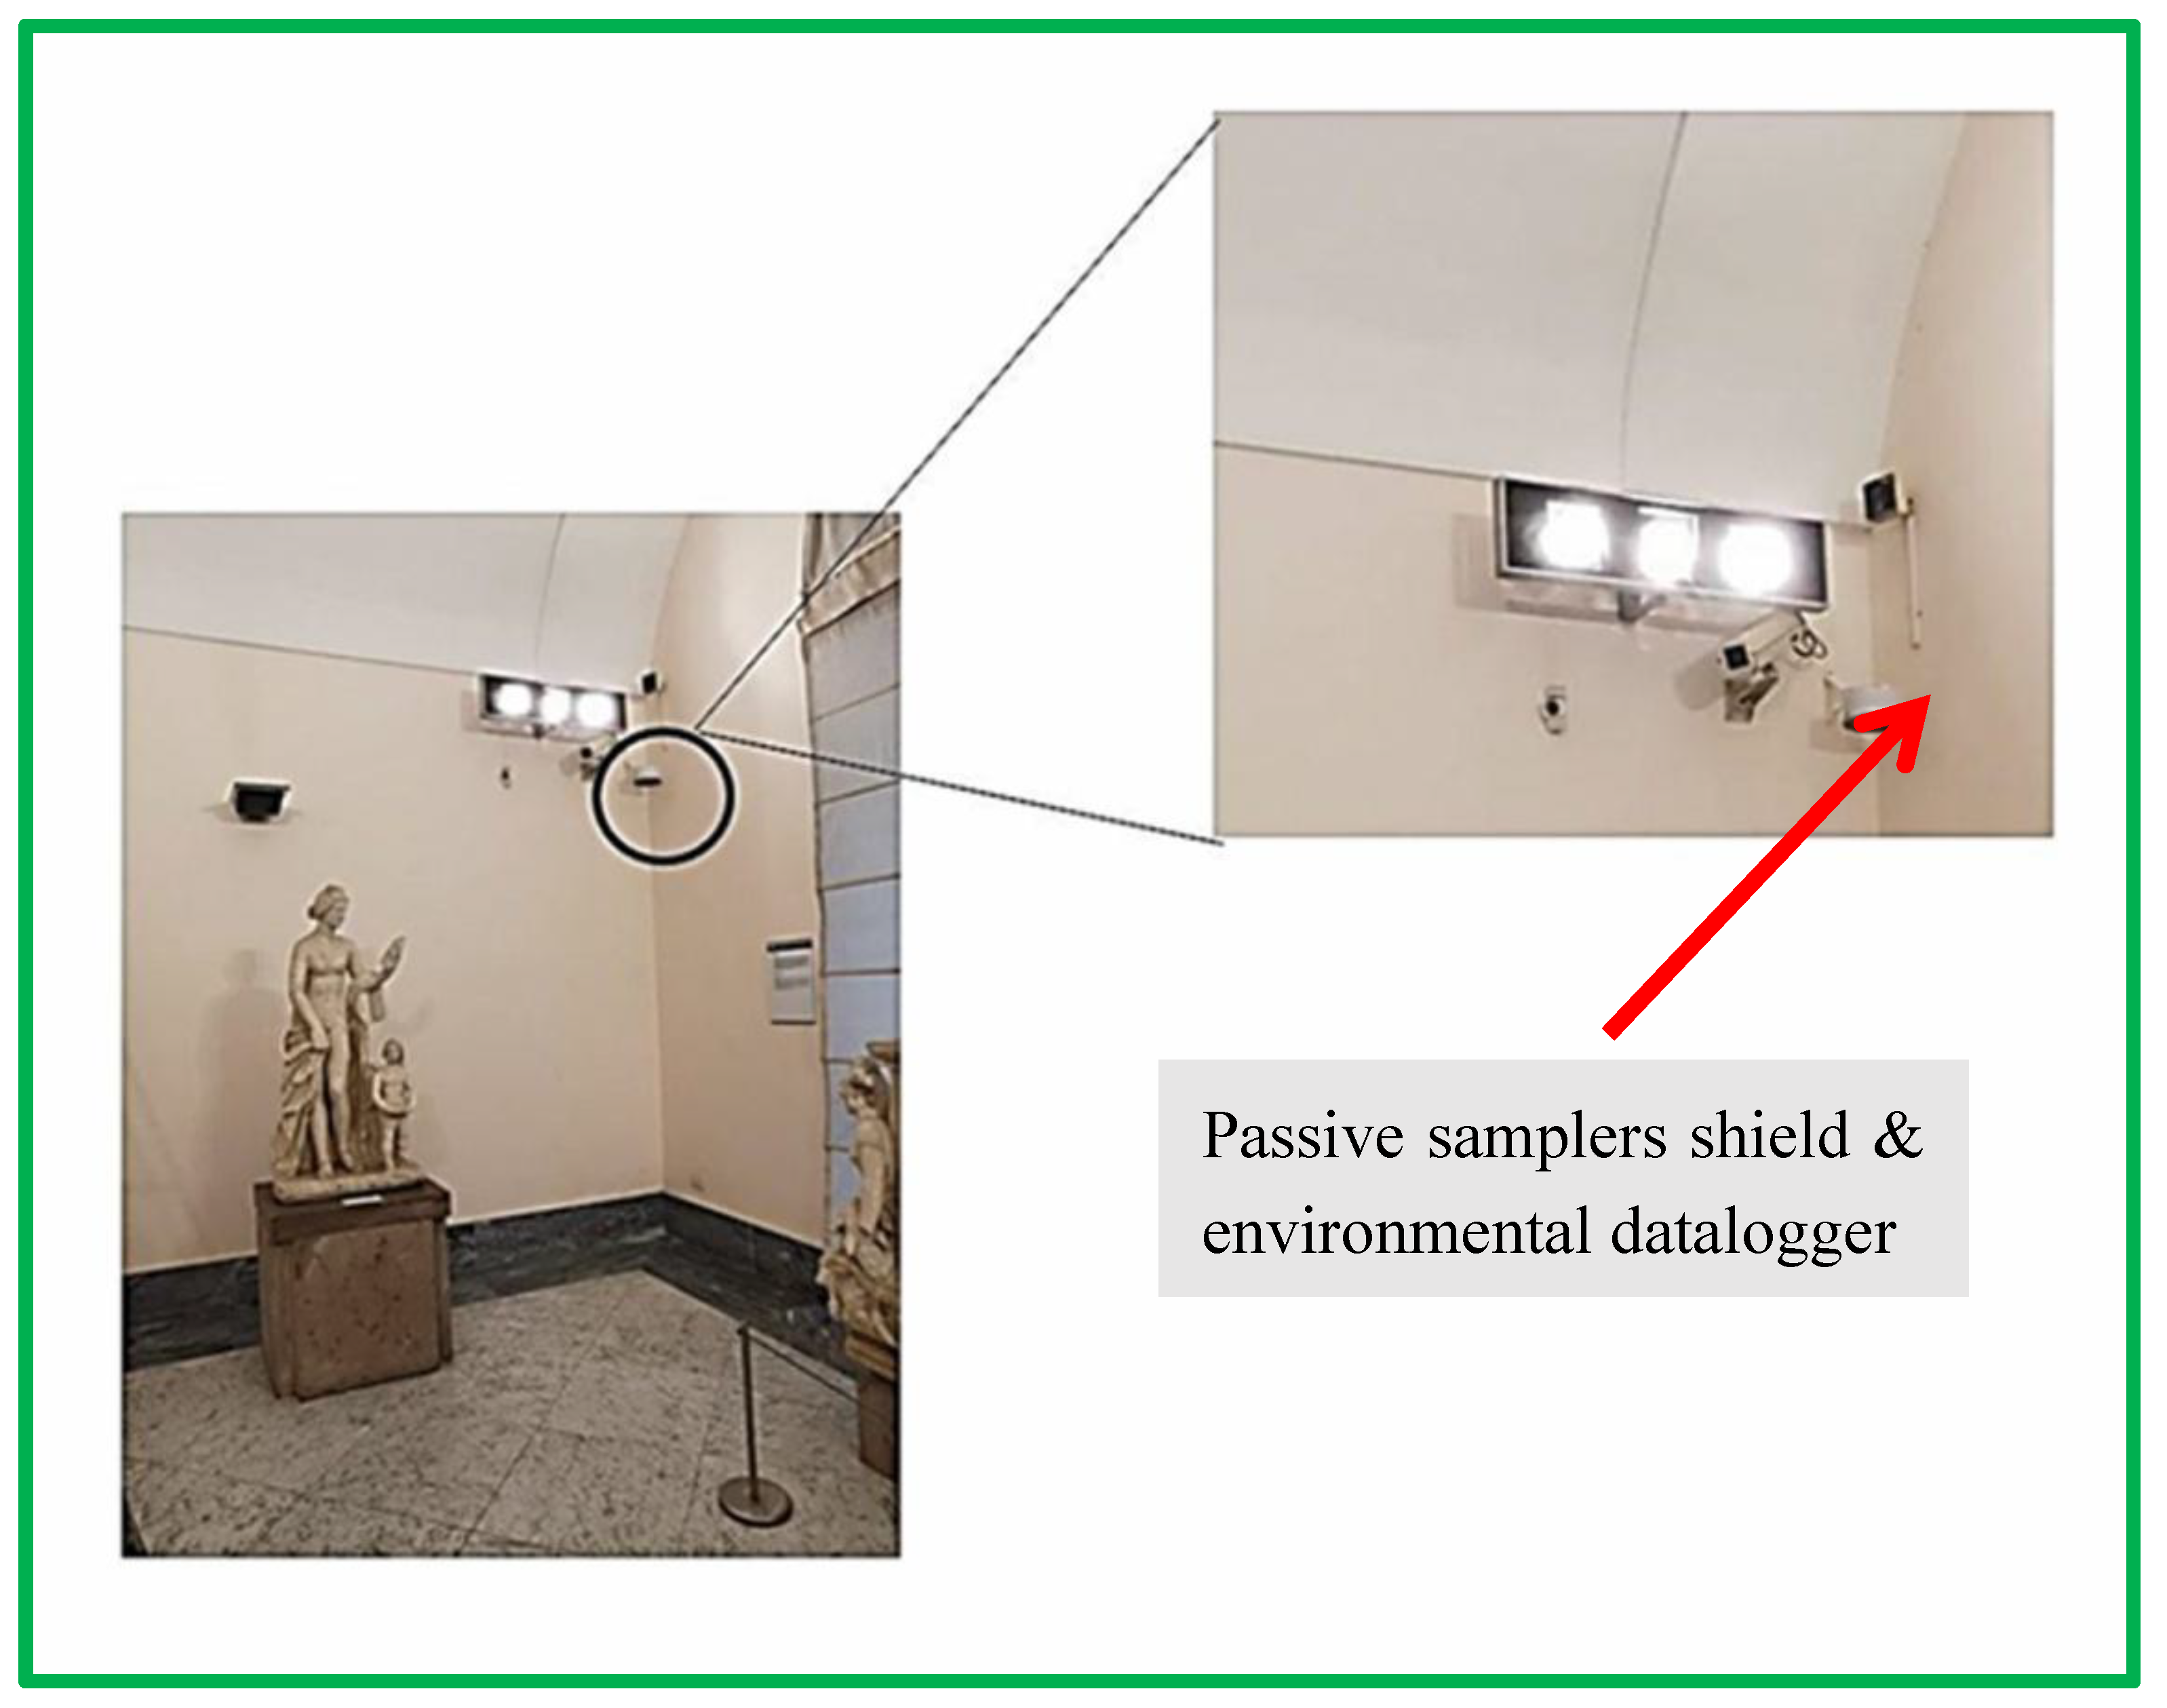
Figure 4.
Datalogger used in the campaign. Dimensions: 7x4.5x2.3 cm.
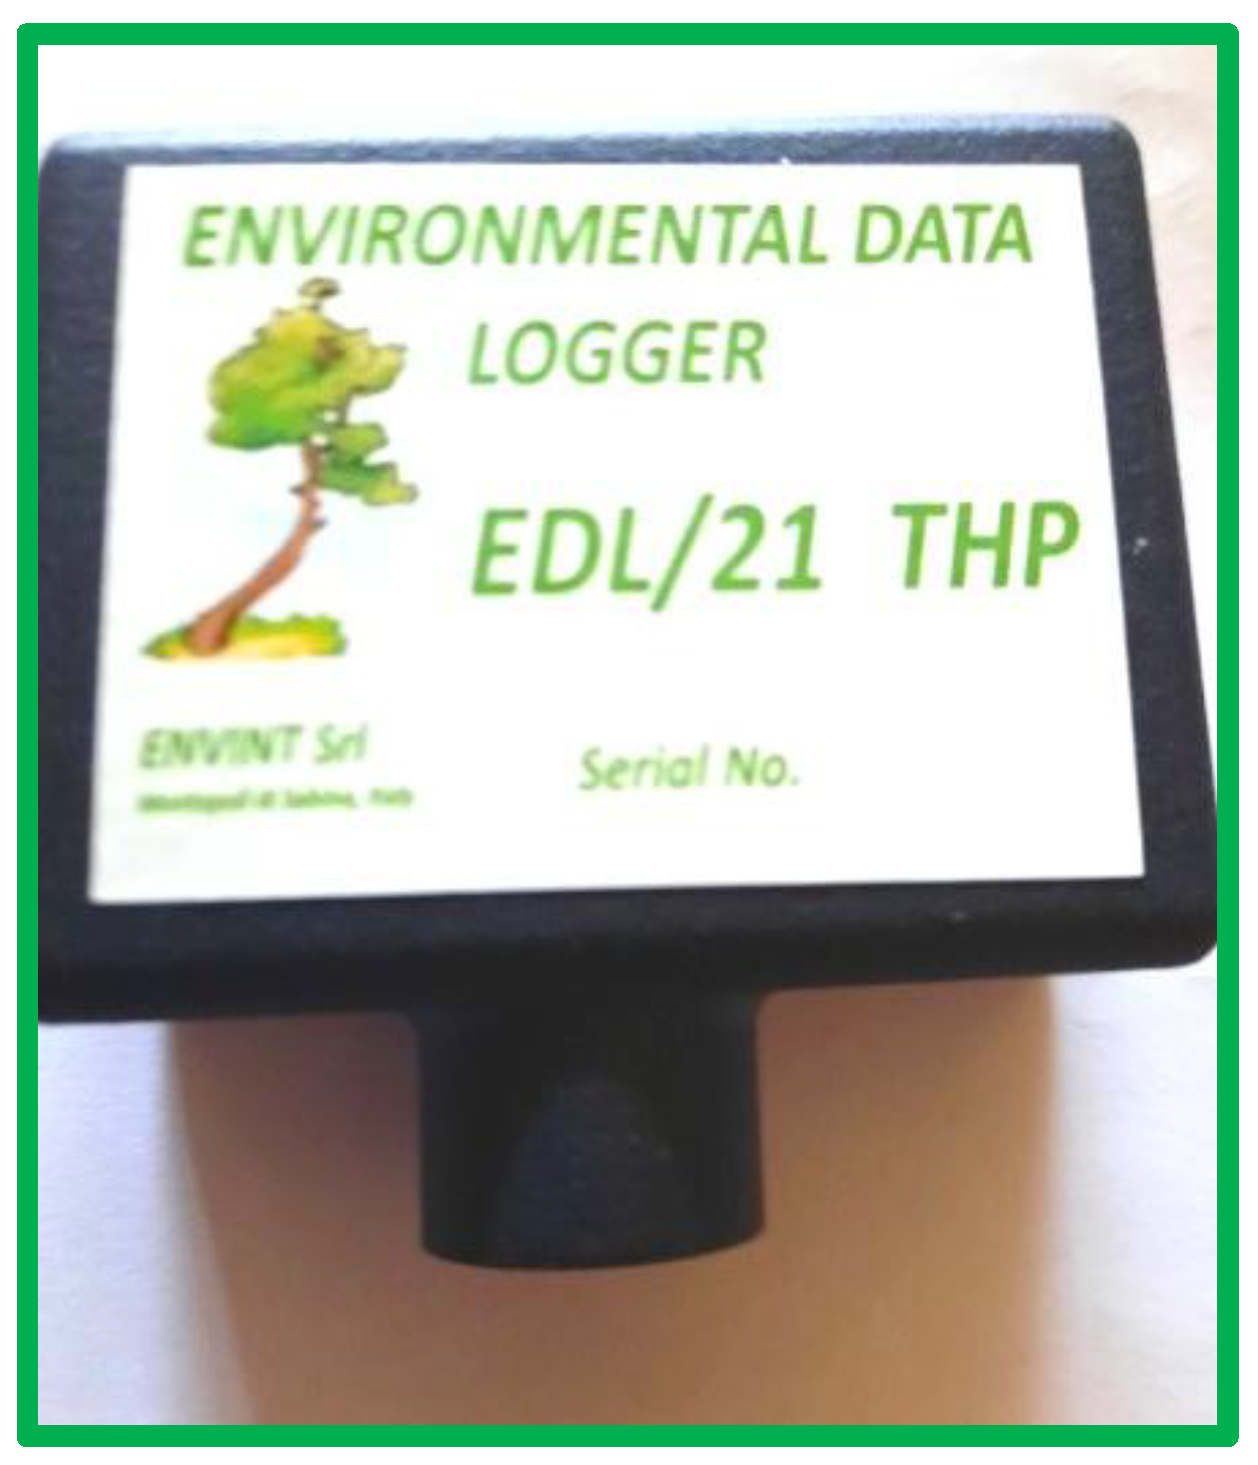
Figure 5.
Temperature trend in the three rooms A, B and E.
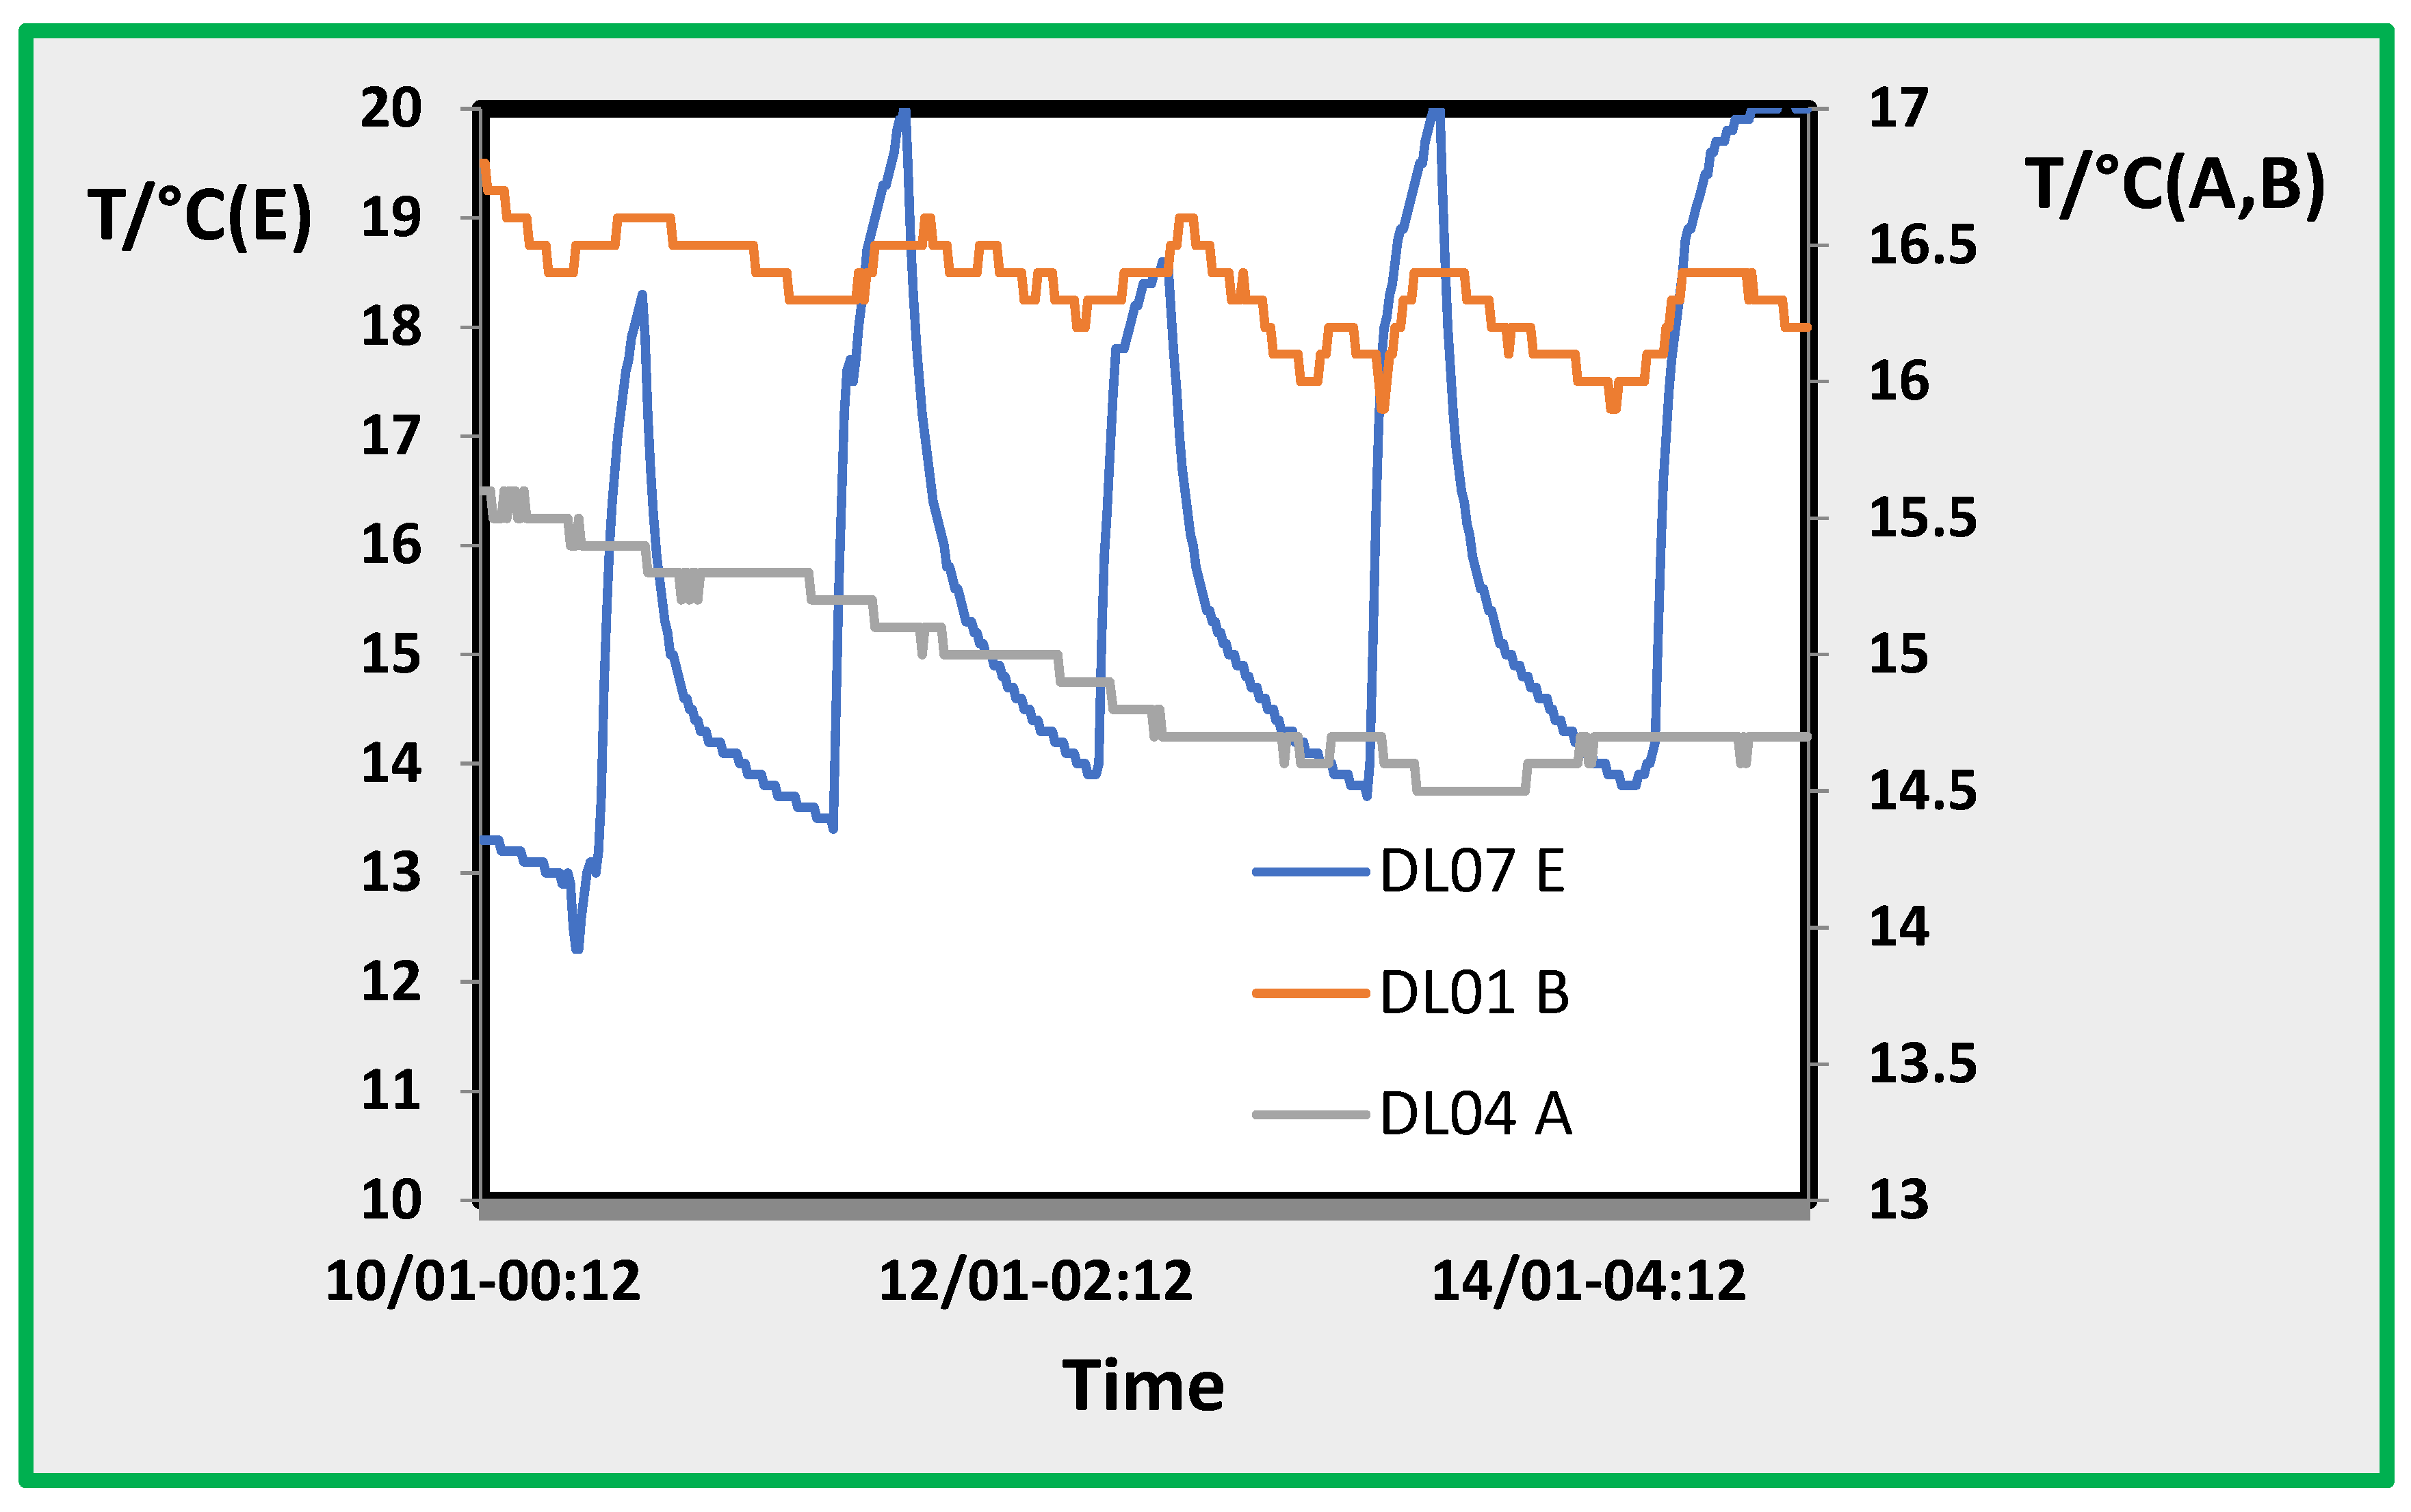
Figure 6.
Indoor (In) and outdoor (Out) nitrogen dioxide average concentration (C, µg/m3) along sampling periods and ratio.
Figure 6.
Indoor (In) and outdoor (Out) nitrogen dioxide average concentration (C, µg/m3) along sampling periods and ratio.
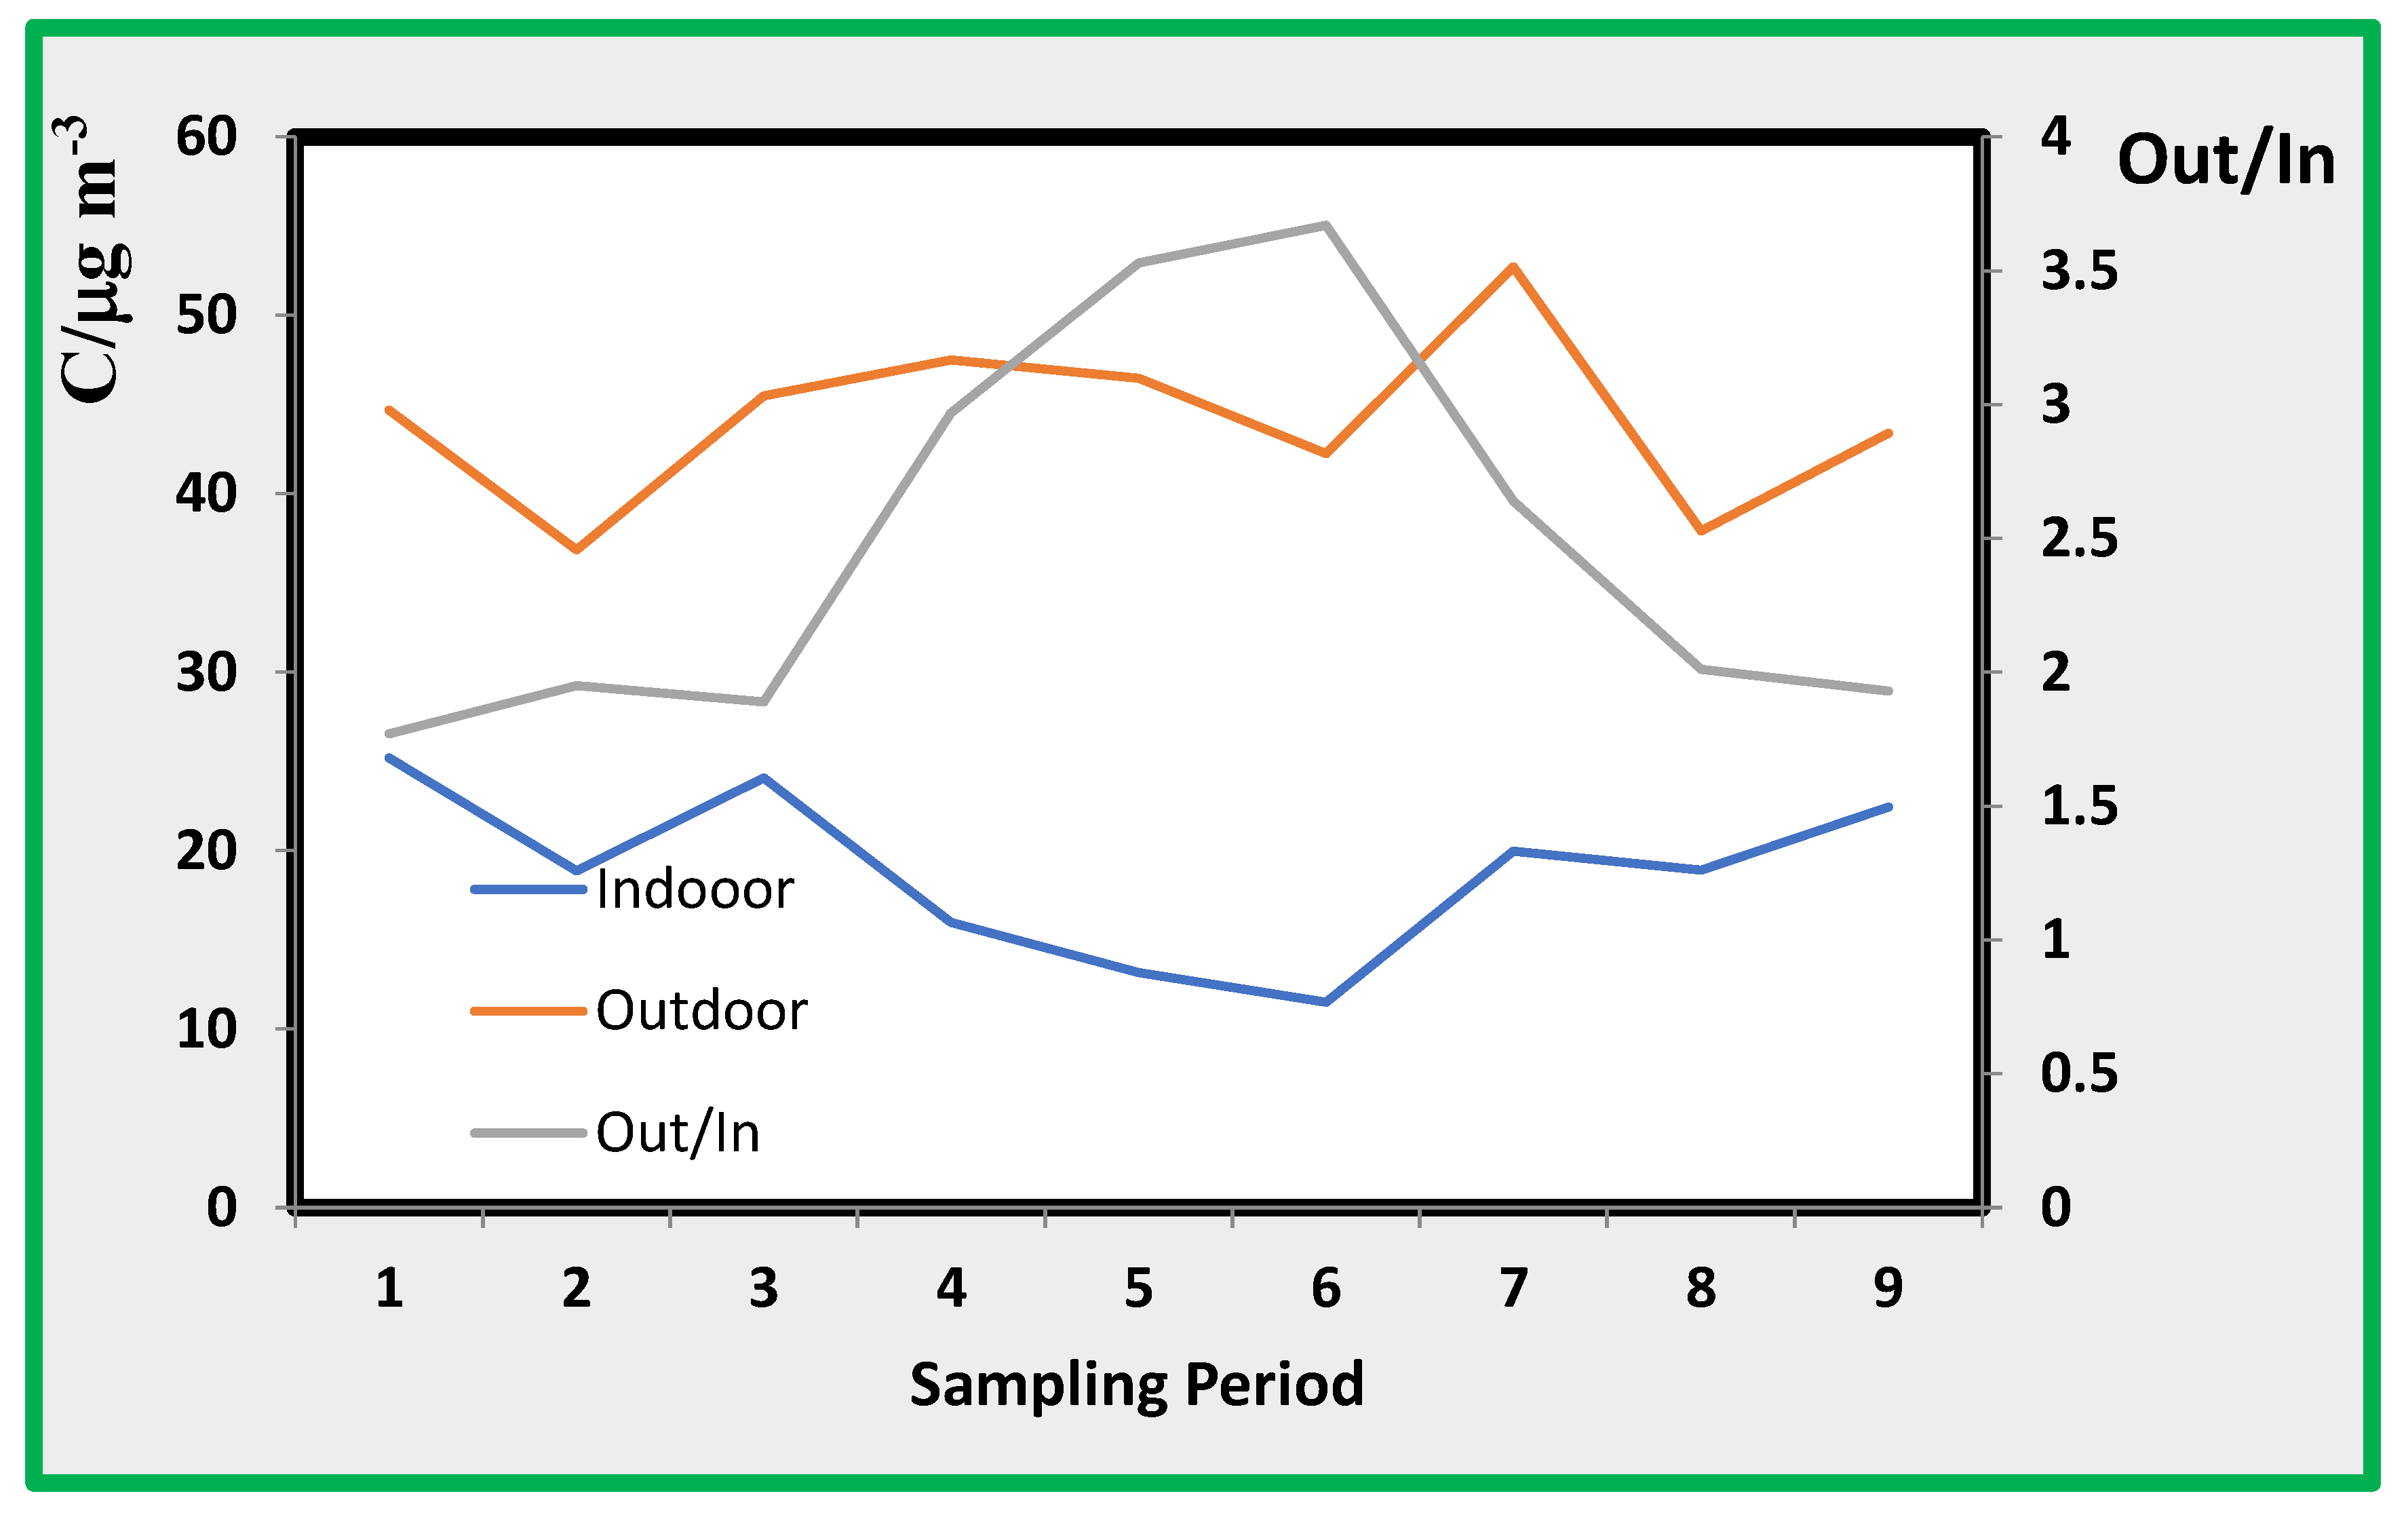
Figure 7.
Time trend of nitrogen oxide (NO) in a specific day in winter.
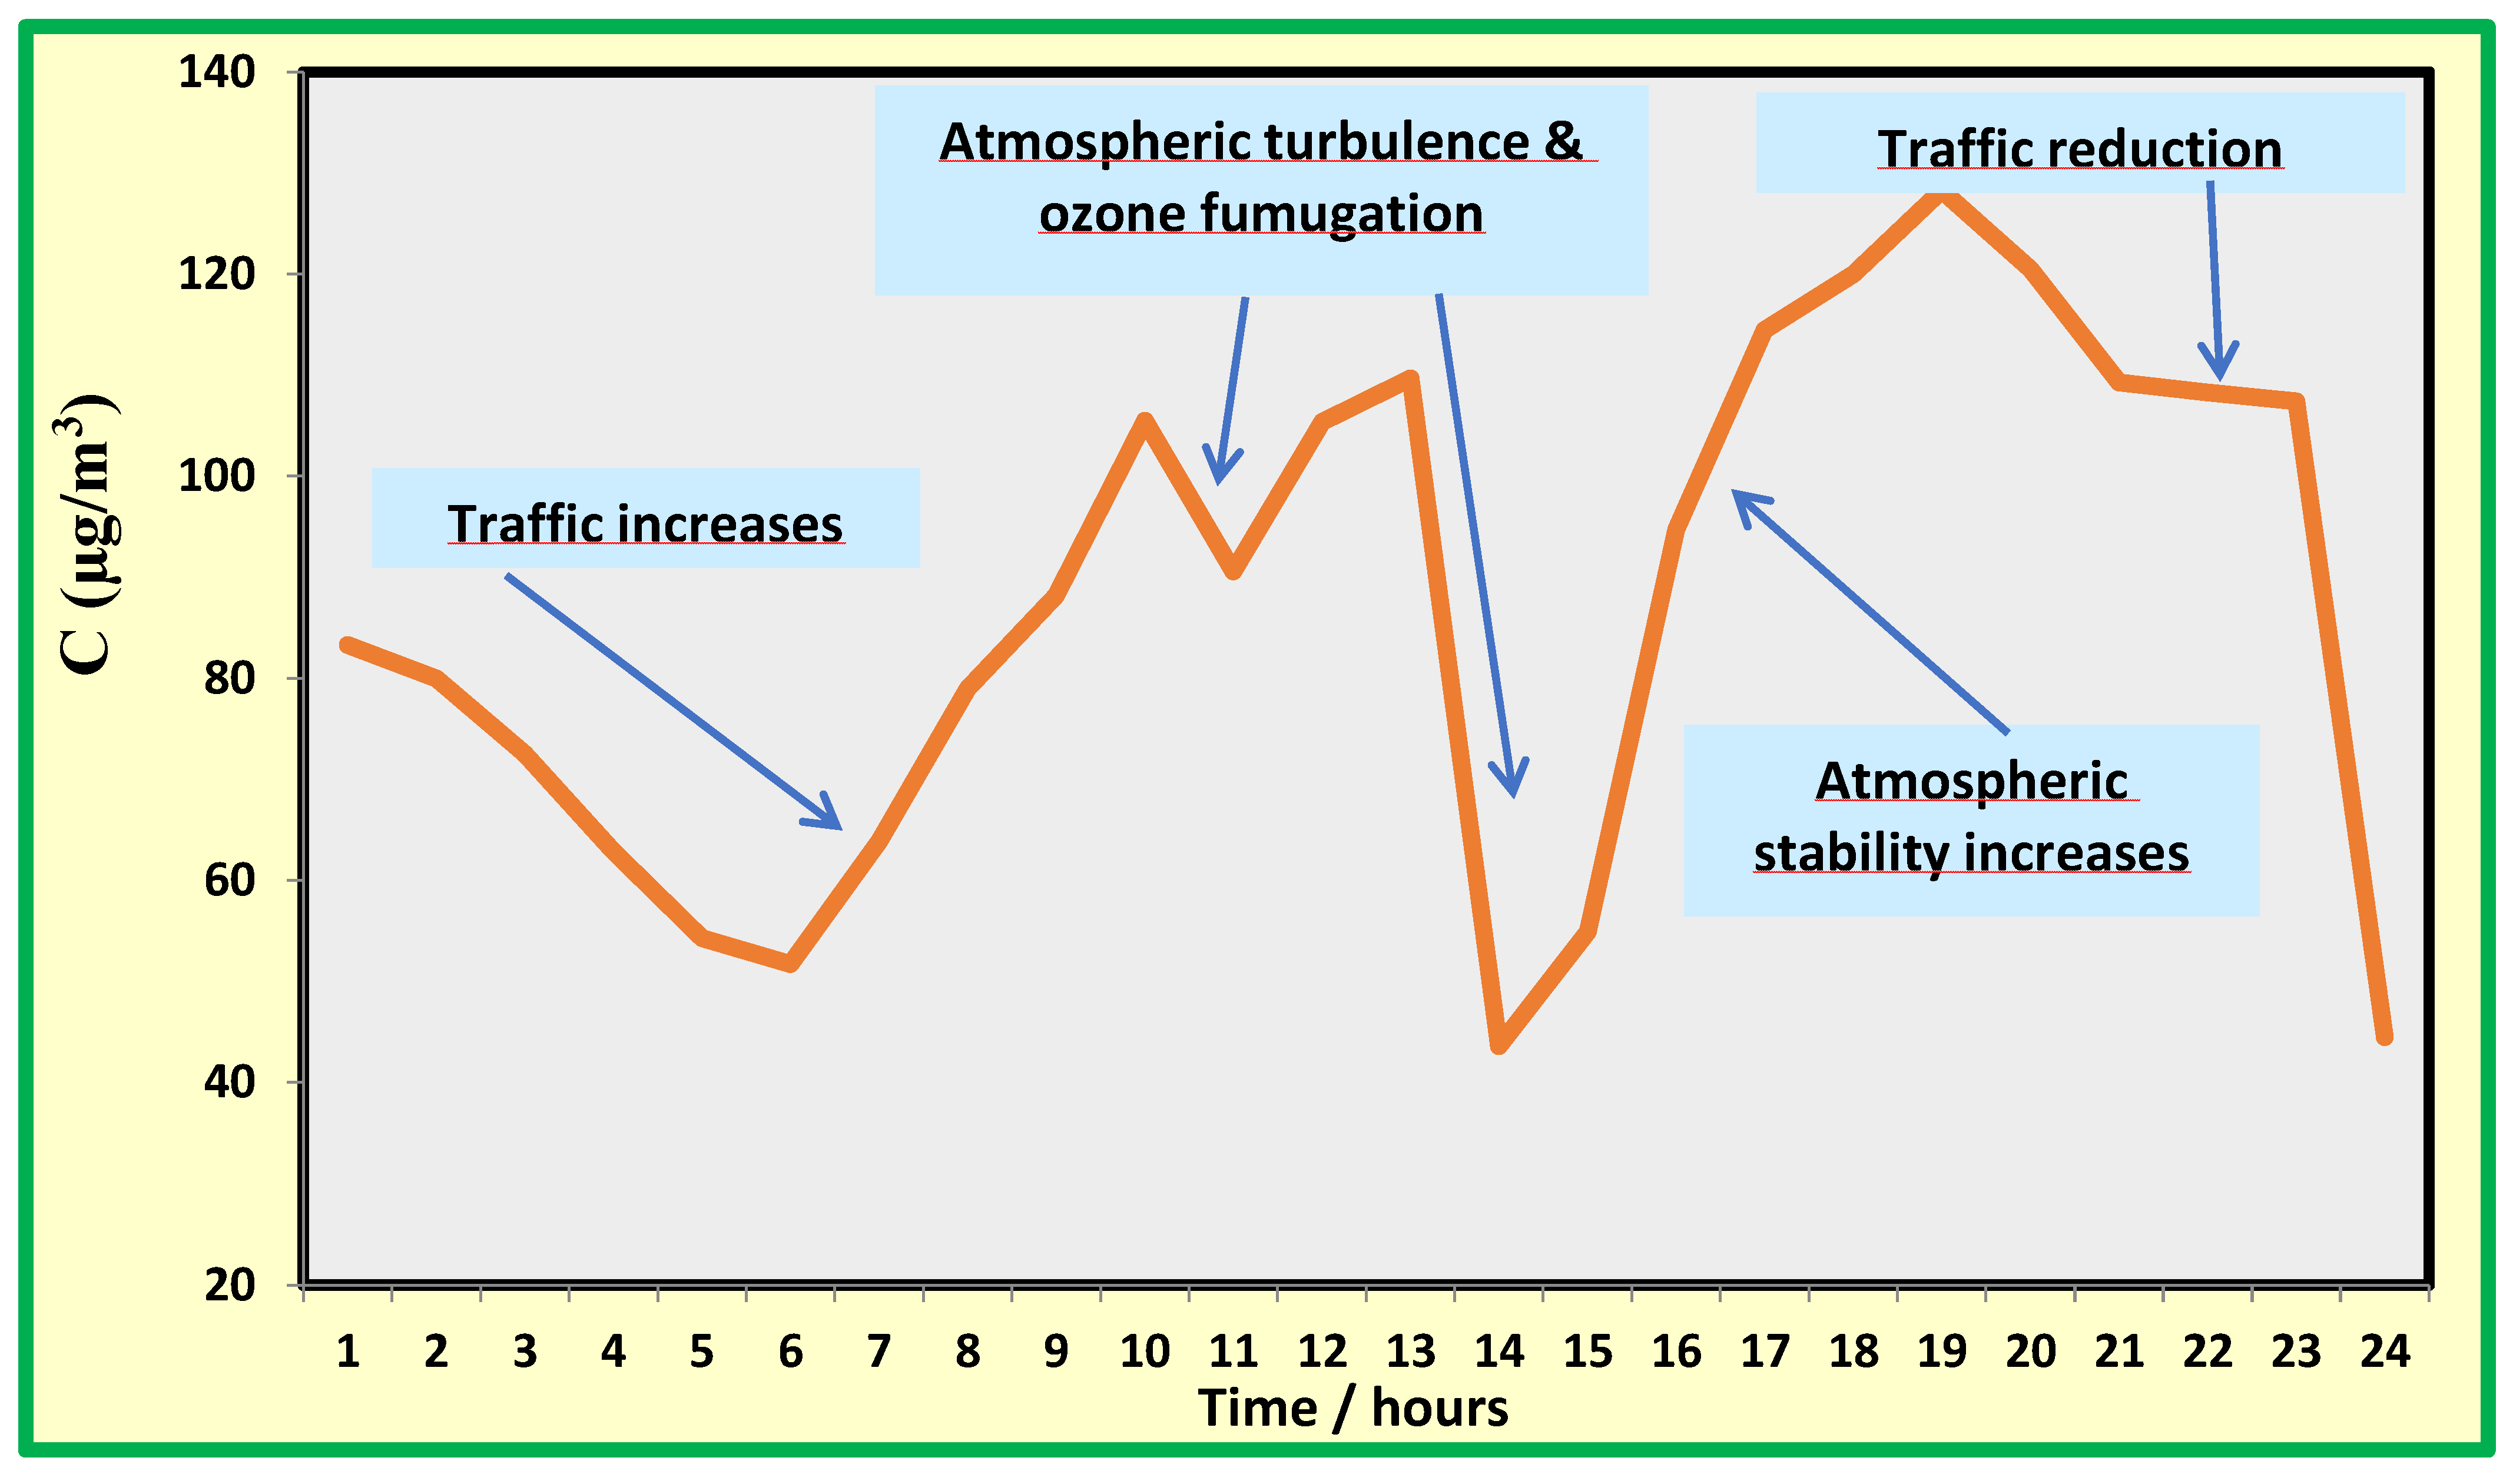
Figure 8.
Time trend of nitrogen dioxide (∙) and ozone (∙) concentration ratio as recorded in the monitoring station near the museum for the week starting on Apr. 25th, 2022.
Figure 8.
Time trend of nitrogen dioxide (∙) and ozone (∙) concentration ratio as recorded in the monitoring station near the museum for the week starting on Apr. 25th, 2022.
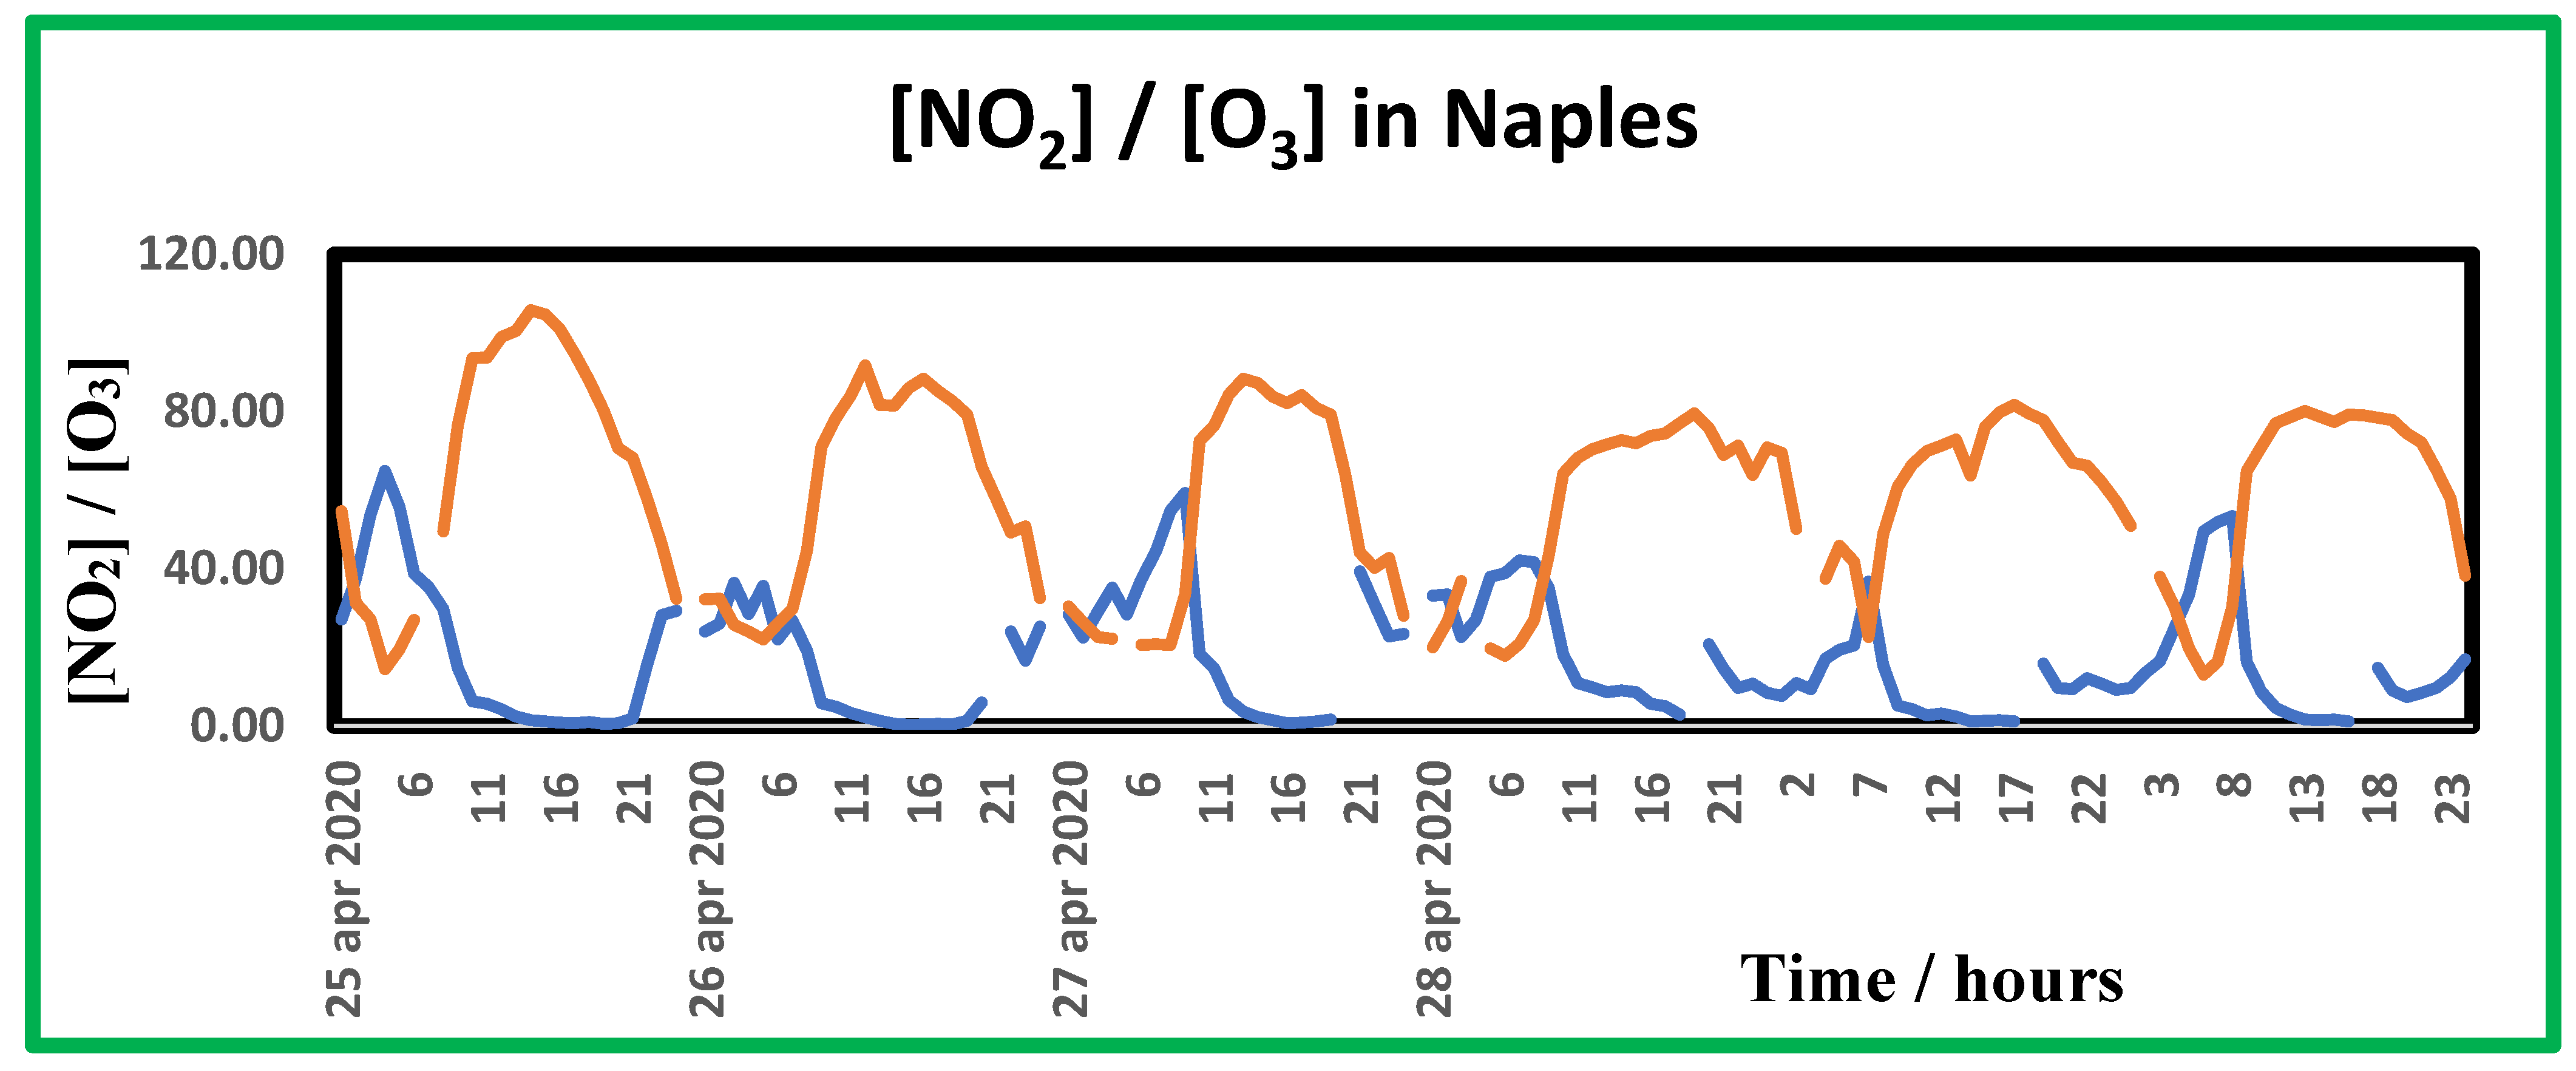
Figure 9.
a. Average concentrations profiles for NO2 and HONO, at B, C and D rooms. Sampling period is according to Table 1. b. Nitrogen dioxide and nitrous acid in room A. c. Nitrogen dioxide and nitrous acid in room E.
Figure 9.
a. Average concentrations profiles for NO2 and HONO, at B, C and D rooms. Sampling period is according to Table 1. b. Nitrogen dioxide and nitrous acid in room A. c. Nitrogen dioxide and nitrous acid in room E.
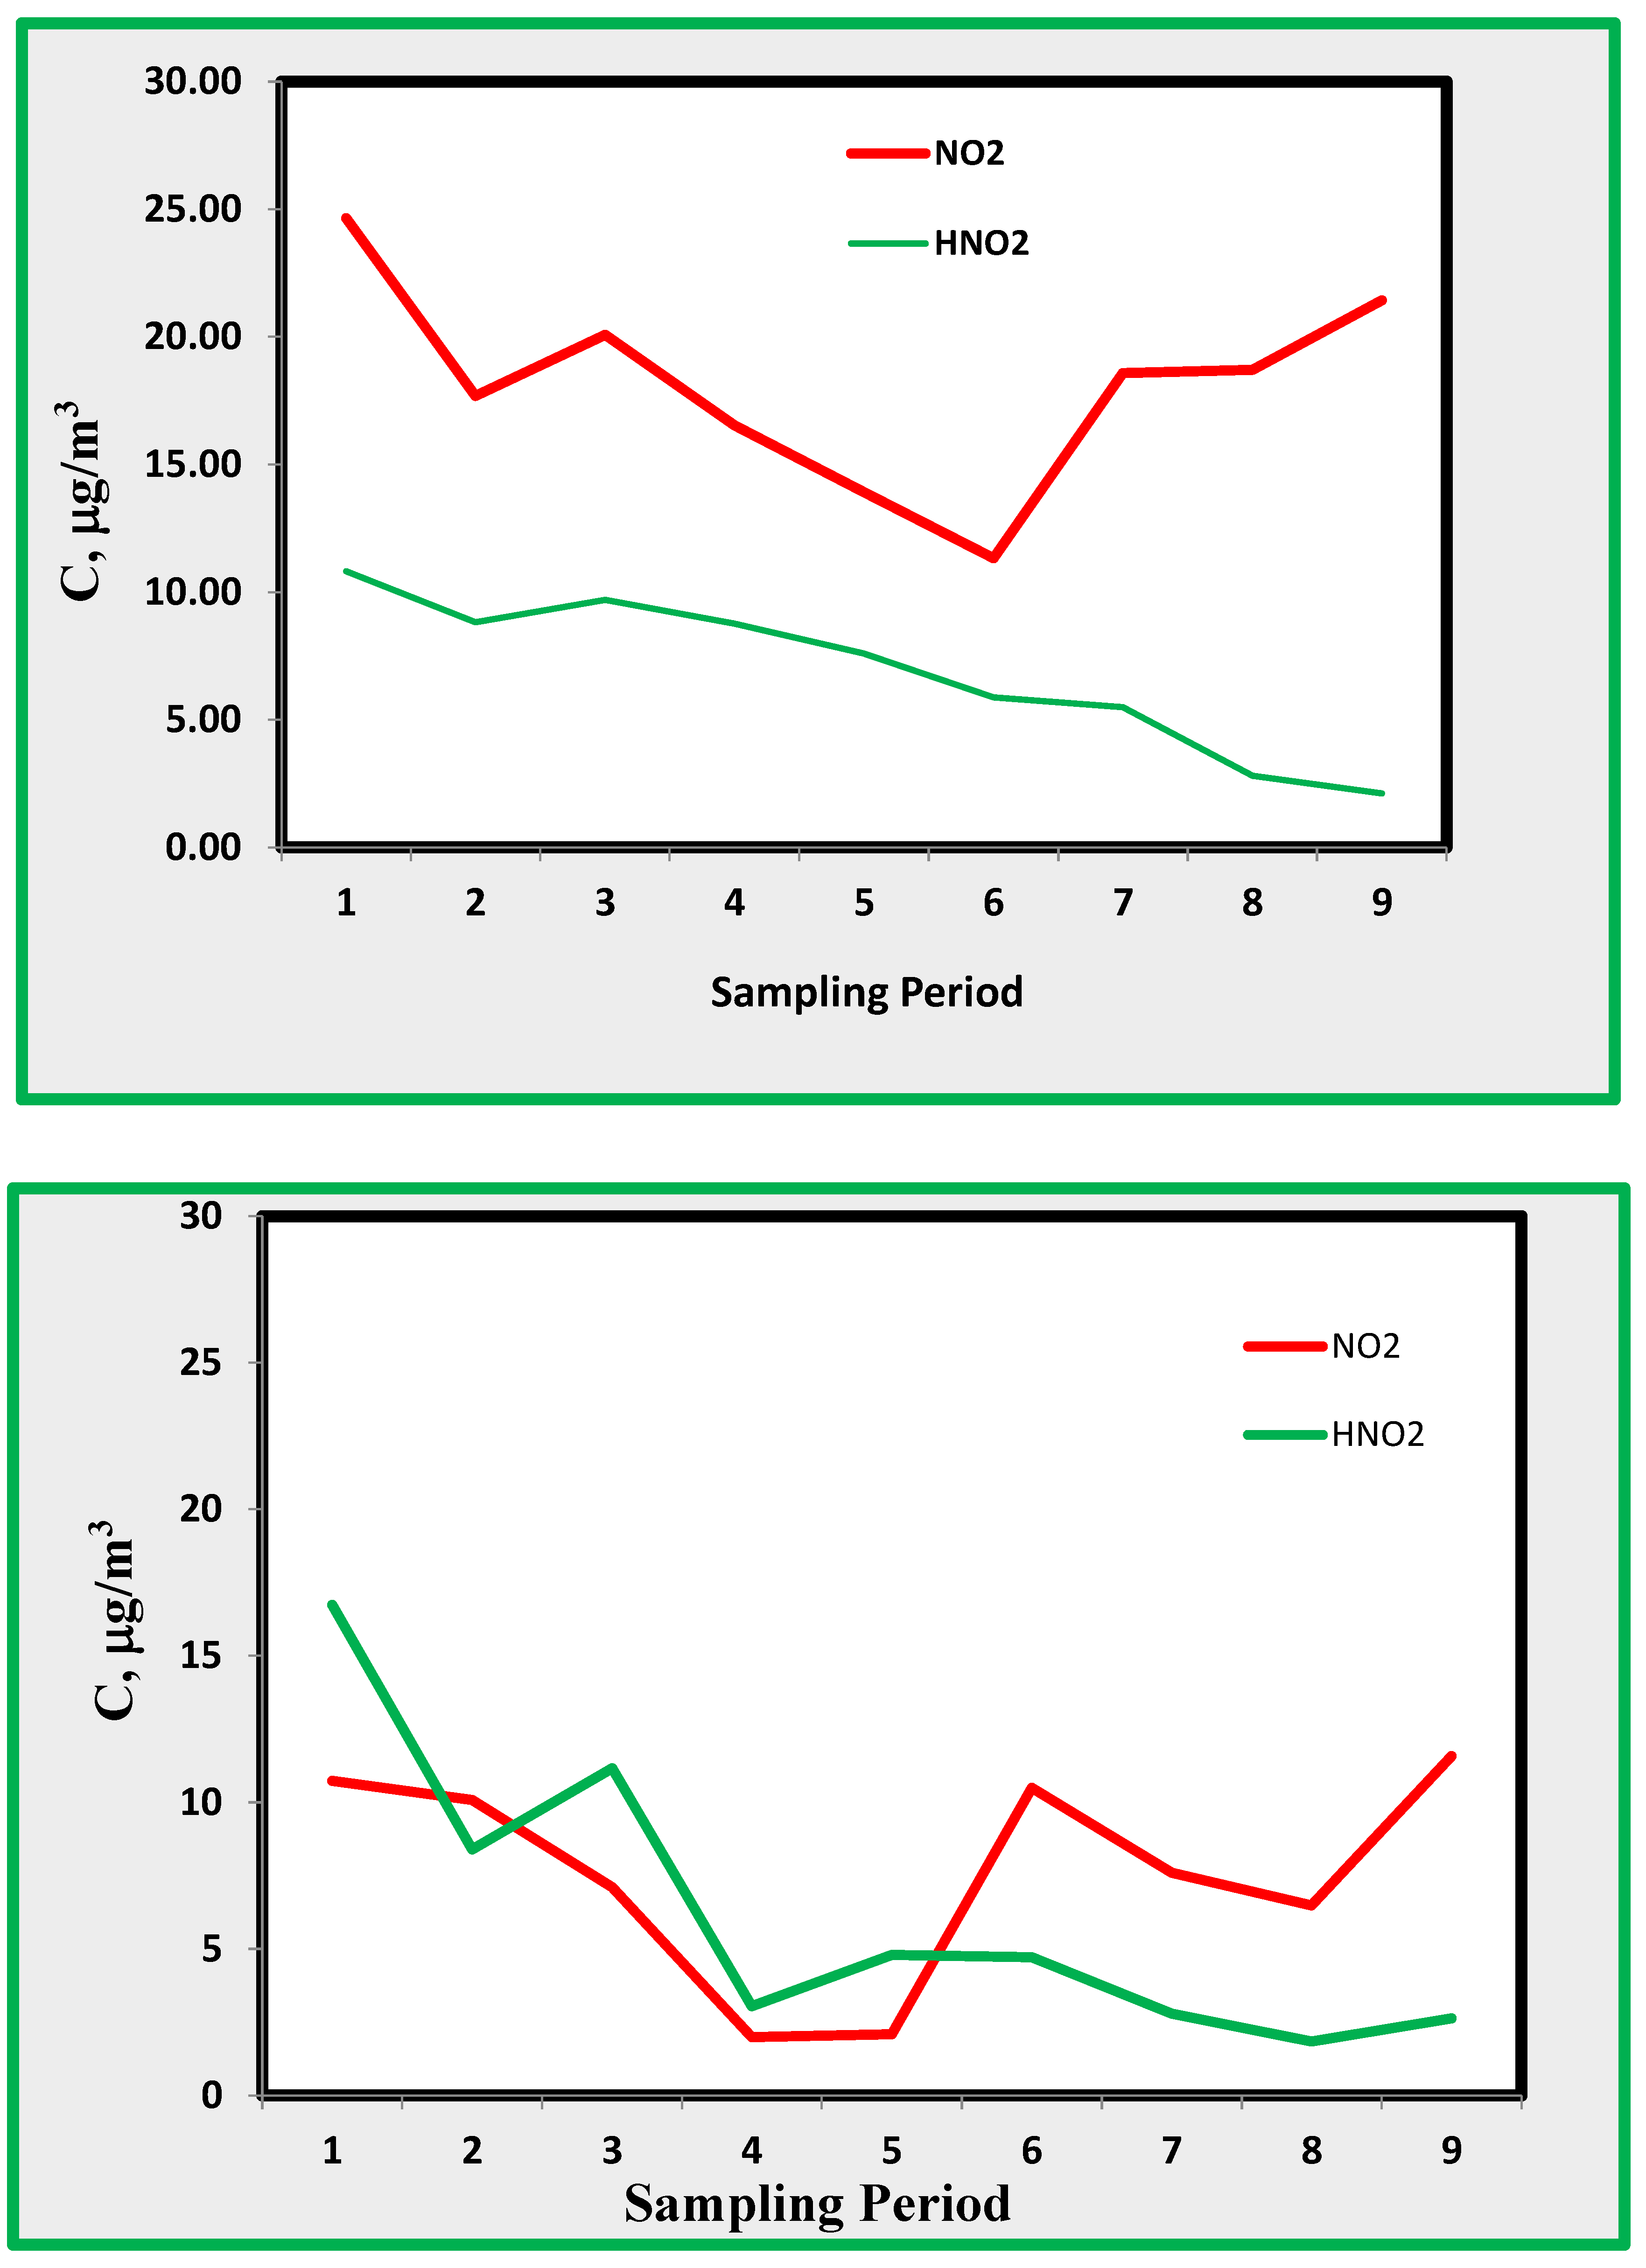
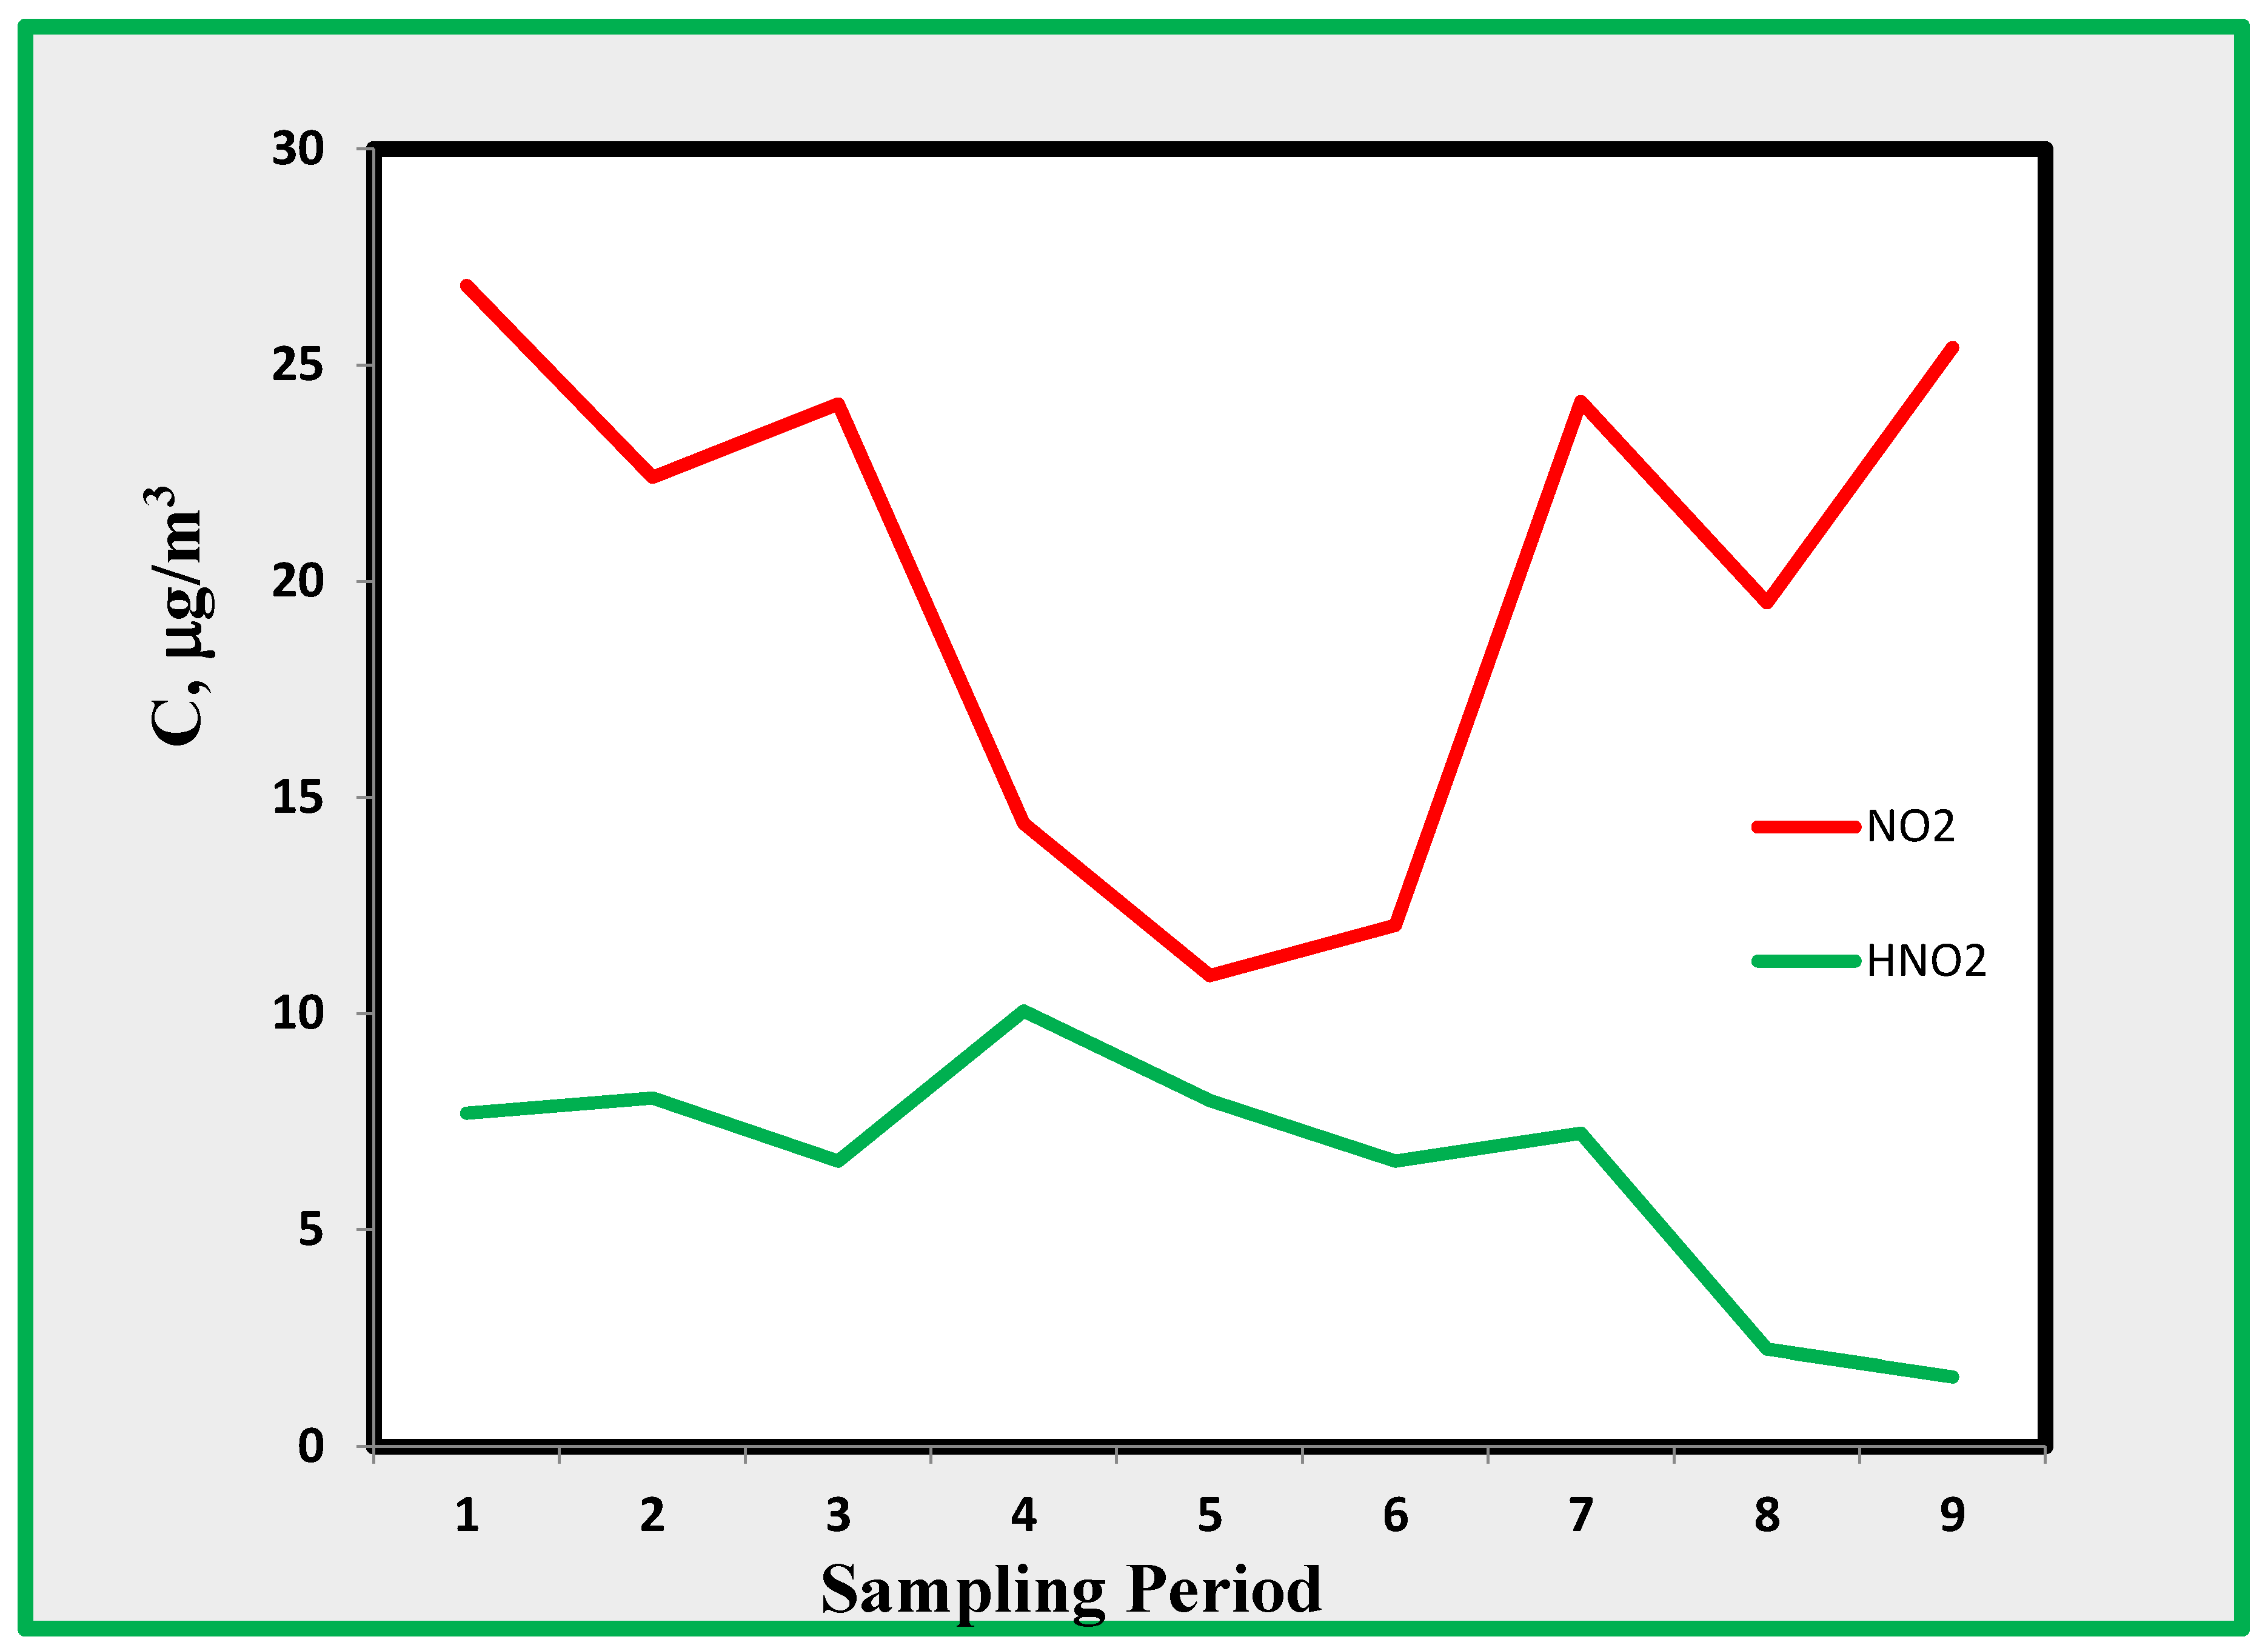
Figure 10.
Sulphur dioxide average concentrations in rooms B, C and D.
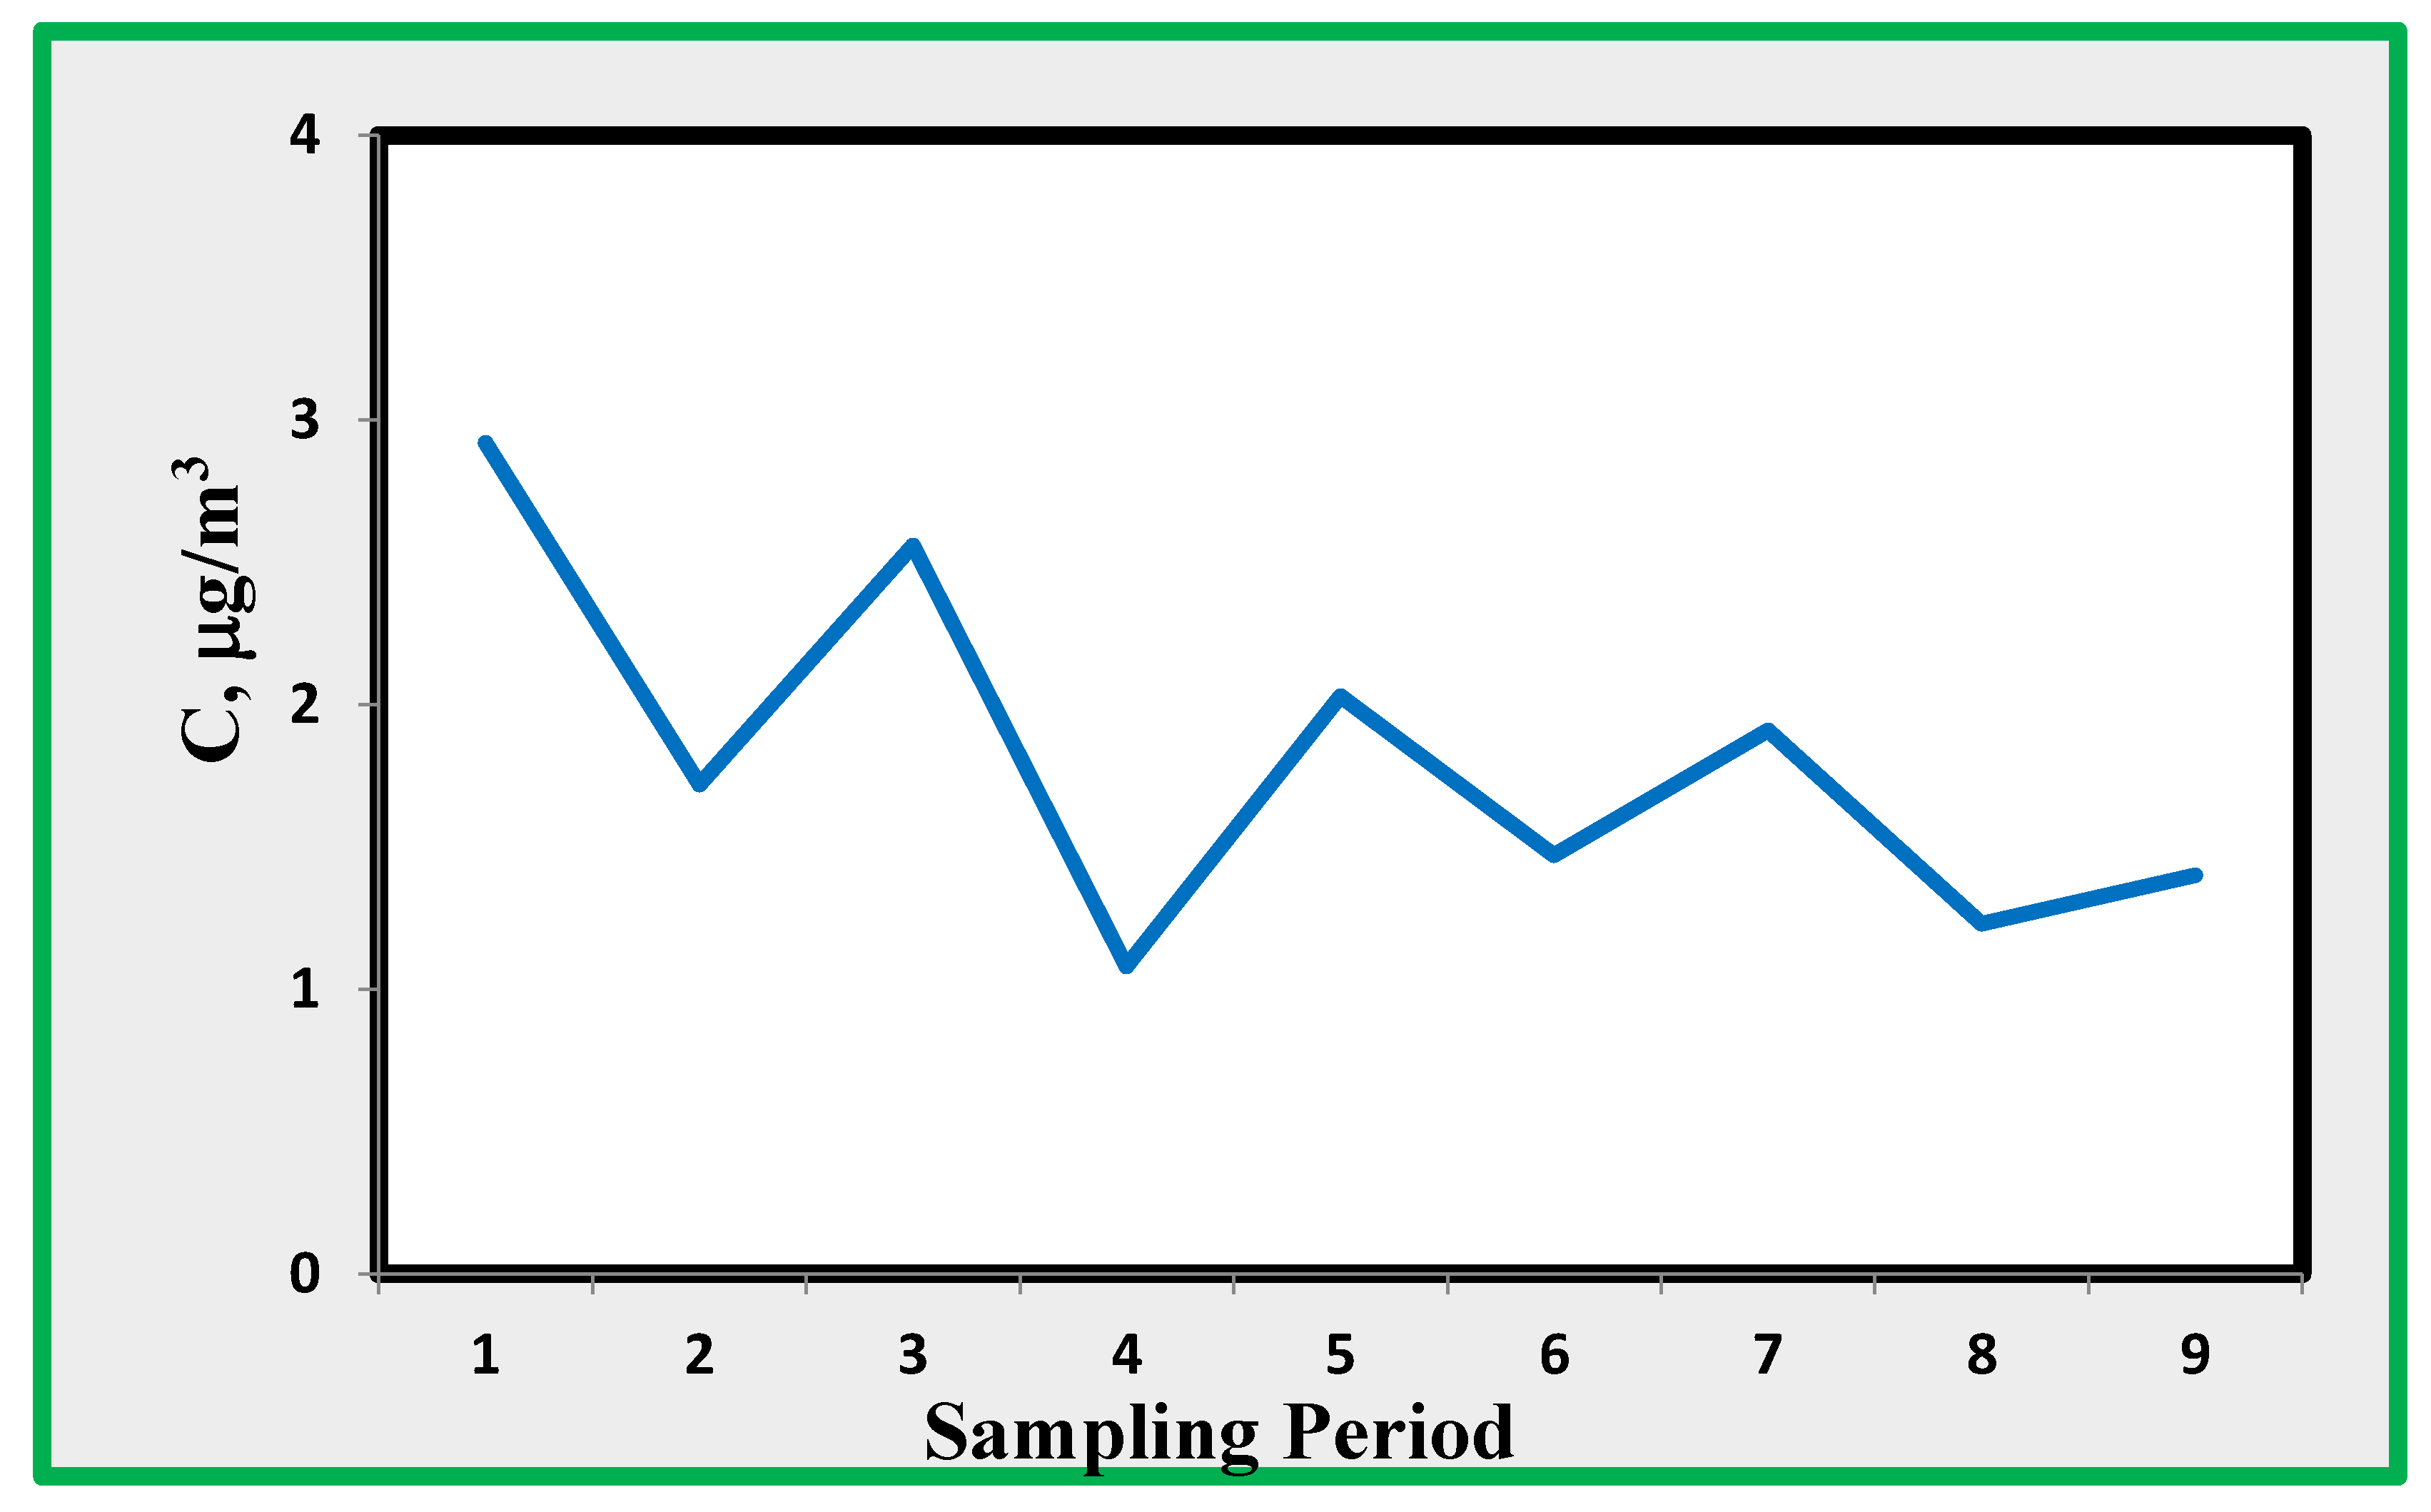
Figure 11.
Nitric acid found indoor as average of rooms B, C, D and E and that of room A.
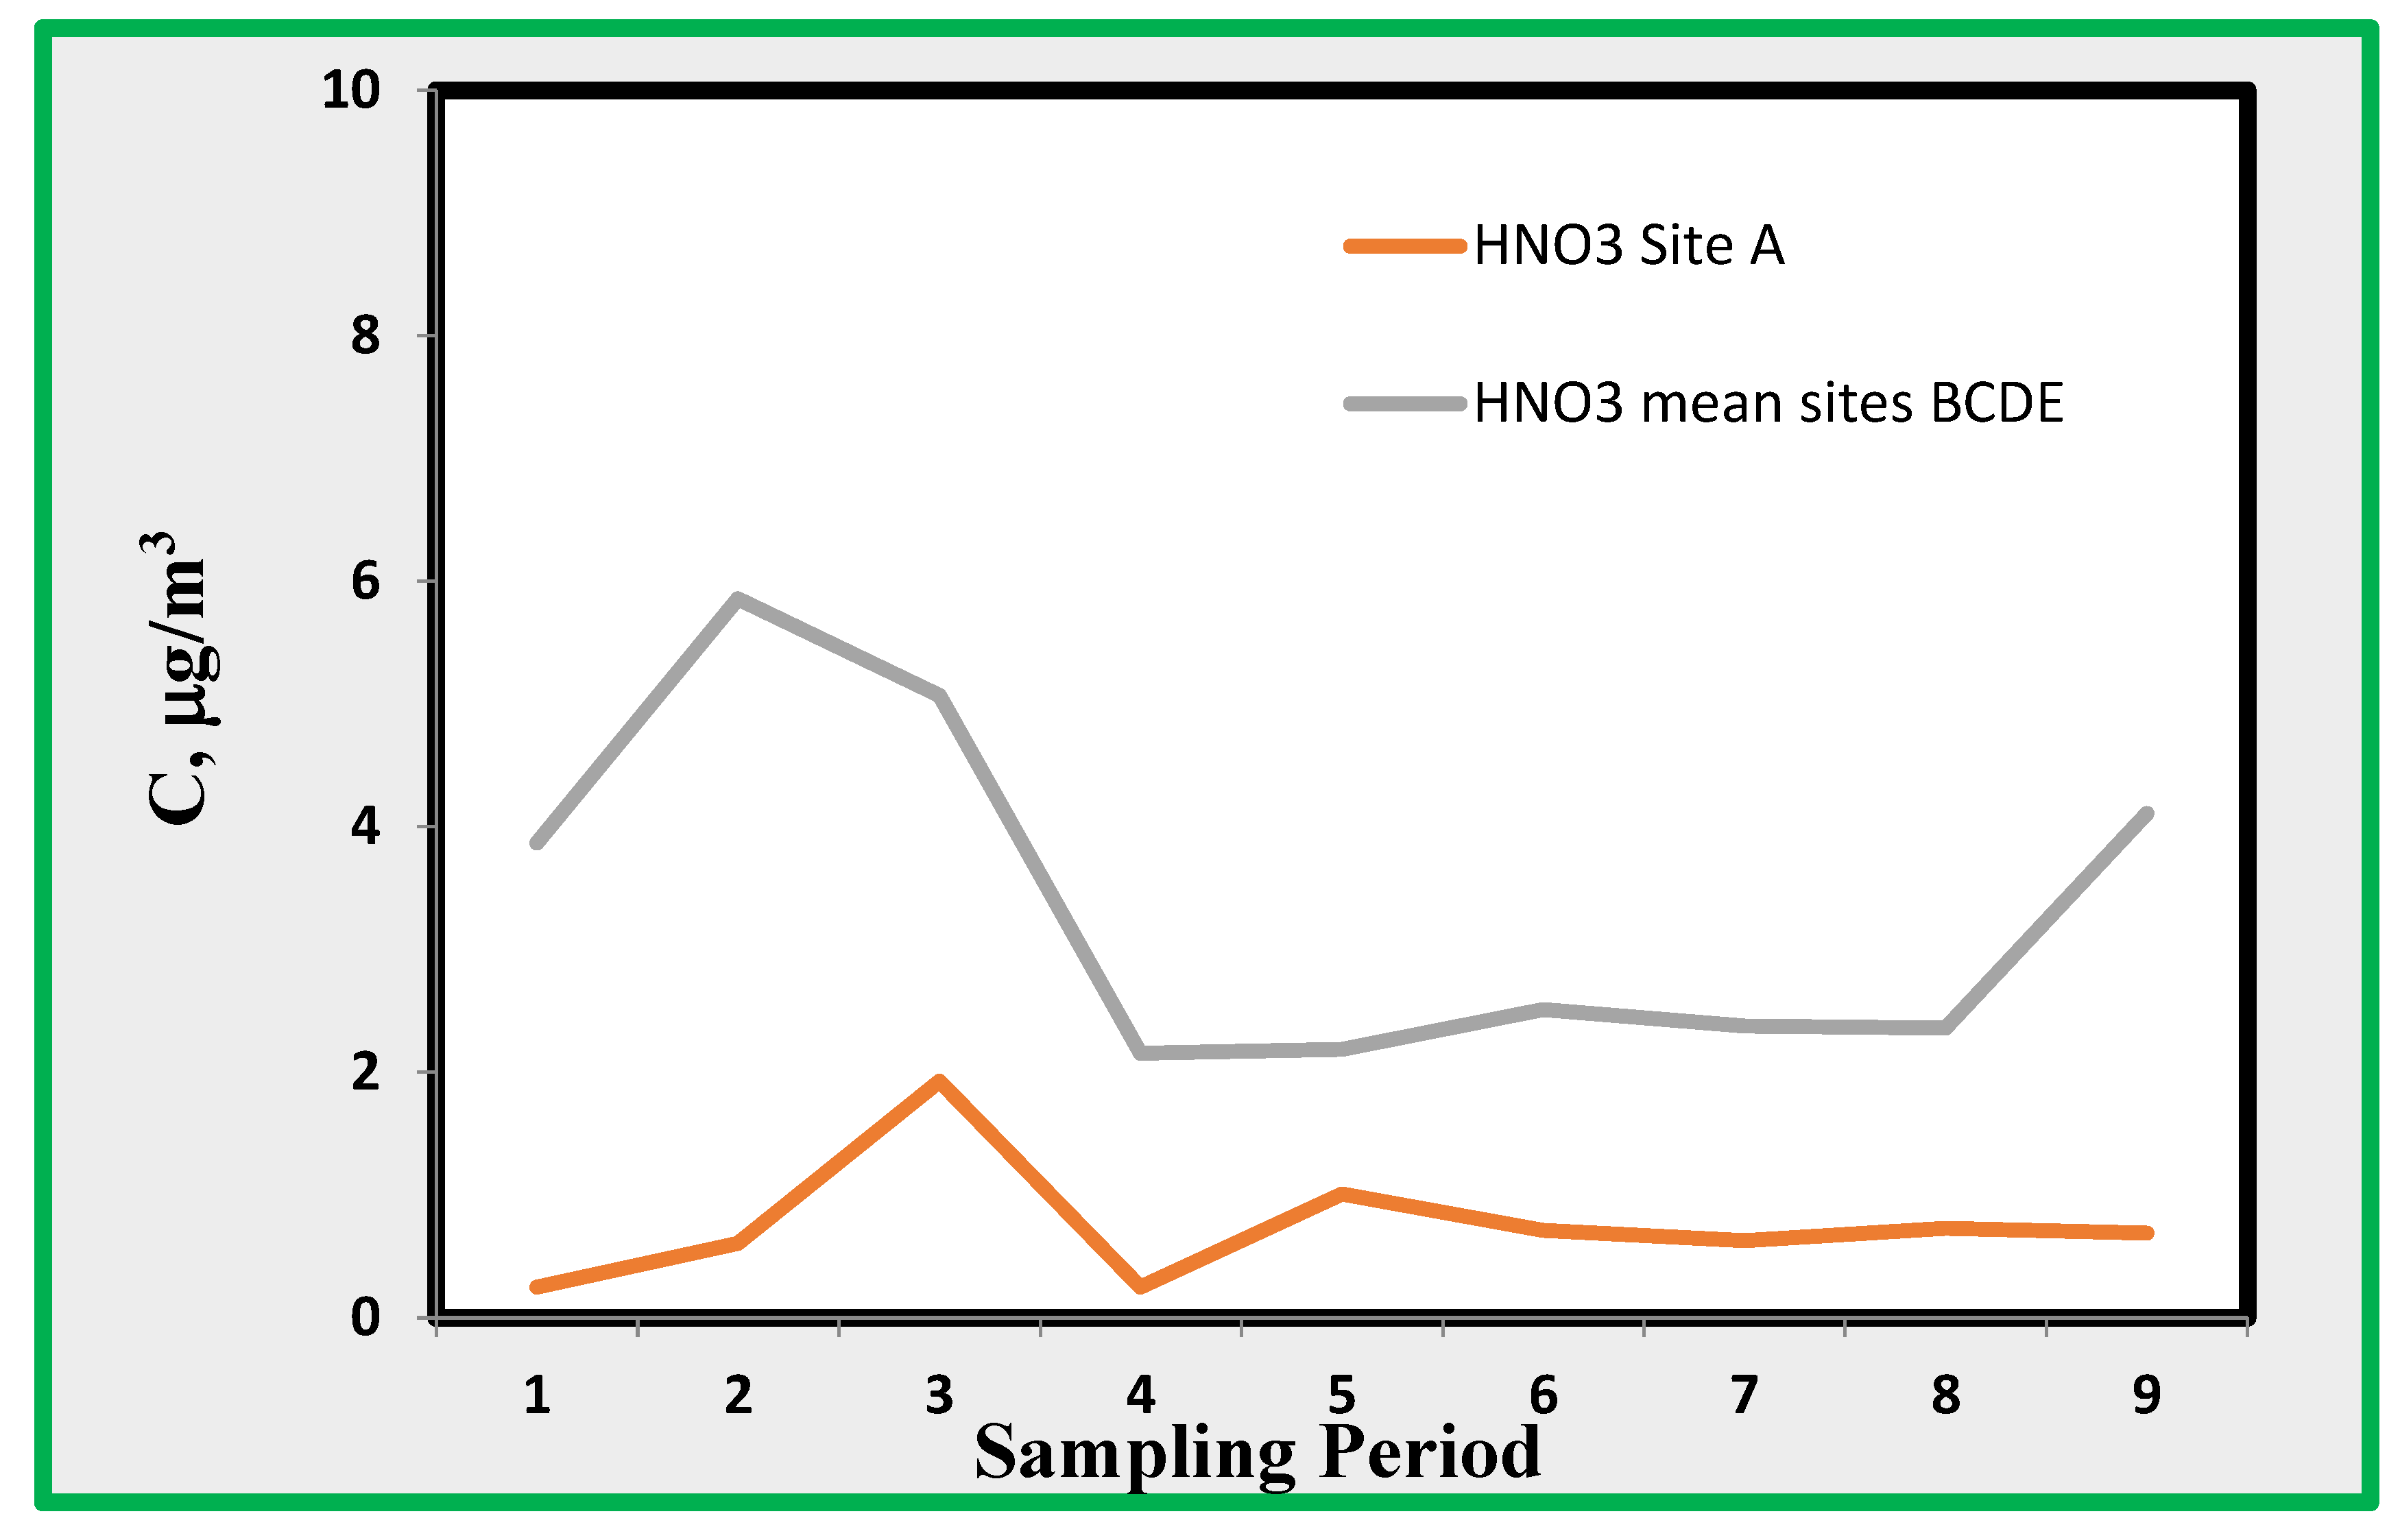
Figure 12.
Hydrogen Chloride found indoor as average of rooms B, C, D and E and that of room A.
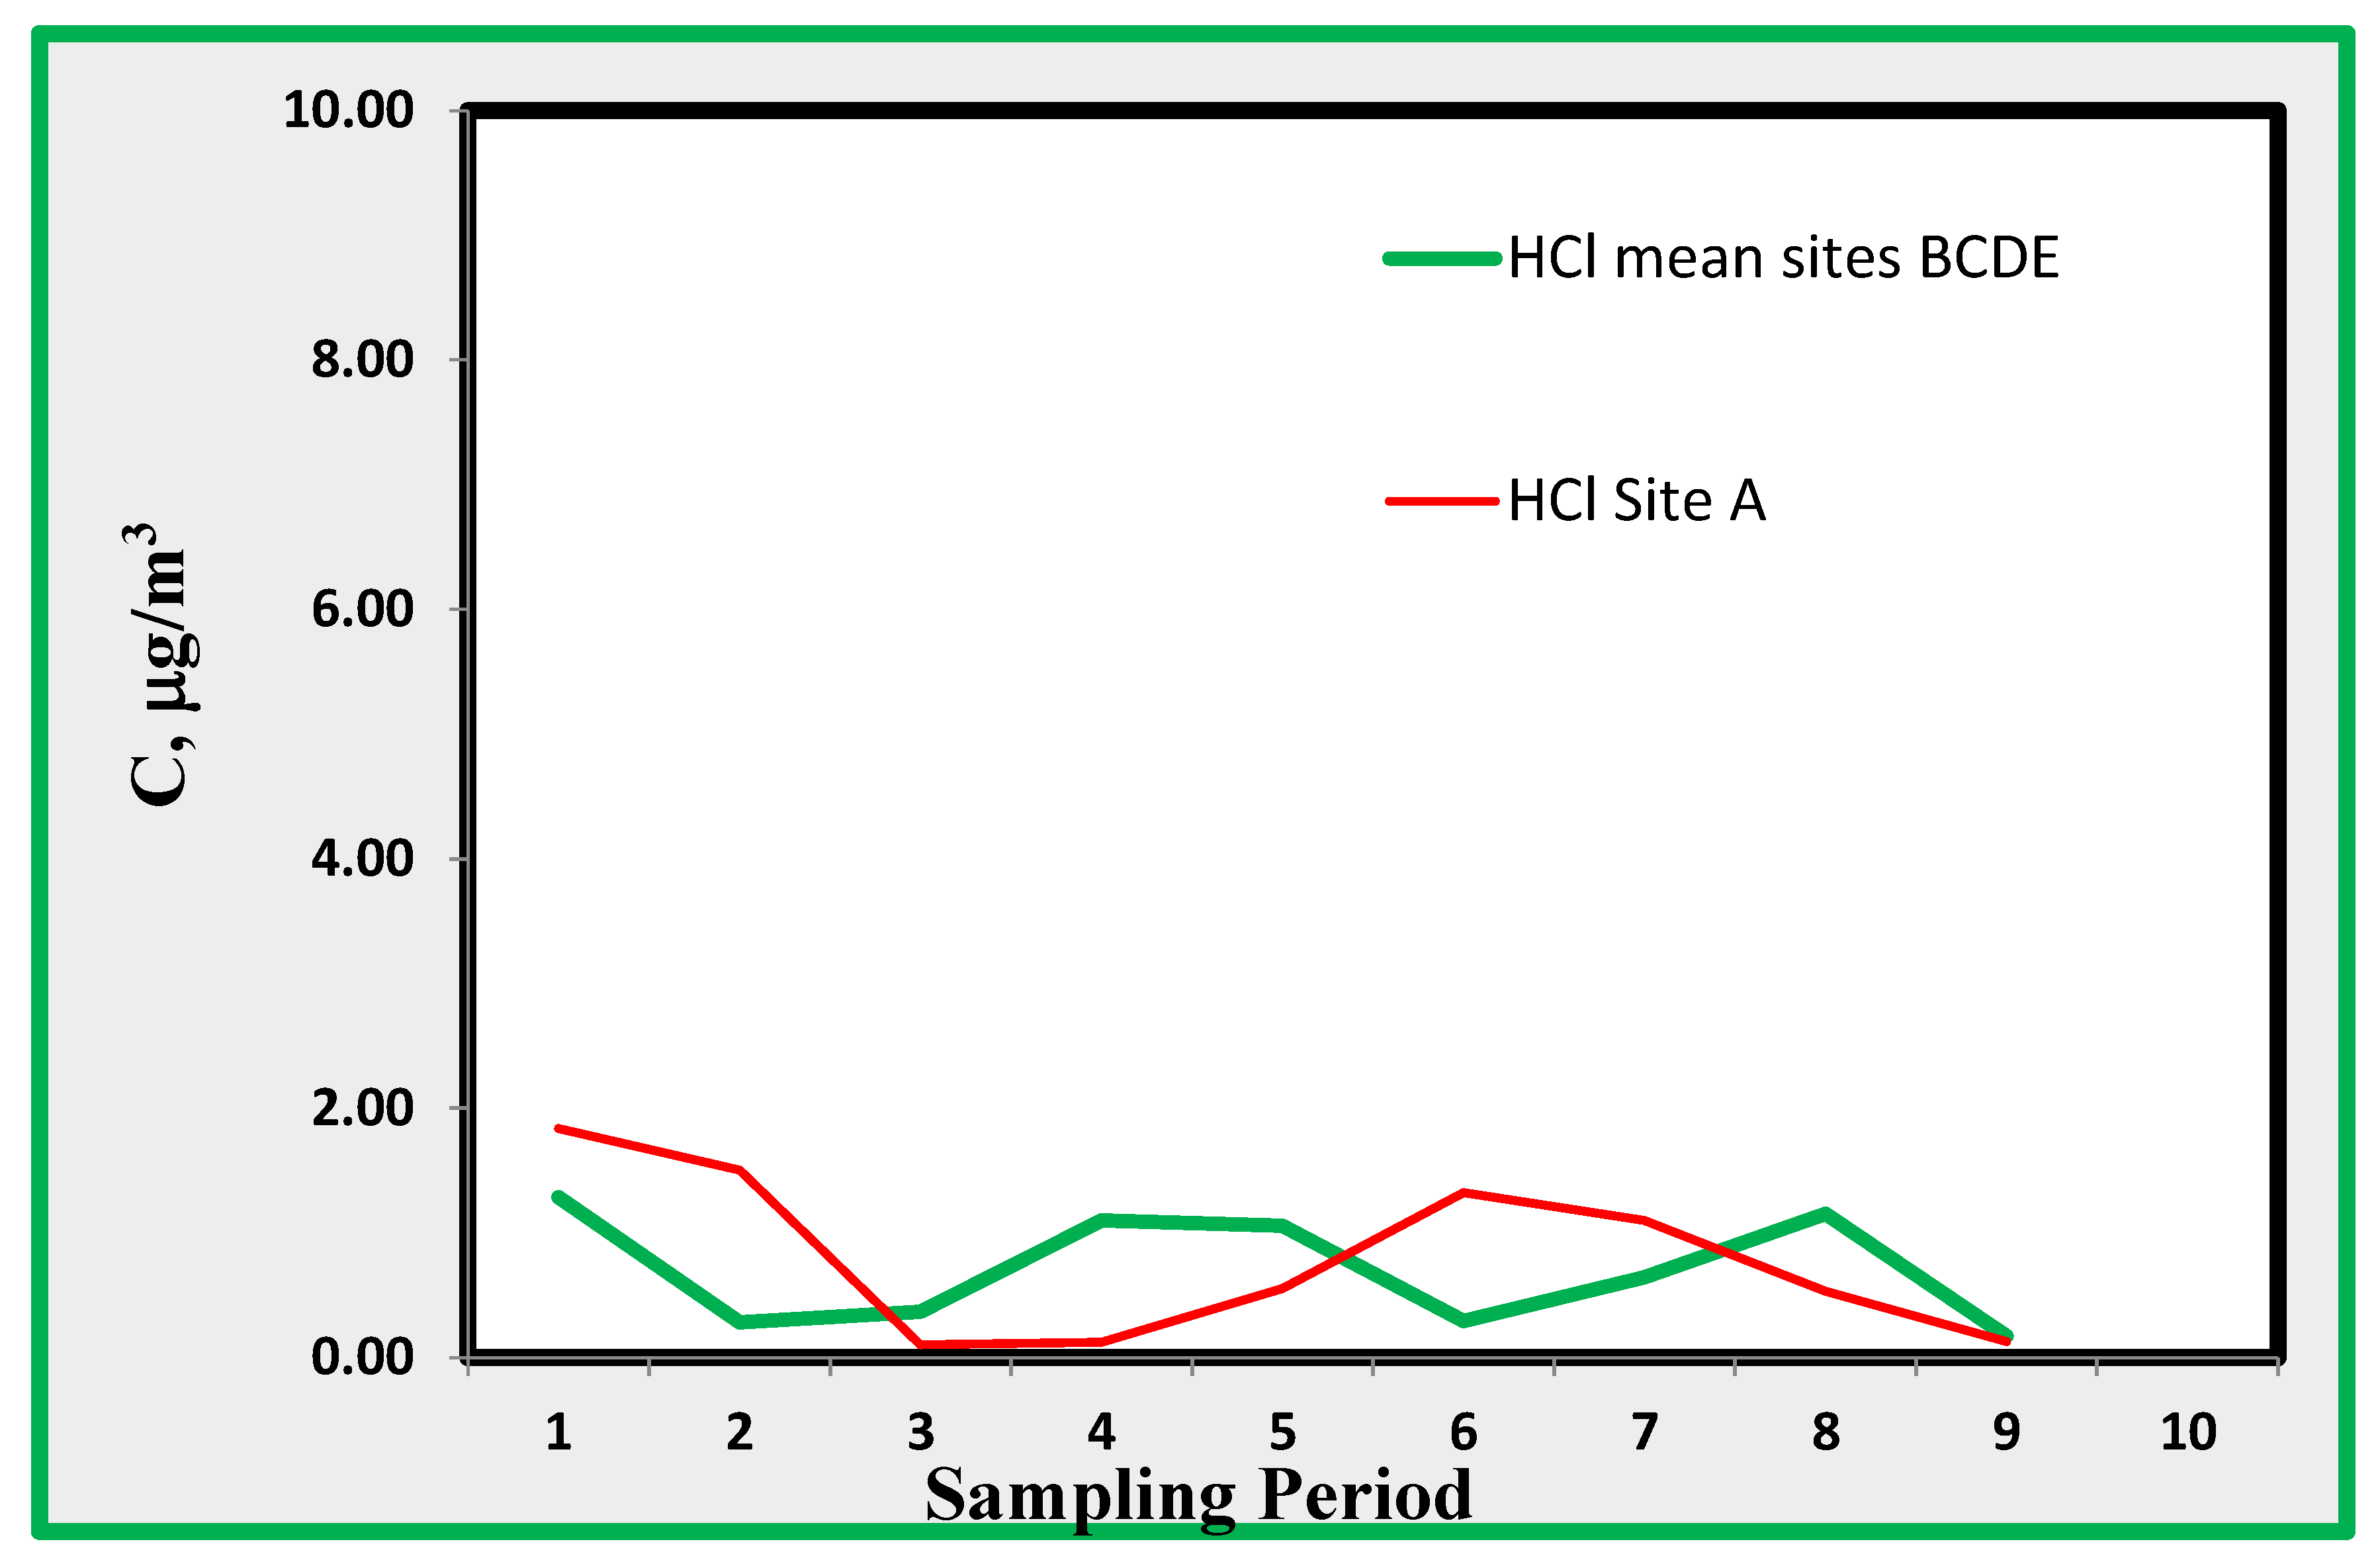

Table 1.
Sampling periods at MANN with start and end days.
| Sampling periods | Start day | End day | Exposure days/hours |
|---|---|---|---|
| 1 | 21/06/2021 | 27/07/2021 | 36/864 |
| 2 | 27/07/2021 | 07/09/2021 | 42/1008 |
| 3 | 07/09/2021 | 12/10/2021 | 35/840 |
| 4 | 12/10/2021 | 23/11/2021 | 42/1008 |
| 5 | 23/11/2021 | 21/12/2021 | 28/672 |
| 6 | 21/12/2021 | 25/01/2022 | 35/840 |
| 7 | 25/01/2022 | 22/02/2022 | 28/672 |
| 8 | 22/02/2022 | 22/03/2022 | 28/672 |
| 9 | 22/03/2022 | 19/07/2022 | 119/2856 |
Table 2.
Apparent flow rates used for the calculations of the gas phase concentration for the investigated pollutants.
Table 2.
Apparent flow rates used for the calculations of the gas phase concentration for the investigated pollutants.
| Pollutants | Ions by IC | Flow Rate (ml min-1) |
|---|---|---|
| Nitric Acid HNO3 | NO3- | 10.5 ± 0.7 |
| Hydrogen Chloride HCl | Cl- | 8.1 ± 0.7 |
| Nitrous Acid HNO2 | NO2- | 9,1± 0,2 |
| Sulphur Dioxide SO2 | SO42- | 9.9 ± 0.3 |
| Formic Acid | H-COO- | Not detected |
| Acetic Acid | CH3-COO- | Not detected |
Table 3.
Analytical Parameters quantified in IC analytical method LOD (the Detection Limit) is quantified by measuring and reading 10 blanks (and reported as the average value); LOQ (limit of quantification) is the first calibration line point.
Table 3.
Analytical Parameters quantified in IC analytical method LOD (the Detection Limit) is quantified by measuring and reading 10 blanks (and reported as the average value); LOQ (limit of quantification) is the first calibration line point.
| Ions | LOD (ppm) |
LOQ (ppm) |
Φ (mL/min) | LOD (µg/m3) | LOQ (µg/m3) |
|---|---|---|---|---|---|
| Chloride/Cl- (from HCl) | 0,01 | 0,1 | 8,1 | 0,14 | 1,48 |
| Nitrite/NO2- (from NO2) | 0,02 | 0,2 | 12,3 | 0,18 | 1,8 |
| Nitrite/NO2- (from HNO2) | 0,02 | 0,2 | 9,1 | 0,25 | 2,5 |
| Nitrate//NO3- (from HNO3) | 0,02 | 0,5 | 10,5 | 0,22 | 5,5 |
| Sulphate/SO42- (from SO2) | 0,045 | 0,5 | 9,9 | 0,52 | 5,2 |
Table 4.
Nitrogen Dioxide concentrations (µg/m3) in the sampling sites averaged over the sampling periods.
Table 4.
Nitrogen Dioxide concentrations (µg/m3) in the sampling sites averaged over the sampling periods.
| Sampling rooms | Sampling Periods | |||||||||
|---|---|---|---|---|---|---|---|---|---|---|
| 1 | 2 | 3 | 4 | 5 | 6 | 7 | 8 | 9 | Average Concentration (µg/m3) | |
| Room A | 10,74 | 10,08 | 7,10 | 1,99 | 2,09 | 10,50 | 7,60 | 6,48 | 11,58 | 7,57 |
| Room B | 23,56 | 18,84 | 26,48 | 18,39 | 15,81 | 13,36 | 18,49 | 21,88 | 22,59 | 19,93 |
| Room C | 23,56 | 15,68 | 17,18 | 14,02 | 12,38 | 9,78 | 20,73 | 16,56 | 20,31 | 16,69 |
| Room D | 26,84 | 18,53 | 16,58 | 17,20 | 13,57 | 10,86 | 16,55 | 17,74 | 21,40 | 17,70 |
| Room E | 26,84 | 22,40 | 24,10 | 14,40 | 10,88 | 12,05 | 24,16 | 19,50 | 25,40 | 19,97 |
| Indooor Averages | 25,20 | 18,86 | 24,10 | 16,00 | 13,16 | 11,51 | 19,98 | 18,92 | 22,43 | |
| OutdoorAverages | 44,69 | 36,86 | 45,50 | 47,50 | 46,48 | 42,24 | 52,72 | 37,94 | 43,38 | |
| Out/In | 1,77 | 1,95 | 1,89 | 2,97 | 3,53 | 3,67 | 2,64 | 2,01 | 1,93 | |
Table 5.
Average Temperature, Relative Humidity, dissociation constant Kn and the Equilibrium concentration of HNO3 ([HNO3]eq).
Table 5.
Average Temperature, Relative Humidity, dissociation constant Kn and the Equilibrium concentration of HNO3 ([HNO3]eq).
| Sampling period | Average T (°K) | Average RH (%) | RHD (%) |
Kn (ppb2) |
[HNO3]eq (ppb) |
|---|---|---|---|---|---|
| 2-Summertime | 301,3 | 57,0 | 66 | 63,0 | ~8 |
| 6-Wintertime | 290.0 | 30.5 | 60.7 | 3.5 | ~ 1,9 |
Table 6.
The nitrite/nitrate molar ratios in acid passive samplers.
| Sapling sites | Average [NO2]-/[NO3]- | Std, Deviation |
|---|---|---|
| Room B,C,D,E | 1,25 | 0,85 (N=35) |
| Room A | 3,08 | 1,89 (N=9) |
Disclaimer/Publisher’s Note: The statements, opinions and data contained in all publications are solely those of the individual author(s) and contributor(s) and not of MDPI and/or the editor(s). MDPI and/or the editor(s) disclaim responsibility for any injury to people or property resulting from any ideas, methods, instructions or products referred to in the content. |
© 2025 by the authors. Licensee MDPI, Basel, Switzerland. This article is an open access article distributed under the terms and conditions of the Creative Commons Attribution (CC BY) license (http://creativecommons.org/licenses/by/4.0/).
Copyright: This open access article is published under a Creative Commons CC BY 4.0 license, which permit the free download, distribution, and reuse, provided that the author and preprint are cited in any reuse.


