Submitted:
25 October 2025
Posted:
27 October 2025
You are already at the latest version
Abstract
Air pollution levels across industrial clusters are major environmental and health concerns. This study investigated the diurnal, monthly and seasonal concentrations of gaseous and fine particulate matter and respiratory conditions of outdoor workers across selected industrial locations in Lagos State, Nigeria. Field monitoring of air quality and respiratory conditions data for 12 months were used. Diurnal and monthly ambient air quality levels varied over the 12 months. The dry season showed higher pollutants and respiratory conditions than the wet season and the control site. Asthma, Pneumonia, and upper and lower respiratory tract infections accounted for the major outdoor respiratory conditions among under-five and the youths. ANOVA, t-test and multiple regression analyses at ρ < 0.05 showed significant variation in ambient sulfur(iv)oxide, nitrogen(iv)oxide and fine particulate matters across the study area. A significant relationship was found between carbon(ii)oxide, sulfur(iv)oxide, nitrogen(iv)oxide, fine particulate matter and respiratory conditions across the study area. The quality of both diurnal, monthly and seasonal concentrations of air was higher than the 2021 WHO air quality guidelines. Hence, continuous air quality monitoring, tree planting and greening, development of road infrastructures, use of high-quality fuels and bio-fuels, and mist collectors will significantly improve the air quality levels to the WHO acceptable guidelines across the study area.
Keywords:
air pollution
; respiratory health
; industrial workers
; environmental quality
1. Introduction
Air pollution in urban areas is a dynamic and complex mixture of both man-made (anthropogenic) pollutants and natural sources (Ozlem et al., 2016). Air quality depends on the atmosphere's dynamics amount and intensities of pollutants emissions, types of physicochemical changes, air masses movement and meteorological conditions (Mengesha & Mamo 2006; Cichowicz, et al 2017; Iny et al, 2016;Saini et al., 2017; Goyal & Chalapati 2007). Industries are one of the dominant sources of pollution globally and involve the release of atmospheric emissions (such as gases, particulates and volatile organic substances) into the atmosphere from various forms altering the chemical composition of the ambient air and increasing its toxicity to humans and the environment (Mengesha and Mamo 2006). Combustion of non-renewable fossil fuels for electricity generation, transport and industry is responsible for the increased mortality and morbidities from respiratory and cardiovascular diseases (Zhang et al., 2015). Large quantities of pollutants from urban transport, energy production and industries negatively impact human and environmental receptors (Baklanor et al., 2018). There is a huge variation in sources and degree of emission between world geographical regions such that emissions in European and American cities are associated with road use while industrial and biofuel consumption characterized Asian and African cities (Baklanov et al, 2018). Ambient air pollution (AAP) is more likely to have the largest impact on sites of deposition where doses are highest, such as the upper aerodigestive tract and lungs. Biomarkers that show great potential for the assessment of AAP exposure and respiratory effects are biomarkers in exhaled breath. Such biomarkers include but are not limited to exhaled nitric oxide (FeNO), exhaled breath condensate (EBC) pH, 8-isoprostane, and interleukin 1β. These exhaled biomarkers of airway oxidative stress and inflammation can provide a more reliable indication of a biologically effective dose for respiratory effects (Demetriou & Vineis 2015). Several studies have also investigated the impacts of meteorological conditions on industrial air pollution and human well-being at both city and regional levels (Kakoli & Gupta 2005; Filho et al, 2008; Iny et al, 2016; Cohen et al, 2017; Xiaolin et al, 2017; Oudin, et al 2018; Arias-Ortiz et al, 2018; Dappe, et al 2018) and emphasis is being made on the urgent need for environmental monitoring of stressors, especially amongst urban slums in low and middle-income countries where poverty, deprivation and failing health infrastructures are perversive (Mustapha, et al. 2022).
Industrial pollution sources are mixed with unidentified combustion sources or traffic (Belis et al., 2013) such that proximity to a source of pollution can be a health concern to the inhabitants e.g. roadways and traffic congestion paths and road users (Requia & Koutrakis, 2018). The release of large quantities of pollutants into the ambient air has caused numerous local health problems (WHS, 2018). Past episodes are notable examples; the release of a gas cloud of methylisocyanate at the Union Carbide plants in Bhopal India in 1984 led to the deaths of over three thousand eight hundred people, persistent meteorological conditions kept emissions trapped near the earth’s surface and resulted in the deaths of over sixty people and hospitalization of over six hundred people in the Meuse Valley in Belgium in 1930, in 1948 a strong temperature inversion in a nearby factory contaminated the air, annihilated over twenty people and hospitalized fourteen thousand people in Donora Pennsylvania in the United State of America, similar incident also occurred in 1950 in Poza Rica city of Mexico, the Fog of 1952 and 1962 resulted in premature deaths of over four thousand in London, in Nigeria twenty five students of Ogba junior secondary school Ikeja, Lagos in November 2013 suffered convulsion after inhaling what was presumed to be poisonous fumes from a nearby industrial plant, residents near an Ikeja glass manufacturing factory in 1984 complained of rotten eggs odour coming from a factory workers at a Lagos based company complained of irritation of the eyes, unusual behaviour and loss of appetite due to inhalation of solvent vapours and fumes from their process plants, lowering of pulmonary function symptoms was reported by industrial workers exposed to carbon black concentration of 31.2 + 2.45mg/m3 within dry cell battery, tyres factories, toluene di-secyanate based polyurethane foam plant and asbestos, textile and toluene diisocyanate foam factories in Ife (Adeyemi 1984; Akeredolu, 1987; Oleru 1980, 1981; see the Guardian Nigeria paper of Saturday 31st October 2015; see the district of Columbia’s ambient air quality trends report of October, 2014; Mengesha & Mamo, 2006).
A variety of fatal respiratory diseases are caused by outdoor and indoor air pollution (Saud & Paudel, 2018). Indoor air quality is dependent on the quality of outdoor air (Leung, 2015). Air pollutants from outdoors affected by ambient meteorological conditions can penetrate the indoor environment, natural ventilation is driven by prevailing wind flow and occurs whenever the doors and windows of the room/building are open. Air exchange between indoor and outdoor environments still occurs through cracks and leaks in the building envelope, a process called infiltration, which may be significant for a building with poor sealing (Leung, 2015). The skin is the body's first line of defense against a foreign pathogen or infectious agent and it is the first organ that may be contaminated by a pollutant. The skin is a target organ for pollution, the absorption of environmental pollutants from this organ is equivalent to the respiratory uptake (Ghorani-Azam et al. 2016). Studies have established the nexus between exposure to industrial air pollution and increased risk for morbidity and global burden of respiratory, cardiovascular and cerebrovascular diseases e.g. acute respi ratory infections, chronic obstructive pulmonary diseases, asthma, lung cancer, recurrent and incidence stroke, cognitive decline, dementia, psychotropic medications in children and adolescents, stress, anxiety, risk of schizophrenia, depression and death (Briere et al 1983; Bickerstaff & Walker 2001; Oberdörster & Utell, 2002; Pedersen et al 2004; Leem, 2006; Szyszkowicz et al 2010; WHO 2013; Oudin et al 2009, 2012, 2016; Power et al 2015; 2016; Mehta et al, 2015; Cohen et al, 2017; Karthik et al, 2017; Pun et al 2017; Ojekunle et al, 2018). Most studies in Nigeria have investigated the influence of meteorological variables on ambient air pollution at roadside corridors with little attention on the influence of industrial air pollution on respiratory conditions (Akanni, 2008, 2010; Gobo, et al 2012; Ekpenyong et al, 2012; Alfred & Hyeladi, 2013; Weli 2014; Weli & Adegoke, 2016; Asuoha & Osu, 2015; Ojekunle et al, 2018) which has necessitated this study.
2. Methodology
2.1. Study Area
Lagos State is situated in South Western Nigeria at latitudes 6022’N and 6052’N and longitudes 2042’E and 3042’E. It is bounded to the west by the Republic of Benin, on the southern boundary by a 180 km long Atlantic coastline and on the northern and eastern boundaries by Ogun State. Lagos state has a landmass of 3,671km2 of which over 35% (787 km2) of this are defined by lagoons, creeks and islands (Soladoye & Ajibade 2014; PWC, 2015; NBS 2011). Lagos state has 20 local government areas of which sixteen are metropolitan densely populated areas. The Climate of Nigeria is balkanized into three climate types which are tropical rainforest, montane or highland and tropical savanna climates. The southern region of Nigeria where Lagos is located is defined by the tropical rainforest climate classified according to Koppens as Af, furthermore, it is divided into tropical wet and tropical wet and dry climates characterized by minimal temperature range and convectional storms due to her proximity to the equatorial climate (and the Atlantic) (Ileoje, 2001; Eludoyin, et al 2013). The coastal landscape of Lagos state is bifurcated into five geomorphological sub-units, which are; coastal creeks and lagoons, abandoned beach ridge complex, swamp flats, active barrier beach complex and forested river floodplain (Adegoke et al. 1980). The topography is flat slightly above mean sea level (Oluwole et al. 1994) and is defined by swamp forests of the coastal belt with fresh water, and dry lowland rain forests with patches of vegetation in their natural state. This wetland vegetation is caused by the double maxima rainfall pattern of the region (Adelana & Olasehinde, 2005; Odjugbo, 2010). The geology of Lagos state is made up of the tertiary and quaternary sediments which comprise the Benin formation (Miocene to recent), recent littoral alluvium and lagoon/coastal plain sands of the Dahomey basin (where the sea bed steeply slopes away from shore and stratigraphically consist of Abeokuta and Imo groups and Ilaro Formation) (Soladoye & Ajibade 2014). The Dahomey basin spreads through southeastern Ghana in the west, through southern Togo and southern Benin Republic to southwest Nigeria, the basin is bounded to the west by faults and marked by the Benin hinge line at its eastern limit (Yusuf & Abiye, 2019).
Lagos state accounts for over 60% of the industrial and commercial activities in Nigeria and financially solvent with the capacity of generating over 75% of its revenues independent of federal allocation (LBS, 2015; Ajayi 2007, 2011; SWIFT 2017). According to the Lagos Bureau of Statistics (2015) report on revenue generation, Lagos state had a gross domestic product (GDP) of over 80 billion dollars in 2010 accounting for 36% of Nigeria's GDP and among the largest economy in Africa. Lagos is the highest internal revenue earner in Nigeria recording over 400 billion Naira in 2018 (Oluseun et al 2018) and plays the role of both a megacity and a global city with a substantial foreign-born populace and a non-stop flight to hundreds of destinations around the world (Nwagwu & Oni 2015; Soladoye & Ajibade 2014). Lagos State has a projected population of 21 million in 2021 according to the 2006 NPC projection making it the seventh fastest-growing city in the world and the third largest city in Africa (Longe, 2011; Salau, 2016; NPC 2006). It has a population growth rate of 3.2% and is projected to be over 30 million by 2025 (PWC, 2015). Over 80% of the population is domiciled on 37% of the metropolitan landmass where all economic activities are concentrated and driven by a skilled workforce of over 45% with a literacy rate of 92% (Ojeh et al 2016; PWC, 2015). The South West Summit Report (2017) on Investment and Exhibition stated that the South West Industrial Region of Nigeria controls 60% of the nation’s industrial capacity, three deep sea ports of Apapa, Tin Can Island and Roro, three thermal stations of Egbin, Papalanto and Omotosho and a West Africa gas pipeline linked industrial estates of Agbara, Ikeja and Otta under the West African Gas Pipeline Plan. The industrial region of South Western Nigeria is located within the industrial conurbation of Ota and Lagos which comprises of states of Ogun, Oyo and Lagos. Most of the industrial clusters are located in Lagos than in Ogun and Oyo states. The industrial estates in Lagos are Ikeja, Agidingbi, Amuwo Odofin, Apapa, Gbagada, Iganmu, Ijora, Ilupeju, Matori, Ogba, Oregun, Oshodi/Isolo/Ilasamaja, Surulere, Odogunya, and Yaba. Others are in Oluyole (Oyo State) and in Agbara-Igbesa industrial estate, Ota industrial estate, Ibeshe-Papalanto-Ewekoro region, Flower Gate industrial estate around the Lagos/Abeokuta interchange and along the Lagos/ Ibadan express from Isheri to Sagamu all in Ogun State (Ajayi, 2007, 2011; Etim, 2012; Ojiodu et al, 2013; Mashi et al, 2014; Ogun State report on industrial and property development, 2020). Some of these estates are both active and dormant in industrial activities. In terms of their sizes, activeness and intensities of industrial activity, the Ikeja/Ogba, Oshodi/Ilupeju, Apapa, Surulere and Odogunya industrial estates were selected for this study.
Lagos state is home to over 90% of head offices of many airlines and multinational corporations, expatriates and recently a tourist heaven due to its re-modernization of its city landscape and infrastructures and modification of its entertainment industries in the city e.g., music scenes, movie industries, colourful carnivals etc. (Salau, 2016; PWC 2015; LBS 2015; Nwagwu & Oni 2015). According to the Price Water Copper report (2015) on investment and travel in Lagos, Lagos airport is the busiest airport in West Africa, the fifth busiest in Africa accounting for over six million passengers (i.e., 74% of Nigeria's yearly international passengers) with one in every three international flights into Nigeria bound for the Lagos airport. Also, Lagos serves as a key access point to many markets for both Nigeria and the West African sub-region with the largest markets in Idumota Lagos. Furthermore, it is driven by the Bus Rapid Transit (BRT) system that transports over 200,000 passengers daily equivalent to the New York City transport systems and has Nigeria’s first cable-stayed bridge geared towards reducing congestion and travel time between Lekki and Victoria Island by 20 min every day. Lagos state comprises a mainland where a majority of the inhabitants live and the island where the head offices of governmental and commercial establishments are located in addition to a low-density residential area. The two sections are linked by three bridges each forming the end of a major highway (Oluwole et al. 1994). Lagos metropolis is located within the Western Nigeria Coastal Zone of coastal creeks and lagoons (Pugh 1954) developed by barrier beaches associated with sand deposition (Hill & Webb 1958). The metropolis is the area of land around the only inlet of the sea into the extensive lagoon system (the Lagos harbour). It includes the islands (Lagos, Ikoyi and Victoria), Apapa, Shomolu, Ikeja, Shasha and Agege.

Table 1.
Study area.
| S/n | Industrial estate | Year of est. | Active industrial firm |
Size (Ha) |
Estate area | Estate type | Industrial nature |
| 1 | Ikeja/Ogba | 1959 | 75 | 180 | Mainland | IR | FBT, FM, C&P, DIP, PPP, TW, EE, WH WWG, MVP, CCT, EE, and P. |
| 2 | Oshodi/Ilupeju | 1962 | 57 | 330 | Mainland | IR | FBT, DIP, PPP, C&P, CP& IT, TW, WWG, MVP, WH and P. |
| 3 | Surulere | 1957 | 39 | 25 | Mainland | IR | FBT, WH, M&S, C, PPP, TW, DIP, E/P, EE, NMMP and MV |
| 4 | Apapa | 1957 | 31 | 100 | Coastal | IR | FBT, C&P, M&S, PPP, OMC, WH, CCT and TW |
| 5 | Odogunya | 1976 | 52 | 1582.27 | Mainland | IR | FBT, C&P, DIP, M&S, PPP, TW, EE, WH, FM, FW and E/P |
| 6 | Alausa (control) | 1996 | 0 | 1 | Mainland | GR | LASEPA premises, Government buildings, offices and residential areas |
Source: (Ajayi, 1998; Fagbohunka, 2014; MAN, 2014; LBS, 2016; Field Survey, 2021). Note: IR: Industrial/Residential; GR: Government/Residential. Ha: Hectares; WH: Warehousing. M&S: Metals Iron and Steels Fabrication; C&P: Chemicals and Pharmaceuticals. CP&IT: Computer Parts and Information Technology Equipment; DIP: Domestic/ Industrial Plastics and Nylons, FBT: Food, Beverages, Biscuits and Tobacco; PPP: Paper and Pulp Products, MVP: Motor Vehicle Assembly and Parts; NMMP: Non -Metallic Mineral Products, EE: Electrical and Electronics Products; TW: Textile and Wearing Apparels, WWG: Wood and Wood Goods;CCT: Cement, Clay and Tiles, OMC: Oil Marketing Companies; E/P: Energy/Power, FM: Foam Manufacturing; P: Publishing, C: Carpets; FW: Foot Wears
Figure 1.
Study area showing the sampling points2.2 Data Collected.
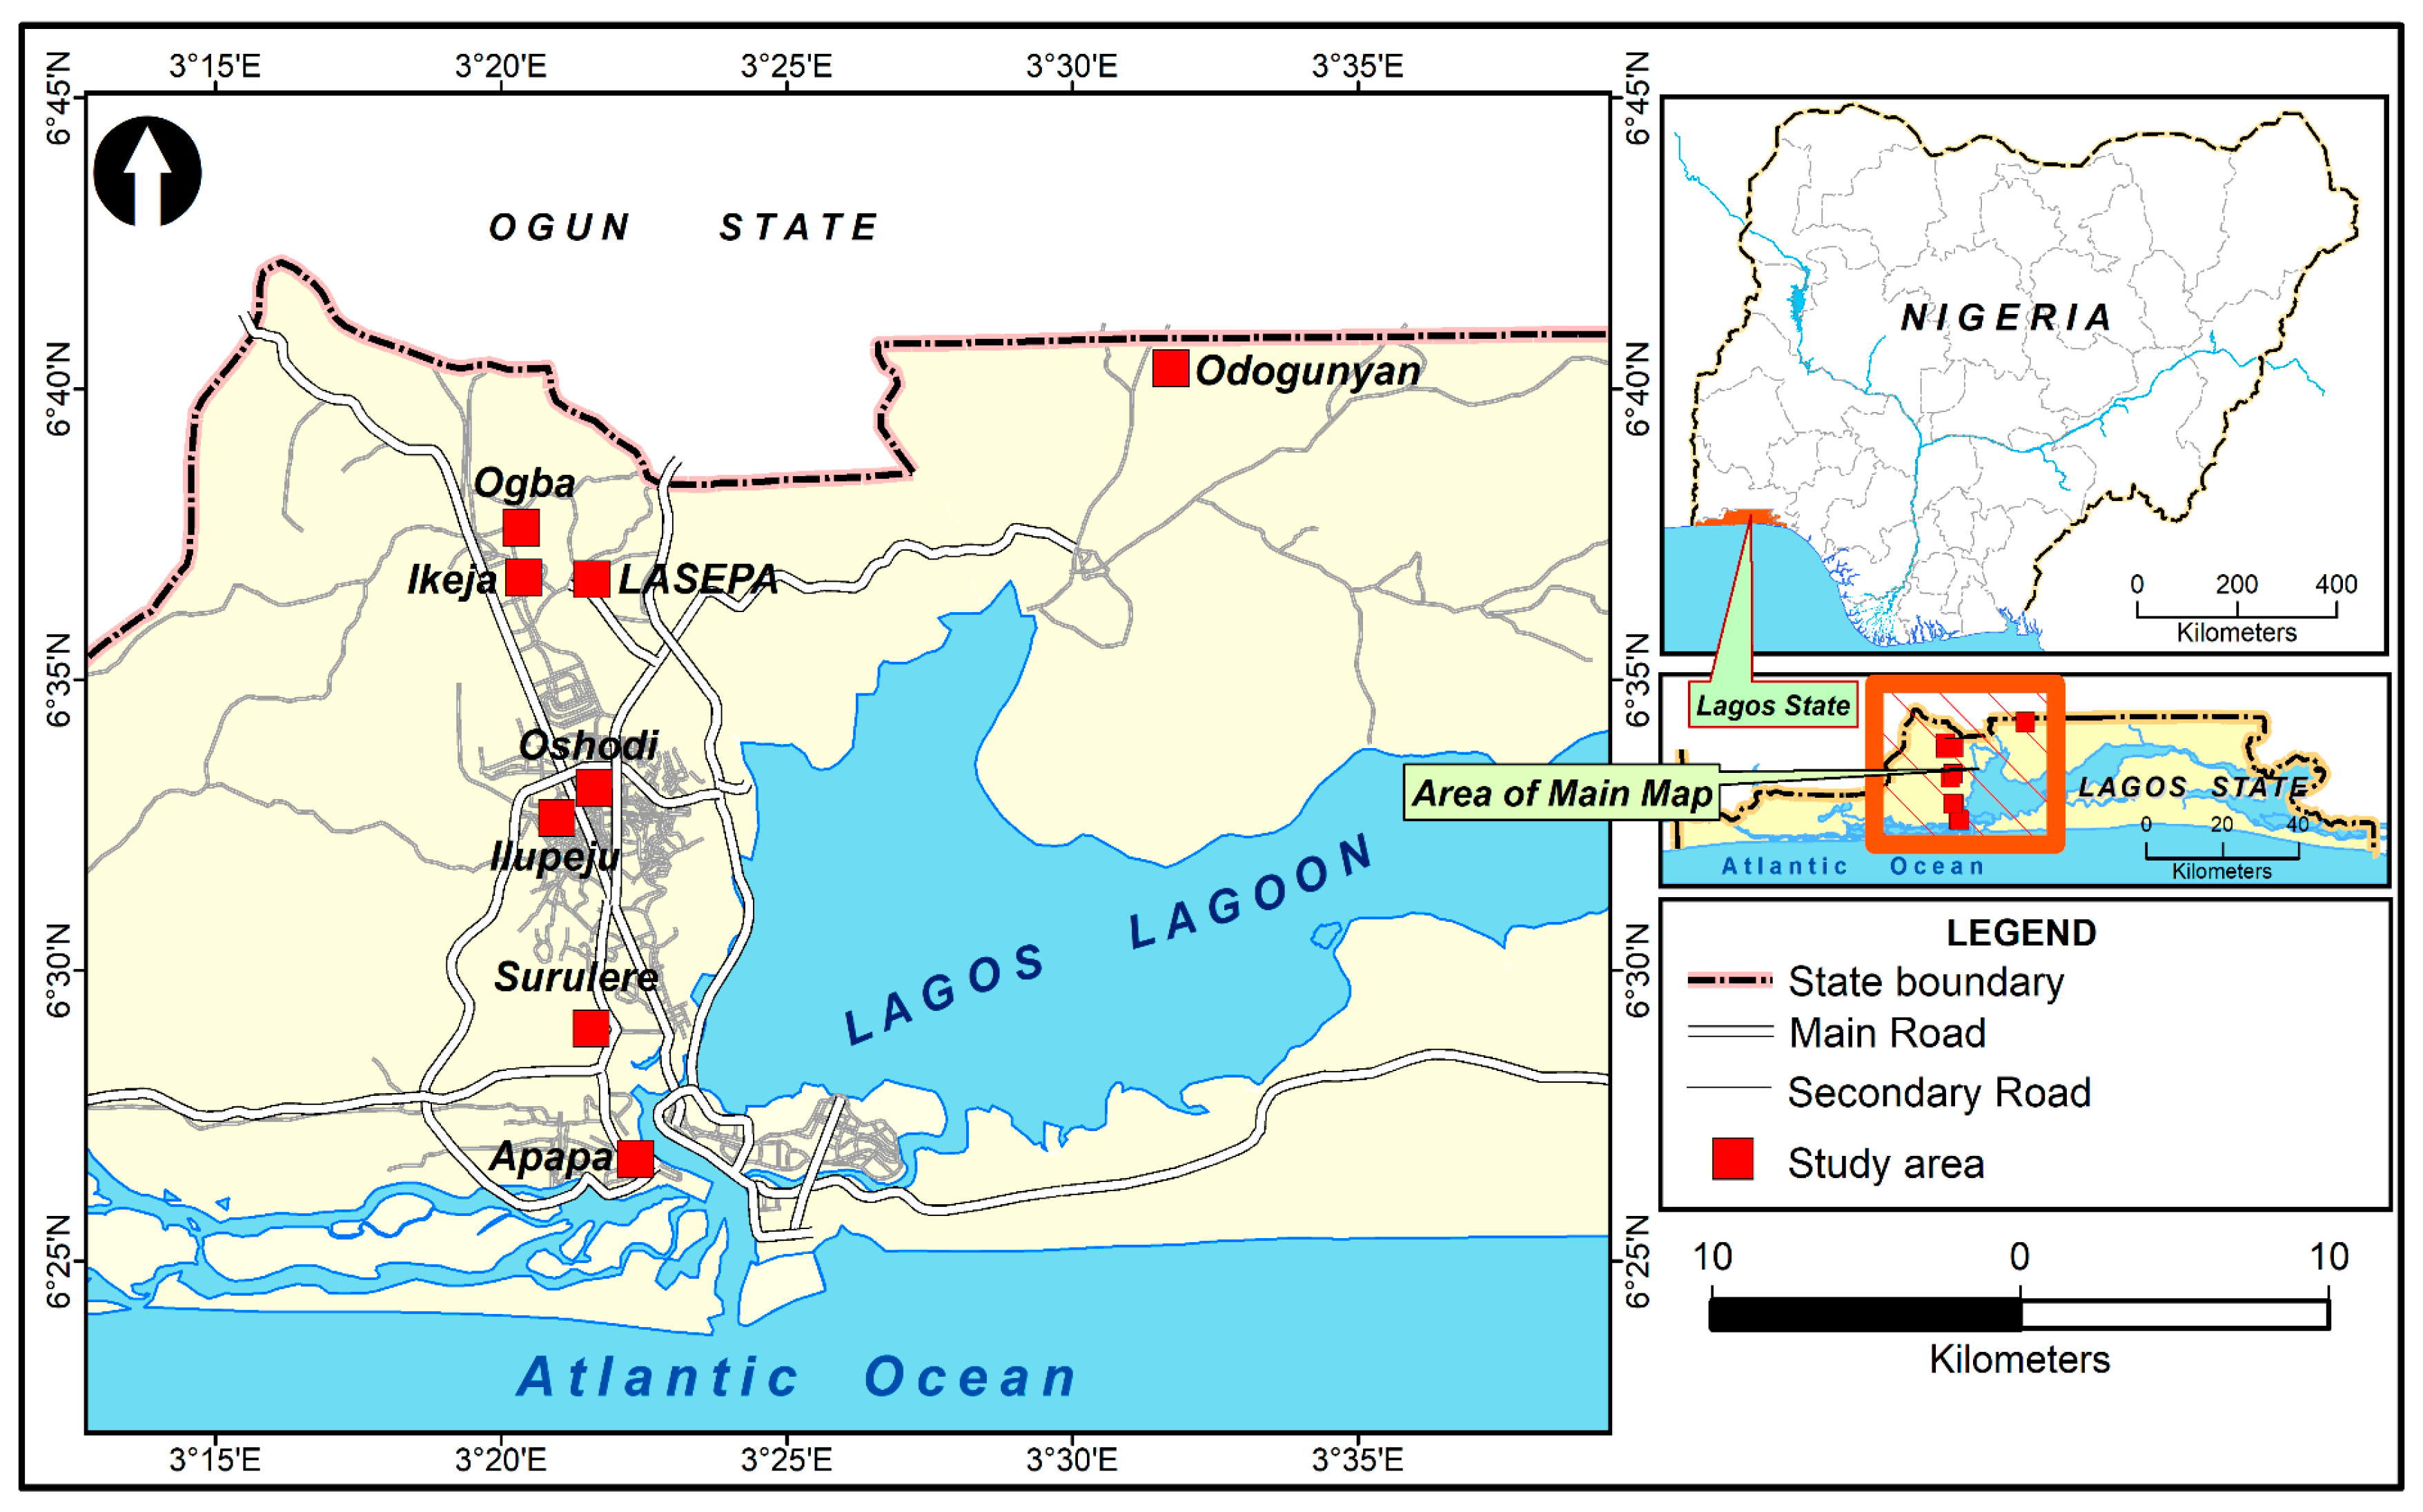
Reconnaissance was carried out on all 15 industrial estates situated in twelve local government areas of Lagos state in August 2019 to ascertain the number of active industrial estates, the nature of industrial activities and the delineation of sampling points. Ranking and regrouping of the industrial estates was done based on the scale of industrial activities. Government hospitals were identified during the survey for the collection of available respiratory hospital visitation records for morbidities from 2016 to 2021. Primary data collected are monthly air quality levels of sulfur (iv) oxide (SO2), nitrogen (iv) oxide (NO2), carbon (ii) oxide (CO), and fine particulate matter (PM2.5) for a period of 12 months (February 2020 to May 2021) obtained through field recording using an air metric embedded with a Teflon filter for fine particulate matter (PM2.5), a vrae multi-detector for nitrogen (iv) oxide (NO2) and sulfur(iv)oxide (SO2), and a tecto 315-2 carbon(ii)oxide detector with (serial no-02343074/204) for carbon(ii)oxide. The secondary data is monthly records of respiratory conditions obtained from the medical statistics unit of Lagos State University Teaching Hospital (LASUTH) and General hospitals in Isolo, Apapa, Ikorodu and Randle from 2016 to 2021 across the study area
3. Results and Discussion
3.1. Variation in Ambient Monthly Gaseous and Particulate Pollutant Levels
Data analysis revealed varying monthly levels of both gaseous and fine particulate matter concentration across the industrial estates with minimal concentration at the control site. Fine particulate matter (Figure 2) ranged between 3.61µgm-3 to 169.23µgm-3, while gaseous carbon(ii)oxide (Figure 3) ranged between 0.33ppm to 21.37ppm, nitrogen(iv)oxide (Figure 4) ranged between 0.5ppm to 7.27ppm and sulfur(iv)oxide (Figure 5) ranged between 0.80ppm to 4.41 across the industrial estates and the control site over the 12 months of monitoring.
One-way analysis of variance (Table 2) was used to analyze the monthly variation in the ambient pollutant levels over the 12 months of the study. The unit of analysis is the months over which the pollutant levels were recorded. SO2 was significant across the study area and period of study at ρ < 0.05; F (11, 108) = 5.103, ρ = 0.000. The mean square (ŋ2) value of 0.853 indicates an SO2 variation of 85.3% across the study area. Hence, there is a significant variation in SO2 levels across the study area and period of study. NO2 was significant across the study area and period of study at ρ < 0.05; F (11, 108) = 8.805, ρ = 0.000. The mean square (ŋ2) value of 1.142 indicates a NO2 variation of 14.2% across the study area. Hence, there is a significant variation in NO2 levels across the study area and period of study. CO was insignificant across the study area and period of study at ρ > 0.05; F (11, 108) = 1.320, ρ = 0.223. The mean square (ŋ2) value of 23.502 indicates a CO similarity of 50.2% across the study area. Hence, there is no significant variation in CO levels across the study area and period of study. PM2.5 was significant across the study area and period of study at ρ < 0.05; F (11, 108) = 3.897, ρ = 0.000. The mean square (ŋ2) value of 1047.117 indicates a PM2.5 variation of 11.7% across the study area. Hence, there is a significant variation in PM 2.5 levels across the study area and period of study.
3.2. Spatial and Seasonal Variation in Gaseous and PM2.5 Levels
Data analysis revealed varying levels of average gaseous and particulate pollutant concentration across the industrial estates and the control site during the wet and dry seasons. Both gaseous and particulate pollutant concentrations were higher during the dry season than the wet season due to decreased washout from precipitation. The average fine particulate matter level was between 7.94µgm-3 to 32.4µgm-3 (Figure 6), CO was between 1.62ppm to 12.57ppm (Figure 8), NO2 was between 2ppm to 4.33ppm (Figure 10) and SO2 was between 0.79ppm to 2.83ppm (Figure 12) during the wet season. During the dry season, fine particulate matter concentration was between 24.55µgm-3 to 137.14µgm-3 (Figure 7), CO was between 4.61 to 18.39ppm (Figure 9), NO2 was between 2.92ppm to 6.38ppm (Figure 11) and SO2 was between 1.39 to 4.23ppm (Figure 13).
Figure 6.
Spatial variation in fine particulate matter (PM2.5) levels in the wet season across selected industrial locations in Lagos state. Source: Field Survey (2021).
Figure 6.
Spatial variation in fine particulate matter (PM2.5) levels in the wet season across selected industrial locations in Lagos state. Source: Field Survey (2021).
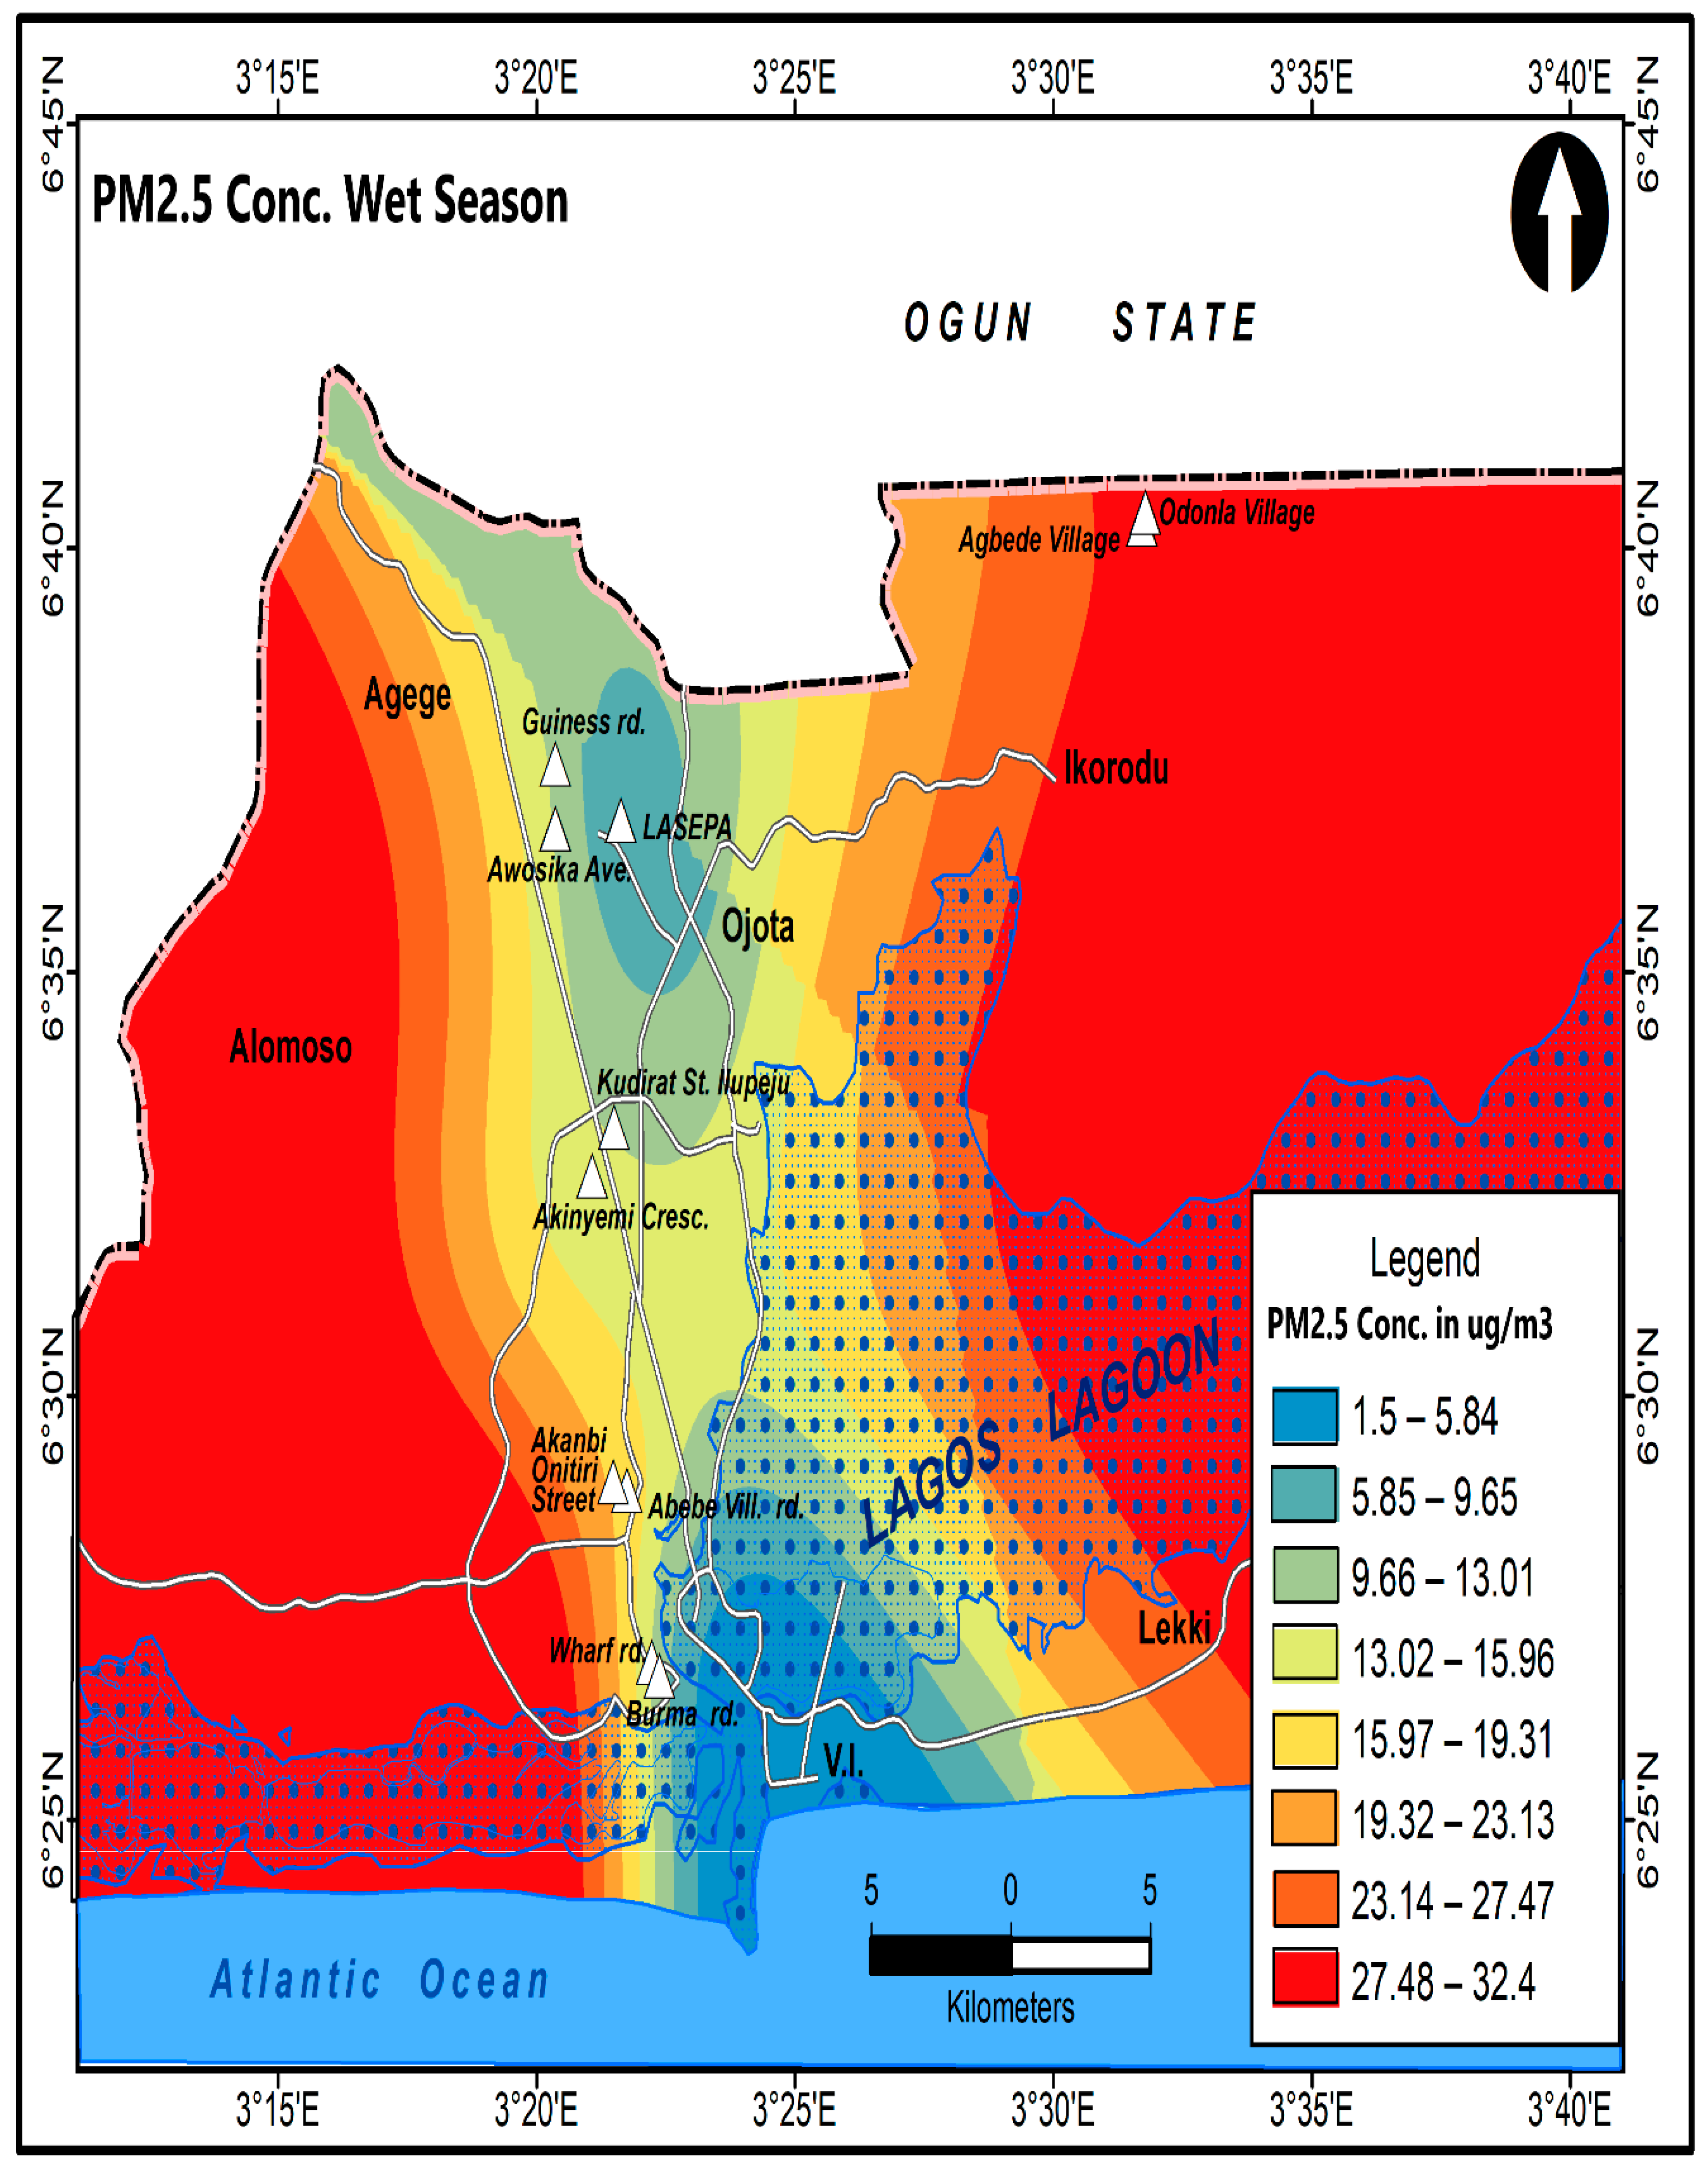
Figure 7.
Spatial variation in fine particulate matter (PM2.5) levels in the dry season across selected industrial locations in Lagos state. Source: Field Survey (2021).
Figure 7.
Spatial variation in fine particulate matter (PM2.5) levels in the dry season across selected industrial locations in Lagos state. Source: Field Survey (2021).
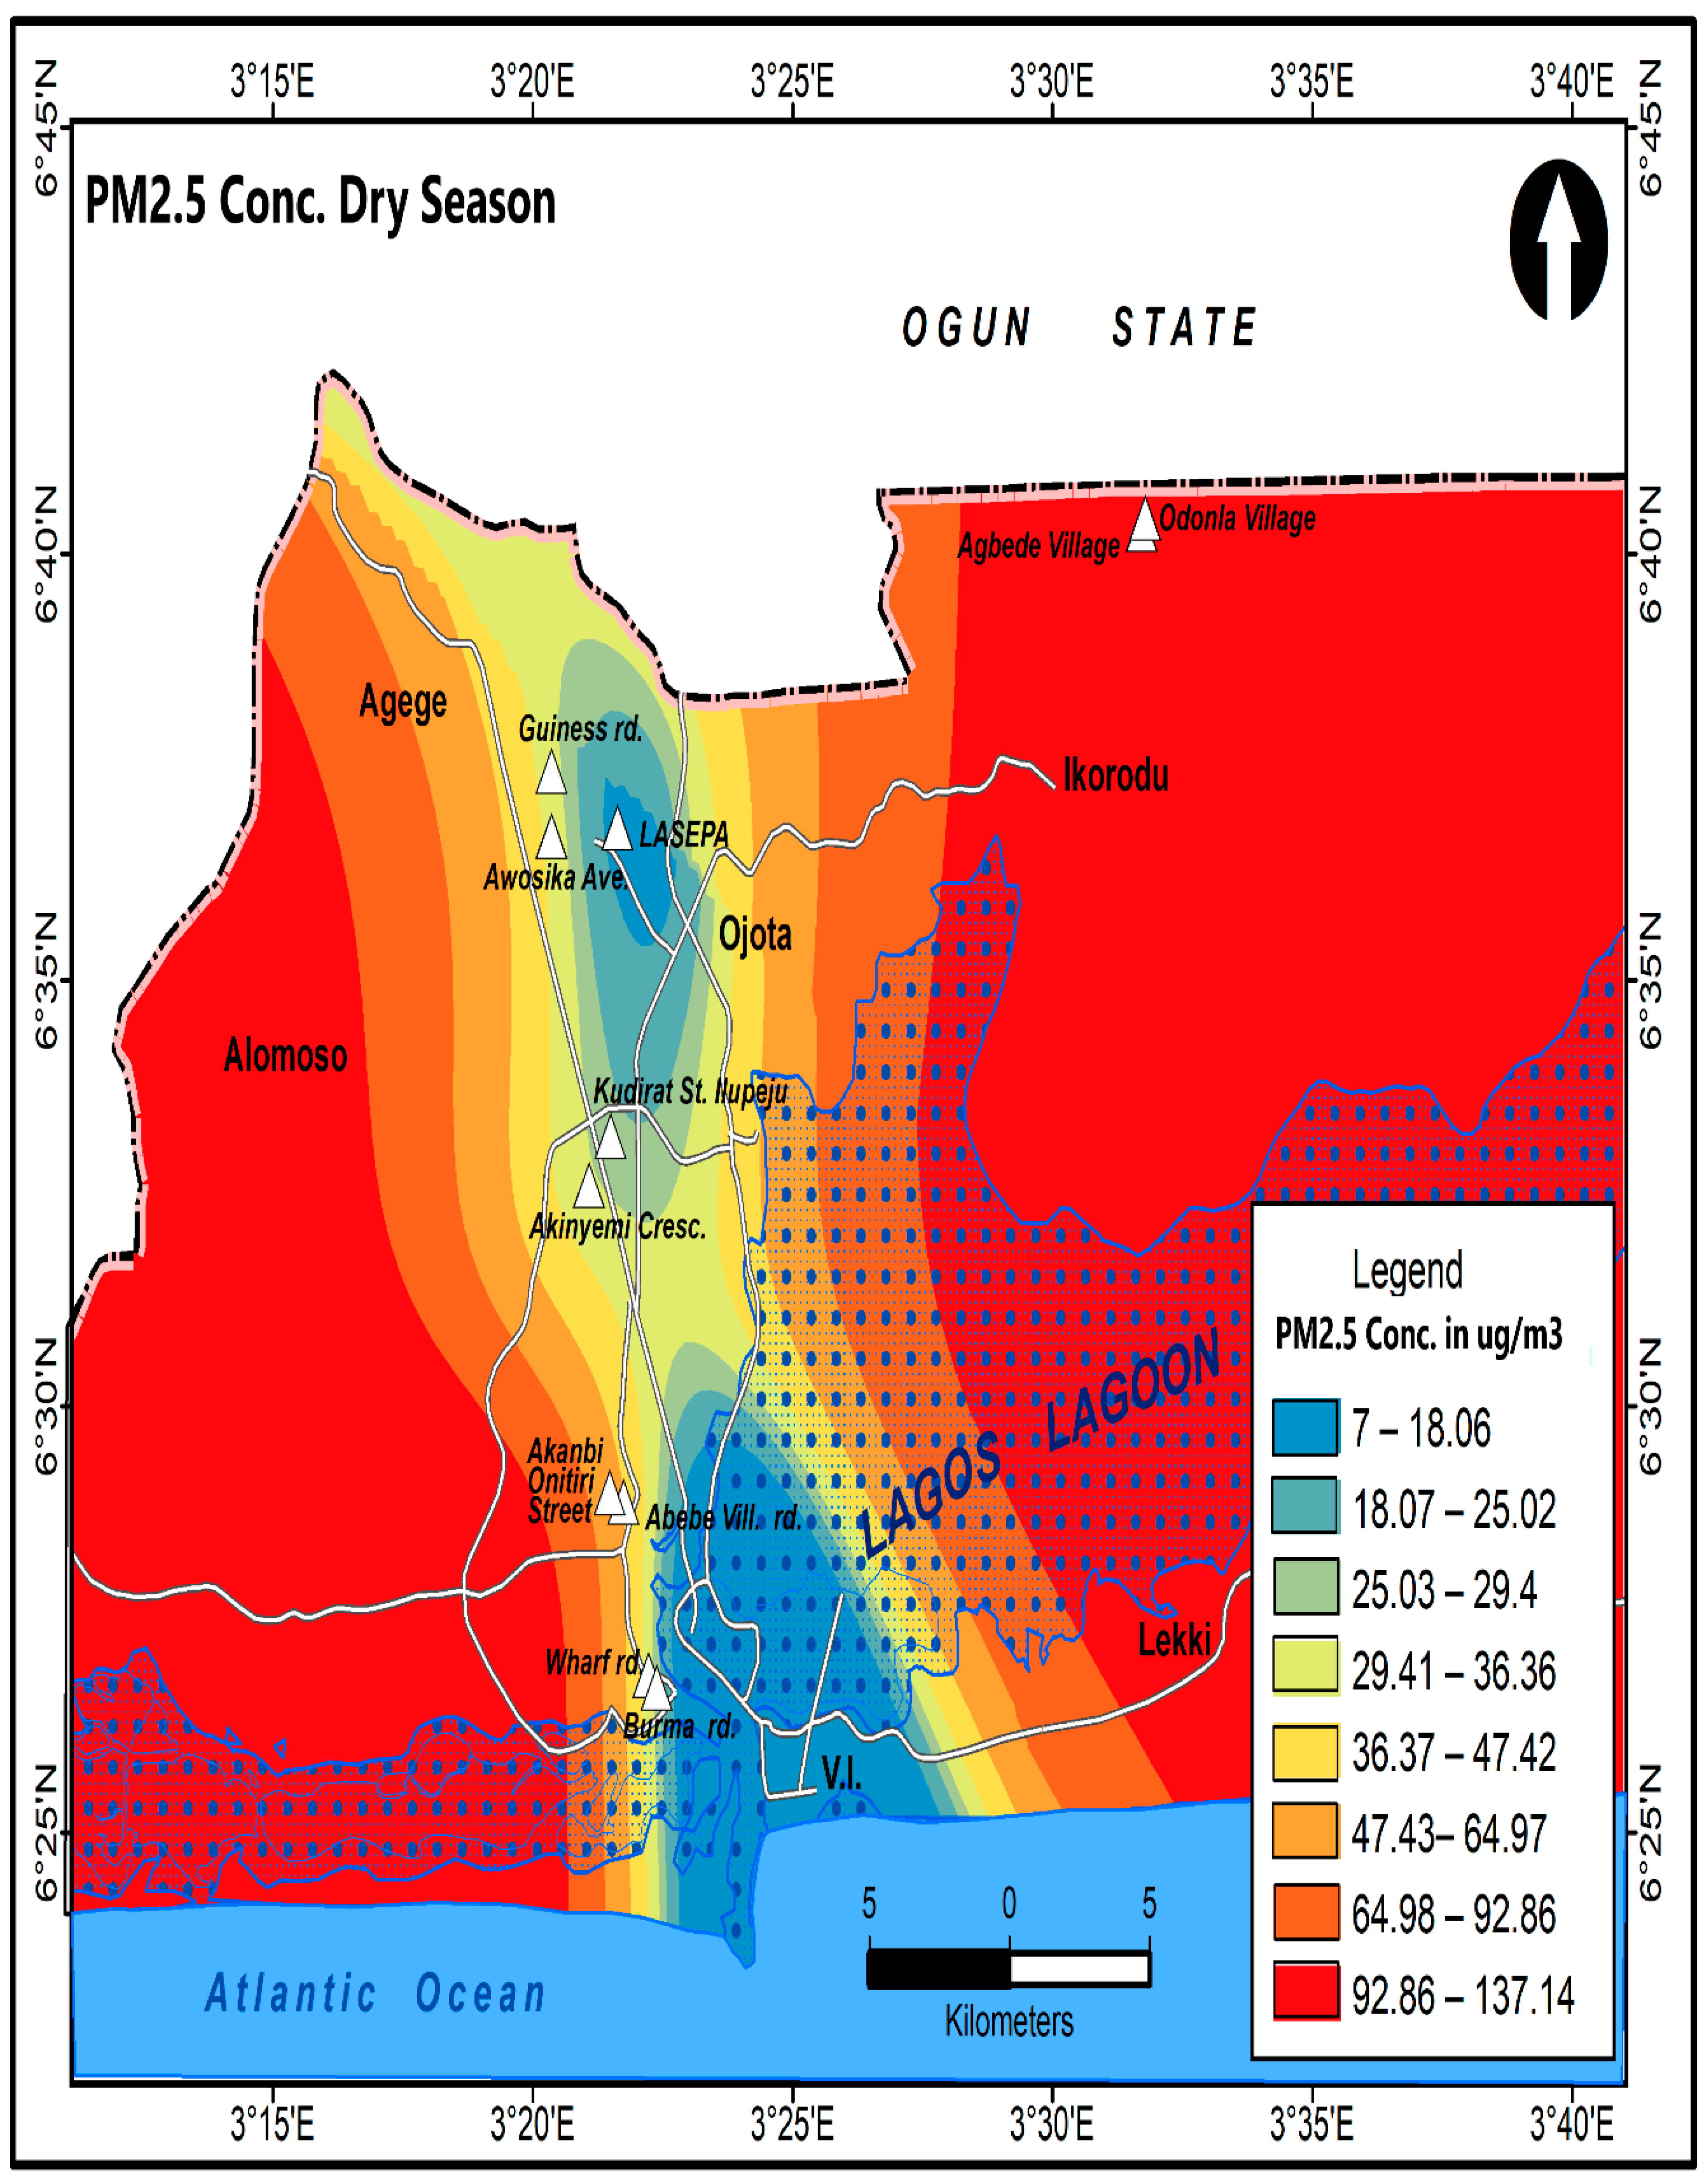
Figure 8.
Spatial variation in carbon(ii)oxide (CO) levels in the wet season across selected industrial locations in Lagos state. Source: Field Survey (2021) .
Figure 8.
Spatial variation in carbon(ii)oxide (CO) levels in the wet season across selected industrial locations in Lagos state. Source: Field Survey (2021) .
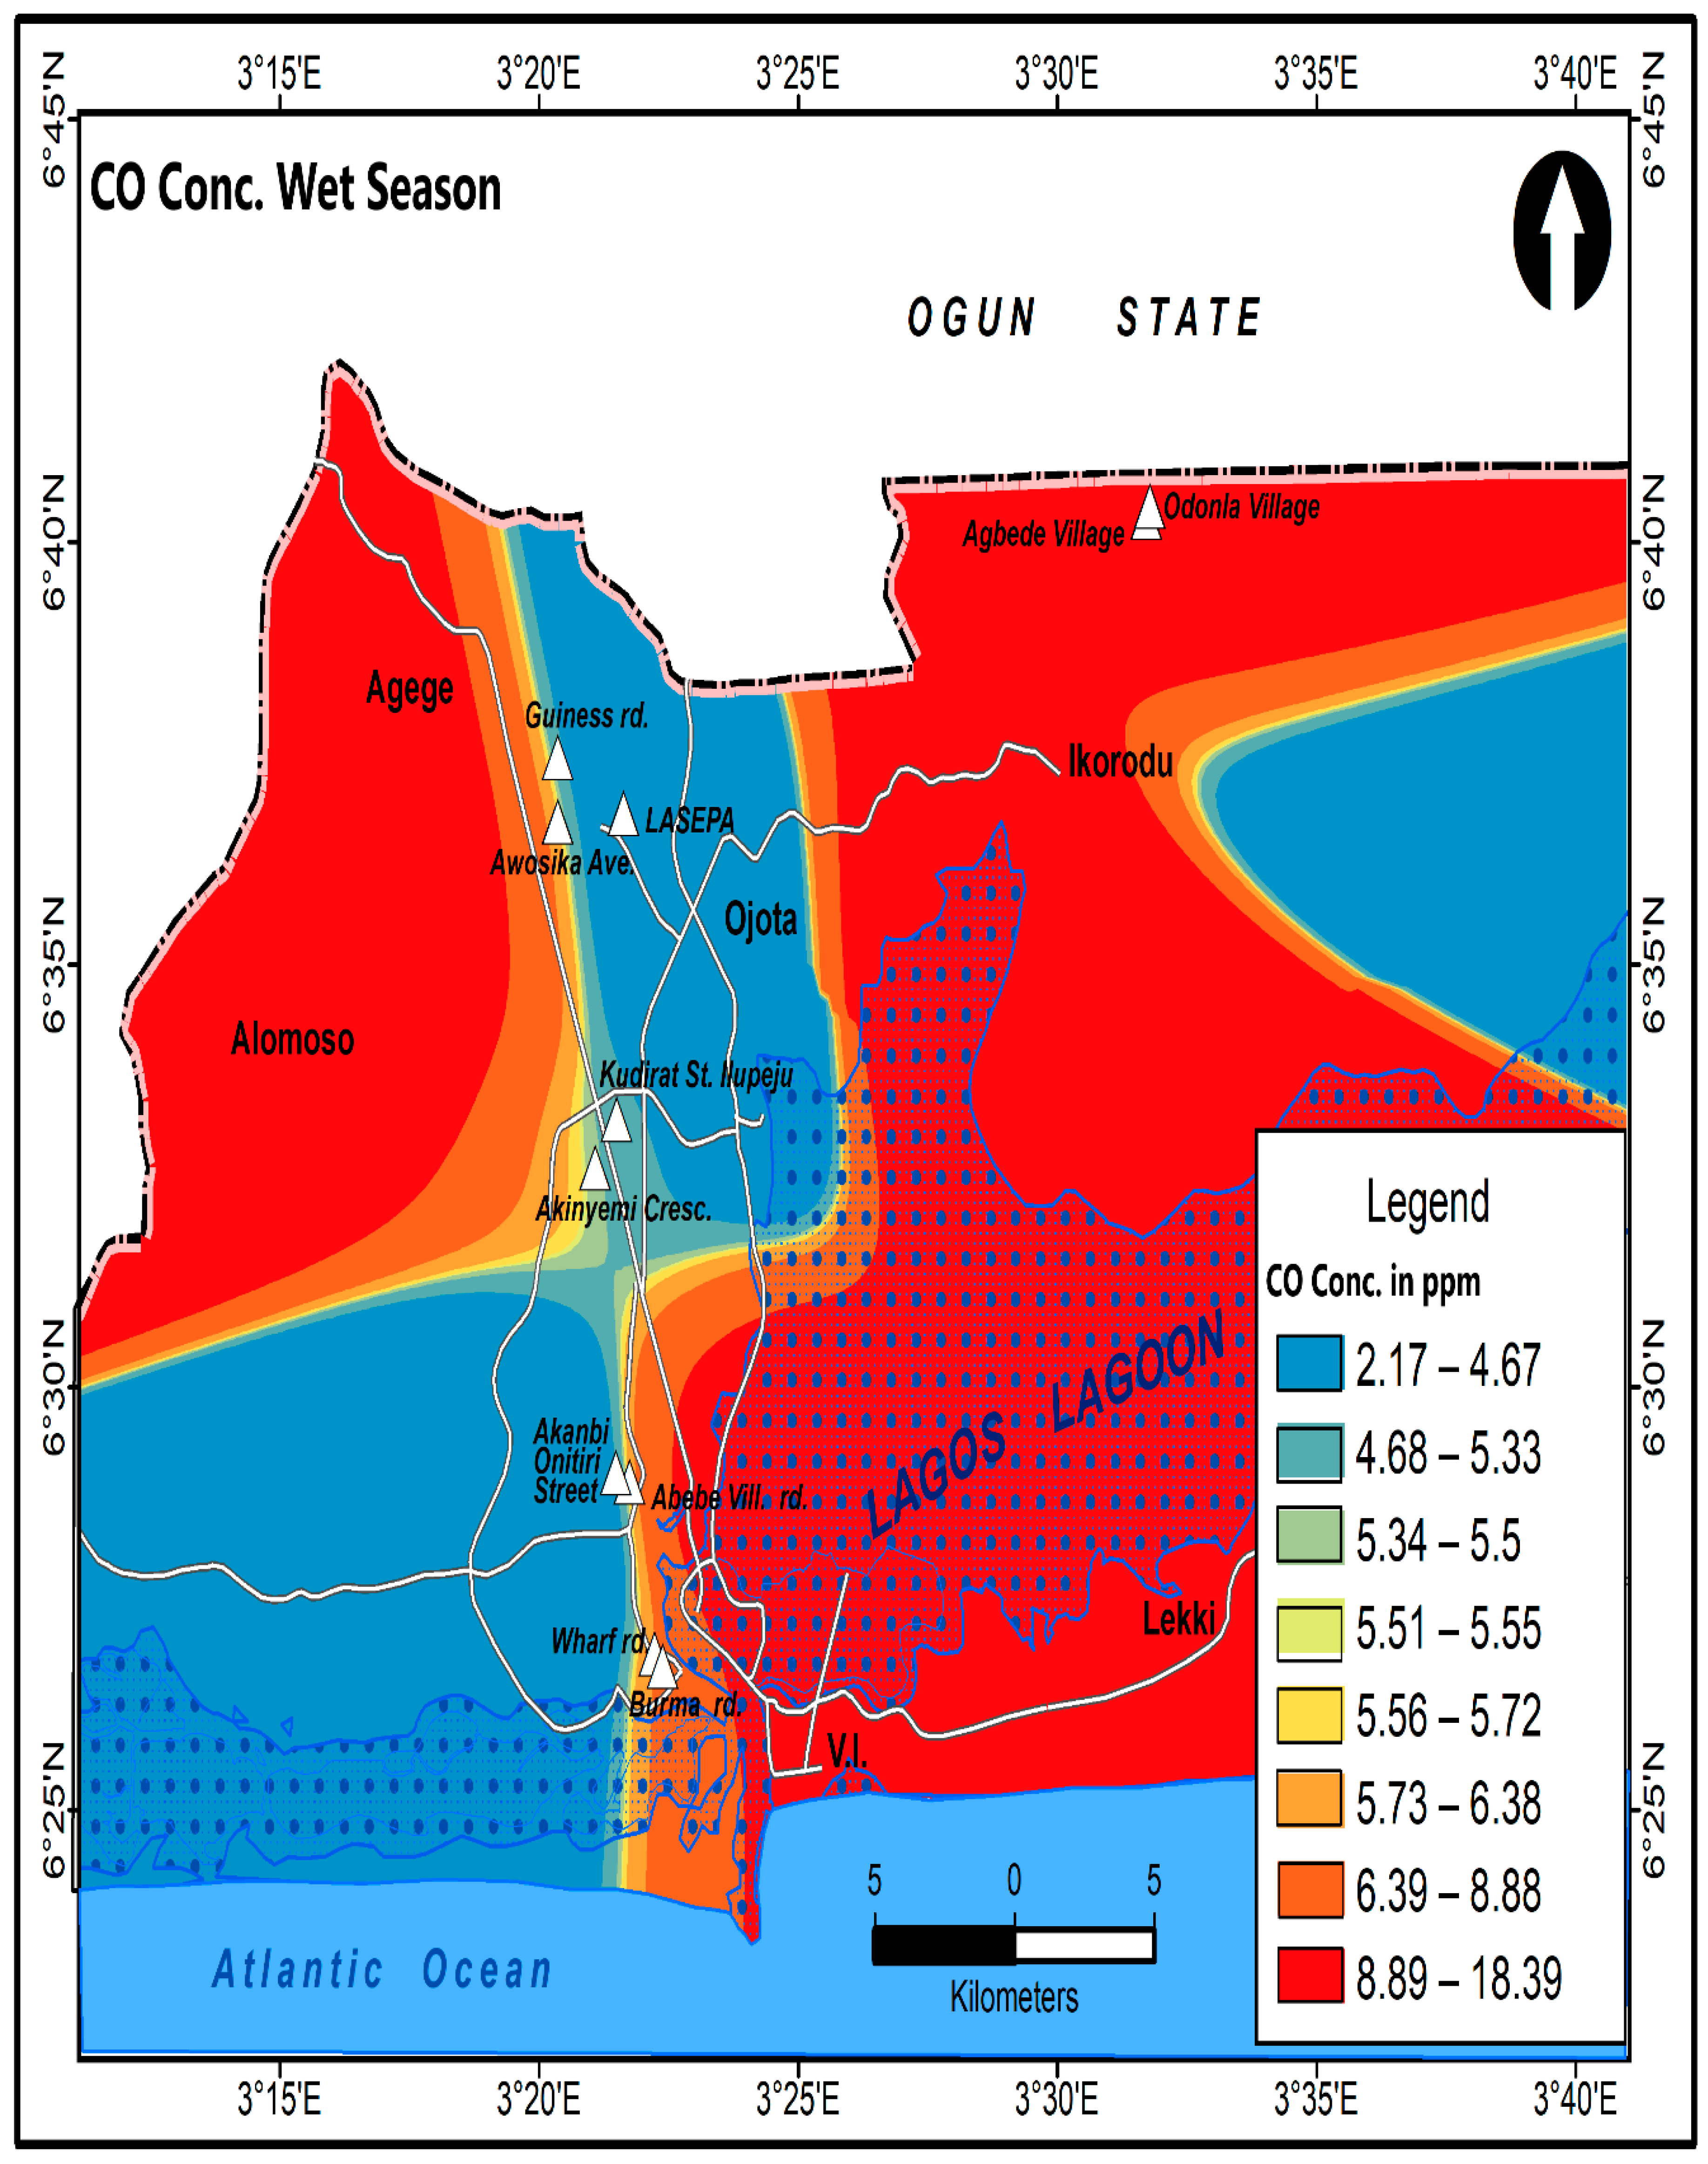
Figure 9.
Spatial variation in carbon(ii)oxide (CO) levels in the dry season across selected industrial locations in Lagos state. Source: Field Survey (2021).
Figure 9.
Spatial variation in carbon(ii)oxide (CO) levels in the dry season across selected industrial locations in Lagos state. Source: Field Survey (2021).
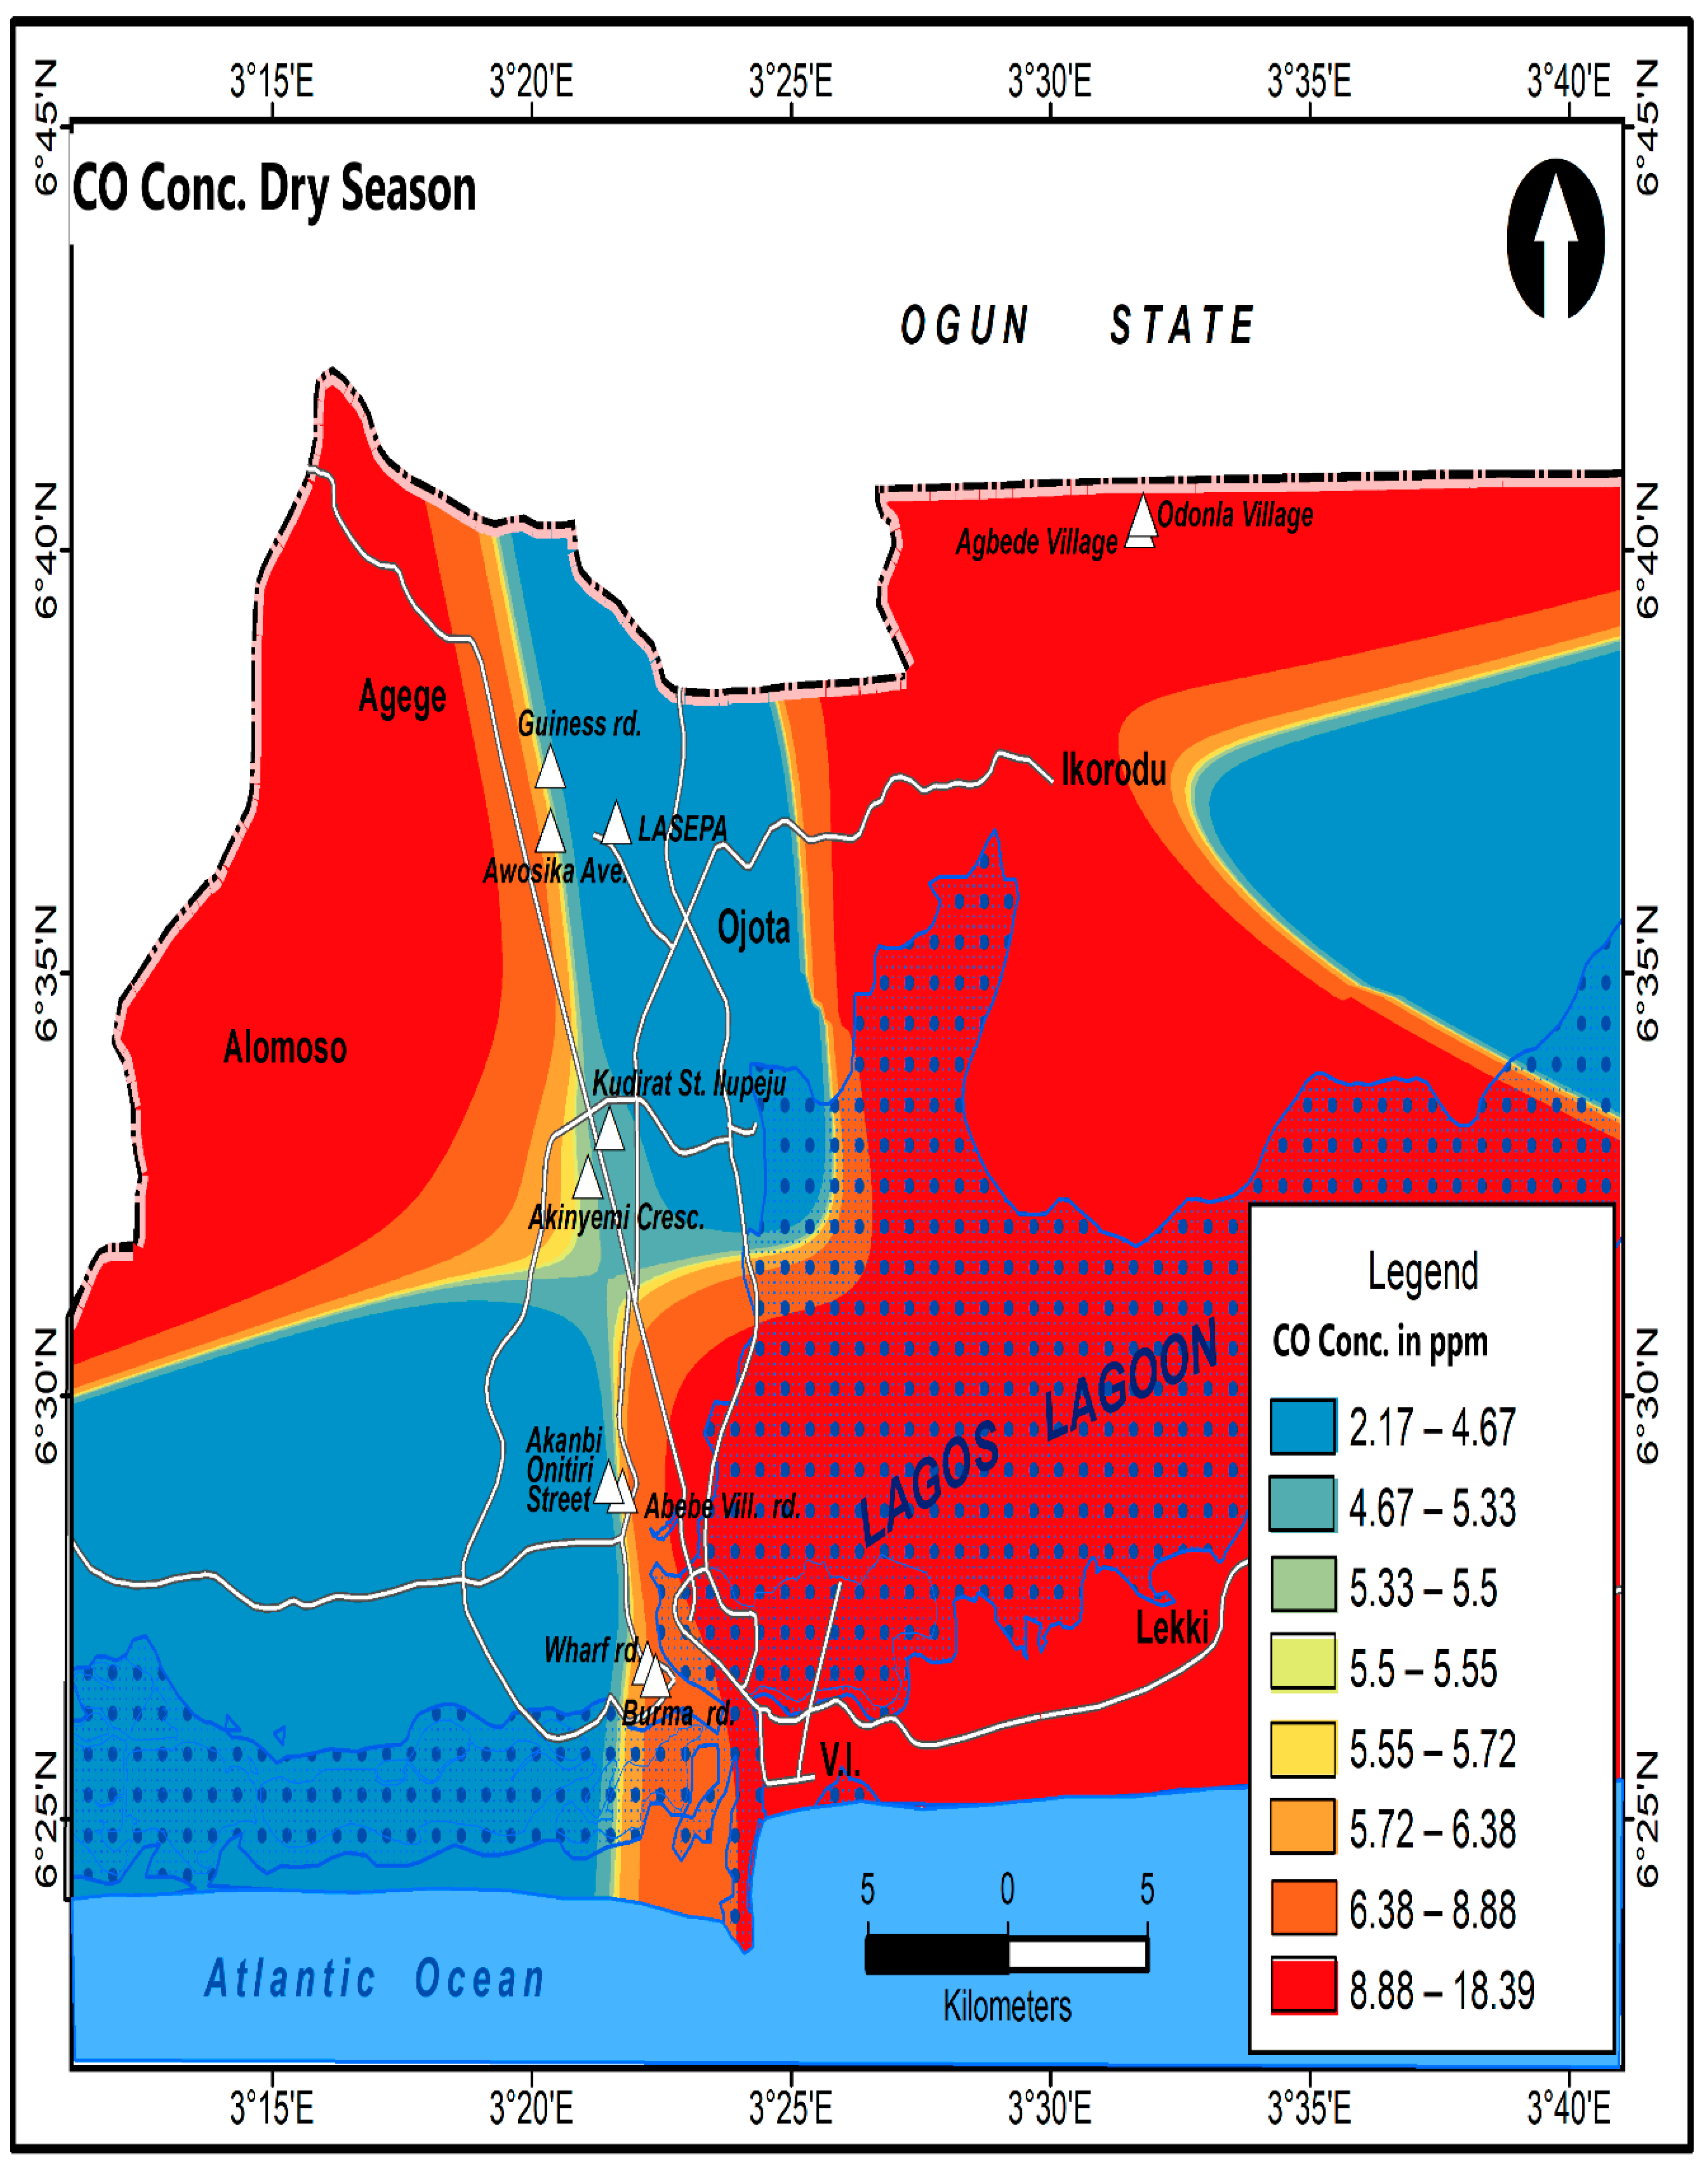
Figure 10.
Spatial variation in nitrogen(iv)oxide (NO2) levels in the wet season across selected industrial locations in Lagos state . Source: Field Survey (2021).
Figure 10.
Spatial variation in nitrogen(iv)oxide (NO2) levels in the wet season across selected industrial locations in Lagos state . Source: Field Survey (2021).
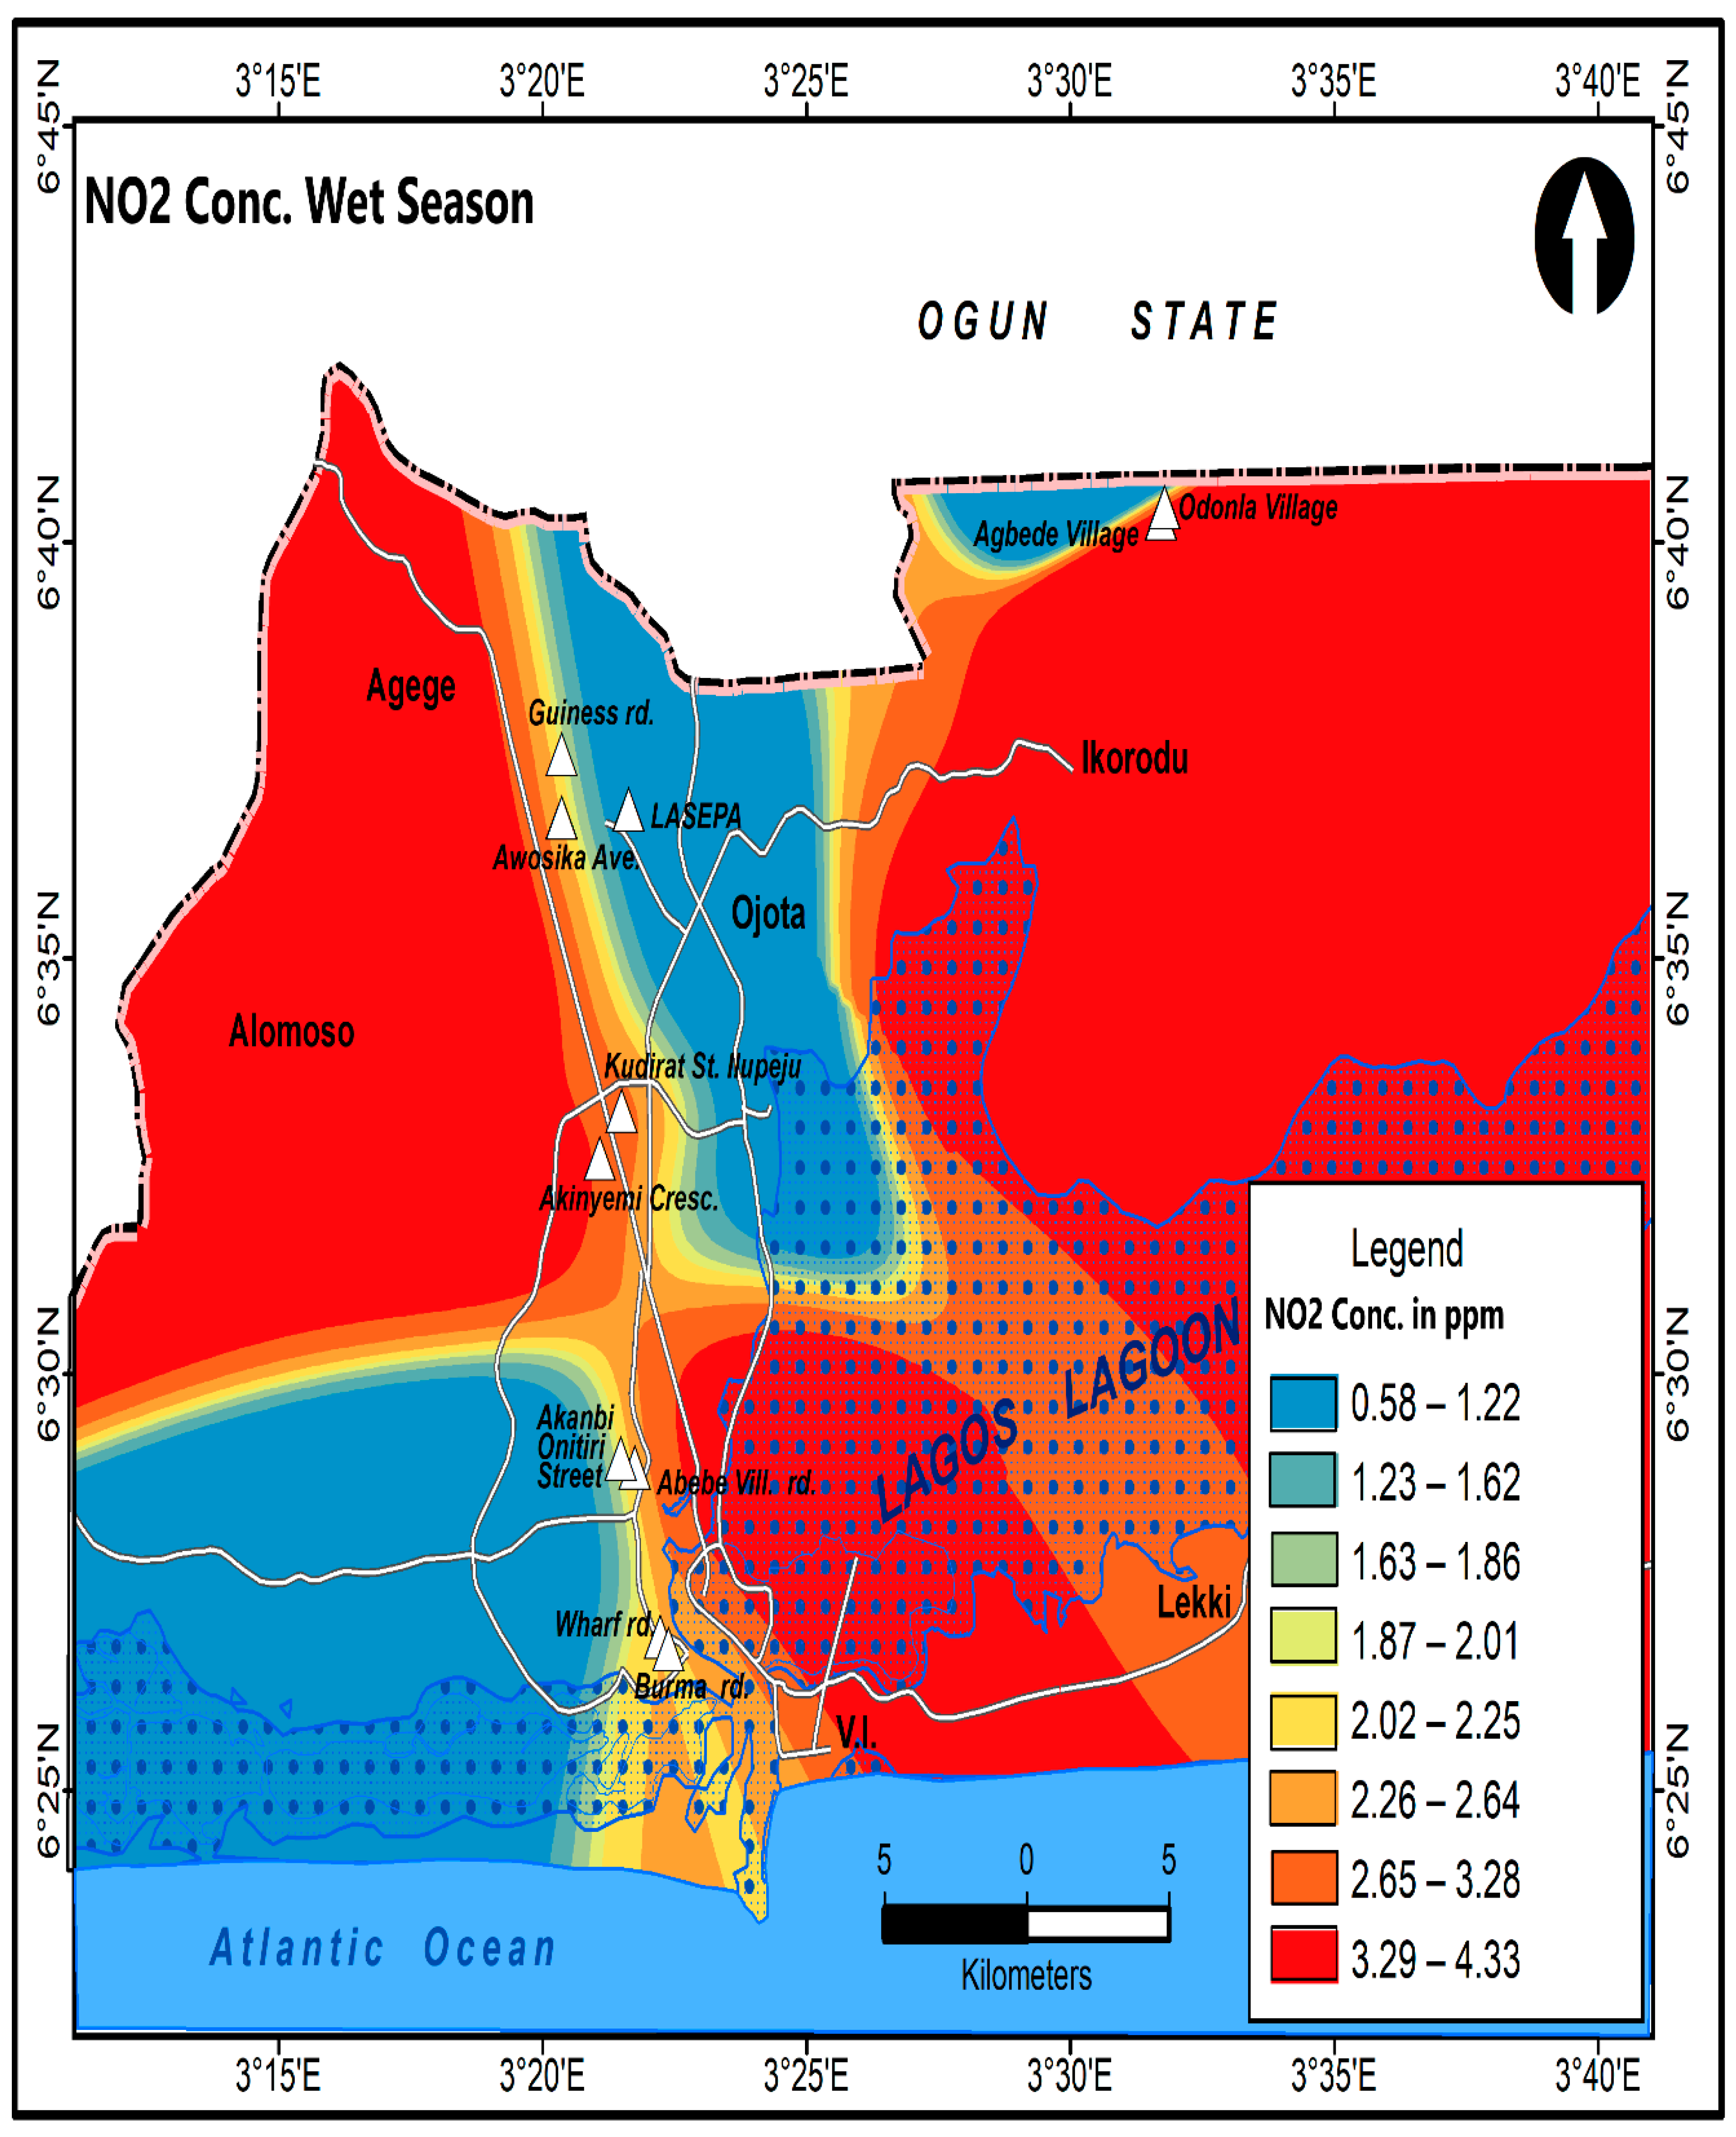
Figure 11.
Spatial variation in nitrogen(iv)oxide (NO2) levels in the dry season across selected industrial locations in Lagos state. Source: Field Survey (2021).
Figure 11.
Spatial variation in nitrogen(iv)oxide (NO2) levels in the dry season across selected industrial locations in Lagos state. Source: Field Survey (2021).
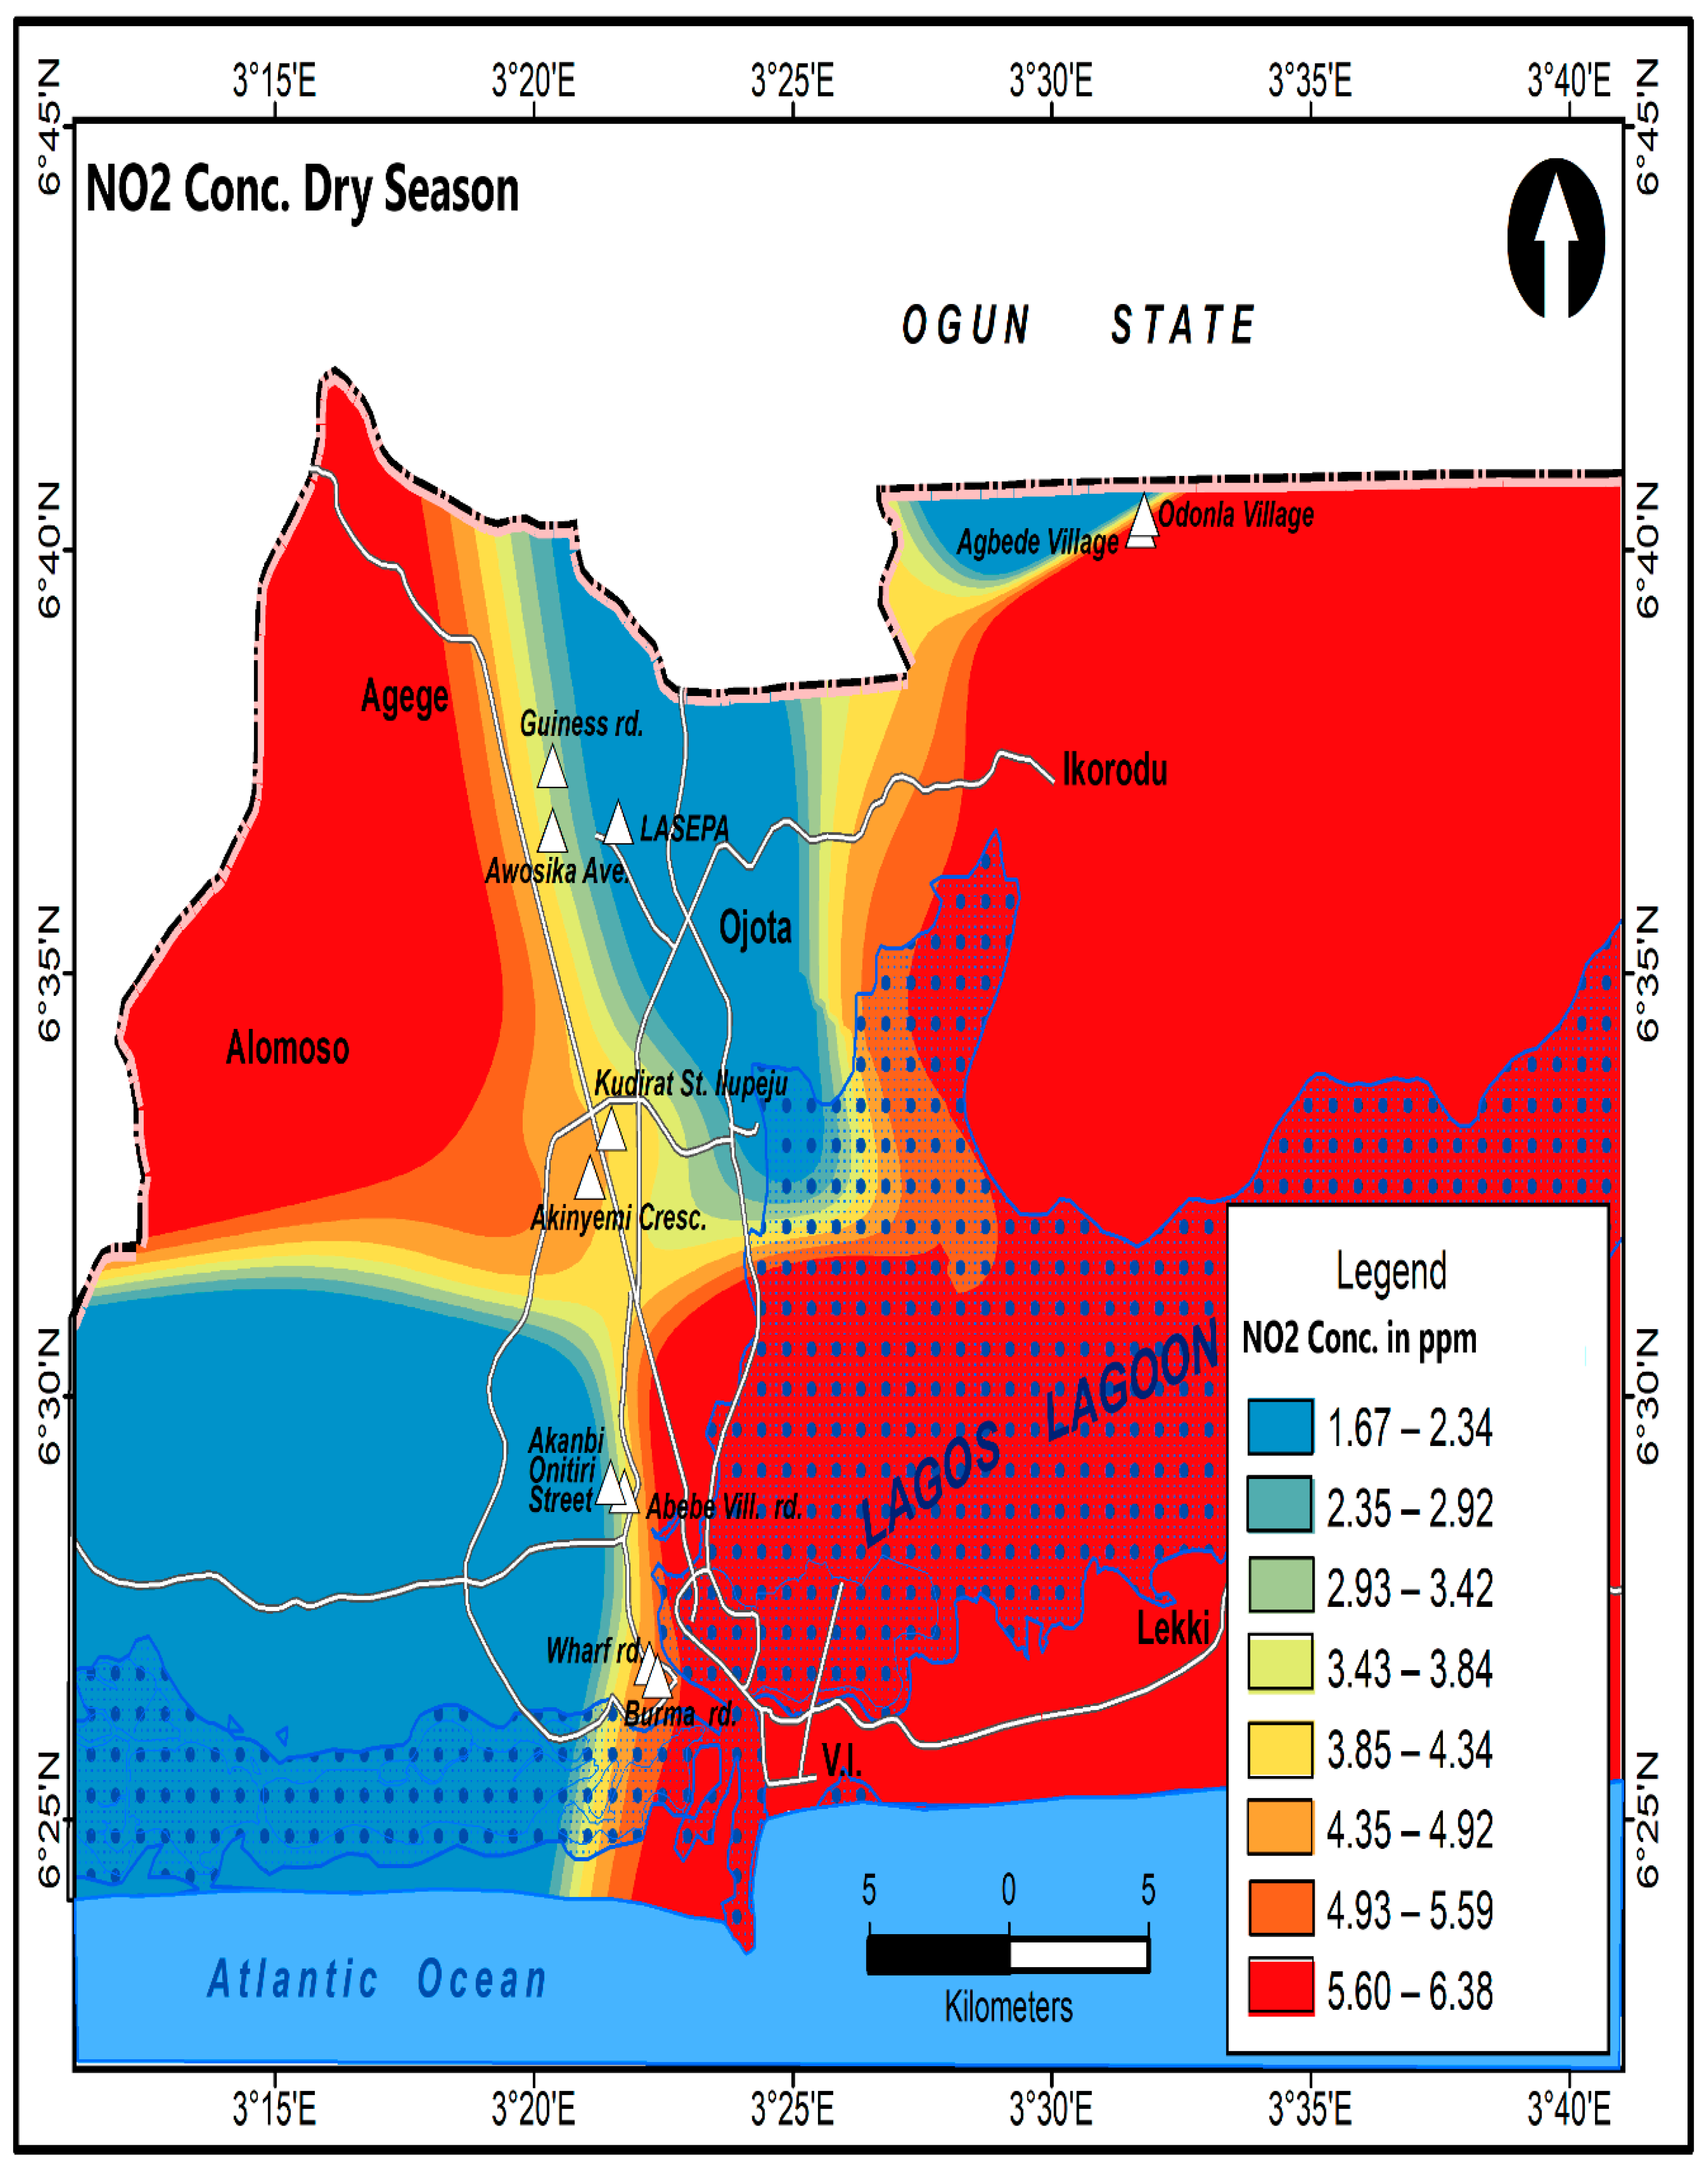
Figure 12.
Spatial variation in sulfur(iv)oxide (SO2) levels in the wet season across selected industrial locations in Lagos state. Source: Field Survey (2021) .
Figure 12.
Spatial variation in sulfur(iv)oxide (SO2) levels in the wet season across selected industrial locations in Lagos state. Source: Field Survey (2021) .
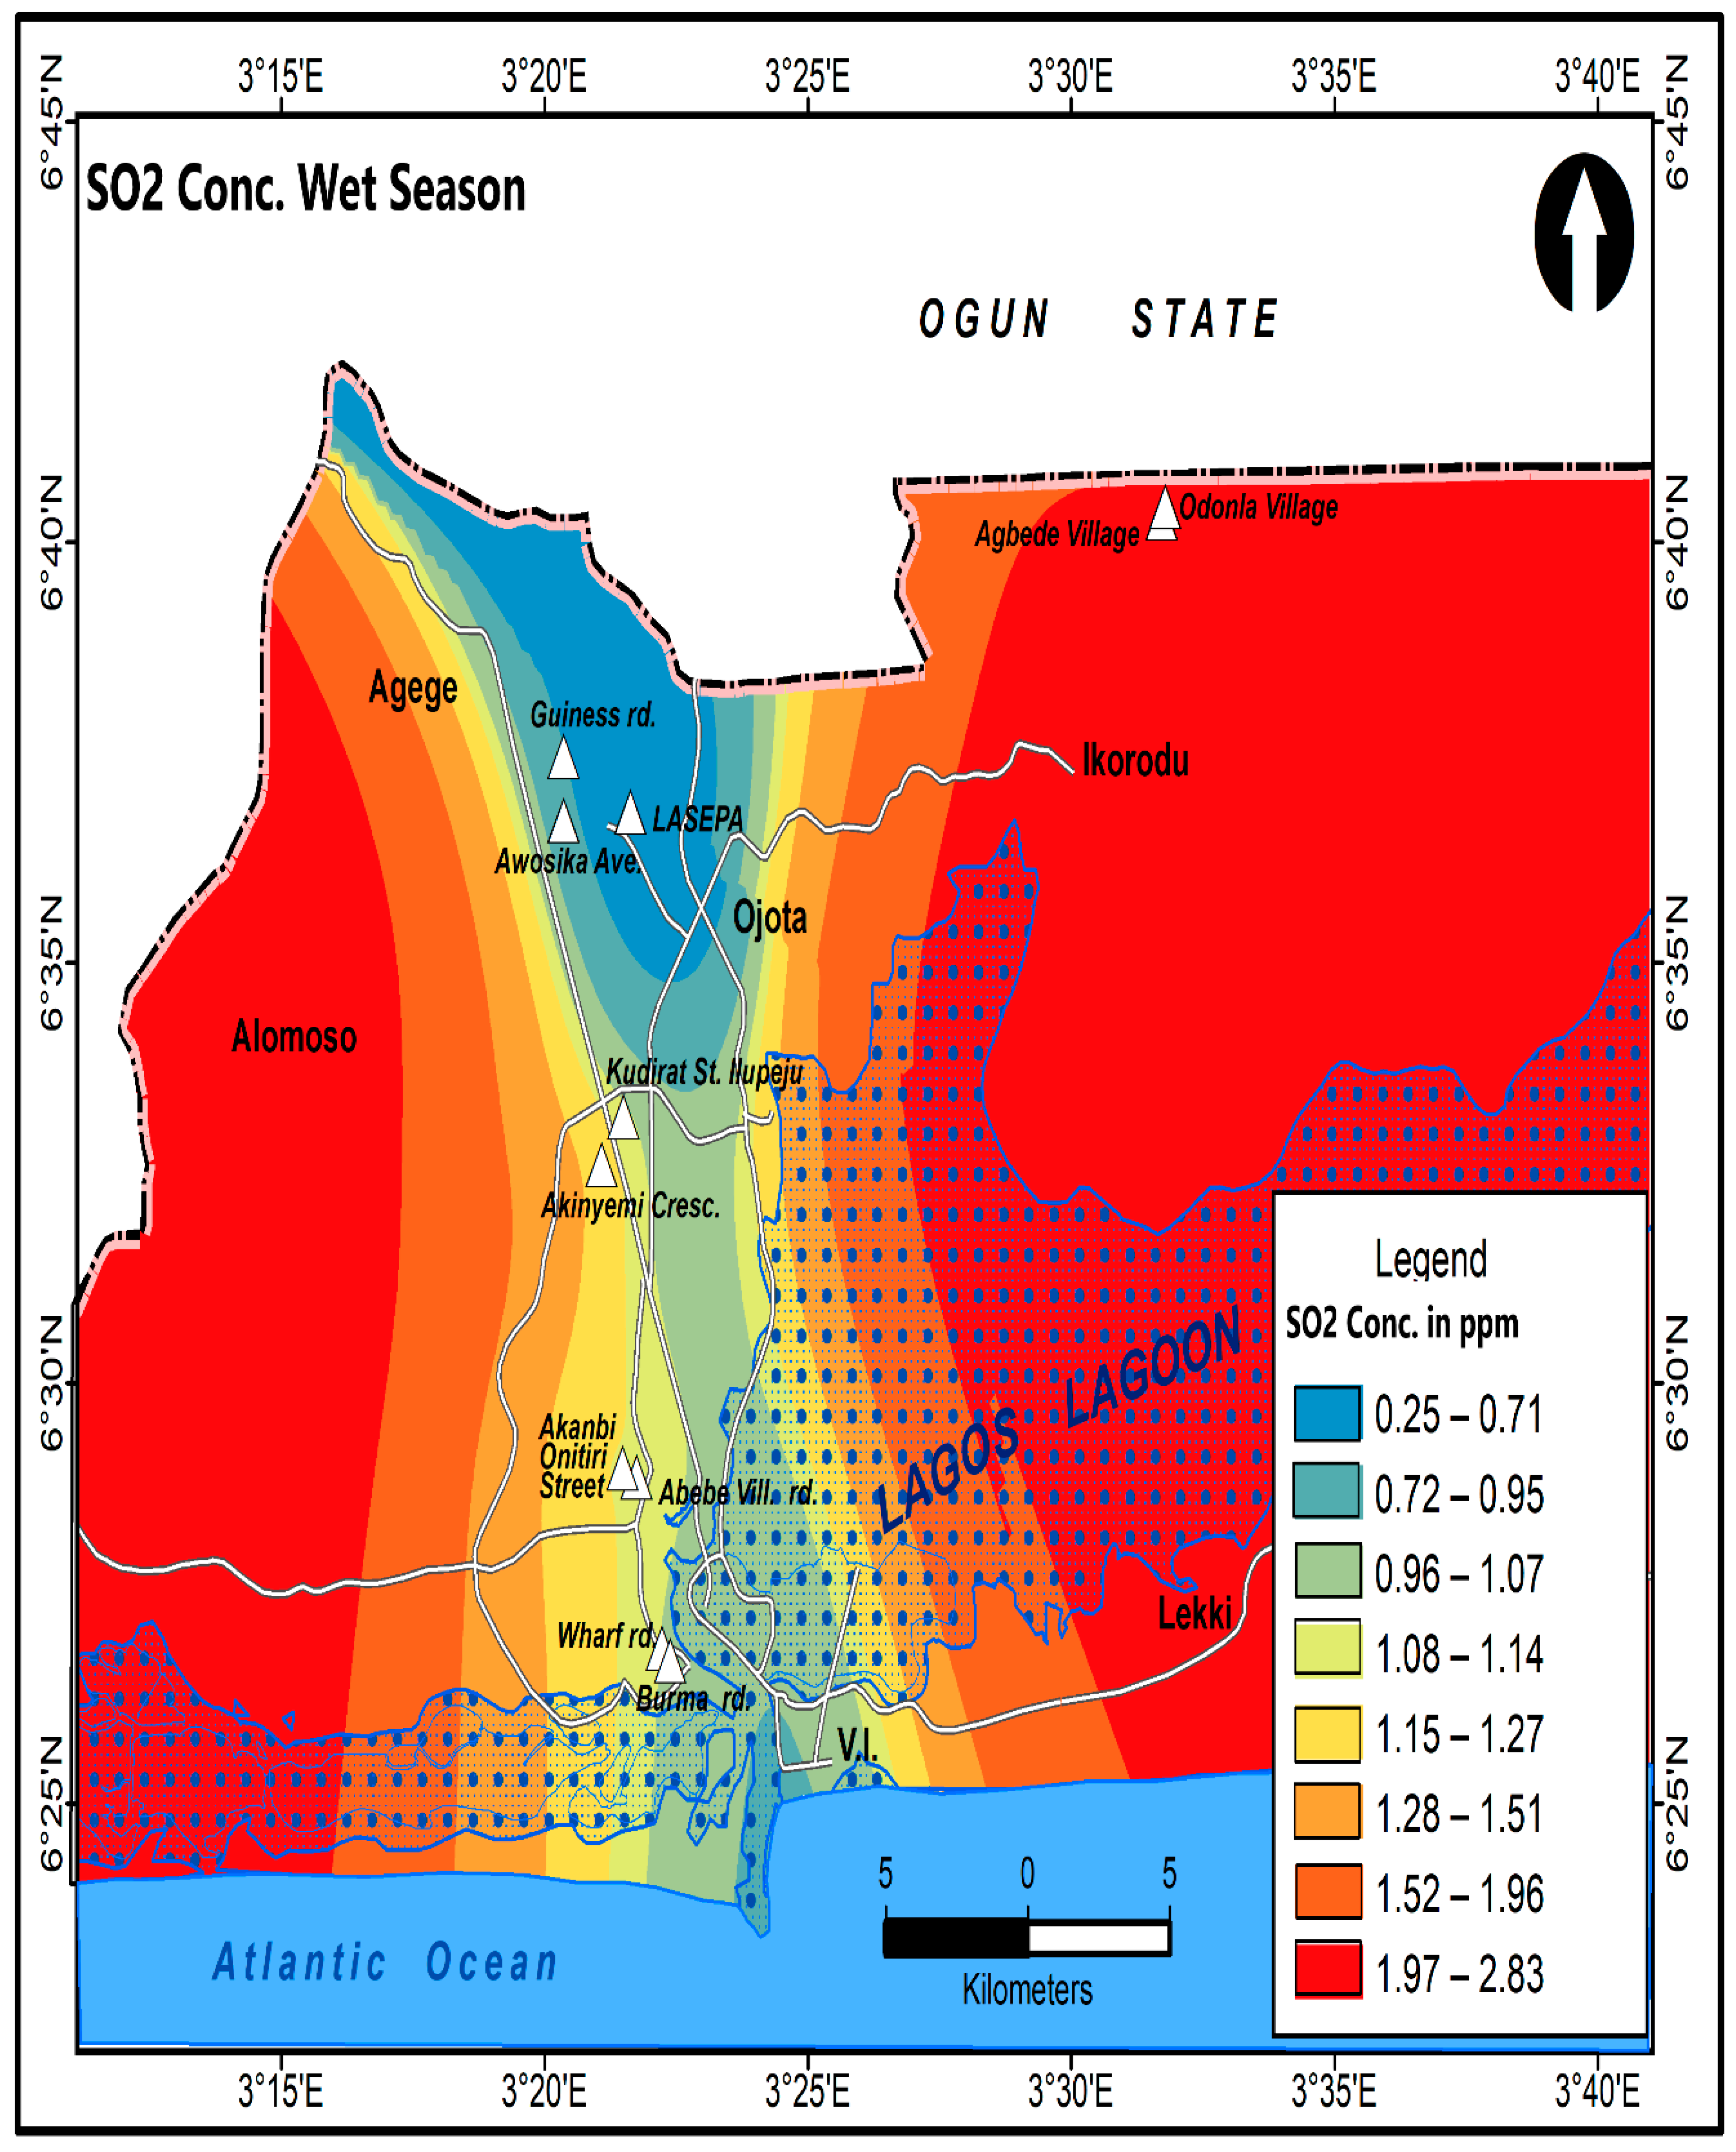
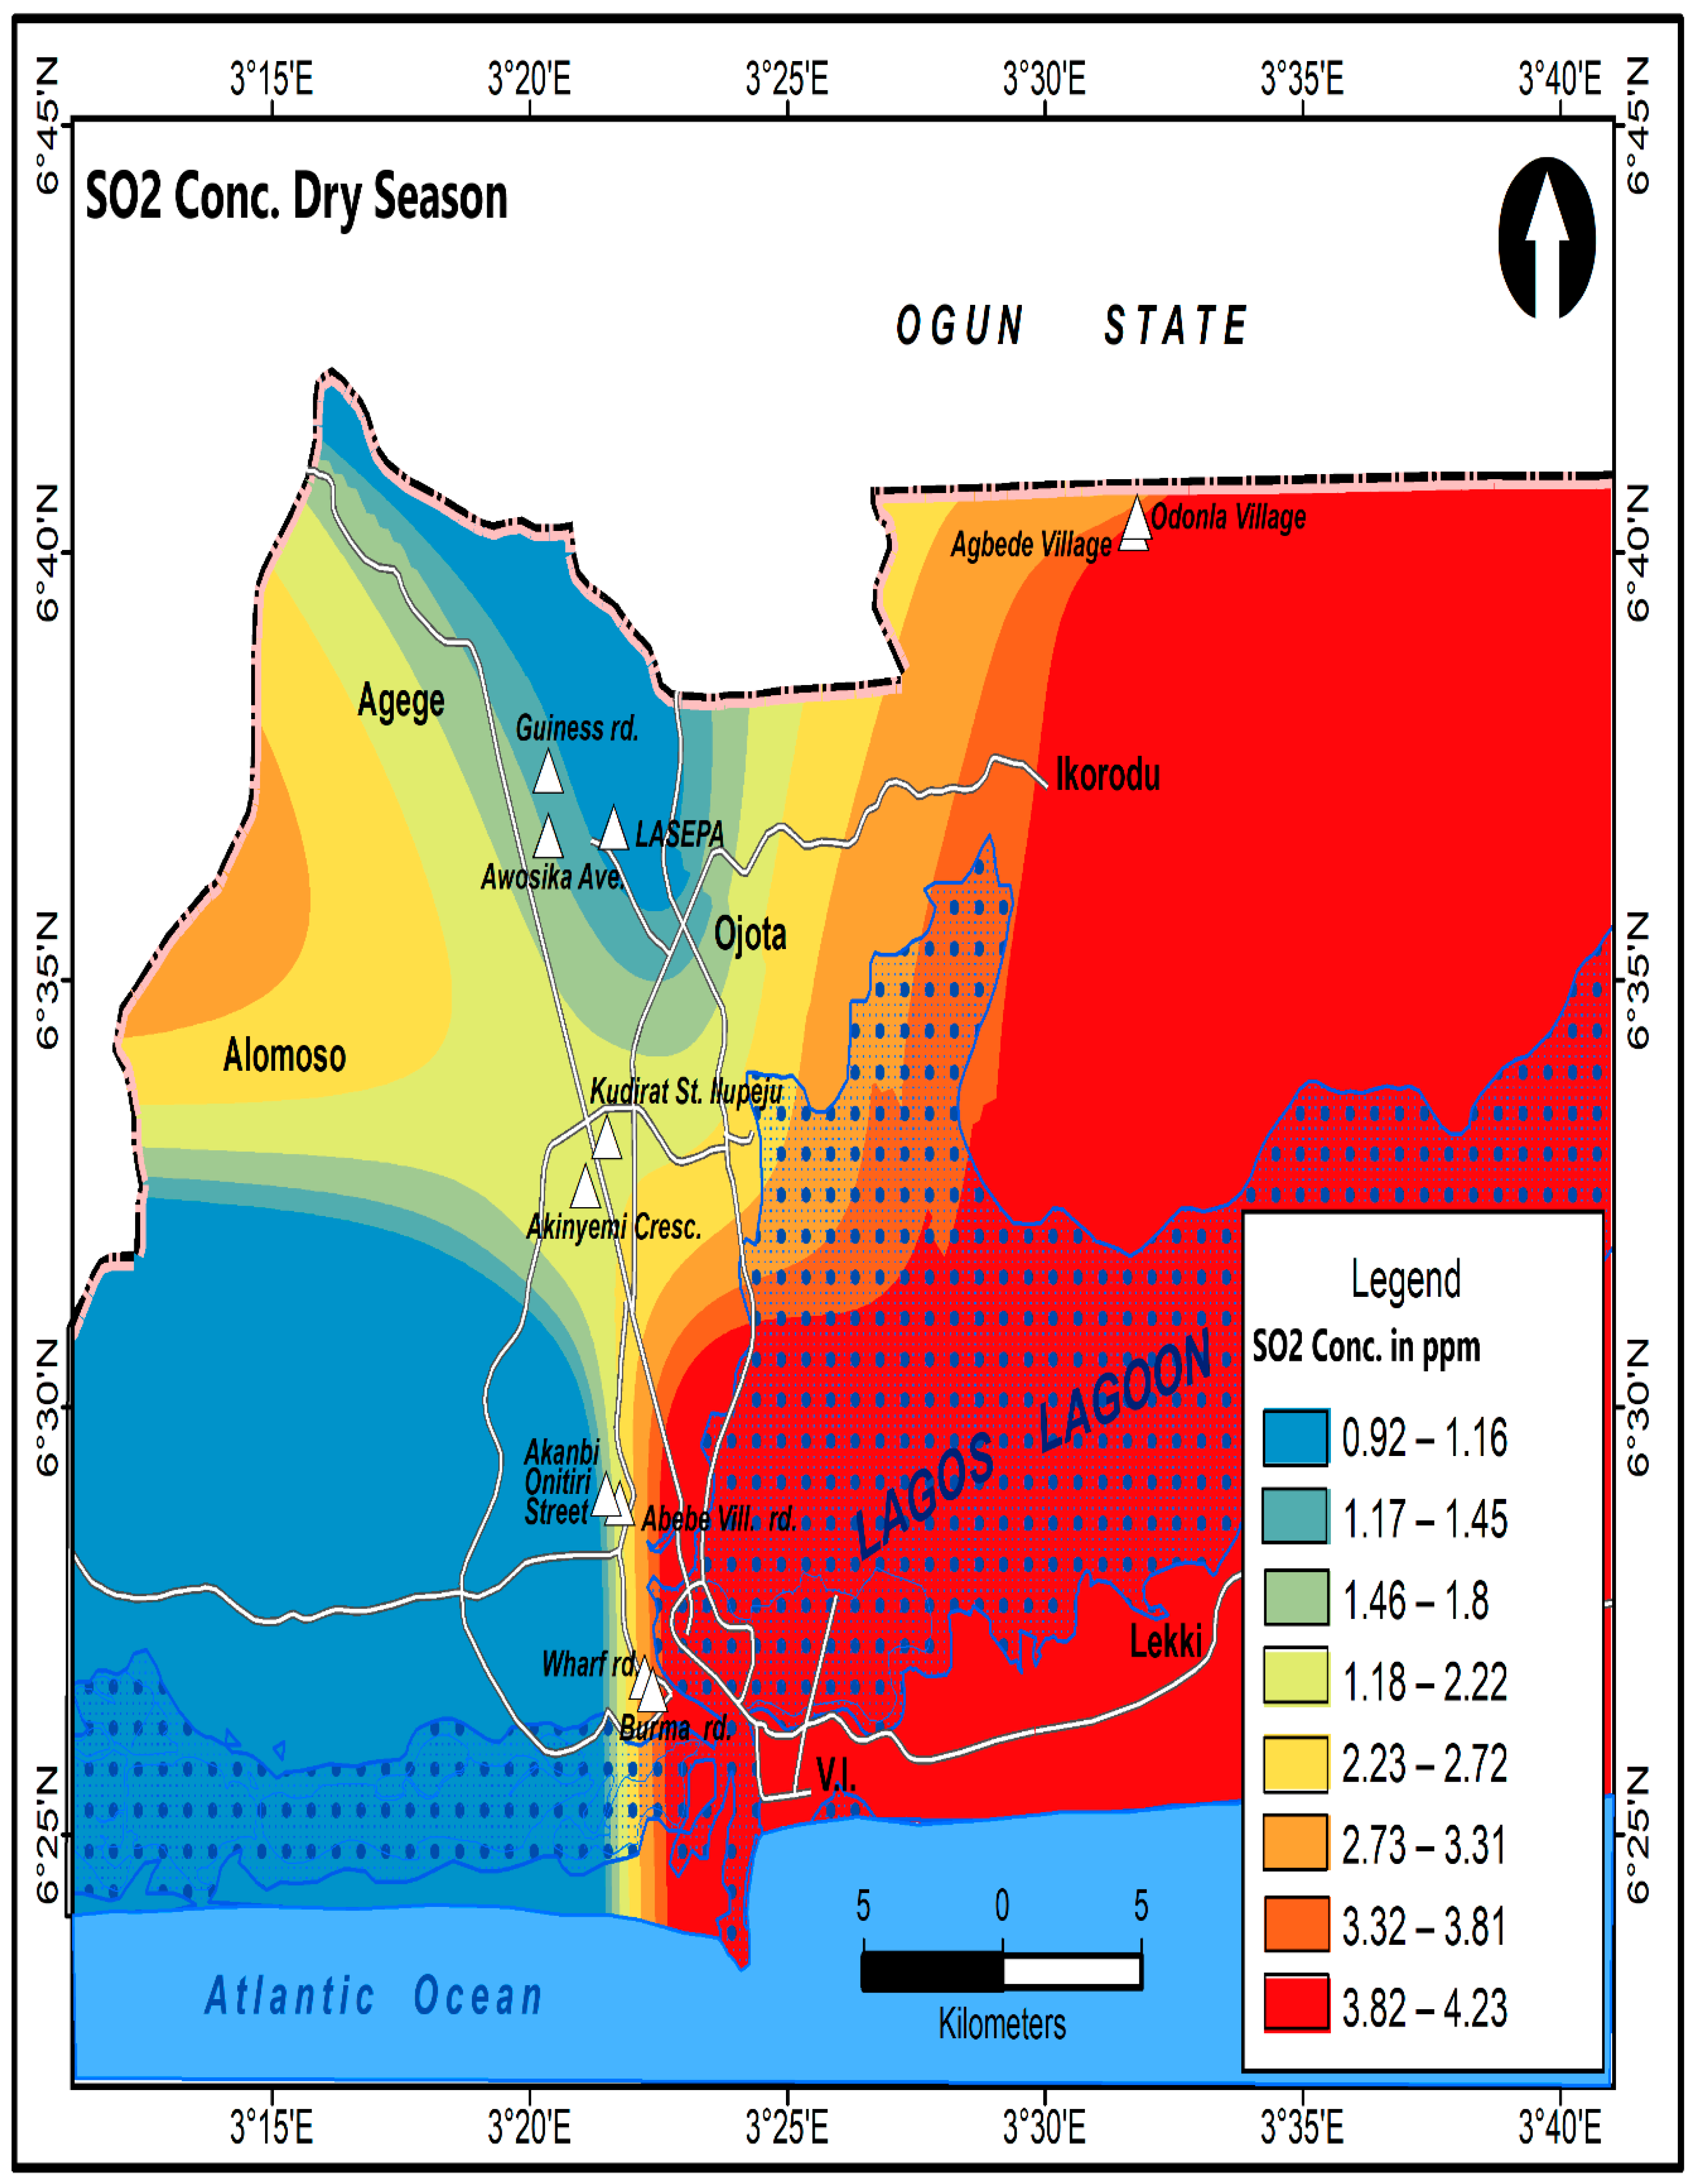
Figure 13.
Spatial variation in sulfur(iv)oxide (SO2) levels in the dry season across selected industrial locations in Lagos state. Source: Field Survey (2021).
Figure 13.
Spatial variation in sulfur(iv)oxide (SO2) levels in the dry season across selected industrial locations in Lagos state. Source: Field Survey (2021).
The independent sample t-test was employed (Table 3) to quantify the seasonal difference in ambient levels of pollutants. SO2 significantly varied between the wet and the dry season (t (18) = 3.013, ρ = 0.007 < 0.05 significant interval. NO2 significantly varied between the wet and the dry season (t (18) = 4.042, ρ = 0.001 significant interval. PM2.5 also significantly varied between the wet and the dry season (t (18) = 2.798, ρ = 0.012 significant interval. CO did not significantly vary between the wet and the dry season (t = 1.432, ρ = 0.169) significant interval.
3.3. Monthly and Seasonal Variation in Gaseous and Particulate Pollutants
Monthly variation in gaseous and particulate emissions stems from both industrial and traffic sources which are a combination of fumes from industries, cars, bikes, forklifts, and heavy-duty vehicles. The utilization of furnace oil in the powering of industries is also a major source of sulfur (iv) oxide while biomass burning, thermal power plants and fossil fuel combustion from vehicles are major emitters of nitrogen (iv) oxide (Saadat, et al. 2021). Natural and anthropogenic sourced PM2.5 from airborne dust particles, sea salts, pollens, industries, bush/forest/wood/incinerator burning, power plants, fumes from heavy-duty vehicles, cars and forklifts, construction sites, and untarred roads are responsible for the variation in fine particulate matter levels across the industrial estates. Fumes from cars and heavy-duty vehicles, combustion (gas turbines and furnaces), non-combustion processes (raw materials treatments), transportation and offloading of dusty industrial raw materials, and traffic particulate matter were identified as the major causes of gaseous and particulate emission in cities (Owoade et al. 2013; Samek, et al. 2017; Ojekunle et al. 2018; Kanu et al. 2021; Ezeugoh, et al., 2020). Across arctic countries, energy, industry, transport and agricultural sectors are significantly responsible for SO2, NO2, PM2.5 and CO emissions (Moore, et al. 2021) which influences the quality of the ambient environment (Marinello et al. 2021). According to Karagulian et al., (2015), 10% of PM2.5 levels in Africa originate from industrial activities where the intensity of emission affects the variation in concentration levels across the city. The reduction in air quality in low- and middle-income countries is primarily caused by the rapidity in urbanization and economic development characterized by the reliance on the burning of fossil fuels with minimal efforts for emission reduction and control (Croitoru, et al. 2020). The WHO (2021) report on air quality guidelines described air pollution as the single biggest environmental threat to human health due to its contribution to the global disease burden. The report identified six classical pollutants of concern to human health and wellbeing which are; fine particulate matter, coarse particulate matter, sulfur(iv)oxide, nitrogen (iv) oxide, carbon (ii) oxide and ozone. Kislitsyna et al., (2021) identified criteria pollutants in an ideal industrial estate as; soot, inorganic dust, carbon(ii)oxide, nitrogen(ii)oxide, sulfur(iv)oxide and nitrogen(iv)oxide.
The hypothesis result revealed that SO2, NO2, and PM2.5 exhibited significant variation over the 12 months across the study area. While CO did not reveal any significant variation in monthly concentration level during the study period. Seasonally, both gaseous and fine particulate matter values were higher during the dry season than the wet season across the study area and the control site. The reason for such differences is the remediating role of precipitation which removes both gaseous and particulate from the atmosphere through precipitation scavenging, gravitational settling and wet deposition (Oke, 1987). Both particulate and gaseous monthly pollutants levels were higher than the WHO air quality standard of 0.013ppm (25µgm-3) for NO2, 3.49ppm for CO, 0.015ppm (40µgm-3) for SO2 and 15µg/m3 for PM2.5. Air quality across seasons revealed a marked variation between the wet and dry seasons in the tropics and in the summer, autumn, and winter months in the temperate region (Gobo, et al 2012; Hongliang et al. 2016; Weli & Adegoke, 2016; Saud & Paudel, 2018; Wei et al., 2015; Ikamaise, et al. 2001; Weli, 2014; Oyebanji, et al. 2021). Weather variables and topography have proven to help in the sequestration and chemical transformation of pollutants in space and over time (Juřík and Braathen, 2021) which in turn reduces the risk posed by elevated pollutants on the vulnerable segment of the populace in the city (Brauer et al. 2021; Ming-Lun et al. 2021). Globally, air quality has increased the burden on respiratory, cardiovascular, and nervous system damages, and eye irritation (Rai, et al. 2021). Human mortality due to ambient air pollution in East Asia (35%) and India (33%) accounted for more deaths than in Africa (11%) (Silva, et al. 2016). Hypothesis results revealed that SO2, NO2, and PM2.5 exhibited significant seasonal variation throughout the study than CO which did not show any significant seasonal variation.
Multiple linear regression was utilized to statistically investigate the relationship between seasonal hospital-based respiratory conditions, seasonal air pollutant concentration and meteorological parameters. The dependent variable (hospital-based respiratory conditions (HBRS) was regressed with seasonal meteorological parameters (wind speed, temperature, precipitation, and relative humidity) and pollutants concentration (Table 4). The independent variables significantly influenced hospital-based respiratory conditions, F (8.11) = 3.652, ρ = 0.025, which indicates that the independent variables under study have a significant influence on seasonal hospital-based respiratory conditions. Moreover, the R2 = 0.726 depicts that the model explains 72.6% of the seasonal variation in hospital-based respiratory conditions. Additionally, the coefficients were also assessed to ascertain the influence of meteorological parameters (wind speed, temperature, precipitation, and relative humidity) and pollutant concentration on hospital-based respiratory conditions. SO2 has no significant influence on hospital-based respiratory conditions (β = 140.133, t = 0.309, ρ = 0.763). NO2 has no significant influence on hospital-based respiratory conditions (β = -303.075, t = -0.929, ρ = 0.373). CO significantly increased hospital-based respiratory conditions by 83.4% (β = 217.834, t = 2.568, ρ = 0.026 < 0.05). PM2.5 has no significant influence on hospital-based respiratory conditions (β = -2.577, t = -0.293, ρ = 0.775). Ambient temperature has no significant influence on hospital-based respiratory conditions (β = -318.472, t = -1.629, ρ = 0.132). Relative humidity significantly reduced hospital-based respiratory conditions by 30.8% (β = -11.308, t = -2.220, ρ = 0.048). Precipitation has no significant influence on hospital-based respiratory conditions (β = 65.217, t = 1.478, ρ = 0.167). Wind-speed has no significant influence on hospital-based respiratory conditions (β = 33.584, t = 0.186, ρ = 0.856).
Multiple linear regression was utilized to statistically investigate the relationship between monthly hospital-based respiratory conditions, monthly air pollutants concentration and monthly meteorological parameters. The dependent variable (hospital-based respiratory conditions (HBRS) was regressed with monthly meteorological parameters (wind speed, temperature, precipitation, and relative humidity) and pollutants concentration (Table 5). The independent variables significantly influenced monthly hospital-based respiratory conditions, F (8.111) = 8.315, ρ = 0.000, which indicates that the independent variables under study have a significant influence on monthly hospital-based respiratory conditions. Moreover, the R2 = 0.375 depicts that the model explains 37.5% of the monthly variation in hospital-based respiratory conditions. Additionally, the coefficients were also assessed to ascertain the influence of meteorological parameters (wind speed, temperature, precipitation, and relative humidity) and pollutant concentration on monthly hospital-based respiratory conditions. SO2 has no significant influence on monthly hospital-based respiratory conditions (β = 25.777, t = 1.049, ρ = 0.297). NO2 significantly reduced monthly hospital-based respiratory conditions by 87.4% (β = -48.874, t = -2.835,ρ=0.005). CO has no significant influence on monthly hospital-based respiratory conditions (β = 6.0454, t =1.627, ρ = 0.107). PM2.5 significantly increased monthly hospital-based respiratory conditions by 36.1% (β =1.361, t = 2.998, ρ = 0.003). Ambient temperature has no significant influence on monthly hospital-based respiratory conditions (β = 7.036, t = 1.128, ρ= 0.262). Relative humidity significantly increased monthly hospital-based respiratory conditions by 21.4% (β = 6.214, t = 4.395, ρ = 0.000). Precipitation has no significant influence on monthly hospital-based respiratory conditions (β=-0.082, t = -0.730, ρ = 0.467). Wind-speed significantly reduced monthly hospital-based respiratory conditions by 37.9% (β = -21.379, t = -2.384, ρ = 0.019).
Hypothesis result revealed varying significant relationships between seasonal pollutants, meteorological variables and respiratory hospital visitation. Only seasonal ambient CO2 levels and relative humidity showed a strong influenced on seasonal respiratory hospital visitation. This is consistent with the findings of Rajendra, et al. (2021) who investigated the impacts of mixture of pollutants on hospital visits for respiratory morbidity in Canada and found that CO, PM2.5, NO2, or Ozone had a stronger impacts on respiratory hospital visitation during the warm season than a combination of pollutants. Monthly ambient NO2, PM2.5, relative humidity and wind-speed levels showed a strong significant influence on monthly respiratory hospital visitation across the study area and period of study. This result is consistent with the findings by Hsu et al.,(2017) who investigated ambient PM2.5 levels in residential areas near industrial complexes in Central Taiwan and found that daily exposure to PM2.5 by 10μgm−3 resulted to an increase in respiratory physician visits for elderly aged ≥65 years in winter by over 2%. Zhaohui, et al. (2021) also investigated the nexus between air pollutants exposure and the risk of pulmonary embolism hospitalization in Beijing China and found a positive association between elevated levels of PM2.5, O3, CO and PM10 on pulmonary embolism hospitalization (3500 cases in three years at 6.5 per 1000 population) among women ages 65 and above.
4. Conclusion
This study investigated the quality of ambient industrial air pollution and human health in Lagos state and found a considerable decline in the quality of air during the dry season than the wet season and control site. The results revealed varying monthly and seasonal variations in the concentration levels of both fine particulate matter and gaseous pollutants across the state. Meteorological variables like precipitation, wind speed, relative humidity and temperature significantly influenced the concentration levels of both fine particulate matter and gaseous pollutants across the state. Specifically, wind speed, relative humidity and precipitation recorded higher levels during the wet season than during the dry season and significantly played remediating roles in the reduction of the concentration levels of both fine particulate matter and gaseous pollutants across the state. More respiratory hospital visitations were found during the dry than the wet season due largely to poor ambient air pollution concentration levels. For example, pneumonia, asthma, upper and lower respiratory tract infections, chronic obstructive pulmonary diseases (COPD) and lung cancer were majorly reported across the state than laryngitis, tonsilitis, and emphysema especially among under 5 and post-natal out door patients. A significant monthly and seasonal variation in both gaseous and fine particulate pollutant levels was found across the study area.
5. Recommendation
There is an urgent need for the development of a master plan and infrastructures for the sitting and continuous monitoring of ambient air quality across the industrial estates in Lagos states, especially in Odogunya, and Apapa. Efforts to reduce air pollution levels is dependent on the resources deployed for air quality infrastructural development in the city. For example, the Romanian implementation of the EU acquis helped in the development of monitoring and reduction approach capacity for major air pollutants levels in the country, in the Czech Republic, air pollution tax imposition on industries was used as a measure for reducing emission concentration limits in the city, in China, government embarked on a national action plan to reduce air pollution in 2013 across the country with specific focus on the most industrialized regions of Beijing-Tianjin-Hebei, Yangtze River Delta and Pearl River Delta regions. The plan committed over 390 billion US dollars by both the central and the Beijing city governments. The plan’s objective centered on the provision of incentives for pollution reduction across all levels of government in China, replacement of coal power plants with natural gas and increase in renewable energy production and generation, reduction and shutting down of the iron and steel production capacity of the country, reduction of vehicles on the road and installation of over 5000 air quality monitoring stations across the country. The results in 2021 revealed a decline in fine particulate matter concentration by 39.6% across all cities in China and a gain in life expectancy of 2 years, a 48.8% reduction and an increase in life expectancy by 4.1 years in the Beijing-Tianjin-Hebei region, 20% reduction in the Pearl River Delta region and a 15% decline in the Yangtze River Delta region of China. In Bogota, Columbia, the government plans to reduce air pollution by 10% by 2024 through the electrification of its public buses and metro stations. The Breathe Warsaw initiative in Poland is transitioning from coal heating to cleaner energy sources and installing 165 sensors for the monitoring of air quality. In Seoul, South Korea, the government is working towards the eradication of diesel-powered cars and mass transit fleets from all public spaces by 2025. In Bangkok, Thailand, the Green Bangkok 2030 project is working towards increasing green spaces and footpaths to reduce dependence on private transportation. The Breathe Life campaign project in Accra, Ghana is poised to sensitizing and educate the populace on the health risks of exposure to indoor cooking stoves and waste burning. Such global approaches are aimed at reducing air pollution in cities and can be planned and implemented across the city of Lagos and the industrialized regions of Nigeria which will build a stronger voice for the prioritization of air pollution in the development agenda of low- and middle-income countries (Sánchez-Triana, et al. 2021).
There is an urgent need for the enforcement and installation of air quality control devices such as mist collectors, scrubbers, incinerators, air filters, electrostatic precipitators, cyclones, biofilters, and catalytic reactors in all manufacturing companies across the industrial estates, to filter and prevent obnoxious and poisonous gases and particulate from the ambient environments. Air quality sensors should be enforced and installed in all manufacturing industries to monitor the quality of both indoor and outdoor pollutant levels. An outdoor solar-assisted large-scale cleaning system is being used in Xi’an China to reduce the level of fine particulate matter in the city. These can be adopted and deployed as a matter of urgency to areas like Odogunyan, Apapa and Surulere industrial estates where the level of both fine particulate matter and gaseous pollutants are unacceptably high.
Regular power supply should be provided to reduce the use of generators which pollute the environment. Waste management practices and evacuation should be intensified across the industrial estates, especially in Apapa where both industrial wastes and human excreta are perversive due to inadequate mobile toilets and irregular waste evacuators along Wharf and Burma Roads. Regular sanitation should be enforced in Apapa and Odogunyan industrial estates for the timely evacuation of wastes generated from the industries. Decommissioning of industrial facilities can be carried out by the government especially the iron steel companies in Odogunyan which have failed to make corporate social responsibility a priority in their host communities and have failed to also reduce the poisonous soot and obnoxious gases released into the ambient environment.
5.1. Limitation of the Study
Studies on air quality and respiratory conditions require funding to access scarce air quality monitoring equipment and respiratory data. Air quality monitoring infrastructures are inadequate in Nigeria due to limited government and private sector support for air quality research. Access to respiratory data across government hospitals was cumbersome and need to be accessible to researchers. This study was funded by the researchers and that affected the number of monitoring points designed for this study. With the right funding support in future studies, more sampling points can be covered to improve on the quality of air quality research outcomes.
5.2. Ethical Approval
Ethical approval for this study was granted by the University of Ibadan Social Science Ethics Committee with Number: UI/SSHREC/2019/0038, Lagos State Ministry of Health, and the Lagos State Health Service Commission.
Authors Contribution
PNA and IOA conceived the topic and both developed the study design. PNA collected the data and analyzed it while IOA developed the study content and supervised the development of the manuscript. Both PNA and IOA read and agreed on the final research output. .
Conflicts of Interest
PNA and IOA declared a conflict of no interest.
Data Availability declaration
The air quality, meteorologic and respiratory data used for this research are readily available for your elucidation.
References
- AbdRahman, N. H., Lee, M. H.S., and Latif, M. T. (2016) Evaluation Performance of Time Series Approach for Forecasting Air Pollution Index in Johor, Malaysia. Journal of Sains Malaysiana Vol. 45, No. 11, Pp.1625–1633.
- Adelana, S.M.A., Bale R.B., Olasehinde P.I., and Wu M. (2005) The impact of anthropogenic activities over groundwater quality of a coastal aquifer in Southwestern Nigeria. Aquifer Vulnerability and Risk, 2nd International Workshop 4th Congress on the Protection and Management of Groundwater Reggia di Colorno - Parma, 21-23 Settembre 2005.
- Agarwal, A. L. (1988). Air Pollution Control Studies and Impact Assessment of Stack and Fugitive Emission from CCI Akaltara Cement Factory, Project Sponsored by M/S CCI Akaltara Cement Factory, NEERI, Nagpur.
- Agbaire, PO and Esiefarienrhe E. (2009). Air Pollution Tolerance Indices of Some Plants around Otorogun Gas Plant in Delta State, Nigeria. Journal of Applied Sciences and Environmental Management; 13.1.:11-14.
- Ajayi, D.D. (2007) Recent Trends and Patterns in Nigeria’s Industrial Development, Council for the Development of Social Science Research in Africa, Africa Development, Vol. XXXII, No. 2, Pp. 139–155.
- Ajayi, D.D. (2011) Nigeria’s Industrial Development; Issues and Challenges in the New Millennium, Transaction on Ecology and the Environment Vol. 150, Pp.1-13.
- Akanni, C. O. (2008) Analysis of Street Level Air Quality Along Traffic Corridors in Lagos Metropolis. PhD Thesis. Department of Geography, Faculty of Science, University of Ibadan, Nigeria.
- Akanni, C. O. (2010) Spatial and Seasonal analyses of traffic-related pollutant concentrations in Lagos Metropolis, Nigeria, African Journal of Agricultural Research Vol. 5. No.11, Pp. 1264-1272.
- Akeredolu, F.A., Olaniyi, H.B., Adejumo, J.A., Obioh, I.B., Ogunsola, O.J., Asubiojo, O.I., and Oluwole, A.F. (1994). Determination of elemental composition of TSP from cement industries in Nigeria using EDXRF technique. Nuclear Instruments and Methods in Physics Research, A., 353, Pp. 542-545.
- Akinfolarin, O.M, Boisa N, and Obunwo C.C. (2017) Assessment of Particulate Matter-Based Air Quality Index in Port Harcourt, Nigeria. J Environ Anal Chem 4: 224. [CrossRef]
- Alfred, J. and Hyeladi, A. (2013). Assessment of Vehicular Emissions and Health Impacts in Jos, Plateau State. Journal of Research in Environmental Science and Toxicology Vol. 2.4. Pp. 80-86, www.interesjournals.org/jrest.
- Alkhdhairi, S.A., Abdel-Hameed, U.K., Morsy, A. A., and Tantawy, M.E. (2018) Air Pollution and its Impact on the Elements of Soil and Plants in Helwan Area. Int. J. Adv. Res. Biol. Sci. 5.6.: 38-59. [CrossRef]
- Alvarado, J. A., McVey A. E., Hegarty, J. D., Cross, E. B., Hasenkopf C. A., Lynch, R., Kennelly, E., Onasch, T., Awe, Y., Sanchez-Triana, E., and Kleiman, G. (2019). Evaluating the use of satellite observations to supplement ground-level air quality data in selected cities in low- and middle-income countries. Atmospheric Environment, 218, 1–14.
- Alvarez, C.M, Hourcade, R., Lefebvre, B., and Eva P. (2020). A Scoping Review on Air Quality Monitoring, Policy and Health in West African Cities, International Journal of Environmental Research and Public Health; Int. J. Environ. Res. Public Health, 17, 9151. [CrossRef]
- Amato, F., Pandolfi, M., Escrig, A., Querol, X., Alastuey, A., Pey, J., Perez, N., Hopke, P.K. (2009). Quantifying road dust resuspension in urban environment by multilinear engine: a comparison with PMF2. Atmos. Environ. 43, 2770 to 2780.
- Amit, K.G., Tuluri, F. Tchounwou, P.B. Shaw, N., and Jain, K. G. (2015). Establishing the Association between Quarterly/Seasonal Air Pollution Exposure and Asthma Using Geospatial Approach. Aerosol and Air Quality Research, Vol.15: Pp.1525–1544. [CrossRef]
- Ana, G. R.E.E. (2011) Air Pollution in the Niger Delta Area: Scope, Challenges and Remedies, the Impact of Air Pollution on Health, Economy, Environment and Agricultural Sources. In Tech, www.intechopen.com/books/the-impact-of-air pollution-on-health-economy-environment-and-agricultural-sources/air-pollution-in-the-niger-delta-area-scopechallenges-and-remedies.
- Anake, W. U. (2016). Spatio-Temporal Variability of Trace Metals in Atmospheric Fine Particulate Matter from Selected Industrial Sites in Ogun State, Nigeria. A Published Thesis Submitted to The School of Postgraduate Studies of Covenant University, Ota, Ogun State, Nigeria, https:// scholar. google. com/ citations? view_op =view_citation &hl=en&user=ztwqXYIAAAAJ&cstart=20&pagesize=80&citation_for_view=ztwqXYIAAAAJ:jgBuDB5drN8C. https://core.ac.uk/download/pdf/85162242.pdf.
- Anake, W.U., Eimanehi, J.E., Riman, H.S., and Omonhinmin, C.A. (2018). Tree Species for bio-monitoring and Green Belt Design: A Case Study of Ota Industrial Estate, Nigeria. 2nd International Conference on Science and Sustainable Development, IOP Publishing IOP Conf. Series: Earth and Environmental Science 173, 012022. [CrossRef]
- Anil, I., and Alagha, O. (2020). The Impact of COVID-19 Lockdown on the Air Quality of Eastern Province, Saudi Arabia. Air Quality, Atmosphere and Health. [CrossRef]
- Arias-Ortiz, N.E., Icaza-Noguera, G., and Ruiz-Rudolph, P. (2018). Thyroid Cancer Incidence in Women and Proximity to Industrial Air Pollution Sources: A Spatial Analysis in a Middle Size City in Colombia. Journal of Atmospheric Pollution Research, Science Direct. Vol. 9, Issue 3, Pp. 464-475.
- Asubiojo, O. I. (2016) Pollution Sources in the Nigerian Environment and their Health Implications, Ife Journal of Science Vol. 18, No. 4, Pp.1-8, Ile Ife.
- Asubioju, O.I, Obioh, I.B., Oluyemi, E.A., Oluwole, A.F., Spyrou, N, M., Faroooi, A.S., Arshed, W., and Akanle, O.A. (1993). Elemental Characterization of Airborne Particulates at Two Nigerian Locations During the Harmattan Season. Journal of Radioanalytical and Nuclear Chemistry, Articles, Vol. 167, No. 2, Pp. 283-293.
- Asuoha, A. N and Osu, C. I. (2015) Seasonal Variation of Meteorological Factors on Air Parameters and the Impacts of Gas Flaring on Air Quality of Some Cities in Niger delta, Ibeno and its Environs, African Journal of Environmental Science and Technology. Vol. 9 No.3 Pp.218-227, River state Nigeria.
- Atkinson, RW, Fuller GW, Anderson HR, Harrison RM, Armstrong B. (2010). Urban ambient particle metrics and health. A time series analysis. Epidemiology; 21:501–11.
- Bagherian, M., Alizadeh, T., and Rezaei, M. (2016). A comparison of health impacts assessment for PM10 during two successive years in the ambient air of Kermanshah, Iran. 1–7. [CrossRef]
- Bakiyaraj, R., and Ayyappan, D. (2014). Air Pollution Tolerance Index of Some Terrestrial Plants Around an Industrial Area, International Journal of Modern Research and Review, Vol. 2, Issue 1, Pp 1-7.
- Bang, KM. (2015). Chronic obstructive pulmonary disease in nonsmokers by occupation and exposure: a brief review. Curr Opin Pulm Med; 21:149–154.
- Baowen, L., Diego M. B., Marco P., Cang H., Akshay G., Inge H., Daniela A. L., Gaurav, S., Kevin C., Kevin F., Louisa L., Maharaj, B., Navid G., Yaning Q., Solomon A., Ali F. M., Bhaven N., Arunabha B., Fusong W., Andrew T., Zhuangzhuang L., Kasun W., Sahra N., Lei Y., Hao C., Benan S., Shubham G., Prince P., Amir H., Montasir A., and Nithin A. (2021). Air pollution perception in ten countries during the COVID-19 pandemic; Ambio. [CrossRef]
- Belis, C., Karagulian, F., Bo, L., Hopke, P. (2013). Critical Review and Meta-Analysis of Ambient Particulate Matter Source Apportionment Using Receptor Models in Europe. Atmos. Environ. 69, 94-108.
- Bhaskar, B. V. and Mehta, V. M. (2010) Atmospheric Particulate Pollutants and their Relationship with Meteorology in Ahmedabad. Journal of Aerosol and Air Quality Research, Vol. 10: Pp.301–315. [CrossRef]
- Brauer, M, Amann M, Burnett RT, Cohen A, Dentener, F, and Ezzati M. (2012). Exposure assessment for estimation of the global burden of disease attributable to outdoor air pollution Environ. Sci Technol; 46:652–60.
- Brimblecombe, P. (2021). Visibility Driven Perception and Regulation of Air Pollution in Hong Kong, 1968–2020. Environments, 8, 51. [CrossRef]
- Brown, JS, Gordon T, Price O, Asgharian B. (2013). Thoracic and respirable particle definitions for human health risk assessment. Part Fibre Toxicol;12. [CrossRef]
- Cadelis, G, Tourres R, Molinie J. (2014). Short-term effects of the particulate pollutants contained in Saharan dust on the visits of children to the emergency department due to asthmatic conditions in Guadeloupe, French Archipelago of the Caribbean, PLoS ONE;9.3.: e91136. [CrossRef]
- Cao, J.J., Lee S. C., Ho, K. F., Zou, S. C., Kochi F., Li, Y., Watson, J.G., and Chow, J.C. (2004). Spatial and Seasonal Variations of Atmospheric Organic Carbon and Elemental Carbon in Pearl River Delta Region, China. Elsevier Journal of Atmospheric Environment, Science Direct., Vol. 38, Issue 27, September 2004, Pp. 4447-4456. [CrossRef]
- Cetin, M., and Sevik, H. (2016). Change of Air Quality in Kastamonu City in Terms of Particulate Matter and CO2 Amount. 3401.4., 3394–3401.
- Chen, P., Bi, X., Zhang, J., Wu, J., and Feng, Y. (2014). Assessment of Heavy Metal Pollution Characteristics and Human Health Risk of Exposure to Ambient PM2.5 in Tianjin, China. Particuology. [CrossRef]
- Choi, J.H. Xu, Q.S. Park, S.Y. Kim, J.H. Hwang, S.S. Lee, K.H., Lee, H.J and Hong Y.C. (2007). Seasonal variation of effect of air pollution on blood pressure, Journal of Epidemiology Community Health; Vol.61, Pp.314–318. Correspondence to: Professor Y-C Hong, Department of Preventive Medicine, Seoul National University College of Medicine, 28 Yongon-Dong, Chongno-Gu, Seoul 110- 799, South Korea. [CrossRef]
- Chuanglin, F., Haimeng L., Guangdong L., Dongqi S., and Zhuang, M. (2015). Estimating the Impact of Urbanization on Air Quality in China Using Spatial Regression Models. Journal of Sustainability, Vol.7, Pp.15570-15592. [CrossRef]
- Cohen, A. J, Brauer M., Burnett, R., Anderson, H R. Frostad, J. Estep, K. Balakrishnan, K. Brunekreef, B. Dandona, L. Dandona, R. Feigin, V. Freedman, G. Hubbell, B. Jobling, A. Kan, H. Knibbs, L. Liu, Y. Randall M., Morawska, L. Pope III, C. Shin, H. Straif, K. Shaddick, G. Thomas, M. Dingenen, R. V. Donkelaar, A. V. Vos, T. Murray, C. J L and Forouzanfar, M. H. (2017). Estimates and 25-Year Trends of The Global Burden of Disease Attributable to Ambient Air Pollution: An Analysis of Data from the Global Burden of Diseases Study 2015.The Lancet, Vol. 389, Pp.1907–18.
- Currie, B. A., and Bass, B. (2008). Estimates of Air Pollution Mitigation with Green Plants and Green Roofs using the UFORE Model. 409–422. [CrossRef]
- Dappe, V., Uzu, G., Schreck, E., Wu, L., Li, X., Dumat, C., Moreau, M., Hanoune, B., Chul-Un R., and Sobanska, S. (2018). Single-Particle Analysis of Industrial Emissions Brings New Insights for Health Risk Assessment of PM. Journal of Atmospheric Pollution Research, Science Direct., Vol. 9, Issue 4, Pp.697-704. [CrossRef]
- Demetriou, C.A., and Vineis, P. (2015) Carcinogenicity of Ambient Air Pollution: Use of Biomarkers, Lessons Learnt and Future Directions. J Thorac Dis.; 7.1.: 67–95. [CrossRef]
- Deng, Q., Lu, C., Norbäck, D., Bornehag, C., Zhang, Y., Liu, W., Yuan, H., Sundell, J. (2015). Early Life Exposure to Ambient Air Pollution and Childhood Asthma in China, Environmental Research 143, 83–92. [CrossRef] [PubMed]
- Dimitriou, K. and Kassomenos, P. (2018). Quantifying Daily Contributions of Source Regions to PM Concentrations in Marseille based on the trails of Incoming Air Masses. Journal of Air Quality, Atmosphere and Health, Vol. 11, Issue 5, Pp. 571–580.
- Ediagbonya, T. F, Tobin, A. E, Olumayede, E. G, Okungbwa, G. E, and Iyekowa, O. (2016) the Determination of Exposure to Total, Inhalable and Respirable Particles in Welders in Benin City, Edo State. Journal of Pollution Effluent Contamination 4:152. [CrossRef]
- Ediagbonya, T.F and Tobin, A.E. (2013). Air Pollution and Respiratory Morbidity in an Urban Area of Nigeria, Greener Journal of Environmental Management and Public Safety, Vol. 2 .1., Pp. 10-15.www.gjournals.org.
- Ekpenyong, C. E., Ettebong, E. O., Akpan, E E., Samson, T K., and Nyebuk, E. D. (2012). Urban City Transportation Mode and Respiratory Health Effect of Air Pollution: A Cross-Sectional Study among Transit and Non-Transit Workers in Uyo City. Nigeria. BMJ. [CrossRef]
- Eludoyin, O. M. (2013) Some Aspects of Physiologic Climatology in Nigeria Interdisciplinary Environmental Review, Vol. 14, No. 2, Pp.150–185.
- Escobedo, F. J, Wanger J. E, and Nowak D. J. (2008). Analyzing the cost-effectiveness of Santiago, Chile’s policy of using urban forests to improve air quality. Journal of Environmental Management; 86.1:148-157.
- Ezeugoh, R.I., Puett, R., Payne-Sturges, D., Cruz-Cano, R and Wilson, S.M. (2020) Air Quality Assessment of Particulate Matter Near a Concrete Block Plant and Traffic in Bladensburg, Maryland. 13 .3., 1009–1015. [CrossRef]
- Fagbohunka, A. (2014) Firms Location and Relative Importance of Location Factors among Firms in the Lagos Region, Nigeria, Research on Humanities and Social Sciences, Vol.4, No. 8, 73,. https:// d1wqtxts1xzle7. cloudfront. net/34228795/ Firms_ Location_and_Relative_Importance_of_Location_Factors_amongst_Firms_in_the_Lagos_Region__Nigeria-libre.pdf?1405649065.
- Fakayode, S.O. and Onianwa, P.C. (2002) Heavy Metal Contamination of Soil, and Bioaccumulation in Guinea grass. Panicum maximum. around Ikeja Industrial Estate, Lagos, Nigeria. Environmental Geology, 2002. 43:145–150. [CrossRef]
- Fang, C.-F., Ling, D.-L. (2003). Investigation of the noise reduction provided by tree belts. Landscape Urban Plan 63, 187–195.
- Fang, Y, Naik V, Horowitz LW, Mauzerall DL. (2013). Air pollution and associated human mortality: the role of air pollutant emissions, climate change and methane concentration increase from the preindustrial period to present. Atmos Chem Phys;13: 1377–94.
- Filho, M.A. P., Pereira, L.A.A., Arbex, F.F., Arbex, M., Conceição, G.M., Santos, U.P., Lopes, A.C., Saldiva, P.H.N., Braga, A.L.F. and Cendon, S. (2008). Effect of Air Pollution on Diabetes and Cardiovascular Diseases in São Paulo, Brazil. Brazilian Journal of Medical and Biological Research, Vol. 41, No. 6, Pp. 526-532, www.bjournal.com.br.
- Gang, W., Shuiyuan C., Jianbing L., Jianlei L., Wei W., Xiaowen Y., and Liang T. (2015). Source Apportionment and Seasonal Variation of PM2.5 Carbonaceous Aerosol in the Beijing-Tianjin-Hebei Region of China. Journal of Environmental Monitoring and Assessment, Vol.187, Pp.143.
- Gang, Xu, Limin J., Suli Z., Man, Y., Xiaoming, Li, Yuyao, H., Boen, Z. and Ting, D. (2016). Examining the Impacts of Land Use on Air Quality from a Spatio-Temporal Perspective in Wuhan, China. Atmosphere, Vol.7, Pp.62.
- Gawronski, S. W., Gawronska, H., and Lomnicki, S. (2017). Plants in Air Phytoremediation. 83, 319–346. [CrossRef]
- Ghorani-Azam, A., Riahi-Zanjani, B. and Balali-Mood, M. (2016). Effects of Air Pollution on Human Health and Practical Measures for Prevention in Iran. Journal Research on Medical Sciences; Vol.21: Pp.65. [CrossRef]
- Gobo, A. E; Ideriah, T. J. K., Francis, T. E., Stanley, H. O. (2012). Assessment of Air Quality and Noise around Okrika Communities, Rivers State, Nigeria, J. Appl. Sci. Environ. Manage, Vol. 16 No.1 Pp.75 – 83.
- Golani-Azam, A., Riahi-Zanjani, B. and Balali-Mood, M. (2016) Effects of Air Pollution on Human Health and Practical Measures for Prevention in Iran. Journal Research on Medical Sciences; Vol.21: Pp.65. [CrossRef]
- Guaita, R, Pichiule M, Mate T, Linares C, and Diaz, J. (2011). Short-term impact of particulate matter PM2.5. on respiratory mortality in Madrid. Int J Environ Health Res; 21:260–74.
- Guillerm, N., and Cesari, G. (2015) State of the Art; Fighting Ambient Air Pollution and Its Impact on Health: From Human Rights to the Right to A Clean Environment. 19.8., 887–897.
- Guttikunda, S. K. and Gurjar, B. R. (2012). Role of Meteorology in Seasonality of Air Pollution in Megacity Delhi, India. Journal of Environmental Monitoring and Assessment, Vol. 184, Issue 5, Pp. 3199–3211.
- Hind, S. Y., Enaam, J. A, and Maitham A. S. (2021). Risk Assessment of Occupational Exposure to Air Pollution in Baghdad City. Annals of R.S.C.B., ISSN:1583-6258, Vol. 25, Issue 2, Pp. 686 - 700.
- Hongliang, Z., Yungang, W., Jianlin, H., Qi Y., and Xiao-Ming, H. (2016). Relationships between Meteorological Parameters and Criteria Air Pollutants in Three Megacities in China, United State of America. Corresponding author: Dr. Yungang Wang, carl.wang@erm.com.
- Hsu, C., Chiang, H., Chen, M., Chuang, C., Tsen, C., Fang, G., Tsai, Y., Chen, N., Lin, T., Lin, S., and Chen, Y. (2017). Ambient PM2.5 in the residential area near industrial complexes: Spatiotemporal variation, source apportionment, and health impact: spatiotemporal variation, source apportionment, and health impact. Science of the total environment, 590–591, 204–214. [CrossRef]
- Huang, Z.; Shaofei K.,; Mingming Z.,; Yingying Y.,; Liquan Y.,; Shurui Z.,; Qin Y., Jian W., Yi C.,; Nan C.,; Yongqing B., ;Tianliang Z.,; Dantong L.,; Delong Z; and Shihua Q. (2020). A 5.5-year observations of black carbon aerosol at a megacity in Central China: Levels, sources, and variation trends, Atmospheric Environment, Vol. 232. [CrossRef]
- Huang, L., Xie, R., and Yang, G. (2021). The impact of lockdown on air pollution: Evidence from an instrument; China Economic Review. [CrossRef]
- Hutton, G. (2011). Air Pollution-Global Damage Costs of Air Pollution from 1900 to 2050.Assessment Paper Copenhagen Consensus on Human Challenge.
- Ikamaise, V.C., Obioh, I. B., Ofoezie, I. E., and Akeredolu, F. A. (2001). Monitoring of total suspended air particulate in the ambient air of welding, car painting and battery charging workshops in Ile- Ife Nigeria. Global journal of pure and applied sciences, Vol. 7, No. 4, Pp. 743-748.
- Ileoje, NP. (2001) A New Geography of Nigeria, New Revised Edition. Longman Publishers: Ibadan, Nigeria.
- Ipeaiyeda, A. R., and Adegboyega, D.A. (2017) Assessment of Air Pollutant Concentrations Near Major Roads in Residential, Commercial and Industrial Areas in Ibadan City, Nigeria, Journal of Health and Pollution. Vol. 7, No. 13, JAMA Vol. 312 .15.: Pp. 1565-1580.
- Jafari, N, Ebrahimi, AA, Mohammadi, A, Hajizadeh, Y. and Abdolahnejad, A. (2017) Evaluation of Seasonal and Spatial Variations of Air Quality Index and Ambient Air Pollutants in Isfahan using Geographic Information System. Journal of Environmental Health Sustainable Development, Vol. 2, No. 2, Pp. 263-72.
- Jenq-Hwan, O., Shihn-Sheng, W., Chun-Hung, R.L., Tzu-Ying, W., and Yen-Hsia, W. (2017). Particulate Matter Air Pollution and Tuberculosis: Exploring the Optimal Exposure Assessment Taipei City Taiwan. Proceedings of ISER 64th International Conference, Nagoya, Japan, 7th -8th July 2017.
- Jian, H., Wei-ping, C., Zhi-Qi, Z., Ran, L., Meng, C., Wen-Jing, D., Wen-min, M., Xue, F., Xiao-Ming, W., and Ning, W. (2022) Source Tracing of Potentially Toxic Elements in Soils around a Typical Coking Plant in an Industrial Area in Northern China. Science of The Total Environment, Vol. 807, Part 2. [CrossRef]
- Joshi, PC and Swami A. (2007). Physiological Responses of Some Tree Species Under Roadside Automobile Pollution Stress Around City of Haridwar, India. Environmentalist; 27:365- 374.
- Juřík, R., and Braathen, N. A. (2021) Assessment of the Air Pollution Tax and Emission Concentration Limits in the Czech Republic. Environment Working Paper N° 174, OCED environment working papers are available at www.oecd.org/environment/workingpapers.htm.
- Kakoli, K., and Gupta, A.K. (2005). Seasonal Variations and Chemical Characterization of Ambient PM10 at Residential and Industrial Sites of an Urban Region of Kolkata, Calcutta., India, Journal of Atmospheric Research, Vol. 81, Issues 1, Pp.36-53. [CrossRef]
- Kaler, NS., Bhardwaj SK, Pant KS and Rai TS. (2016). Determination of Leaf Dust Accumulation on Certain Plant Species Grown Alongside National Highway 22, India. Current World Environment; 11.1.:77-82.
- Kanee, R.B., Ede, P.N., Adeyemi, A.J., Ojimah, C., Gobo, A.E., Edokpa, D.O., Owhonda, G., and Maduka, O. (2021). Perception of Port Harcourt Residents on Governments’ Interventions towards Air Quality: The Implication for Air Pollution Policy Accountability Framework, International Journal of Science and Research, IJSR. ISSN: 2319-7064, Vol. 10 Issue 2. [CrossRef]
- Karagulian, F., Belis, C. A., Francisco, C., Dora, C., Prüss-ustün, A. M., Bonjour, S., Adair-Rohani, H., and Amann, M. (2015). Contributions to cities' ambient particulate matter, PM.: A Systematic Review of Local Source Contributions at Global Level. Atmospheric Environment, 120, 475–483. [CrossRef]
- Katarzyna, R., Grzegorz M. and Tomasz, R. (2014). Seasonal Variation of Air Pollution in Warsaw Conurbation, Journal of Meteorologische Zeitschrift, Vol. 23, No. 2, Pp.175–179.
- Kaza, N. (2020). Urban Form and Transportation Energy Consumption, Energy Policy, Vol. 136, No. 111049. [CrossRef]
- Kebe, M.; Traore, A.; Manousakas, M.I.; Vasilatou, V.; Ndao, A.S.; Wague, A.; and Eleftheriadis, K. (2021) Source Apportionment and Assessment of Air Quality Index of PM 2.5–10 and PM2.5 in at Two Different Sites in Urban Background Area in Senegal. Atmosphere, 12, 182. [CrossRef]
- Khaniabadi, Y.O., Polosa, R., Chuturkova, R.Z, Daryanoosh, S.M, Goudarzi, G, Borgini, A., Tittarelli, A., Basiri, H., Armin, H., Nourmoradi, H., Babaei, A.A., and Naserian, P. (2017). Air Pollution Health Impact Assessment on Total, Cardiovascular, and Respiratory Mortality in Khorramabad, Iran, the Air Approach., Journal of Process Safety and Environment Protection. [CrossRef]
- Ki-Hyun, K., Ehsanul K., and Shamin K. (2015). A Review on The Human Health Impact of Airborne Particulate Matter, Environment International 74, 136–143. [CrossRef]
- Kovacs, T., Horvath, M., Csordas, A., Bator, G., and Toth-Bodrogi, E. (2020). Heliyon Tobacco Plant as Possible Biomonitoring Tool of Red Mud Dust Fallout and Increased Natural Radioactivity aria Horv. [CrossRef]
- Krewski, D. (2009). Evaluating the effects of ambient air pollution on life expectancy;360: 413–5.
- Kuang, X., Yuku W., Guang, W., Bin F., and Yuanyuan, Z. (2018). Spatiotemporal Characteristics of Air Pollutants .PM10, PM 2.5, SO2, NO2, O3, and CO. in the Inland Basin City of Chengdu, Southwest China. Journal of Atmosphere, Vol. 9, No. 74, Pp. 1-11. [CrossRef]
- Kumar, M., and Nandini, N. (2013). Identification and Evaluation of Air Pollution Tolerance Index of Selected Avenue Tree Species of Urban Bangalore India. International Journal of Emerging Technologies in Computational and Applied Sciences; 13:388-390.
- Landrigan, P.J. (2017) Air Pollution and Health, Preventive Medicine and Global Health, Icahn School of Medicine at Mount Sinai, New York, Vol. 2, www.thelancet.com/public-health. [CrossRef]
- Lange, C.L., Smith, V.A. and Kahler, D.M. (2021). Pittsburgh Air Pollution Changes During the COVID-19 Lockdown, Environmental Advances. [CrossRef]
- LeBlanc, F. and Rao, D.N. (1975). Effects of Air Pollutants on Lichen Bryophytes. In: Response of Air Pollution. Eds: J.B. Mudd and T. T. Kozlowski. Academic Press. New York, Pp. 237-272.
- Lelieveld, J, Evans JS, and Fnais M. (2015). The contribution of outdoor air pollution sources to premature mortality on a global scale. Nature; 525:367–371.
- Londahl, J., Pagels J, Swietlicki E, Zhou JC, Ketzel M, and Massling A. (2006). A set-up for field studies of respiratory tract deposition of fine and ultrafine particles in humans. J Aerosol Sci;37.9:1152–63.
- Lorenzo, J. S. L., Tam, W. W. S., and Seow, W. J. (2021). Association between air quality, meteorological factors and COVID-19 infection case numbers, Environmental Research 197 .2021. 111024. [CrossRef]
- Manju, A., Kalaiselvi, K., Dhananjayan, V., Ravichandran, B., Palanivel, M., Banupriya, G.S., Vidhya, M.H., and Panjakumar, K. (2018). Spatio-seasonal Variation in Ambient Air Pollutants and Influence of Meteorological Factors in Coimbatore, Southern India. Air Quality, Atmosphere and Health. [CrossRef]
- Manochehrneya, S., Mohammadi, M., Esmaeili, R., and Vahdani, A. (2021). A time series approach to estimate the association between health effects, climate factors and air pollution, Mashhad, Iran, Iranian Journal of Health and Environment.
- Marinello, S., Butturi MA, and Gamberini R. (2021). How changes in human activities during the lockdown impacted air quality parameters: A review. Environ Prog Sustainable Energy, 40.4.: e13672. [CrossRef]
- Mashi, S.A., El-Ladan, I.Y., and Yaro, A. (2014) Atmospheric Contamination by Heavy Metals in Ilupeju Industrial Area of Lagos, International Journal of Current Microbiology and Applied Science, Vol. 3, No.2, Pp. 833-840.
- Mba, E. (2015). Problems and Prospects of Industrialization in Nigeria, infoguidenigeria.com.
- Mehmood, U., Azhar, A., Qayyum, F., Nawaz, H., Tariq, S., and Haq, Z. (2021). Air pollution and hospitalization in megacities: empirical evidence from Pakistan. Environ Sci Pollut Res. [CrossRef]
- Mendoza, D.L., Benney, T.M., Bares, R., Crosman, E.T. (2021). Intra-city variability of fine particulate matter during COVID-19 lockdown: A case study from Park City, Utah. Environmental Research 201 .2021. 111471. [CrossRef]
- Metcalfe, D.J. (2005). Hedera helix L. J. Ecol. 93, 632e648. [CrossRef]
- Mir, QA., Yazdani T, Kumar A, Narain K, and Yunus M. (2008). Vehicular Population and Pigment Content of Certain Avenue Trees. Pollution Research; 27:59-63.
- Mirsanjari, M.M., Zarandian, A., Mohammadyari, F., and Visockiene, S.J. (2020). Investigation of the impacts of urban vegetation loss on the ecosystem service of air pollution mitigation in Karaj metropolis, Iran. Environ Monit Assess 192, 501. 2020. [CrossRef]
- Moore, G. W. K., & Semple, J. L. (2021). Himalaya air quality impacts from the COVID-19 lockdown across the Indo-Gangetic Plain. GeoHealth, 5. [CrossRef]
- Mustapha, A.; Amegah, A.K.; Coker, E.S. (2022) Harmonization of Epidemiological Research Methods to Address the Environmental and Social Determinants of Urban Slum Health Challenges in Sub-Saharan Africa. Int. J. Environ. Res. Public Health, 19, 11273. [CrossRef]
- Nabanita, G., Abhisek, R., Devdyuti, B., Nandini, D., Anupam, D., and Joyashree, R. (2020). COVID-19 Lockdown: Lessons Learnt Using Multiple Air Quality Monitoring Station Data from Kolkata City in India, Pp. 1-28. [CrossRef]
- Nagaraj, S and Rajashree, V.B. (2017). Application of Wireless Sensor Networks in The Real Time Ambient Air Pollution Monitoring and Air Quality in Metropolitan Cities- A survey. 2017 International Conference on Smart Technology for Smart Nation, Pp. 1393-1398.
- National Bureau of Statistics Report, (2011) Population, Education, Economy, Health and Climate of Nigeria. Federal Republic of Nigeria, Pp.1 -698.
- National Population Census and Housing Census (2006) National Population Commission Bab Animashau, Surulere Lagos.
- Ninavenave, SY., Chaudhary PR, Gajghate DG, and Tarar JL. (2001). Foliar Biochemical Features of Plants as Indicators of Air Pollution. The Bulletin of Environmental Contamination and Toxicology; 67.1.:133-140.
- Njoku, K. L., Akinola M. O. and Zighadina T. M. (2013) A study on the spatial distribution of heavy metal in the industrial area of Ikorodu, Lagos State, Nigeria. Journal of Research in Environmental Science and Toxicology. ISSN: 2315-5698. Vol. 2. 3. pp.64-70, available online http://www.interesjournals.org/JREST.
- Nowak, D. J. (1994). Air pollution removal by Chicago’s urban forest,” In: Mc Pherson, E., Nowak, D.J., Rowntree, R.A, Eds, Results of the Chicago Urban Forest Climate Project, USDA Forest Service General Technical Report NE, Chicago’s Urban Forest Ecosystem, 186: 63–81.
- Nowak, D. J., Hirabayashi, S., Bodine, A., and Greenfield, E. (2014). Tree and Forest Effects on Air Quality and Human Health in The United States. Environmental Pollution, 193, 119e129.
- Nowak, D.J., Crane, D.E., Stevens, J.C. (2006). Air pollution removal by urban trees and shrubs in the United States. Urban For. Urban Green 4, 115–123.
- Nwachukwu, A. N., Chukwuocha E. O., and Igbudu O. (2012). A Survey on the Effects of Air Pollution on Diseases of the People of Rivers State, Nigeria. African Journal of Environmental Science and Technology Vol. 6.10., pp. 371-379. http: //www. academicjournals.org/AJEST. [CrossRef]
- Obioh, I.B., Oluwole, A.F., Akeredolu, F.A., and Ogunsola, O. J. (1994). Inventory and Emission Projections in Relation to Various Transport Modes in Nigeria, 3rd International Symposium “Transport and Air Pollution” /3c Colloque Intern, 6th to 7th June Poster Proceedings/Actes posters 37, Bron, France.
- Odjugo, P. A. O. (2010) General Overview of Climate Change Impacts in Nigeria. Journal of Human Ecology, Vol. 29, No. 1, Pp. 47-55.
- Offor, I. F., Adie, G. U., and Ana, G. R. E.E. (2016). Review of Particulate Matter and Elemental Composition of Aerosols at Selected Locations in Nigeria from 1985-2015.Journal of Health and Pollution Vol. 6, No. 10 Pp.1-18.
- Oghenetega, O. B., Ojengbede, O. A., Okunlola, M. A and Ana, GREE. (2021) Oil pollution and its impact on communities in the Niger Delta: a qualitative research approach; African Journal of Medicine and Medical Sciences, Vol. 50, No. 1.
- Ogolo, N.A., Ugwu, P., Ukut, I., Otokpa, M., and Onyekonwu, M. (2018) Rain Water Quality Evaluation in a Typical Gas Flaring Environment in the Niger Delta. Paper presented at the SPE Nigeria Annual International Conference and Exhibition, Lagos, Nigeria, August 2018, Paper Number: SPE-193398-MS. [CrossRef]
- Ogwu, F. A., Ajayi A.P., Aliyu, H. B., and Nuzhat, A. (2015) An Investigative Approach on the Effect of Air Pollution on Climate Change and Human Health in the Niger Delta Region of Nigeria. International Journal of Scientific Research and Innovative Technology Vol. 2 No. 5; Pp.1-13.
- Ojekunle, Z. O., Jinadu O. O. E., Afolabi, T. A. and Taiwo, A. M. (2018) Environmental Pollution and Related Hazards at Agbara Industrial Area, Ogun State. Nature Scientific Report, Vol. 8, Issue 6482, www.nature.com/scientificreports. [CrossRef]
- Ojiodu, C. C. Okuo, J. M and Olumayede, E. G. (2013) Volatile organic compounds. VOCs. pollution in Iganmu industrial area, Lagos State, Southwestern – Nigeria. Scholarly Journals of Biotechnology Vol. 2.4., Pp. 43-49, http://www.scholarly-journals.com/SJB ISSN 2315-6171.
- Ojo, O.O. S. and Awokola, O.S. (2012) Investigation of Air Pollution from Automobiles at Intersections on Some Selected Major Roads in Ogbomosho, South Western, Nigeria. Journal of Mechanical and Civil Engineering Volume 1, Pp. 31-35, www.iosrjournals.org.
- Okolo, V.N., Olowolafe, E. A., Akawu, I., and Okoduwa, S.I.R. (2016) Effects of Industrial Effluents on Soil Resource in Challawa Industrial Area, Kano, Nigeria. Journal of Global Ecology and Environment 5.1.: 1-10, International Knowledge Press.
- Oksanen, E., and Kontunen-soppela, S. (2020). Plants have Different Strategies to Defend Against Air Pollutants, Current Opinion in Environmental Science and Health. [CrossRef]
- Olusola, J.A, Shote AA, Ouigmane A, and Isaifan RJ. (2021). The impact of COVID-19 pandemic on nitrogen dioxide levels in Nigeria. PeerJ 9: e11387. [CrossRef]
- Oluwole, A.F., Akeredolu, F.A., Ogunsola, O.J., Obioh, I.B., Asubiojo, I.O., Baumbach, G., and Vogt, U. (1994). Measurement of Traffic Related Air Pollutants at Urban Location in Nigeria. 3rd International Symposium “Transport and Air Pollution” /3c Colloque Intern, 6th to 10th June 1994 Poster Proceedings/Actes posters 37, Bron, France.
- Oudin, A., Aström, D. O., Asplund, P., Steingrimsson, S., Szabo, Z., and Carlsen, H. K. (2018). The Association between Daily Concentrations of Air Pollution and Visits to a Psychiatric Emergency Unit: A Case-Crossover Study. Journal of Environmental Health, Vol. 17, Issue 4, Pp. 2-9. [CrossRef]
- Ouédraogo, A.R., Ouedraogo, J. R. P. Ouoba, S., Ozoh, O.B., Traoré, A.N., Sourabié, A., Boncoungou, K., Ouédraogo, G., Badoum, G., and Ouedraogo, M. (2021). Short-Term Effects of Ambient air Pollution on Pediatric Hospital Visits for Respiratory Diseases in Ouagadougou, Burkina Faso. [CrossRef]
- Oyebanji, F., Ana, G.R.E.E., Tope-Ajayi, O., Sadiq, A., and Mijinyawa, Y. (2021) Air Quality Indexing, Mapping and Principal Components Analysis of Ambient Air Pollutants around Farm Settlements across Ogun State, Nigeria. Applied Environmental Research 43.2., 93-105. [CrossRef]
- Pandit, J., and Sharma, A. K. (2020). A Review of Effects of Air Pollution on Physical and Biochemical Characteristics of Plants. 8.3., 1684–1688.
- Papazian, S., and Blande, J.D. (2018). Dynamics of Plant Responses to Combinations of Air Pollutants, Plant Biology, Review Article. [CrossRef]
- Pathak, V., Tripathi, B.D., and Mishra, V.K. (2008). Dynamics of traffic noise in a tropical city Varanasi and its abatement through vegetation. Environ. Monit. Assess. 146, 67–75.
- Paul, L. A., Burnett, R.T., Kwong, J.C. Hystad, P., Donkelaar, A., Bai, L., Goldberg, M. S., Lavigne, E., Copes, R. Martin, R. V., Kopp, A., and Chen, H. (2020). The Impact of Air Pollution on the Incidence of Diabetes and Survival among Prevalent Diabetes Cases. 134. [CrossRef]
- Popek, R., Gawro_nska, H., Wrochna, M., Gawronski, S.W., and Sæbø, A. (2013). Particulate Matter on Foliage of 13 Woody Species: Deposition on Surfaces and Phytostabilisation in Waxes - A 3-year Study. Int. J. Phytoremediation 15, 245e256. [CrossRef]
- Price Water Copper, (2015) Report on Lagos: City of Opportunities an Investor's Guide.
- Pu, H., Luo, K., Wang, P., Wang, S., and Kang, S. (2016) Spatial variation of air quality index and urban driving factors linkages: evidence from Chinese cities. Environmental Science and Pollution Research. [CrossRef]
- Pugh, T.A.M., MacKenzie, A.R., Whyatt, J.D., Hewitt, C.N. (2012). Effectiveness of Green Infrastructure for Improvement of Air Quality in Urban Street Canyons. Environ. Sci. Technol. 46, 7692e7699. [CrossRef]
- Qiao, H.,Yang, L., Xixi, F., Pan, M., Ang, S., Mingya, W., and Mingshi, W. (2021) Pollution Effect Assessment of Industrial Activities on Potentially Toxic Metal Distribution in Windowsill Dust and Surface Soil in Central China. Science of the Total Environment, Vol. 759, 144023. [CrossRef]
- Rai, PK., and Panda LLS. (2014). Leaf Dust Deposition and Its Impact on Biochemical Aspect of Some Roadside Plants of Aizawl, Mizoram. International Research Journal of Environment Science; 3.11.:14-19.
- Ramanathan, V.; Crutzen, P. J.; Kiehl, J.T.; Rosenfeld, D. (2001). Aerosols Science, 294, 2119-2124.
- Ranjan, O.; Menon J.S; and Nagendra, S.M.S. (2016). Assessment of Air Quality Impacts on Human Health and Vegetation at an Industrial Area. Journal of Hazardous, Toxic, and Radioactive Waste, Vol. 20, Issue 4. [CrossRef]
- Requia, W. J., and Koutrakis, P. (2018). Mapping distance-decay of premature mortality attributable to PM2.5 - related traffic congestion. Environmental Pollution, 243, 9–16. [CrossRef]
- Richards, D. R., Fung T. K., Belcher, R. N., and Edwards P. J. (2020). Differential Air Temperature Cooling Performance of Urban Vegetation Types in The Tropics, Urban Forestry and Urban Greening, Vol. 50, 126651. [CrossRef]
- Rodriguez-Alvarez, A. (2021) Air pollution and life expectancy in Europe: Does investment in renewable energy matter? Science of the Total Environment 792. [CrossRef]
- Rogers, C. D. (2017) How Do Factories Pollute the Air, livestrong.com.
- Roy, A., Bhattacharya, T., and Kumari, M. (2020). Air pollution tolerance, metal accumulation and dust capturing capacity of common tropical trees in commercial and industrial sites. Science of the Total Environment, 722. [CrossRef]
- Saadat, M.N., Das, S., Nandy, S., Pandey, D., Chakraborty, M., Mina, U., and Sarkar, A. (2021). Can the nation-wide COVID-19 lockdown help India identify region-specific strategies for air pollution? Spat. Inf. Res. [CrossRef]
- Saini, R., Taneja, A., and Singh, P. (2017). Surface ozone scenario and air quality in the north-central part of India. Journal of Environmental Sciences, 59, 72–79. [CrossRef]
- Salau, O. R. (2016) The Changes in Temperature and Relative Humidity in Lagos State, Nigeria. World Scientific News, Vol. 49, No. 2, Pp. 295-306, available at worldscientificnews.com.
- Salvador, S., and Salvador, E. (2012) Air Quality Communication Workshop https://www.epa.gov/sites/production/files/2014-05/documents/zell-aqi.pdf.
- Samek, L., Stegowski, Z., and Furman, L. (2017). Quantitative Assessment of PM2.5 Sources and Their Seasonal Variation in Krakow. [CrossRef]
- Sánchez-Triana, E., Enriquez, S., Afzal, J., Nakagawa, A., and Khan, A. S. (2014). Cleaning Pakistan’s Air- Policy Options to Address the Cost of Outdoor Air Pollution. International Bank for Reconstruction and Development / The World Bank. [CrossRef]
- Saud, B., and Paudel, G. (2018). The Threat of Ambient Air Pollution in Kathmandu, Nepal.
- Senaul, H. and Singh, R.B. (2017). Air Pollution and Human Health in Kolkata, India: Department of Geography, Delhi School of Economics, University of Delhi, Delhi 110007.
- She, Q., Peng, X., Xu, Q., Long, L., Wei, N., Liu, M., and Jia, W. (2017). Air quality and its response to satellite-derived urban form in the Yangtze River Delta, China. Ecological Indicators, 75, 297–306. [CrossRef]
- Shehzad, K., Xiaoxing, L., Ahmad, M., Majeed, A., Tariq, F., and Wahab, S. (2021). Does air pollution upsurge in megacities after Covid-19 lockdown? A spatial approach, Environmental Research 197. [CrossRef]
- Singh, A. (2020). Impact of Air Pollutants on Plant Metabolism and Antioxidant Machinery. In: Saxena P., Srivastava A., eds. Air Pollution and Environmental Health. Environmental Chemistry for a Sustainable World, Vol 20. Springer, Singapore. [CrossRef]
- Singh, R.B., Das, U. C., Prasad, B.B. and Jha, S.K. (2002). Monitoring of dust pollution by leaves,”Pollution Research 21: 13 – 16.
- Siti, N. F. A, Azimah, I., Hafizan, J., Badlishah, A., Fathurrahman, L., Noor, M. H., Nadiana, A., Munirah, A. Z., Tengku, A. T. M., Hafriz, F. H., Raja, I. S. R. M., Jef, R. A. J., and Safari, M.D. (2022) Chemical composition of rainwater harvested in East Malaysia. Environ. Eng. Res. 2022 Research Article. [CrossRef]
- Siudek, P. (2018). Total Carbon and Benzo, A. Pyrene in Particulate Matter Over a Polish Urban Site – A Combined Effect of Major Anthropogenic Sources and Air Mass Transport. Journal of Atmospheric Pollution Research. Science Direct., Vol. 9, Issue 4, Pp. 764-773. [CrossRef]
- Sokan-Adeaga, A.A. and Ana, GR.E.E. (2015) A comprehensive review of biomass resources and biofuel production in Nigeria: potential and prospects; Journal Reviews on Environmental Health; De Gruyter. [CrossRef]
- South West Investment Exhibition and Summit, (2017) Report, Fodion Consultants.
- Srimuruganandam, B, and Nagendra S. (2012). Source characterization of PM10 and PM2.5 mass using a chemical mass balance model at urban roadside. Sci Total Environ; 433:8–19.
- State of Global Air, (2018). The Health Effects Institute. HEI, www.stateofglobalair.org.
- Sternberg, T., Viles, H., Cathersides, A., and Edwards, M. (2010). Dust Particulate Absorption by Ivy. Hedera helix L. on Historic Walls in Urban Environments. Sci. Total Environ. 409, 162e168. [CrossRef]
- Subramani, S, and Devaanandan, S. (2015). Application of Air Pollution Tolerance Index in Assessing the Air Quality. International Journal of Pharmacy and Pharmaceutical Sciences; 7.7.:216-221.
- Surinder, D. and Verma, V. (2016). Annual and Seasonal Variations in Air Quality Index of The National Capital Region, India. World Academy of Science, Engineering and Technology. International Journal of Environmental and Ecological Engineering Vol. 10, No. 10, Pp. 1-6.
- Swami, A. and Chauhan, D. (2015). Impact of Air Pollution Induced by Automobile Exhaust Pollution on Air Pollution Tolerance Index on Few Species of Plants. International Journal of Scientific Research; 4.3.:342-343.
- Taiwo, A.M, Arowolo T.A., Abdullahi K.L. and Taiwo O.T. (2015). Particulate Matter Pollution in Nigeria, A Review, Proceedings of the 14th International Conference on Environmental Science and Technology Rhodes, Greece, 3-5.
- Tao, Y., Zhang, Z., Ou, W., Guo, J., and Pueppke, S.G. (2020). How Does Urban Form Influence PM2.5 Concentrations: Insights From 350 Different-Sized Cities in The Rapidly Urbanizing Yangtze River Delta Region of China, 1998–2015, Vol. 98, 102581. [CrossRef]
- Tawari, C.C and Abowei, J.F.N. (2012) Air Pollution in the Niger Delta Area of Nigeria. International Journal of Fisheries and Aquatic Sciences Vol.1, No.2, Pp.94-117.
- Thakur, A. (2017). Study of Ambient Air Quality Trends and Analysis of Contributing Factors in Study of Ambient Air Quality Trends and Analysis of Contributing Factors in Bengaluru, India. [CrossRef]
- Tran, T. N.; Tran, N. B.; Tran, H. M. T.; Tang, H. K.; Ngo, X. M.; Godin, I.; Michel, O.; and Bouland, C. (2020). Influence of type of dwelling on the prevalence of chronic respiratory diseases in Ho Chi Minh City, Vietnam, The International Journal of Tuberculosis and Lung Disease, Vol.24, No. 3, Pp. 316-320.5. [CrossRef]
- Tripathi, A.K and Gautam, M. (2007). Biochemical Parameters of Plants as Indicators of Air Pollution. Journal of Environmental Biology; 28.1:127-132.
- Uka, U. N., Hogarh, J., and Belford, E. J. D. (2017). Morpho-Anatomical and Biochemical Responses of Plants to Air Pollution. 7.1., 1–11. [CrossRef]
- Umoh, V., Peters, E., Erhabor, G., Ekpe, E., and Ibok, A. (2013) Indoor Air pollution and Respiratory Symptoms among Fishermen in the Niger delta of Nigeria, African Journal of Respiratory Medicine, Vol. 9 No. 1. Pp.1-5.
- Umoh, V., Peters, E., Erhabor, G., Ekpe, E., and Ibok, A. (2013). Indoor Air pollution and Respiratory Symptoms among Fishermen in the Niger delta of Nigeria, African Journal of Respiratory Medicine, Vol. 9 No. 1. Pp.1-5.
- UNEP (2016). The Emissions Gap Report United Nations Environment Programme, UNEP., Nairobi.
- Valavanidis, A, Fiotakis K, Vlachogianni, T. (2008). Airborne particulate matter and human health: toxicological assessment and importance of size and composition of particles for oxidative damage and carcinogenic mechanisms. J Environ Sci Health C Environ Carcinog Ecotoxicol Rev; 26.4.:339–62.
- Wagh, N. D., Shukla, P. V, and Ingle, S. T. (2006). Biological monitoring of roadside plants exposed to vehicular pollution in Jalgaon city Biological monitoring of roadside plants exposed to vehicular pollution in Jalgaon city. Journal of Environmental Biology, 27.2.419-421.
- Wang, B., Sun, S., and Duan, M. (2015). Impacts of Building Form on The Wake Flow Wind Potential. Energy Procedia, 153, 383-388.
- Wei, C., Lei Y., and Haimeng, Z. (2015). Seasonal Variations of Atmospheric Pollution and Air Quality in Beijing.
- WeiJian, L., YunSong X., WenXin L., QingYang L., ShuangYu, Y., Yang L., Xin W., and Shu T. (2018). Oxidative Potential of Ambient PM2.5 in the Coastal Cities of the Bohai Sea, Northern China: Seasonal Variation and Source Apportionment. Environmental Pollution 236, 514-528. [CrossRef]
- Weli, V. E and Adegoke, J. O. (2016) the Influence of Meteorological Parameters and Land use on the Seasonal Concentration of Carbon Monoxide CO, in the Industrial Coastal City of Port Harcourt, Nigeria. Journal of Pollution Effluent Control Vol.4, Pp. 171. [CrossRef]
- Weli, V. E. (2014). Spatial and Seasonal Variations in Atmospheric Pollutants Concentrations in Port Harcourt Nigeria. PhD Thesis. Department of Geography, Faculty of Science, University of Ibadan, Nigeria.
- West, J. J., Cohen, A. Dentener, F., Brunekreef, B. Zhu, T., Armstrong, B., Bell, M.L, Brauer, M., Carmichael, G., Costa, D.L, Dockery, D. W., Kleeman, M., Krzyzanowski, M., Künzli, N. C., Lung, S.C, Randall V. M, Pöschl, U., Arden C., P, Roberts, J.M, Russell, A.G and Wiedinmyer, C. (2016) What We Breathe Impacts Our Health: Improving Understanding of the Link between Air Pollution and Health. Environ. Sci. Technol., Vol. 50, No. 10, Pp. 4895–4904. [CrossRef]
- WHO (2021) Global Air Quality Guidelines. Particulate matter .PM2.5 and PM10., ozone, nitrogen dioxide, sulfur dioxide and carbon monoxide. Geneva: World Health Organization .CC BY-NC-SA 3.0 IGO; https://creativecommons.org/licenses/by-nc-sa/3.0/igo.
- Witters, K., Plusquin, M., Slenders, E., Aslam, I., and Ameloot, M. (2020). Monitoring Indoor Exposure to Combustion-Derived Particles Using. 266. [CrossRef]
- World Bank Group (2016) The Cost of Air Pollution, Strengthening the Economic Case for Action, English, Washington, D.C: Working Paper, 108141. Available online: http://documents.worldbank.org/curated/en/781521473177013155/ The-cost-of-air-pollution-strengthening-the-economic-case-for-action.
- World Health Organization (2016) Ambient air pollution: A global assessment of exposure and burden of disease.
- World Health Organization (2018) CCAC Report, http://www.who.int/airpollution/data/household-energy-database/en/.
- World Health Organization Report (2010) Preventing Disease through Healthy Environments, Exposure to Air Pollution, A Major Public Health Concern.
- Xianghua, W. (2010). Industrial Pollution, Point Sources of Pollution: Local Effects and its Control, Encyclopedia of Life Support Systems, EOLSS., Vol. I. Beijing, China.
- Xiaoguo, W., Yueyue, D., Shoubiao, Z., and Ye, T. (2018). Temporal Characteristic and Source Analysis of PM 2.5 in the Most Polluted City Agglomeration of China, Journal of Research, Turkish National Committee for Air Pollution Research and Control, Production and hosting by Elsevier B.V.
- Xiaolin, X., Zhang, A., Liang, S., Qingwen, Qi, Jiang, L., and Yanjun, Ye. (2017). The Association between Air Pollution and Population Health Risk for Respiratory Infection: A Case Study of Shenzhen, China, Int. J. Environ. Res. Public Health, Vol.14, and Pp.950. [CrossRef]
- Xin, B.; Jun, X.; Xiao-Hui D.; QianQian, G., RuiQing, Z., Jun, T., BoFeng, C., LongFei, W., Ma FangShu, M., and BeiHai, Z. (2017). Impacts Assessment of Steel Plants on Air Quality over Beijing-Tianjin-Hebei Area, China Environmental Science 2017 Vol. 37, No.5 pp.1684-1692.
- Xing L; Zhi G; Hub J; Hua C; and Xing, X. (2022) The impact of environmental accountability on air pollution: A public attention perspective; Energy Policy, Vol. 161, 112733. [CrossRef]
- Yang, J., Fu, Q., Guo, X., and Wang, Y. (2015). Concentrations and Seasonal Variation of Ambient PM2.5 and Associated Metals at a Typical Residential Area in Beijing, 232–239. [CrossRef]
- Yang, J., Shi, B., Shi, Y., Marvin, S., Zheng, Y., and Xia, G. (2019). Air Pollution Dispersal in High Density Urban Areas: Research on the Triadic Relation of Wind, Air Pollution, and Urban Form. Sustainable Cities and Society, 101941. [CrossRef]
- Yan-ju, L and Hui, D. (2008). Variation in air pollution tolerance index of plant near a steel factory: implications for landscape plant species selection for industrial areas. Environment, Development; 1:24-30.
- Yusuf, M. A., and Abiye, T. A. (2019) Groundwater for Sustainable Development Risks of groundwater pollution in the coastal areas of Lagos, South Western Nigeria. Groundwater for Sustainable Development, 100222. https://doi.org /10.1016/ j.gsd.2019.100222.
- Zagha, O. and Nwaogazie, I. L. (2015) Roadside Air Pollution Assessment in Port-Harcourt, Nigeria, Standard Scientific Research and Essays Vol. 3, No. 3: Pp.066-074.ISSN: 2310-7502 http://www.standresjournals.org/journals/SSRE.
- Zhang, Y., Ding, A., Mao, H., Nie, W., and Zhou, D. (2015). Impact of synoptic weather patterns and inter-decadal climate variability on air quality in the North China Plain during 1980 e 2013. Atmospheric Environment, 1–10. [CrossRef]
Figure 2.
Monthly variation in fine particulate matter across selected industrial locations in Lagos state. Source: Field Survey (2021).
Figure 2.
Monthly variation in fine particulate matter across selected industrial locations in Lagos state. Source: Field Survey (2021).
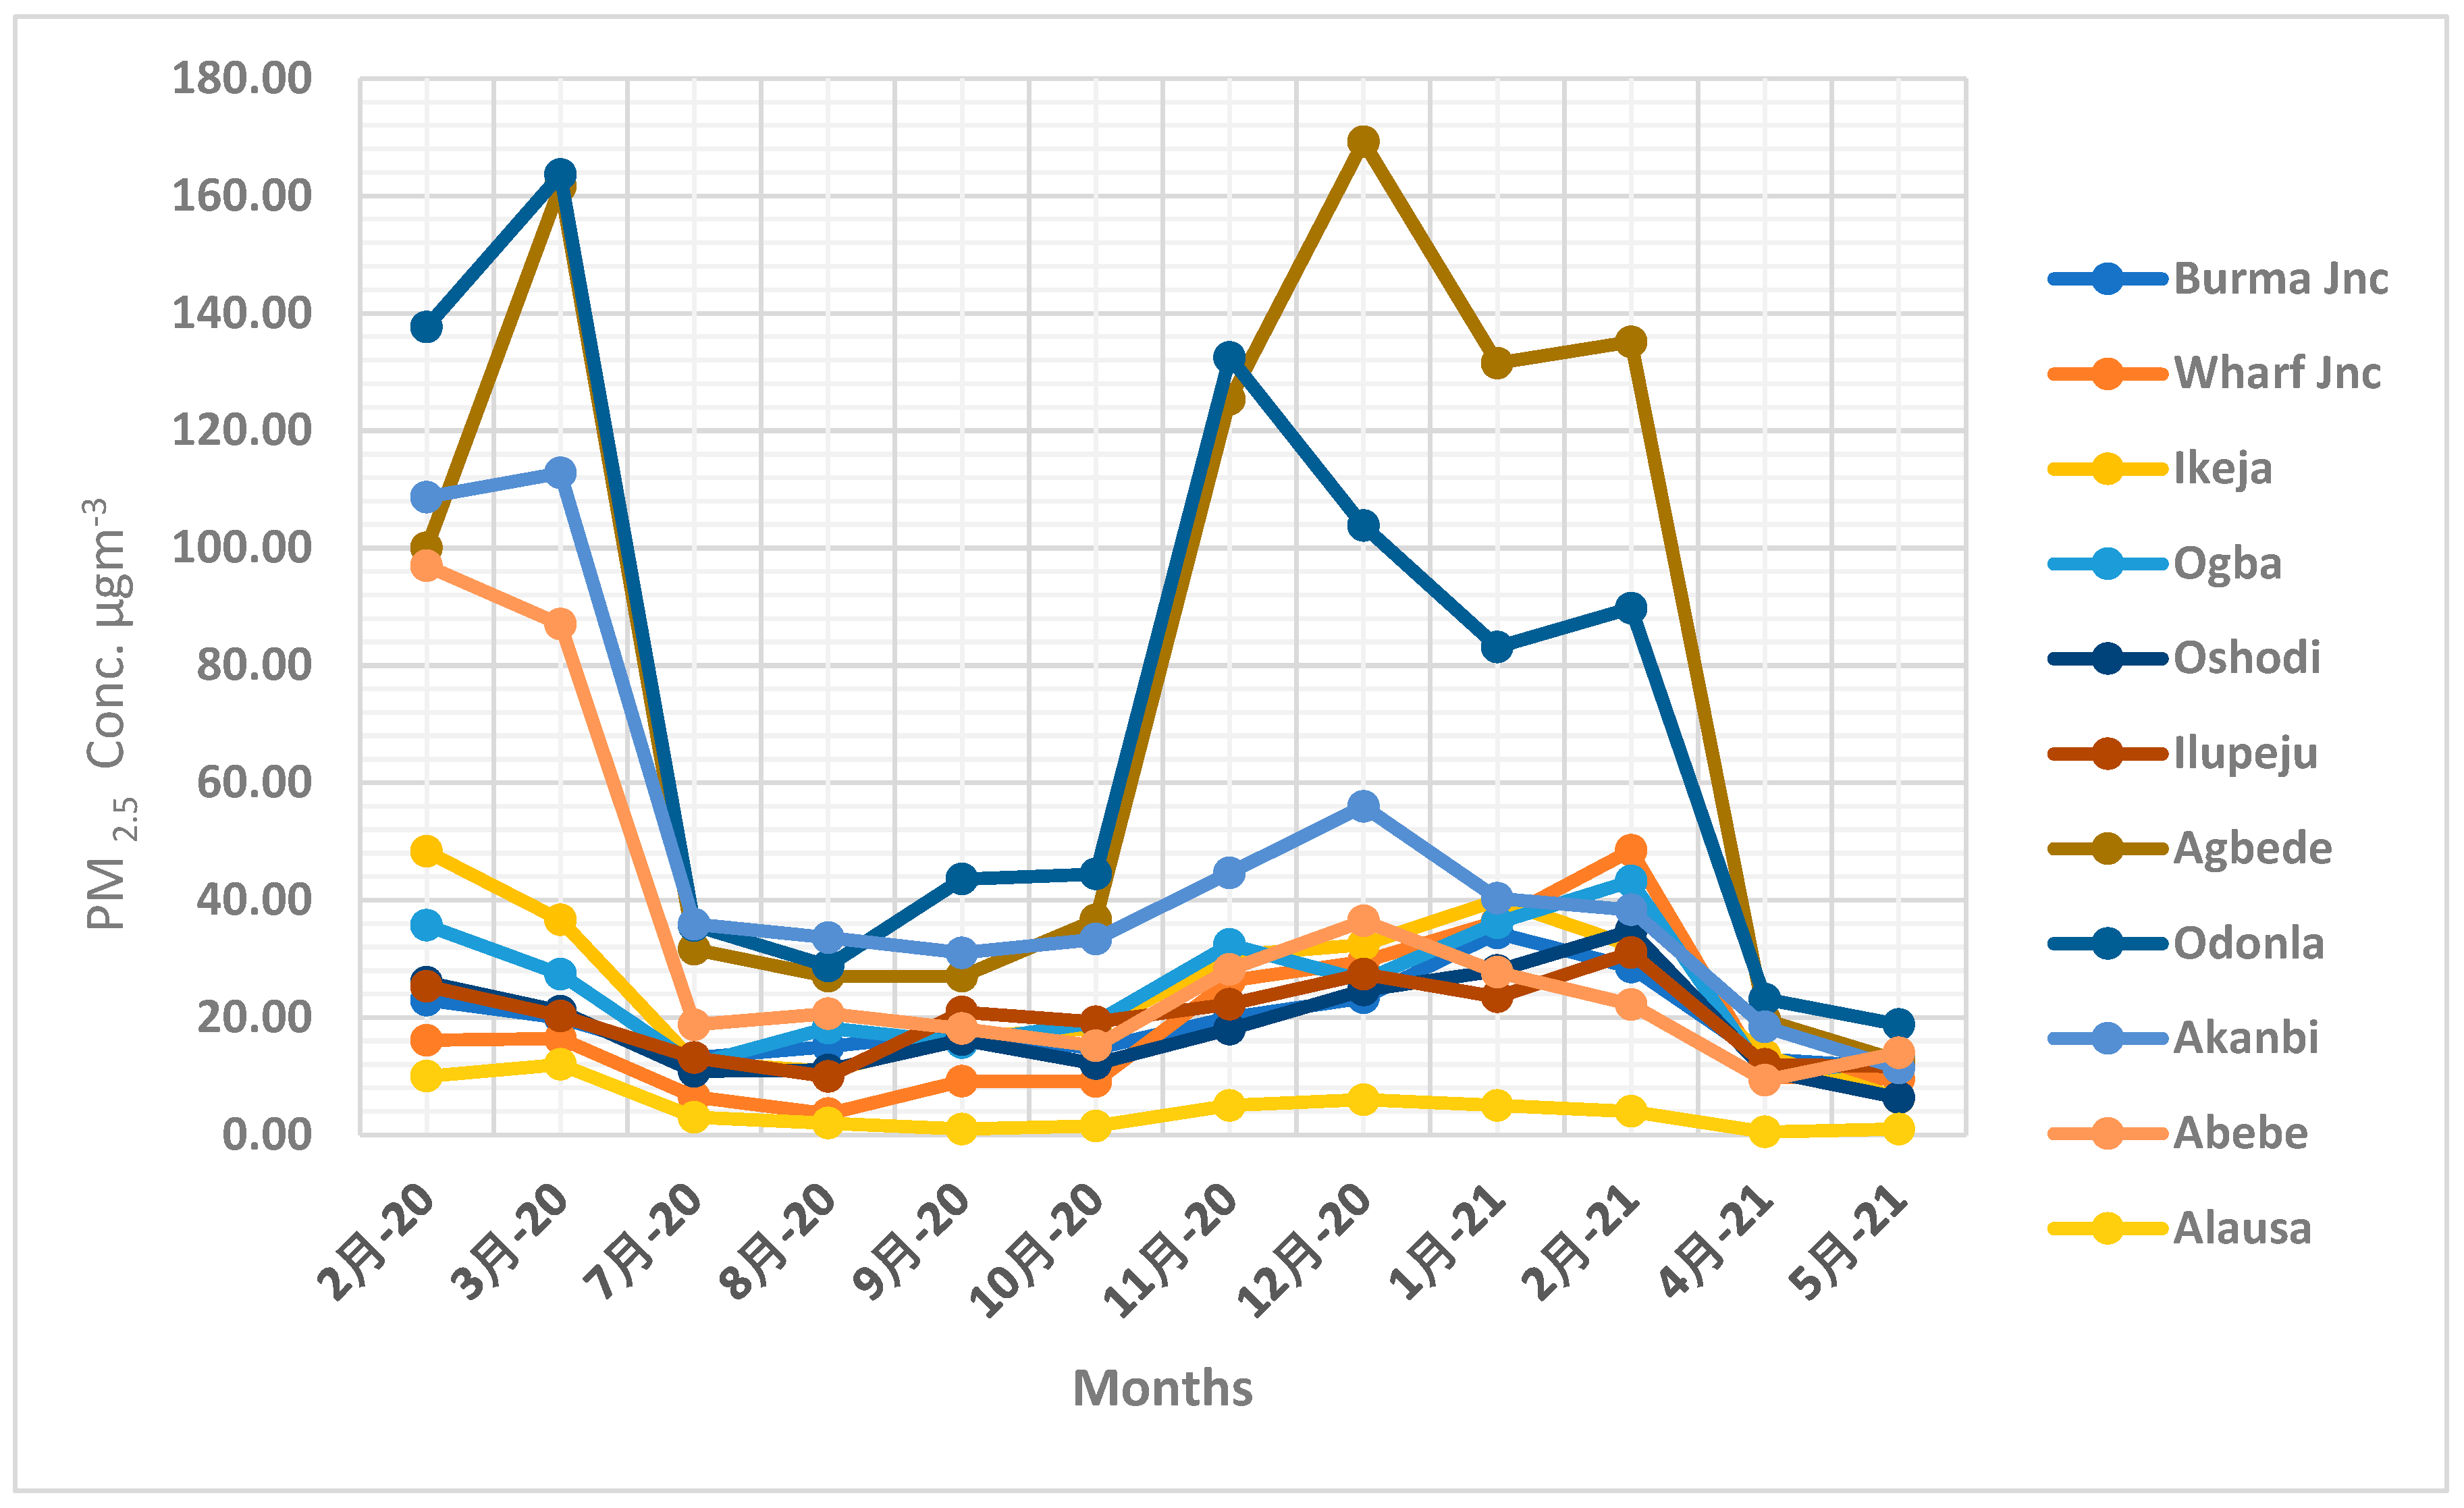
Figure 3.
Monthly variation in carbon(ii)oxide levels across selected industrial locations in Lagos state. Source: Field Survey (2021).
Figure 3.
Monthly variation in carbon(ii)oxide levels across selected industrial locations in Lagos state. Source: Field Survey (2021).
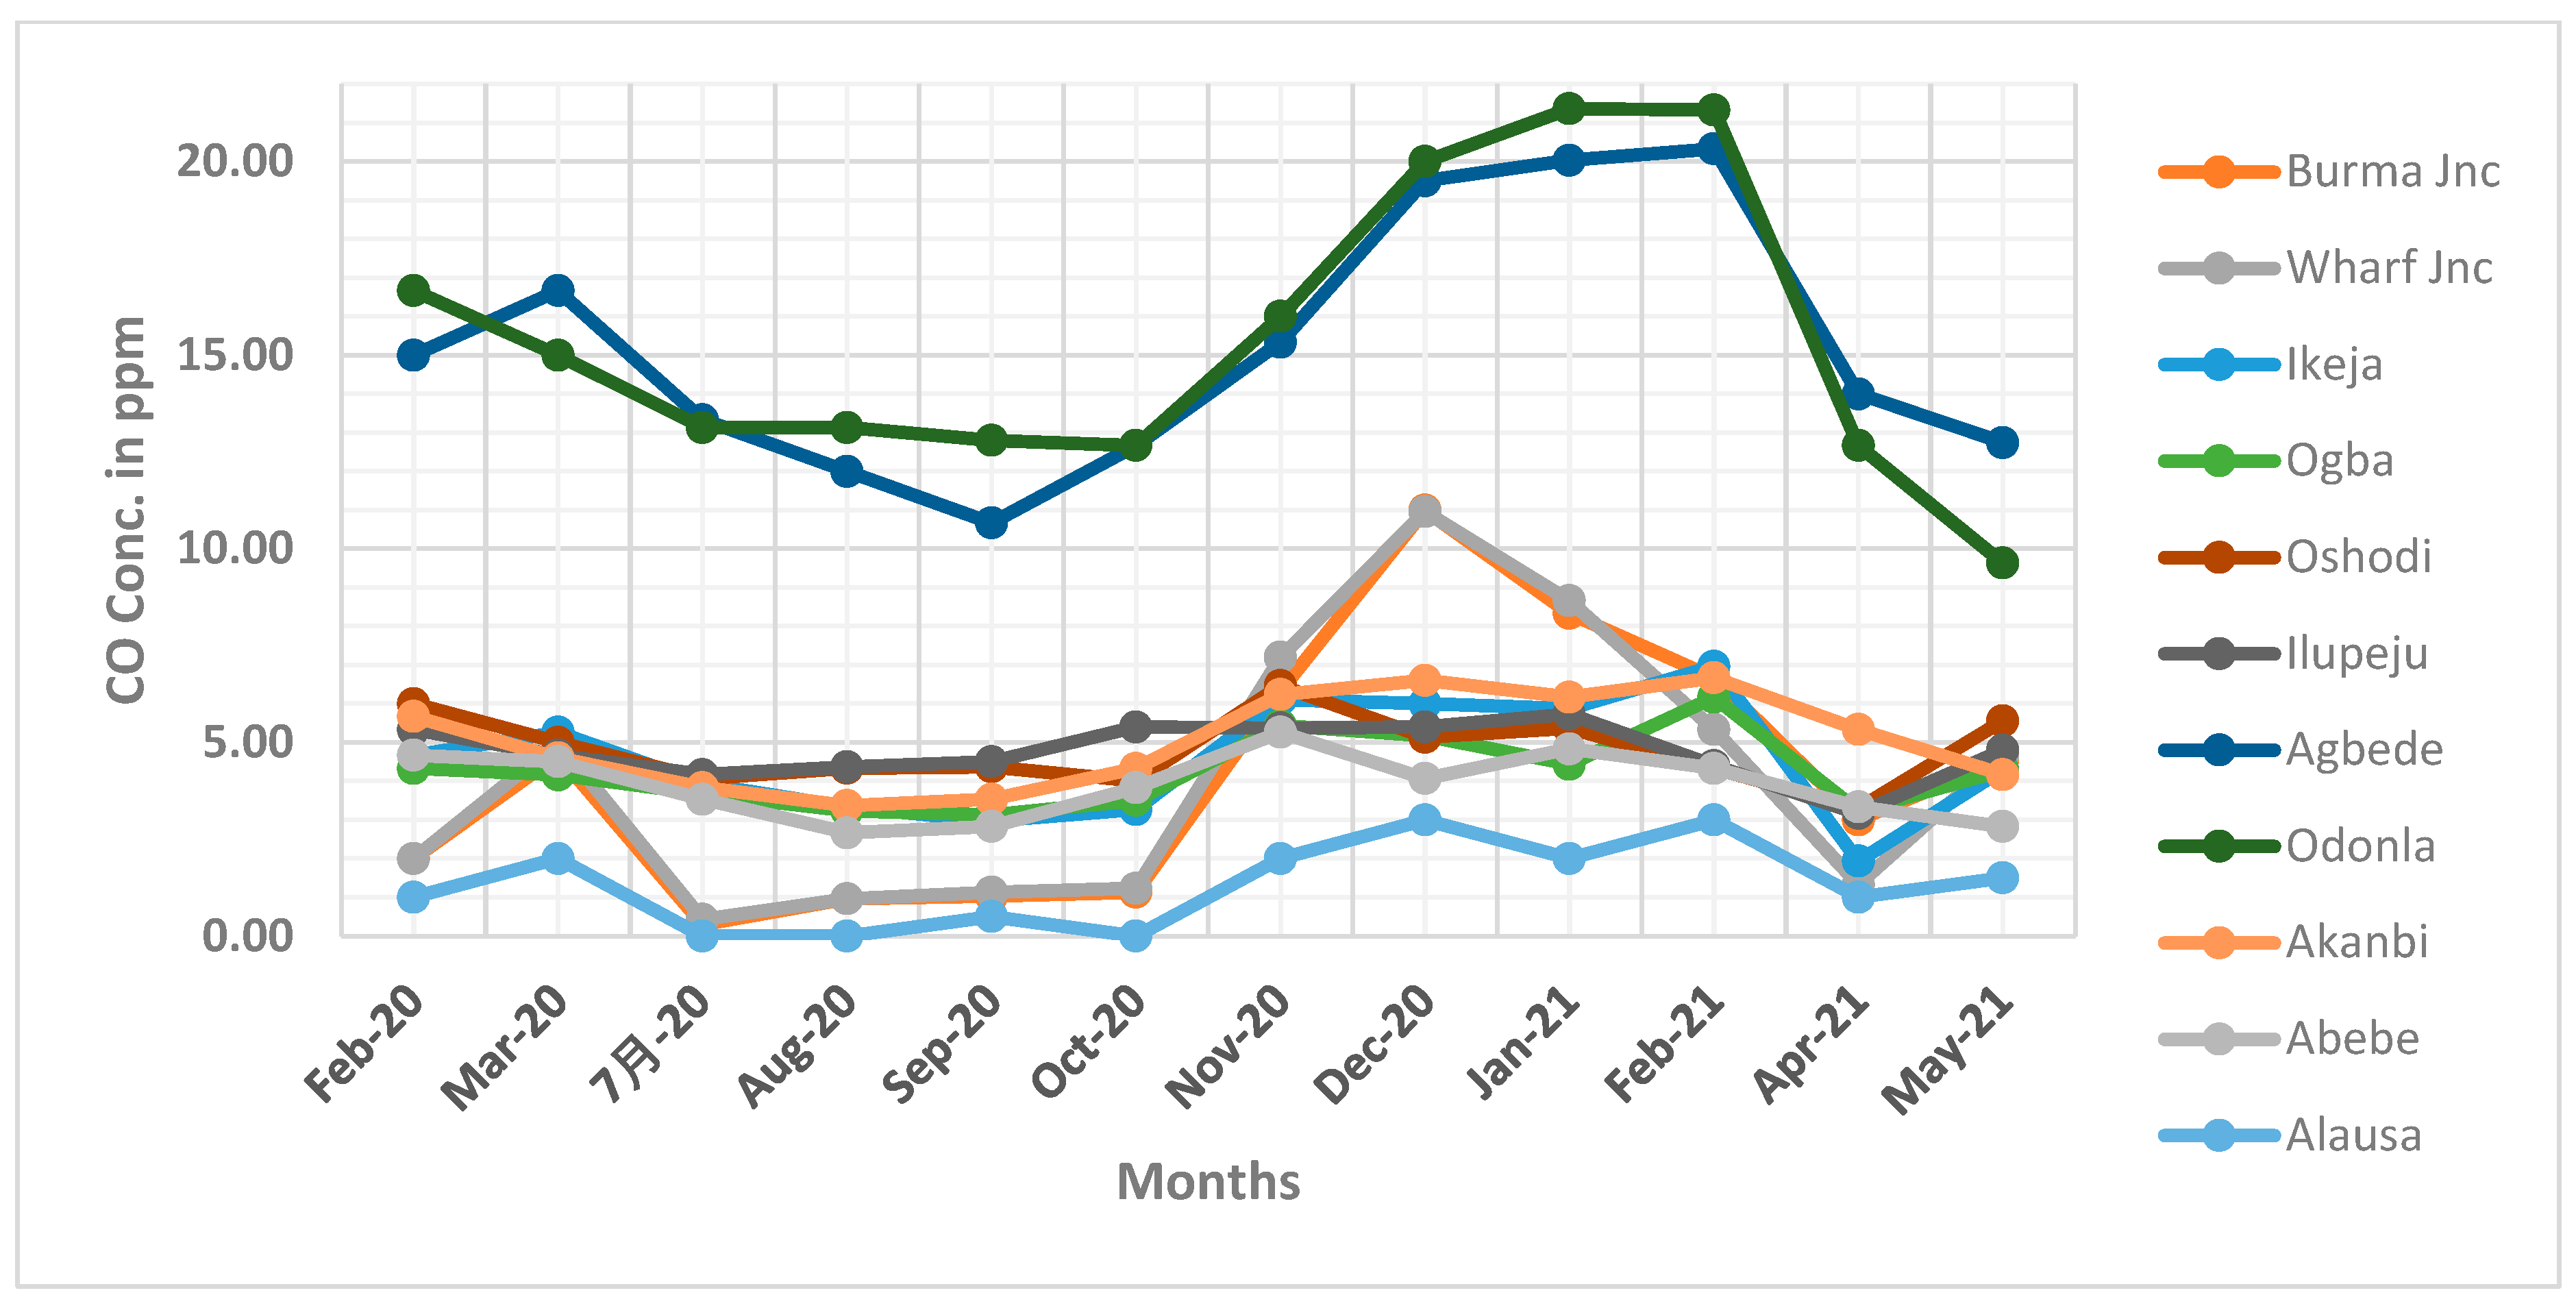
Figure 4.
Monthly variation in nitrogen(iv)oxide levels across selected industrial locations in Lagos state Source: Field Survey (2021).
Figure 4.
Monthly variation in nitrogen(iv)oxide levels across selected industrial locations in Lagos state Source: Field Survey (2021).
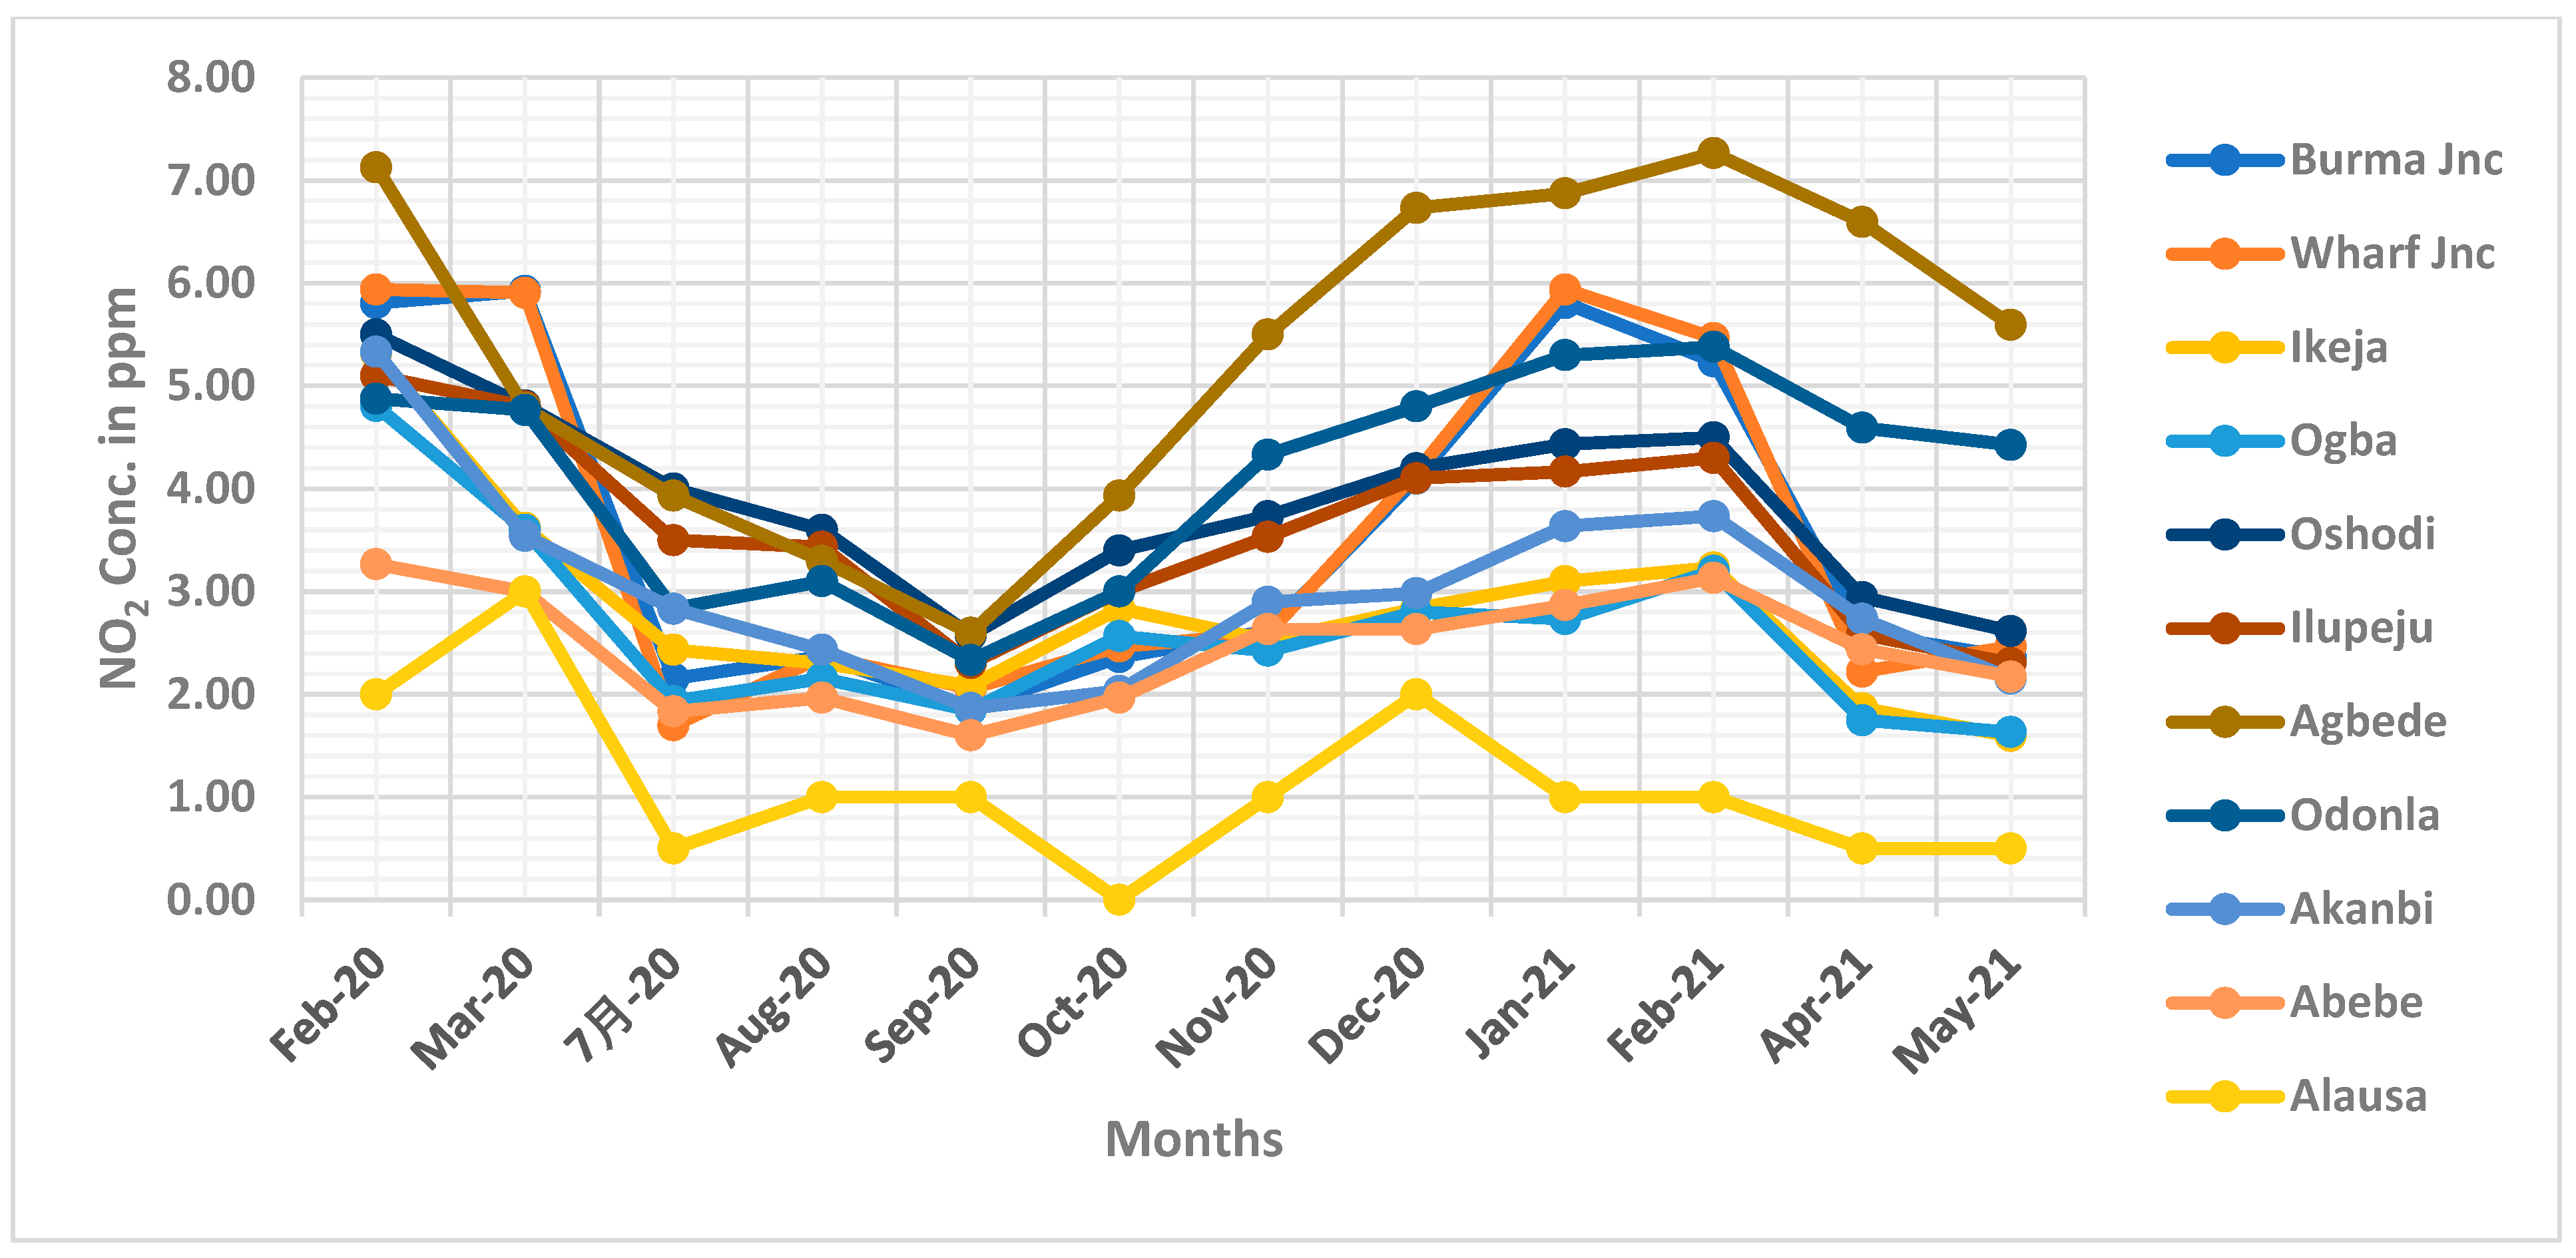
Figure 5.
Monthly variation in sulfur(iv)oxide level across selected industrial locations in Lagos state. Source: Field Survey (2021).
Figure 5.
Monthly variation in sulfur(iv)oxide level across selected industrial locations in Lagos state. Source: Field Survey (2021).
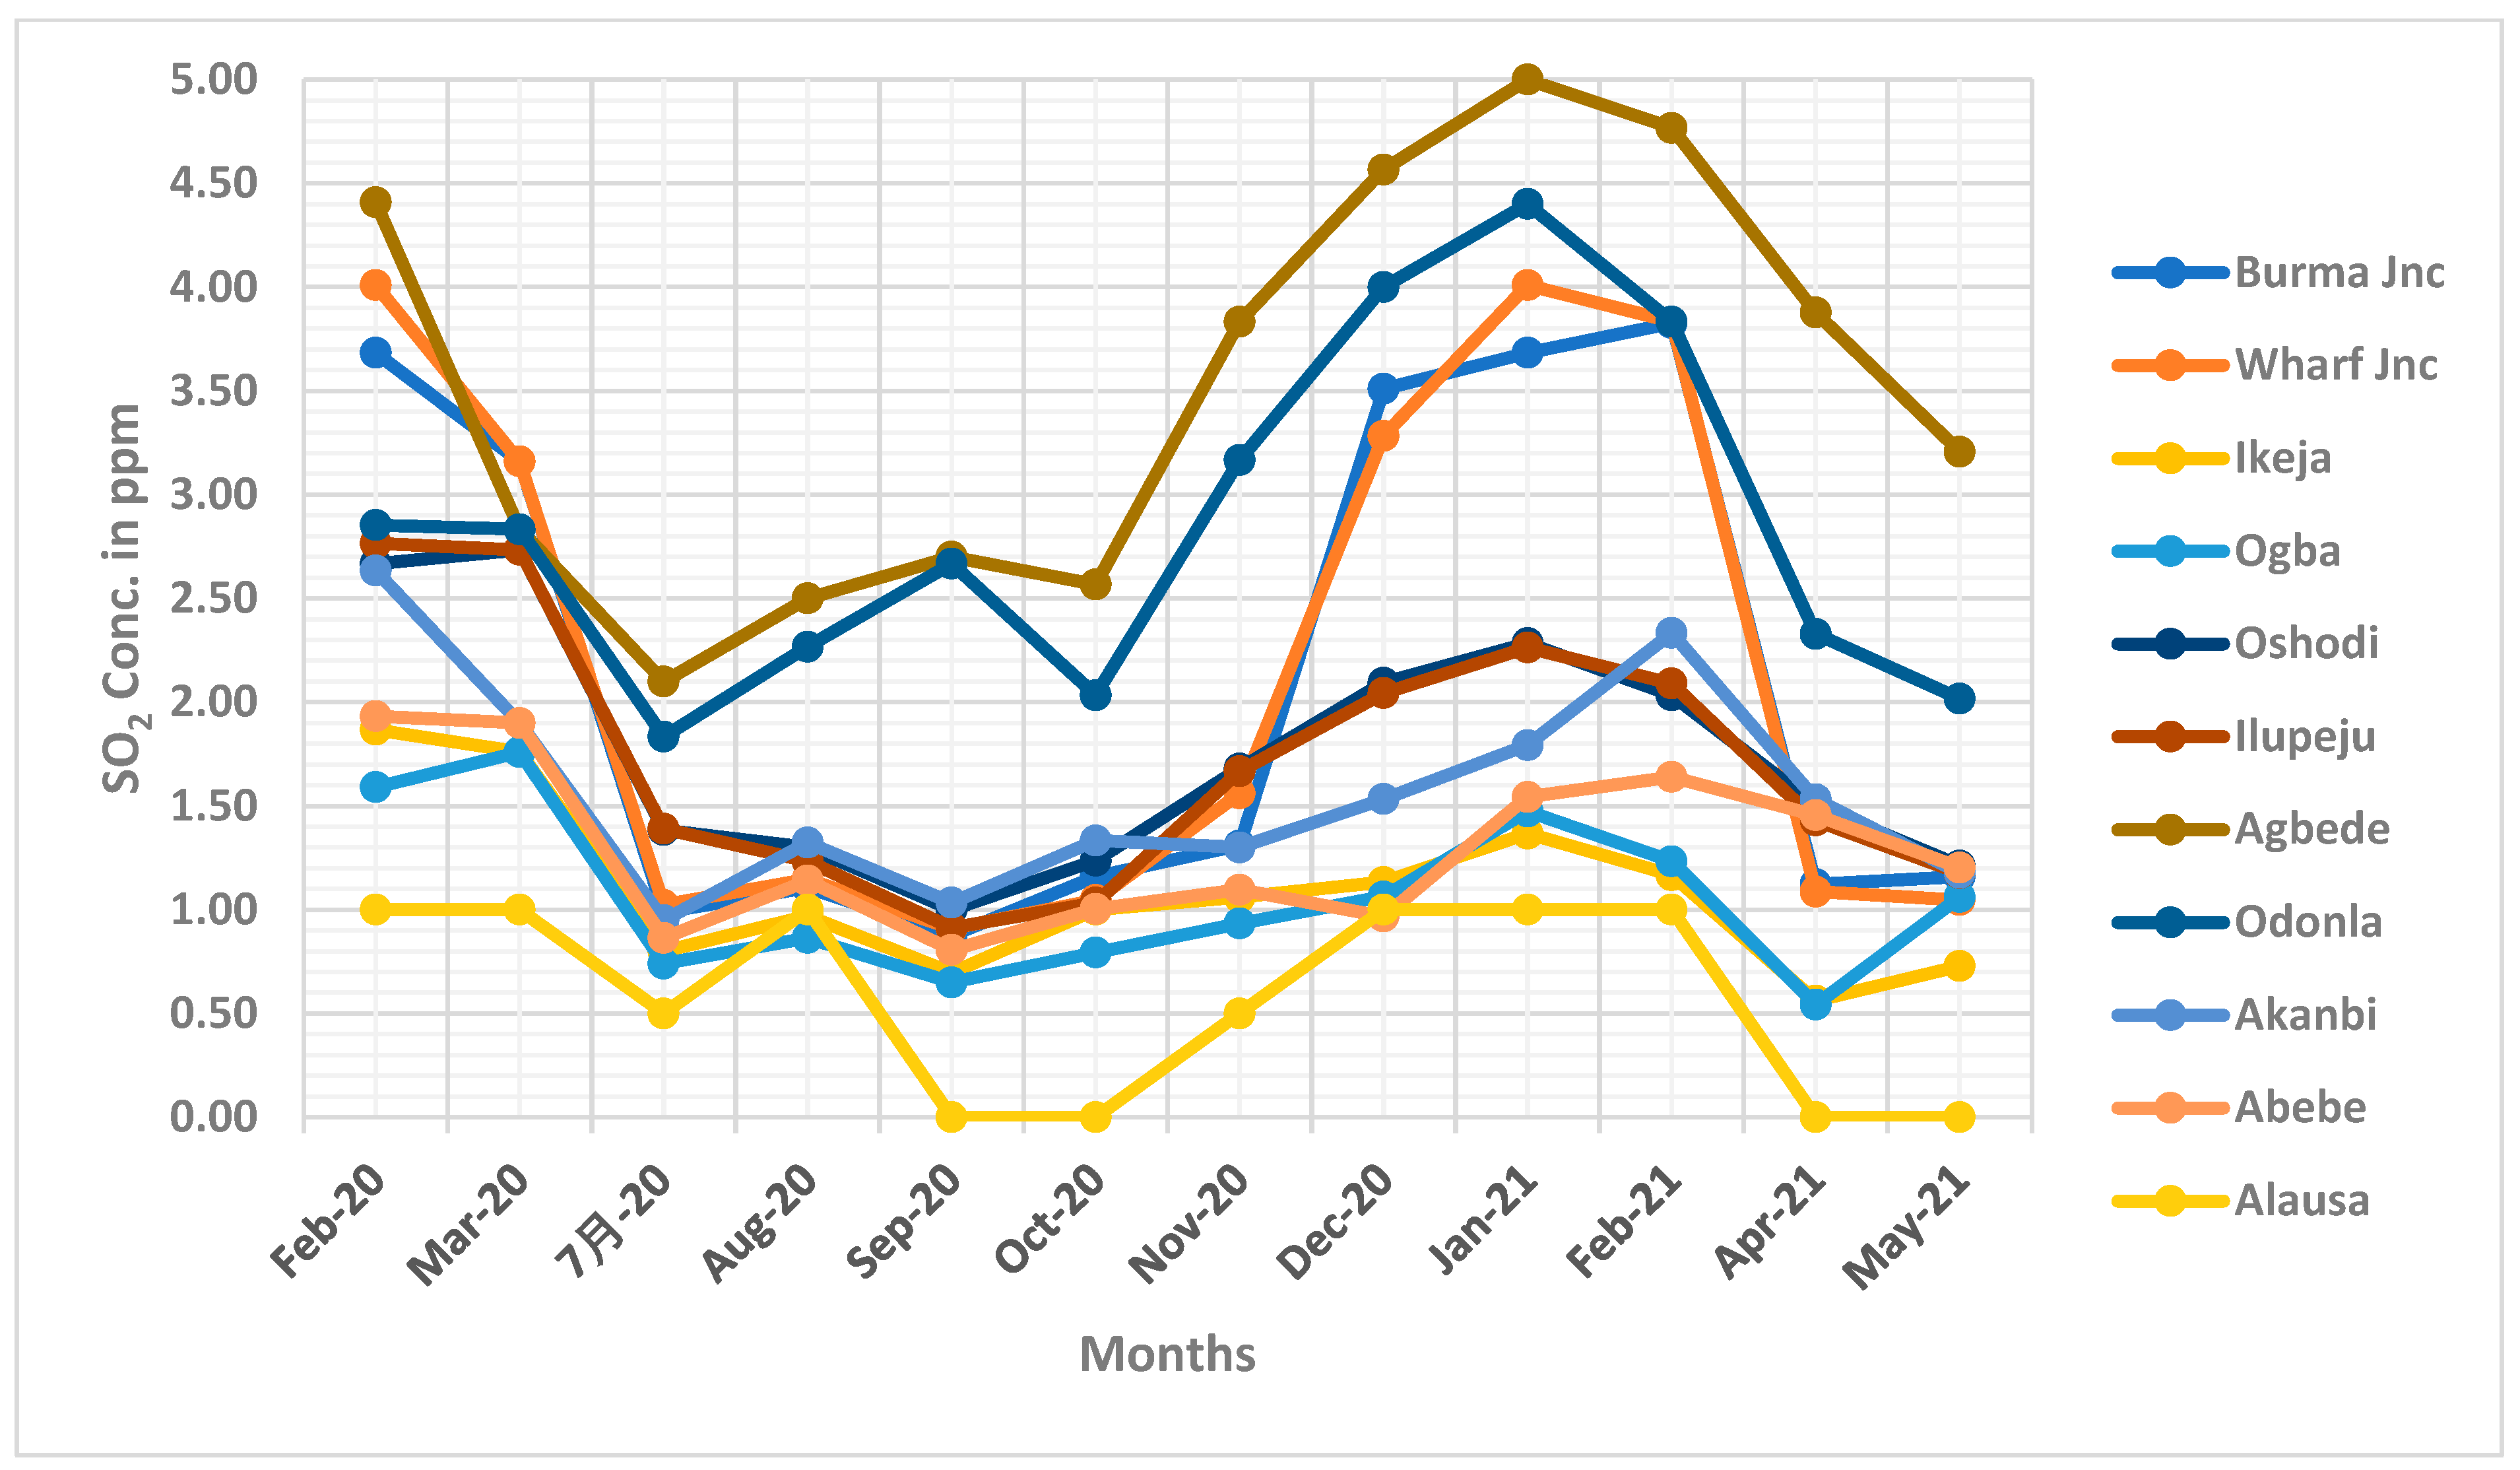
Table 2.
Monthly variation in ambient air pollutant levels.
| ANOVA | ||||||
| Sum of Squares | df | Mean Square | F | Sig. | ||
| SO2 | Between Groups | 47.897 | 11 | 4.354 | 5.103 | .000 |
| Within Groups | 92.157 | 108 | .853 | |||
| Total | 140.054 | 119 | ||||
| NO2 | Between Groups | 110.649 | 11 | 10.059 | 8.805 | .000 |
| Within Groups | 123.388 | 108 | 1.142 | |||
| Total | 234.036 | 119 | ||||
| CO | Between Groups | 341.300 | 11 | 31.027 | 1.320 | .223 |
| Within Groups | 2538.233 | 108 | 23.502 | |||
| Total | 2879.533 | 119 | ||||
| PM2.5 | Between Groups | 44891.032 | 11 | 4081.003 | 3.897 | .000 |
| Within Groups | 113088.662 | 108 | 1047.117 | |||
| Total | 157979.695 | 119 | ||||
Source: Field Survey (2021).
Table 3.
Seasonal variation in ambient pollutant levels.
| t-test for Equality of Means | ||||||||
| t | df | Sig. (2-tailed) | Mean Difference | Std. Error Difference | 95% Confidence Interval of the Difference | |||
| Lower | Upper | |||||||
| SO2 Season | Equal variances assumed | 3.013 | 18 | .007 | 1.14500 | .38006 | .34652 | 1.94348 |
| NO2 Season | Equal variances assumed | 4.042 | 18 | .001 | 1.65200 | .40866 | .79344 | 2.51056 |
| CO Season | Equal variances assumed | 1.432 | 18 | .169 | 3.00300 | 2.09720 | -1.40304 | 7.40904 |
| PM2.5 Season | Equal variances assumed | 2.798 | 18 | .012 | 36.91900 | 13.19497 | 9.19741 | 64.64059 |
Source: Field Survey, (2021).
Table 4.
Relationship between seasonal ambient air pollutant concentration, meteorological parameters, and seasonal hospital-based respiratory conditions.
Table 4.
Relationship between seasonal ambient air pollutant concentration, meteorological parameters, and seasonal hospital-based respiratory conditions.
| Predictors | β | t | ρ- value | Results |
| SO2 | 140.13 | .309 | .763 | Not supported |
| NO2 | -303.07 | -.929 | .373 | Not supported |
| CO | 217.83 | 2.568 | .026* | Supported |
| PM2.5 | -2.577 | -.293 | .775 | Not supported |
| Temperature | -318.47 | -1.629 | .132 | Not supported |
| Relative Humidity | -11.308 | -2.220 | .048* | Supported |
| Precipitation | 65.217 | 1.478 | .167 | Not supported |
| Wind Speed | 33.584 | .186 | .856 | Not supported |
| ANOVA | F (8,11) | 3.652 | 0.025* | |
| R2 | 0.726 |
ρ < 0.05*; Dependent variable: Hospital-based respiratory conditions. Regression weight; Weighted by season. Source: Field Survey, (2021).
Table 5.
Relationship between monthly ambient air pollutant levels, meteorological parameters, and monthly hospital-based respiratory conditions.
Table 5.
Relationship between monthly ambient air pollutant levels, meteorological parameters, and monthly hospital-based respiratory conditions.
| Predictors | β | t | ρ- value* | Results |
| SO2 | 25.777 | 1.049 | .297 | Not supported |
| NO2 | -48.874 | -2.835 | .005* | Supported |
| CO | 6.045 | 1.627 | .107 | Not supported |
| PM2.5 | 1.361 | 2.998 | .003* | Supported |
| Temperature | 7.036 | 1.128 | .262 | Not supported |
| Relative Humidity | 6.214 | 4.359 | .000* | Supported |
| Precipitation | -.082 | -.730 | .467 | Not supported |
| Wind Speed | -21.379 | -2.384 | .019* | Supported |
| ANOVA | F (8,111) | 8.315 | 0.000* | |
| R2 | 0.375 |
ρ < 0.05*; Dependent variable: Hospital-based respiratory conditions. Regression weight; Weighted by month . Source: Field Survey, (2021).
Disclaimer/Publisher’s Note: The statements, opinions and data contained in all publications are solely those of the individual author(s) and contributor(s) and not of MDPI and/or the editor(s). MDPI and/or the editor(s) disclaim responsibility for any injury to people or property resulting from any ideas, methods, instructions or products referred to in the content. |
© 2025 by the authors. Licensee MDPI, Basel, Switzerland. This article is an open access article distributed under the terms and conditions of the Creative Commons Attribution (CC BY) license (http://creativecommons.org/licenses/by/4.0/).
Copyright: This open access article is published under a Creative Commons CC BY 4.0 license, which permit the free download, distribution, and reuse, provided that the author and preprint are cited in any reuse.


