
Submitted:
12 November 2024
Posted:
13 November 2024
You are already at the latest version
Abstract
Human health is at risk when particulate matter levels reach a certain threshold, and determining these levels is crucial for mitigating environmental pollution. Since there is a lack of data in this field of study, it is anticipated that this work will provide stakeholders with data. On the basis of this supposition, an Airly sensor was used to assess the air quality at a location in Mafoluku, Lagos, Nigeria. Following the manufacturer's instructions, the installation was done at a height of 1.8 meters above the ground. Outdoor PM1, PM2.5, PM10, PM ratios, toxicity potentials (T/P), climatic factors, and their correlations were measured during a two-month period. The findings indicate that the levels of PM10, PM2.5, and PM1 were 36.12 μg/m3 (equivalent to 80.7% of the WHO annual limit), 34.83 μg/m3 (equivalent to 232.23% of the WHO annual limit), and 34.39 μg/m3 (no limit for the calculation), respectively. The corresponding average ratios were 0.98, 0.95, and 0.93. The majority of T/P values were greater than 1, which suggests that there are health risks to the area's most vulnerable residents. Winds from the southwestern desert influenced the air mass, and WHO limits are often exceeded. The study suggests stakeholders focus on problem reduction to mitigate air pollution risks.
Keywords:
Airly sensor
; WHO
; specific threshold
; particulate matter
; human health
1. Introduction
A major threat to public health is ambient air pollution, of which particulate matter [1,2] is one of the air contaminants with the greatest proof of health effects. Of these, fine particulate matter (PM10, PM2.5, PM1), which have aerodynamic diameters of less than 10, 2.5, and 1 micrometers, are the appropriate indicators for urban air quality [3] and have been identified risk factors for health. They breach the lung's defenses, enter the bloodstream, and compromise the blood-brain barrier, leading to neurological, cardiovascular, and respiratory disorders as well as early mortality [4,5,6].
Though their spatial coverage is typically constrained, data from ground monitors is favored for analysis globally. Many attempts have been made to measure PM2.5 concentrations using alternative techniques, such as satellite-based imaging and atmospheric chemistry models, in order to get around this issue. These techniques, however, are meant to supplement surface ground-monitored data rather than completely replace it [7]. To fully utilize the advantages of each data source and provide more accurate estimates of PM2.5 concentrations on a large scale, it is recommended to integrate data from satellite imaging, ground-based monitors, and other models [8]. Lagos has not yet been the subject of this kind of study.
A thorough analysis of the most recent research shows that ambient PM concentrations in Lagos and other places have produced a range of findings. Table 1 illustrates how the location, season, time period, and year of measurement all affect the PM concentrations. Satellite data was utilized in one article, although it wasn't calibrated using ground-level readings [9]. Other studies [10,11,12,13,14,15] gathered PM data using air samplers for brief periods of time, typically less than three months. The average yearly PM concentration in Lagos cannot be calculated using these attempts because of their short-term nature. The tools utilized are shown in Table 1 as follows: Microglass fiber, purpleAir sensor, Aerosol Mass Monitor, AQMesh, P-sensor, and handheld air tester (CW-HAT 200), in that order. No Airly low-cost sensor (LCS) was used in any of the studies.
There is currently no trustworthy estimate of the effects of ambient air pollution in Lagos using Airly LCS, particularly in the Mafoluku neighborhood, despite mounting worries about the city's air pollution problems. By giving a concise summary of the ambient PM10, PM2.5, and PM1 pollution using Airly LCS and the toxicity potential of the region, this report fills in these gaps.
2. Materials and Methods
Sampling location Mafoluku, Lagos, in the Southwest area of Nigeria (6o33'32.1'' N 3o19'35.5'') was the urban site where the air quality was evaluated (Figure 1). The study is being conducted in Lagos, the former capital of Nigeria. It has both domestic and international airports, businesses, marketplaces, office and residential buildings, and a lot of traffic, both people and cars. Garbage is produced here. Residents have had trouble disposing of these trash. From this point of view, there is a reason for pollution from all the different activities. There is a lack of data in the Mafoluko area, Oshodi, where this study was conducted.
Meteorology of Lagos, Nigeria
One of the world's most crowded cities is Lagos, the former capital of Nigeria. There are almost 9 million people living in the 1,171.28 km2 area. Lagos is situated on the Atlantic Ocean coast in Southwest Nigeria at 6°27′18′′N 3°23′03′′E. It is Nigeria's industrial and commercial hub. Nigeria generally has high temperatures and a humid climate. Nigeria has two distinct seasons based on its weather: the wet (raining) season (November to March) and the dry (harmattan) season (April to October). Lagos experiences hot, dry summers and moderate winters due to its Mediterranean climate. June through August is the ideal time osf year to visit Lagos if you enjoy the sun. With an average daily high of 28 oC and an average low of 19 degrees, July is the hottest month of the year.
Assessment
Using the standard particulate matter assessment technique, an assessment of air quality indicators was carried out from September to November of 2024. Data was collected in real time for a whole day. Figure 2 displays the Airly Sensor (GSM-PM-PTH 2965, Poland) that was utilized in this investigation. The sensor analyzes (real-time dashboard, report generator, social effect tracker), measures (PM1, PM2.5, and PM10) each have a resolution of ± 1 µg/m3), and impacts (air pollution warning, mobile app, forecast, and air quality map). It weighs 440g, is made of stainless steel, and may be powered by a mobile battery, solar power, or commercial energy.
The sampling interval is 1-2 seconds, while the averaging and sending intervals are 5 minutes. Map.airly.org, the Airly website, provided access to the data. Since the research area was clear of obstructions, the sensor's accuracy was good. Using the manufacturer's handbook, installing the sensor was simple. It was suspended at least 1.8 meters above the ground and connected to a standard electrical outlet. Calibrated measurements appeared on the Airly Data Platform 48 hours later. The inexpensive sensor measured wind speed, wind bearing, and pressure, among other meteorological characteristics. CSV files of the results were downloaded.
Using the following formula, the toxicity potential (TP) for PM2.5 and PM10 at the outdoor sampling site is as follows [16,17]:
In this case, Sp is the usual recommendation value of 25 μg/m3 for PM2.5 and 50 μg/m3 for PM10, while Cp is the measured concentrations of the pollutants [18]. A TP score greater than one indicates that the chosen pollutant may pose a health concern in a certain area.
Backward air-mass trajectories analysis
In order to determine the origin of the particulate matter approaching the sampling location of the residential area in Lagos, Nigeria, a backward air-mass trajectory analysis that reached Lagos at 500 meters above ground level was computed using Hybrid Single-Particle Lagrangian Trajectory (HYSPLIT, NOAA/ARL) [19].
Statistical analysis
To evaluate the data at the location, the mean and standard deviation of each air quality indicator (PM1.0, PM2.5, PM10, wind speed, wind bearing, and pressure) were computed. Statistically significant seasonal differences were evaluated at a 95% confidence level (p value = 0.05) using a paired t test. To determine whether PM levels and the meteorological parameter were related, the Pearson product correlation coefficient (r) was calculated. While Minitab software performed various computations, Excel 2013 was used to create the visual depictions.
3. Results
It is quite concerning how careless most people are with their air and air quality. Ambient air pollution has been largely caused by unmonitored human activity and noncompliance with preventive measures [12]. According to data (Table 2) gathered over a two-month period, the mean for PM10, PM2.5, and PM1 was 36.32, 34.83, and 34.39 µg/m3, respectively. For Lugbe (11.42 – 156.73 µg/m3), Lagos – Ikeja and Maryland – 22–173 [9, and Lagos Mainland – 43.34 – 127.21 μg/m3, the results are consistent with PM10 measured by Lawal and Mohammed, [12]. Although the maximum PM2.5 in this study was higher than that of Obanya et al. [10], the mean PM2.5 value (34.83 μg/m3) was higher than those reported by Alani et al. [11], Popoola et al. [14], and Yahaya et al. [13]. The study's mean results were lower than those published by Croitoru et al. [1]. The various activities, weather conditions, and assessment methods could all be contributing factors to the discrepancies. Kurtosis (11.38), Skewness (2.92), CV% (53.92), StD (18.54), and PM1 mean are 34.39 μg/m3. The lowest and greatest values were in good agreement with those of Emekwuru and Ejohwomu [20], which ranged from 3.7 to 139.3 μg/m3.
The PM10, PM2.5, and PM1 comparisons with WHO recommendations are displayed in Figure 3. Based on the averaged data for the study site, the average concentrations for PM10, PM2.5, and PM1 were determined to be 36.12 μg/m3, 34.83 μg/m3, and 34.39 μg/m3, respectively. PM2.5 was around 232.23% of the WHO air quality standard annual value (5 μg/m3), and PM10 was over 80% of the WHO air quality standard annual value (45 μg/m3). The value for PM1 was not computed since the WHO standard was not available. These values (36.12, 34.83, and 34.39 μg/m3) were higher than the annual average value from June 2021 and May 2022 at an urban site in Lagos (26 µg/m3), but they were close to the lower end of the annual mean values (from 40 to 135 μg/m3) at six sites in Lagos from August 2020 to July 2021 [21]. This implied higher local emission contributions at a particular industrial location in Lagos as opposed to the Mafoluku study site.
Particulate matter mass ratio of the PM indicators
The inter-particulate ratios were assessed in September and November to have a better knowledge of particulate matters in the outdoor environment (Figure 4). PM1.0/PM2.5, PM2.5/PM10, and PM1.0/PM10 had average ratios of 0.98, 0.95, and 0.93, respectively. In Hong Kong, Cheng et al. [22] found that PM1.0 made up a significant amount of PM2.5 and PM2.5 made up a significant fraction of PM10. According to their findings, PM1.0 accounted for 68 to 84% of PM2.5 and PM2.5 for 73 to 82% of PM10. Nonetheless, the ratios showed that mechanically generated aerosols or secondary aerosol particles contributed significantly to IAQ indicators, particularly for PM1.0 and PM2.5. During the assessment period, there was some variation in all three ratios (PM1.0/PM2.5, PM2.5/PM10, and PM1.0/PM10) at the sampling locations. The ratios do not significantly differ from one another.
Because PM1-sized particles are more likely than PM2.5 or coarse (PM10)-sized particles to enter the lungs through the nose and throat, they are researched here because they are at least as dangerous. According to the measured mean PM1/coarse particle concentration ratios (PM1/PM10), a significant fraction of the particulate concentrations in this region are caused by combustion and related processes that generate extremely small particles. Saetae et al. [15] found a ratio of 0.63, but this was over the course of 2.5 months during the dry season; these kinds of research are uncommon in this area. While fine particles are primarily created in the atmosphere by chemical reactions and organic substances, coarse particles are often created by mechanical processes like grinding or wind blowing. Accordingly, a high PM2.5/PM10 ratio suggests that fine particles, like those from combustion sources, contribute significantly to the PM concentration, while a low ratio suggests that coarse particles, like those from road dust or re-suspended soil, contribute more to the PM concentration [23].
Toxicity potential
According to Ayodele et al. [17], toxicity potential is a quantitative toxic equivalence that is helpful in determining the harmful impact that air pollution emissions from various hospital operations have on human health. A TP score greater than one indicates that the chosen pollutant may pose a health concern in a certain area. Both the annual and daily TP values of PM2.5 and PM10 were higher than 1 in the area. PM2.5's values varied from 3.6 to 30.8 per year and daily from 1.2 to 10.27, while PM10's values ranged from 1.3 to 10.32 per year and daily from 0.43 to 3.44. Because standard guidelines were not available, the TP of PM1 was not calculated (Figure 5). With the exception of a few number of instances in which the TP was less than 1, this indicated that the TP values for PM10 daily were below 1.
The association between climatic characteristics and PMs concentrations in the outdoor sampling location during the assessment periods was examined using the Pearson product-moment correlation coefficient (PCC) (r value) at a 95% significance level. The relationships between particulate matter and meteorological parameters are displayed in Table 3 and Figure 6. There was an extremely high positive connection between PM1.0, PM2.5, and PM10. Although they are weak, there are relationships between the PMs and the climatic data as well. The following is a presentation of the correlation coefficient threshold definitions that were modified from Schober et al. [24]:
Observed Correlation Coefficient, r Interpretation
0.00 to 0.10 Negligible correlation
0.10 to 0.39 Weak correlation
0.40 to 0.69 Moderate correlation
0.70 to 0.89 Strong correlation
0.90 to 1.00 Very strong correlation
The three size fractions of particulate matter (PM1.0, PM2.5, and PM10) have a strong positive connection, with r values ranging from 0.80 to 0.95 in the winter, according to comparable findings published by Abulude and Abulude [25] and Emekwuru and Ejohwomu [20].
The temporal trend of PM1, PM2.5, and PM10 concentrations during a 24-hour period is displayed in Figure 7. The mean concentrations measured hourly on various days are used to compute the trend. In general, there is a greater fluctuation in particulate matter concentration during the day than at night. On the other hand, the nighttime concentration of particulate matter is higher than the daytime concentration. The reason for this could be that the atmosphere is more stable at night because of the lower temperatures, whereas during the day the planet is warmed by sunshine, which improves atmospheric mixing. At higher elevations, PM increases [26]. Additionally, the range of PM concentrations across different altitudes decreases at night when the mixing layer height (MLH) decreases [27]. Because particulate matter may more readily travel to higher altitudes in an unstable atmosphere, the difference in particulate matter concentration at different altitudes during the day is more noticeable, even though the concentration of particulate matter is larger at night.
Backward air-mass trajectories analysis
The Hybrid Single-Particle Lagrangian Integrated Trajectory (HYSPLIT) backward trajectory model [28,29] was used to calculate the directions and distances of the sources of the air parcel over the air pollutants measurement site in this study. The simulation results show that Southwestern desert winds contributed to the air mass over the site during the assessment. This difference between higher and lower PM levels were noted at Ile Ife, which is roughly 210 kilometers northeast of the Akoka Lagos sites [30]. According to Figure 8, the low-level air mass primarily arrives from the south and travels a comparatively short distance throughout the September–November season. Natural marine aerosols are abundant in the southerly air mass (originating from the Atlantic Ocean). Lower particle concentrations were observed throughout the research period as a result of the relatively fresh air mass and heavy rainfall, which considerably reduces the washout effect.
Author Contributions
“Conceptualization, FOA. and A.A.; methodology, FOA.; software, SDO.; validation, FOA, AA, SDO.; formal analysis, SA.; investigation, FOA.; resources, SA.; data curation, SDO, SA.; writing—original draft preparation, FOA.; writing—review and editing, AA, SDO, KMA.; visualization, SA.; supervision, KMA; project administration, FOA, KMA; gift acquisition, FOA. All authors have read and agreed to the published version of the manuscript.
Funding
This research received no external funding.
Institutional Review Board Statement
Not applicable.
Informed Consent Statement
Not applicable.
Data Availability Statement
Not applicable.
Acknowledgments
The authors are grateful to Michal Misiek (Co-founder and Chief Scientist) and other team members of Airly Inc. Poland for the gift of the sensor used in the study and for the hosting of the data on their dashboard. We would like to express our gratitude to the Soremekun family for installing the sensor at their home in Mafoluku, Lagos, Nigeria.
Conflicts of Interest
The authors declare no conflicts of interest.
References
- Croitoru, L.; Chang, J.C.; Akpokodje, J. The Health Cost of Ambient Air Pollution in Lagos. J. Environ. Prot. 2020, 11, 753–765. [Google Scholar] [CrossRef]
- Aryal, A.; Harmon, A.C.; Dugas, T.R. Particulate matter air pollutants and cardiovascular disease: Strategies for intervention. Pharmacol. Ther. 2021, 223, 107890–107890. [Google Scholar] [CrossRef] [PubMed]
- Cohen, A.J.; Anderson, H.R.; Ostro, B.; Pandey, K.D.; Krzyzanowski, M.; Künzli, N.; Gutschmidt, K.; Pope, A.; Romieu, I.; Samet, J.M.; et al. The Global Burden of Disease Due to Outdoor Air Pollution. J. Toxicol. Environ. Health Part A 2005, 68, 1301–1307. [Google Scholar] [CrossRef] [PubMed]
- Profaci, C.P.; Munji, R.N.; Pulido, R.S.; Daneman, R. The blood–brain barrier in health and disease: Important unanswered questions. J. Exp. Med. 2020, 217. [Google Scholar] [CrossRef]
- Wu, D.; Chen, Q.; Chen, X.; Han, F.; Chen, Z.; Wang, Y. The blood–brain barrier: Structure, regulation and drug delivery. Signal Transduct. Target. Ther. 2023, 8, 1–27. [Google Scholar] [CrossRef]
- Guo, J.; Chai, G.; Song, X.; Hui, X.; Li, Z.; Feng, X.; Yang, K. Long-term exposure to particulate matter on cardiovascular and respiratory diseases in low- and middle-income countries: A systematic review and meta-analysis. Front. Public Heal. 2023, 11, 1134341. [Google Scholar] [CrossRef]
- Duncan, B.N.; Prados, A.I.; Lamsal, L.N.; Liu, Y.; Streets, D.G.; Gupta, P.; Hilsenrath, E.; Kahn, R.A.; Nielsen, J.E.; Beyersdorf, A.J.; et al. Satellite data of atmospheric pollution for U.S. air quality applications: Examples of applications, summary of data end-user resources, answers to FAQs, and common mistakes to avoid. Atmospheric Environ. 2014, 94, 647–662. [Google Scholar] [CrossRef]
- Diao, M.; Holloway, T.; Choi, S.; O’neill, S.M.; Al-Hamdan, M.Z.; Van Donkelaar, A.; Martin, R.V.; Jin, X.; Fiore, A.M.; Henze, D.K.; et al. Methods, availability, and applications of PM2.5 exposure estimates derived from ground measurements, satellite, and atmospheric models. J. Air Waste Manag. Assoc. 2019, 69, 1391–1414. [Google Scholar] [CrossRef]
- Abulude, F.O.; Damodharan, U.; Acha, S.; Adamu, A.; Arifalo, K.M. Preliminary Assessment of Air Pollution Quality Levels of Lagos, Nigeria. International Electronic Conference on Geosciences. LOCATION OF CONFERENCE, COUNTRYDATE OF CONFERENCE; p. 20.
- Obanya, H.E.; Amaeze, N.H.; Togunde, O.; Otitoloju, A.A. Air Pollution Monitoring Around Residential and Transportation Sector Locations in Lagos Mainland. J. Heal. Pollut. 2018, 8, 180903. [Google Scholar] [CrossRef]
- Alani, R.A.; Ayejuyo, O.O.; Akinrinade, O.E.; Badmus, G.O.; Festus, C.J.; Ogunnaike, B.A.; Alo, B.I. The level PM2.5 and the elemental compositions of some potential receptor locations in Lagos, Nigeria. Air Qual. Atmosphere Heal. 2019, 12, 1251–1258. [Google Scholar] [CrossRef]
- Lawal, H.A. and Muhammed, M. I. Atmospheric Physics; Air Pollution Monitoring and Analysis Using Purple Air Data. African Scientific Reports. 2022, 1, 123–132. [Google Scholar]
- Yahaya, T.; Umar, F.M.; Zanna, A.M.; Abdulmalik, A.; Ibrahim, B.A.; Bilyaminu, M.; Joseph, A. Concentrations and health risks of particulate matter (PM2.5) and associated elements in the ambient air of Lagos, Southwestern Nigeria. Bio-Research 2023, 21, 2141–2149. [Google Scholar] [CrossRef]
- Popoola, O.A.M.; Alani, R.; Assah, F.; Lawanson, T.; Tchouaffi, A.K.; Mapa-Tassou, C.; Blanche, N.; Odekunle, D.; Unuigboje, R.; Onifade, V.A.; et al. Assessment of the Temporal and Seasonal Variabilities in Air Pollution and Implications for Physical Activity in Lagos and Yaoundé. Atmosphere 2023, 14, 1693. [Google Scholar] [CrossRef]
- Saetae, S.; Abulude, F.O.; Ndamitso, M.M.; Akinnusotu, A.; Oluwagbayide, S.D.; Matsumi, Y.; Kanegae, K.; Kawamoto, K.; Nakayama, T. Multi-Year Continuous Observations of Ambient PM2.5 at Six Sites in Akure, Southwestern Nigeria. Atmosphere 2024, 15, 867. [Google Scholar] [CrossRef]
- Chamseddine, A.; Alameddine, I.; Hatzopoulou, M.; El-Fadel, M. Seasonal variation of air quality in hospitals with indoor–outdoor correlations. Build. Environ. 2018, 148, 689–700. [Google Scholar] [CrossRef]
- Ayodele, C.; Fakinle, B.; Jimoda, L.; Sonibare, J. Investigation on the ambient air quality in a hospital environment. Cogent Environ. Sci. 2016, 2. [Google Scholar] [CrossRef]
- World Health Organization. Occupational and Environmental Health Team. WHO Air quality guidelines for particulate matter, ozone, nitrogen dioxide and sulfur dioxide: global update 2005: summary of risk assessment. 2006. World Health Organization. https:// apps.who.int/iris/handle/10665/69477.
- Draxler RR, Hess GD. Description of the HYSPLIT 4 modeling system (NOAA technical memorandum ERL ARL-224). 2004, NOAA Air Resources Laboratory, Silver Spring.
- Arcadi, A.; Morlacci, V.; Palombi, L. Synthesis of Nitrogen-Containing Heterocyclic Scaffolds through Sequential Reactions of Aminoalkynes with Carbonyls. Molecules 2023, 28, 4725. [Google Scholar] [CrossRef]
- Odu-Onikosi, A.; Herckes, P.; Fraser, M.; Hopke, P.; Ondov, J.; Solomon, P.A.; Popoola, O.; Hidy, G.M. Tropical Air Chemistry in Lagos, Nigeria. Atmosphere 2022, 13, 1059. [Google Scholar] [CrossRef]
- Cheng, Y.; Ho, K.; Lee, S.; Law, S. Seasonal and diurnal variations of PM1.0, PM2.5 and PM10 in the roadside environment of hong kong. China Particuology 2006, 4, 312–315. [Google Scholar] [CrossRef]
- Oanh, N.K.; Upadhyay, N.; Zhuang, Y.-H.; Hao, Z.-P.; Murthy, D.; Lestari, P.; Villarin, J.; Chengchua, K.; Co, H.; Dung, N.; et al. Particulate air pollution in six Asian cities: Spatial and temporal distributions, and associated sources. Atmospheric Environ. 2006, 40, 3367–3380. [Google Scholar] [CrossRef]
- Schober, P.; Boer, C.; Schwarte, L.A. Correlation Coefficients: Appropriate Use and Interpretation. Anesth. Analg. 2018, 126, 1763–1768. [Google Scholar] [CrossRef] [PubMed]
- Abulude, F.O.; Abulude, I.A. Monitoring Air Quality in Nigeria: The Case of Center for Atmospheric Research-National Space Research and Development Agency (CAR-NASRDA). Aerosol Sci. Eng. 2021, 5, 478–498. [Google Scholar] [CrossRef]
- Faridi, S.; Shamsipour, M.; Krzyzanowski, M.; Künzli, N.; Amini, H.; Azimi, F.; Malkawi, M.; Momeniha, F.; Gholampour, A.; Hassanvand, M.S.; et al. Long-term trends and health impact of PM2.5 and O3 in Tehran, Iran, 2006–2015. Environ. Int. 2018, 114, 37–49. [Google Scholar] [CrossRef] [PubMed]
- Taghvaee, S.; Sowlat, M.H.; Mousavi, A.; Hassanvand, M.S.; Yunesian, M.; Naddafi, K.; Sioutas, C. Source apportionment of ambient PM2.5 in two locations in central Tehran using the Positive Matrix Factorization (PMF) model. Sci. Total. Environ. 2018, 628-629, 672–686. [Google Scholar] [CrossRef]
- Stein, A.F.; Draxler, R.R.; Rolph, G.D.; Stunder, B.J.B.; Cohen, M.D.; Ngan, F. NOAA’s HYSPLIT Atmospheric Transport and Dispersion Modeling System. Bull. Am. Meteorol. Soc. 2015, 96, 2059–2077. [Google Scholar] [CrossRef]
- Rolph, G.; Stein, A.; Stunder, B. Real-time Environmental Applications and Display sYstem: READY. Environ. Model. Softw. 2017, 95, 210–228. [Google Scholar] [CrossRef]
- Owoade, O.K.; Olise, F.S.; Ogundele, L.T.; Fawole, O.G.; Olaniyi, H.B. Correlation between particulate matter concentrations and meteorological parameters at a site in Ile-Ife, Nigeria. Ife J. Sci. 2012, 14, 83–93. [Google Scholar]
Figure 1.
The location of the assessment.
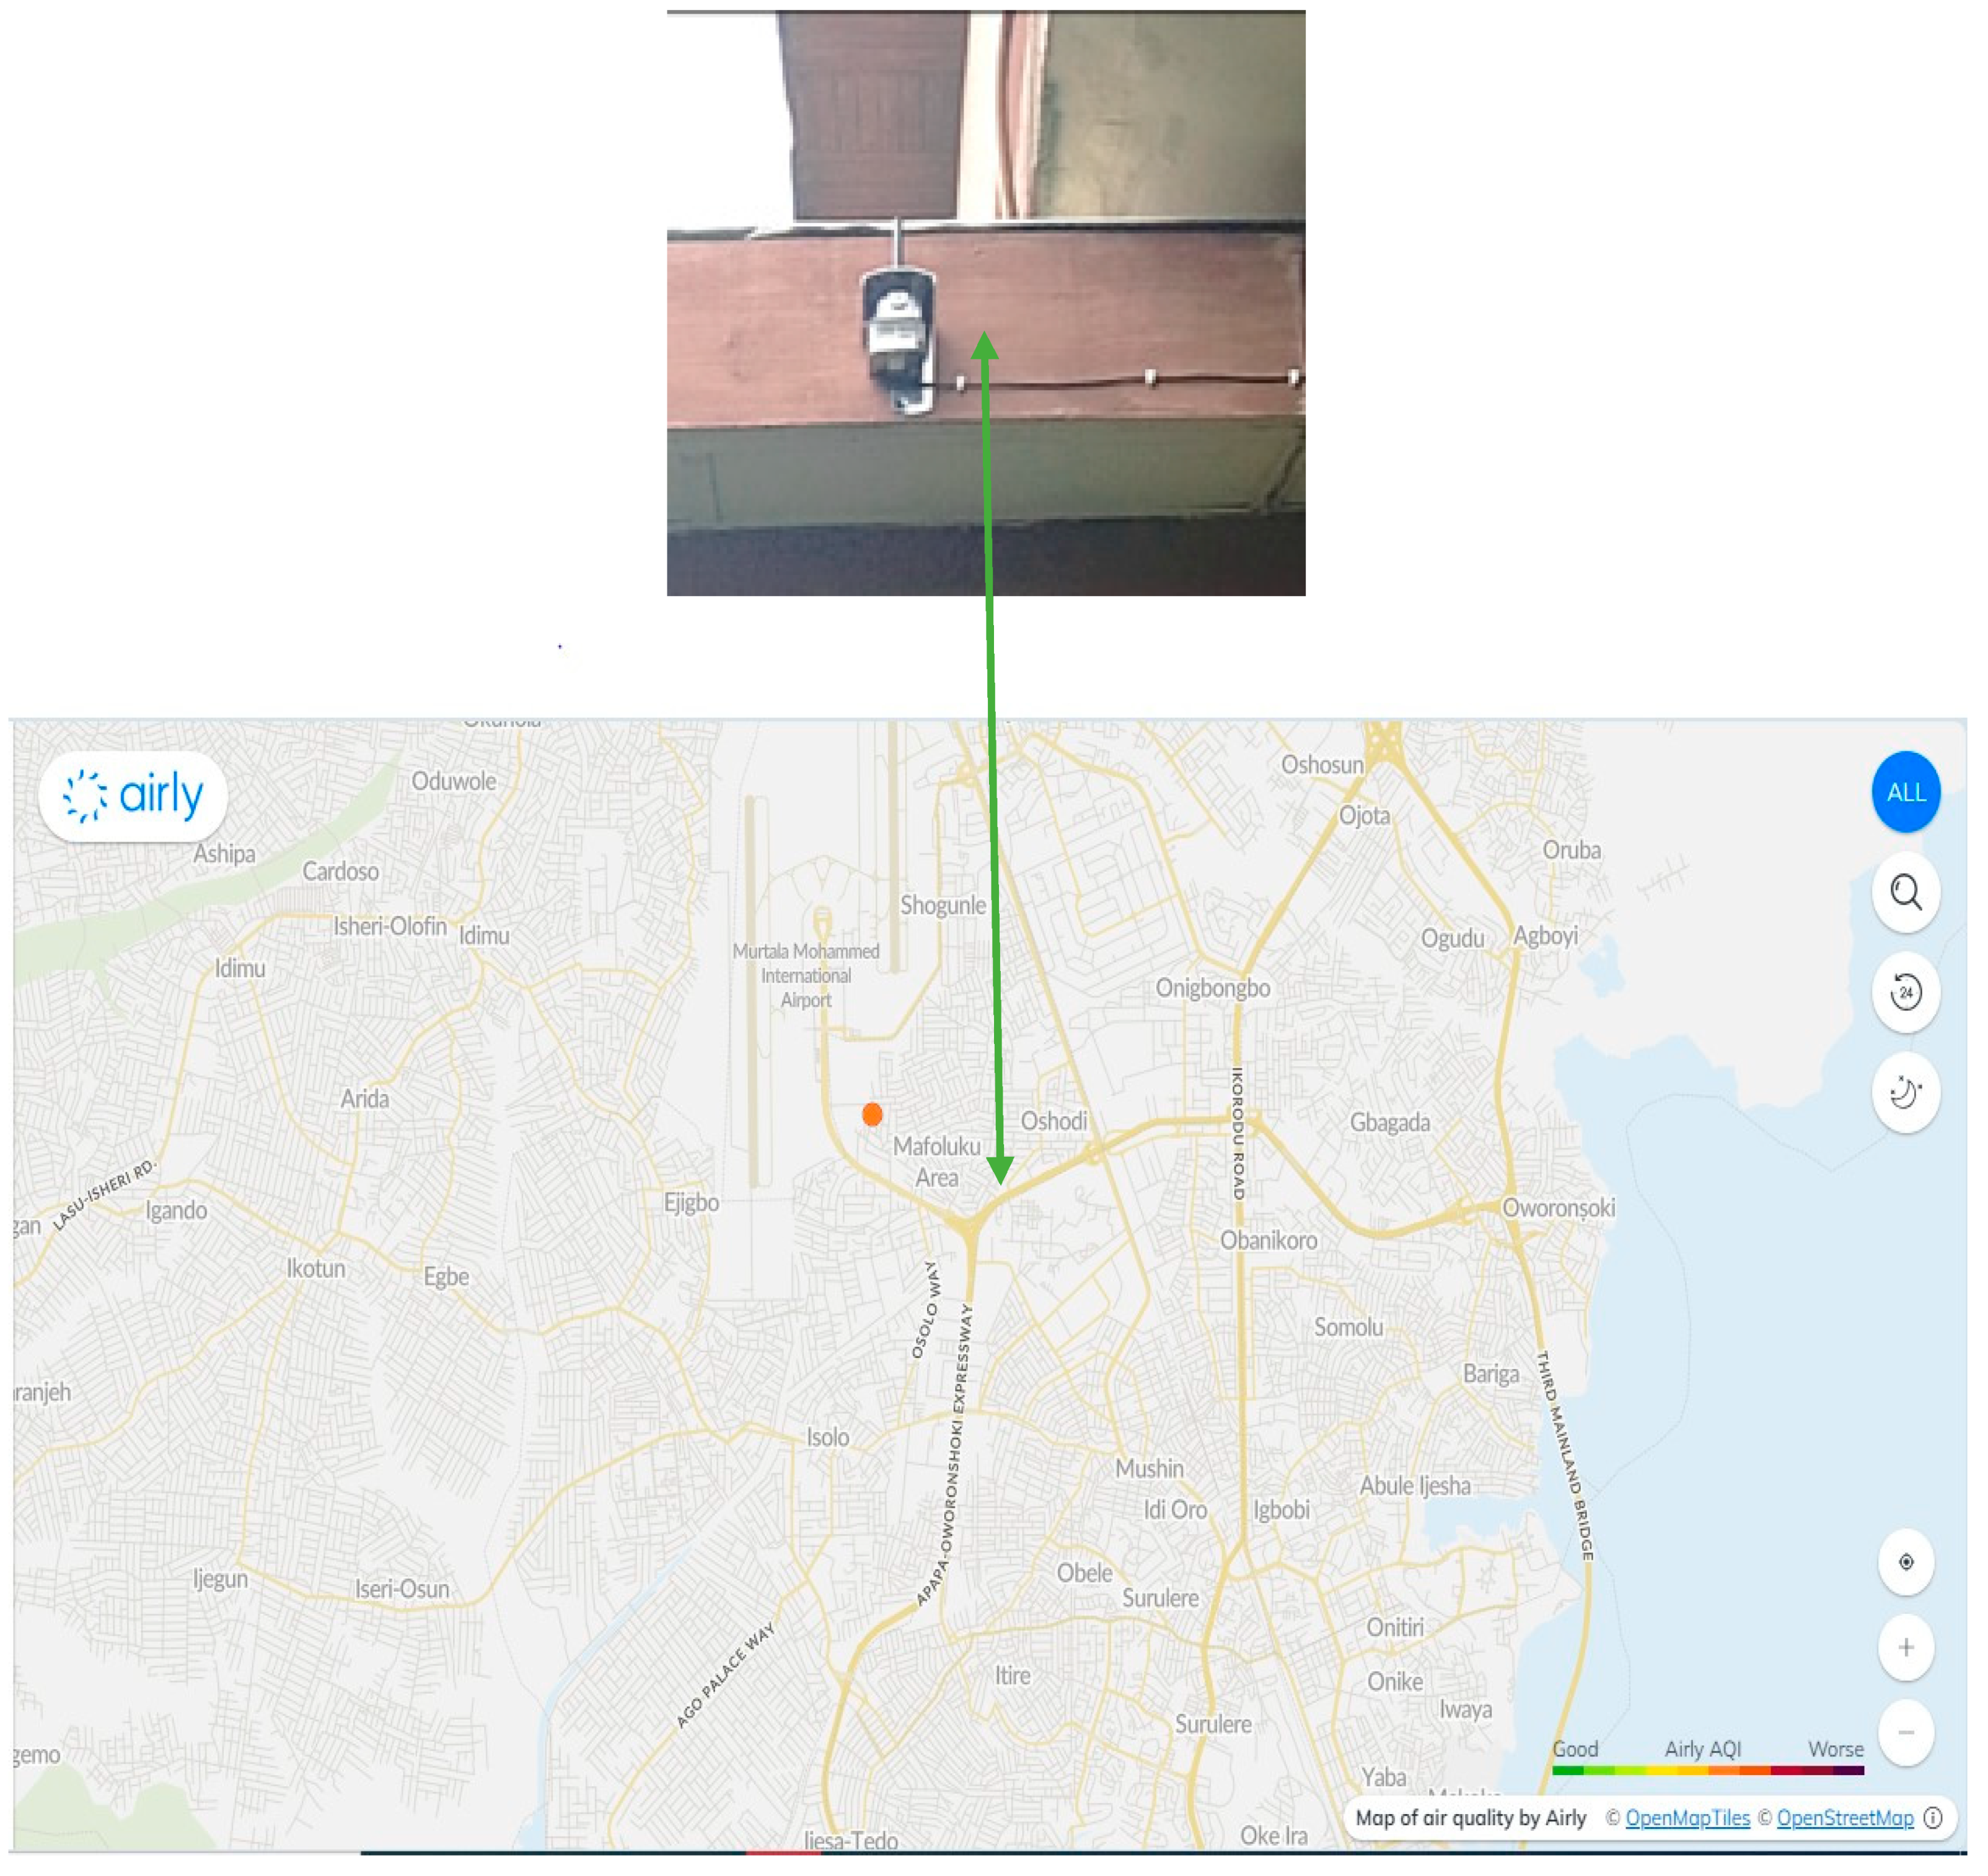
Figure 2.
The Airly LCS used for the assessment.
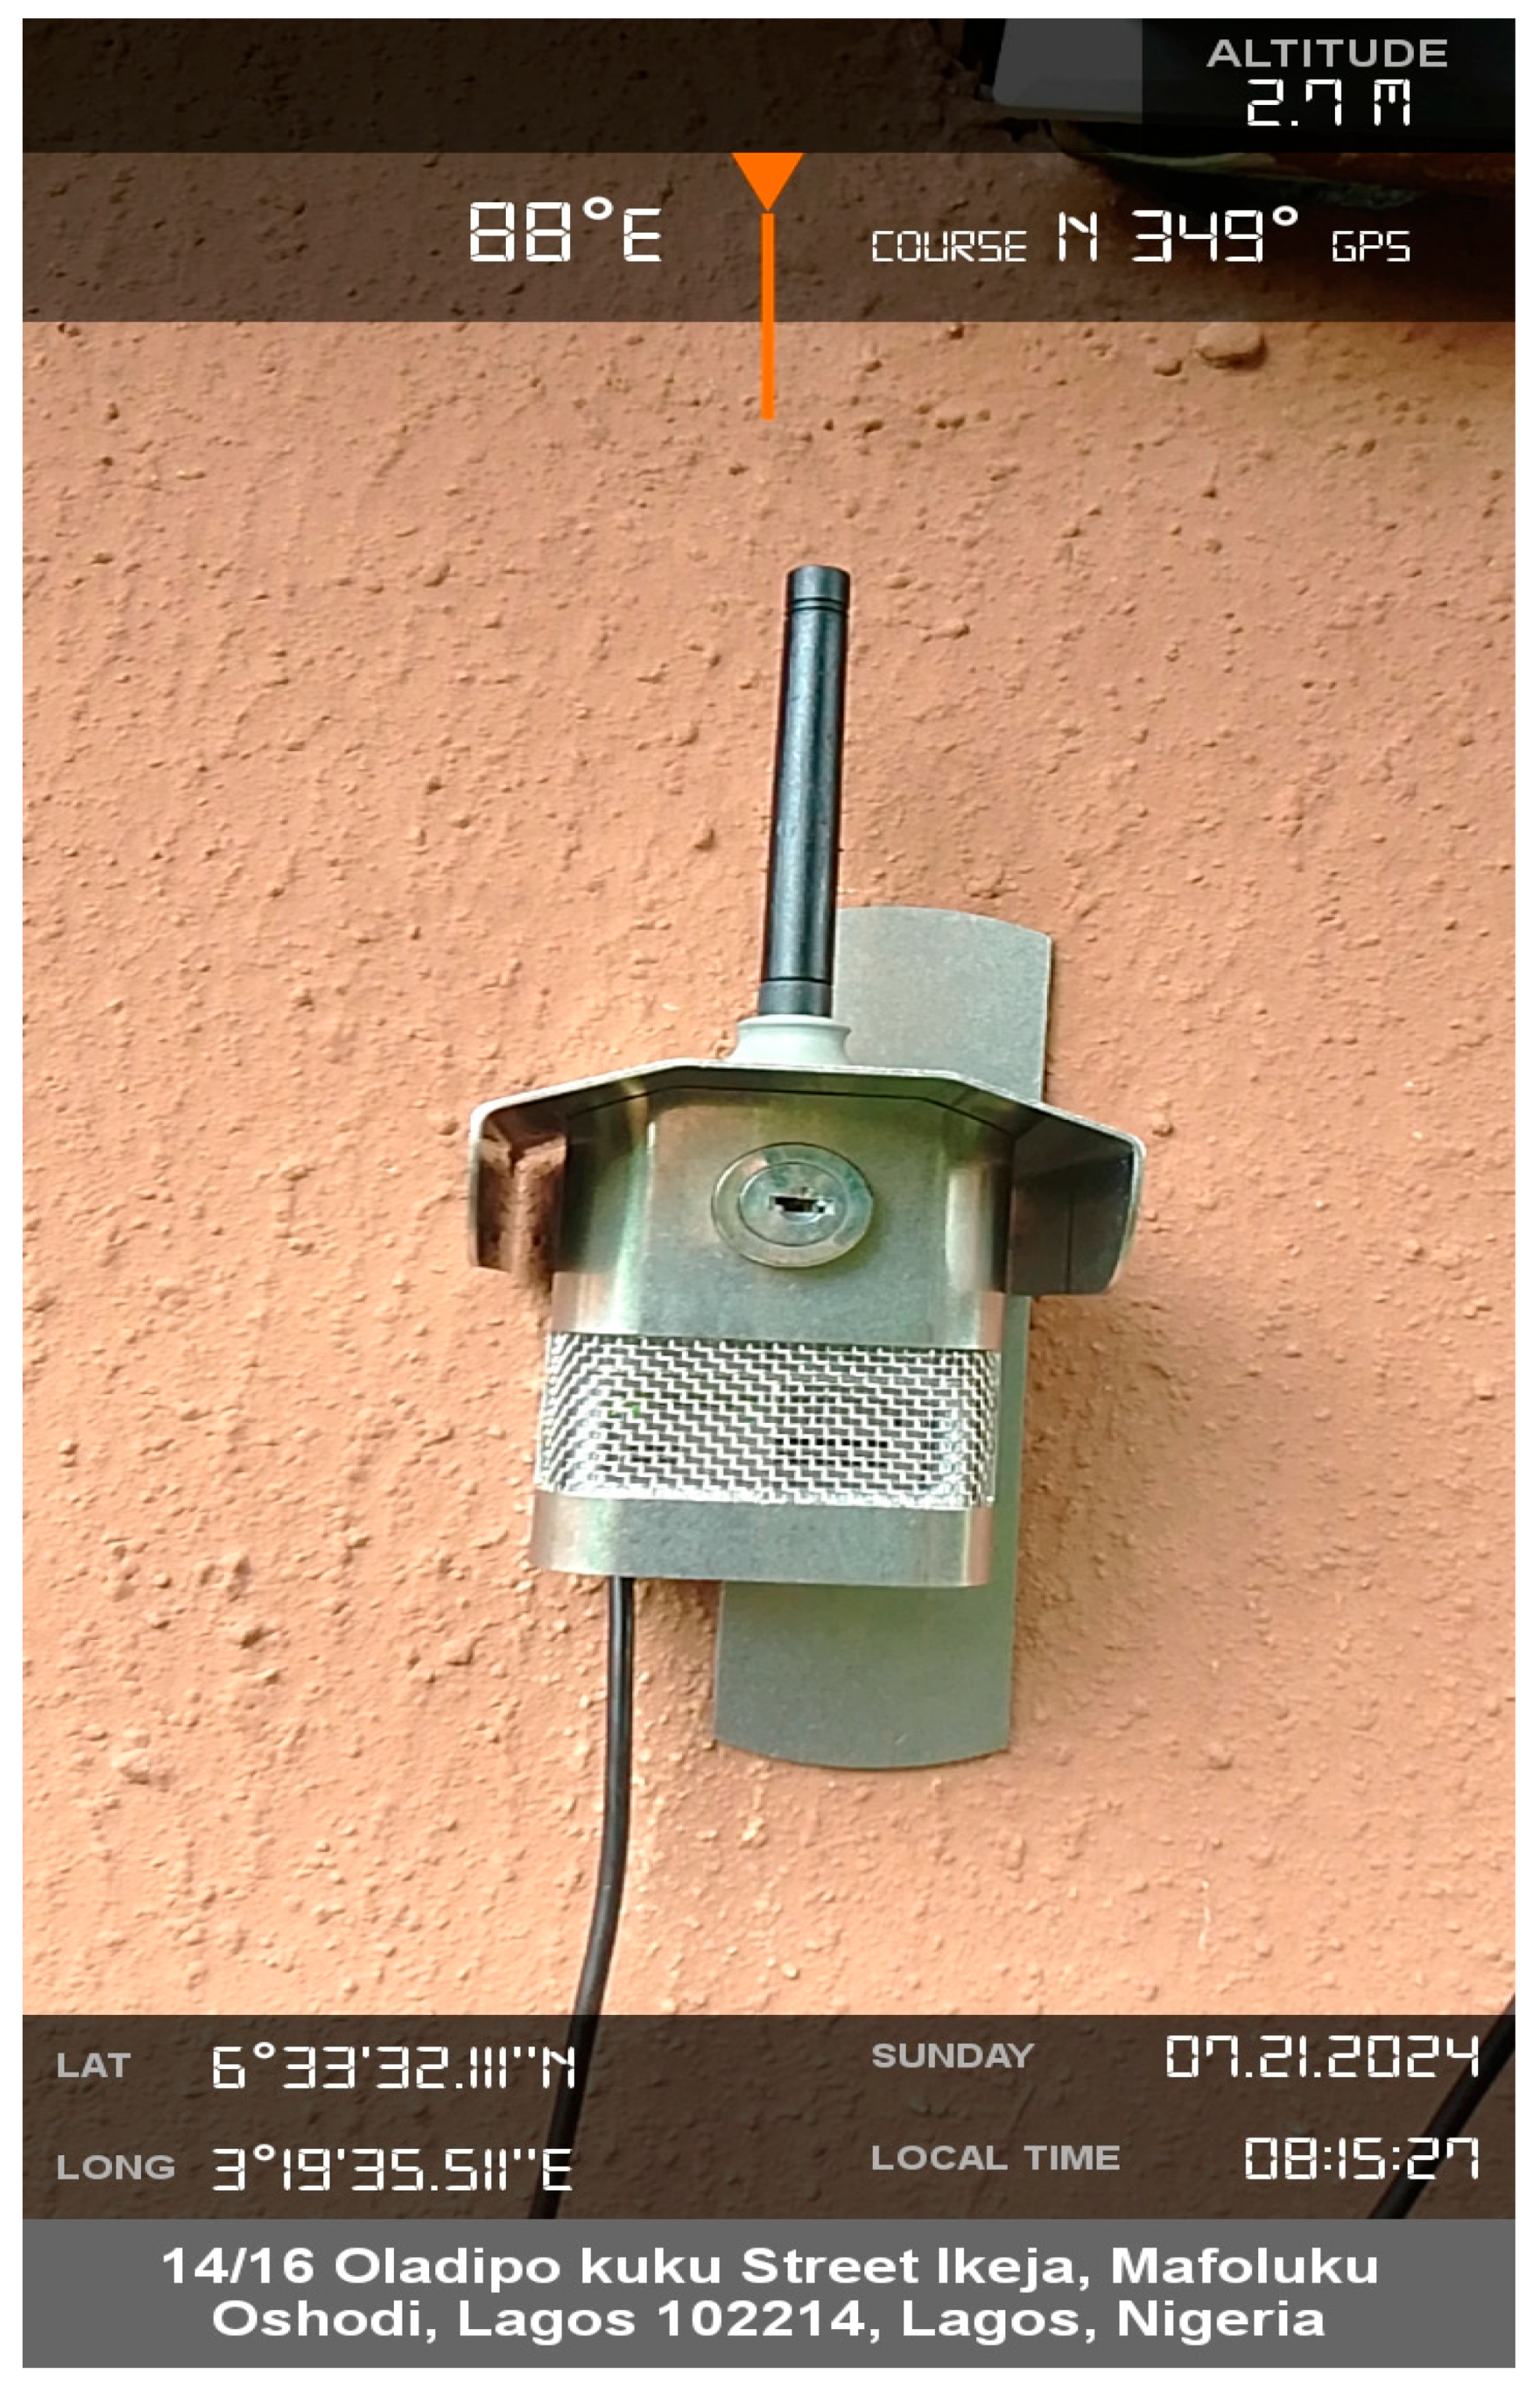
Figure 3.
Particulate Matter Concentrations Compared to WHO annual Guidline.
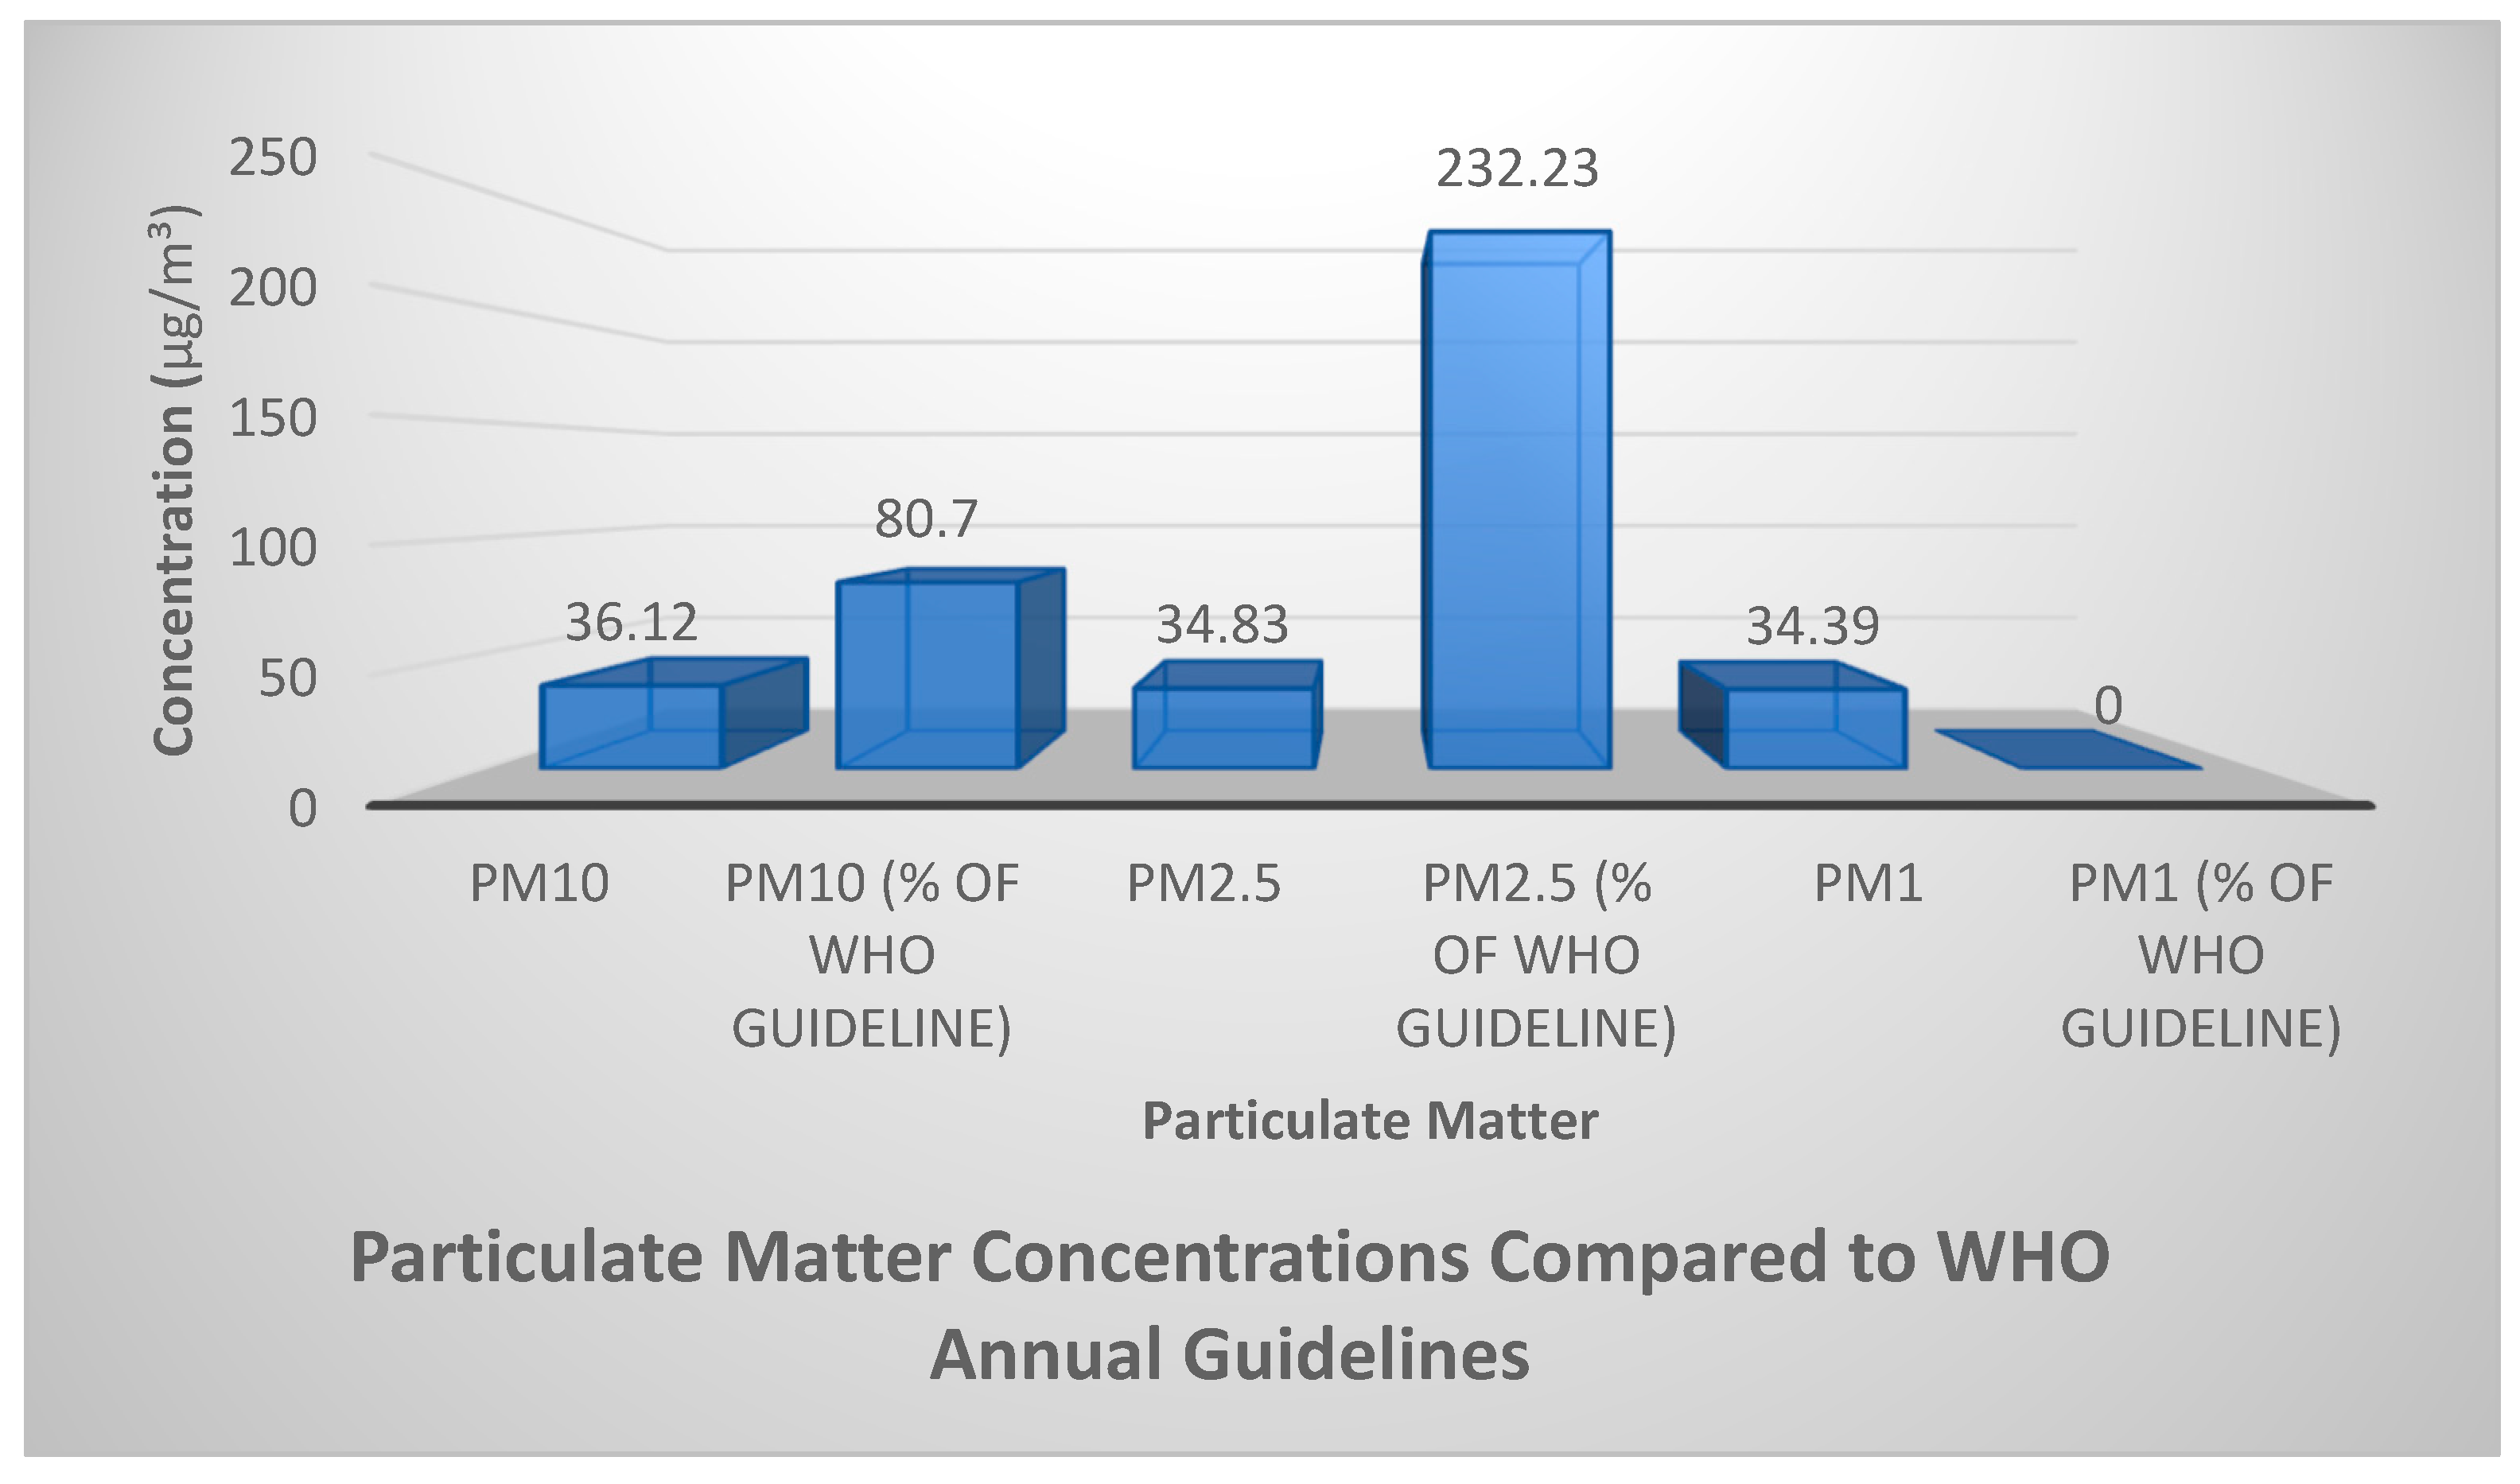
Figure 4.
Ratio of the PM Pollutants of the Location.
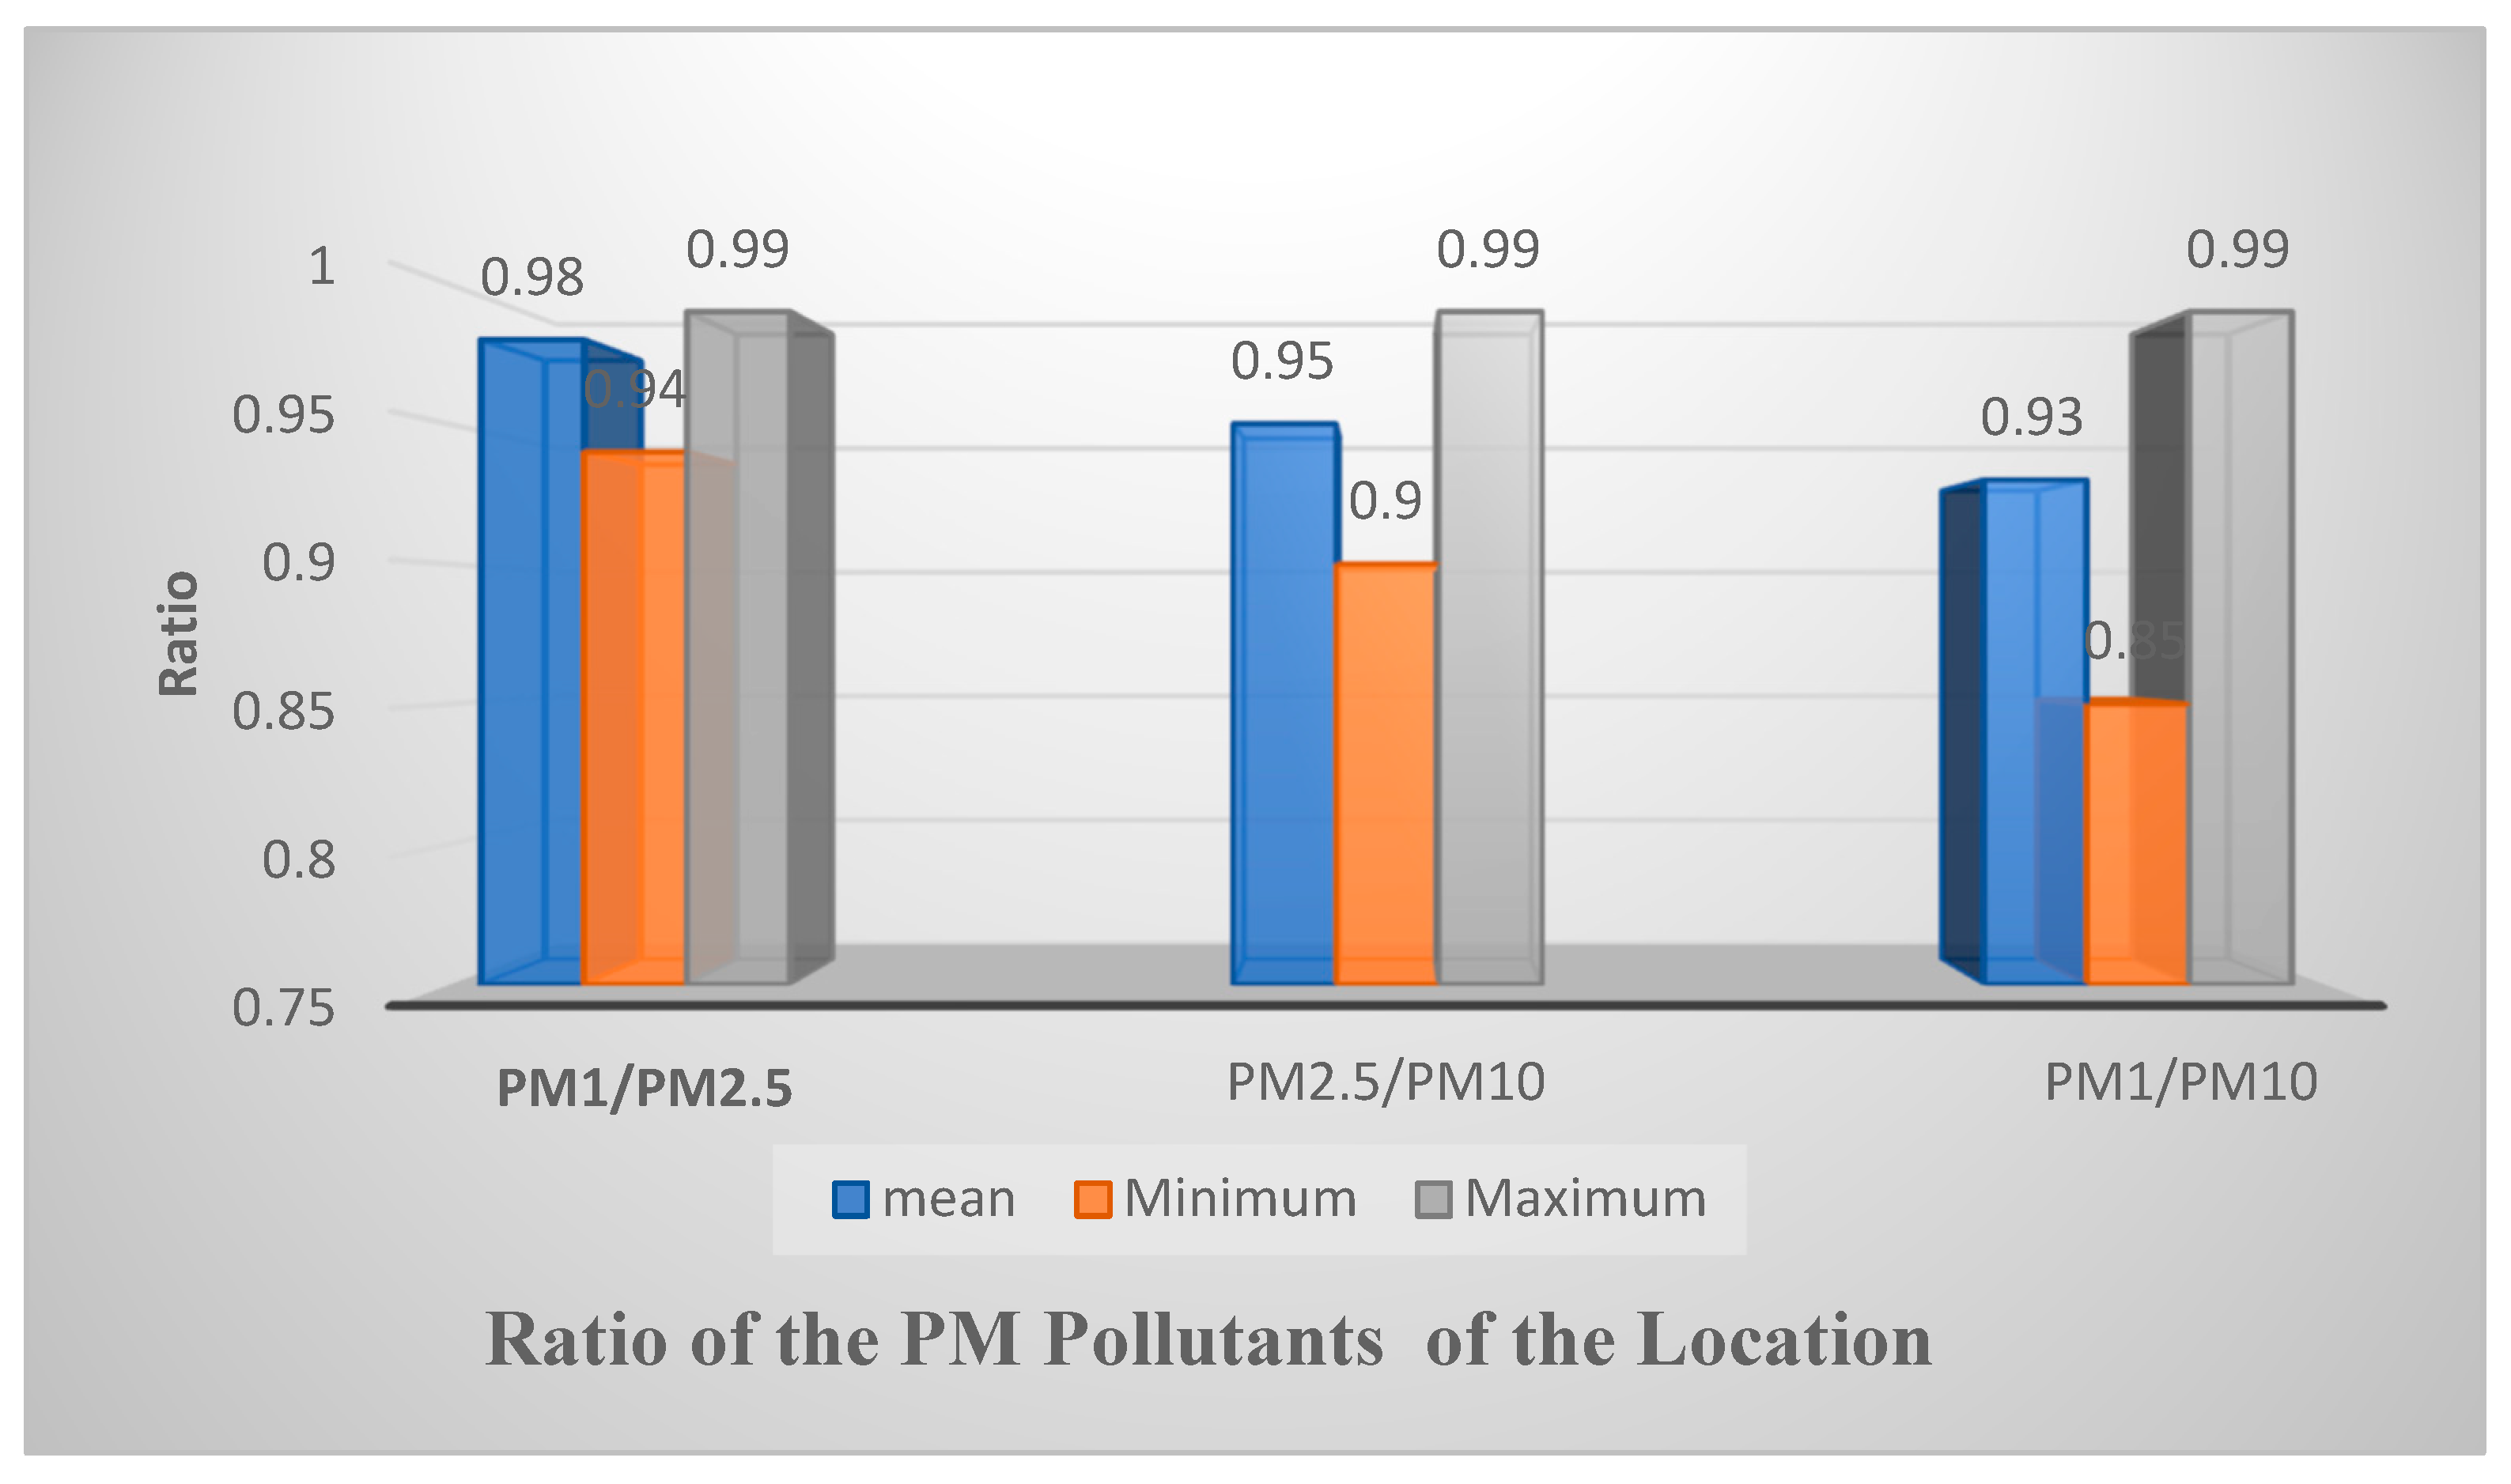
Figure 5.
Toxicity Potentials of the PM Pollutants of the Location.
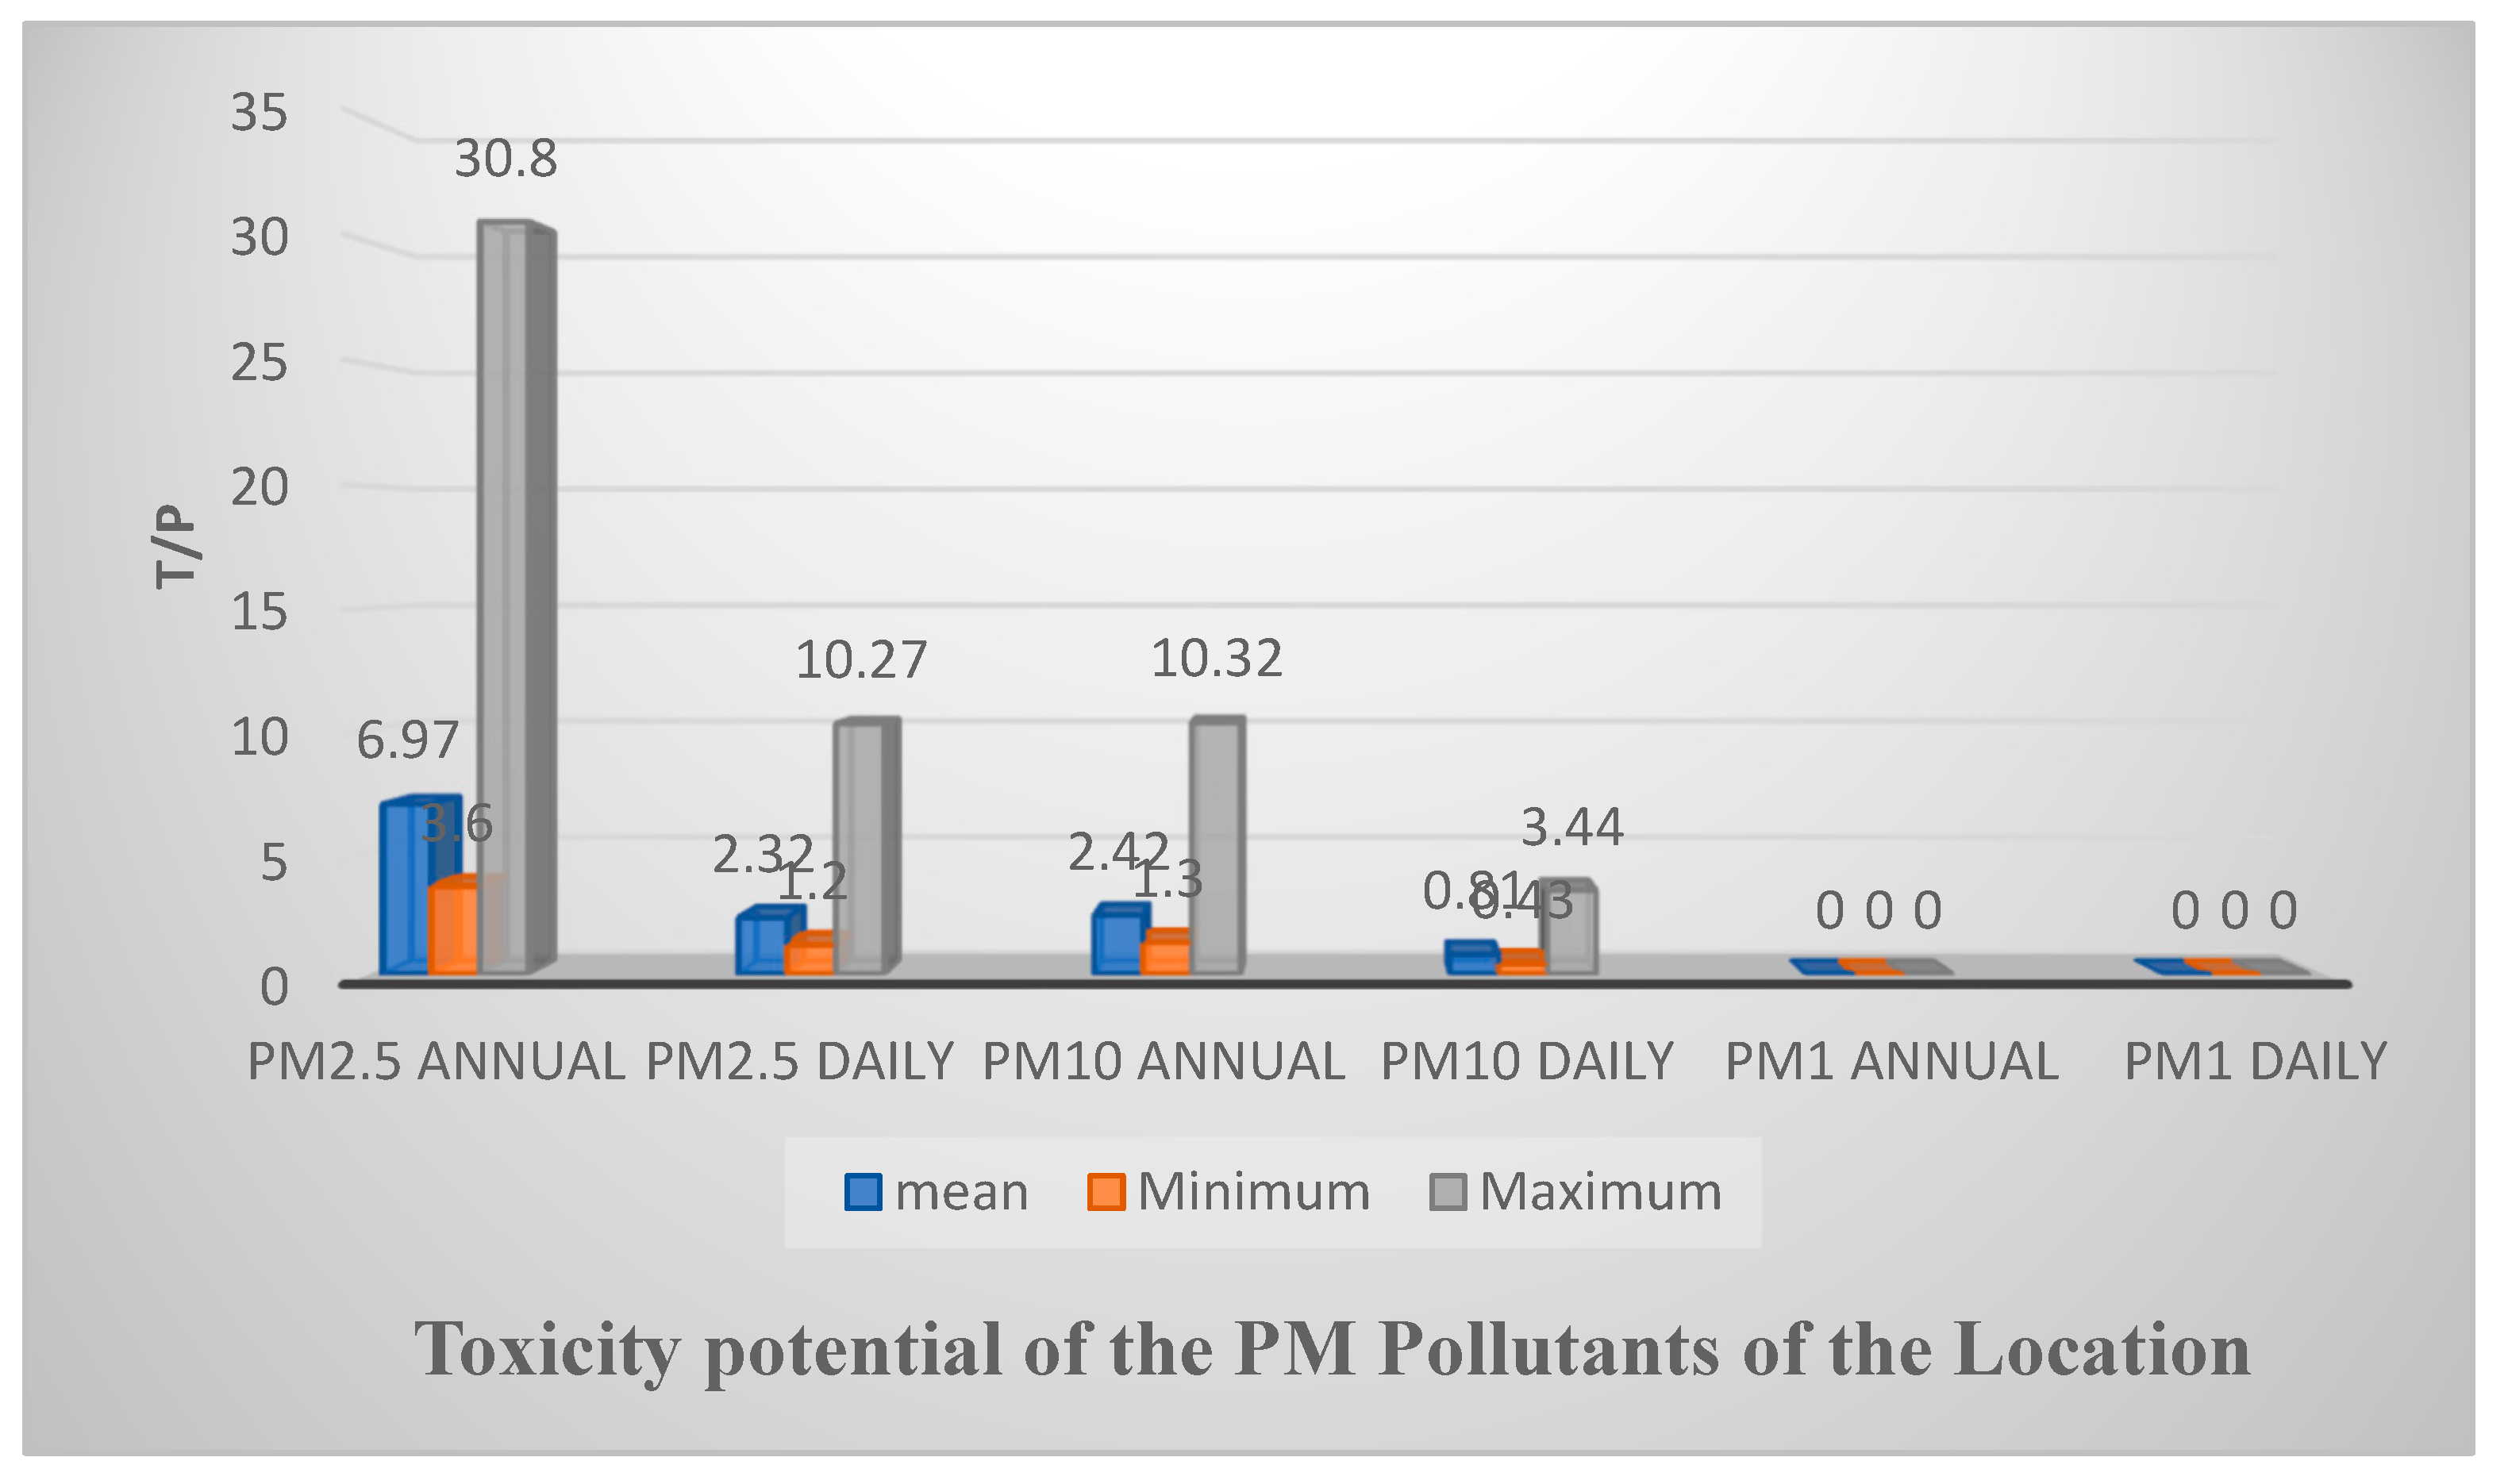
Figure 6.
Matrix Correlation of the Particulate Matter and the Meteorological Parameters.
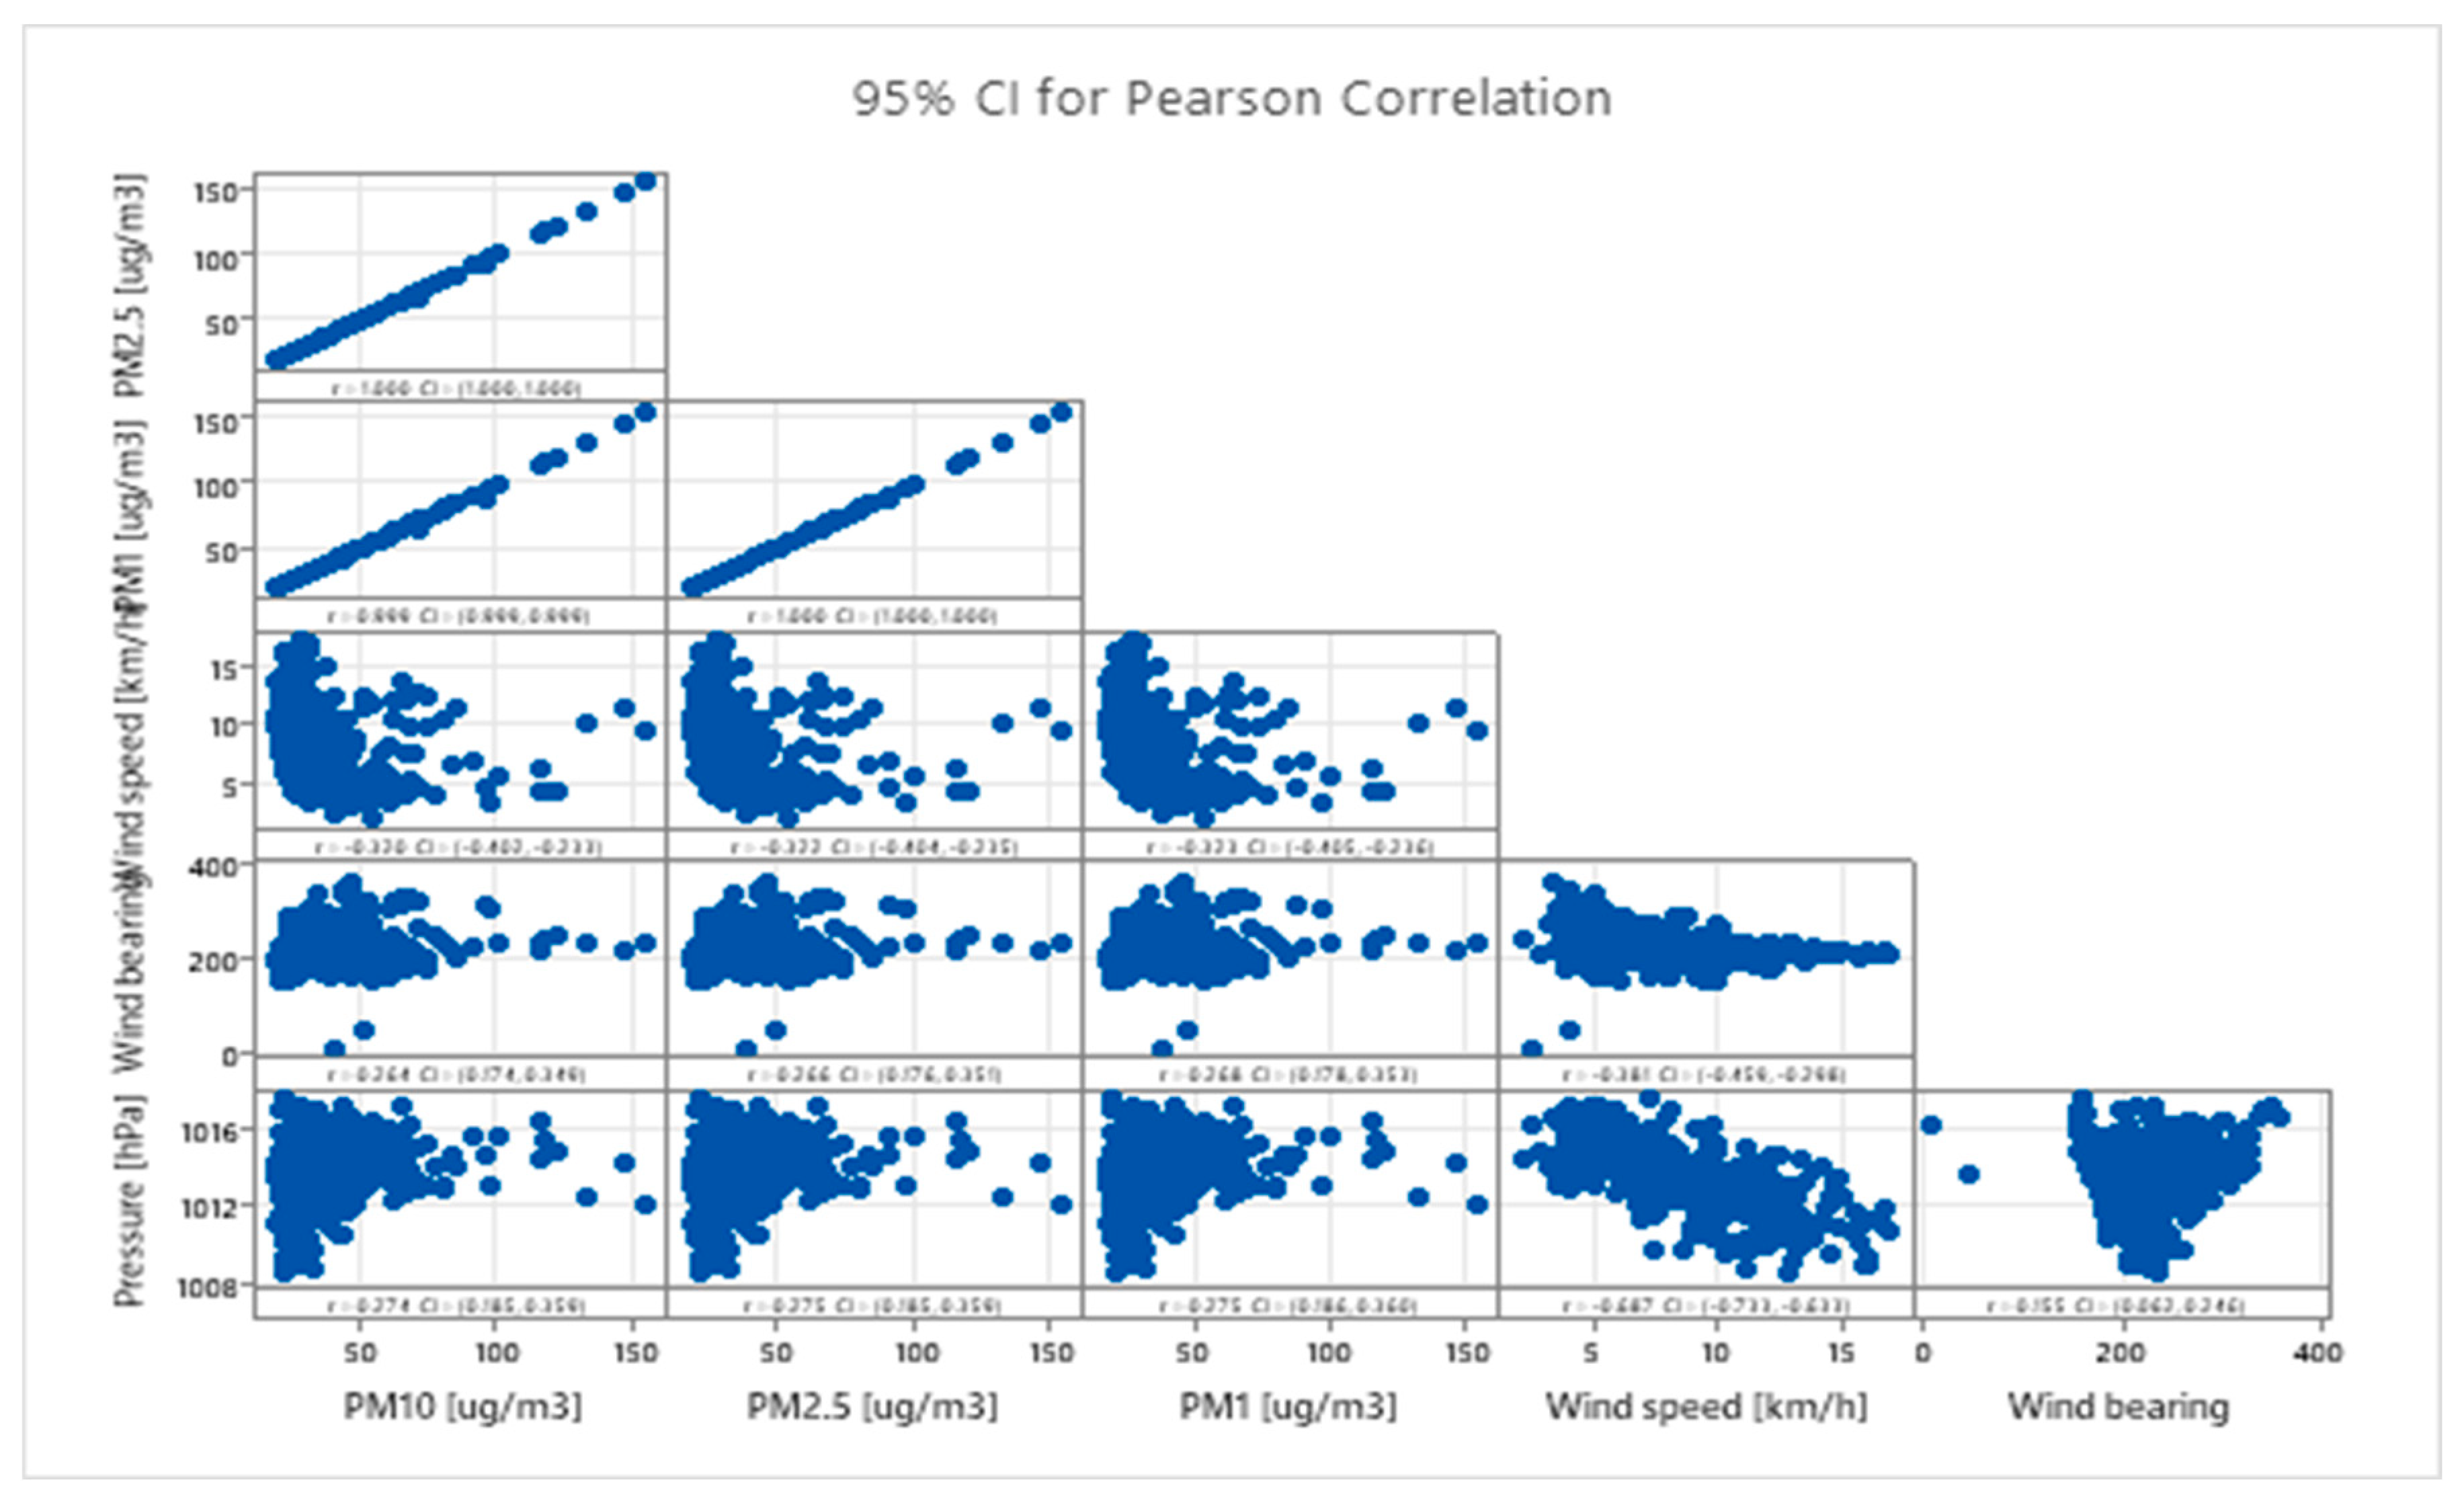
Figure 7.
Times Series Plot of the Pollutants at the Location.
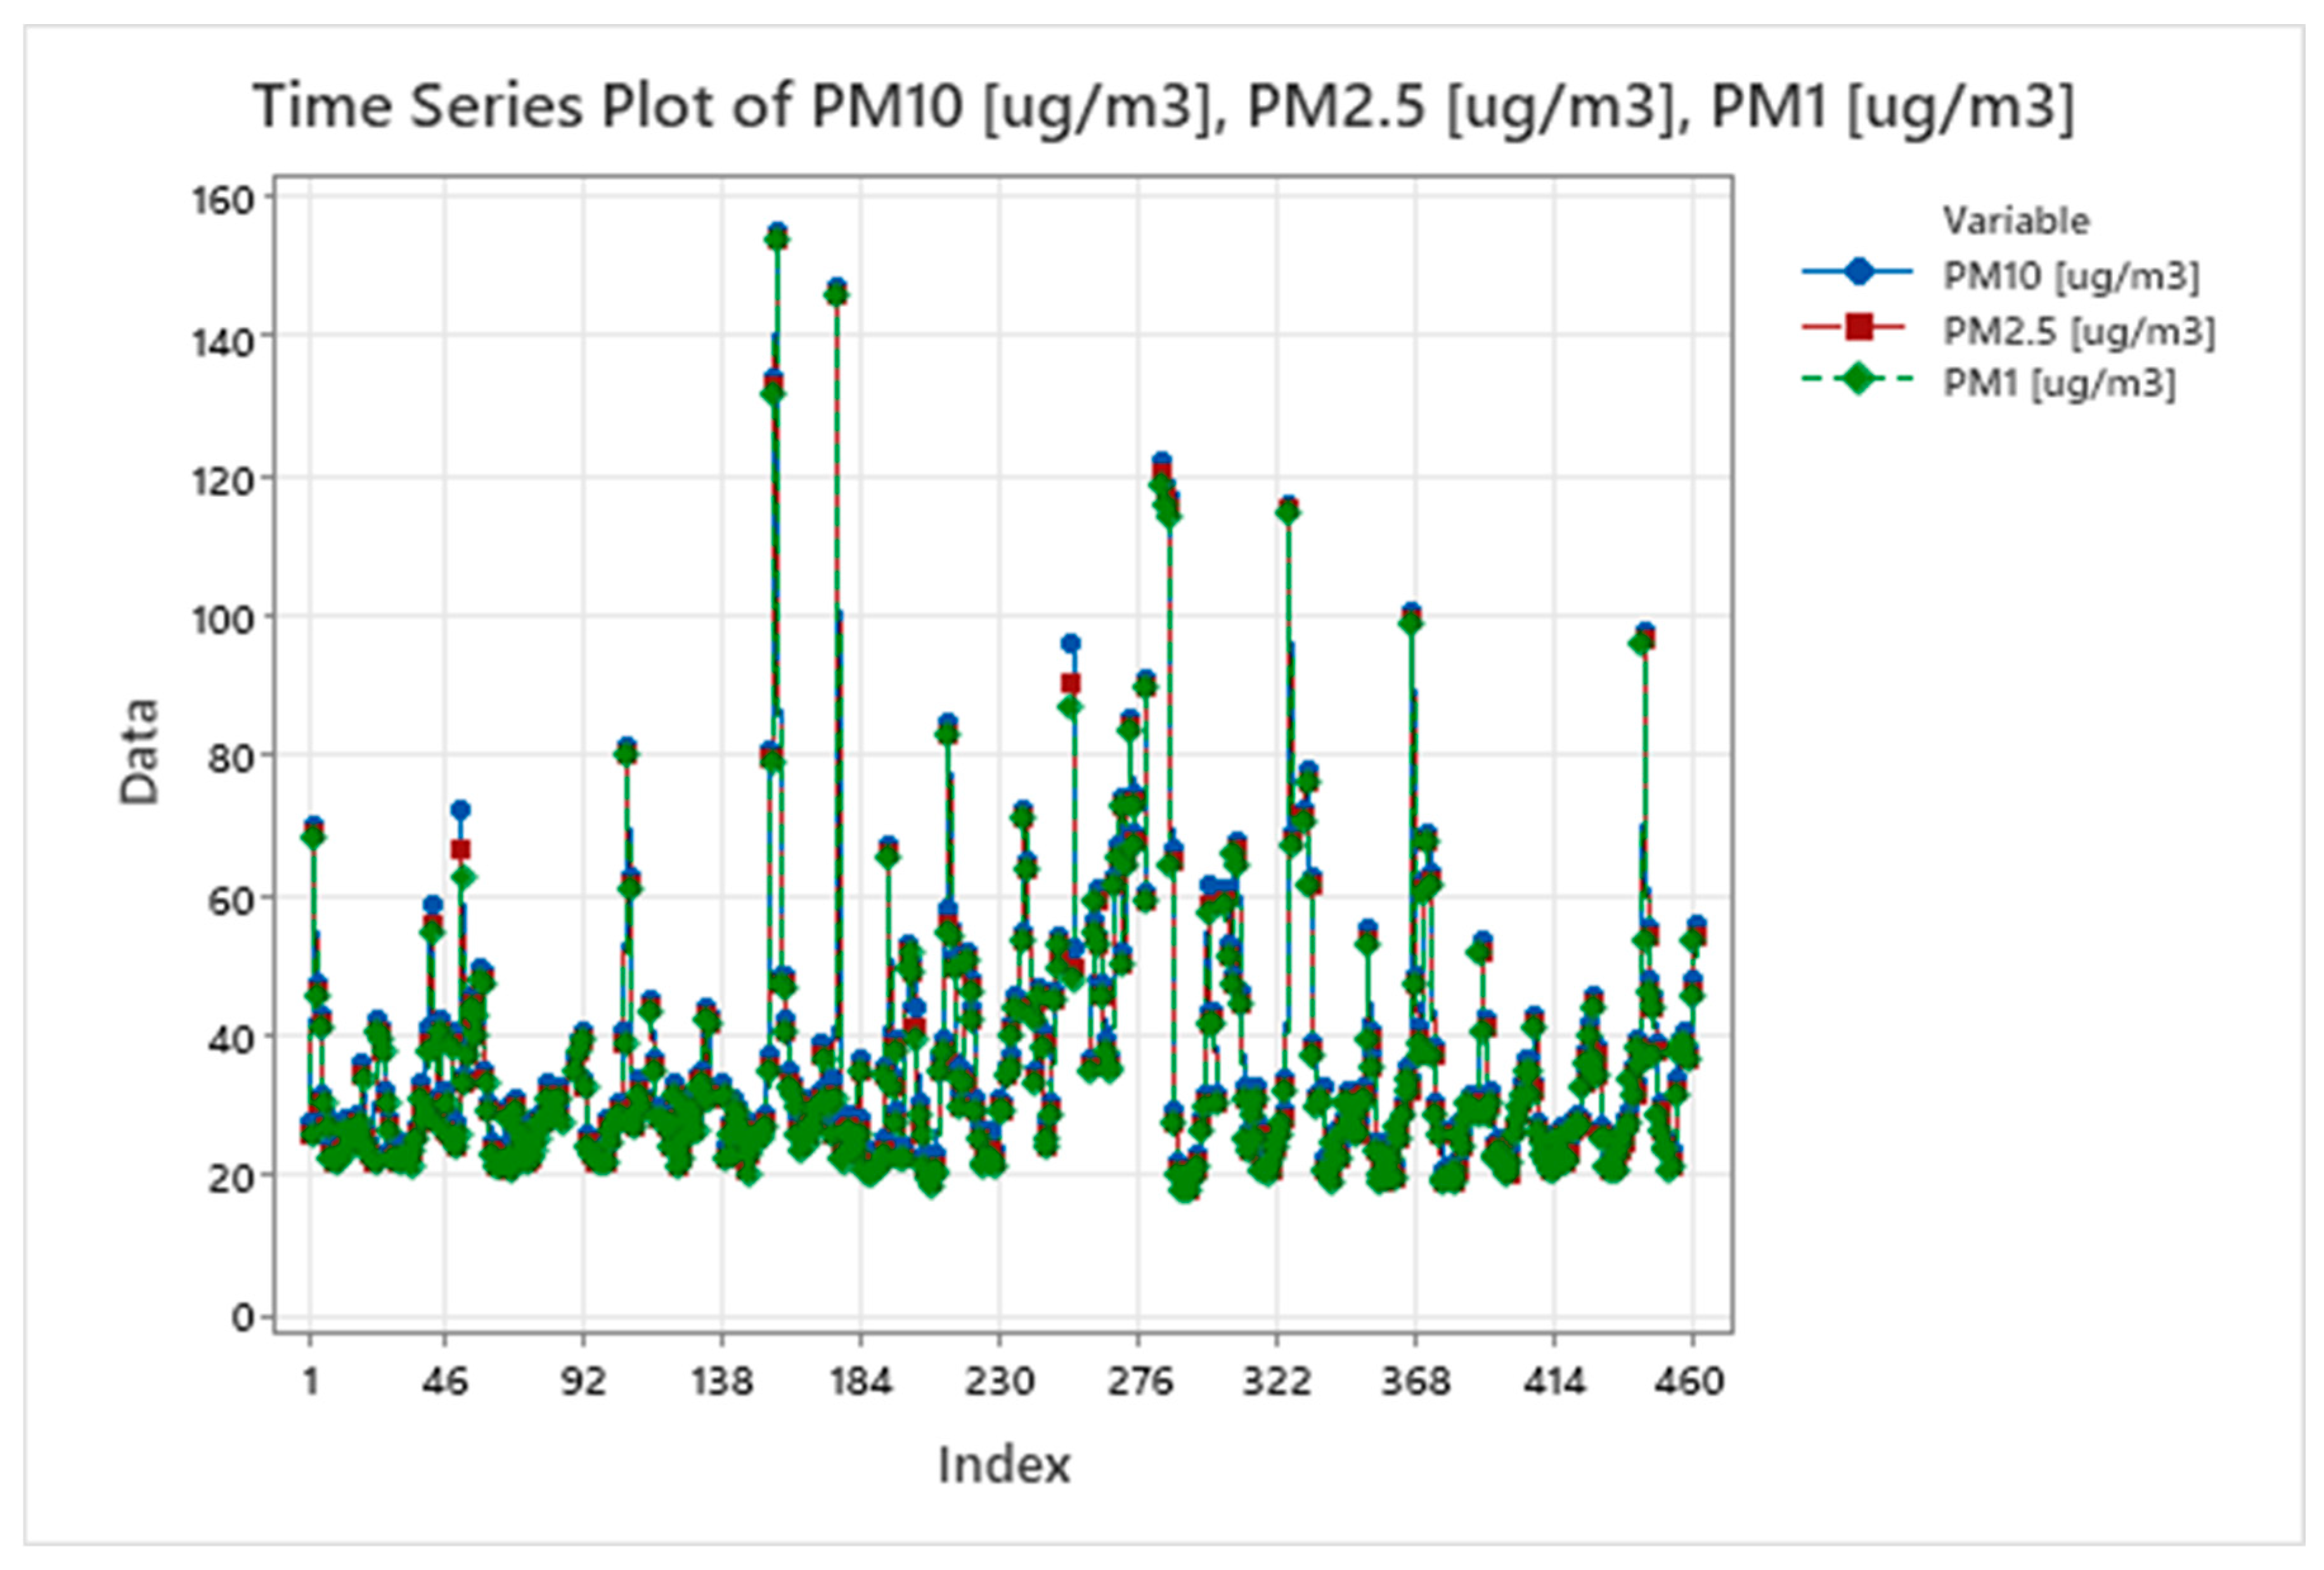
Figure 8.
Integrated Trajectory (HYSPLIT) backward trajectory of the Location.
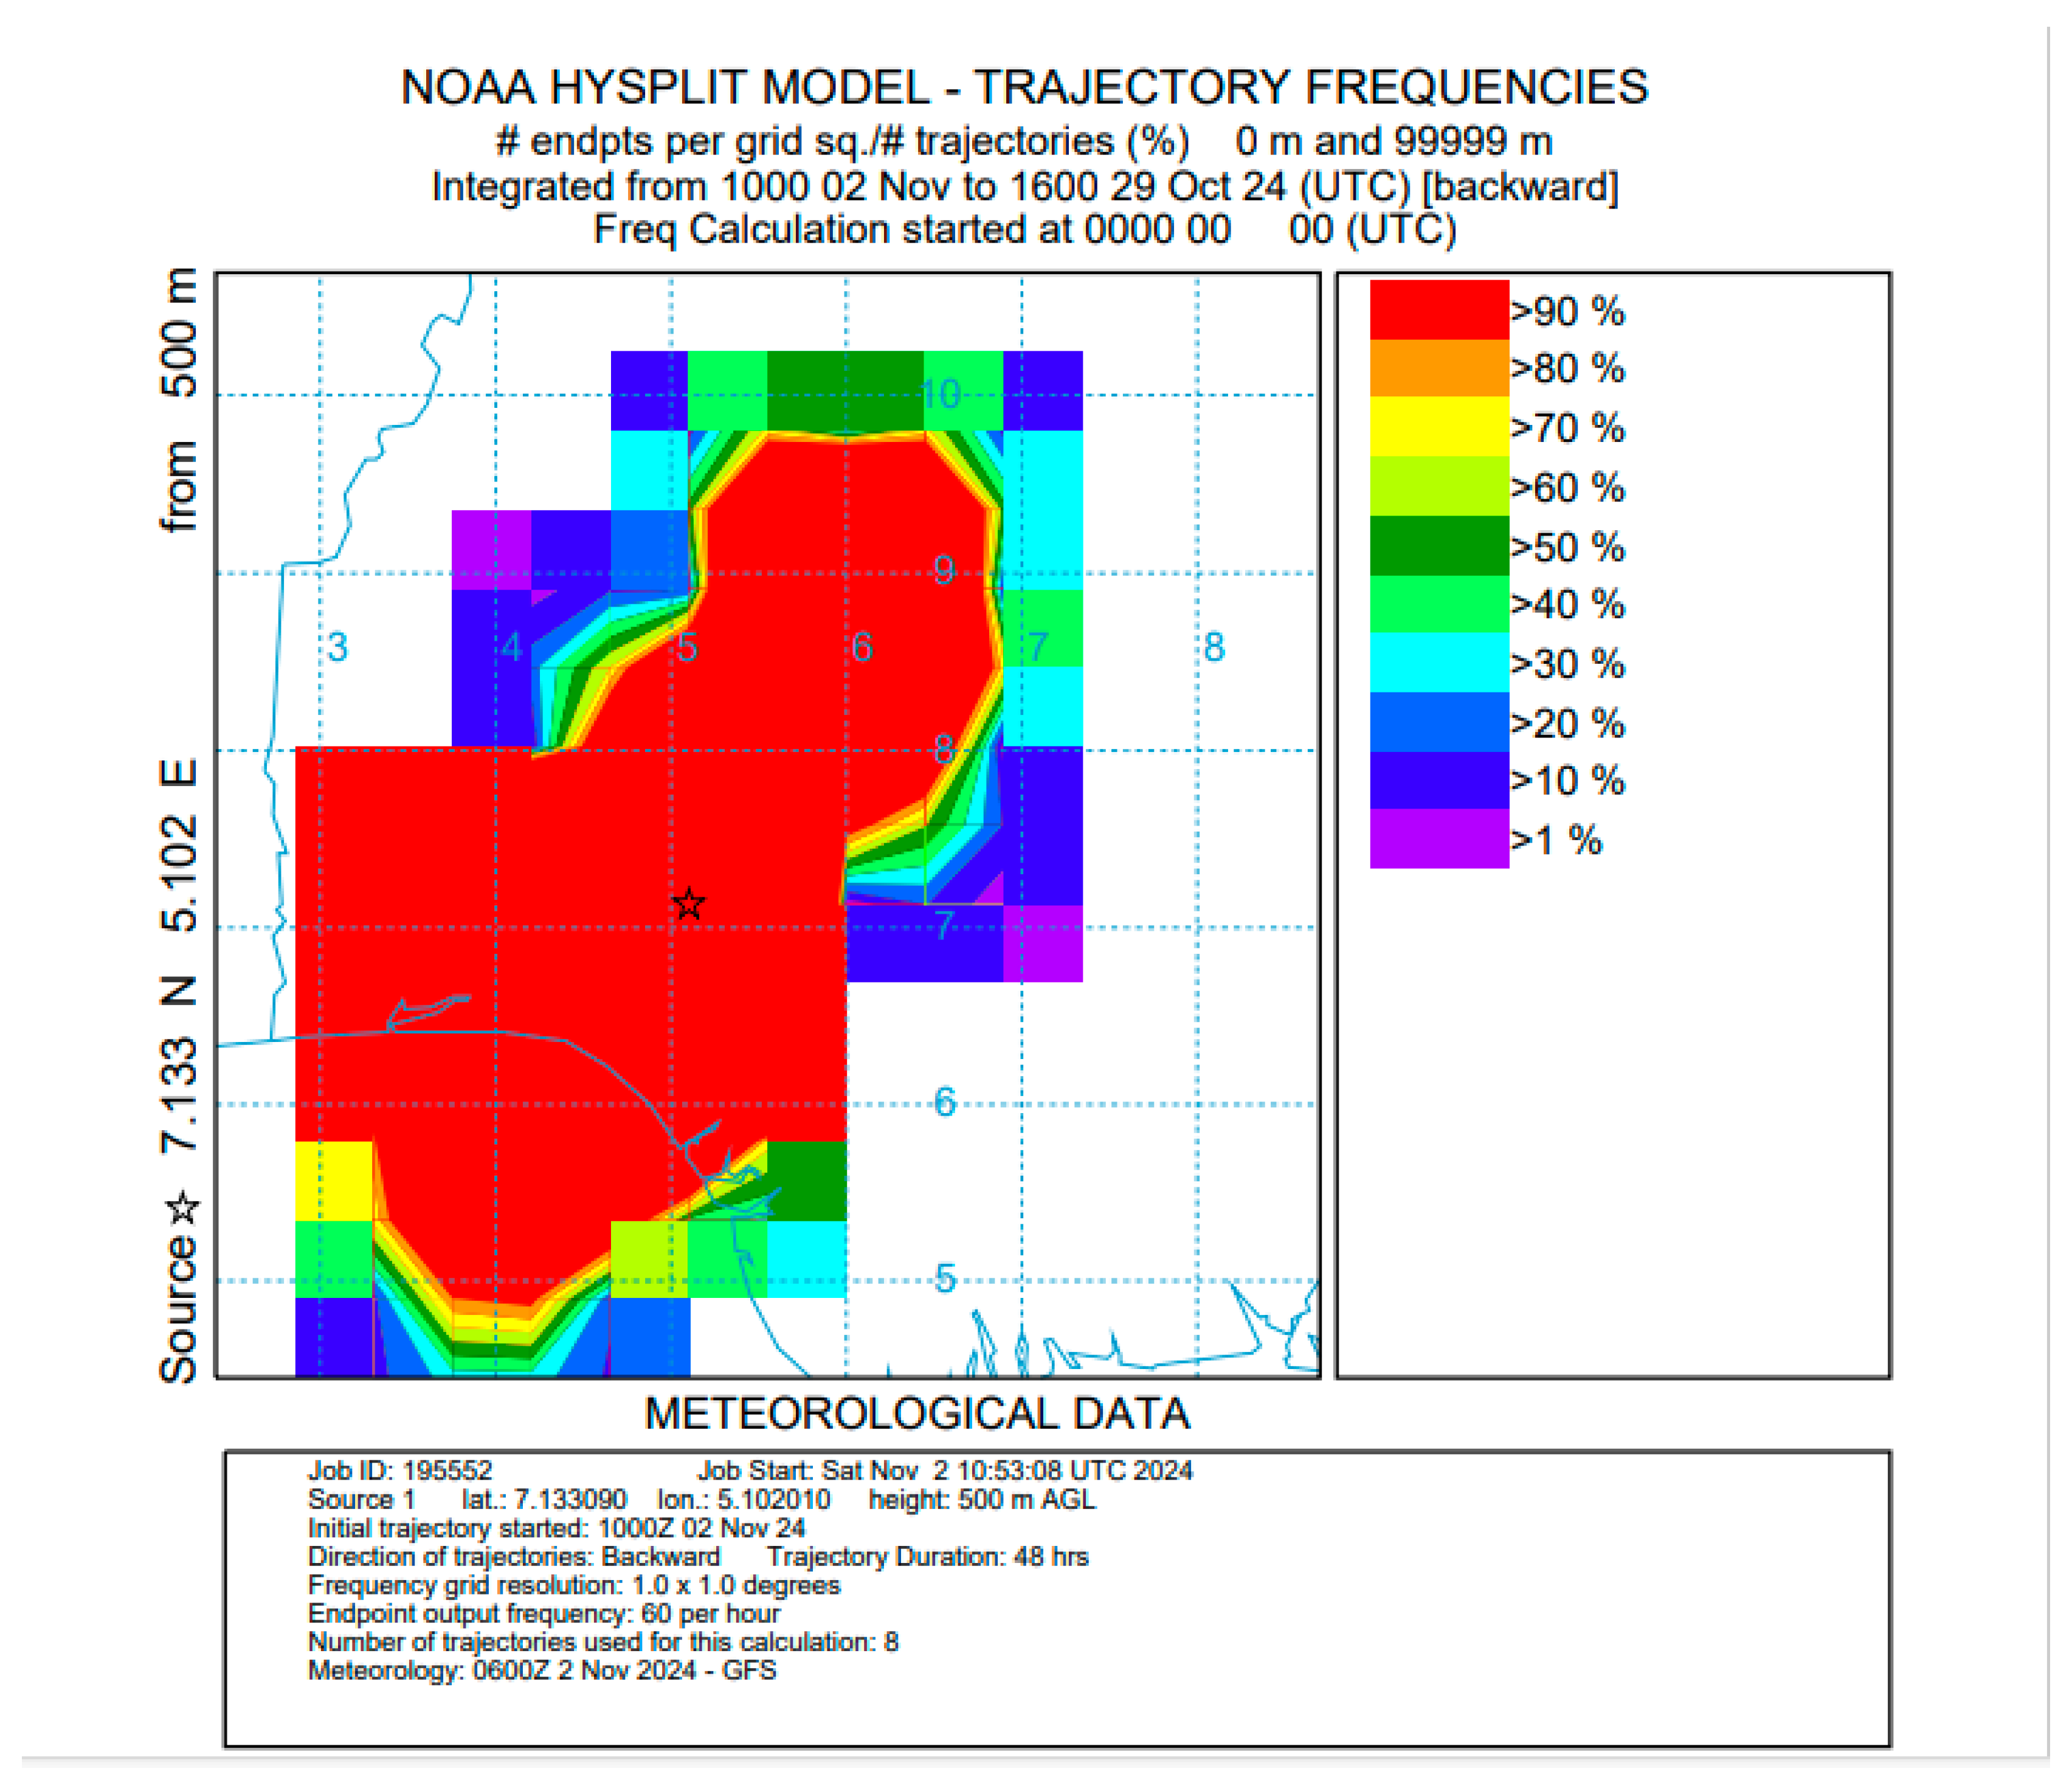

Table 1.
Air Pollution studies including location, title of studies, tool used for assessment, and key findings.
Table 1.
Air Pollution studies including location, title of studies, tool used for assessment, and key findings.
| City (Country) | Title of studies | Instrument Used | Key findings | Reference |
| Lagos Mainland, Nigeria | Air Pollution Monitoring Around Residential and Transportation Sector Locations in Lagos Mainland |
Handheld air tester (CW – HAT 200) | PM10 43.34 – 127.21 μg/m3, and PM2.5 20.32 – 69.05 μg/m3 | [10] |
| Lagos, Nigeria | The Health Cost of Ambient Air Pollution in Lagos | air samplers | Ikeja (77 µg/m3 ), Mushin (85 µg/m3 ) and Ikoyi (41 µg/m3 ) | [1] |
| Allen Avenue, Kolington, Isheri, Badagry, Opebi, Eti-Osa, Ajeniya, Awolowo, Orile, and Ajegunle, Lagos, Nigeria | Concentrations and health risks of particulate matter (PM2.5) and associated elements in the ambient air of Lagos, Southwestern Nigeria | Aerosol Mass Monitor | PM2.5 Allen Avenue (16.83 µg/m3), Kolington (15.85 µg/m3), Isheri 27.22 µg/m3), Badagry (5.36 µg/m3), Opebi (17.85 µg/m3), Eti-osa (31.32 µg/m3), Ajeniya (34.63 µg/m3), Awolowo (17.31 µg/m3), Orile (28.48 µg/m3), Ajegunle (29.65 µg/m3) |
[13] |
| Ikeja, Maryland, Ojodu, Eti-Osa, and Opebi, Lagos, Nigeria | Preliminary Assessment of Air Pollution Quality Levels of Lagos, Nigeria |
Satellite Data |
PM2.5 and PM10 over Ikeja was between 20–123 μg/m3 and 30–176 μg/m3 ; Maryland was between 22– 120 μg/m3 and 33–173 μg/m3 ; Ojodu was between 17 μg/m3 –81 μg/m3 and 27–121 μg/m3 ; and Eti-Osa was between 5 μg/m3 –212 μg/m3 and 9 μg/m3 –298 μg/m3 . In Opebi, however, PM2.5 and PM10 were between 26–163 μg/m3 and 40–241 μg/m3, respectively. |
[9] |
| University of Lagos, Akoka and Agege, Lagos | The level PM2.5 and the elemental compositions of some potential receptor locations in Lagos, Nigeria | Aerosol samples were captured on a microglass fiber particle filter and the PM2.5 determined gravimetrically | PM2.5 6 to 14 μg/m3 in Unilag and Agege respectively |
[11] |
| Victoria Island (in Lagos, Nigeria) and Melen Mini-Ferme, (Yaoundé, Cameroon | Assessment of the Temporal and Seasonal Variabilities in Air Pollution and Implications for Physical Activity in Lagos and Yaoundé |
AQMesh | Mean PM2.5 26 µg/m3 (Lagos) and 28 µg/m3 (Yaoundé) | [14] |
| Lagos, Rivers and Abuja namely Lekki, Port Harcourt and Lugbe | Atmospheric Physics; Air Pollution Monitoring and Analysis Using Purple Air Data | PurpleAir sensors. | The results indicate that Port Harcourt has the greatest concentration of particulate matter among the research regions, afterwards Lugbe, which has an average level of Standard Indoor (CF1) PM2.5 & PM10.0 of 12 weeks. concentration and Standard Outdoor or Atmospheric(ATM) PM2.5 concentration to be 87.80 µg/m3 , 101.76 µg/m3 and 63.15 µg/m3 respectively while Abuja has an average PM2.5 CF1, PM10.0 CF1 and PM2.5 ATM values of 70.51 µg/m3 , 86.21 µg/m3 and 52.07 µg/m3 respectively |
[12] |
| Akure, Nigeria | Multi-Year Continuous Observations of Ambient PM2.5 at Six Sites in Akure, Southwestern Nigeria |
P-sensors | Compared to the rainy season, PM2.5 levels were much higher during the dry season (November–March), frequently surpassing dangerous levels (over 350 µg/m3). |
[15] |
Table 2.
Basic Description of Data obtained from the Location.
| Variable | Mean | StD | CV (%) | Min | Q1 | Median | Q3 | Max | Skewness | Kurtosis |
|---|---|---|---|---|---|---|---|---|---|---|
| PM10 | 36.32 | 18.57 | 51.13 | 19.45 | 25.26 | 30.06 | 40.38 | 154.84 | 2.92 | 11.24 |
| PM2.5 | 34.83 | 18.58 | 53.35 | 18.01 | 23.51 | 28.63 | 38.74 | 154.02 | 2.92 | 11.32 |
| PM1 | 34.39 | 18.54 | 53.92 | 17.58 | 23.01 | 28.30 | 37.99 | 153.74 | 2.92 | 11.38 |
| Wind Speed | 8.56 | 3.19 | 36.84 | 2.08 | 6.17 | 8.46 | 11.03 | 16.98 | 0.28 | -0.59 |
| Wind Bearing | 224.62 | 36.71 | 16.34 | 10.20 | 206.49 | 217.66 | 137.11 | 358.61 | 0.23 | 4.73 |
| Pressure | 1013.3 | 1.73 | 0.17 | 1008.6 | 1012.3 | 1013.4 | 1014.6 | 1017.5 | -0.22 | -0.29 |
Table 3.
Pearson Csorrelation of the Particulate Matter and the Meteorological Parameters.
| PM10 | PM2.5 | PM1 | Wind speed | Wind bearing | |
|---|---|---|---|---|---|
| PM10 PM2.5 |
1.000 | ||||
| PM1 | 0.999 | 1.000 | |||
| Wind speed | -0.320 | -0.322 | -0.323 | ||
| Wind bearing | 0.264 | 0.266 | 0.268 | -0.381 | |
| Pressure | 0.274 | 0.275 | 0.275 | -0.687 | 0.155 |
Disclaimer/Publisher’s Note: The statements, opinions and data contained in all publications are solely those of the individual author(s) and contributor(s) and not of MDPI and/or the editor(s). MDPI and/or the editor(s) disclaim responsibility for any injury to people or property resulting from any ideas, methods, instructions or products referred to in the content. |
© 2024 by the authors. Licensee MDPI, Basel, Switzerland. This article is an open access article distributed under the terms and conditions of the Creative Commons Attribution (CC BY) license (https://creativecommons.org/licenses/by/4.0/).
Copyright: This open access article is published under a Creative Commons CC BY 4.0 license, which permit the free download, distribution, and reuse, provided that the author and preprint are cited in any reuse.


