Preprint
Article

This version is not peer-reviewed.

Spatiotemporal Analysis of Land Use Change and Urban Heat Island Effects in Akure and Osogbo, Nigeria Between 2014 and 2023

A peer-reviewed article of this preprint also exists.

Submitted:

20 February 2025

Posted:

21 February 2025

You are already at the latest version

Abstract

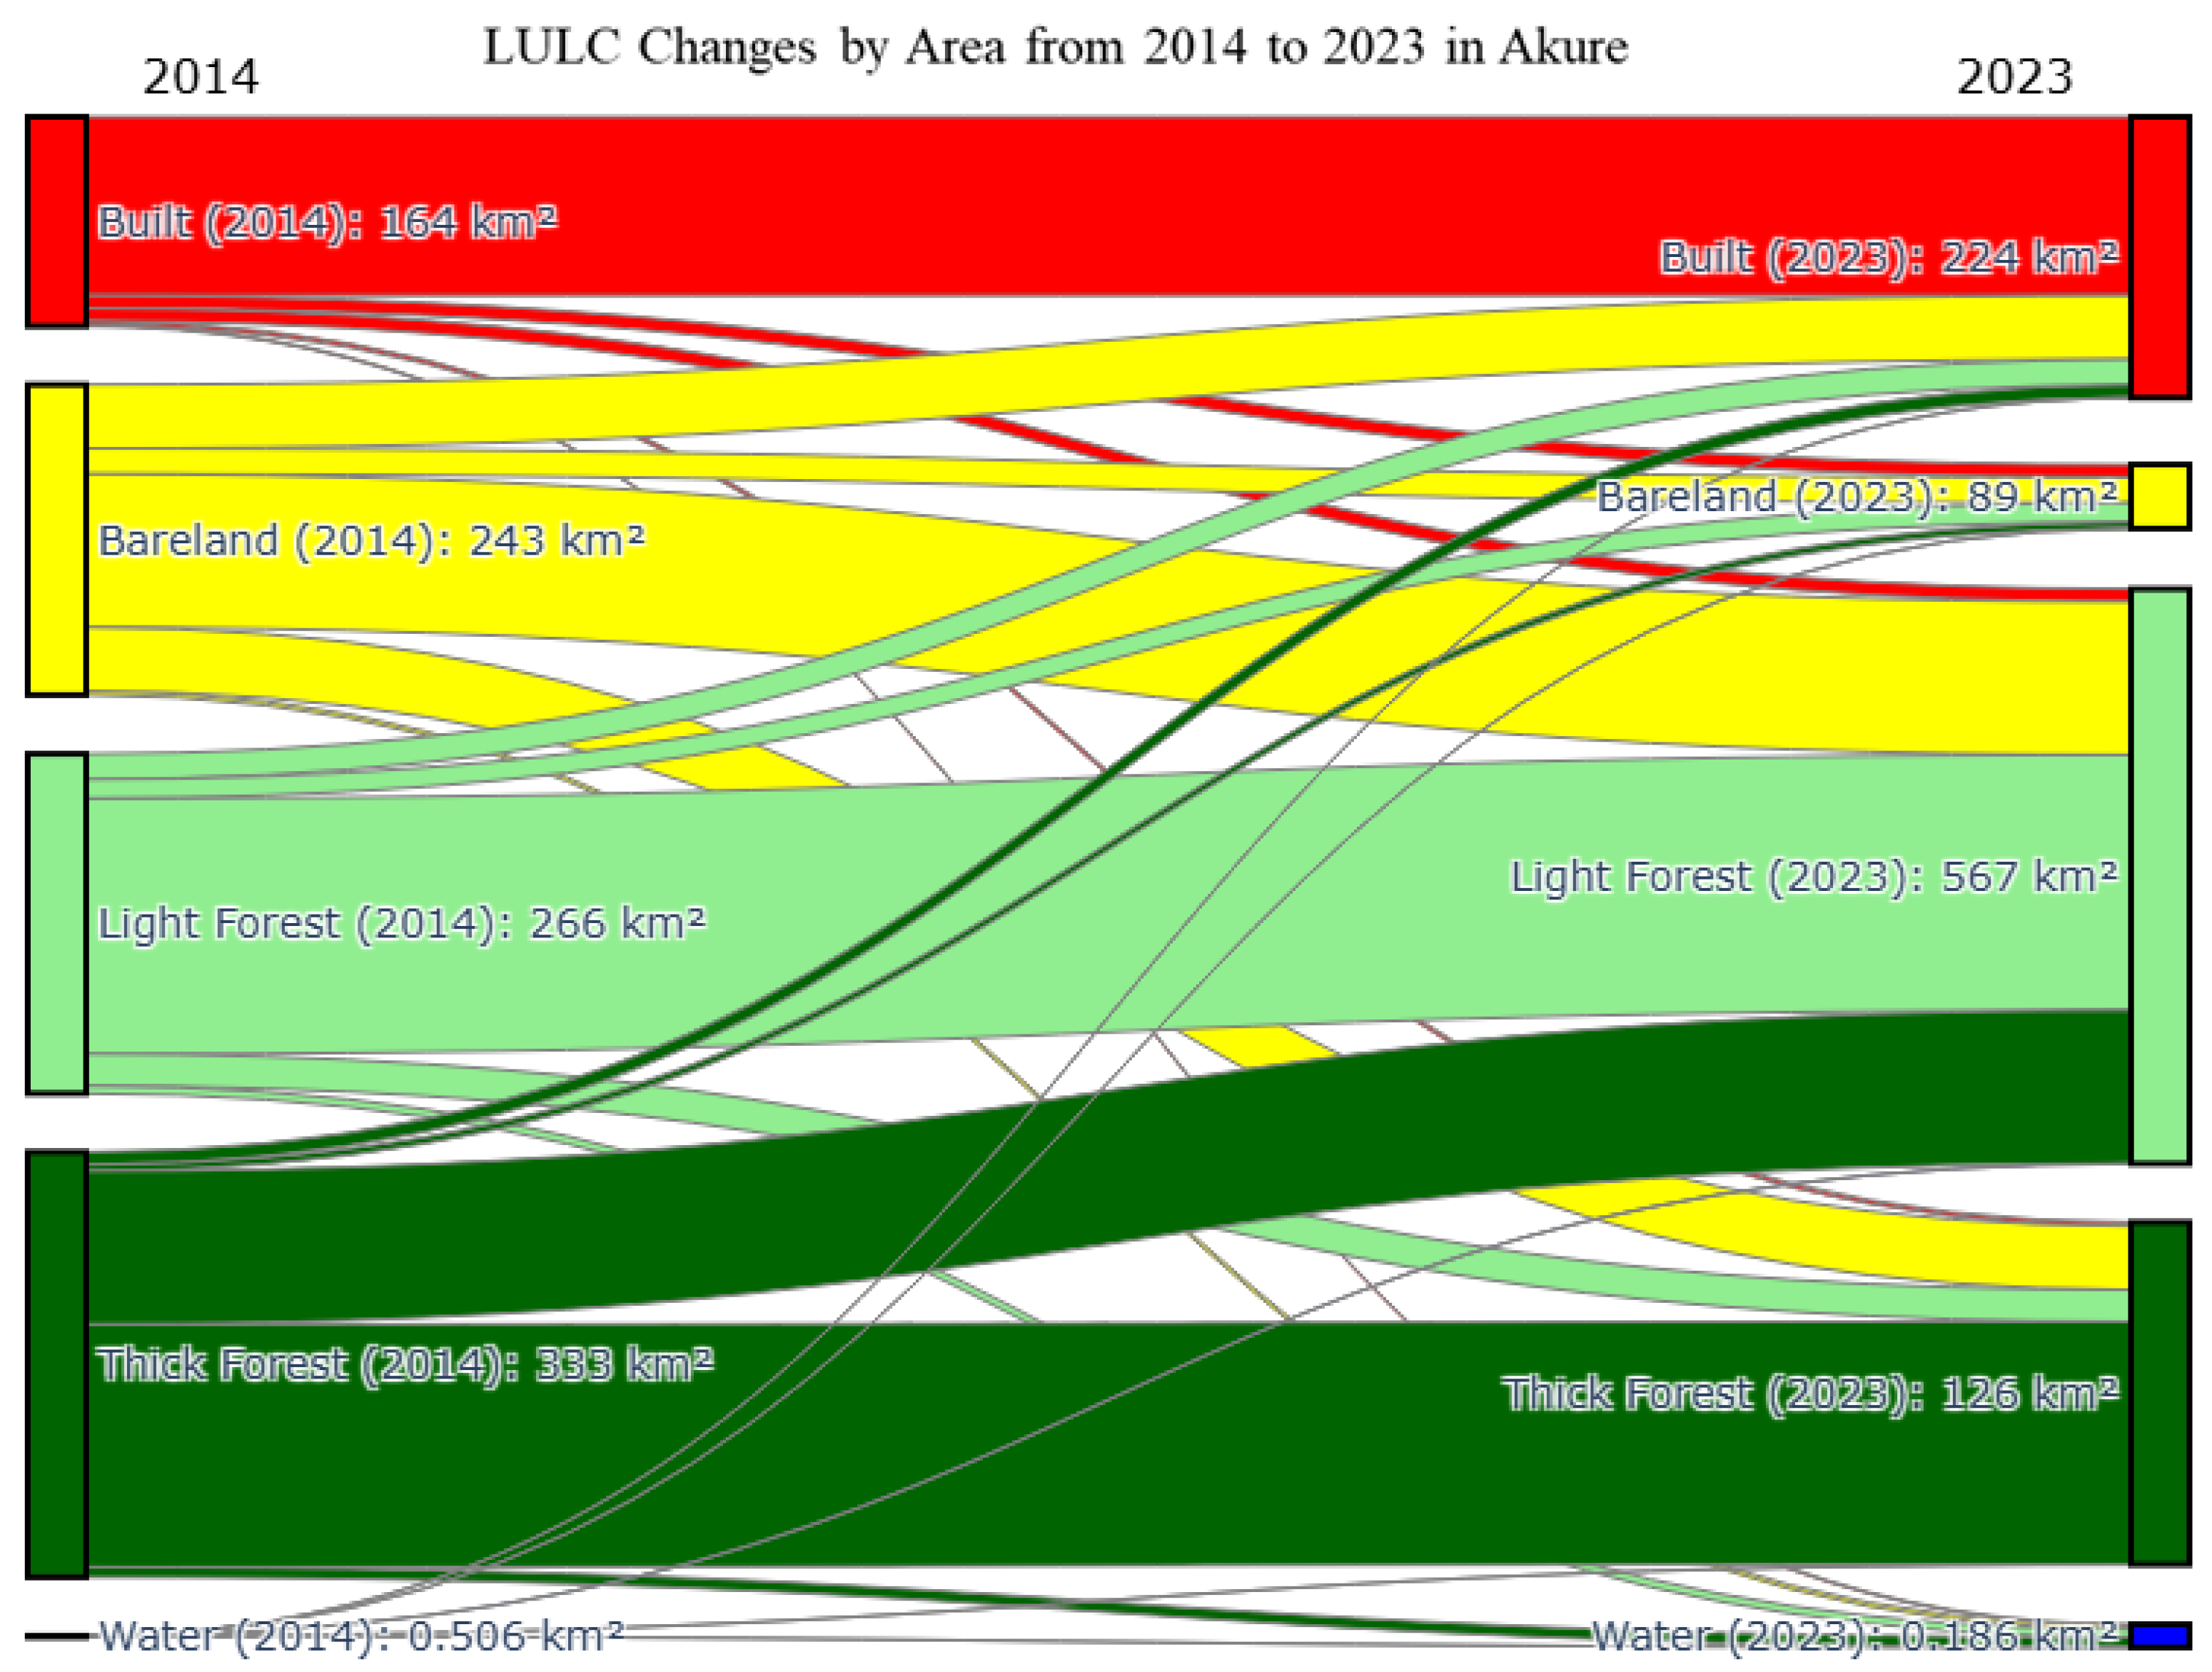
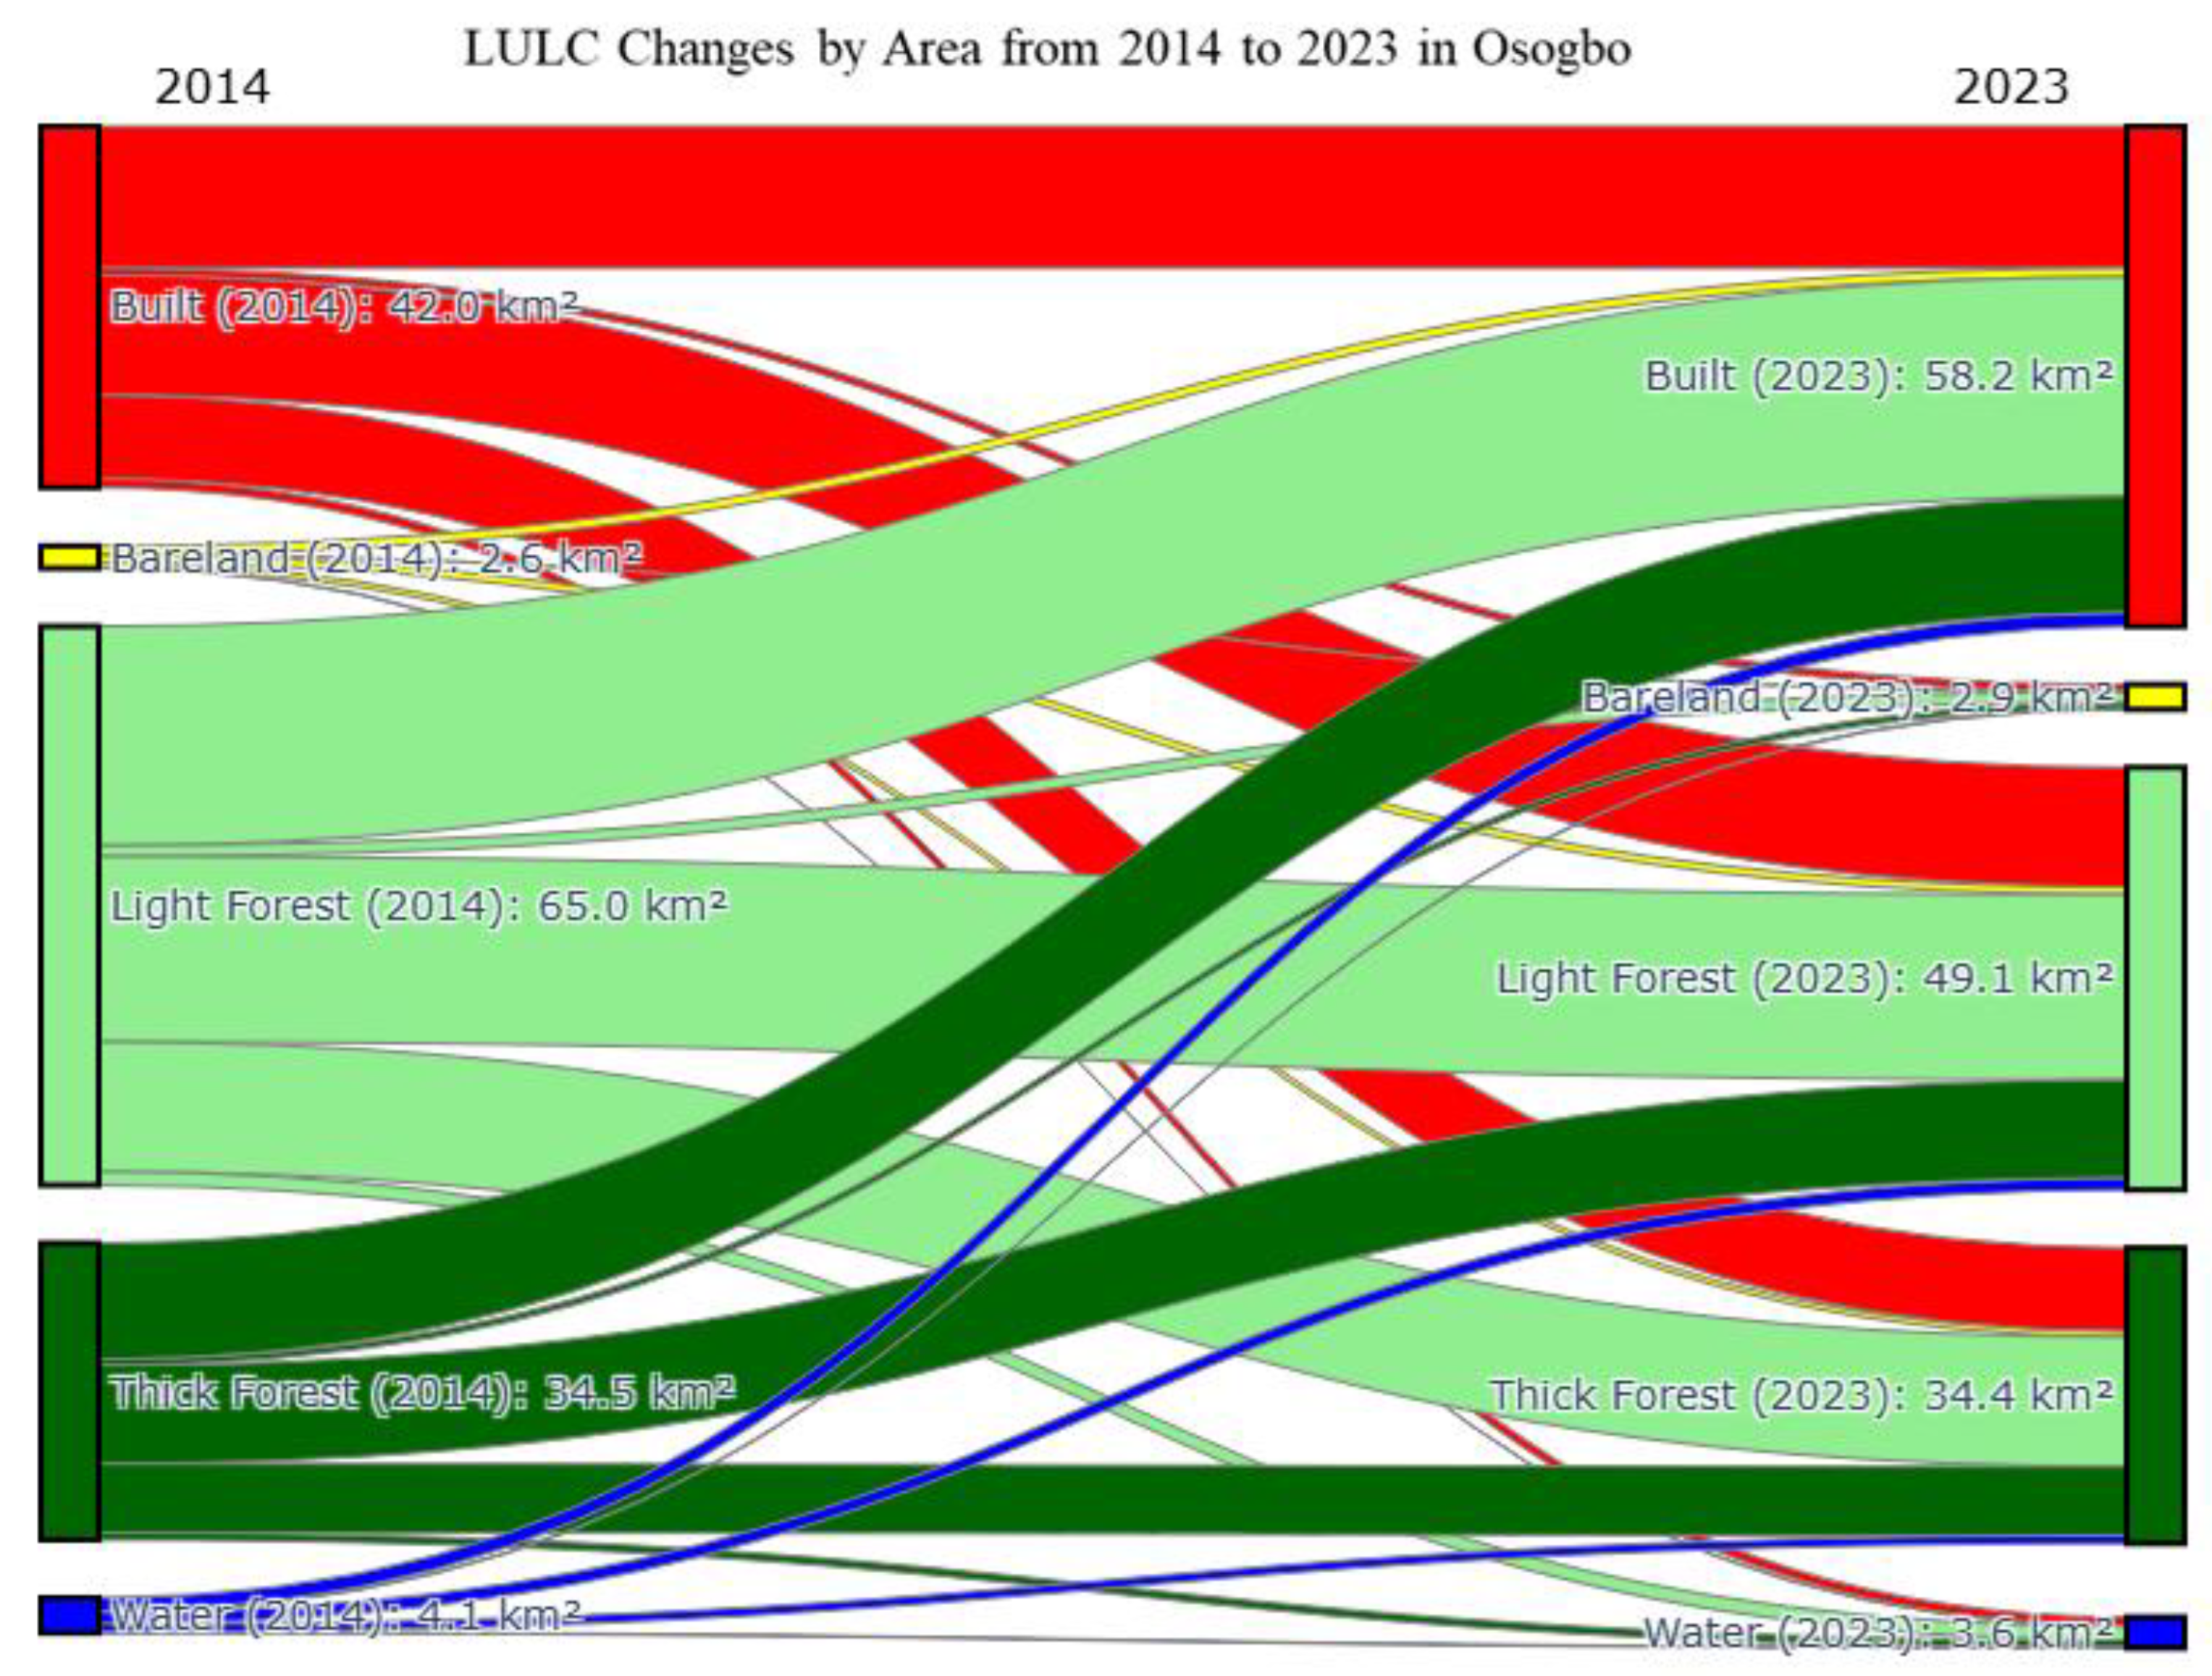
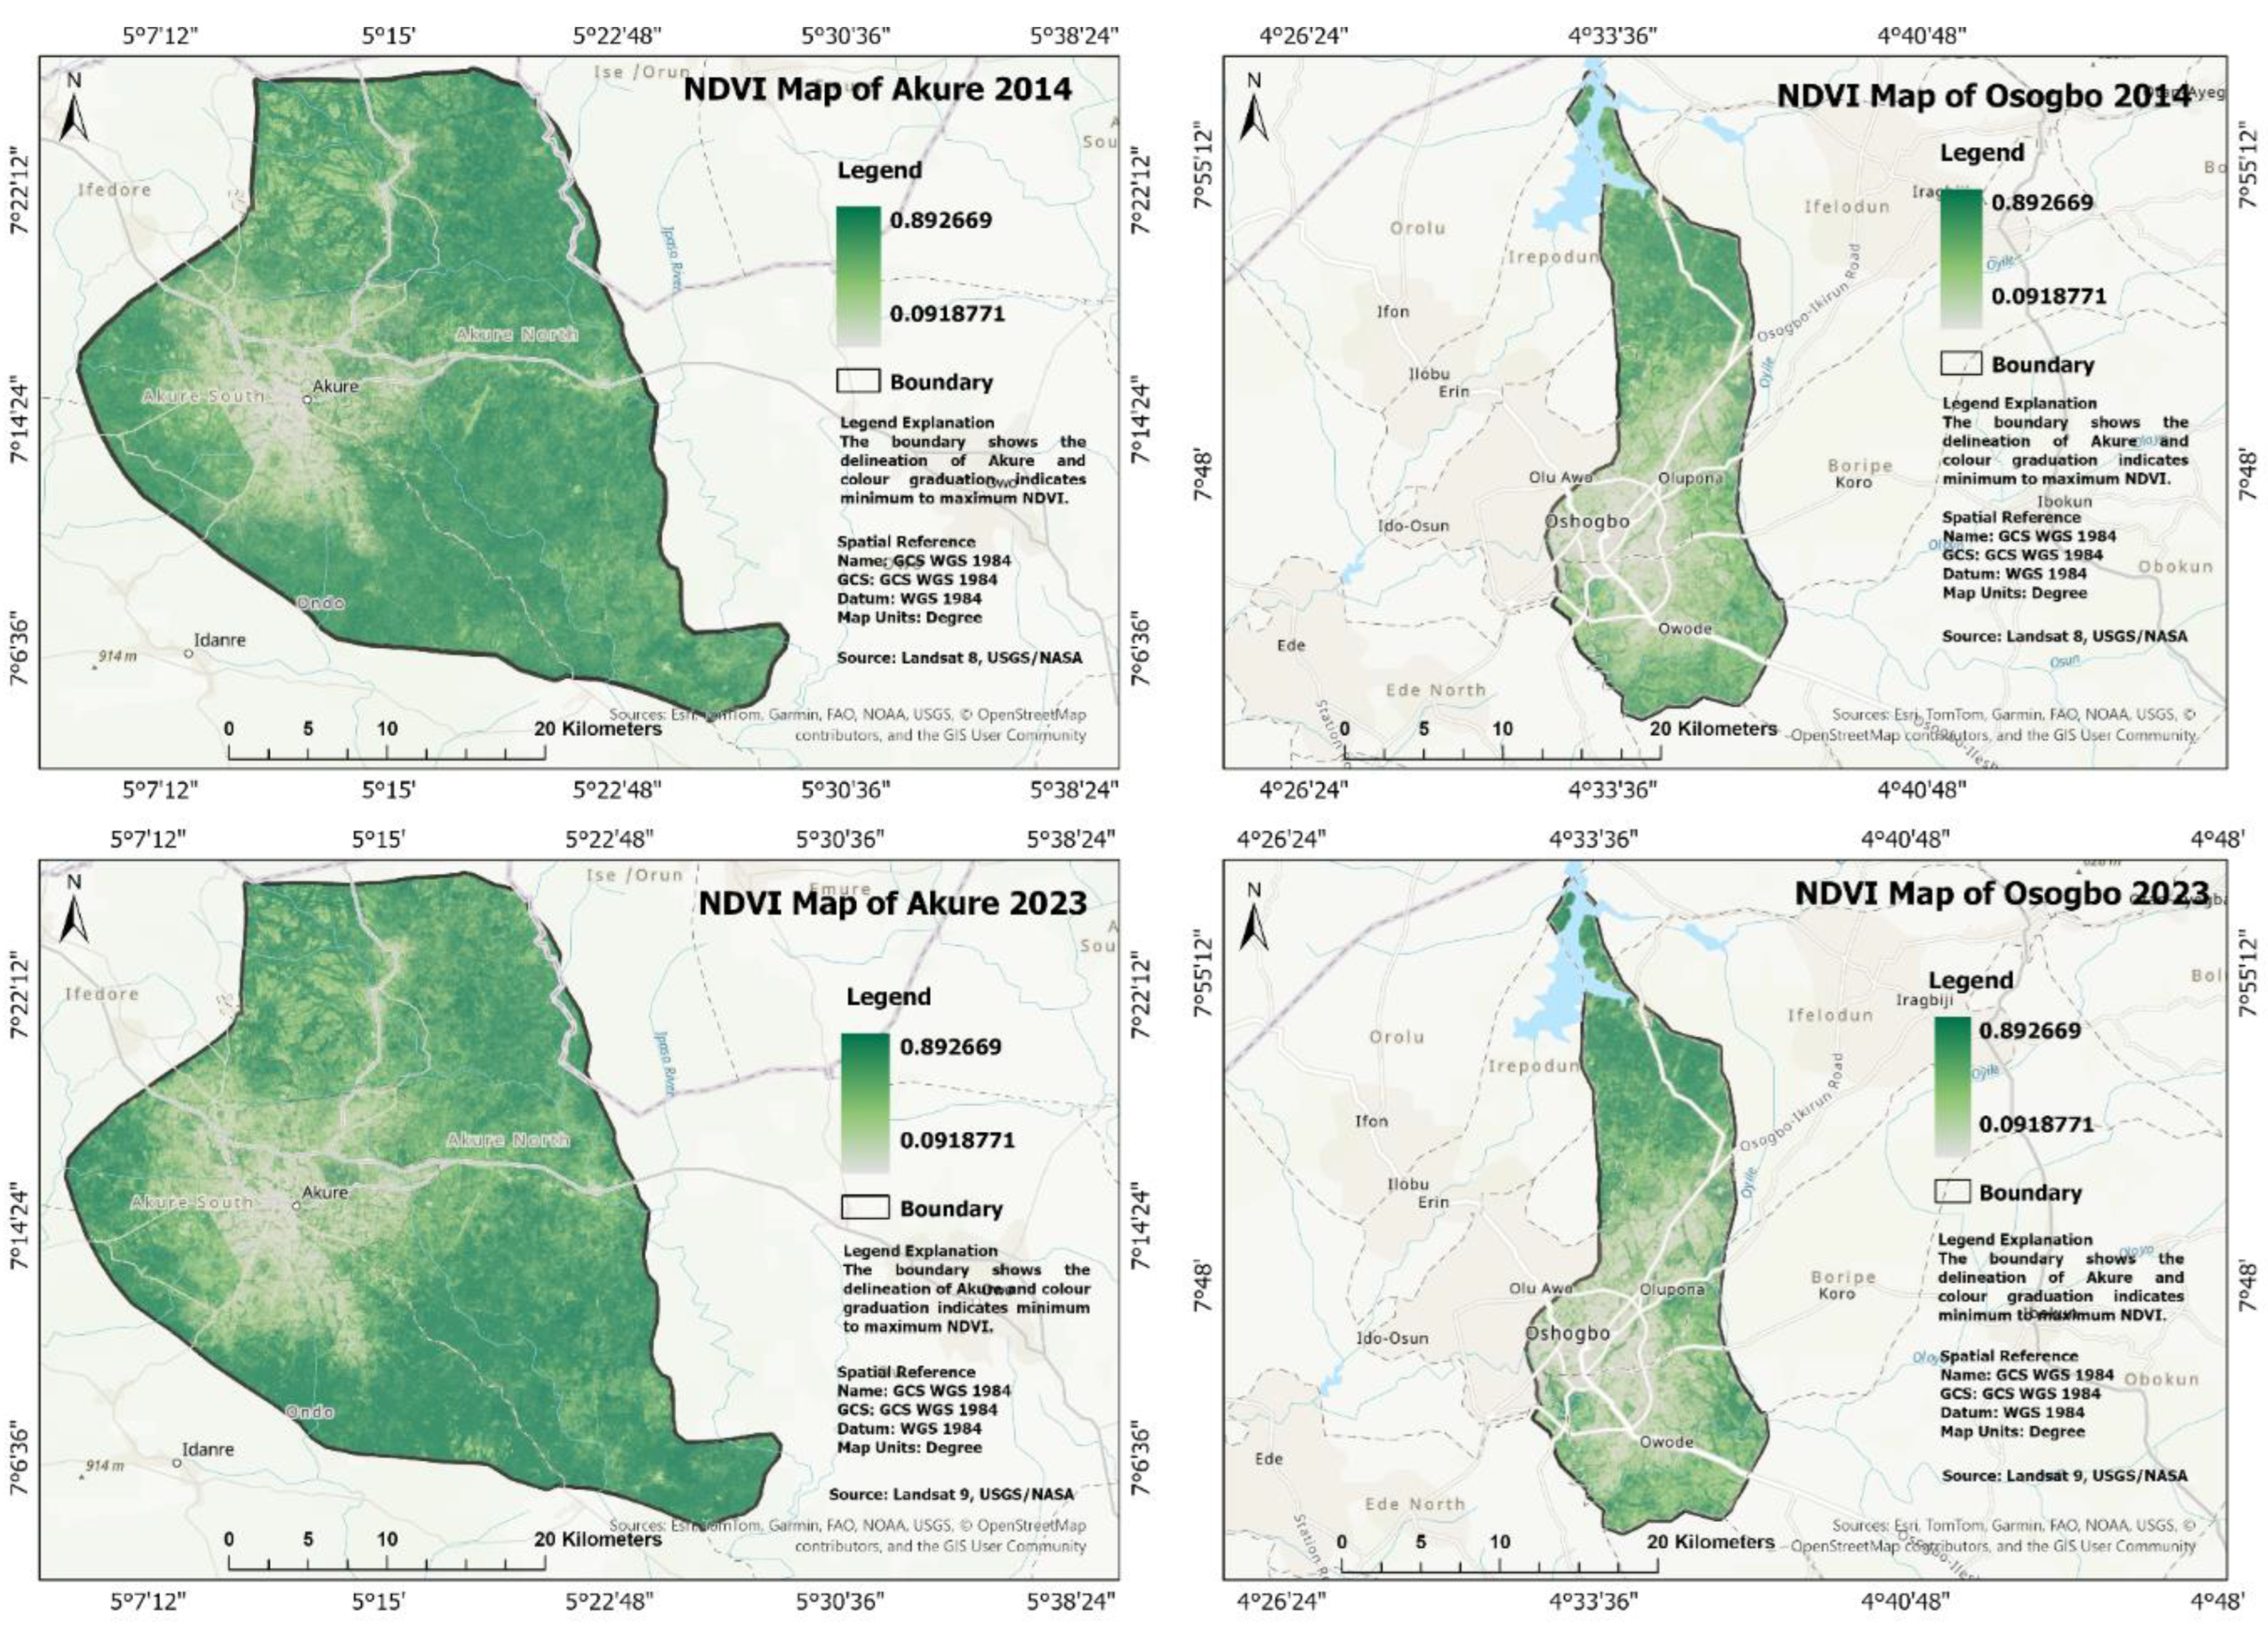
Rapid urbanization and climate impacts have raised concerns about the emergence and aggravation of urban heat island effects. In Africa, studies have focused more on big cities due to their growing populations and high socio-economic functions, while mid-sized cities remain understudied, with limited comparative insights into their distinct characteristics. This study therefore provided a spatiotemporal analysis of land use land cover change (LULCC) and surface urban heat islands (SUHI) effects in the Nigerian mid-sized cities of Akure and Osogbo from 2014 to 2023. This study used Landsat 8 and 9 imagery (2014 and 2023) and analyzed data via Google Earth Engine and ArcGIS Pro 3.4. Results showed that Akure increased significantly from 164.026 km² to 224.191 km² in the built areas while Osogbo witnessed a smaller expansion from 41.808 km² to 58.315 km² in built areas. This study identified Normalized Difference Vegetation Index (NDVI) and emissivity patterns associated with vegetation and thermal emissions and a positive association between LST and urbanization. The findings across Akure and Osogbo cities established that the LULCC had a different impact on SUHI effects. As a result, evidence from a mid-sized city might not be extended to other cities of similar size and socioeconomic characteristics without caution.

Keywords: 
;  ;  ;  ;  ;  ;  ;  

1. Introduction

Urbanization has increased significantly globally since the mid-twentieth century due to increasing anthropogenic activities accompanied by exponential increases in population. The global population of 2.5 billion in 1950 and 6.1 billion in 2000 is anticipated to be more than 8 billion towards the end of 2024 [1,2,3]. It is also estimated that 68 percent of the global population will reside in urban areas by 2050 [2,3,4]. This growth in the global and urban population is, however, unevenly distributed. While some countries in East Asia and Europe are experiencing low population growth, others in Sub-Saharan Africa and South Asia are inundated with increased growth [3,5,6]. In the case of Nigeria, 30, 35 and 43 percent of the population lived in urban areas in 1990, 2000 and 2010, respectively. However, 54 percent of the population were urban residents in 2023 [7].
The evidence of global, regional and local urbanization impacts is the manifestation of unplanned and informal development across cities [8]. Numerous studies [9,10,11,12,13] have shown that many natural landscapes in cities are converted into bare land and built-up surfaces as a result of increasing urbanization. This phenomenon concerns land use and land cover change (LULCC). On the one hand, land cover change refers to altering natural land features, and on the other hand, land use change refers to how humans use a piece of land [14,15]. LULCC, therefore, refers to the conversion, change and transformation of the Earth's natural landscape due to human actions and processes such as urbanization, deforestation and agriculture. LULCC contributes significantly to increasing city temperature by modifying natural green areas with impervious surfaces [16,17]. The current concern for contemporary cities is the formation of surface urban heat islands (SUHI) and their effects on the urban population.
SUHI is a phenomenon whereby cities become warmer than their rural environments [4,10]. The term "SUHI effect" reflects the temperature impacts that the residents in urban regions experience compared to their counterparts in rural surroundings [4,18]. Many studies [12,19,20,21] have asserted that SUHI effects result from urbanization and industrialization based on increased energy use for cooling alongside higher emissions from transportation and industry, leading to increases in greenhouse gas production. More so, due to the development of heat-absorbing materials like asphalt, concrete, and resistant surfaces, as well as increasing vehicle emissions and concentrated energy use, an increase in urban population density exacerbates the SUHI effect. For example, major SUHI effects have been observed in Delhi, New York, and Tokyo, resulting in increased energy consumption for cooling, increased air pollution, and negative health effects [22,23,24]. Other scholars have also revealed that city areas can be several degrees warmer than their rural counterparts, considerably influencing local temperatures and contributing to global climatic shifts [4,12,19,25,26].
In Nigeria, several cities are experiencing rapid expansion driven by natural population growth, political influence, industrialization and rural-to-urban migration as people seek better economic opportunities and services [20,27]. This expansion of both metropolitan and mid-sized cities is creating the problems of overburdened infrastructure, insufficient housing, increased bare land surfaces, and an increase in SUHI [28]. The issue of rapid urban growth, especially in mid-sized cities, requires a critical need for sustainable urban planning and climate mitigation strategies [18,29,30,31]. To provide information on mitigating temperature increases, public health consequences and climate change, as well as improving urban liveability and resilience, this study addresses the spatio-temporal context of LULCC and the SUHI effects in mid-sized cities, which are Akure and Osogbo in Nigeria. The SUHI effect is defined as increased land surface temperatures (LST) in urban areas relative to adjacent rural regions, primarily caused by land use and land cover changes [12,21]. This study will examine SUHI in Akure and Osogbo from 2014 to 2023, using Landsat 8 and 9 TIRS satellite data to extract LST, normalized difference vegetation index (NDVI), Emissivity, surface urban heat island (SUHI), urban thermal field variance index (UTFVI) and quantify geographical and temporal fluctuations. LULCC will be categorized using supervised machine learning techniques (Random Forest), and the association between LULCC and SUHI will be investigated using zonal statistics in ArcGIS Pro, including correlation analysis.
Rapid urbanization and climate impacts have raised concerns about the emergence and aggravation of SUHI effects. Empirical studies [32,33,34] have emphasized that the transformation of natural land cover to impervious surfaces alters surface energy balance, thereby leading to localized increases in temperature. In Africa, several studies [34,35,36] have concentrated on big cities such as Cape Town, Accra, Lagos, Cairo and Nairobi. This is because of their growing populations and high socioeconomic functions, whereas medium-sized cities have received little attention. Consequently, the findings on these big cities are not easily transferable to mid-sized cities due to their distinct attributes as lower hierarchical settlements. The limited studies [37,38,39] available on mid-sized cities tend to examine them in isolation without offering comparative insights across different cities. Whereas, such insights will aid in understanding their distinct urbanization patterns and climate impacts, allowing decision-makers to determine whether mid-sized cities require the same or different resource allocations during planning and management, especially in developing nations with limited resources. This study, therefore, investigated the relationship between land use and land cover (LULC) change and SUHI effects in Akure and Osogbo between 2014 and 2023 to provide valuable insights on how to adopt city-specific strategies in reducing SUHI effects as each city has distinct characteristics, such as socioeconomic variables, growth trends, urban green infrastructure plans, and climate adaptation and mitigation programs. This study has three research questions namely: (i) How has LULCC altered in Akure and Osogbo between 2014 and 2023? (ii) What are the spatial and temporal variations in the effects of SUHI on Akure and Osogbo from 2014 to 2023? And (iii) What is the relationship between LULCC and SUHI effects in Akure and Osogbo during the study? The objectives of this study are to (i) assess the LULCC in Akure and Osogbo, (ii) estimate the SUHI effects in Akure and Osogbo, and (iii) examine the relationship between LULCC and SUHI effects in Akure and Osogbo between 2014 and 2023. The following sections will outline the materials and methods, including the study area, data acquisition, and data analysis. The study results will cover LULC changes in Akure and Osogbo from 2014 to 2023, the surface urban heat island (SUHI) effects in these cities during the same period, and the relationship between LULC changes and SUHI effects. Finally, the discussion and conclusion will be presented.

2. Materials and Methods
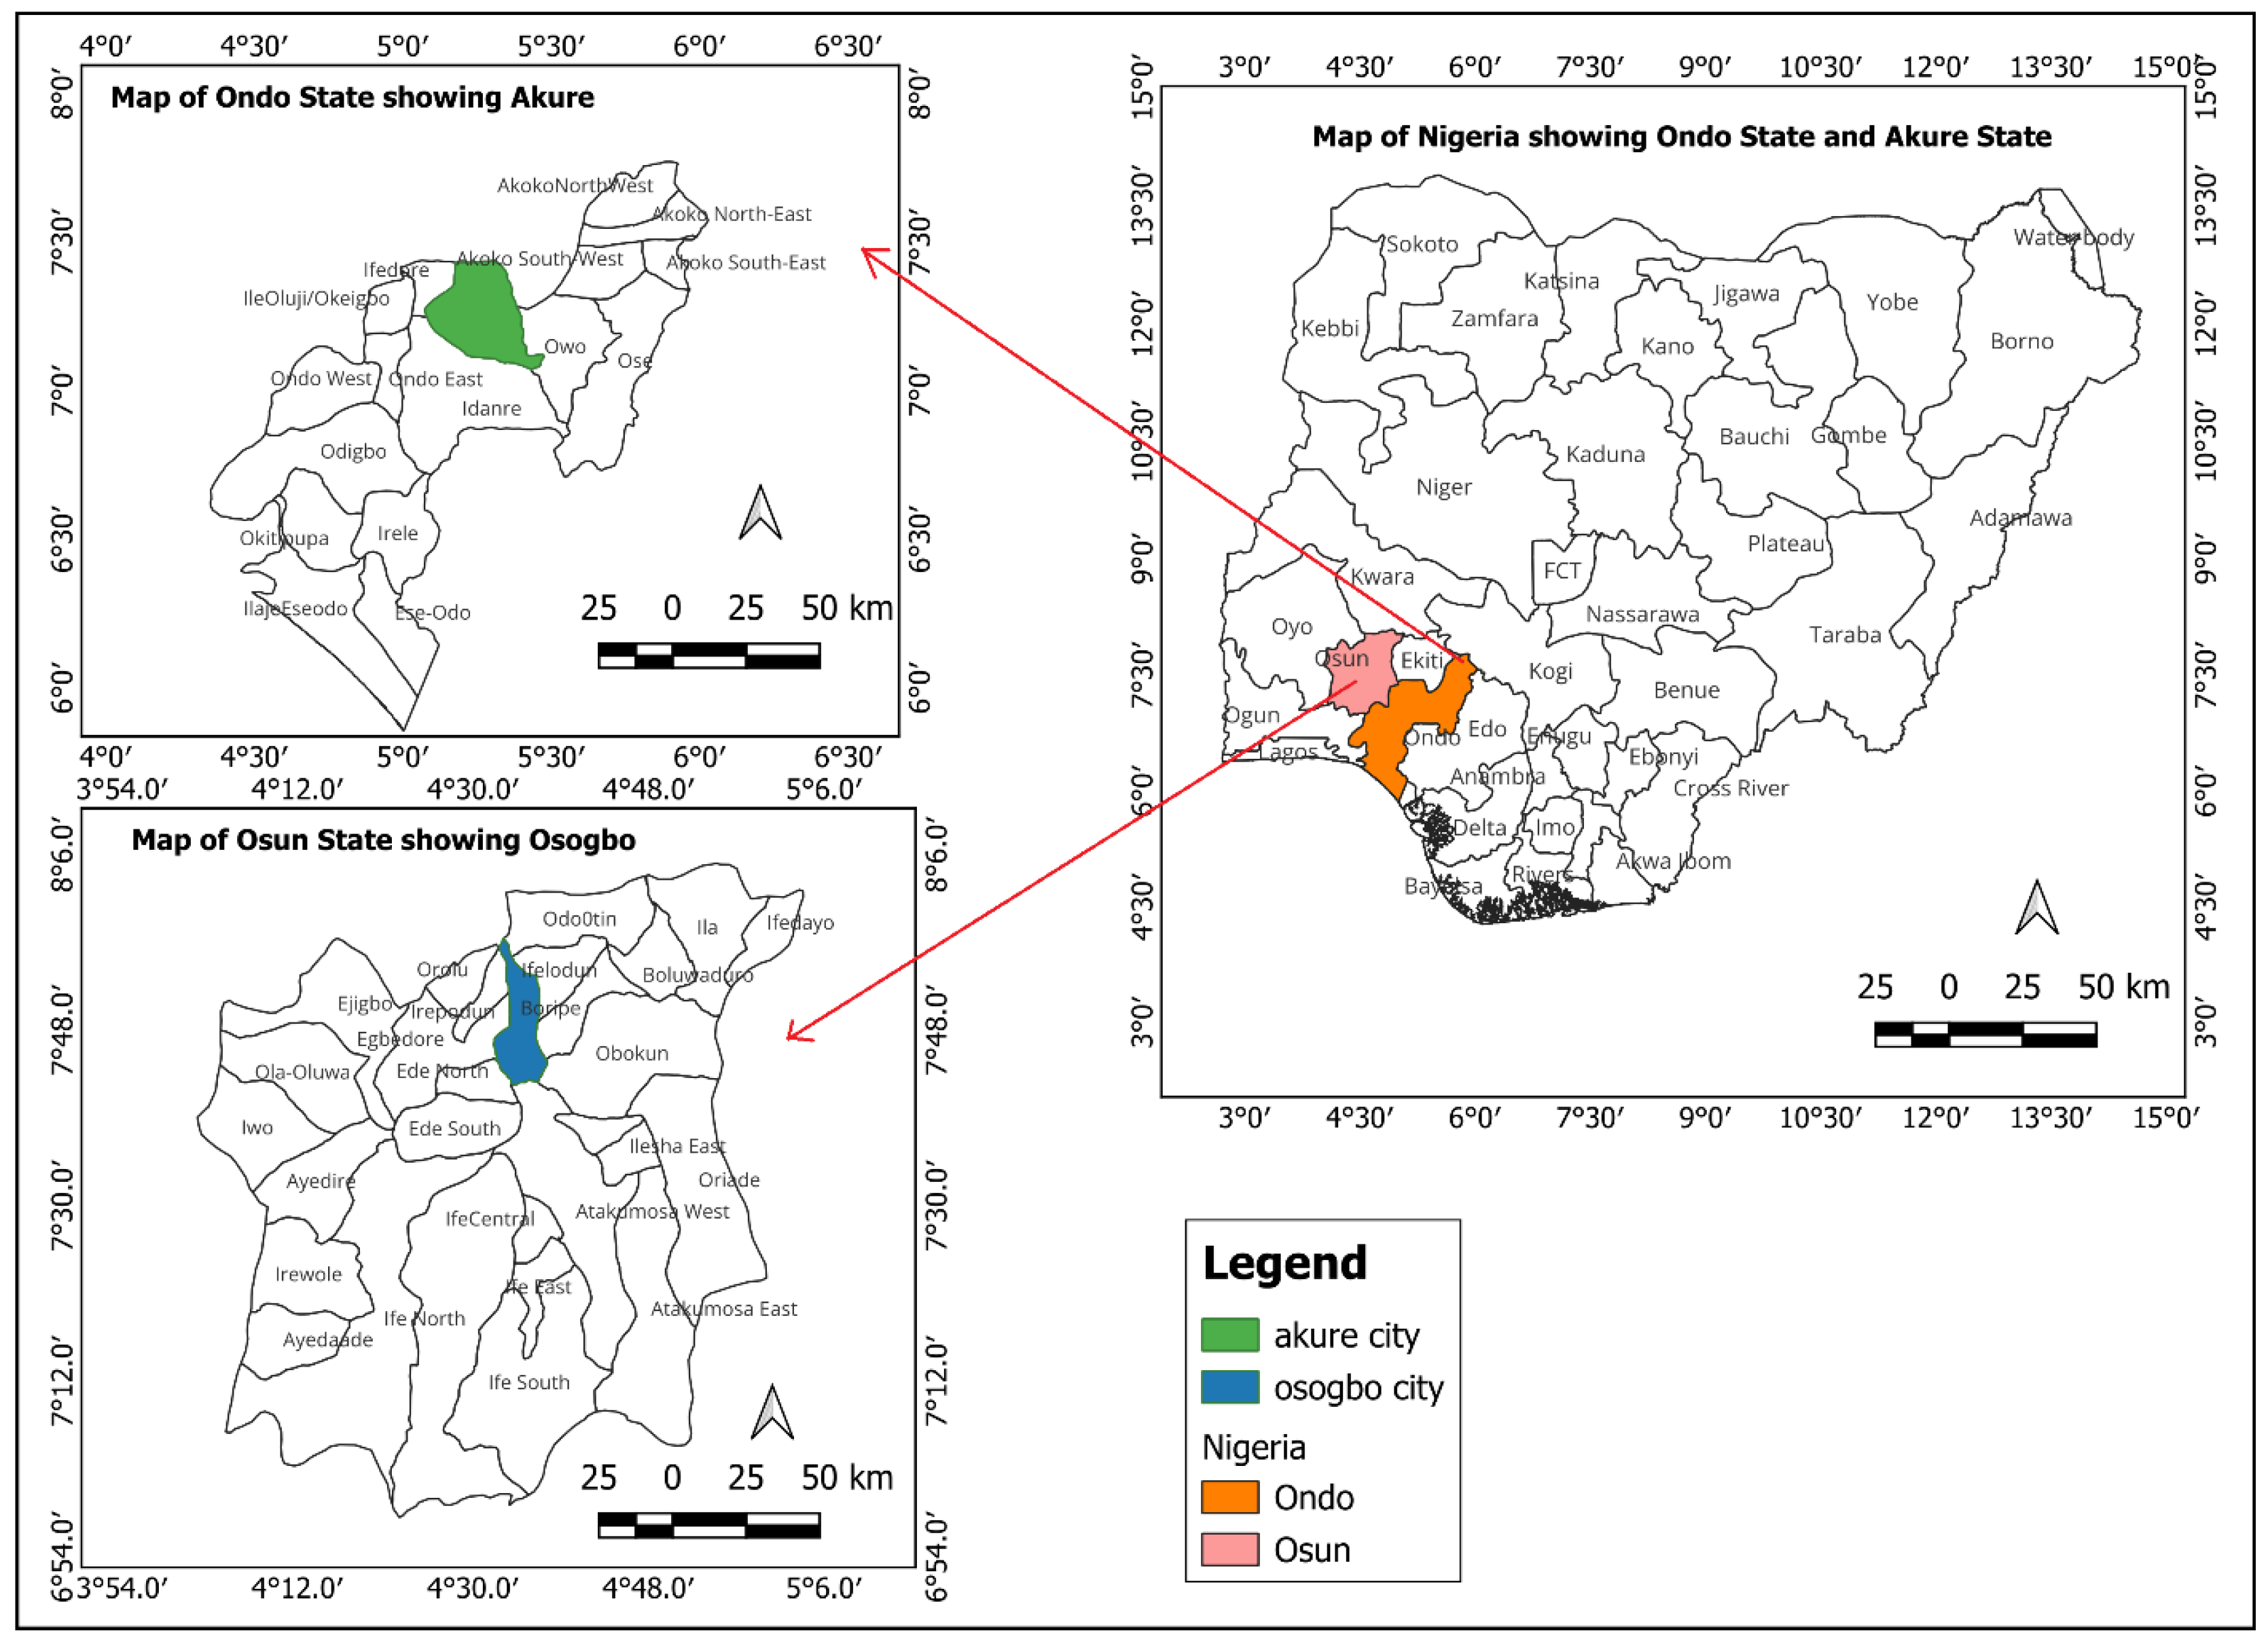
2.1. Study Area

This study is conducted in Nigeria, a developing country in West Africa. The study area comprises two mid-sized cities: Akure and Osogbo. Akure is in Ondo State, which is positioned in the southwestern part of Nigeria. The city is situated at 7.25° N latitude and 5.20° E longitude (Figure 1). It is the major administrative and economic centre of Ondo State. It comprises two local governments, namely Akure North and South [4]. According to the 2022 population census, the Akure North Local Government population was 200,900, while the Akure South Local Government population was 553,400 [40]. Akure has seen an influx of people from its hinterlands, including Ifedore and Idanre since it was designated as the capital of Ondo State in 1976. [41] found a correlation between this occurrence and the city's physical alterations and increased urban development. The city spans a variety of environments, including tropical rainforests and savanna woodland. Akure's economy is diverse, with agricultural (particularly cocoa, yam, and cassava farming), trade, industry, and services supporting a mix of traditional and modern residential and business sectors [42].
Osogbo is in Osun State, situated in the southwestern part of Nigeria. The city is located at 7.77°N latitude and 4.56°E longitude (Figure 1). Osogbo is the capital city of Osun State with two local government councils, namely Olorunda and Osogbo local government areas. It is important to note that Osogbo has only two local government areas [43,44,45,46], in contrast to various literature portraying Osogbo with several local governments, which is frequently referred to as Osogbo and its environs in their articles [9,18,47]. These have caused general misunderstanding on a global scale regarding the correct geographical extent of Osogbo on the world map. Osogbo is an important administrative, cultural, and economic centre. Since Osun State was established in 1991, the population has increased dramatically, which has increased urbanization and the influx of people into Osogbo and its suburbs. The population of Osogbo local government was 201,900 in 2022 and Olorunda local government's 170,900 population in 2022 [40]. As the State Capital, it houses government offices, educational institutions, and cultural landmarks, significantly contributing to regional governance and development.

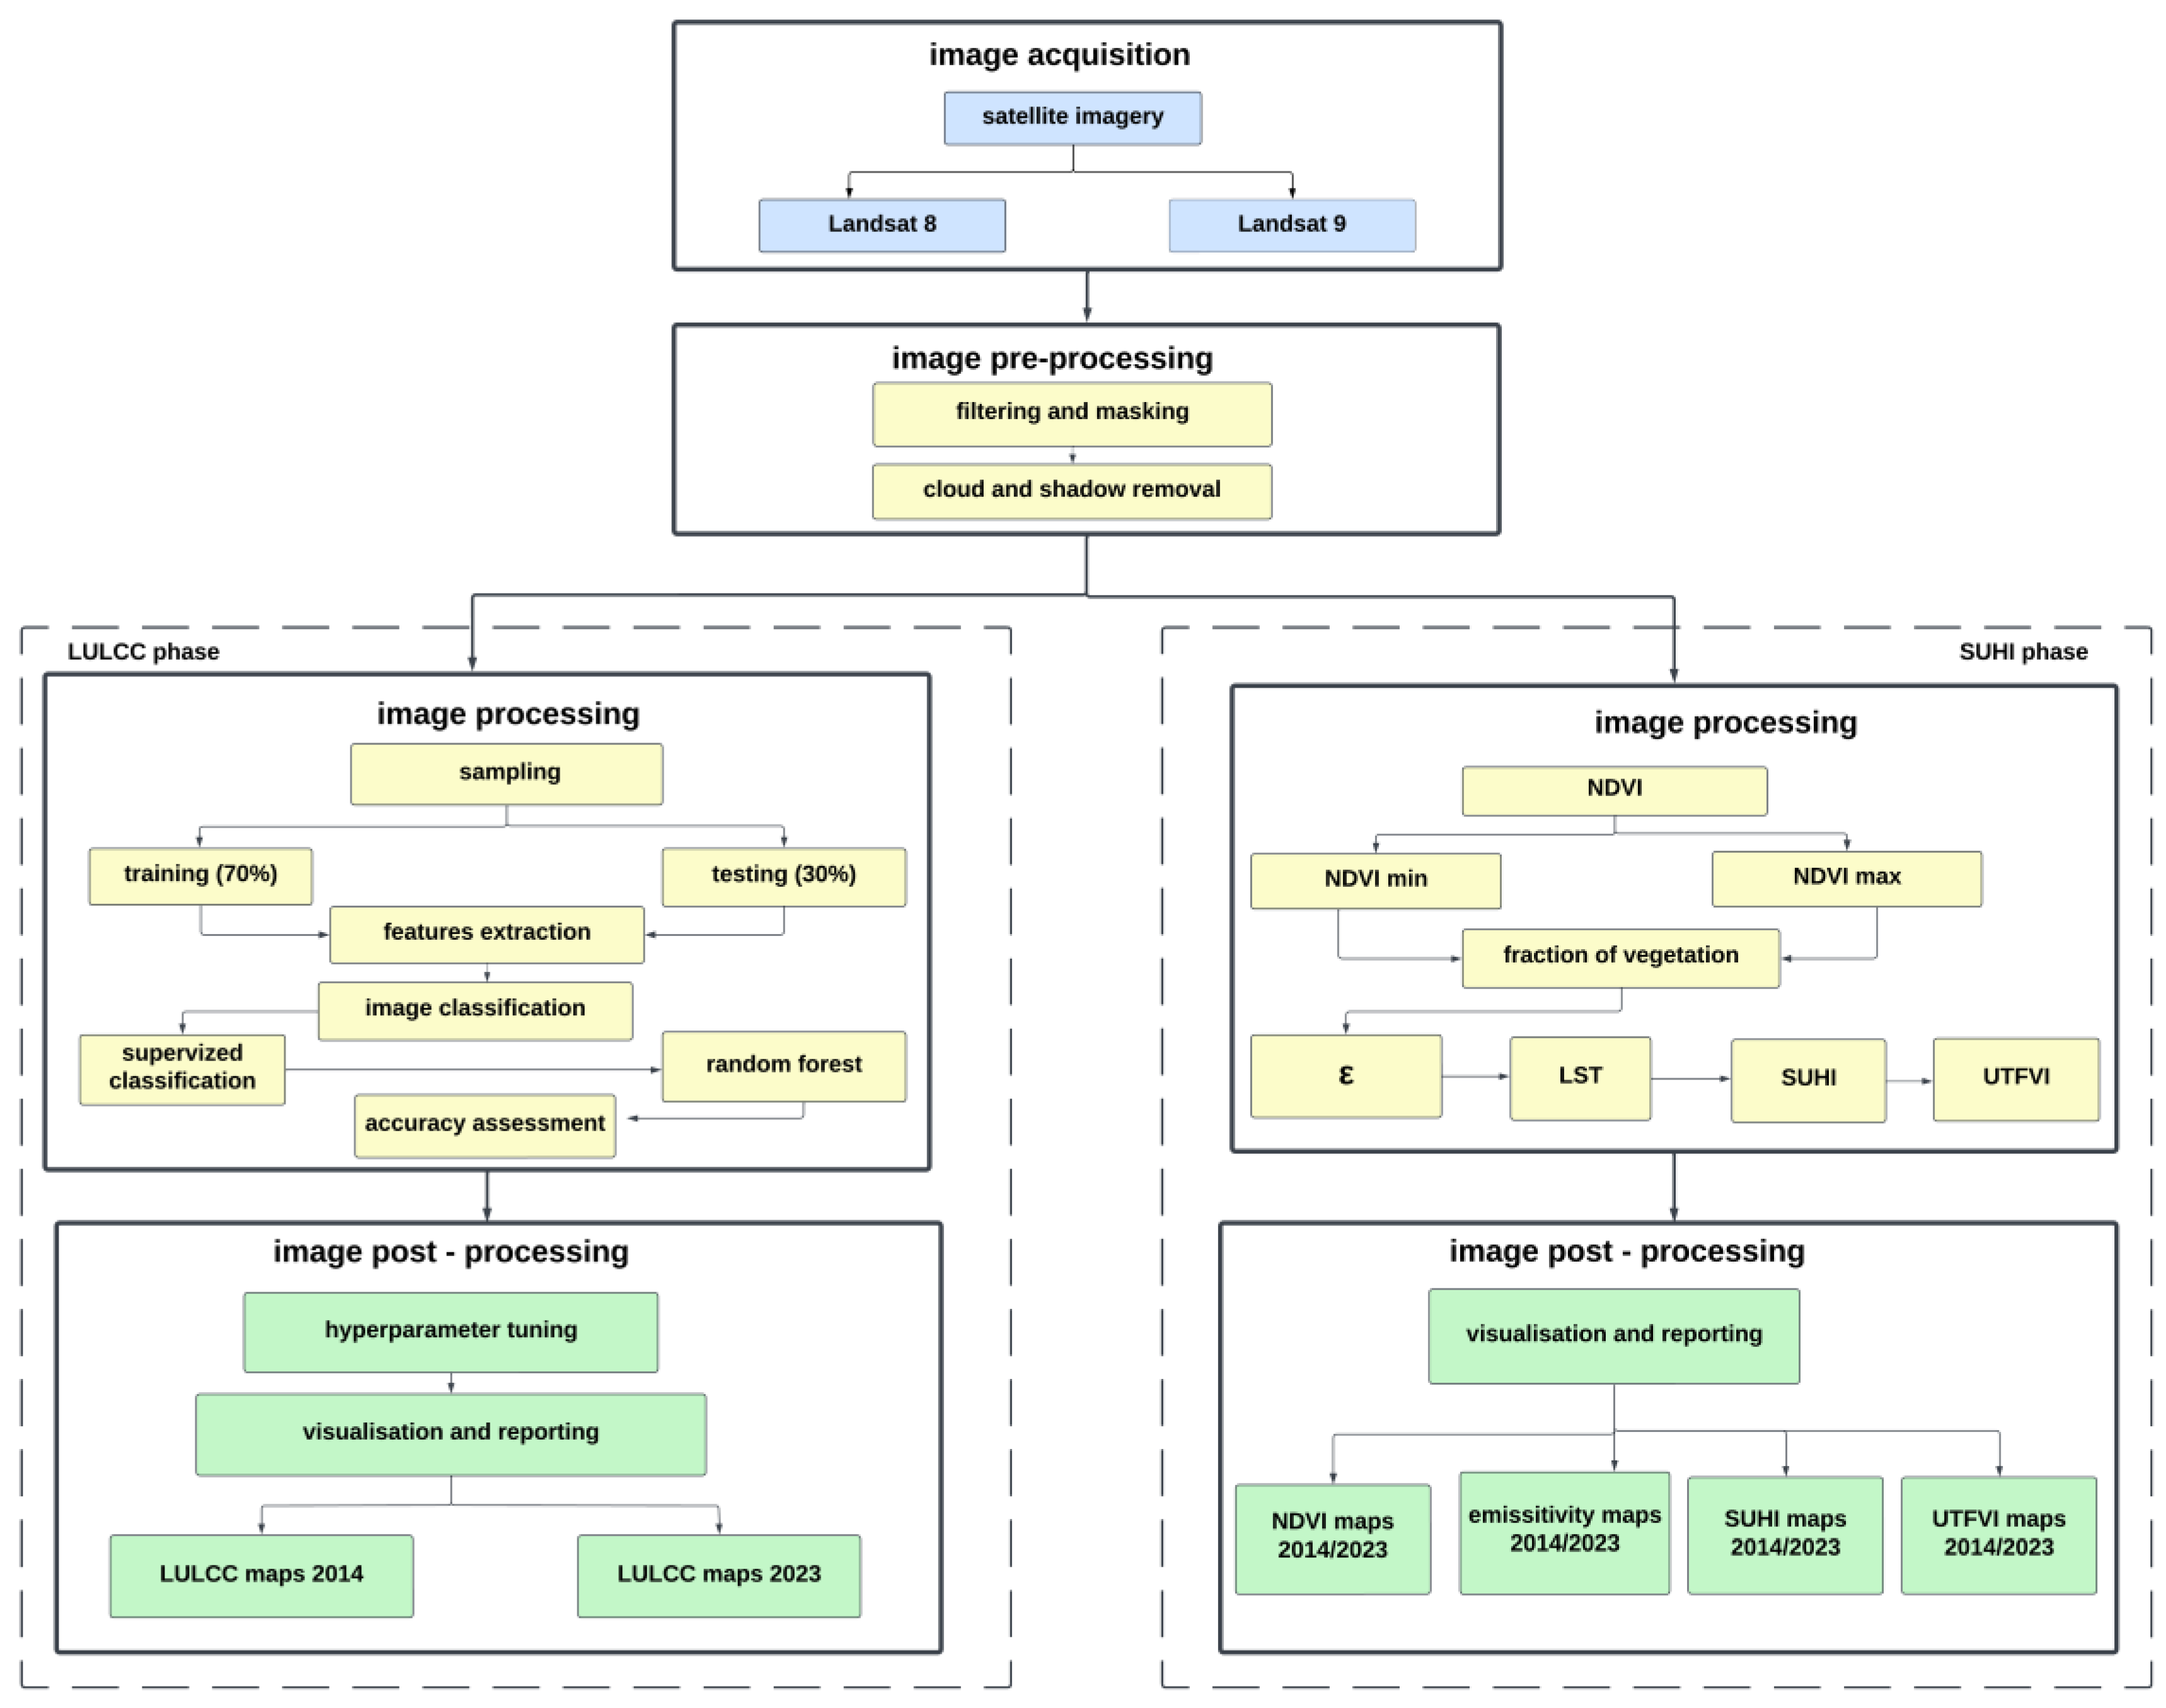
2.2. Data Acquisition

This study used Landsat images produced by the National Aeronautics and Space Administration (NASA) / United States Geological Survey (USGS). The data were sourced from the Google Earth Engine (GEE) catalog, a cloud platform for environmental monitoring and research that provides massive satellite datasets, scalable computing power, and machine learning for geospatial analysis [48]. Specifically, data were obtained from two Landsat sensors. The first is Landsat 8 (acquired on June 4, 2024), the Ordinary Land Imager-1/ Thermal Infrared Sensor-1 (OLI-1/TIRS-1). The second is Landsat 9 (acquired on June 5, 2024), the Ordinary Land Imager-2 and Thermal Infrared Sensor-2 (OLI-2/TIRS-2). Both sensors contain eleven (11) spectral bands (Table 1). The data required are for LULC classification and the analysis of vegetation, emissivity and temperature for SUHI estimation. Hence, the bands with the spectral information needed for these data types are acquired. In GEE, satellite image collections were acquired from Landsat 8 for 2014, and those from Landsat 9 were acquired for 2023. See Figure 2 for the methodological framework. The dates were chosen based on the data available and the quality of the Landsat sensors. The polygon shapefiles of Nigeria and its states were acquired from DivaGIS. The boundaries of Akure and Osogbo were extracted from shapefiles in ArcGIS and used as the region of interest (AOI).

2.3. Data Analysis

2.3.1. Image Classification

The respective AOI for Akure and Osogbo were imported into GEE to specify the boundary for the study. The image collections for Landsat 8 ("LANDSAT/LC08/C02/T1_L2“) and Landsat 9 ("LANDSAT/LC09/C02/T1_L2") were obtained and filtered by dates (date range equals January 1 - December 31, 2014; and January 1 - December 31, 2023). The images were filtered for cloud cover at less than 30. The masked pixels were filled with annual median values. The median images of the image collections for 2014 and 2023 were derived. The spectral indices of NDVI complemented the median images to provide additional spectral information. The aggregated bands were subject to the Random Forest classifier for supervised classification. Before the classification, sample data were collected within the GEE classes for five identifiable Akure and Osogbo classes: built, bare land, light forest, thick forest, and water. Ground observation points were assembled with Google Earth Pro's aid to evaluate the LULC maps' correctness [49,50]. The random forest classifier was trained with 70% of the sample data and tested with 30% of the sample data. The accuracy classification is also evaluated using the Kappa coefficient matrix.

2.3.2. Random Forest

[51] has created a new non-parametric ensemble machine-learning technique called Random Forest (RF). The RF algorithm frequently addresses environmental issues, such as managing natural hazards and water resources. It can handle various data, including numerical and satellite imagery. It is a decision tree-based ensemble learning technique that combines huge ensemble regression and classification trees. The number of trees, described by "n-tree," and the number of features in each split, justified by "hyperparameter tuning" were the parameters needed to set up the RF model used. Classification trees allow each tree to make its own decisions and offer precise classification to control the majority vote among all the trees in the forest. In this study, we created LULCC maps of Akure and Osogbo using the Google Earth Engine's "randomForest" package. The RF algorithms perform hyperparameter tuning with a testing range of 10, 100, and 10 sequences and with the smileRandomForest for nTrees. The hyperparameter tuning chart for trees and accuracies identified the best NTrees. The RF classification was done with the best hyperparameter value, and the classes of LULC of Akure and Osogbo were merged and displayed.

2.3.3. Quantitative Analysis

This study employed quantitative methods to evaluate the accuracy and reliability of classification results. The key statistical tools involved include the Kappa coefficient, Normalized Difference Vegetation Index (NDVI), and Confusion Matrix. The Kappa coefficient, which starts from -1 to 1, is an arithmetic measure used to estimate the accuracy of LULC classification by matching the observed classification with reference or ground truth data. It is more robust than simple accuracy because it considers the possibility that the agreement occurred by chance. Equation i shows the formula for calculating the Kappa coefficient. 1 indicates perfect agreement, 0 indicates no agreement beyond chance, and negative values suggest agreement is worse than random [52]. The formula used for Kappa calculation is:
K = Po - Pe 1 - Pe -------------------- equation (i)
where P o is the observed accuracy and P e ​ is the expected accuracy by chance.
Normalized Difference Vegetation Index (NDVI) is a popularly used remote sensing indicator to measure vegetation health and cover [53]. It is determined using satellite imagery's red and near-infrared (NIR) bands (equation ii).
NDVI = NIR - Red NIR + Red -------------------- equation (ii)
NDVI values range from -1 to +1, where higher values specify compact vegetation, values close to zero recommend bare soil and negative values typically signify water or non-vegetative surfaces. In this study's LULC analysis, NDVI helps distinguish between vegetated and non-vegetated areas and monitor changes over time.
A confusion matrix is one of the important parts of evaluating classification performance. It shows the number of accurate and inaccurate projections made by the model related to the actual classifications. The matrix helps calculate various accuracy metrics, such as overall accuracy (equation iii), producer’s accuracy, consumer’s accuracy and kappa coefficient. The confusion matrix was used for testing, and the training matrix was used to analyze the actual and predicted classification [54]. This matrix is very important in validating and assessing LULC classifications, offering a demanding evaluation of the model's performance and other metrics such as precision, recall, and F1 score were calculated by:
Overall Accuracy = Sum of Diagonal Elements Total   Number   of   Samples ​ -------------------- equation (iii)
Emissivity (ε) is the energy discharged by a surface divided by the energy radiated by a blackbody at the same temperature [55]. The ε can be calculated with the NDVI threshold approach (equation iv). This method identifies land cover types (built, bare land, light forest, thick forest and water) with different emissivity values. It is then determined based on the percentage of vegetation and the type of land cover with the following equation:
ε = εv ​⋅ Pv ​+ εs​ ⋅ (1−Pv​) + C -------------------- equation (iv)
where: εv ​ is the emissivity of thick vegetated surfaces (usual range of 0.985), Pv is the Proportion of Vegetation in the study area. (usual range 0 and 1), εs is the emissivity of bare land (usual range of 0.960), and C is a correction factor for surface roughness, which can usually be set to zero except specific roughness data is obtainable.
Land Surface Temperature (LST) is an important parameter for determining the surface energy balance, land cover types, and SUHI monitoring [56]. It requires three main stages namely (i) converting digital numbers to TOA radiance (equation v), (ii) converting radiance to brightness temperature (equation vi) and (iii) applying surface emissivity correction to get the actual LST (equation vii).
(i) Convert Digital Numbers (DN) to TOA Radiance. The Top of Atmosphere (TOA) radiance (Lλ​) is estimated as: L λ = M L * Q cal + A L ​-------------------- equation (v)
where: M L = Radiance multiplicative scaling factor, A L ​ = Radiance additive scaling factor, Q c a l = Digital number (DN) of the thermal band.
(ii) Convert TOA Radiance to Brightness Temperature. The Planck equation estimates the brightness temperature (TB) in Kelvin:
T B = K 2 ln K 1 L λ + 1 -------------------- equation (vi)
where: K1​ is the thermal constant 1, K2 is the thermal constant 2, Lλ is the TOA radiance from stage (i).
(iii) Correct for Surface Emissivity to Calculate LST. The normalized land surface temperature (LST) is determined by adjusting the brightness temperature using surface emissivity (ε):
LST = T B 1 + λ T B ρ ln ε -------------------- equation (vii)
where: λ is the wavelength of emitted radiance (λ = 10.895×10⁻⁶ for Landsat 8 and 9, ρ is h ⋅ c / σ = 1.438 × 10⁻² m·K (Planck's constants), and ε is the emissivity.
SUHI is medium where the built areas experience substantially higher temperatures than surrounding rural areas [39]. It is calculated using LST as given below (equation viii):
SUHI = LST   -   LSTmean LS T STD -------------------- equation (viii)
where: LST is the land surface temperature; LSTmean is the mean of the LST; and LSTSTD is the standard deviation of the LST.
The Urban Thermal Field Variance Index (UTFVI) quantifies the thermal comfort and environmental stress in the built areas based on the difference between the land surface temperature and the mean LST [57]. It is calculated in the given below equation (equation ix):
UTFVI = LST   -   LSTmean LST -------------------- equation (ix)
We calculated the UTFVI by entering the necessary parameters into GEE reducers. [58] define UTFVI ranges as follows: <0.000 (none), 0.000-0.005 (weak), 0.005-0.010 (moderate), 0.010-0.015 (strong), 0.015-0.020 (stronger), and ≥0.020 (the strongest). Based on these classifications, we divided the UTFVI in our study area into three categories: -0.225 to -0.031 (none), -0.030 to 0.070 (moderate), and 0.071 to 0.281 (strong). The SUHI effects are rated excellent, good, and poor within these categories.
The Nigeria shapefile was downloaded and processed in QGIS Desktop 3.36.0 to create the study area map. Additionally, ArcGIS Pro 3.4 was used to map the LULC, NDVI, Emissivity, LST, SUHI, and UTFVI shapefiles. Statistical analysis, including Spearman’s correlation, was conducted using Python libraries to assess the correlation between NDVI and SUHI. The relationship between LULC and SUHI effects was analyzed through zonal statistics in ArcGIS Pro 3.4. LULC change classifications for Akure and Osogbo were further visualized with Sankey charts using Python libraries, illustrating land cover changes from 2014 to 2023. These shapefiles were then downloaded and pre-processed in ArcGIS Pro to generate all necessary study maps.

3. Results

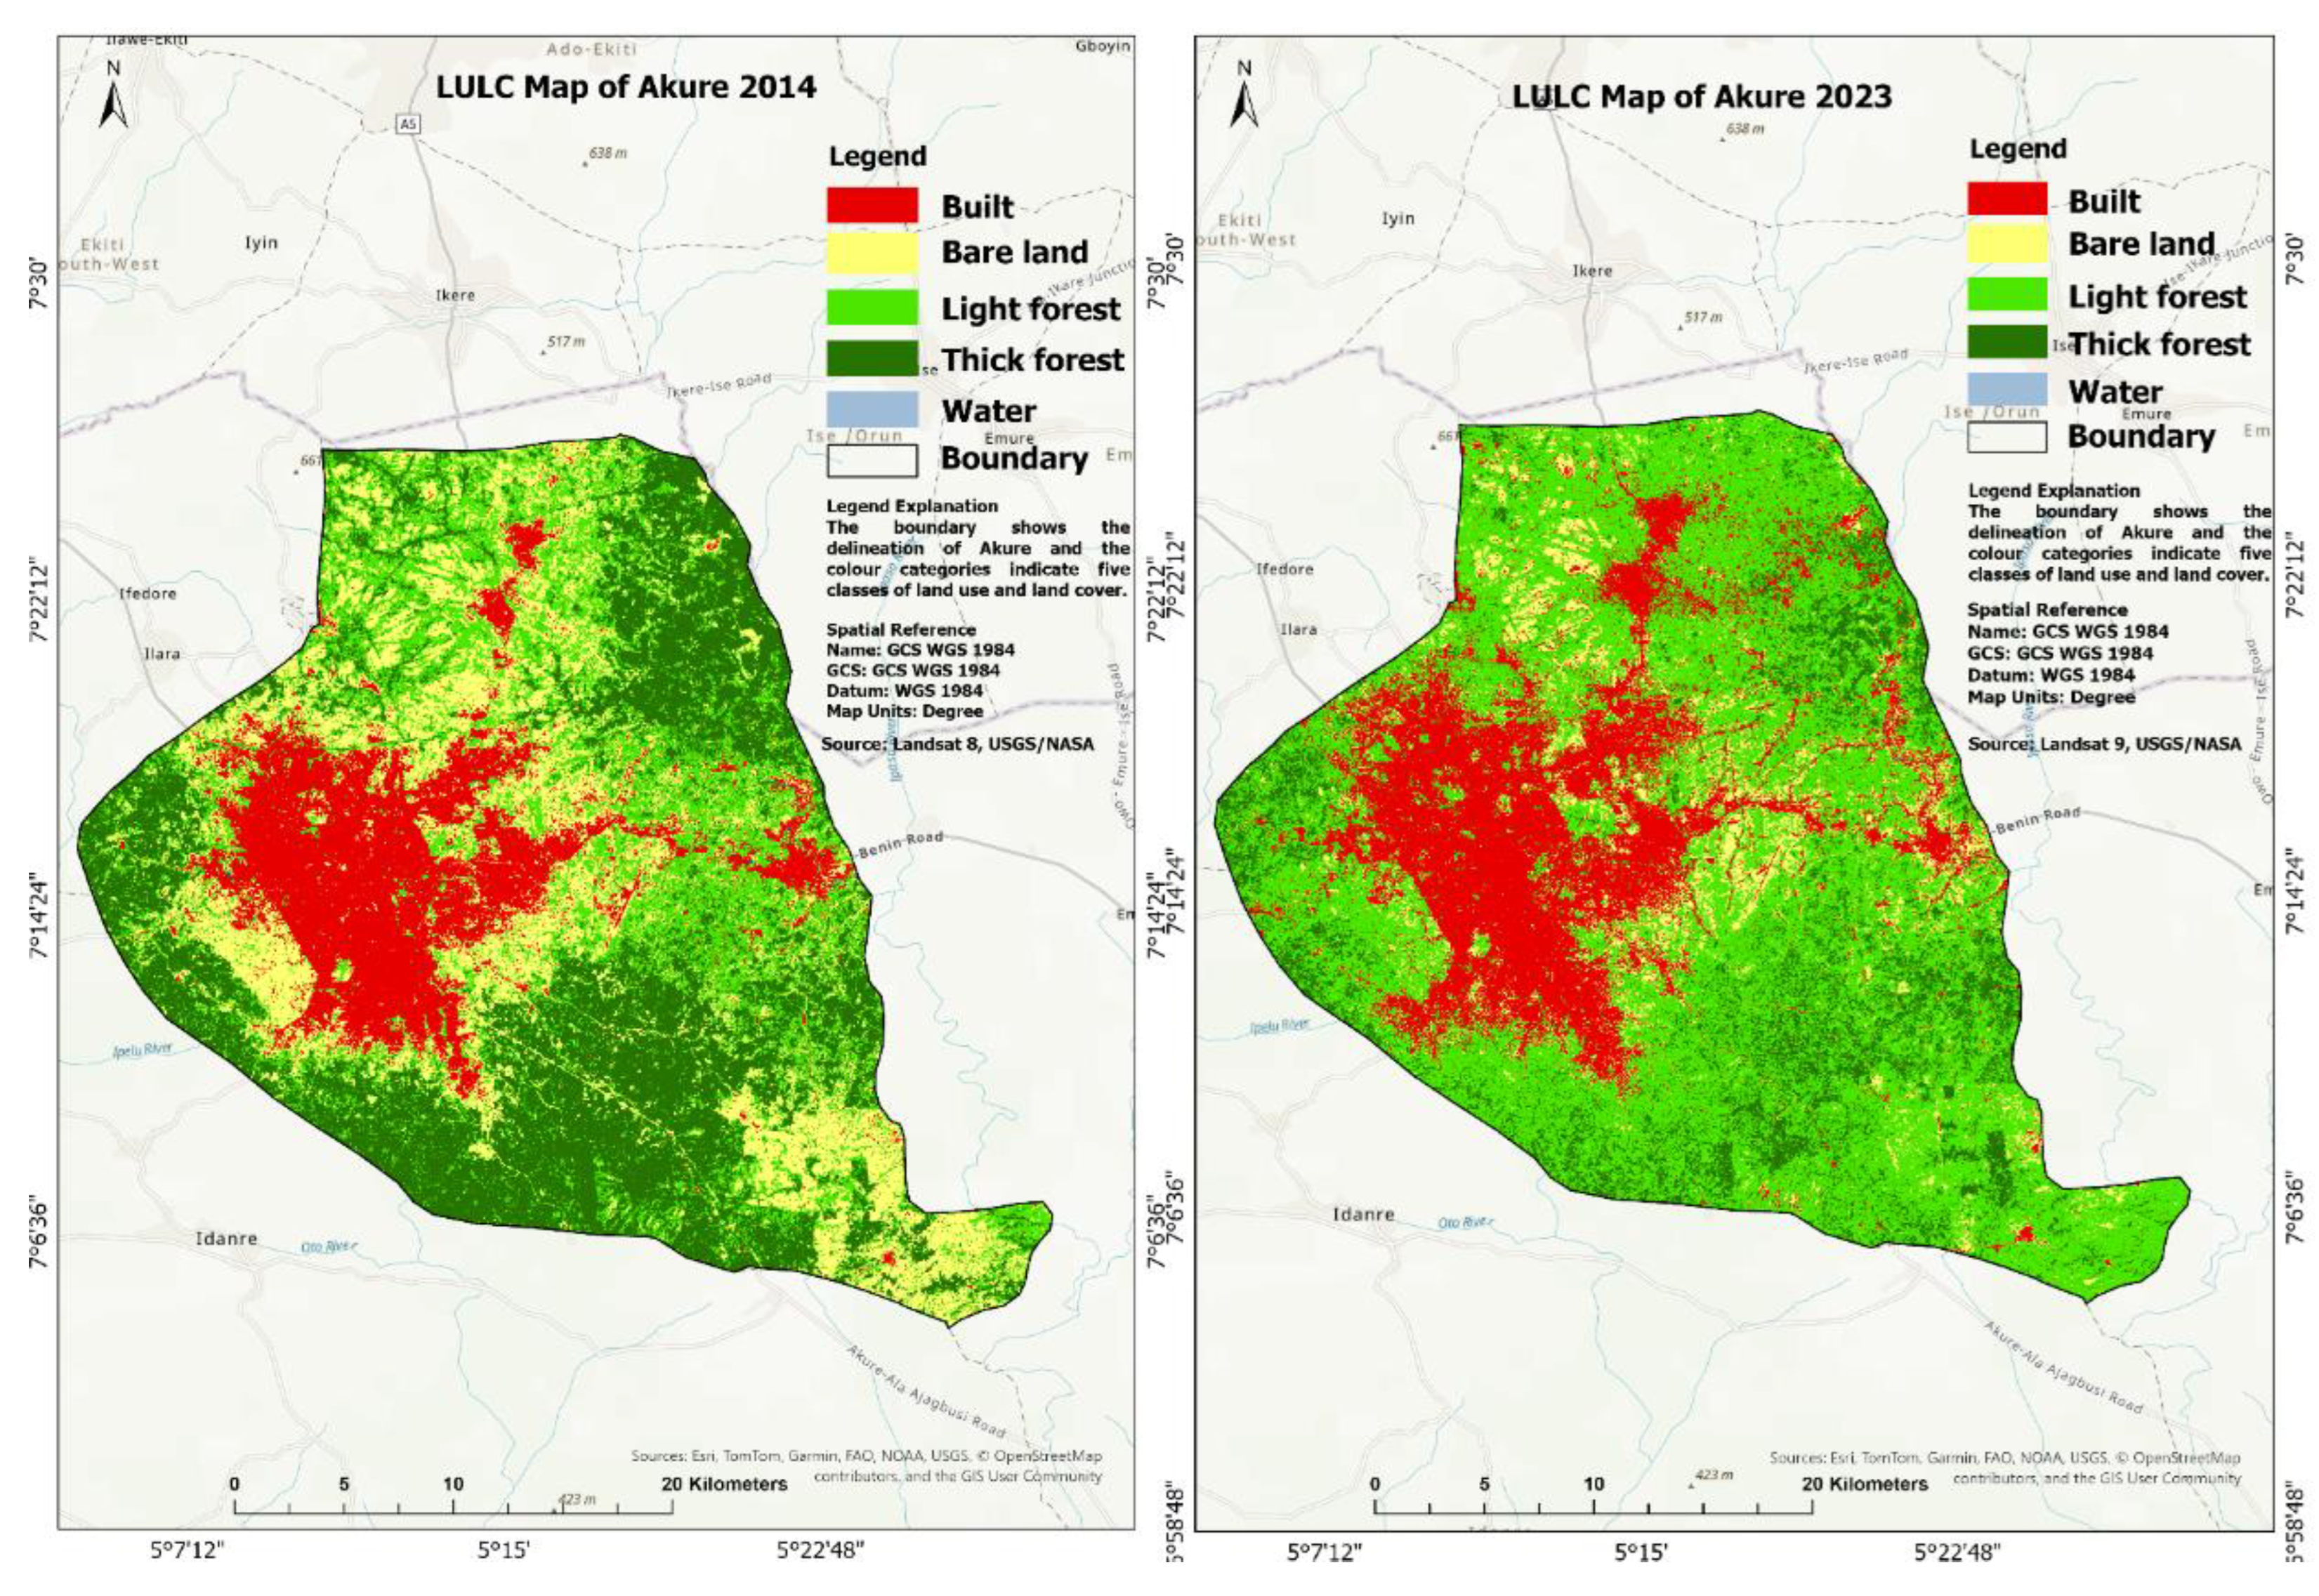
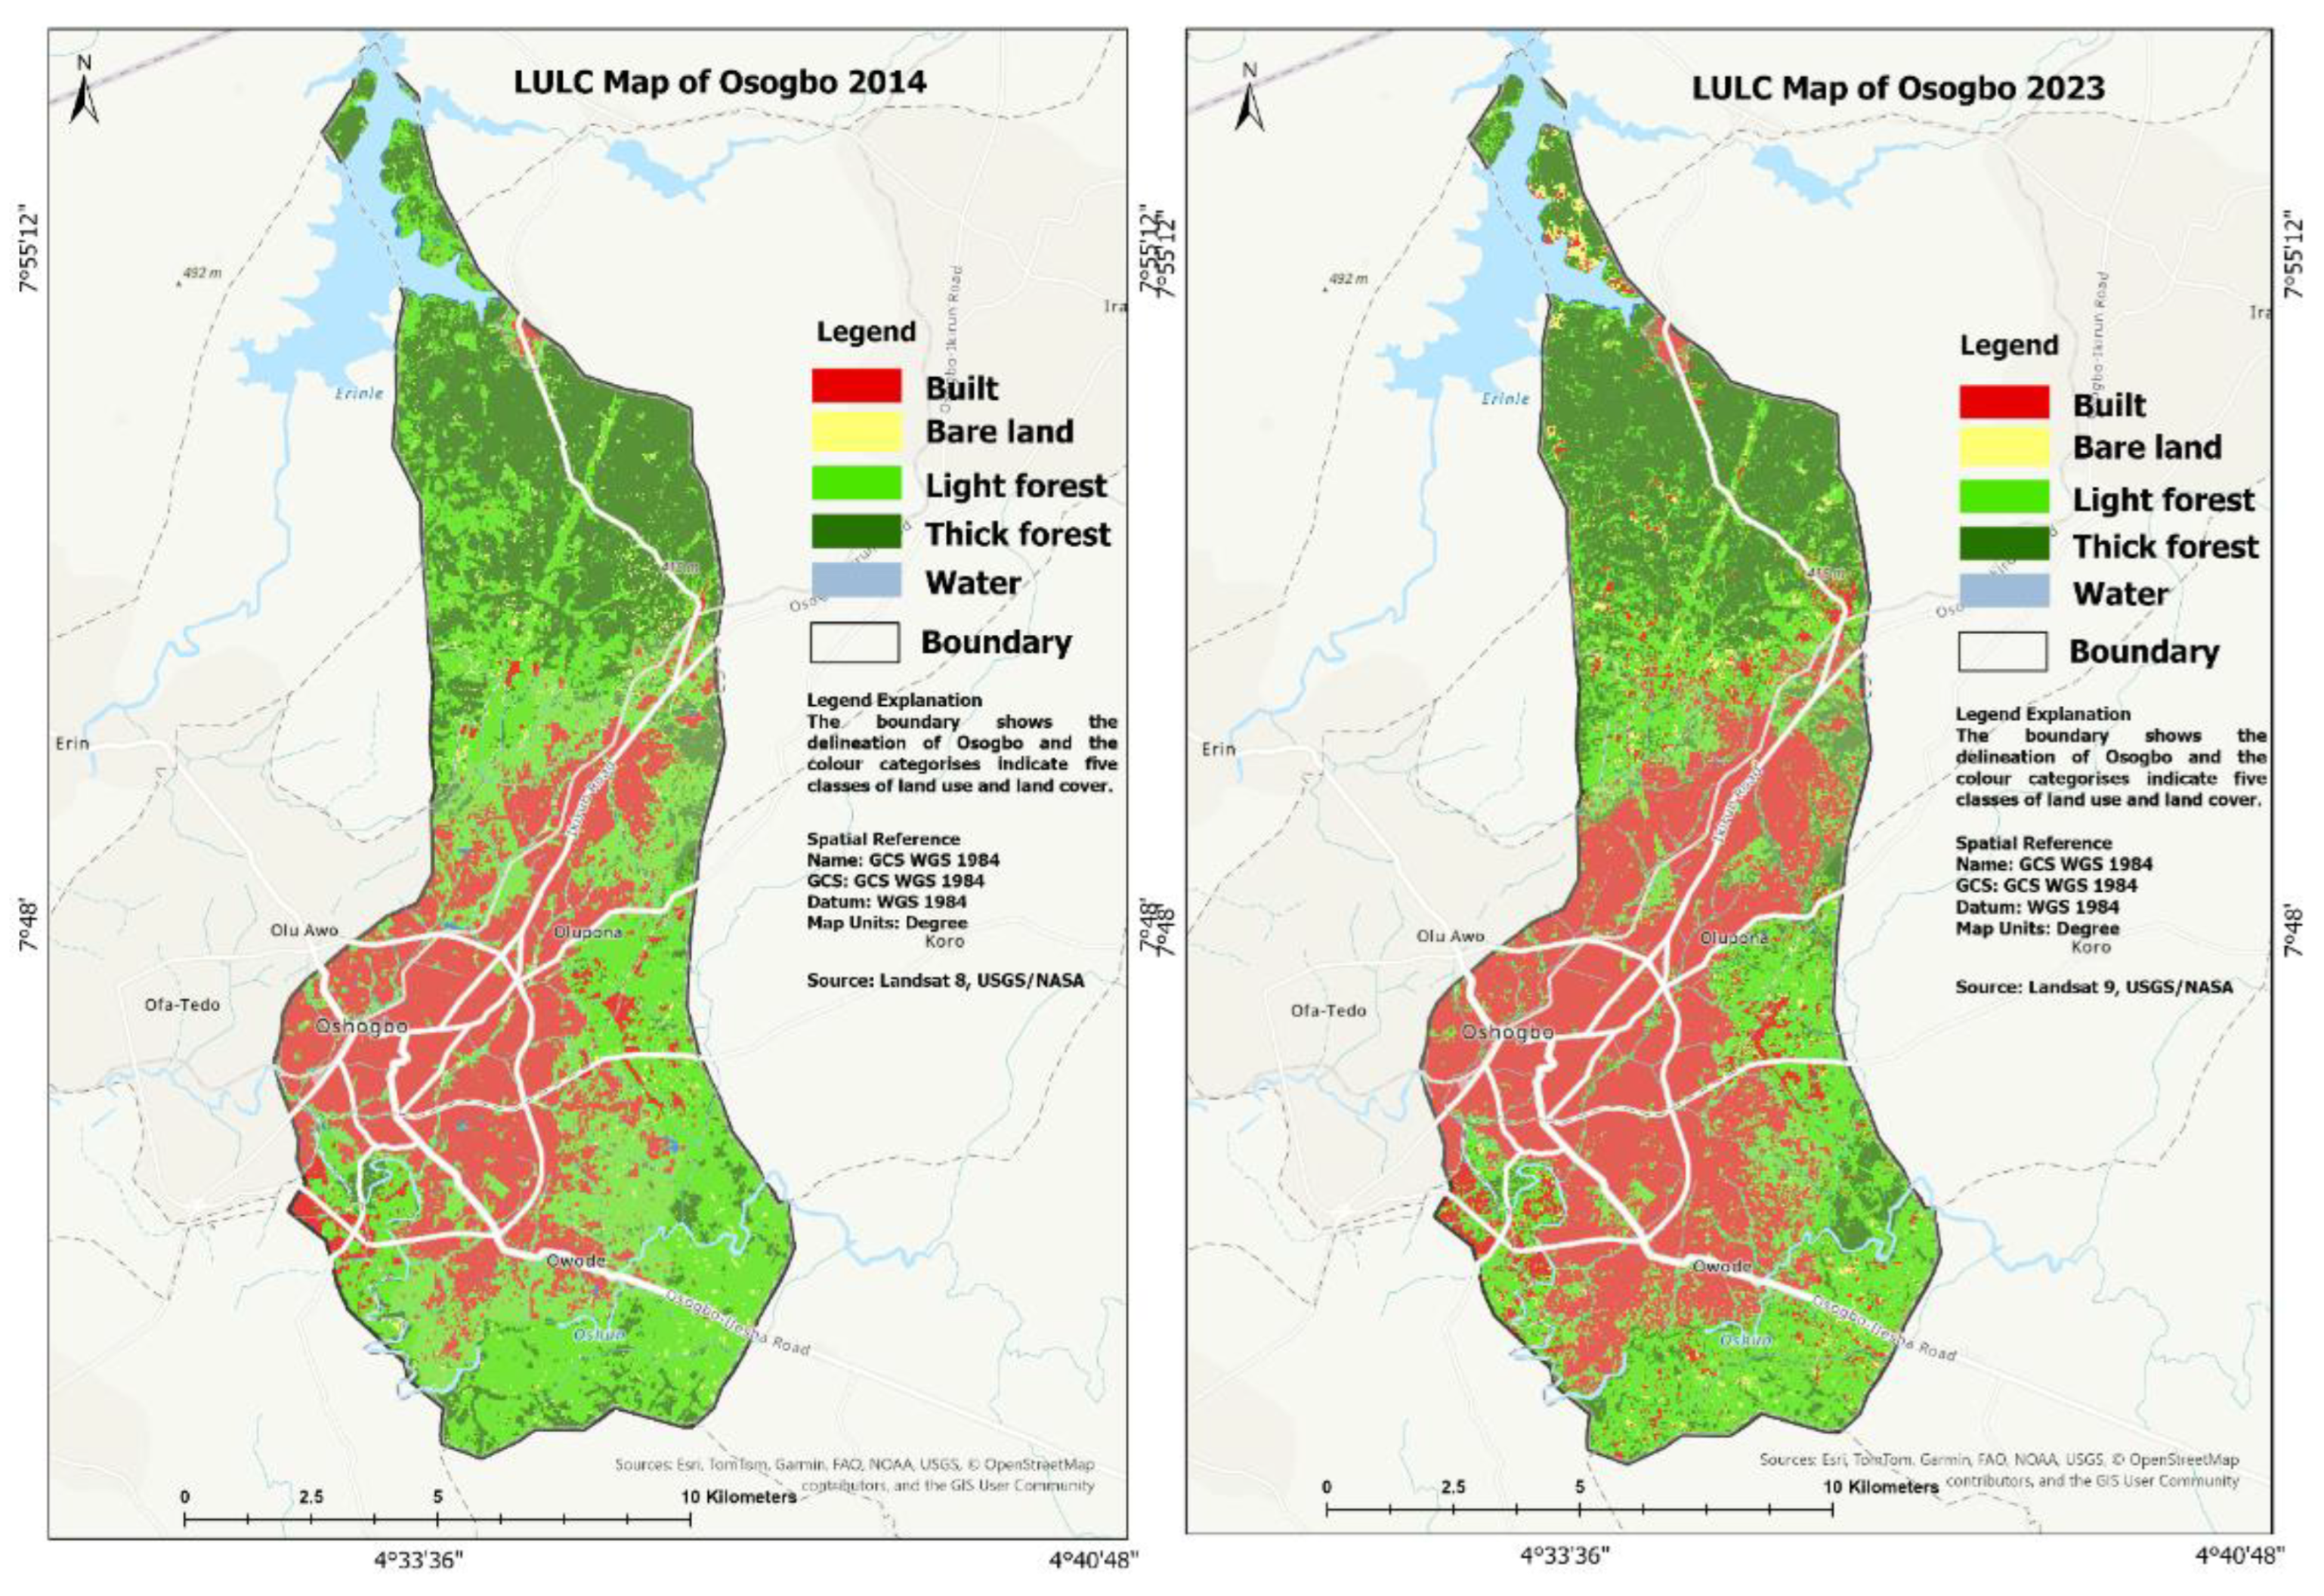
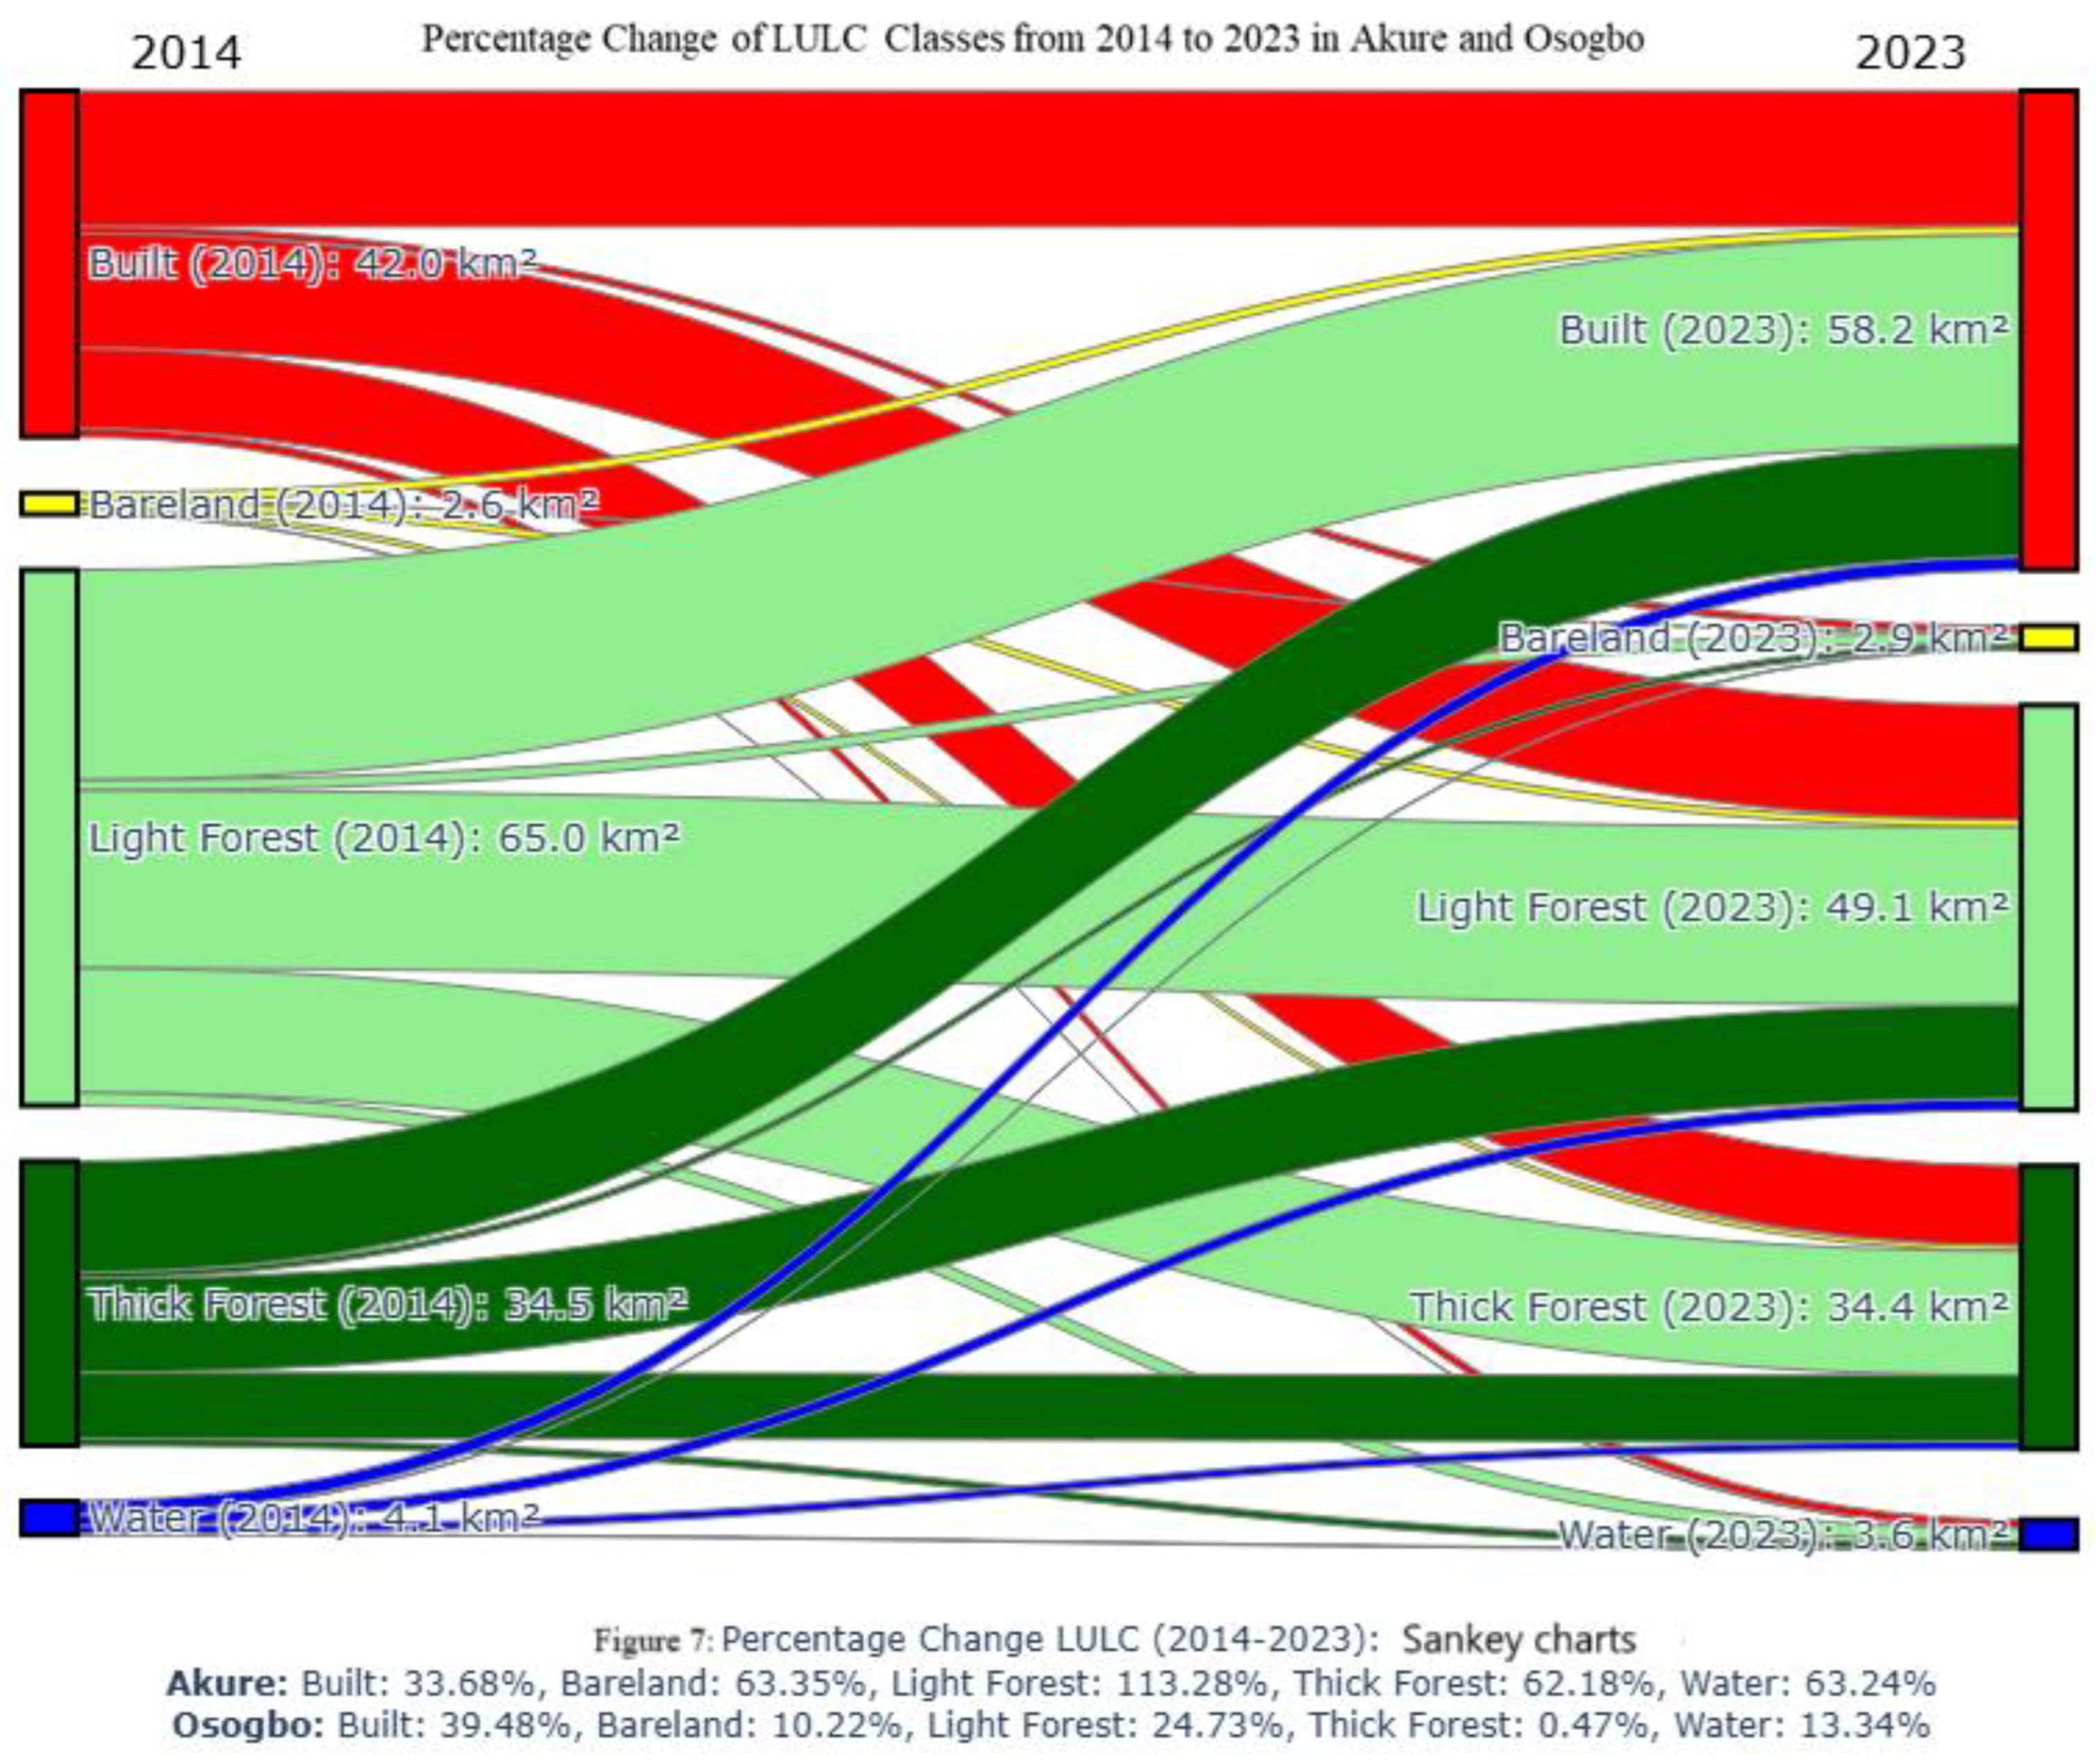
3.1. Land Use Land Cover Change in Akure and Osogbo Between 2014 and 2023

Random forest classification was employed to categorize land cover classes. There are five classes of land cover: built, bare land, light forest, thick forest, and water areas, which were observed and mapped. This classification thoroughly explains how various land cover types contribute to SUHI impacts in Akure and Osogbo since it catches the main landscape elements driving surface temperature dynamics. Figure 3 and Figure 4 present the LULC maps for Akure and Osogbo in 2014 and 2023, respectively. Figure 5 and Figure 6 shows the Sankey charts visualizing the land area estimates and percentages of all LULC classes for both 2014 and 2023 for Akure and Osogbo. Figure 7 further shows the Sankey diagram revealing the percentage change in LULC classes for both 2014 and 2023 for Akure and Osogbo.
The built areas of Akure between 2014 and 2023 increased from 164.026 km2 to 224.191 km2 while the change in the built area of Osogbo between 2014 and 2023 was from 41.808 km2 to 58.315 km2 in 2014 and 2023, respectively (Figures 5 to 7). The light forest area in Akure also increased by 113% percent from 265.753 km2 to 566.801 km2 while the bare land area, thick forest area and water body of Akure region were on the decline from 2014 to 2023. On the other hand, there was a very slight expansion in the bare land area of Osogbo from 2.633 km2 to 2.902 km2 while light forest area, thick forest and water body of Osogbo were all on the decline during the study period.
The results of the accuracy assessments of the LULC classifications for Akure and Osogbo are presented in Table 2. The overall accuracy and Kappa coefficient for model testing are also presented. The overall accuracy for Akure in 2014 and 2023 are 0.812 and 0.800, respectively, and for Osogbo are 0.834 and 0.816, respectively. The Kappa coefficient for Akure in 2014 and 2023 are 0.746 and 0.705, respectively, and for Osogbo in 2014 and 2023 are 0.791 and 0.738, respectively.

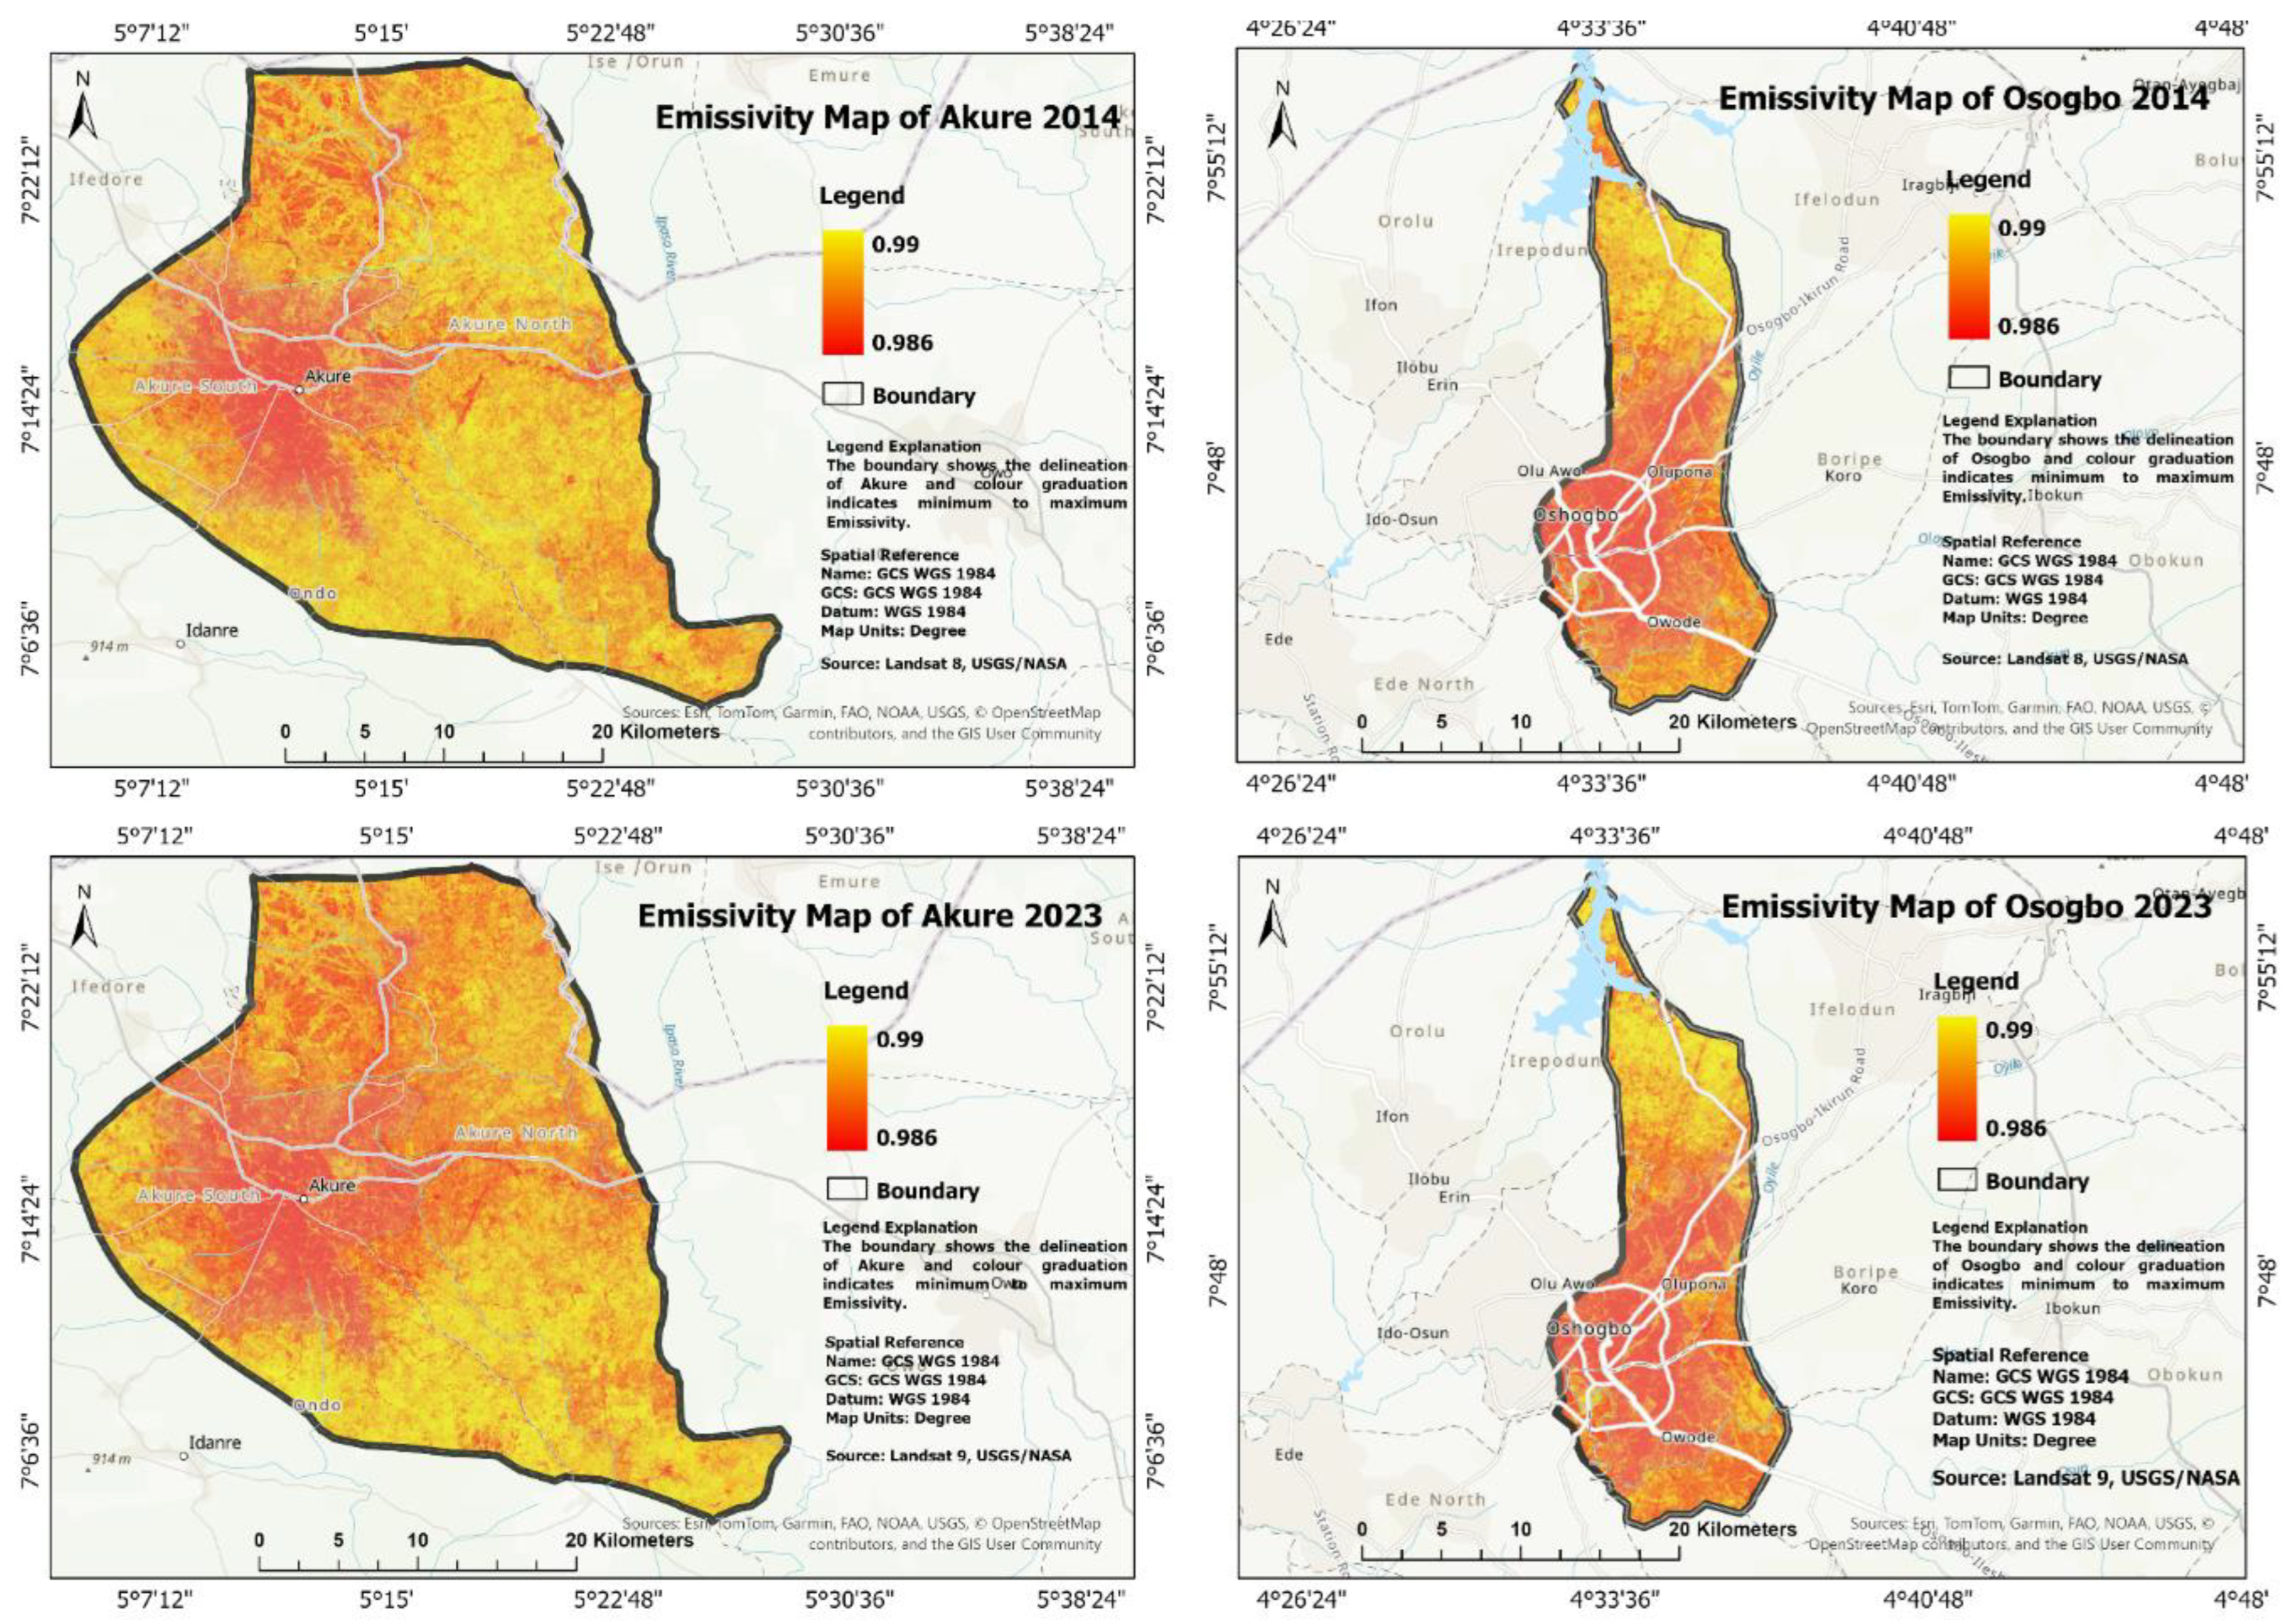
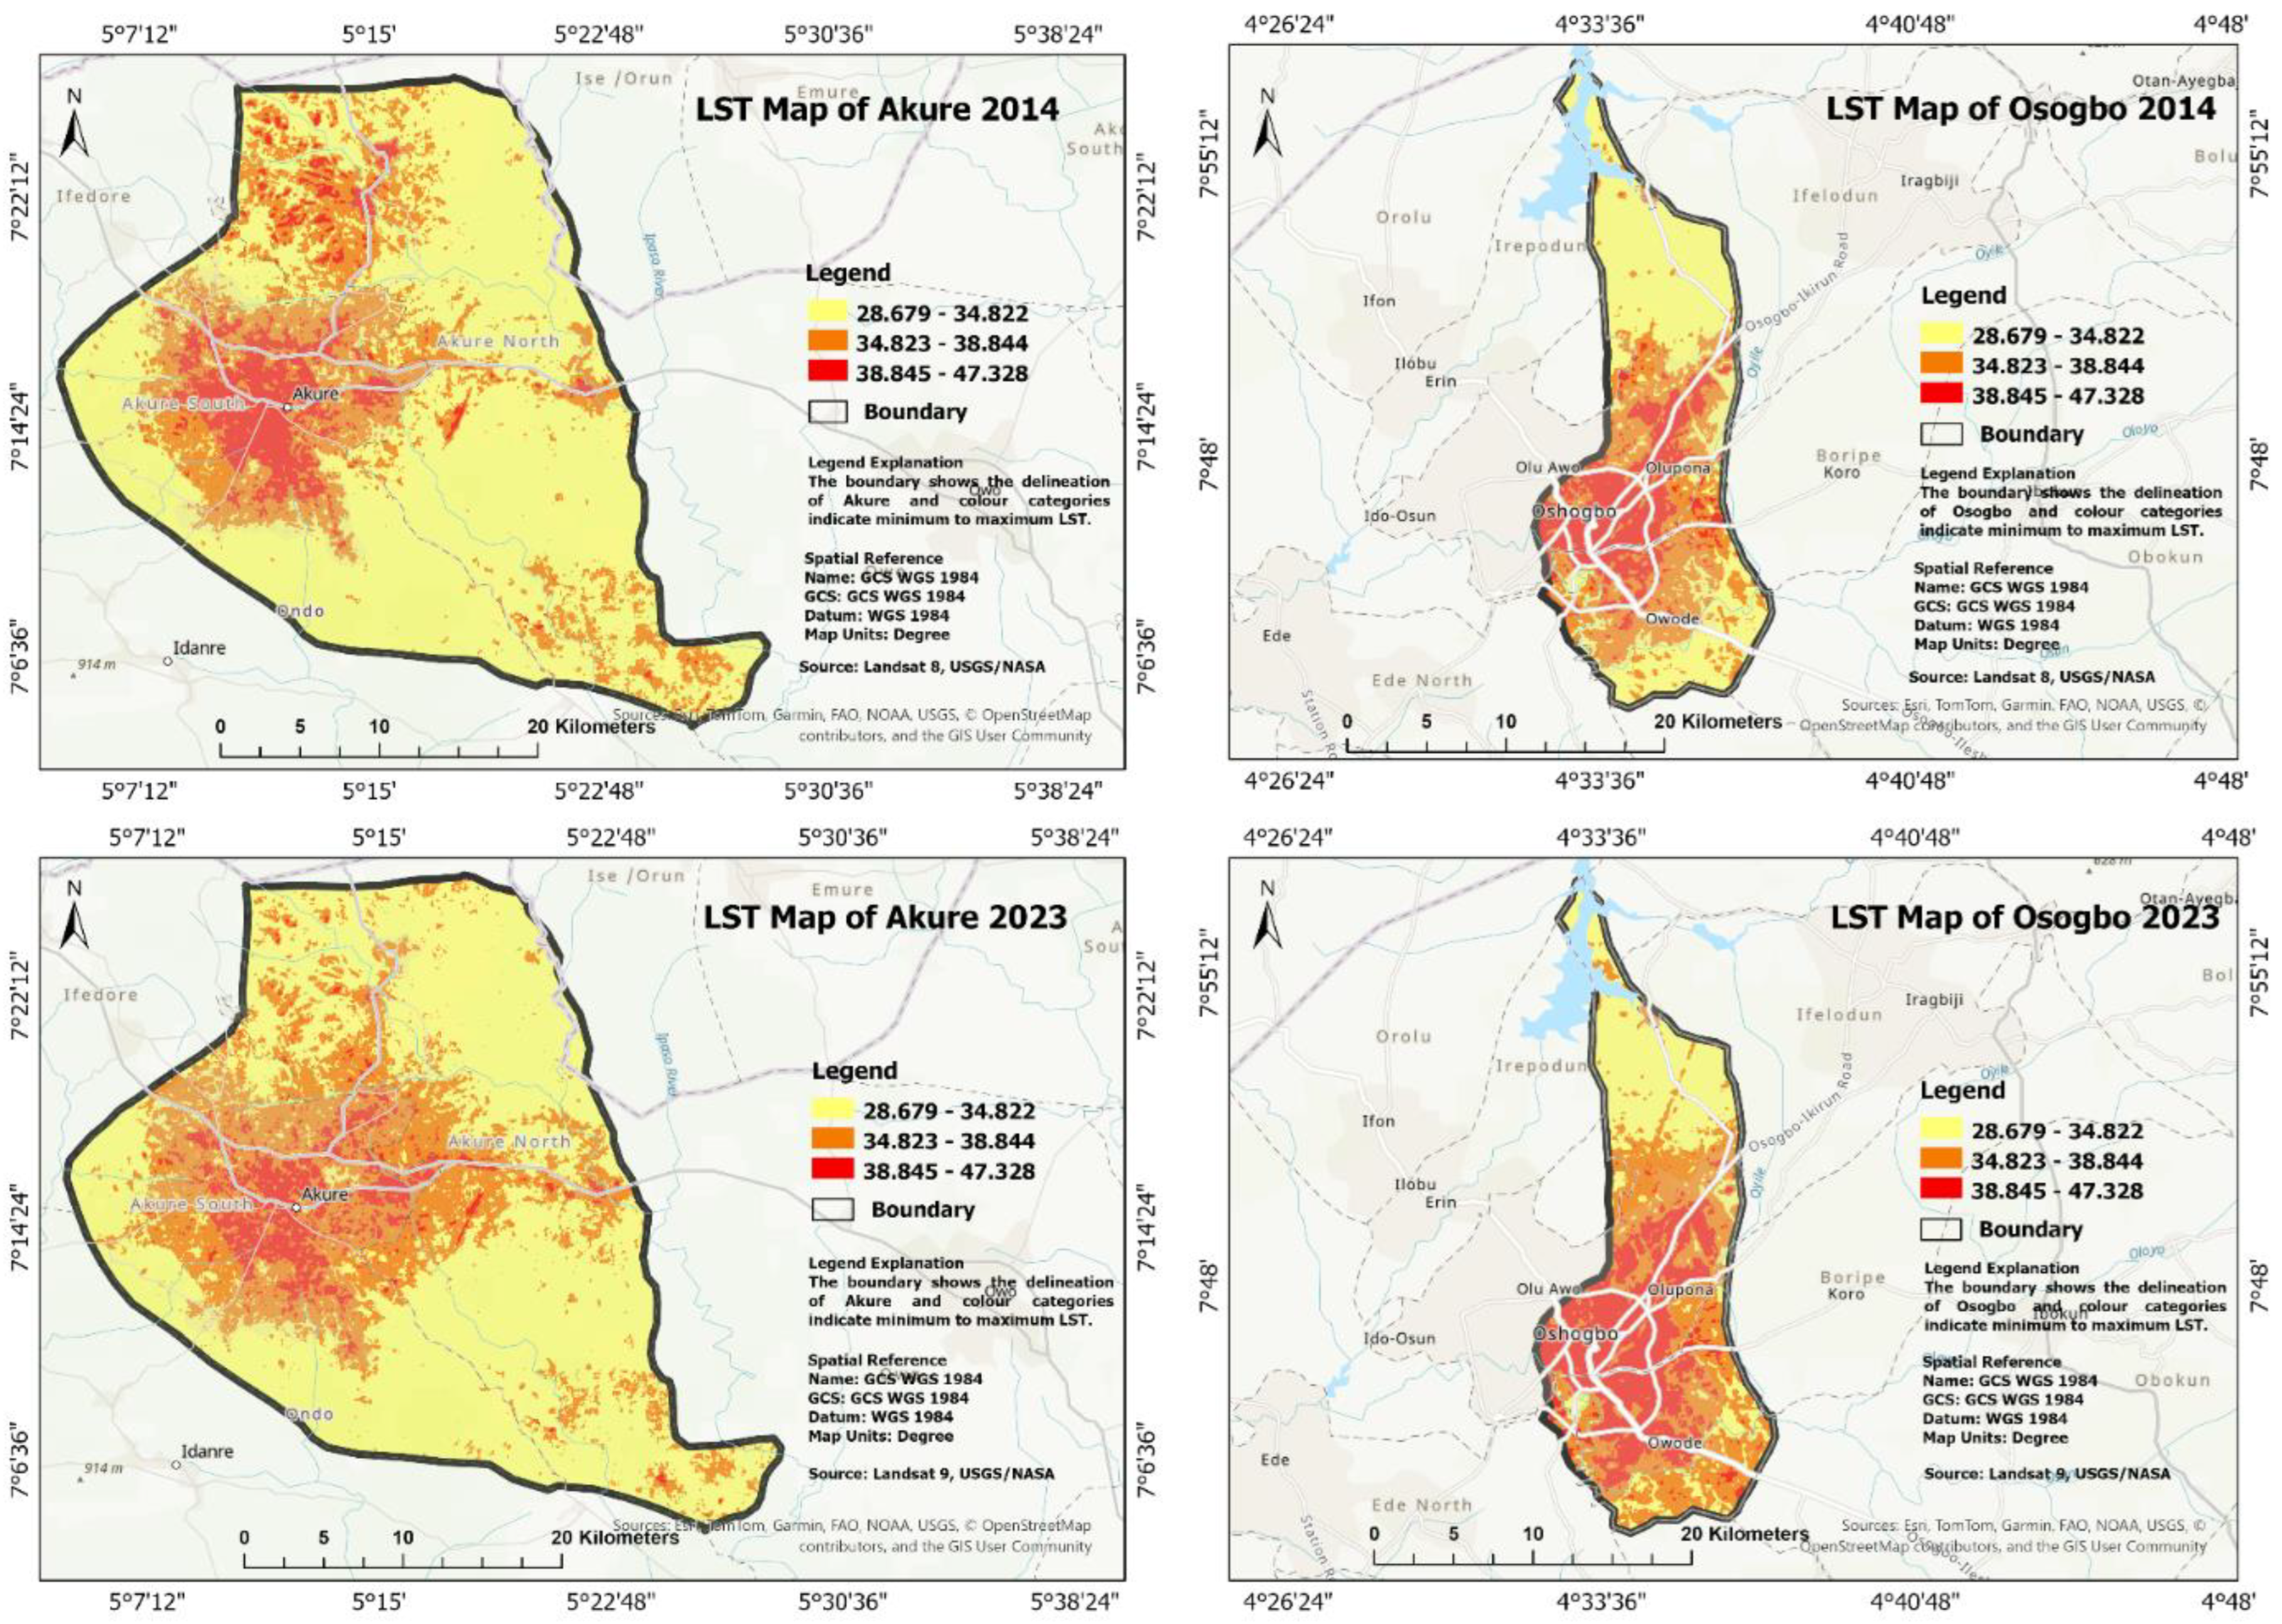
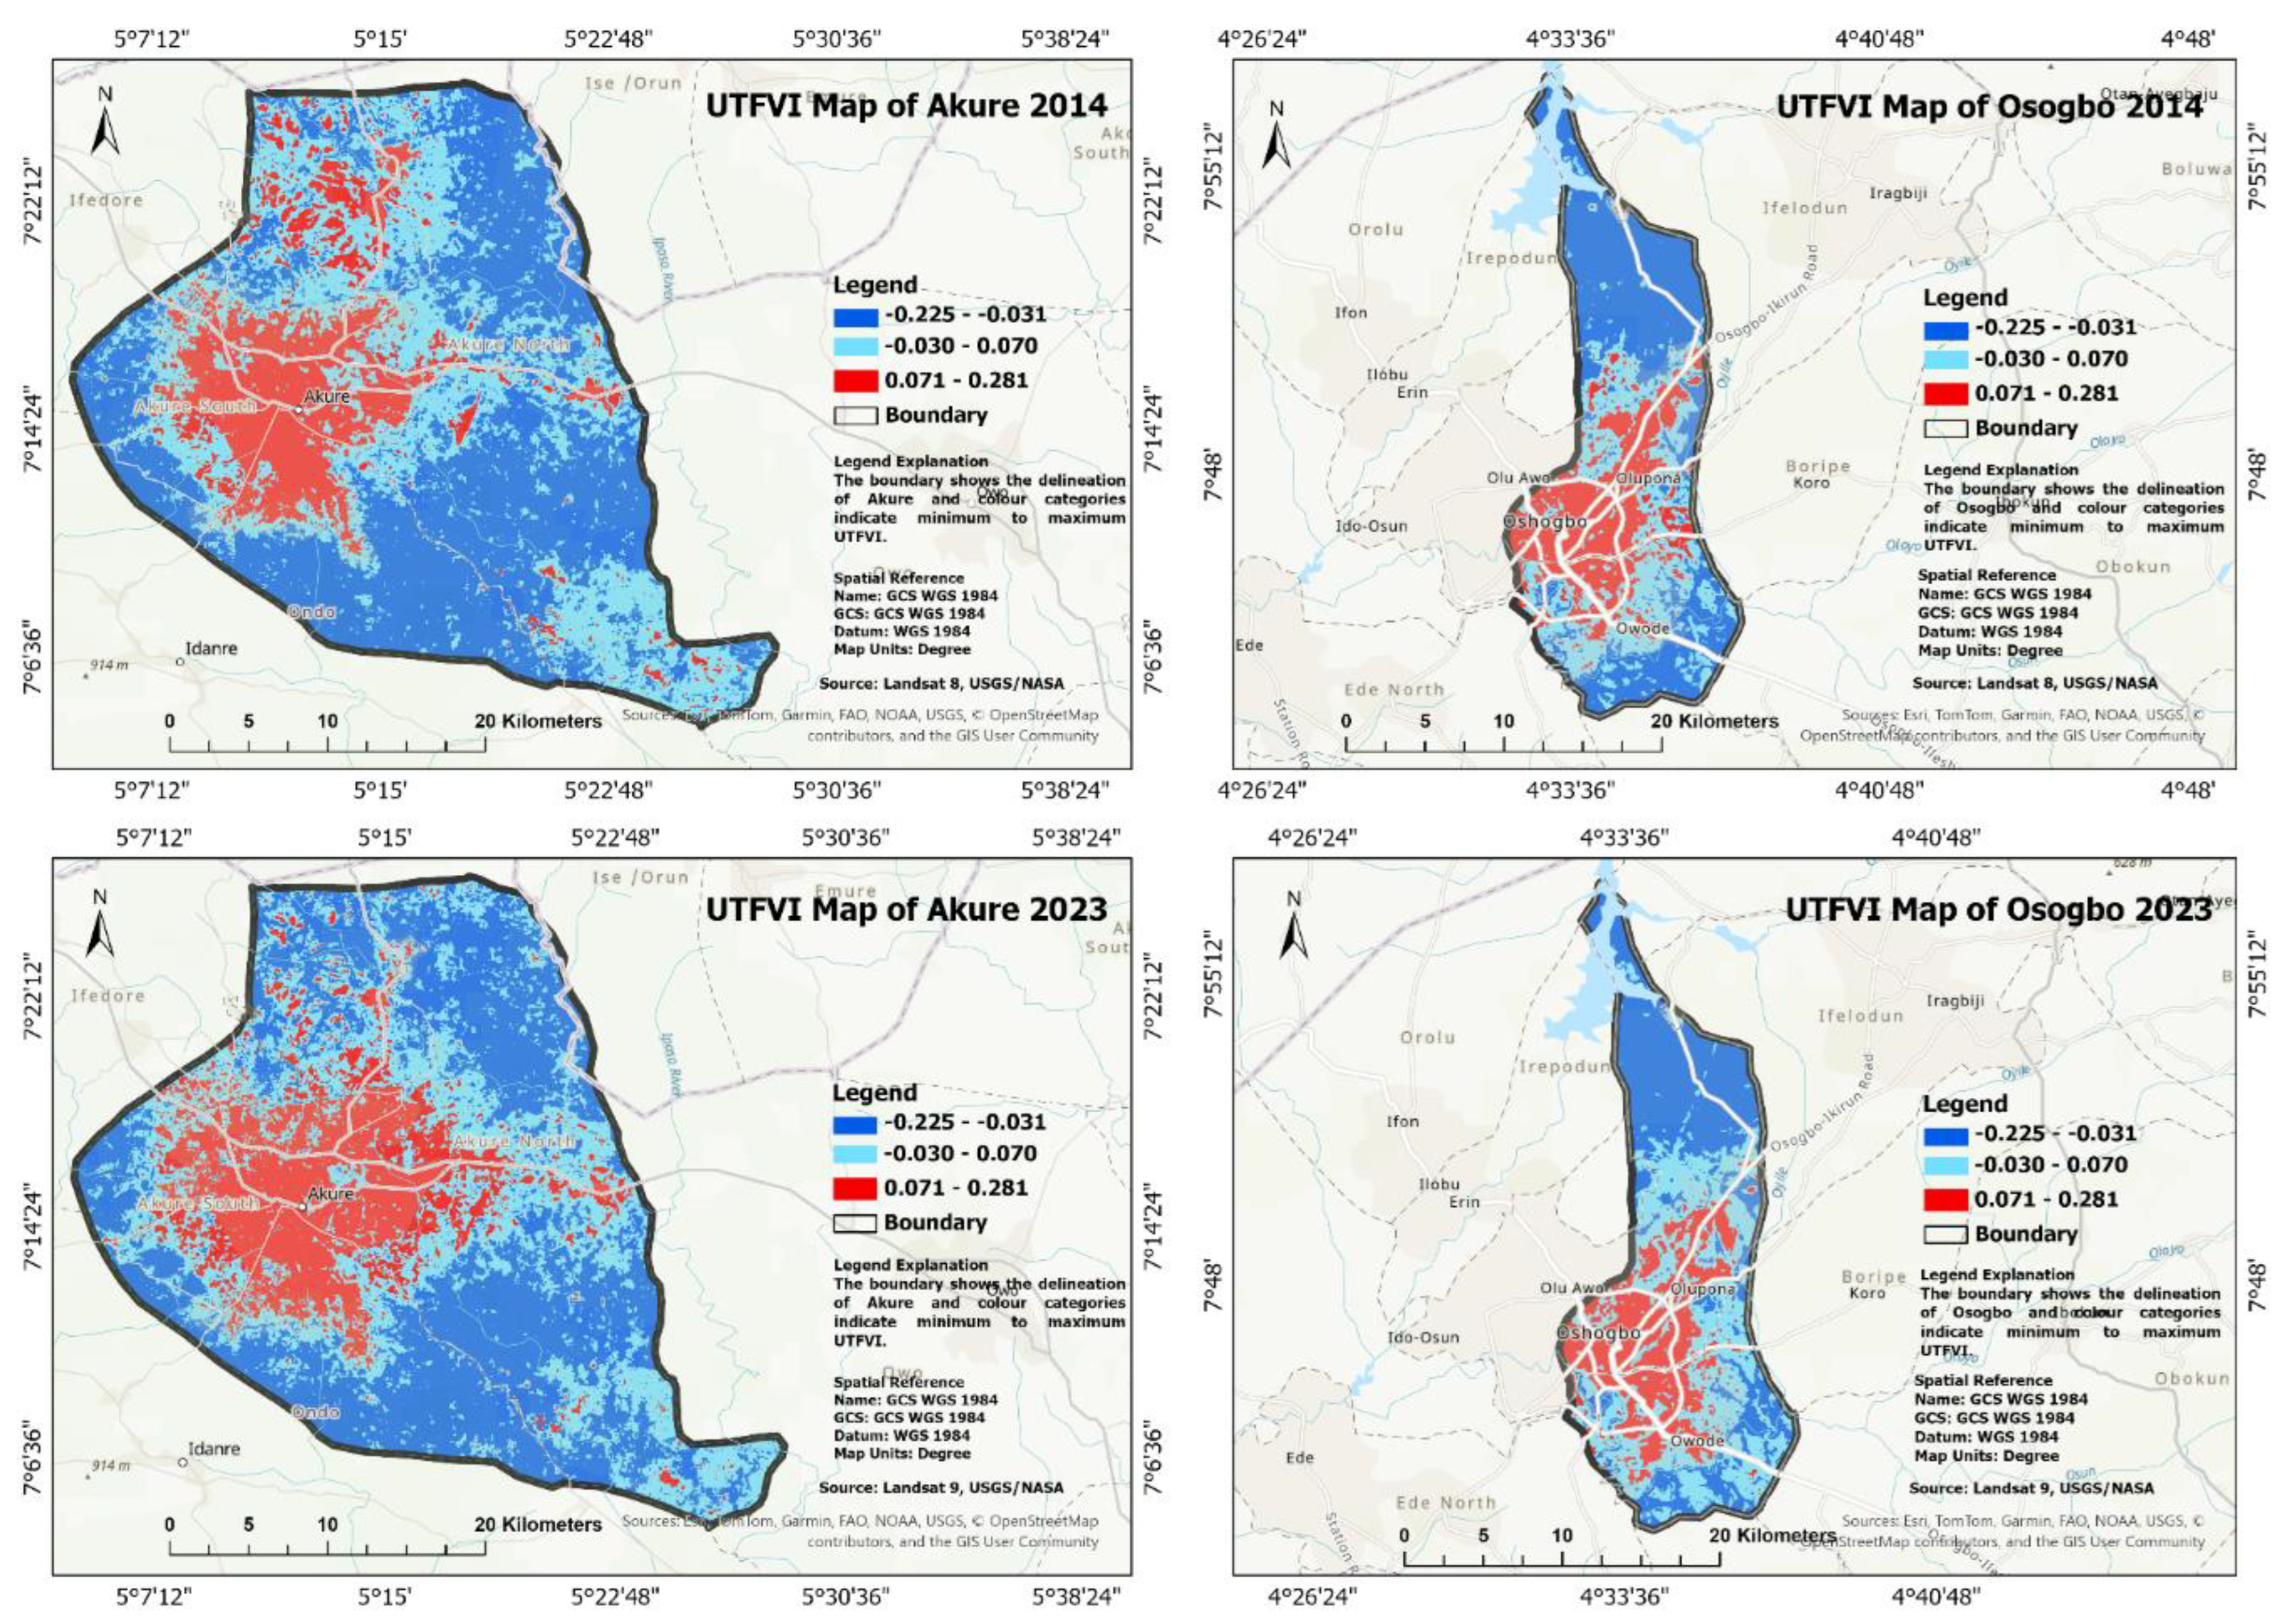
3.2. Surface Urban Heat Island Effects in Akure and Osogbo Between 2014 and 2023

This study identified some parameters that uncovered the effects of SUHI in Akure and Osogbo, as the two cities experienced significant changes in LULC between 2014 and 2023. Figure 8 shows spatial distributions of NDVI in the study area. The NDVI ranges from 0.893 to 0.092. The maximum depicts high vegetation regions while the minimum portrays low vegetation areas. Figure 9 reveals the emissivity in the study area, which has the same pattern as NDVI. The maximum emissivity rate is 0.990, which falls in the forest region and emits higher, while the minimum value of 0.986 emits slightly lower radiation and falls in the built area. Additionally, the Spearman analysis shows a positive relationship between SUHI and NDVI with the values of R = 0.873, 0.871, 0.998, and 0.989 for Akure 2014, Akure 2023, Osogbo 2014, and Osogbo 2023, respectively.
Evident patterns of LST are closely linked to the urban thermal characteristics of different LULC classifications. Figure 10, Figure 11 and Figure 12 show similar patterns of SUHI effects in the study area. Figure 10 shows the LST of the study area, which was classified into three different parts. The high temperate region is the built areas with a temperature between 38.85oC and 47.33 oC, the medium temperate region is the peri-urban areas with a temperature between 34.82oC and 38.84 oC and the low temperate region is the thick and the light forest areas with the temperature between 28.68oC and 34.82 oC. More so, Figure 11 reveals the SUHI of the study area, which follows the same pattern as LST. The three categories include the high thermal region (the built areas) between 1.15 oC and 4.58 oC, the medium thermal region (peri-urban areas) between -0.20 oC and 1.14 oC and the low thermal region between -2.16 oC and -0.21 oC. Figure 12 illustrates UTFVI which is the effect of SUHI on the study area. The effects are further grouped into three, namely: the high impact area (the built areas) between 0.07 oC and 0.28 oC, the medium region between -0.03 and 0.07 and the low or no impact region between -0.23 oC and -0.03oC.

3.3. Relationship Between LULC Change and SUHI Effects in Akure and Osogbo Between 2014 and 2023

This study analyzes the relationship between change in LULC and the corresponding SUHI effects in Akure and Osogbo between 2014 and 2023 with the zonal statistics in ArcGIS Pro. Table 3 reveals that the built areas of Akure in 2014 experienced the highest temperature with a mean temperature of 0.114, while the thick forest areas had the lowest temperature effect of -0.072. The median effects were also at the peak in the built region with 0.114 and the lowest median effect of SUHI was felt in the thick forest region of Akure in 2014. In 2023, the same variation occurred in Akure as the built area has the most pronounced SUHI effects with the mean and median value of 0.083 and 0.093, respectively, while the least SUHI effects were experienced in the thick forest region with the mean and median value of -0.084 and -0.084 respectively.
On the other hand, the built region of Osogbo 2014 indicates the highest effect of SUHI with a mean and median value of 0.106 and 0.106, respectively, while the lowest effects were found in the thick region with a mean value of -0.127 and the lowest median value of -0.143 in the water region. The effect is quite similar in Osogbo 2023 as the built region experienced the highest impact with the mean and median values of 0.075 and 0.080, respectively, while the least effect was observed in the water region with the mean and median values of -0.163 and -0.156, respectively. This study affirmed that there is a strong relationship between the change in LULC and SUHI effects in Akure and Osogbo as the effects were more pronounced in the built region to the bare land region, to the water body, and very little in the light forest region and on to the thick forest region in hierarchy.

4. Discussion

The study examined variations in land use and land cover (LULC) and their impact on surface urban heat islands (SUHI) in Akure and Osogbo from 2014 to 2023. First, the study assessed the land use land cover change in Akure and Osogbo between 2014 and 2023. On the one hand, the evidence of the increase in built-up in Akure regions could be the derivative of development mobilizations in the areas as seen in the Sankey charts [59,60,61]. For instance, the siting of a higher institution, Federal University of Technology Akure (FUTA), in 1981 has stimulated unprecedented demand for housing and public infrastructure, among many others in the city. According to [62], the establishment of the FUTA and other tertiary institutions in Akure, as well as the construction of housing estate schemes like Aule Housing Estate, could be responsible for the growth in built-up areas. A previous study by [4] in Akure highlighted similar results. The study also applied GIS and remote sensing systems to investigate SUHI effects. It was observed that built up areas increased by 8.78% between 2000 and 2018, increasing SUHI intensity across Akure​. On the other hand, the observed modest change in LULC of Osogbo City could be attributed to the urban renewal programs implemented by the political leadership in Osun State between 2010 and 2018. These urban renewal programs include the integration of green spaces in urban planning, planting of trees on the State roads in Osogbo city, conversion of the Plank Market and Garage at Okefia area into Nelson Mandela Freedom Park and demolition of Fakunle High School at Orita-Olaiya area that was converted into Parks in 2013 [63,64,65].
The findings on LULCC also established that forest cover dynamics in Akure and Osogbo have changed significantly. In Akure, light forest areas have more than doubled, while thick forest areas have decreased by nearly two-thirds. By inference, there is a drastic shift from thick to light forests in Akure between 2014 and 2023. This transition is most likely driven by deforestation caused by logging and agricultural activities such as lumber production and cocoa farming, which converted dense forests into lighter ones. These findings are substantiated by [66], who affirmed that deforestation has been occurring in Akure Forest Reserve and its surroundings since 1988, with thick vegetation mostly depleted, thereby allowing for predominant light vegetation in 2018. In contrast, Osogbo experienced a significant fall in light forest areas, with a minor decrease in dense forest areas, indicating a moderate decline over the earlier decade. Previous studies [20,44] supported these findings by establishing that agricultural land is substantially reduced, thereby emphasizing the need for integrating agricultural land preservation into urban planning to mitigate the loss.
Further findings on LULCC revealed that Akure experienced a 63% reduction in the bare land during the study period, while Osogbo witnessed a 10% increase. According to [20], Osogbo witnessed an increase in the bare land and a decrease in water areas between 1984 and 2015. Akure and Osogbo experienced a decline in the water areas. For instance, Akure has very few water areas and witnessed a 63% reduction, while Osogbo experienced a 12% decrease in the water areas. In contrast to these findings, [67] reported an increase in the bare surface of Akure and a relatively stable water area between 1984 and 2016. The implication of this estimate reflects a shift from natural landscapes to built-up areas. The LULC classification models achieved acceptable accuracy, as confirmed by the Kappa coefficient and overall accuracy tests.
Second, our study estimated the urban heat island effects in Akure and Osogbo between 2014 and 2023. The findings on SUHI provide an understanding of how temperature patterns have evolved. The study found that both Akure and Osogbo experienced significant changes in SUHI between 2014 and 2023 and Akure experienced higher SUHI effects, while Osogbo experienced modest changes with consistent SUHI patterns. This study showed a clear relationship between vegetation density (NDVI) and SUHI. Building on the earliest studies [68,69], the Spearman correlation analysis reveals correlation values of R = 0.873, 0.871, 0.998, and 0.989 between the variables influencing SUHI (vertical axis) and NDVI (horizontal axis) for Akure 2014, Akure 2023, Osogbo 2014, and Osogbo 2023, respectively. The effects of SUHI are measured following [58] UTFVI ranges and further grouped into none, middle, and bad effects, respectively. In general, the built areas (urban) of Akure in 2014 experienced high temperatures in the centre of the built and bare land. However, the effects of SUHI were spread out in Akure 2023, as seen in Figure 3. This is due to the rapid transformation and change in the LULC of Akure within a decade, consequently causing higher SUHI effects in Akure. In respect to Osogbo, the city experienced closely the same pattern of SUHI effects between 2014 and 2023 as the city moderately changed within 10 years. The city experienced high temperatures in the built and bare land areas, thus higher SUHI effects. The effects are almost the same proportion in 2023 as the city relatively changed in LULC between 2014 and 2023. Various studies by [9,37,70,71,72,73] have proved that there is a positive correlation between the LST, SUHI, emissivity, and built areas, illustrating that this is causing the rise in SUHI effects. A negative relationship between forest areas and LST and SUHI indicates positive effects of urban cooling.
Third, our study revealed the relationship between change in LULC and SUHI effects in Akure and Osogbo between 2014 and 2023. In both cities, the built areas experienced the highest SUHI effects, while thick forest and water regions had the lowest. This shows a clear correlation between urbanization and increased temperatures. The outcomes confirmed that SUHI effects are most pronounced in the built regions and progressively decrease in areas with more natural land cover, like forests and water bodies. SUHI results from human activities and urbanization processes, leading to higher temperatures in the regions built than the forest areas. Many studies [9,71,74] have established a correlation between changes in LULC types and the increase in SUHI effects in different regions of their studies. Their findings are similar to the outcome of the quantitative analysis of the relationship between change in LULC and the corresponding effects of the SUHI in Akure and Osogbo.
In summary, the findings of this study revealed that Akure and Osogbo have undergone major changes in LULC over the study period, with Akure undergoing highly rapid urbanization. In Akure, the built areas developed significantly while bare land decreased drastically. On the contrary, Osogbo witnessed a LULC change with increased built areas and relatively stable bare land. By implication, our study revealed that the impact of LULCC on SUHI effects in one mid-sized city is not the same as the result obtained in another mid-sized city, as demonstrated in the case of Akure and Osogbo and cannot be transferred. Therefore, this study would provide useful geospatial information to help urban planners and decision-makers focus on city-specific policies and initiatives to reduce urban heat islands and improve urban sustainability. This study will add to the scholarly literature and evolve practical solutions to cities based on their peculiarity. This study is significant because it addresses an important need for empirical data-driven ways to manage the negative consequences of urbanization on climate change and global warming from mid-sized cities up to the global level.
This study has its limitations. First, the analysis was primarily based on data from the Landsat satellite with decadal intervals. The downside is that these data are of medium spatial resolutions with inconsistent temporal and coarse resolution of Landsat data. The inability to afford high-resolution satellite data, which is usually very expensive, also contributed to the dependence on the Landsat image. Nevertheless, Landsat data have been largely used in spatiotemporal research with accurate results. Second, the study focused mainly on LST and SUHI. It did not consider any other types of SUHI. The study did not account for socioeconomic factors and urban green infrastructure, which could also impact SUHI effects. Lastly, the study is confined to two cities and a specific period (2014-2023) due to the unavailability of satellite data, consequently limiting its generalizability to other regions or longer-term climate trends. These restrictions emphasize integrating ground-based observations and broader temporal and geographic data for more comprehensive future studies.

5. Conclusions

This study analyzed the spatiotemporal relationship between LULC changes and SUHI effects in the cities of Akure and Osogbo, Nigeria, from 2014 to 2023. The study applied geospatial data involving satellite imagery, remote sensing techniques and machine learning to examine the dynamics of LULC transformation and its influence on SUHI in these mid-sized, rapidly urbanizing cities. The formation and impact of SUHI in mid-sized cities represent a complex issue that has received less attention globally. Hence, our study’s objectives responded to these complex issues of LULC dynamics and its impact on the formation of the SUHI effect, especially in the developing mid-sized cities in Nigeria. Addressing the first research objective, we observed notable LULCC in Akure, including a significant increase in built up areas and more than a doubling of light forest area. In contrast, Osogbo witnessed more moderate changes, with modest expansion in built up areas and a little rise in bare land between 2014 and 2023.
Regarding the second research objective, the findings demonstrated that Akure and Osogbo had significant changes in SUHI between 2014 and 2023. Akure experienced higher SUHI effects in 2014, particularly in the built-up and bare-land areas, and a more pronounced effect in 2023 as the city's land use changed substantially. In contrast, Osogbo experienced modest changes at consistent SUHI patterns, with the highest SUHI effect in the built and bare-land regions in 2014 and nearly the same proportion in 2023 as the city's LULC changed relatively between 2014 and 2023. Finally, our third research objective revealed a strong relationship between change in LULC and SUHI effects in Akure and Osogbo between 2014 and 2023. In both cities, the built areas experienced the highest SUHI effects, while thick forest and water regions had the lowest. This indicates a clear correlation between urbanization and increased temperatures.
It can be inferred from the results that the extent of LULCC impact on SUHI across mid-sized cities is not equal. As such, evidence from a mid-sized city might not be transferrable to other cities of similar size and socio-economic characteristics without caution. As comparable as Osogbo and Akure are within the southwestern region of Nigeria, the differences in population growth, socio-economic indicators, urban green infrastructure plans, and climate adaptation and mitigation programs could be the reasons behind the varying LULCC impacts on SUHI effects in the two cities. This study also emphasized the important role of vegetation in mitigating SUHI, as areas with dense green cover felt cooler temperatures. To address these challenges, our findings recommended sustainable urban planning that integrates green infrastructure and monitors LULC changes as necessary for minimizing SUHI effects and encouraging climate resilience in rapidly growing cities of Nigeria. This study also recommends the incorporation of green infrastructure, such as parks, urban forests, and vegetation corridors, to help lessen SUHI intensity and promote climate resilience in the study area, particularly in Akure, where SUHI effects are more pronounced. By recognizing the impact of LULC change on SUHI effects, city planners and policymakers in Nigeria can make informed decisions to supervise urban growth and retain environmental sustainability. Promoting public awareness about SUHI effects and incentivizing climate-adaptive building methods are vital for encouraging long-term resilience against increasing temperatures in these mid-sized growing cities.

Author Contributions

Moruff Oyeniyi handled the study's design, initial draft preparation, methodology, data processing, analysis, software, visualization, editing, and research report compilation, ensuring data accuracy and dependability. Dr. Oluwafemi Odunsi improved the methodology and software, examined and edited the manuscript, guided the analysis and strengthened the study's conceptual workflow and design. Dr. Andreas Rienow supervised the manuscript, including its visualization and review. Dr. Dennis Edler supervised the study, contributed to cartographic visualization, review, and conceptualization. All authors read, edited, and approved the final manuscript.

Funding

This research received no external funding.

Data Availability Statement

The data were sourced from secondary sources and are publicly accessible through the link: https://developers.google.com/earth-engine/datasets/catalog/landsat (accessed on June 4, 2024).

Acknowledgments

The authors thank the staff and students at the Institute of Geography, Ruhr University Bochum, Germany, for providing the enabling environment for the study.

Conflicts of Interest

The authors declare no conflicts of interest.

References

  1. Brenner, N.; Keil, R. From global cities to globalized urbanization. In The city reader; Routledge, 2011; pp. 667–684. [Google Scholar]
  2. Kundu, D.; Pandey, A. K. World urbanization: trends and patterns. Developing national urban policies: Ways forward to green and smart cities 2020. [Google Scholar] [CrossRef]
  3. United Nations; Department of Economic and Social Affairs; Population Division. World Population Prospects 2022: Summary of Results. 2022. Retrieved from. Available online: https://www.un.org/development/desa/pd/sites/www.un.org.development.desa.pd/files/wpp2022_summary_of_results.pdf.
  4. Popoola, O.; Durojaye, P.; Bayode, T.; Popoola, A.; Olanibi, J.; Aladetuyi, O. Spatio-temporal variance and urban heat island in Akure, Nigeria: A time-spaced analysis Using GIS Techniqu. South African Journal of Geomatics 2020, 9(2), 365–378. [Google Scholar] [CrossRef]
  5. Linard, C.; Tatem, A. J.; Gilbert, M. Modelling spatial patterns of urban growth in Africa. Applied Geography 2013, 44, 23–32. [Google Scholar] [CrossRef] [PubMed]
  6. Chatterji, T. New urban worlds: inhabiting dissonant times. 2019. [Google Scholar] [CrossRef]
  7. World Bank. Urban population (% of total population)–Nigeria Data World. 2018. Available online: https://data.worldbank.org/indicator/SP.URB.TOTL.IN.ZS?locations=NG.
  8. Sun, Y.; Jiao, L.; Guo, Y.; Xu, Z. Recognizing urban shrinkage and growth patterns from a global perspective. Applied Geography 2024, 166, 103247. [Google Scholar] [CrossRef]
  9. Adewale, A. O.; Adepoju, K. A.; Awotoye, O. O. Mapping and assessing impervious surface areas and urban heat island in Osogbo, Nigeria. 2017. [Google Scholar] [CrossRef]
  10. Leal Filho, W.; Icaza, L. E.; Neht, A.; Klavins, M.; Morgan, E. A. Coping with the impacts of urban heat islands. A literature based study on understanding urban heat vulnerability and the need for resilience in cities in a global climate change context. Journal of Cleaner Production 2018, 171, 1140–1149. [Google Scholar] [CrossRef]
  11. Tuholske, C. Exposure to deadly urban heat worldwide has tripled in recent decades. State of the Planet, Earth Institute, Columbia University. 2021. Available online: https://news.climate.columbia.edu/2021/10/04/exposure-to-deadly-urban-heat-worldwide-has-tripled-in-recent-decades/.
  12. Ma, X.; Dong, L. Surface urban heat island effect and its spatiotemporal dynamics in metropolitan areas: A case study in the Zhengzhou metropolitan area, China. Frontiers in Environmental Science 2023. Available online: https://www.frontiersin.org/articles/10.3389/fenvs.2023.00001/full. [CrossRef]
  13. Badmos, O. S.; Callo-Concha, D.; Agbola, B.; Rienow, A.; Badmos, B.; Greve, K.; Jürgens, C. Determinants of residential location choices by slum dwellers in Lagos megacity. Cities 2020, 98, 102589. [Google Scholar] [CrossRef]
  14. Patel, S. K.; Verma, P.; Shankar Singh, G. Agricultural growth and land use land cover change in peri-urban India. Environmental monitoring and assessment 2019, 191, 1–17. [Google Scholar] [CrossRef]
  15. Verma, P.; Singh, R.; Singh, P.; Raghubanshi, A. S. Urban ecology–current state of research and concepts. In Urban ecology; Elsevier, 2020; pp. 3–16. [Google Scholar] [CrossRef]
  16. Das, S.; Angadi, D. P. Land use-land cover (LULC) transformation and its relation with land surface temperature changes: A case study of Barrackpore Subdivision, West Bengal, India. Remote Sensing Applications: Society and Environment 2020, 19, 100322. [Google Scholar] [CrossRef]
  17. Demisse Negesse, M.; Hishe, S.; Getahun, K. LULC dynamics and the effects of urban green spaces in cooling and mitigating micro-climate change and urban heat island effects: a case study in Addis Ababa city, Ethiopia. Journal of Water and Climate Change 2024, 15(7), 3033–3055. [Google Scholar] [CrossRef]
  18. Aguda, A. S.; Adegboyega, S. A. Evaluation of spatio-temporal dynamics of urban sprawl in Osogbo, Nigeria using satellite imagery & GIS techniques. International Journal of Multidisciplinary and Current Research 2013, 1(1), 39–51. [Google Scholar]
  19. Jones, B.; Tebaldi, C.; O’Neill, B. C.; Oleson, K.; Gao, J. Avoiding population exposure to heat-related extremes: demographic change vs climate change. Climatic change 2018, 146, 423–437. [Google Scholar] [CrossRef]
  20. Eresanya, E. O.; Daramola, M. T.; Durowoju, O. S.; Awoyele, P. Investigation of the changing patterns of the land use land cover over Osogbo and its environs. Royal Society Open Science 2019, 6(12), 191021. [Google Scholar] [CrossRef]
  21. Mekonnen, G. T.; Berlie, A. B.; Wubie, M. A.; Legesse, S. A. Drivers of surface urban heat island of Gondar City, Ethiopia: a comparative study. Cogent Social Sciences 2024, 10(1), 2354974. [Google Scholar] [CrossRef]
  22. Shao, H.; Kim, G. A comprehensive review of different types of green infrastructure to mitigate urban heat islands: Progress, functions, and benefits. Land 2022, 11(10), 1792. [Google Scholar] [CrossRef]
  23. Giorio, M.; Paparella, R. Climate Mitigation Strategies: The Use of Cool Pavements. Sustainability 2023, 15(9), 7641. [Google Scholar] [CrossRef]
  24. Vardhu, V. A. K.; Sharma, A. Classification, Mitigations and Methods to Detect UHI: A Review. International Journal of Scientific Research in Engineering and Management (IJSREM) 2023, 7(2). [Google Scholar] [CrossRef]
  25. Chun, B.; Guldmann, J. M. Spatial statistical analysis and simulation of the urban heat island in high-density central cities. Landscape and Urban Planning 125 2014, 76–88. [Google Scholar] [CrossRef]
  26. Helbling, M.; Meierrieks, D. Global warming and urbanization. Journal of population economics 2023, 36(3), 1187–1223. [Google Scholar] [CrossRef]
  27. Dissanayake, D.; Morimoto, T.; Murayama, Y.; Ranagalage, M. The impact of landscape composition for urban heat island intensity in Addis Ababa City using Landsat data (1986–2016). Abstracts of the Ica 2019, 1, 63. [Google Scholar] [CrossRef]
  28. Degefu, M. A.; Argaw, M.; Feyisa, G. L.; Degefa, S. Dynamics of green spaces-land surface temperature intensity nexus in cities of Ethiopia. Heliyon 2023, 9(2), e13274. [Google Scholar] [CrossRef] [PubMed]
  29. Owoeye, J. O.; Ibitoye, O. A. Analysis of Akure urban land use change detection from remote imagery perspective. Urban Studies Research 2016, 2016(1), 4673019. [Google Scholar] [CrossRef]
  30. Irfeey, A. M. M.; Chau, H. W.; Sumaiya, M. M. F.; Wai, C. Y.; Muttil, N.; Jamei, E. Sustainable mitigation strategies for urban heat island effects in urban areas. Sustainability 2023, 15(14), 10767. [Google Scholar] [CrossRef]
  31. Makvandi, M.; Li, W.; Ou, X.; Chai, H.; Khodabakhshi, Z.; Fu, J.; Horimbere, E. D. L. J. Urban heat mitigation towards climate change adaptation: An eco-sustainable design strategy to improve environmental performance under rapid urbanization. Atmosphere 2023, 14(4), 638. [Google Scholar] [CrossRef]
  32. Prasomsup, W. Spatial evalution and prediction of urban heat island pkenomena in bangkok and its vicinity. Doctoral dissertation, School of Remote Sensing Institute of Science Suranaree University of Technology, 2017. [Google Scholar]
  33. Eludoyin, A. O.; Omotoso, I.; Eludoyin, O. M.; Popoola, K. S. Remote sensing technology for evaluation of variations in land surface temperature, and case study analysis from Southwest Nigeria. Geospatial challenges in the 21st century 2019, 151–170. [Google Scholar] [CrossRef]
  34. Simwanda, M.; Ranagalage, M.; Estoque, R. C.; Murayama, Y. Spatial analysis of surface urban heat islands in four rapidly growing African cities. Remote Sensing 2019, 11(14), 1645. [Google Scholar] [CrossRef]
  35. Athukorala, D.; Murayama, Y. Urban heat island formation in Greater Cairo: Spatio-temporal analysis of daytime and nighttime land surface temperatures along the urban–rural gradient. Remote Sensing 2021, 13(7), 1396. [Google Scholar] [CrossRef]
  36. Kotir, C.; Amponsah, O.; Anbazu, J.; Takyi, S. A.; Blija, D. K.; Frempong, F. Unveiling Ghana's urban tapestry: satellite-based analysis of Tamale city's spatial expansion and land surface temperature (LST) dynamics. GeoJournal 2024, 89(6), 1–25. [Google Scholar] [CrossRef]
  37. Makinde, E. O.; Agbor, C. F. Geoinformatic assessment of urban heat island and land use/cover processes: a case study from Akure. Environmental Earth Sciences 2019, 78, 1–12. [Google Scholar] [CrossRef]
  38. Ofordu, C. S.; Agbor, C. F.; Aigbokhan, O. J.; Audu, M. A.; Adedoyin, E. D.; Ogoliegbune, O. M. Urban Heat Island and Land Use/Cover Dynamics Evaluation in Enugu Urban, Nigeria. Journal of Geoscience and Environment Protection 2022, 10(12), 354–372. [Google Scholar] [CrossRef]
  39. Odunsi, O. M.; Rienow, A. Estimating Surface Urban Heat Island Effects of Abeokuta Within the Context of Its Economic Development Cluster in Ogun State Nigeria: A Baseline Study Utilising Remote Sensing and Cloud-Based Computing Technologies. Climate 2024, 12(12), 198. [Google Scholar] [CrossRef]
  40. National Population Commission of Nigeria. National Bureau of Statistics - City population. 2023. Available online: https://citypopulation.de/en/nigeria/admin/ondo/NGA029005__akure_north/.
  41. Fasakin, J.; Basorun, J.; Bello, M.; Enisan, O.; Ojo, B.; Popoola, O. Effect of Land Pricing on Residential Density Patter in Akure Nigeria. Advances in Social Sciences Research Journal 2018, 5(1), 31–43. [Google Scholar] [CrossRef]
  42. Oduwaye, L.; Akinbile, C.; Oluwatobi, A. A GIS-based assessment of urban expansion and its environmental consequences in Akure, Nigeria. In Journal of Environmental Planning and Management; Office, Vienna, 2020; Volume 63, 8, pp. 1407–1425. [Google Scholar]
  43. Adejuwon, J. O.; Adekitan, A. A.; Oladunmoye, S. L. Community awareness and evaluation of surface water bodies in Osogbo, Osun State, Nigeria. Journal of Applied Sciences and Environmental Management 2018, 22(10), 1567–1571. [Google Scholar] [CrossRef]
  44. Oladehinde, G.; Fatusin, A. F.; Ojo, V. Urban expansion and loss of agricultural land in Osogbo, Osun State Nigeria, using multi-temporal imageries. Journal of African Real Estate Research 2019, 4(1), 139–156. [Google Scholar] [CrossRef]
  45. Olayiwola, A. M.; Olaitan, A. A. Spatial preference of urban residential location in Osogbo, Nigeria. Ghana Journal of Geography 2019, 11(1), 140–158. [Google Scholar]
  46. Aluko, O. W.; Okhimamhe, A.; Abubaker, S. Towards Transforming Osogbo into a Sustainable City, The Remote Sensing Perspective. AIJR Preprints 2022. [Google Scholar] [CrossRef]
  47. Alimi, S. A.; Andongma, T. W.; Ogungbade, O.; Senbore, S. S.; Alepa, V. C.; Akinlabi, O. J.; Muhammed, Q. O. Flood vulnerable zones mapping using geospatial techniques: Case study of Osogbo Metropolis, Nigeria. The Egyptian Journal of Remote Sensing and Space Science 2022, 25(3), 841–850. [Google Scholar] [CrossRef]
  48. Gorelick, N.; Hancher, M.; Dixon, M.; Ilyushchenko, S.; Thau, D.; Moore, R. Google Earth Engine: Planetary-scale geospatial analysis for everyone. Remote sensing of Environment 2017, 202, 18–27. [Google Scholar] [CrossRef]
  49. Badmos, O. S.; Rienow, A.; Callo-Concha, D.; Greve, K.; Jürgens, C. Urban development in West Africa—Monitoring and intensity analysis of slum growth in Lagos: Linking pattern and process. Remote Sensing 2018, 10(7), 1044. [Google Scholar] [CrossRef]
  50. Badmos, O. S.; Rienow, A.; Callo-Concha, D.; Greve, K.; Jürgens, C. Simulating slum growth in Lagos: An integration of rule based and empirical based model. Computers, environment and urban systems 2019, 77, 101369. [Google Scholar] [CrossRef]
  51. Breiman, L. Random forests. Machine learning 2001, 45, 5–32. [Google Scholar] [CrossRef]
  52. Franco, F.; Di Napoli, A. Reliability assessment of a measure: the kappa statistic. Giornale di Tecniche Nefrologiche e Dialitiche 2016, 28(4), 289–292. [Google Scholar] [CrossRef]
  53. Huang, S.; Tang, L.; Hupy, J.P.; Wang, Y.; Shao, G.F. A commentary review on the use of normalized difference vegetation index (NDVI) in the era of popular remote sensing. J. For. Res. Erratum in J. For. Res. 2021, 32, 1–6, Erratum in J. For. Res. 2021, 32, 2719. [Google Scholar] [CrossRef]
  54. Heydarian, M.; Doyle, T. E.; Samavi, R. MLCM: Multi-label confusion matrix. IEEE Access 2022, 10, 19083–19095. [Google Scholar] [CrossRef]
  55. Norman, J.M.; Becker, F. Terminology in thermal infrared remote sensing of natural surfaces. Agric. For. Meteorol. 1995, 77, 153–166. [Google Scholar] [CrossRef]
  56. Li, Z. L.; Tang, B. H.; Wu, H.; Ren, H.; Yan, G.; Wan, Z.; Sobrino, J. A. Satellite-derived land surface temperature: Current status and perspectives. Remote sensing of environment 2013, 131, 14–37. [Google Scholar] [CrossRef]
  57. Waleed, M.; Sajjad, M.; Acheampong, A. O.; Alam, M. T. Towards sustainable and livable cities: leveraging remote sensing, machine learning, and geo-information modelling to explore and predict thermal field variance in response to urban growth. Sustainability 2023, 15(2), 1416. [Google Scholar] [CrossRef]
  58. Moisa, M. B.; Gemeda, D. O. Assessment of urban thermal field variance index and thermal comfort level of Addis Ababa metropolitan city, Ethiopia. Heliyon 2022, 8(8). [Google Scholar] [CrossRef]
  59. Bytyqi, V.; Qevani, S.; Agaj, T. Quantifying and Visualizing Land Cover. 2024. [Google Scholar]
  60. Ghazaryan, G.; Rienow, A.; Oldenburg, C.; Thonfeld, F.; Trampnau, B.; Sticksel, S.; Jürgens, C. Monitoring of urban sprawl and densification processes in western Germany in the light of SDG indicator 11.3. 1 based on an automated retrospective classification approach. Remote Sensing 2021, 13(9), 1694. [Google Scholar] [CrossRef]
  61. Cuba, N. Research note: Sankey diagrams for visualizing land cover dynamics. Landscape and Urban Planning 2015, 139, 163–167. [Google Scholar] [CrossRef]
  62. Balogun, I. A.; Adeyewa, D. Z.; Balogun, A. A.; Morakinyo, T. E. Analysis of urban expansion and land use changes in Akure, Nigeria, using remote sensing and geographic information system (GIS) techniques. Journal of Geography and Regional Planning 2011, 4(9), 533. [Google Scholar]
  63. Ekemode, B. G. Impact of urban regeneration on commercial property values in Osogbo, Osun State, Nigeria. Smart and Sustainable Built Environment 2020, 9(4), 557–571. [Google Scholar] [CrossRef]
  64. Ismail, A. I.; Kehinde, O. J.; Adedayo, O. O.; Aderinola, O. F. Appraising the Performance of Urban Renewal Measures in Nigeria: A Case of Osogbo, Osun State. 2020. [Google Scholar] [CrossRef]
  65. Yoade, A. O.; Onifade, V. A.; Jimoh, H. O. Residents’ satisfaction with urban renewal projects in south-western Nigeria. Journal of Urban Regeneration & Renewal 2022, 16(2), 139–154. [Google Scholar]
  66. Ojo, O. O.; Shittu, A. A.; Adebolu, T. J. Landuse Pattern and Landcover of Akure Forest Reserve and Its Environs. International Journal of Environment and Climate Change 2019, 9(12), 852–861. [Google Scholar] [CrossRef]
  67. Ochei, M. C.; Ogunfuyi, S. O. Impact of Urbanization on Temperature Trend Using Geospatial Techniques Sciences, 6(3), 208-223.in Ondo State, Nigeria. Remote Sensing in Earth Systems 2023. [Google Scholar] [CrossRef]
  68. Rauf, S.; Pasra, M. M. Analysis of correlation between urban heat islands (SUHI) with land-use using sentinel 2 time-series image in Makassar city. In IOP Conference Series: Earth and Environmental Science; IOP Publishing, 2020; Vol. 419, No. 1, p. 012088. [Google Scholar] [CrossRef]
  69. Patriota, E. G. Analysis of patterns, drivers, and trends of Surface Urban Heat Islands (SSUHIS) in Brazil. 2024. Available online: https://repositorio.ufpb.br/jspui/handle/123456789/32140.
  70. Singh, R.; Kalota, D. Urban sprawl and its impact on generation of urban heat island: A case study of Ludhiana city. Journal of the Indian society of remote sensing 2019, 47(9), 1567–1576. [Google Scholar] [CrossRef]
  71. Kafy, A. A.; Rahman, M. S.; Hasan, M. M.; Islam, M. Modelling future land use land cover changes and their impacts on land surface temperatures in Rajshahi, Bangladesh. Remote Sensing Applications: Society and Environment 2020, 18, 100314. [Google Scholar] [CrossRef]
  72. Saleem, M. S.; Ahmad, S. R.; Javed, M. A. Impact assessment of urban development patterns on land surface temperature by using remote sensing techniques: a case study of Lahore, Faisalabad and Multan district. Environmental Science and Pollution Research 2020, 27(32), 39865–39878. [Google Scholar] [CrossRef] [PubMed]
  73. Seun, A. I.; Ayodele, A. P.; Koji, D.; Akande, S. O. The potential impact of increased urbanization on land surface temperature over South-West Nigeria. Current Research in Environmental Sustainability 2022, 4, 100142. [Google Scholar] [CrossRef]
  74. Ma, X.; Peng, S. Research on the spatiotemporal coupling relationships between land use/land cover compositions or patterns and the surface urban heat island effect. Environmental Science and Pollution Research 2022, 29(26), 39723–39742. [Google Scholar] [CrossRef] [PubMed]
Figure 1. Maps of the Study Area.
Preprints 150083 g001
Figure 2. Methodological framework.
Preprints 150083 g002
Figure 3. Land use land cover classification of Akure.
Preprints 150083 g003
Figure 4. Land use land cover classification of Osogbo.
Preprints 150083 g004
Figure 5. Sankey charts for land use and land cover changes in Akure from 2014 to 2023.
Preprints 150083 g005
Figure 6. Sankey charts for land use and land cover changes in Osogbo from 2014 to 2023.
Preprints 150083 g006
Figure 7.
Figure 7.
Preprints 150083 g007
Figure 8. NDVI of Akure and Osogbo 2014 and 2023.
Preprints 150083 g008
Figure 9. Emissivity of Akure and Osogbo 2014 and 2023.
Preprints 150083 g009
Figure 10. LST of Akure and Osogbo 2014 and 2023.
Preprints 150083 g010
Figure 11. SUHI of Akure and Osogbo 2014 and 2023.
Preprints 150083 g011
Figure 12. UTFVI of Akure and Osogbo 2014 and 2023.
Preprints 150083 g012
Table 1. Image Spectral Bands for Landsat 8-9 Operational Land Imager (OLI) and Thermal Infrared Sensor (TIRS).
Band Wavelength (micrometers) Resolution (meters)
Band1 - Coastal aerosol 0.43 – 0.45 30
Band2 – Blue 0.45 – 0.51 30
Band3 – Green 0.53 – 0.59 30
Band4 – Red 0.64 – 0.67 30
Band5 – Near Infrared (NIR) 0.85 – 0.88 30
Band6 – SWIR 1 1.57 – 1.65 30
Band7 – SWIR 2 2.11 – 2.29 30
Band8 – Panchromatic 0.50 – 0.68 15
Band9 – Cirrus 1.36 – 1.38 30
Band10 – Thermal Infrared (TIRS) 1 10.6 – 11.19 100
Band 11 - Thermal Infrared (TIRS) 2 11.50 – 12.51 100
Source: NASA/USGS (2019, 2022).
Table 2. Assessment of the accuracy of LULC in 2014 and 2023 for Akure and Osogbo.
Sample Assessment Akure 2014 Akure 2023 Osogbo 2014 Osogbo 2023
Training Overall Accuracy (OvA) 0.998 0.998 0.993 0.996
Kappa Coefficient (K) 0.998 0.996 0.991 0.995
Testing Overall Accuracy (OvA) 0.812 0.800 0.834 0.816
Kappa Coefficient (K) 0.746 0.705 0.791 0.738
Number of trees for hyperparameter tuning 80 90 90 50
Table 3. Relationship between change in LULC and SUHI effects.
Study Area Class Min Max Mean SD Median 90th Percentile
Akure 2014 Built -0.115 0.281 0.114 0.056 0.114 0.189
Bare land -0.219 0.279 0.023 0.055 0.020 0.091
Light forest -0.226 0.223 -0.026 0.046 -0.029 0.035
Thick forest -0.220 0.220 -0.072 0.036 -0.076 -0.028
Water -0.098 0.155 0.013 0.046 0.008 0.072
Akure 2023 Built -0.435 0.267 0.083 0.065 0.093 0.157
Bare land -0.250 0.233 0.052 0.052 0.056 0.115
Light forest -0.479 0.227 -0.035 0.064 -0.038 0.051
Thick forest -0.442 0.229 -0.084 0.048 -0.084 -0.027
Water -0.098 0.126 0.009 0.046 0.012 0.069
Osogbo 2014 Built -0.094 0.235 0.106 0.045 0.106 0.166
Bare land -0.200 0.163 -0.029 0.072 0.026 0.065
Light forest -0.211 0.199 -0.016 0.062 -0.016 0.066
Thick forest -0.237 0.151 -0.127 0.048 -0.135 -0.063
Water -0.234 0.179 -0.115 0.073 -0.143 0.005
Osogbo 2023 Built -0.155 0.221 0.075 0.047 0.080 0.130
Bare land -0.154 0.117 -0.017 0.048 -0.013 0.046
Light forest -0.214 0.149 -0.021 0.054 -0.015 0.046
Thick forest -0.244 0.135 -0.116 0.052 -0.125 -0.043
Water -0.286 0.083 -0.163 0.045 -0.156 -0.117
Disclaimer/Publisher’s Note: The statements, opinions and data contained in all publications are solely those of the individual author(s) and contributor(s) and not of MDPI and/or the editor(s). MDPI and/or the editor(s) disclaim responsibility for any injury to people or property resulting from any ideas, methods, instructions or products referred to in the content.
Copyright: This open access article is published under a Creative Commons CC BY 4.0 license, which permit the free download, distribution, and reuse, provided that the author and preprint are cited in any reuse.
Prerpints.org logo

Preprints.org is a free preprint server supported by MDPI in Basel, Switzerland.

Subscribe

Disclaimer

Terms of Use

Privacy Policy

Privacy Settings

© 2025 MDPI (Basel, Switzerland) unless otherwise stated