1. Introduction
Increasing global, regional, and local urbanization fosters a wide range of environmental challenges, including Urban Heat Islands (UHIs) [
1,
2]. This phenomenon arises from the temperature contrast between rural and urban zones, whereby the daily thermal amplitude of urban zones is decreased as a result of the diurnal absorption of solar energy, which gradually dissipates during the night [
3]. Several factors, such as land use and land cover changes [
4], changes in urban architecture [
5,
6], and human activities, are often associated with the UHI phenomenon, which influences different local conditions [
7]. Land use and land cover changes resulting from urbanization promote the increased usage of materials, such as asphalt, with greater potential for heat absorption and storage [
4]. Furthermore, changes in urban architecture involving building geometry, particularly construction patterns with tall buildings situated closely together in small spaces, contribute to the phenomenon referred to as the “urban canyon”[
5,
6]. The urban canyon associated with heat emissions from human activities, particularly transport and industrial activities, further amplifies surface warming and significantly exacerbates Urban Heat Island (UHI) effects [
7,
8]. The UHI effect is typically related to various environmental, social, and economic consequences. Beyond compromising well-being, raising energy consumption, and deteriorating air quality, the UHI effect can aggravate respiratory health problems. Elevated heat places strain on water supply systems, reducing availability and increasing contamination risks, particularly in areas dependent on vulnerable water sources [
7,
9,
10,
11]. The UHI effect disrupts cultural and social dynamics by limiting outdoor activities and altering the natural rhythms of urban life. Especially in tropical areas, such as the Kisangani region in the Democratic Republic of Congo (DRC), the UHI effect may significantly impact agriculture, where high temperatures already pose challenges. Indeed, elevated urban heat alters microclimates [
7], with the potential to spread parasites and diseases that thrive in warmer conditions, increase irrigation requirements, and accelerate the decomposition of soil organic matter, thereby reducing fertility. The UHI effect has thus attracted considerable attention, particularly in the last decade, due to such challenges.
In this context, Garcia-Herrera et al. [
12] analyzed the 2003 heatwave and reported a 60% increase in mortality in France from August 1 to 20, with 14,802 additional deaths. In Shanghai, China, Zhang et al. [
13] found that reduced green spaces and water bodies combined with population changes intensified the spatial and temporal dynamics of the UHI. In the United Kingdom (UK), Malley et al. [
14] highlighted the role of building design (shape, orientation) and the use of green spaces and reflective materials in mitigating UHI effects. Furthermore, in India, Mandal et al.[
15], reported a significant rise in surface temperatures in the Kolkata Metropolitan Area, with increases 2.5 times higher than surrounding regions. In the tropical regions, Li et al.[
16], observed an expansion of UHI in Kampala, Uganda, between 2003 and 2017, despite a decrease in average daytime temperatures, suggesting that well-managed urbanization can mitigate environmental impacts [
16]. In the region of Accra, Ghana, Wemegah et al.[
17], confirmed the intensification and spatial expansion of UHI in Accra, where built-up and bare land areas experienced increased heat, worsening extreme heat events.
Despite extensive studies on the UHI effect globally, no research has addressed its existence and impacts in Kisangani, DRC, a city that experienced significant spatial expansion from 1987 to 2021 [
18], resulting in forest loss and altered spatial configurations [
19]. This study fills this gap by analyzing the spatiotemporal patterns of the Surface Urban Heat Island (SUHI) in the context of rapid urbanization. It also examines the relationship between Building Volume Density (BVD), which accounts for the footprint and height of buildings, and Land Surface Temperature (LST), providing insights into how urban design influences thermal dynamics. The analysis across urbanization gradients, using randomly selected plots, further highlights spatial variations in UHI effects.
We therefore hypothesize that Kisangani’s spatial transformations between 2000 and 2024, driven by uncontrolled urban expansion [
18,
19,
20], have caused significant variations in LST and the formation of Urban Heat Islands (UHIs). The spatial extent of the moderate and high UHI is expected to have expanded substantially, reflecting the intensified impact of urbanization on local thermal conditions. Across the urbanization gradient, we anticipate notable fluctuations in LST and UHI effects, with urban areas showing higher averages than peri-urban and rural zones due to increased artificialization in 2024. Annual variations in LST and UHI effects are expected to differ significantly within each gradient zone from 2000 to 2024, highlighting their dynamic nature. Additionally, we predict significant annual differences in UHI fluctuations among urban, peri-urban, and rural areas during this period. Furthermore, LST variations are hypothesized to correlate significantly with (1) Building Volume Density (BVD) and (2) vegetation density, measured by the Normalized Difference Vegetation Index (NDVI). As Kisangani’s urban architecture evolves with denser and taller buildings, BVD’s influence on LST and UHI effects is expected to increase, while vegetation density’s predictive role is anticipated to decline.
2. Materials and Methods
2.1. Study Area
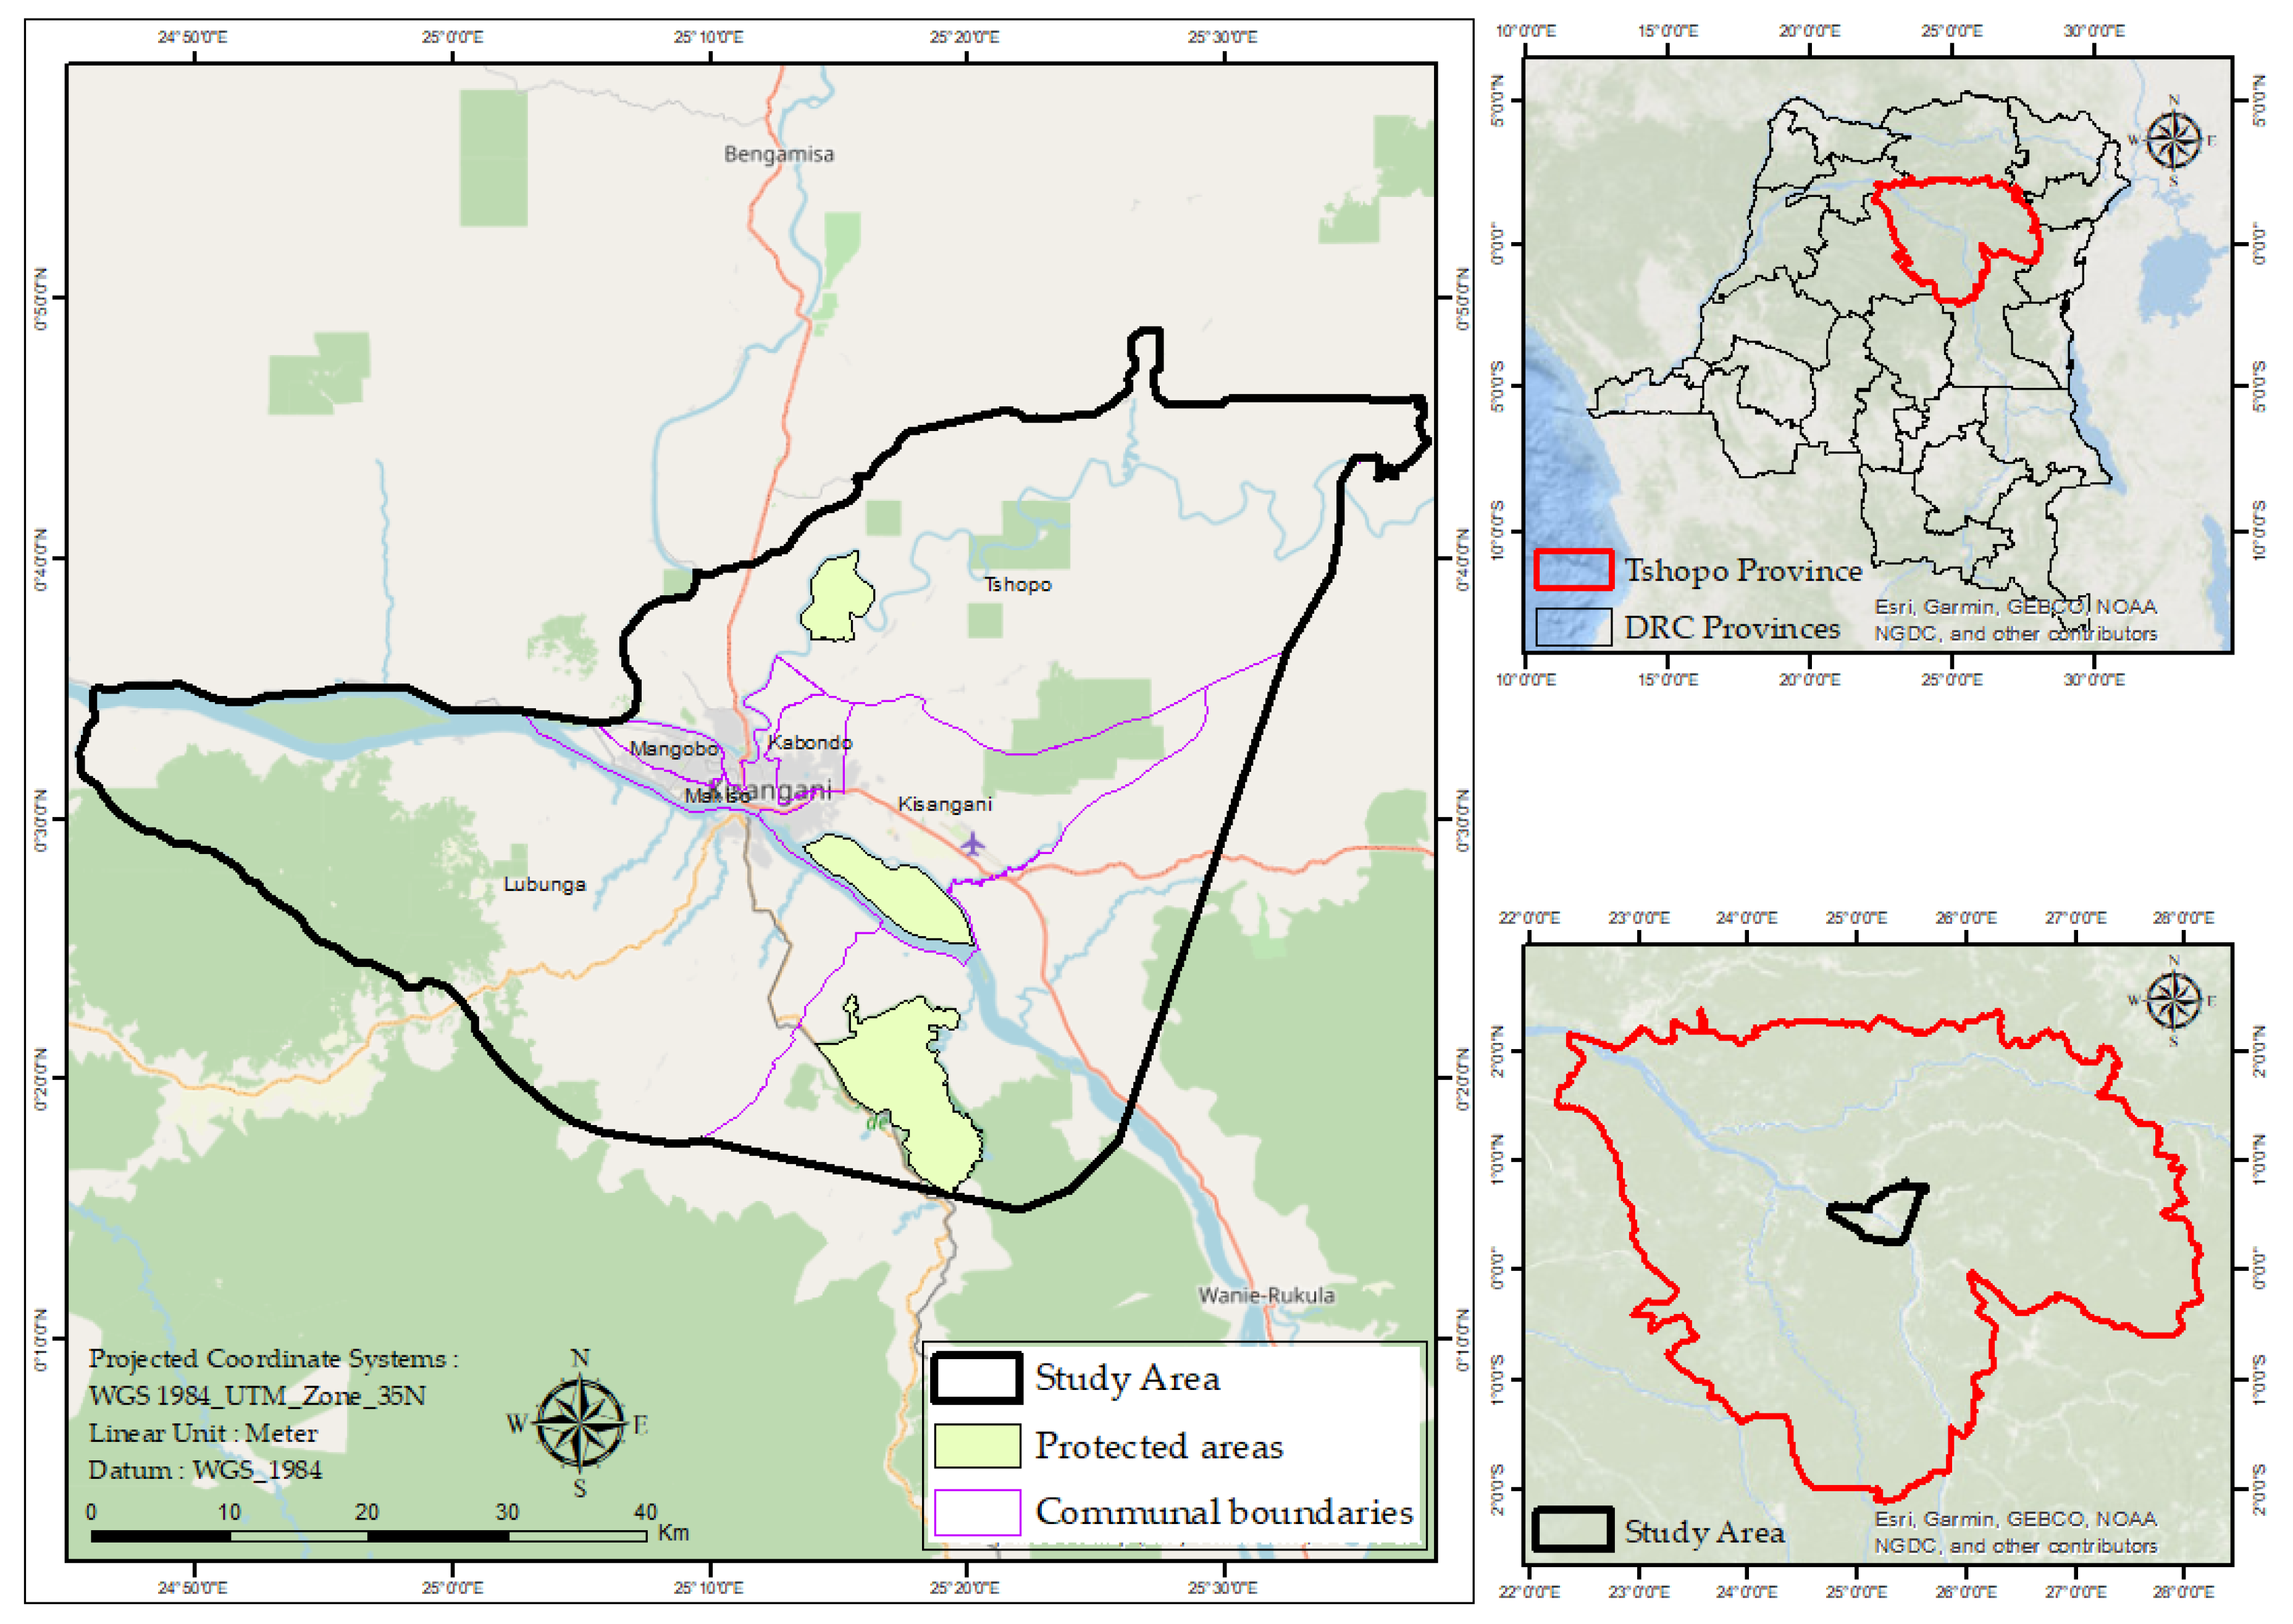
The area examined comprises the city of Kisangani and its surroundings in north-eastern DRC (
Figure 1). Covering an area of 2,947.9 km², the studied region includes six municipalities of Kisangani. Five of these municipalities are on the right bank of the Congo River, while one is on the left bank (
Figure 1). Over 50 years (1956–2005), the region recorded an average annual rainfall of 1,724 mm and a mean annual temperature of 25.3°C [
21]. Monthly rainfall consistently surpasses 60 mm year-round [
21], classifying Kisangani as an Af climate type under the Köppen classification system [
21,
22]. Kisangani has reported substantial population growth in recent years. According to the National Statistics Institute, the city’s population surpassed 2,184,096 in 2021 [
18]. The city is characterized by a diverse mix of ethnic groups from different regions of the DRC and neighboring countries. Most residents sustain their livelihoods through agriculture, fishing, and trade [
23]. The rising demand for social infrastructure has driven significant urban and peri-urban expansion, potentially influencing the LST [
18].
2.2. Data Used
Spatiotemporal pattern analysis of urban heat island (UHI) and vegetation density as measured by NDVI were performed using MODIS satellite data available in Google Earth Engine. Data regarding building volume and population density were obtained from the Global Human Settlement Layer (GHSL) project of the Joint Research Centre (JRC) as updated in 2023 [
24]. Furthermore, high-resolution satellite imagery from Google Earth was employed to identify and characterize urban, peri-urban, and rural zones along the urbanization gradient.
Table 1 below describes the data used.
2.3. Data-Processing and Derivation of the Land Surface Temperature (LST)
The Google Earth Engine (GEE) platform provides access to MODIS Land Surface Temperature (LST) products through the “MOD11A2 V6.1” image collection. Each pixel in MOD11A2 represents the mean value derived from all corresponding MOD11A1 LST pixels recorded over the 8-day interval [
25]. The daily MOD11A1 LST product is generated using pixel-level LST data from individual granules, derived under clear-sky conditions through the generalized split-window algorithm. This method adjusts LST values in two thermal infrared bands (31 and 32) to compensate for atmospheric influences. Additionally, it incorporates land-cover-specific emissivity values to refine LST accuracy by addressing variations in surface emissivity [
25,
26]. Using GEE, the LST images were transformed from Kelvin to Celsius by applying a scale factor of 0.02 and subtracting 273.15 [
15,
16,
17,
18,
19,
20,
21,
22,
23,
24,
25].
We used the NDVI to quantify variations in vegetation density. NDVI is derived from the visible and near-infrared (NIR) bands of the Advanced Very High-Resolution Radiometer (AVHRR) and MODIS, particularly using the “MODIS/061/MOD13A2” dataset. This collection provides NDVI images at 1 km spatial resolution with a 16-day interval. Generally, positive NDVI values signify vegetated areas, whereas values at or below zero represent bare soil or water bodies [
26,
27].
The geospatial data on building volume and population density were obtained through the Global Human Settlement Layer (GHSL) project [
24]. The raster dataset on building volume depicts the worldwide distribution of building volumes, measured in cubic meters, with a spatial resolution of 1 km. It provides data on the total building volume and the volume associated with grid cells primarily designated for non-residential (NRES) purposes. These estimates are derived from built-up surface and building height data generated using inputs from Advanced World 3D 30m (AW3D30), Shuttle Radar Topography Mission (SRTM30), Sentinel-2, and Landsat composites [
24]. However, based on interpolation, GHSL building volume data can be subject to significant errors, particularly in rapidly changing urban areas. Therefore, to ensure a good level of accuracy, these data were compared with building volume data obtained by combining Open Street Map data on building footprint and building height data extracted from the subtraction of elevation values from the ALOS World 3D - 30m digital surface model (AW3D30) and those from the Digital Terrain Model (DTM) from Shuttle Radar Topography Mission (SRTM30). Furthermore, data on population density depicts the distribution of the human population expressed as the number of people per cell [
24]. These data cover the period from 1975 to 2030 and are spatio-temporally interpolated at five-year intervals. Data for the intermediate years were derived through a straightforward analysis of annual rate changes within each pixel of 1 Km. Thus, for example, data on building volume and population density per pixel for 2001, 2002, 2003, and 2004 were obtained by applying the annual percentage change calculated between 2000 and 2005 within each pixel.
2.4. Derivation of the Urban Heat Island (UHI)
The mean LST in rural areas was used to indicate the mean LST in the whole study area to analyze the UHI effect [
13,
14,
15,
16,
17,
18,
19,
20,
21,
22,
23,
24,
25,
26,
27,
28,
29]. This analysis was conducted to evaluate temperature fluctuations across urban, peri-urban, and rural zones. Therefore, the UHI effect can be calculated as [
28,
29]:
Where: UHI refers to the urban heat island effect (UHI), measured as the relative LST in the area;
ΔT is the difference between the i-th pixel LST (
Ti )
in °C and the average rural LST (Ts) in °C. From the overall comprehension of the spatial and temporal pattern of the UHI, the UHI magnitude can be categorized into five levels [
28,
29] (
Table 2).
Figure 2 shows the workflow of this study.
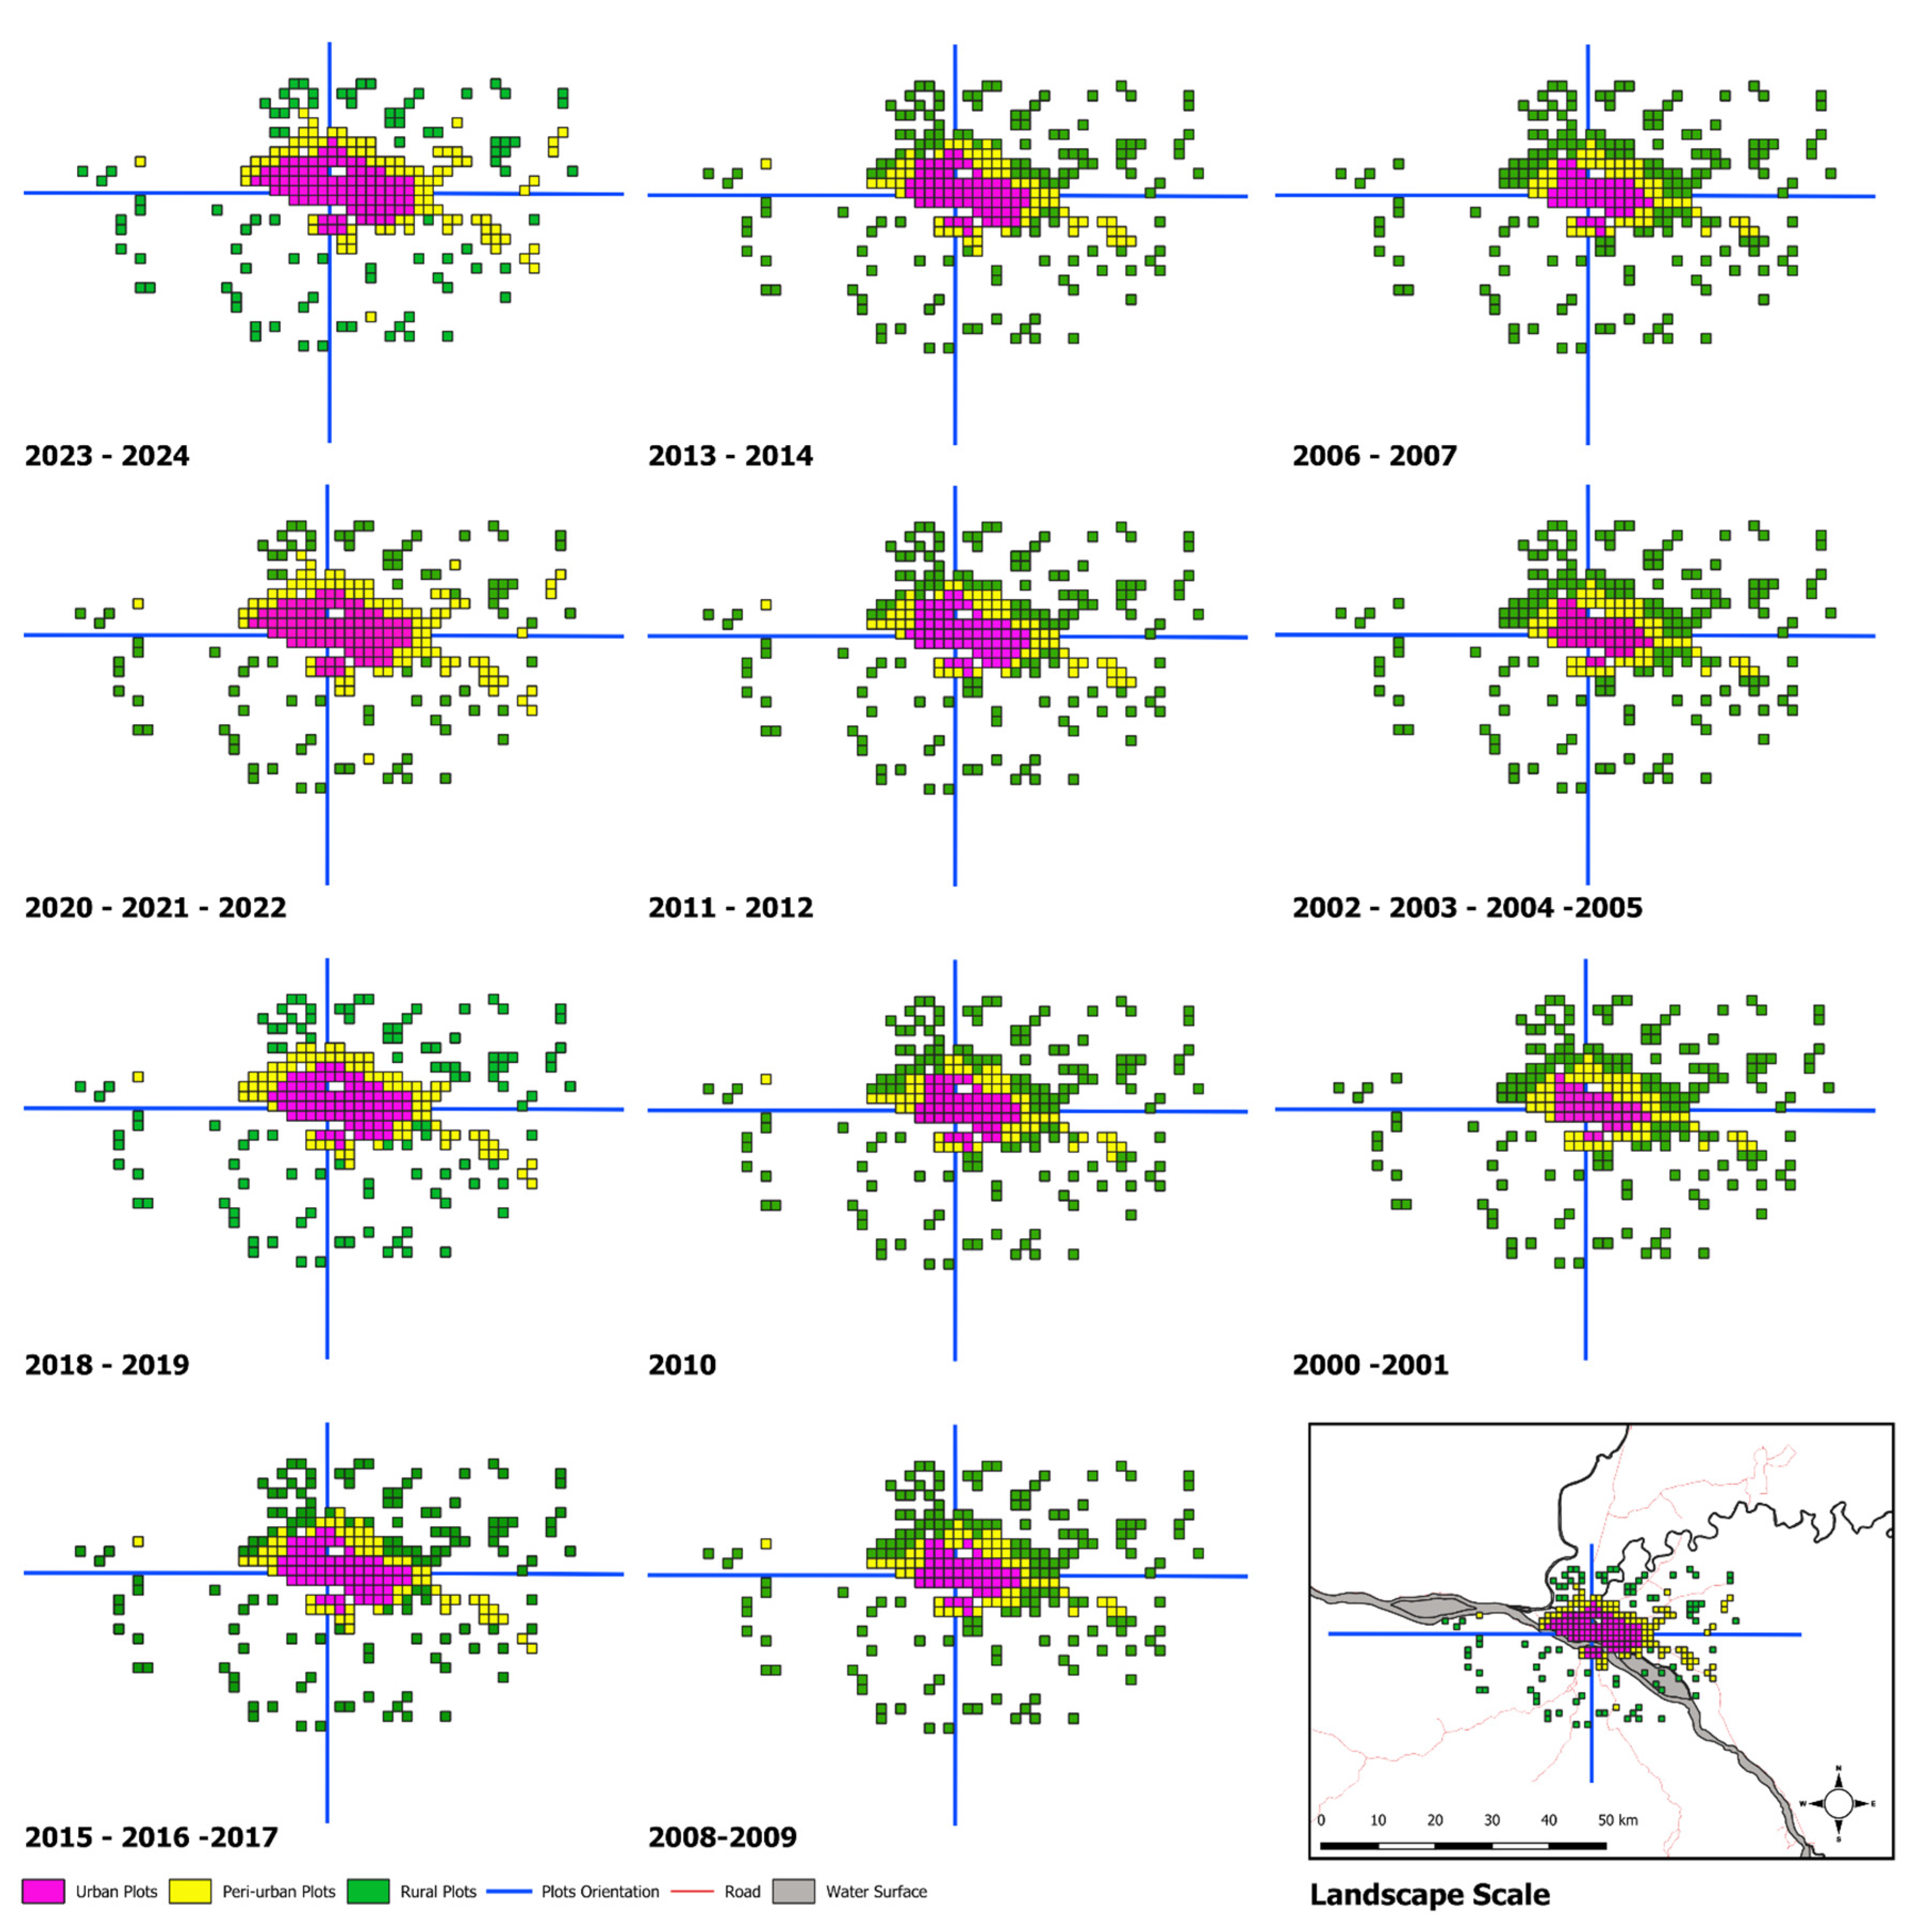
2.5. Spatial Analysis and Delineation of Urban-Rural Gradient Zones
Analysis of Urban Heat Island (UHIs) was conducted within the urban-rural gradient of Kisangani city. In many cases, spatiotemporal analyses of the UHI effect across the urban-rural gradient are conducted using either a transect-based approach [
30] or a concentric zone method [
15]. However, to improve our understanding of the UHI phenomenon across the urban-rural gradient, we used a methodology that captures the spatial complexity inherent in the landscape. To achieve this, a strategic randomized sampling approach was adopted, selecting plots in different directions: north, south, east, and west, as well as northeast, northwest, southeast, and southwest within each defined area of the gradient. This approach enriches the data collected and accounts for the significant spatial variation that can occur perpendicular to a traditional transect. By capturing and incorporating variation at short distances, this approach avoids potential oversights that a concentric zone methodology might introduce [
19].
To delineate the urbanization gradient zones, the decision tree of Marie André et al. [
18,
19,
20,
21,
22,
23,
24,
25,
26,
27,
28,
29,
30,
31,
32] based on morphological criteria was preferred because of its ability to reflect reality. These morphological criteria include vegetation, agricultural areas, and built-up areas, which represent one of the most precise, consistent, and evolving morphological indicators [
18,
19,
20,
21,
22,
23,
24,
25,
26,
27,
28,
29,
30,
31,
32,
33,
34]. Thus, for each date from 2000 to 2024, high-resolution satellite data available on Google Earth was used. Indeed, using a Geographic Information System (GIS), the intensity level of each pixel was highlighted in a range from 0 to 255. Built-up pixels, characterized by impermeable surfaces (roads, roofs, and compacted floors), were characterized by intensity values ranging from 80 to 255. Agricultural and grassland pixels were represented by intensity values between 50 and 80, depending on their stage of development (cultivated land or fallow land). In contrast, forest pixels were characterized by intensity values below 50.
To increase the credibility of the urbanization gradient, the morphological criteria were supported by data on population density. The increase or decrease in population density affects the landscape configuration and composition, and this variable is expected to decrease from urban to rural areas [
18,
19,
20,
21,
22,
23,
24,
25,
26,
27,
28,
29,
30,
31,
32,
33,
34,
35]. Thus, for each year, a plot is classified as urban if more than 50% of its area is covered by built-up pixels [
18,
19,
20,
21,
22,
23,
24,
25,
26,
27,
28,
29,
30,
31,
32,
33,
34] within a cell with a population density greater than 100 inhabitants per km
2 [
18]. The population density threshold of 100 inhabitants per km² was chosen as it represents one of the lowest densities observed near Kisangani’s urban center from 2000 to 2024. It serves as a practical marker to identify areas transitioning to urban characteristics and distinguish them from rural zones. Conversely, a parcel with 50% or fewer built-up pixels in a cell with a population density greater than or equal to 100 inhabitants per km
2 is considered peri-urban, as long as the remaining pixels do not exclusively represent forest or agricultural zones [
18,
19,
20,
21,
22,
23,
24,
25,
26,
27,
28,
29,
30,
31,
32]. On the other hand, a parcel is considered rural if it consists mainly of vegetation pixels [
18,
19,
20,
21,
22,
23,
24,
25,
26,
27,
28,
29,
30,
31,
32].
A total of 86 plots (
Figure 3), each covering a spatial dimension of 1 km², corresponding to the spatial resolution of the MODIS data used, were randomly selected from each zone in the reference year (2024). The random sampling technique was employed to reduce potential bias and improve the applicability of the results on the landscape scale. This method is essential to provide an objective assessment of the variability present in the landscape and to provide a complete view of the impact of urbanization on the UHI phenomenon across the urban-rural gradient. However, it is important to note that spatial features in these observation plots have evolved, reflecting the dynamic properties of urban, peri-urban, and rural zones.
As samples have satisfied the key assumptions for parametric tests, including data normality and homogeneity of variances, we applied an analysis of Variance (ANOVA) test to assess the spatial variations of the LST and the UHI effect across urban, peri-urban, and rural zones. Additionally, this approach was employed to assess the temporal effects of various years on LST and UHI variations. Furthermore, to assess the impacts of Building Volume Density (BVD) and vegetation density, we conducted linear regression analyses. The historical trends observed in the slope and coefficient of determination from these regressions have enhanced our understanding of the roles of building volume density and vegetation density as predictors of LST.
3. Results
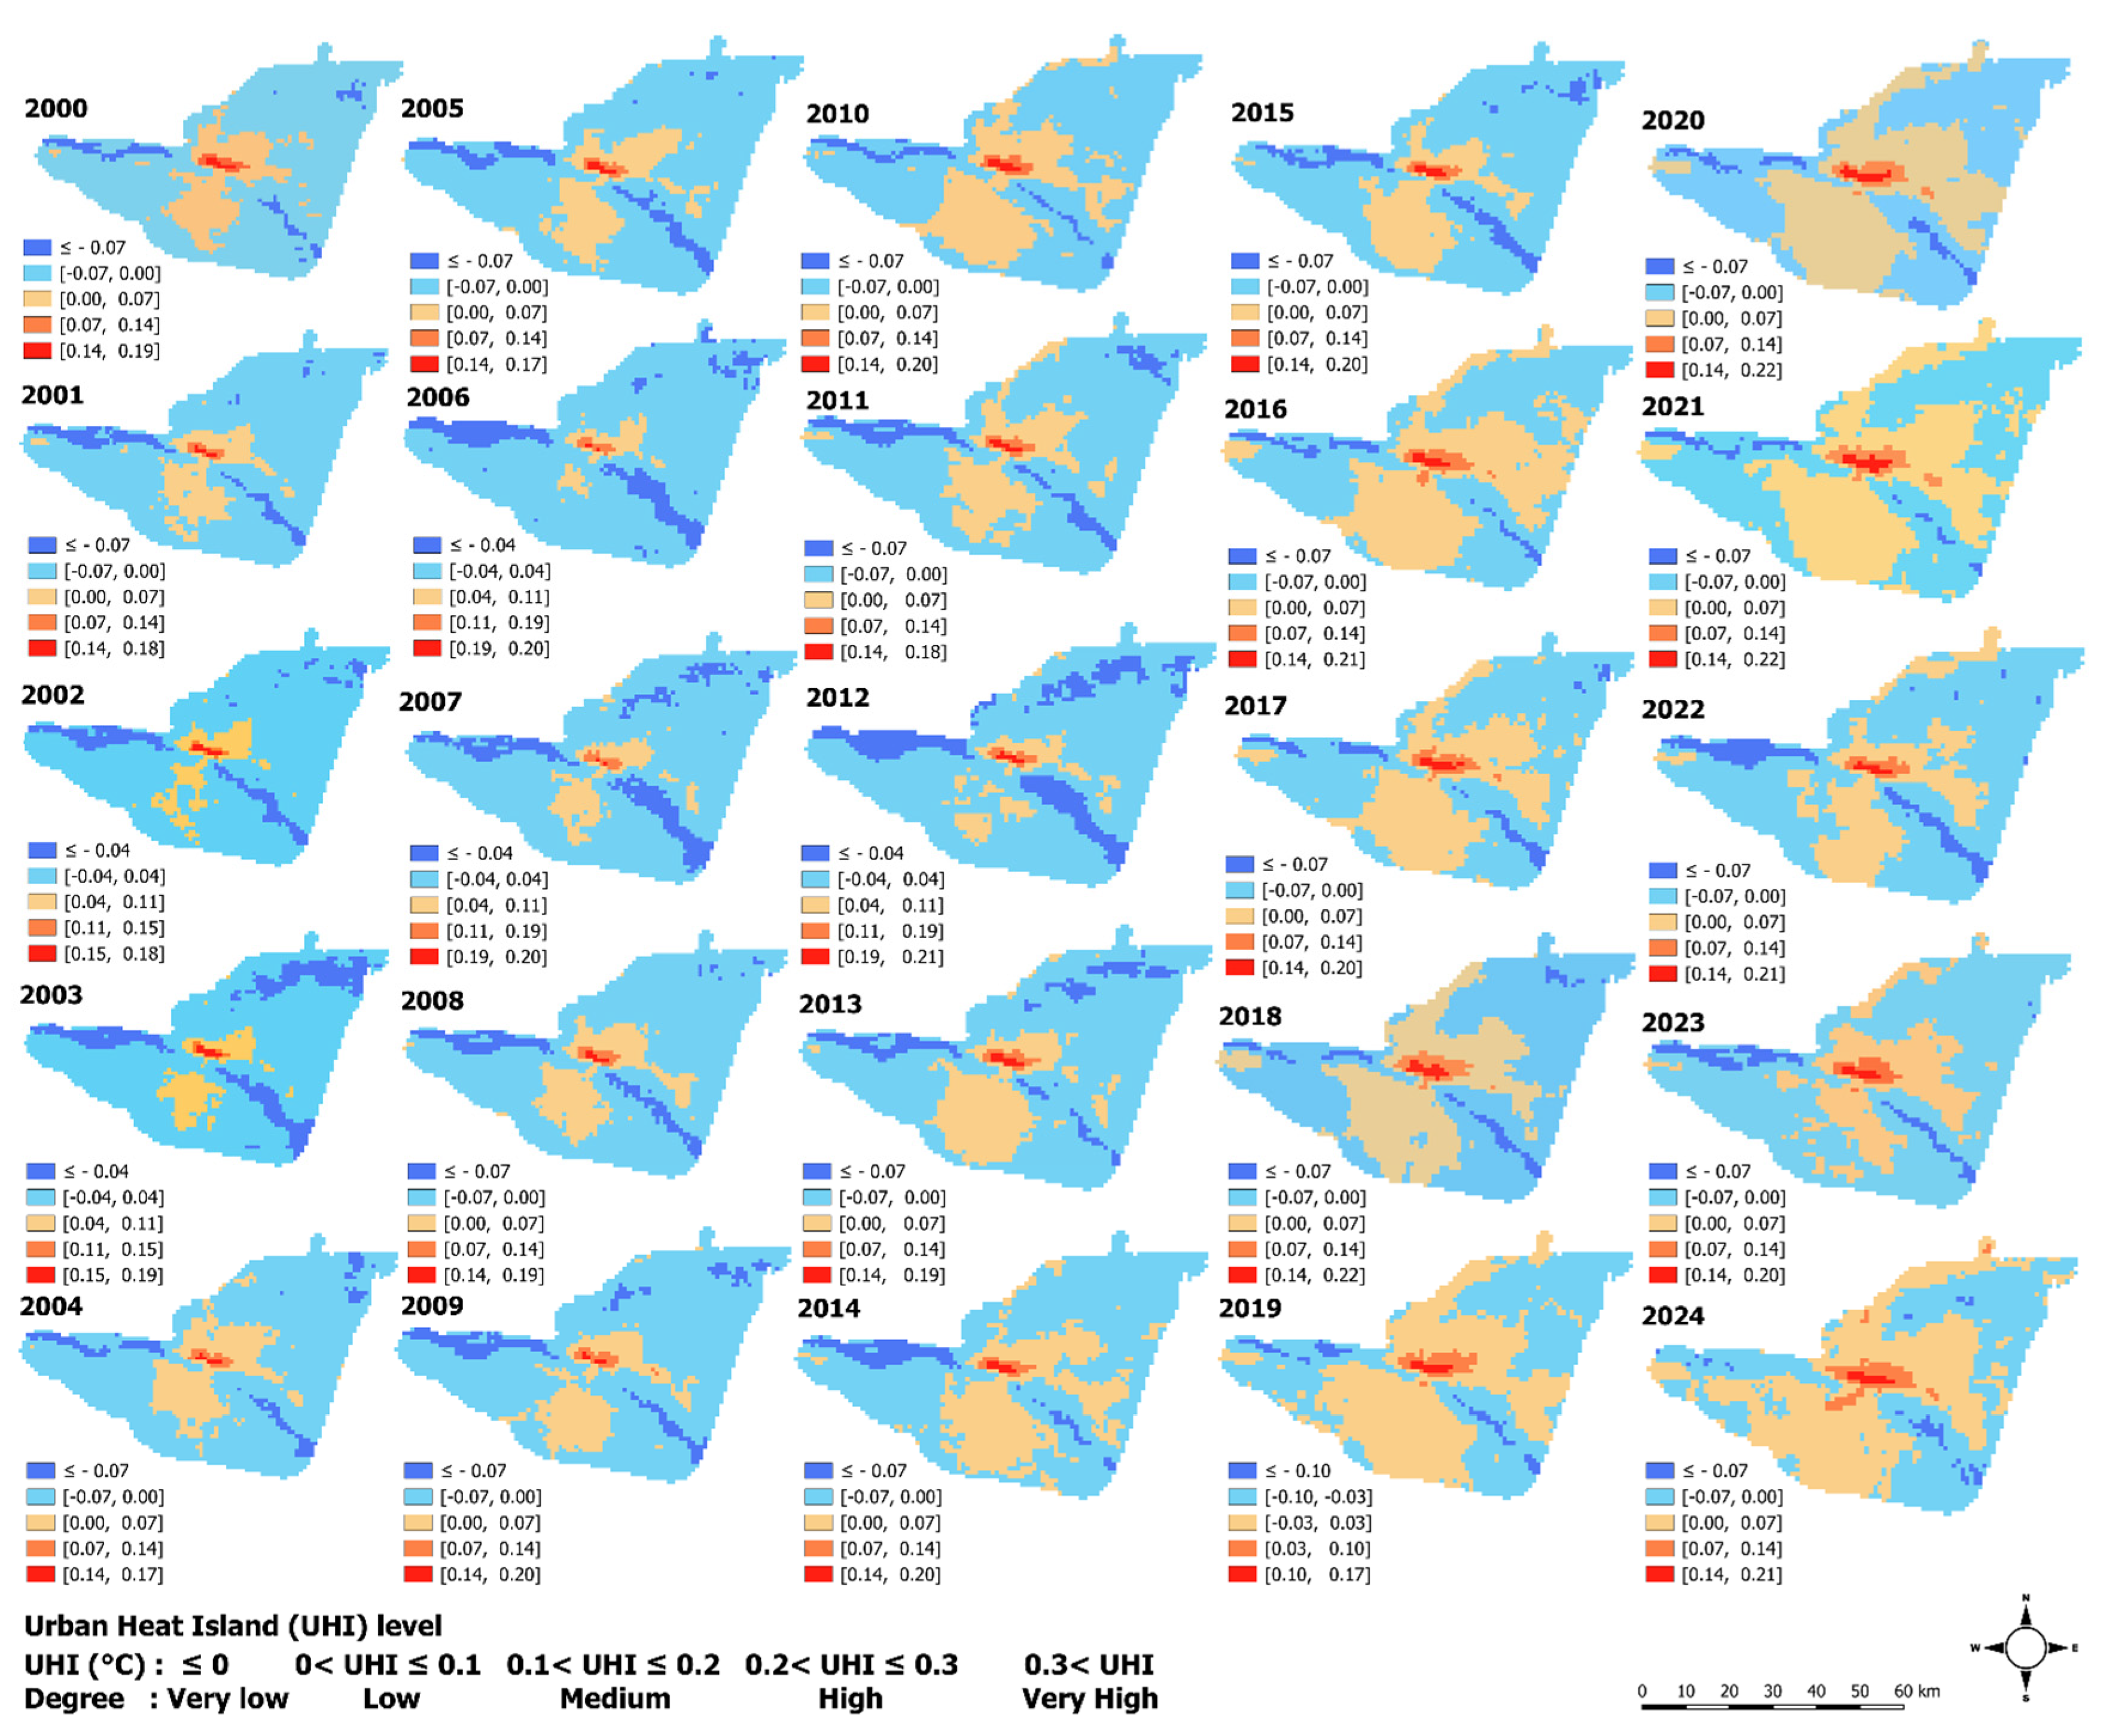
3.1. Spatio-temporal Patterns of Urban Heat Island (UHI)
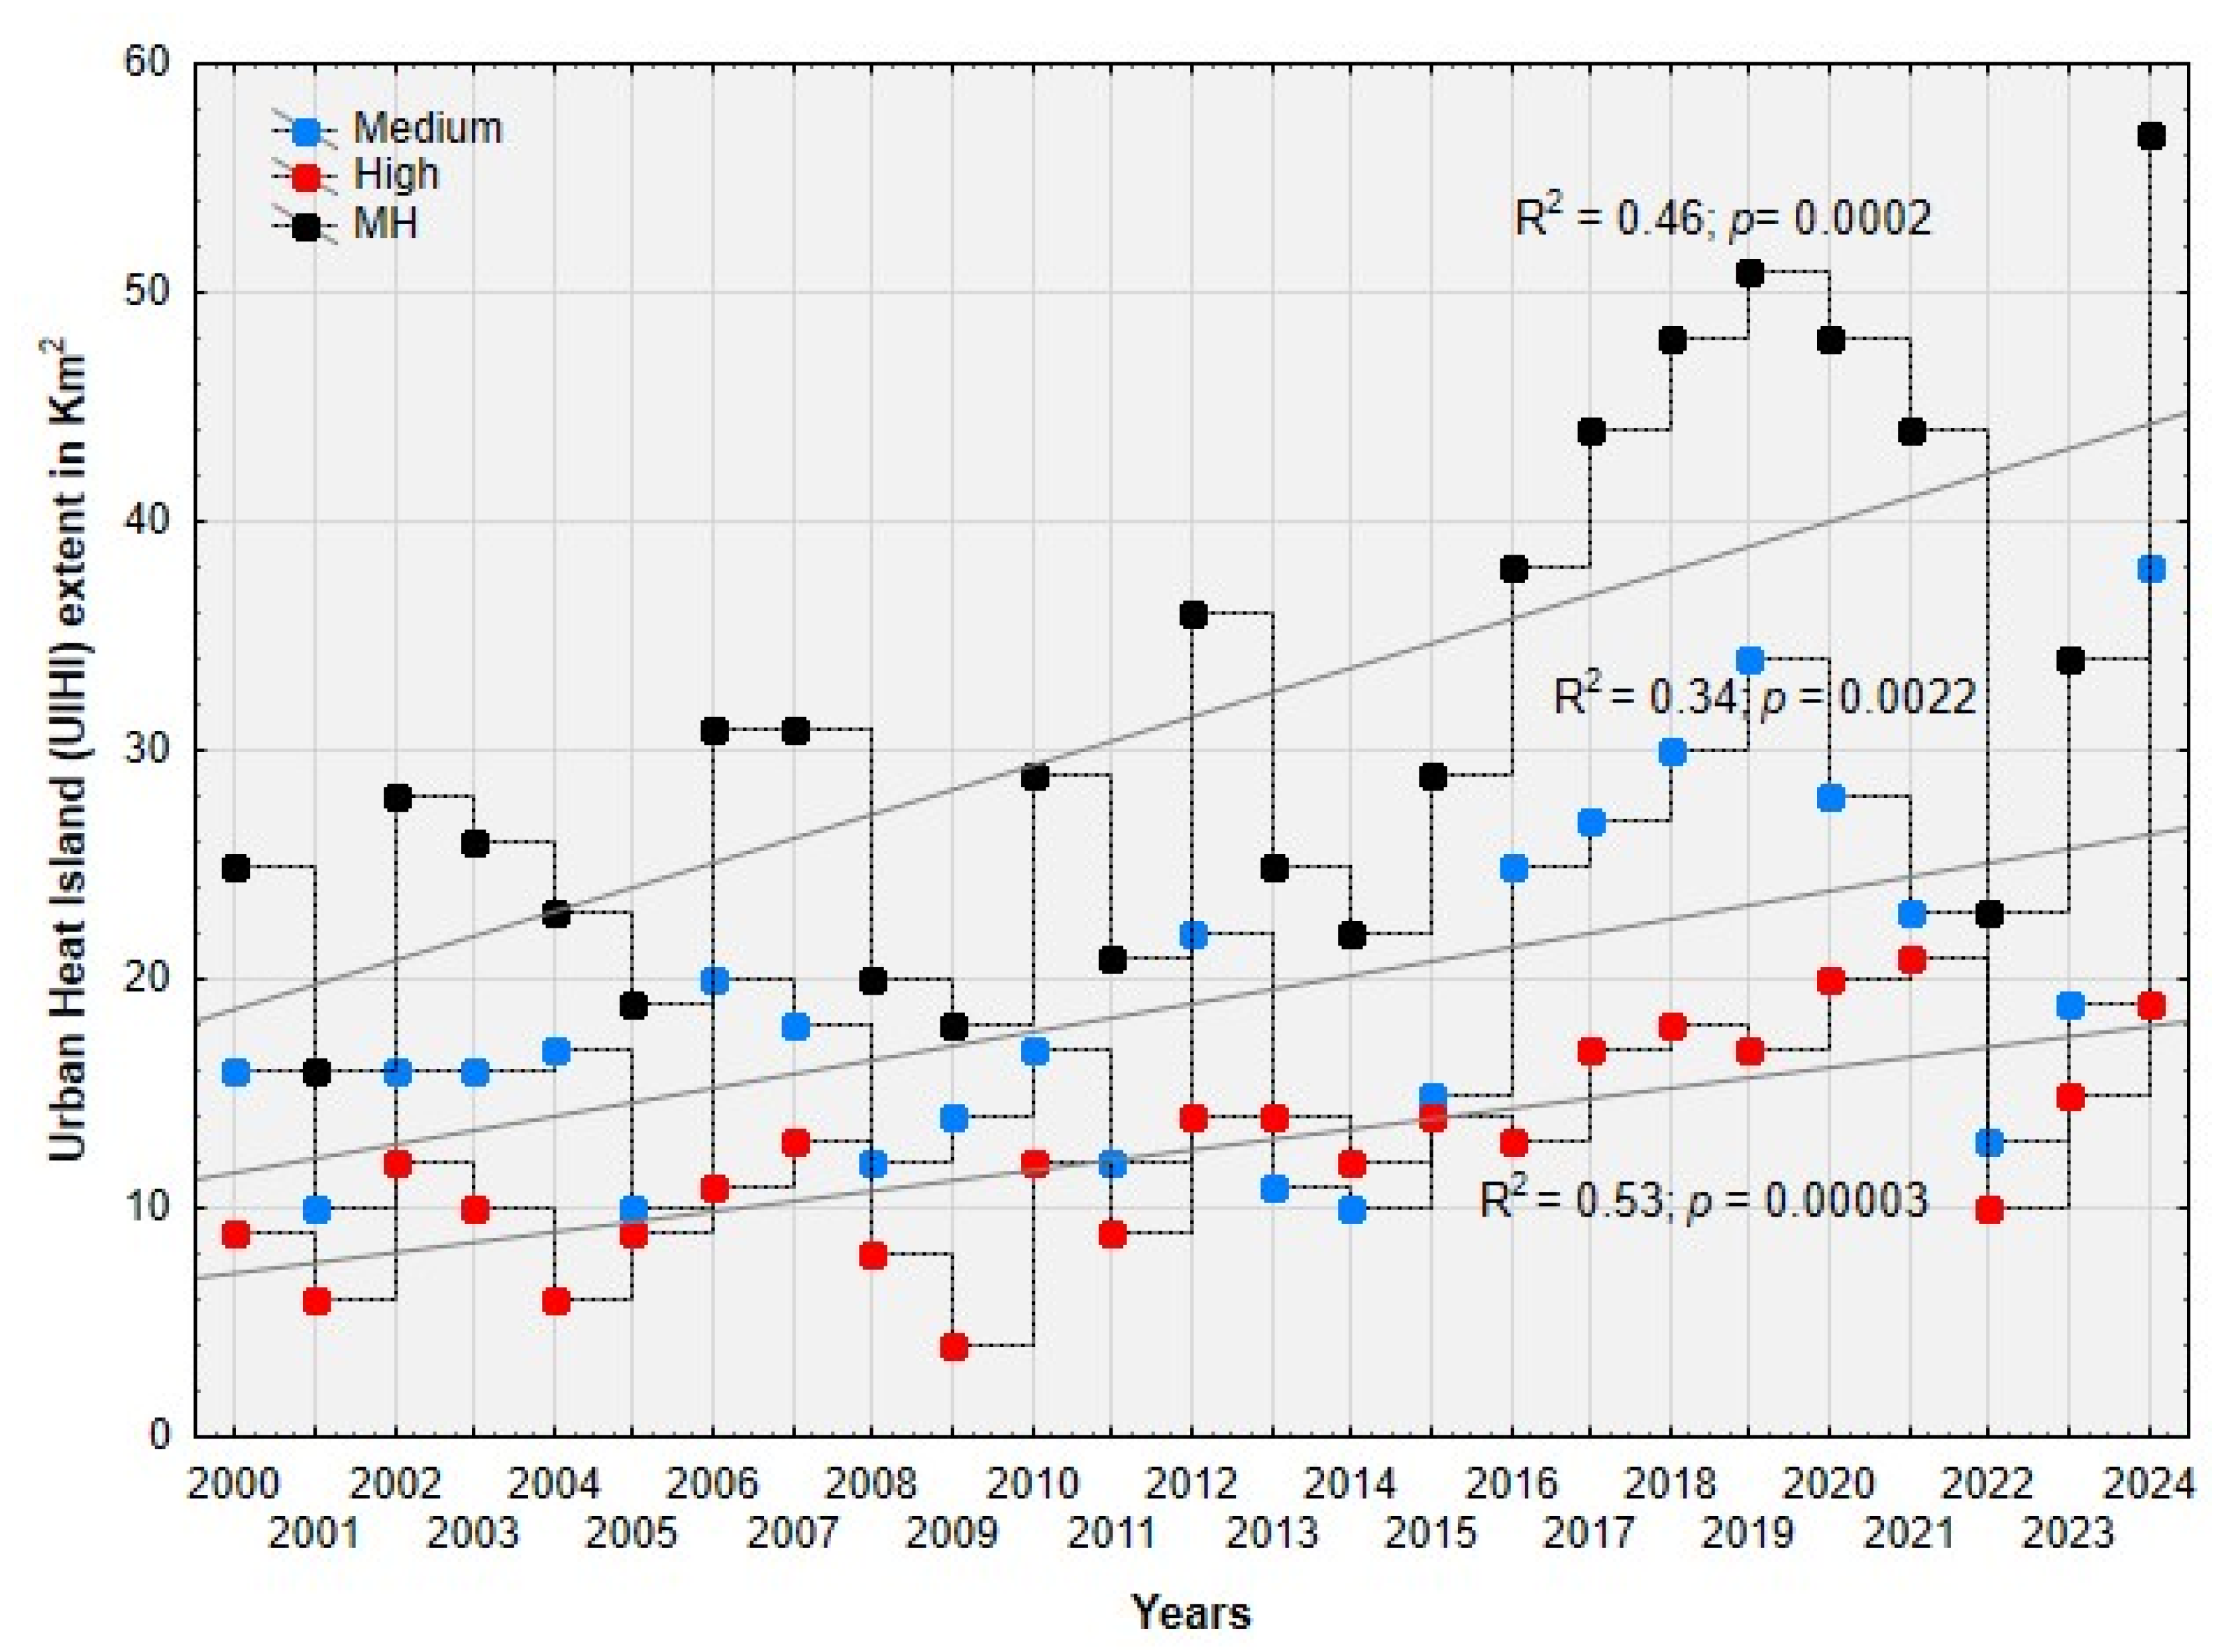
The spatial pattern of Urban Heat Islands (UHI) exhibits significant temporal variation. From 2000 to 2009, the landscape of Kisangani was predominantly dominated by areas with UHI values at or below 0°C, with the lowest UHI values consistently observed along river corridors. In contrast, between 2010 and 2024, areas with UHI values exceeding 0°C expanded considerably, and significant annual UHI values, exceeding 0.1 and 0.2°C, were consistently observed in the city center (
Figure 4). Furthermore, the spatial extent of medium UHI gradually expanded from 16 km² to 38 km², while high UHI increased from 9 km² to 19 km². Consequently, the total extent of UHIs greater than 0.1°C reached more than 50 km
2 in 2024 (
Figure 5).
3.2. Variation in LST and UHI Across the Urban-Rural Gradient in 2024
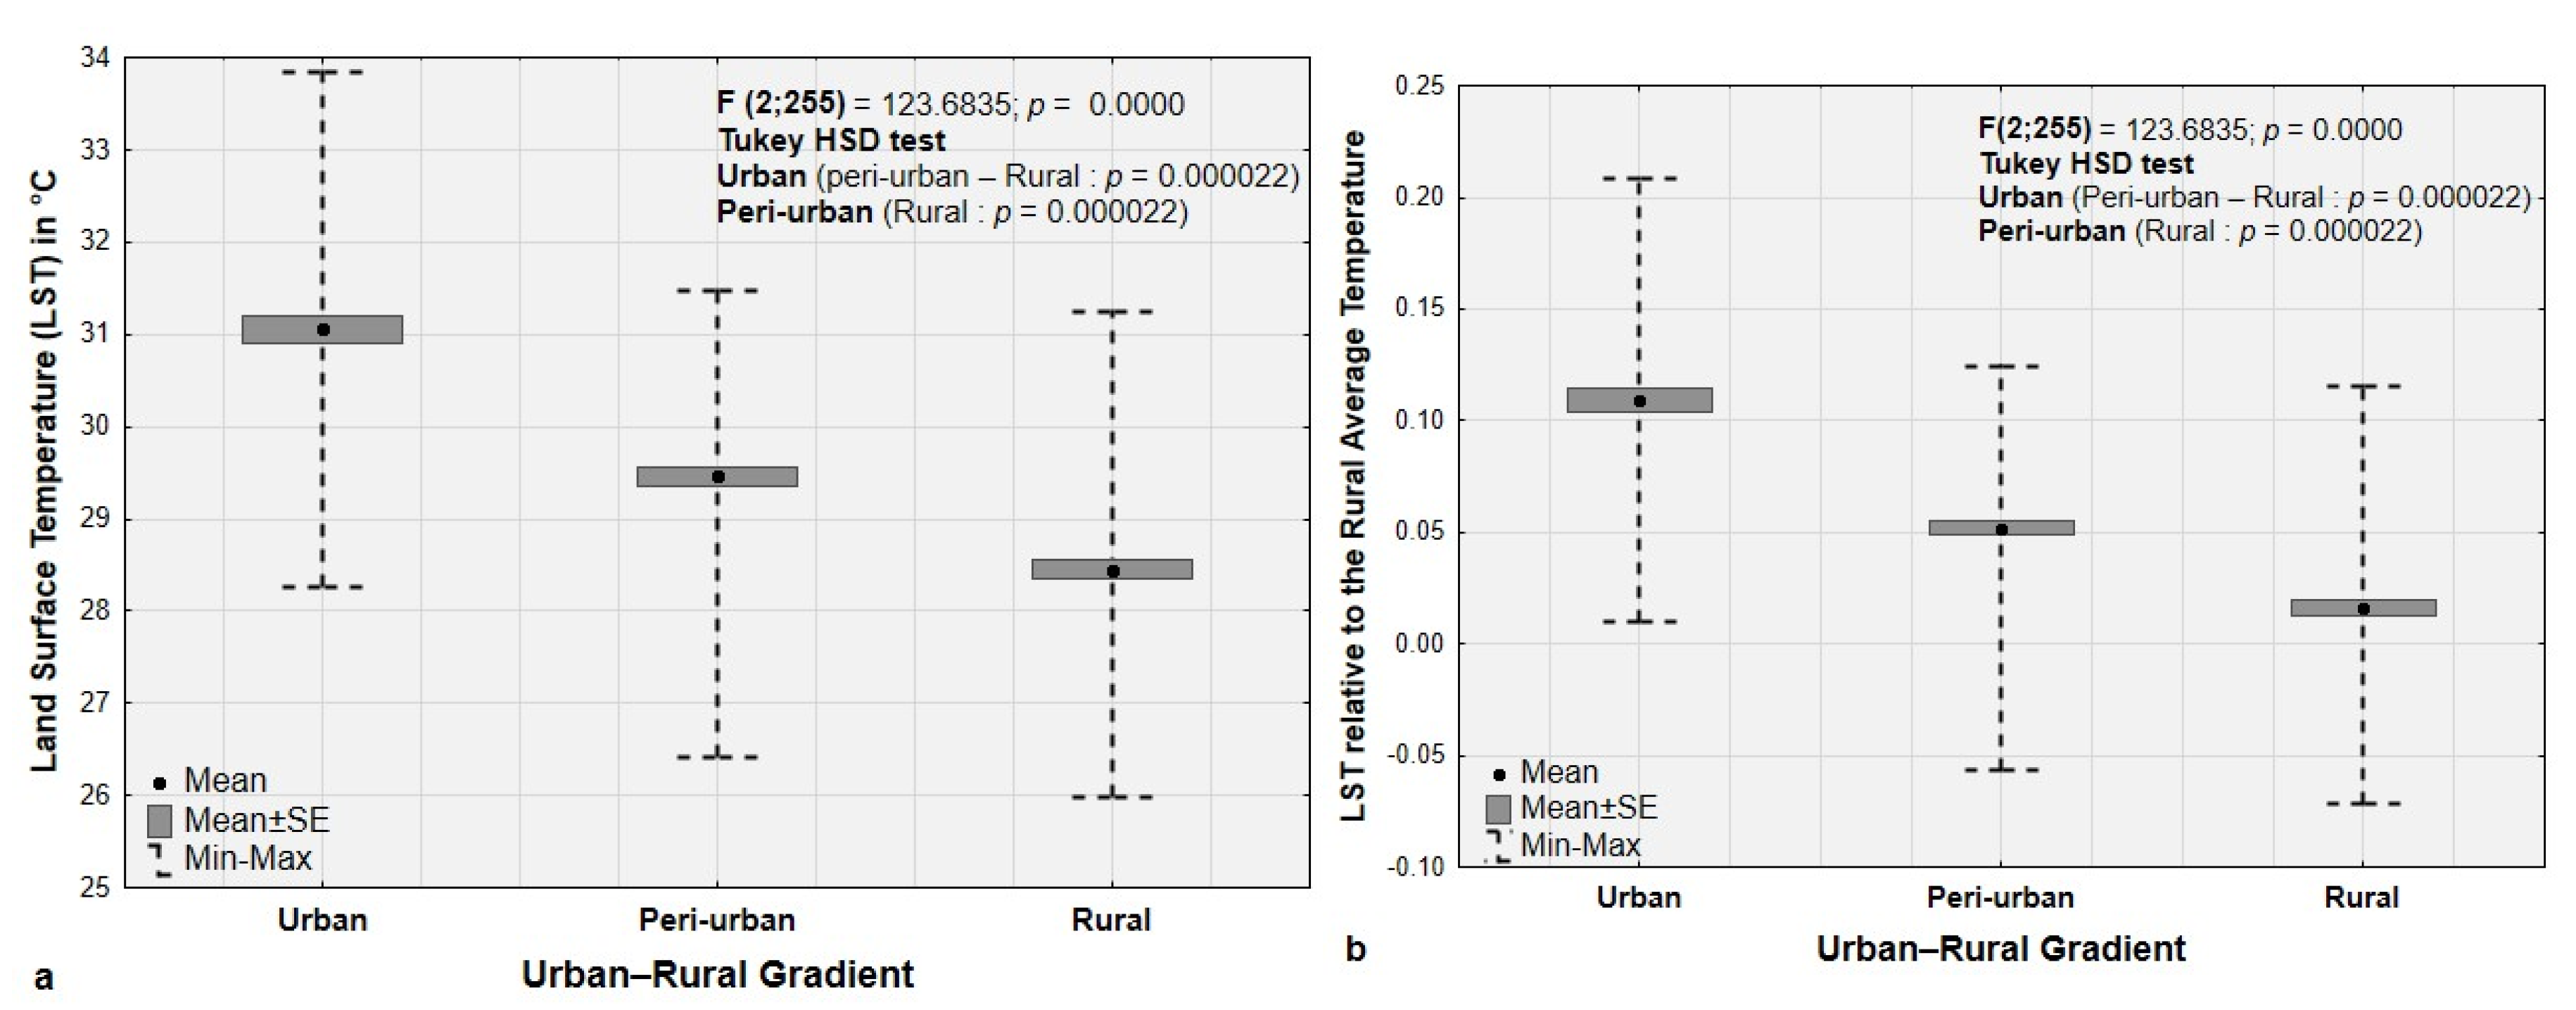
Within the Urban-Rural Gradient, significant variations in both Land Surface Temperature (LST) and Urban Heat Island effect (UHI) are observed in 2024, with urban zones exhibiting substantially higher averages than peri-urban and rural zones (
Figure 6). LST and UHI variations in peri-urban areas also differ significantly from those observed in rural areas. Furthermore, areas with maximum LST around 34°C and maximum UHI values of more than 0.2°C are observed in urban zones, while peri-urban and rural zones reach maximum LST of 31°C and maximum UHI values of slightly more than 0.1°C.
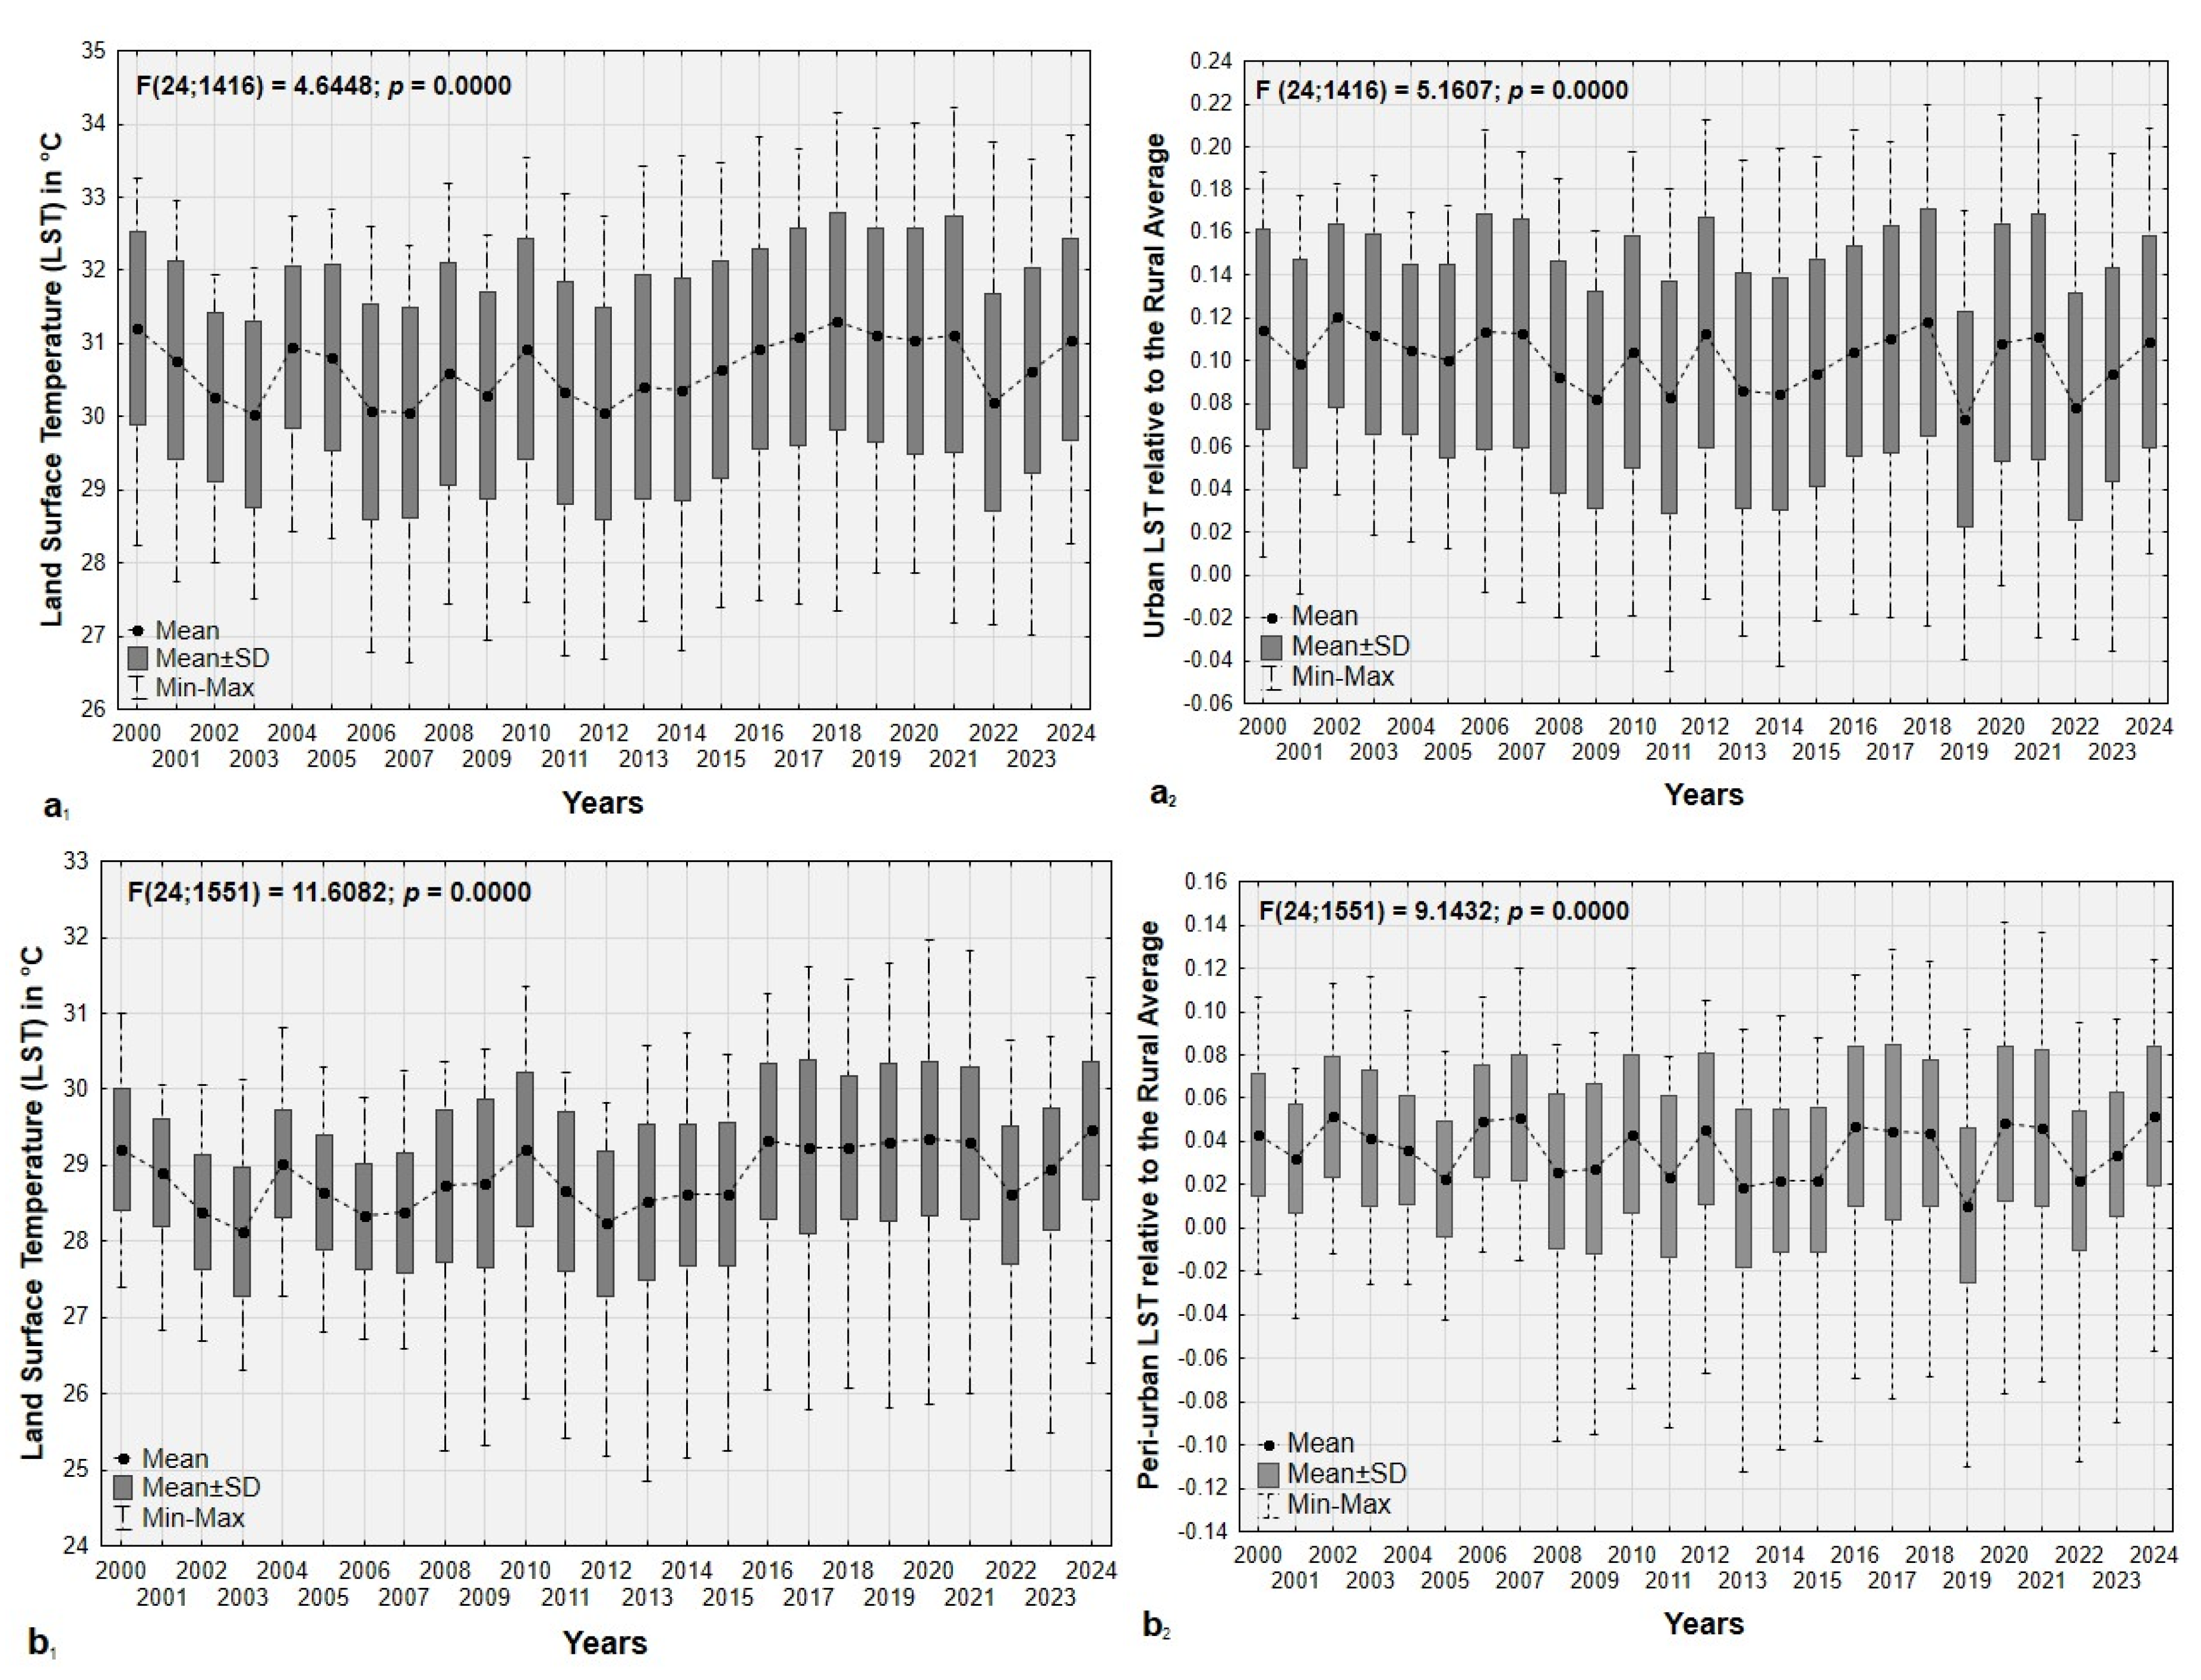
3.3. Historical Variations in LST and UHI Across the Urban-Rural Gradient
Statistical analysis (
Figure 7) revealed significant historical trends in annual land surface temperature (LST) and urban heat island (UHI) variations within each urbanization gradient zone from 2000 to 2024 (p < 0.05). Tuke
y’s post hoc tests identified specific years with significant differences within each gradient, indicating notable temporal shifts. In urban areas, notable differences in LST were observed between earlier years (e.g., 2000, 2003, and 2006) and more recent years, such as 2018, 2019, and 2021. For instance, 2000 significantly differs from 2012, and 2003 differs from 2018, 2019, and 2021. Additionally, 2012 shows significant variations compared to a broader range of years, including 2017, 2018, 2019, 2020, and 2024. UHI variations similarly highlight significant differences between earlier years (e.g., 2000, 2002, and 2003) and recent periods, such as 2019 and 2022, with 2022 also differing significantly from 2024.
In peri-urban zones, significant differences in LST (Land Surface Temperature) were observed across multiple time intervals. The early years, such as 2000 and 2001, showed significant differences with later years, including 2002, 2003, 2006, 2007, 2012, 2013, and 2022. For example, 2002 differed significantly from 2010, 2016–2020, and 2024, while 2003 differed from both earlier years, like 2004 and later years such as 2016–2020, 2023, and 2024. Similarly, more recent years, such as 2012-2015, showed significant variations compared to 2016-2024, and 2022 differed significantly from 2024. There were also significant temporal differences in the urban heat island (UHI) variations. The early years, such as 2000 and 2002, showed notable differences with years like 2013–2019 and 2022. For example, 2002 differed significantly from a range of years spanning 2005–2022. Later years, such as 2013–2015, exhibited significant differences from 2016–2024, while 2016–2018 differed from 2019 and 2022. Notable contrasts also emerged between more recent years: for instance, 2022 differed significantly from 2024.
Rural areas showed the widest range of differences in LST and UHI variations. LST differences spanned several pairs of years, such as 2000 vs. 2002, 2006 and 2022, and 2006 vs. 2008, 2017, and 2024. More recent years, such as 2016-2020, were consistently different from earlier periods (e.g., 2012-2015) and from later years, such as 2022 and 2024. For example, LST in 2016 differed significantly from 2022, while 2023 differed from 2024. Similarly, UHI variations in rural areas revealed significant differences between earlier years (e.g., 2000 and 2002) and later periods, such as 2019, 2022, and 2023. For instance, UHI in 2006 and 2007 showed significant differences from multiple years, including 2008, 2016, and 2024. Additionally, 2022 and 2023 exhibited consistent contrasts with 2024, indicating persistent changes in rural thermal environments.
Furthermore, as expected, the results of the annual comparison of the urban heat island (UHI) effect from 2000 to 2024 across Kisangani’s urbanization gradients reveal significant differences. Annual UHI variations in urban zones consistently differed from those in peri-urban and rural zones (p <0.05). Moreover, UHI variations in peri-urban zones were significantly distinct from those observed in rural zones throughout the study period. These findings highlight clear and consistent disparities in UHI dynamics across the urban, peri-urban, and rural gradients.
3.4. Building Volume Density (BVD) and Vegetation Effects
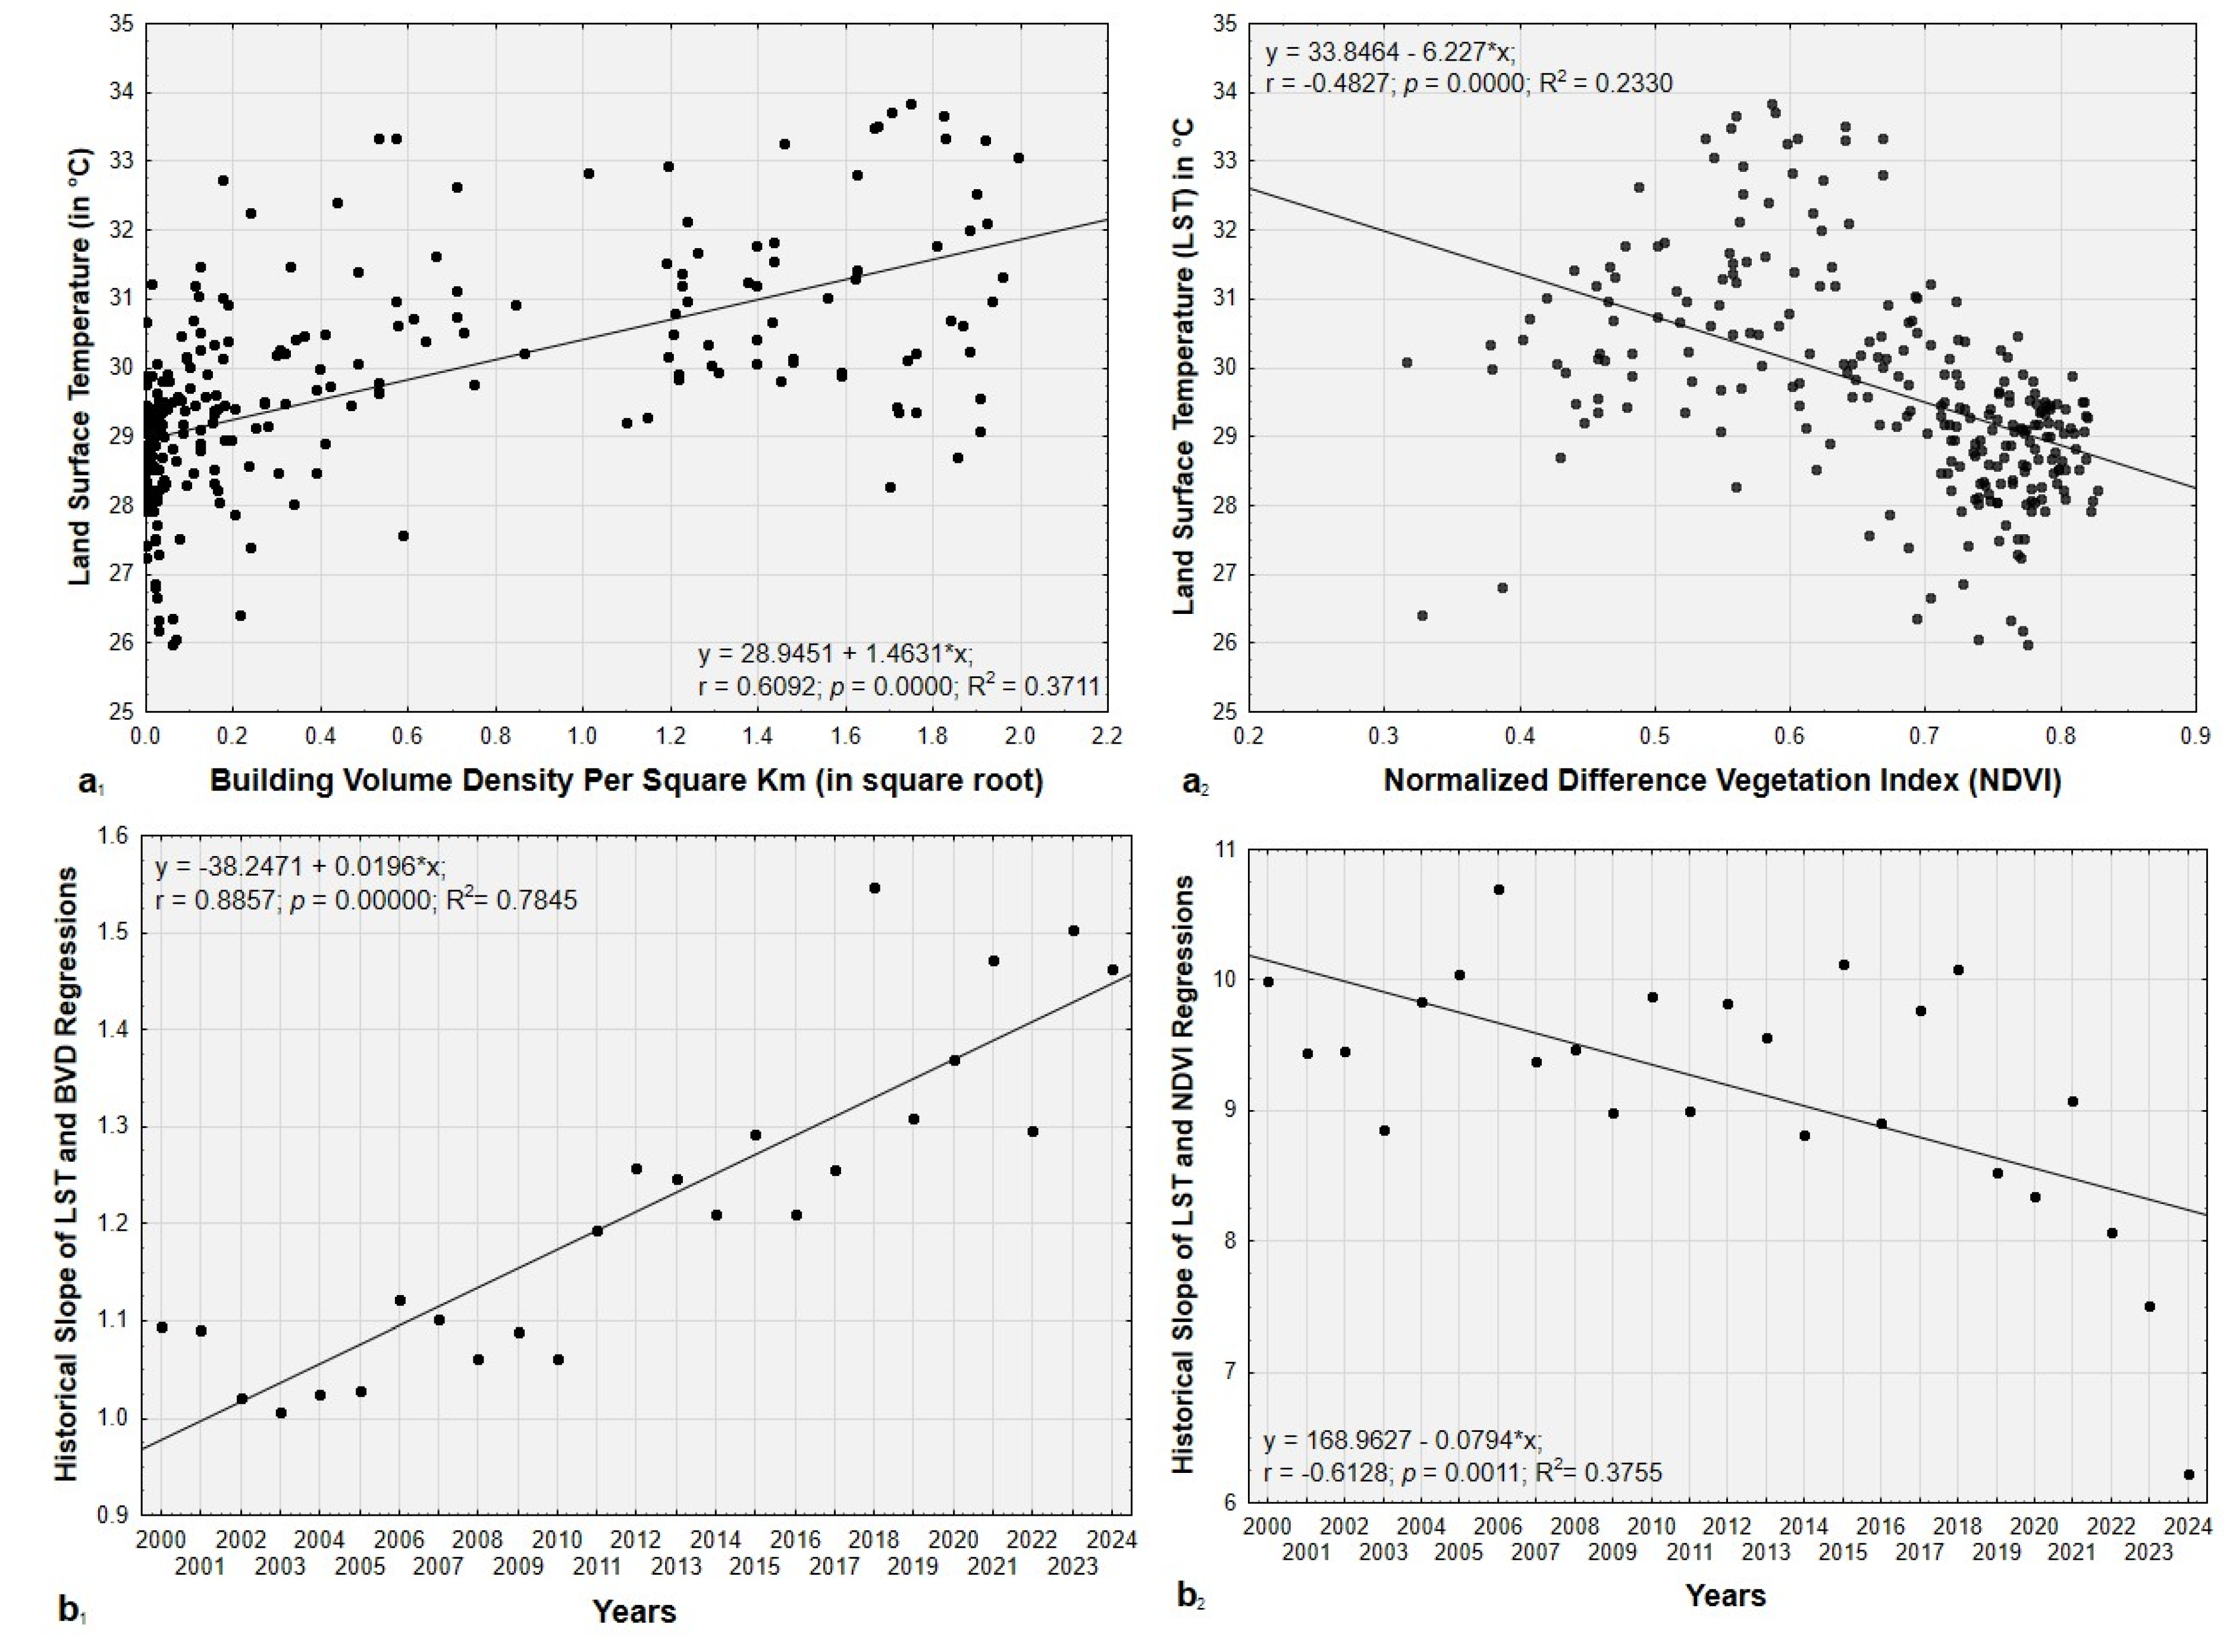
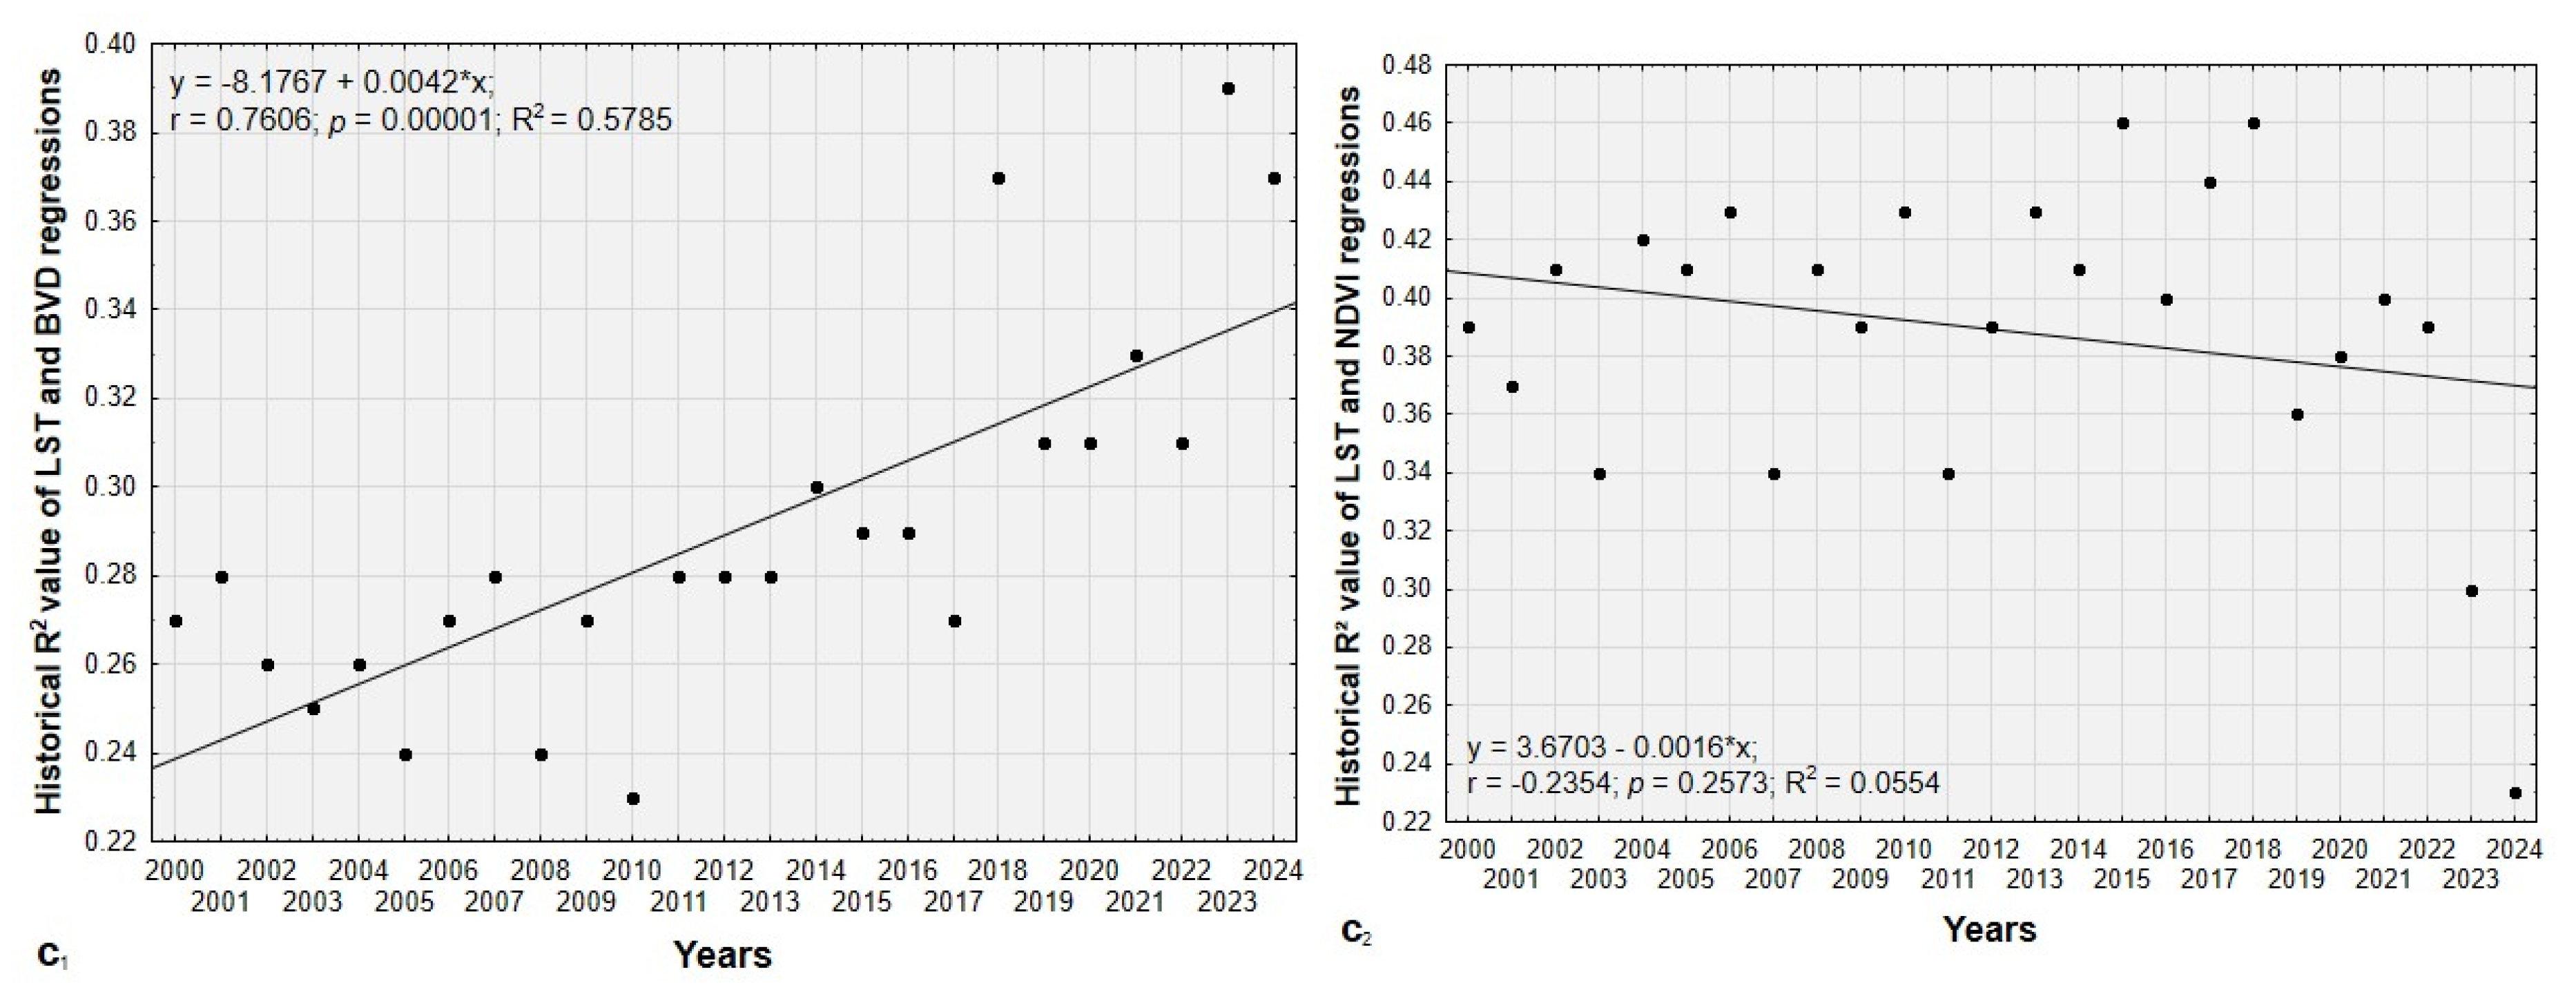
As expected, land surface temperature (LST) variations are significantly correlated with the Building Volume Density (BVD) and vegetation density, expressed by the Normalized Difference Vegetation Index (NDVI) (
Figure 8a). Moreover, the influence of Building Volume Density (BVD) as a predictor of Land Surface Temperature (LST) increases over time. This trend, evidenced by progressively higher slopes and coefficients of determination values (
Figure 8b
1c
1), highlights the growing role of urban development in shaping thermal patterns. Conversely, the influence of vegetation density as a predictor of Land Surface Temperature (LST), as expected, is gradually decreasing over time. This trend, reflected in progressively lower slope values and coefficients of determination in the regression analyses (
Figure 8b
2c
2), reveals a weakening relationship between vegetation and temperature regulation.
4. Discussion
4.1. Data and Spatial Analysis of the Urban Heat Island
The spatial and temporal pattern analyses of the Urban Heat Island (UHI) were performed using MOD11A2 V6.1. Each pixel in MOD11A2 represents the mean value derived from all corresponding MOD11A1 LST pixels recorded over the 8-day interval [
25]. This approach reduces the effects of punctual anomalies, such as clouds or sensor errors, by averaging data. It is, therefore, more reliable than products based on a single daily or instantaneous observation. In addition, MODIS LST data (including MOD11A2) have been extensively validated through comparisons with in situ measurements, which have consistently shown high accuracy under clear and stable atmospheric conditions [
36,
37]. With its 1km spatial resolution, MOD11A2 is also well suited for medium-scale studies such as urban-rural gradient analysis. In some cases, GHSL building volume data based on interpolation may have large spatial errors. However, the lack of significant difference (p-value < 0.05) between GHSL building volume data and building volume estimates derived from OpenStreetMap building footprints combined with building heights from the ALOS World 3D - 30m Digital Surface Model and the SRTM Digital Terrain Model supports the credibility of analyses based on GHSL data for Kisangani city.
The urban heat island (UHI) spatial analysis was carried out within the urban-rural gradient of Kisangani city, using sampling areas randomly selected across various locations representing all cardinal and intercardinal directions within each gradient zone. Compared to an approach based on transects [
30] or a method based on concentric zones [
15], this approach enhances the data collected and accounts for the substantial spatial variation that can arise perpendicular to a traditional transect. By incorporating variations over short distances, this method mitigates potential oversights that could be introduced by a concentric zone methodology [
19].
4.2. Spatio-Temporal Patterns of Urban Heat Island
In this study, we observed significant temporal variations in the spatial patterns of urban heat islands between 2000 and 2024. During this period, the extent of medium UHI (0.1<UHI<0.2) gradually expanded from 16 km² to 38 km², while high UHI (0.2<UHI≤0.3) increased from 9 km² to 19 km². Furthermore, the UHI intensity gradually increased between 2000 and 2024, reaching maximum values of more than 0.21°C in the last four years (2020, 2021, 2023, and 2024), compared to maximum values of 0.17°C and 0.18°C observed in 2001, 2004, and 2005.
However, despite observing maximum values exceeding 0.21°C and significant differences across urban, peri-urban, and rural areas, the findings of this study indicate that the average UHI values in the urban zones of Kisangani remain below 0.2°C. Consequently, on average, the urban areas of Kisangani exhibit moderate disparities in land surface temperature when compared to rural areas. Various factors associated with urban development, land use, land cover, land cover change, and socio-economic transformation may elucidate the coexistence of maximum UHI values exceeding 0.21°C in certain regions while maintaining an overall average below 0.2°C, which is relatively low compared to other urban centers.
Indeed, in general, rural landscapes are characterized by vegetation, while urban areas consist mainly of impervious surfaces such as concrete, pavements, rooftops, and compacted ground [
18,
19,
20,
21,
22,
23,
24,
25,
26,
27,
28,
29,
30,
31,
32,
33,
34,
35,
36,
37,
38]. This land cover conversion significantly impacts the local microclimate and thermal environment in urban areas, resulting in a relatively high heat absorption capacity and poor ventilation [
38,
39]. In Kisangani city, rapid population growth from 2000 to 2021 [
40] has led to an increasing expansion of urban and peri-urban areas and a significant reduction in natural areas [
18,
19]. This spatial transformation may have altered the thermal properties, as artificial materials such as concrete and asphalt absorb and retain more solar radiation than natural surfaces. This phenomenon is one of the main factors behind the heat island effect [
41,
42,
43]. As a result, expanding these increasingly artificial areas would have contributed to the gradual increase of UHI intensity in some urban areas between 2000 and 2024, reaching maximum values of more than 0.21°C. In addition, this would have contributed to the expansion of the medium and high UHI in terms of area. These results are consistent with those observed in other cities. In Uganda, Li et al.[
16], revealed that from 1995 to 2017, Kampala experienced substantial changes in its urban infrastructure. The urban land area grew from 12,133 hectares in 1995 to 25,389 hectares in 2016. Consequently, the extent of the UHI increased significantly, rising from 22,910 hectares in 2003 to 27,900 hectares in 2016. This effect of urban expansion on microclimate was also observed in Accra, Ghana. In fact, Wemegah et al.[
17], found that LST was significantly higher in urbanized and bare soil areas compared to areas with vegetation and water bodies. This reducing effect of water bodies on UHI intensity, as observed in Accra [
17], would explain the low mean UHI values (<0.2) in the urbanization gradient zones of Kisangani city when compared to other cities, such as Seoul, in South Korea, where the mean UHI is largely above over 0.2 [
44]. Indeed, the city of Kisangani is surrounded by the Congo River to the south and the Tshopo and Lindi Rivers to the north and northwest, respectively. Therefore, the urban zones of Kisangani tend to have a more moderate UHI average because water has a high specific heat capacity and an evaporative cooling potential [
45].
Although land artificialization is less pronounced in peri-urban zones compared to urban zones, the findings of this study highlight its influence on the urban heat island (UHI) effect relative to rural areas. Indeed, in peri-urban zones, the progressive conversion of natural landscapes into semi-artificial areas such as intensive agricultural fields and informal settlements reduces the connectivity of vegetative cover, thereby weakening its ability to moderate local temperatures through evaporation and transpiration, as well as passively providing shade [
46]. Moreover, peri-urban zones are also influenced by the thermal effects of adjacent urban centers. The UHI effect generated within the city can extend to these peripheral areas through heat transfer driven by mixed convection, a phenomenon that is exacerbated by local atmospheric currents that transport warm air from the urban core to the surrounding zones [
47,
48].
It is crucial to emphasize that variations in LST within urban, peri-urban, and rural environments directly influence fluctuations in the Urban Heat Island (UHI), given that UHI is fundamentally dependent on LST. This explains the same level of significance as that observed in
Figure 6. Therefore, strategies to mitigate high LST values should also be instrumental in narrowing the temperature disparities observed between urban, peri-urban, and rural areas.
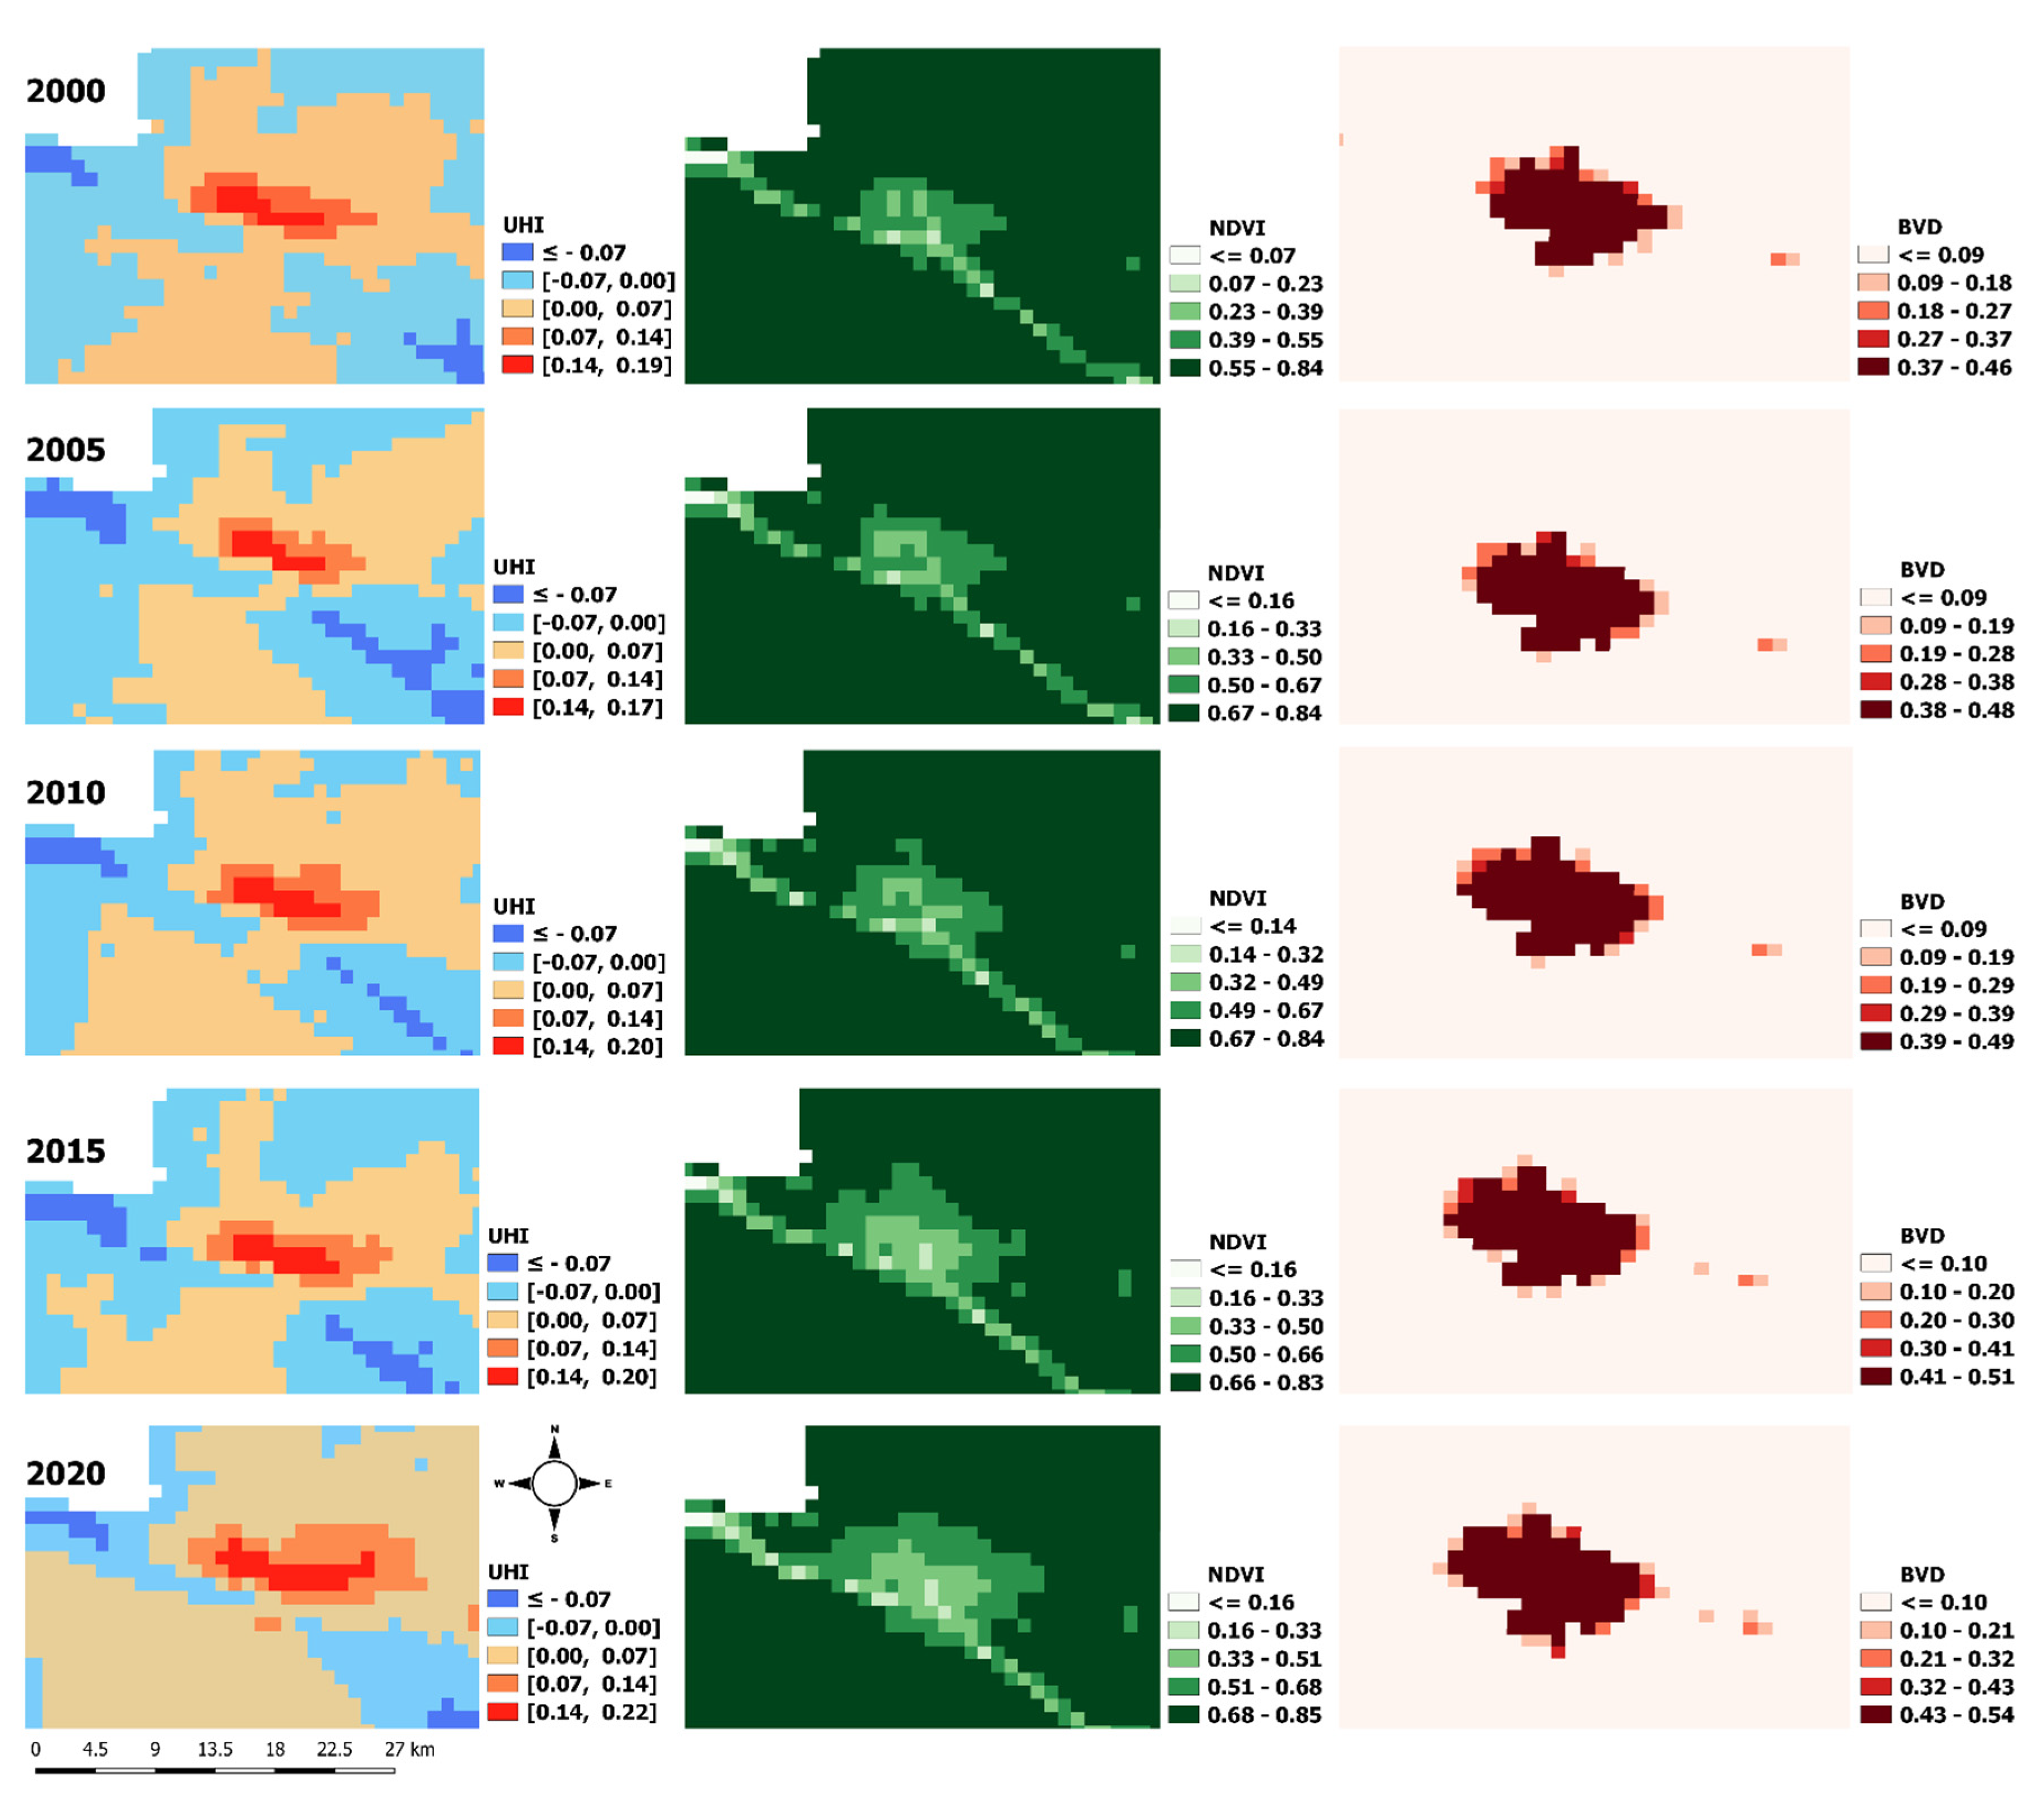
4.3. Impact of Building Architecture on the LST
This study has shown that the influence of building volume density (BVD) on the LST increases over time in Kisangani. This trend is evidenced by progressively higher slopes and coefficients of determination. This increasing correlation suggests that as urban areas expand, with changes in urban architecture involving building geometry, particularly construction patterns with tall buildings situated closely together, as illustrated in
Figure 9 for a typical area (the urban center), the capacity of these densely built environments to retain and emit heat intensifies. Combined with the degradation of vegetation, reflected in increasingly reliable NDVI values in the urban center (
Figure 8), this architectural model contributes to the phenomenon referred to as the “urban canyon”[
5,
6]. In fact, since the end of the armed conflict (1990 – 2000) [
49], Kisangani has experienced continuous spatial growth [
18], largely driven by economic operators who exploit the interstitial spaces by constructing large commercial complexes and high-rise hotels. This installation of buildings accentuates their spatial footprint and, thus, the canyon effect.
This urban canyon effect influences various local conditions, including wind patterns, light availability, air quality, and temperature, thereby significantly exacerbating the intensification of urban heat islands [
7]. In Kisangani, this could affect urban residents in various ways, shaping their comfort, air and water quality, access to ecological services, opportunities for recreation, and overall living conditions [
9,
10].
4.3. Effective and Resilient Mitigation Strategies of UHI
It should be noted that urbanization, if properly managed, does not always lead to environmental degradation [
16]. However, mitigating the UHI effect in Kisangani would require strategies tailored to its specific socioeconomic, environmental, and climatic context. These effective and resilient solutions should integrate green infrastructure, urban planning, and community engagement. Indeed, expanding green spaces such as parks, urban forests, roadside vegetation, and green corridors connecting urban, peri-urban, and rural landscapes should lower surface and air temperatures through shading and evapotranspiration [
44,
45,
46,
47,
48,
49,
50]. For Kisangani, leveraging its proximity to the Congo rainforest provides an opportunity to integrate indigenous plant species into urban landscapes. Previous studies have shown that in cities with a UHI effect, such as Hong Kong or Lisbon, the cooling effect of urban green spaces is more accentuated on hot and dry days [
51,
52]. In drier environments, rising temperatures and higher transpiration rates amplify the vegetation’s humidifying effects [
44,
45]. Furthermore, protecting and restoring peri-urban vegetation can enhance temperature regulation while mitigating urban sprawl. In addition, encouraging the use of green roofs and vertical gardens can help reduce rooftop temperatures, provide insulation, and improve urban aesthetics. On the other hand, Malley et al. [
14] highlighted that building design, including form, orientation, and layout, plays a crucial role in mitigating the urban heat island effect. Additionally, incorporating high-albedo (reflective) materials for structures and roadways can significantly decrease heat absorption.
Finally, to effectively address the impacts of urban heat islands (UHIs), it is imperative to strengthen land-use planning and management policies, particularly in urban and peri-urban areas. These policies should establish explicit guidelines to control urban sprawl and thus limit unplanned development in the city of Kisangani. To achieve this, it is essential to identify and prioritize critical areas for the conservation of green spaces and ecological corridors, thereby ensuring ecological connectivity and minimizing landscape artificialization. Furthermore, the active engagement of local communities in land-use decision-making processes in peri-urban and rural regions is necessary to address socio-economic needs while also safeguarding environmental integrity. In addition, scientists should prioritize interdisciplinary approaches that integrate urban planning, climatology, ecology, and socio-economic studies. To maximize the impact of research, findings should be effectively communicated through scientific publications, policy briefs, and community engagement initiatives. Local communities should be made aware of the importance of green infrastructure and sustainable practices in reducing the UHI effect. Simplifying complex scientific concepts into accessible formats will encourage broader participation and support for mitigation efforts. Research institutions must ensure that their findings translate into actionable policies. This involves actively engaging with policymakers to integrate scientific evidence into urban planning and environmental conservation strategies. Furthermore, scenario analyses that simulate the long-term benefits of sustainable land-use practices can help demonstrate the value of these policies, fostering greater political will for implementation. To this end, capacity building is essential for sustaining research and mitigation efforts. Training programs should be designed to equip local researchers, urban planners, and practitioners, while partnerships with international institutions can provide access to funding, expertise, and technological resources.
5. Conclusions
This paper analyzes MOD11A2 V6.1 data to map Urban Heat Islands (UHIs) in the city of Kisangani from 2000 to 2024. The findings reveal a significant temporal shift in the spatial pattern of UHI, with an increase in areas exhibiting UHI values above 0°C over the study period. Specifically, areas of moderate UHI (0.1°C<UHI<0.2°C) increased from 16 km² to 38 km², while areas of high UHI (0.2°C<UHI≤0.3°C) increased from 9 km² to 19 km². Furthermore, although maximum UHI values exceeding 0.21°C were observed in urban zones and significant differences in UHI variations are noted across urban, peri-urban, and rural zones, the findings indicate that the average UHI in Kisangani’s urban zones remains below 0.2°C. Therefore, based on the average UHI variations, the urban zones of Kisangani exhibit moderate disparities in LST compared to rural areas.
Moreover, regression analyses show that variations in Land Surface Temperature (LST) are significantly correlated with Building Volume Density (BVD) and vegetation density, measured by the Normalized Difference Vegetation Index (NDVI). In addition, the influence of BVD on LST variation has increased over time, as indicated by increasing slopes and coefficients of determination. This trend suggests that urban expansion and architectural changes, particularly the construction of large, closely spaced buildings, enhance the heat retention and emission capacity of these dense environments.
These findings highlight the importance of integrated development policies to effectively manage the interface that exists between urbanization, changes in landscape patterns, and the supply of ecosystem services. As urban and peri-urban areas expand, vegetation faces loss and fragmentation, weakening its ability to regulate the urban heat island (UHI) effect, especially in regions with UHI values equal to or exceeding 0.21°C, categorized as high-temperature zones.
However, the UHI mitigating strategies tailored to the specific socio-economic, environmental, and climatic context of Kisangani are increasingly essential. These effective and resilient solutions should integrate green infrastructure, urban planning, and community engagement. Indeed, expanding green spaces, including parks, urban forests, roadside vegetation, and green corridors linking urban, peri-urban, and rural areas, should lower surface and air temperatures through shading and evapotranspiration. This holistic strategy offers a way to balance urban expansion and economic progress while preserving ecosystem services across the urban-rural gradient.
Author Contributions
J.B.B., T.M.S., J.P.P.M.T.H., K.R.S., Y.U.S., J.-F.B. and J.B. conceptualization, methodology, formal analysis. J.B.B. data collection and analysis. J.B.B. wrote the first draft of the article. J.B.B.,T.M.S., P.T.W., J.E.M., J.M.T., B.A.M were responsible for proofreading the text. J.B.: validation and supervision.
Funding
This research was supported by the ERAIFT-AGRINATURA consortium, funded through the Development Cooperation Instrument (DCI) No. 41928 of the European Union. The authors express their gratitude to the European Union and the ERAIFT-AGRINATURA consortium for their financial support.
Data Availability Statement
Data can be made available by contacting the authors.
Conflicts of Interest
The authors declare no conflicts of interest.
References
- Jato-espino, D. Spatiotemporal Statistical Analysis of the Urban Heat Island e Ff Ect in a Mediterranean Region. Sustain. Cities Soc., 2019, 46, 101427. [Google Scholar] [CrossRef]
- Dwivedi, A.; Khire, M. V. Application of Split- Window Algorithm to Study Urban Heat Island e Ff Ect in Mumbai through Land Surface Temperature Approach. Sustain. Cities Soc., 2018, 41, 865–877. [Google Scholar] [CrossRef]
- Kolokotroni, M.; Giannitsaris, I.; Watkins, R. The Effect of the London Urban Heat Island on Building Summer Cooling Demand and Night Ventilation Strategies. 2006, 80, 383–392. [CrossRef]
- Liu, K.; Su, H.; Zhang, L.; Yang, H.; Zhang, R.; Li, X. Analysis of the Urban Heat Island Effect in Shijiazhuang, China Using Satellite and Airborne Data. 2015, 4804–4833. [CrossRef]
- Arnfield, A. J. Two Decades of Urban Climate Research : A Review of Turbulence, Exchanges of Energy and Water, and the Urban Heat Island. 2003, 26, 1–26. [CrossRef]
- Oke, T. R. Boundary Layer Climates - 2nd Ed.; 2002.
- Stewart, I. D.; Oke, T. R. Local Climate Zones for Urban Temperature Studies. Am. Meteorol. Soc. 2012. [Google Scholar] [CrossRef]
- Taha, H. Urban Climates and Heat Islands : Albedo, Evapotranspiration, and Anthropogenic Heat. 1997, 25 (96), 99–103.
- Candra, A.; Lecturer, K.; Nitivattananon, V. Factors Influencing Urban Heat Island in Surabaya, Indonesia. Sustain. Cities Soc., 2016, 27, 99–105. [Google Scholar] [CrossRef]
- Prilandita, N. Perceptions and Responses to Warming in an Urban Environment: A Case Study of Bandung City, Indonesia. 2009, V (1), 51–58.
- Martínez, F.; Fernando, N.; Aragonés, N.; Benítez, P.; Buitrago, M. J.; Casas, I.; Cortés, M.; Dürr, U.; Herrera, D.; Izquierdo, A.; et al. Assessment of the Impact of the Summer 2003 Heat Wave on Mortality. 2004, 18 (Supl 1), 250–258.
- Garcia-Herrera, R.; Díaz, J.; Trigo, R. M.; Luterbacher, J.; Fischer, E. M. A Review of the European Summer Heat Wave of 2003 A Review of the European Summer Heat Wave of 2003. 2010, 3389. [CrossRef]
- Zhang, H.; Qi, Z.; Ye, X.; Cai, Y.; Ma, W.; Chen, M. Analysis of Land Use / Land Cover Change, Population Shift, and Their Effects on Spatiotemporal Patterns of Urban Heat Islands in Metropolitan Shanghai, China. Appl. Geogr., 2013, 44, 121–133. [Google Scholar] [CrossRef]
- Malley, C. O.; Piroozfarb, P. A. E.; Farr, E. R. P.; Gates, J. An Investigation into Minimizing Urban Heat Island (UHI) Effects: A UK Perspective. Energy Procedia, 2014, 62, 72–80. [Google Scholar] [CrossRef]
- Mandal, J.; Pravin, P.; Samanta, S. Examining the Expansion of Urban Heat Island Effect in the Kolkata Metropolitan Area and Its Vicinity Using Multi-Temporal MODIS Satellite Data. Adv. Sp. Res., 2022, 69, 1960–1977. [Google Scholar] [CrossRef]
- Li, X.; Stringer, L. C.; Chapman, S.; Id, M. D. How Urbanisation Alters the Intensity of the Urban Heat Island in a Tropical African City. 2021, 1–18. [CrossRef]
- Wemegah, C. S.; Yamba, E. I.; Aryee, J. N. A.; Sam, F.; Amekudzi, L. K. Assessment of Urban Heat Island Warming in the Greater Accra Region. Sci. African, 2020, 8, e00426. [Google Scholar] [CrossRef]
- Balandi, J. B.; Meniko, J.-P. P. T. H.; Sambieni, K. R.; Sikuzani, Y. U.; Bastin, J.-F.; Musavandalo, C. M.; Elangi Langi, J. M.; Selemani, T. M.; Mweru, J. M.; Bogaert, J. Urban Sprawl and Changes in Landscape Patterns: The Case of Kisangani City and Its Periphery (DR Congo). 2023, 1–14. [CrossRef]
- Balandi, J. B.; Meniko, J.-P. P. T. H.; Sambieni, K. R.; Sikuzani, Y. U.; Bastin, J.-F.; Musavandalo, C. M.; Nguba, T. B.; Jesuka, R.; Sodalo, C.; Pika, L. M.; Bogaert, J. Anthropogenic Effects on Green Infrastructure Spatial Patterns in Kisangani City and Its Urban – Rural Gradient. 2024. [CrossRef]
- UN-Habitat. Habitat III RD Congo: Rapport Final. 2015, 1–93.
- Sabongo, P. Y. Etude Comparative de La Structure et de La Diversité Des Forêts à Gilbertiodendron Dewevrei (De Wild) J.Léonard Des Régions de Kisangani et de l’Ituri (RD Congo), Thèse de Doctorat. Université de Kisangani, 2015.
- Kottek, M.; Grieser, J.; Beck, C.; Rudolf, B.; Rubel, F. World Map of the Köppen-Geiger Climate Classification Updated. Meteorol. Zeitschrift, 2006, 15, 259–263. [Google Scholar] [CrossRef]
- Gabriel, K. B.; Omer, N. T. Etude Socio-Économique Des Conflits Des Guerres Armées Dans La Ville de Kisangani et Sa Périphérie En Province de La Tshopo (1997 à 2006). IJRDO - J. Soc. Sci. Humanit. Res., 2022, No. 5, 318–324.
- European Commission. GHSL Data Package 2023, Publications Office of the European Union, Luxembourg, 2023. [CrossRef]
- Wan, Z. MODIS Land Surface Temperature Products Users ’ Guide. 2013.
- Azizi, S.; Azizi, T. Urban Climate Dynamics: Analyzing the Impact of Green Cover and Air Pollution on Land Surface Temperature—A Comparative Study Across Chicago, San Francisco, and Phoenix, USA. 2024.
- Didan, K.; Munoz, A. B.; Huete, A. MODIS Vegetation Index User ’ s Guide (MOD13 Series). 2015, 2015 (June).
- Rendana, M.; Mohd, W.; Idris, R.; Rahim, S. A.; Abdo, H. G.; Almohamad, H.; Abdullah, A.; Dughairi, A.; Al-mutiry, M. Relationships between Land Use Types and Urban Heat Island Intensity in Hulu Langat District, Selangor, Malaysia. Ecol. Process. 2023. No. July. [Google Scholar] [CrossRef]
- Huang, Q.; Huang, J.; Yang, X.; Fang, C.; Liang, Y. Quantifying the Seasonal Contribution of Coupling Urban Land Use Types on Urban Heat Island Using Land Contribution Index: A Case Study in Wuhan, Sustain. Cities Soc., 2019, 44, 666–675. [Google Scholar] [CrossRef]
- Marando, F.; Salvatori, E.; Sebastiani, A.; Fusaro, L.; Manes, F. Regulating Ecosystem Services and Green Infrastructure: Assessment of Urban Heat Island Effect Mitigation in the Municipality of Rome, Italy. Ecol. Modell., 2019, 392, 92–102. [Google Scholar] [CrossRef]
- Salomon, W.; Sikuzani, Y. U.; Sambieni, K. R.; Barima, Y. S. S.; Théodat, J. M.; Bogaert, J. Land Cover Dynamics along the Urban-Rural Gradient of the Port-Au-Prince Agglomeration (Republic of Haiti) from 1986 to 2021. Land, 2022, 11. [Google Scholar] [CrossRef]
- André, M.; Mahy, G.; Lejeune, P.; Bogaert, J. Vers Une Synthèse de La Conception et Une Définition Des Zones Dans Le Gradient Urbain-Rural. Biotechnol. Agron. Soc. Environ., 2014, 18, 61–74. [Google Scholar]
- Sambieni, K. R. Dynamique Du Paysage de La Ville Province de Kinshasa Sous La Pression de La Périurbanisation: L’infrastructure Verte Comme Moteur d’aménagement. Thèse de Doctorat, Université de Liège, et ERAIFT. 2019, 1–261.
- Angel, S.; Parent, J.; Civco, D. L.; Blei, A.; Potere, D. The Dimensions of Global Urban Expansion: Estimates and Projections for All Countries, 2000-2050. Prog. Plann., 2011, 75, 53–107. [Google Scholar] [CrossRef]
- Bogaert, J.; Biloso, A.; Vranken, I.; André, M. Peri-Urban Dynamics: Landscape Ecology Perspectives. In Territoires périurbains. Développement, enjeux et perspectives dans les pays du Sud.; Bogaert, J., Halleux, J.-M., Eds.; Les presses agronomiques de gembloux, a.s.b.L, 2015; pp 59–69.
- Lu, L.; Zhang, T.; Wang, T. Evaluation of Collection-6 MODIS Land Surface Temperature Product Using Multi-Year Ground Measurements in an Arid Area of Northwest China. 2018, 1. [CrossRef]
- Wan, Z.; Zhang, Y.; Zhang, Q.; Li, Z. Validation of the Land-Surface Temperature Products Retrieved from Terra Moderate Resolution Imaging Spectroradiometer Data. 2002, 83, 163–180.
- Wen, C.; Mamtimin, A.; Feng, J.; Wang, Y.; Yang, F.; Huo, W.; Zhou, C.; Li, R.; Song, M.; Gao, J.; et al. Diurnal Variation in Urban Heat Island Intensity in Birmingham: The Relationship between Nocturnal Surface And. 2023.
- Dutta, D.; Rahman, A.; Paul, S. K.; Kundu, A. Urban Climate Impervious Surface Growth and Its Inter-Relationship with Vegetation Cover and Land Surface Temperature in Peri-Urban Areas of Delhi. Urban Clim., 2021, 37, 100799. [Google Scholar] [CrossRef]
- INS. Population de La Ville de Kisangani Repartie En Sexe, de 1990 à 2021. Kisangani 2022.
- Haodong, L.; Zheng, H.; Wu, L.; Deng, Y.; Chen, J.; Zhang, J. Spatiotemporal Evolution in the Thermal Environment and Impact Analysis of Drivers in the Beijing – Tianjin – Hebei Urban Agglomeration of China from 2000 to 2020. 2024.
- Ren, J.; Shi, K.; Kong, X.; Zhou, H. On-Site Measurement and Numerical Simulation Study on Characteristic of Urban Heat Island in a Multi-Block Region in Beijing, China. Sustain. Cities Soc., 2023, 95, 104615. [Google Scholar] [CrossRef]
- Lima, I.; Scalco, V.; Lamberts, R. Energy & Buildings Estimating the Impact of Urban Densification on High-Rise Office Building Cooling Loads in a Hot and Humid Climate. Energy Build., 2019, 182, 30–44. [Google Scholar] [CrossRef]
- Kim, Y.-H.; Baik, J.-J. Maximum Urban Heat Island Intensity in Seoul. J. Appl. Meteorol., 2002, 651–659.
- Cheung, P. K.; Jim, C. Y.; Siu, C. T. Effects of Urban Park Design Features on Summer Air Temperature and Humidity in Compact-City Milieu. Appl. Geogr., 2021, 129 (February), 102439. [CrossRef]
- Yan, M.; Chen, L.; Leng, S.; Sun, R. Effects of Local Background Climate on Urban Vegetation Cooling and Humidification: Variations and Thresholds. Urban For. Urban Green., 2023, 80 (December 2022), 127840. [CrossRef]
- Ziyan; Paschalis, A. ; Mijic, A.; Meili, N.; Manoli, G.; Reeuwijk, M. Van; Fatichi, S. Urban Climate A Mechanistic Assessment of Urban Heat Island Intensities and Drivers across Climates. Urban Clim., 2022, 44, 101215. [Google Scholar] [CrossRef]
- Omidvar, H.; Bou-zeid, E.; Li, Q.; Mellado, J. Plume or Bubble ? Mixed-Convection Flow Regimes and City-Scale Circulations. 2020. [CrossRef]
- Koluwa, S. K. De La Reparation Des Victimes de La Guerre de Six Jours à Kisangani. J. Soc. Sci. Humaniyies Res., 2020, 5, 44–56. [Google Scholar]
- Fengjiao, C.; Feng, S.; Feng, Q.; Yujie, W.; Tailong, Z.; Haiying, Y. Research Advances in the Influence of Vegetation on Urban Heat Island Effect. 2020, 56.
- Kwan, P.; Fung, C. K. W.; Jim, C. Y. Seasonal and Meteorological Effects on the Cooling Magnitude of Trees in Subtropical Climate. Build. Environ., 2020, 177, 106911. [Google Scholar] [CrossRef]
- Oliveira, S.; Andrade, H.; Vaz, T. The Cooling Effect of Green Spaces as a Contribution to the Mitigation of Urban Heat: A Case Study in Lisbon. Build. Environ., 2011, 46, 2186–2194. [Google Scholar] [CrossRef]
Figure 1.
Kisangani and its surrounding area. The city is organized into six municipalities and is surrounded by three protected areas. Its transport infrastructure includes both national and provincial road networks.
Figure 1.
Kisangani and its surrounding area. The city is organized into six municipalities and is surrounded by three protected areas. Its transport infrastructure includes both national and provincial road networks.
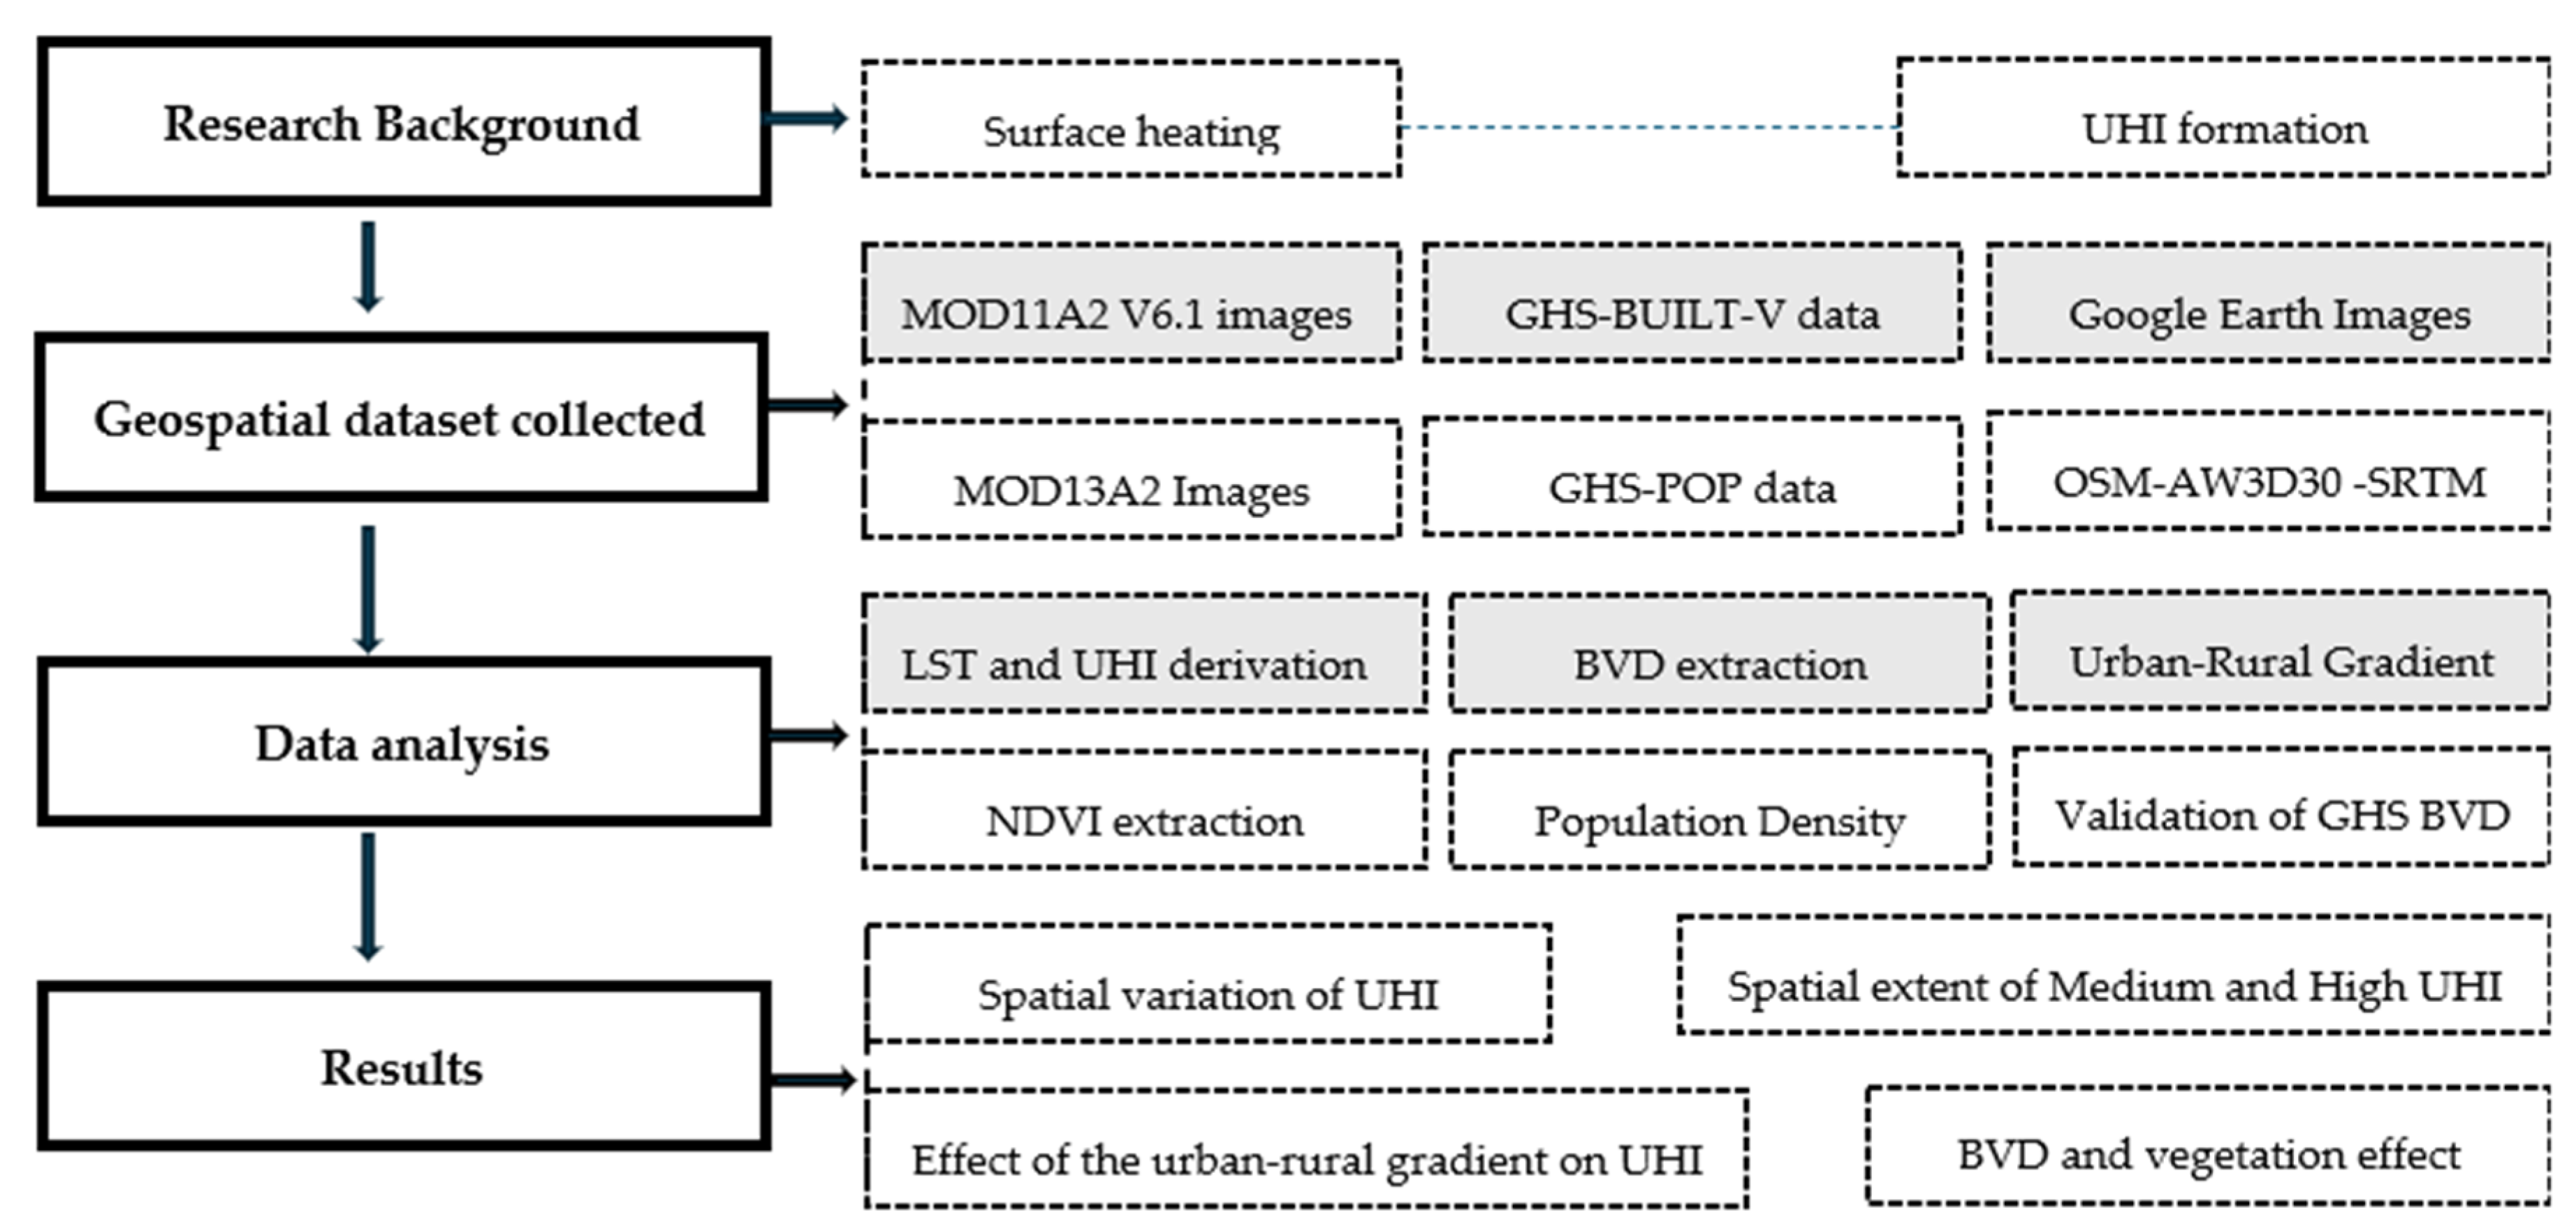
Figure 2.
Methodological flowchart of the study.
Figure 2.
Methodological flowchart of the study.
Figure 3.
Sample plots along the Urban-Rural Gradient. A series of randomly selected sample plots were analyzed along the urban-rural gradient, encompassing various directional perspectives: north, south, east, west, northeast, northwest, southeast, and southwest. The evolving characteristics of these plots highlight the dynamic and continual shifting of urban, peri-urban, and rural areas.
Figure 4.
Spatial variations of diurnal Urban Heat Island (UHI). The UHI corresponds to Land Surface Temperature (LST) per pixel relative to the Rural Average Temperature. Data from MODIS sensor (MOD11A2 V6.1) covering the period from 2000 to 2024.
Figure 4.
Spatial variations of diurnal Urban Heat Island (UHI). The UHI corresponds to Land Surface Temperature (LST) per pixel relative to the Rural Average Temperature. Data from MODIS sensor (MOD11A2 V6.1) covering the period from 2000 to 2024.
Figure 5.
The spatial extent of Urban Heat Islands (UHI) is expressed in square km. Medium (0.1<UHI<0.2); High (0.2<UHI≤0.3); MH expresses the sum of Medium and High UHI extent.
Figure 5.
The spatial extent of Urban Heat Islands (UHI) is expressed in square km. Medium (0.1<UHI<0.2); High (0.2<UHI≤0.3); MH expresses the sum of Medium and High UHI extent.
Figure 6.
(a) Land Surface Temperature (LST) and (b) the UHI variation in Urban, per-urban, and Rural zones based on the landscape context of the last year studied (2024). In b, the UHI is derived from the difference between the LST per pixel and the mean LST in rural areas (Ts = 28°C).
Figure 6.
(a) Land Surface Temperature (LST) and (b) the UHI variation in Urban, per-urban, and Rural zones based on the landscape context of the last year studied (2024). In b, the UHI is derived from the difference between the LST per pixel and the mean LST in rural areas (Ts = 28°C).
Figure 7.
Historical variations in Land Surface Temperature (LST) and Urban Heat Island (UHI) in urban areas (a1,a2), peri-urban areas (b1,b2), and rural areas (c1, c2).
Figure 7.
Historical variations in Land Surface Temperature (LST) and Urban Heat Island (UHI) in urban areas (a1,a2), peri-urban areas (b1,b2), and rural areas (c1, c2).
Figure 8.
Linear regression performed between Building Volume Density (BVD) and LST (a1), vegetation density expressed by NDVI and LST (a2), and the historical trends in the regressions’ slope (b1,b2) and coefficient of determination values (c1,c2). In a each point corresponds to a pixel of 1km².
Figure 8.
Linear regression performed between Building Volume Density (BVD) and LST (a1), vegetation density expressed by NDVI and LST (a2), and the historical trends in the regressions’ slope (b1,b2) and coefficient of determination values (c1,c2). In a each point corresponds to a pixel of 1km².
Figure 9.
An illustration of the spatiotemporal evolution of the Urban Heat Island (UHI), the NDVI, and the Building Volume Density for a typical area (urban center of Kisangani).
Figure 9.
An illustration of the spatiotemporal evolution of the Urban Heat Island (UHI), the NDVI, and the Building Volume Density for a typical area (urban center of Kisangani).
Table 1.
Spatial characteristics, time scale, and product type of geospatial dataset collected.
Table 1.
Spatial characteristics, time scale, and product type of geospatial dataset collected.
| Product ID |
Layer |
Spatial Resolution |
Time scale |
| MOD11A2 V6.1 |
LST Emissivity |
1 Km |
01.01 – 31.12 |
| MOD13A2 |
NDVI |
1 Km |
01.01 – 31.12 |
| GHS-BUILT-V |
Building Volume |
1 Km |
1975-2030 |
| GHS-POP |
Population Density |
1 Km |
1975-2030 |
| Google Earth |
GE Images |
1m |
Annual |
Table 2.
The UHI level.
| UHI (°C) |
Level |
Description |
| UHI ≤ 0 |
Very low |
Extreme low-temperature zone, meaning that there is no difference in LST between urban and rural areas. |
| 0<UHI ≤ 0.1 |
Low |
Low-temperature zone, which means that the LST variation between urban and rural areas is minimal. |
| 0.1<UHI ≤ 0.2 |
Medium |
Medium temperature region, meaning that the LST differs moderately between urban and rural areas. |
| 0.2<UHI ≤ 0.3 |
High |
High-temperature zone, meaning large urban/rural LST difference. |
| 0.3<UHI |
Very high |
Extremely high-temperature zone, meaning very large urban/rural LST difference. |
|
Disclaimer/Publisher’s Note: The statements, opinions and data contained in all publications are solely those of the individual author(s) and contributor(s) and not of MDPI and/or the editor(s). MDPI and/or the editor(s) disclaim responsibility for any injury to people or property resulting from any ideas, methods, instructions or products referred to in the content. |
© 2025 by the authors. Licensee MDPI, Basel, Switzerland. This article is an open access article distributed under the terms and conditions of the Creative Commons Attribution (CC BY) license (http://creativecommons.org/licenses/by/4.0/).