Submitted:
20 February 2025
Posted:
20 February 2025
You are already at the latest version
Abstract
Nanjing series japonica rice varieties developed by the Institute of Food Crops, Jiangsu Academy of Agricultural Sciences in China have the characteristics of excellent taste quality, high yield, and good resistance. They are being widely promoted and applied in the lower reaches of the Yangtze River in China's japonica rice planting areas. In response to the problem of the lack of coordination between nitrogen fertilizer management measures and variety characteristics in production, which makes it difficult to synergistically improve yield and quality, this study adopted a split-plot experimental design, with four nitrogen application rates (pure nitrogen) treatments (N1: 0 kg hm-2; N2: 150kg hm-2; N3: 300 kg hm-2; N4: 450 kg hm-2 in 2021, N1: 120 kg hm-2; N2: 180kg hm-2; N3: 240 kg hm-2; N4: 300 kg hm-2 in 2022) as the main plot, and four varieties (2021: Nanjing 46, Nanjing 9108, Nanjing 9308 and Nanjingxiangnuo; 2022: Nanjing 9108, Nanjing 5718, Nanjing 5818 and Nanjing 5758) as the split plot, to study the effect of nitrogen fertilizer application on yield and rice quality. The results showed that the differences between different nitrogen fertilizer treatments were significant at the 5% or 1% level, except for the milled rice rate, head rice rate, peak viscosity, setback viscosity and paste temperature in 2021, panicle number, grain number per panicle, all RVA characteristic values, and amylose content in 2022. With the increase of nitrogen application rate, the number of panicles and grain number per panicle increased, and the yield increased. The rates of brown rice, milled rice, and head rice showed an upward trend, while the rates of chalky grains and chalkiness were increased. The peak viscosity, hot viscosity, final viscosity, and breakdown viscosity decreased, while the setback viscosity increased. For the quality of cocked rice, the hardness increased, appearance, viscosity and balance decreased, protein content increased, and taste value decreased. The interaction between nitrogen application rate and variety only reached a significant level of 5% or 1% in yield components, processing quality, and rice protein content in 2021, and in eating and cooking quality, appearance quality and peak viscosity in 2022, other traits were not significant. The comprehensive results of two years of experiments showed that under the conditions of this experiment, a nitrogen application rate of 240-300 kg hm-2 could improve the quality of rice in the Nanjing series varieties while maintaining a high yield. The results of this experiment have guiding significance for the high-yield and high-quality cultivation of Nanjing series excellent tasting japonica rice.
Keywords:
nitrogen application rate
; japonica rice
; yield
; quality
; good taste
1. Introduction
Rice is the main grain crop in China, and Jiangsu Province is the main producer of rice in China, playing a crucial role in ensuring national food security. In the past 20 years, Jiangsu Academy of Agricultural Sciences and other institutions have made outstanding progress in the breeding of new varieties of excellent taste japonica rice, and have developed a number of japonica rice varieties with excellent taste quality, high yield, and good resistance. Nanjing 46, Nanjing 9108, Nanjing 5718, Nanjing 9308, Nanjing 5818, Nanjing 5758, and Nanjingxiangnuo are all japonica rice varieties developed by the Institute of Food Crops, Jiangsu Academy of Agricultural Sciences [1-5]. Among them, Nanjing 46, Nanjing 9108, Nanjing 5718, Nanjing 9308, and Nanjing 5818 are all semi glutinous excellent taste japonica rice varieties. The cooked rice is crystal clear, the taste is soft and smooth, elastic, and does not regenerate when cold, and the taste quality is excellent. Nanjing 46 was approved by the Jiangsu Provincial Crop Variety Approval Committee in 2008, and by the Shanghai Crop Variety Approval Committee in 2009. In 2021, it was approved by Jiangsu Province to expand the promotion area to the Yangtze River and southern Jiangsu regions and registered for introduction in Zhejiang Province. This variety has won more than 30 honorary titles such as "Gold Award Rice" in Jiangsu Province and China, and was known as the "best rice for eat" in Jiangsu Province. It has become the preferred variety for high-end and high-quality rice brands in the Yangtze River Delta region [6]. In recent years, the planting area has exceeded 100000 hectares, with a cumulative promotion area of over 800000 hectares. Nanjing 9108 was approved by Jiangsu Province in 2013, and was registered for introduction in Shanghai in 2017. In 2015, it was confirmed as a super rice by the Ministry of Agriculture and Rural Affairs of China. In 2019, it won the Gold Award in the second National Rice Variety Quality Taste Evaluation organized by the Ministry of Agriculture and Rural Affairs. From 2022 to 2024, it was continuously listed as a national leading variety by the Ministry of Agriculture and Rural Affairs. From 2016 to 2024, a total of 4 million hectares of rice have been promoted, with an annual planting area exceeding 350000 hectares. It has become the largest rice variety in Jiangsu Province with the largest annual planting area of a single variety, and the third largest variety of conventional rice promoted nationwide in 2023. It has become a core variety of high-quality rice regional public brands such as "Sheyang Rice", "Xinghua Rice", and "Hai'an Rice" in Jiangsu Province [7]. Nanjing 5718 is a new variety of medium maturing japonica rice developed by the Institute of Food Crops, Jiangsu Academy of Agricultural Sciences. It has excellent taste quality, strong lodging resistance, and high yield potential [3]. In 2019, it was approved by the Jiangsu Province as the medium maturing medium japonica rice variety, and in 2021, it was approved by the Jiangsu Province as the late maturing medium japonica rice variety and registered for introduction in Anhui Province and Henan Province. In 2021, it was confirmed as a super rice variety by the Ministry of Agriculture and Rural Affairs. Once this variety was launched, it received unanimous praise from many farmers and its promotion area rapidly expanded. In 2023, it was listed as a growing variety in the National Catalogue of Excellent Crop Varieties and a leading variety for 2023-2024. The promotion area has exceeded 100000 hectares by 2024. Nanjing 9308[4] and Nanjing 5818 [5] are both mid maturity japonica rice varieties developed by the Institute of Food Crops, Jiangsu Academy of Agricultural Sciences from the hybridization of Nanjing 46 and Nanjing 9108. They were approved by Jiangsu Province in 2021 and 2023 respectively. Nanjing 9308 and Nanjing 5818 not only maintained the excellent taste quality of the two parental rice varieties, Nanjing 46 and Nanjing 9108, as well as the high-yield and lodging resistant characteristics of Nanjing 9108, but also have improved resistance to rice blast disease and the appearance quality of rice. The chalkiness degree was 5.4% and 5.6% respectively, and the gel consistency was 90 mm and 85 mm respectively. They were mid maturity medium japonica rice varieties that balance appearance quality and taste quality, with good yield and resistance. They have good prospects for promotion and application in the area north of Huai River in Jiangsu Province. Among them, Nanjing 9308 has been planted in an area of over 30000 hectares in 2024. Nanjing 5758 is a non semi glutinous late maturing medium japonica rice variety with excellent appearance and taste quality. It was approved by Jiangsu Province in 2021 [5]. According to the 2020 testing conducted by the Food Quality Supervision, Inspection and Testing Center of the Ministry of Agriculture and Rural Affairs (Wuhan), the rice quality of Nanjing 5758 had reached the first grade standard of "Cooking Rice Variety Quality (NY/T 593-2021)" in the agricultural industry. The milled rice rate was 75.8%, the chalky grain rate was 4.0%, the chalkiness degree was 0.9%, the gel consistency was 84 mm, the amylose content was 14.9%, and the taste value was 82 points. Nanjingxiangnuo is an early maturing late japonica glutinous rice variety that was approved by Jiangsu Province in 2021. The average yield of the two-year regional trial was 10881 kg/hm2, which was 3.5% higher than the control. The average yield of the production experiment was 10320 kg/hm2, an increase of 3.2% compared to the control. The quality of rice meets the second level of the agricultural industry standard "Coking Rice Variety Quality", with a milled rice rate of 71.6%, a gel consistency of 100 mm, a amylose content of 1.3%, and a fragrant aroma.
Some of the above-mentioned varieties of Nanjing series japonica rice have just been promoted in production, while others have been promoted and planted in production for many years. During the planting process, it was found that the yield and taste quality of the same variety of Nanjing series japonica rice planted in different years and locations, or by different farmers in the same year and location, was vary greatly. Numerous studies have shown that nitrogen application rate had a significant impact on both rice yield and quality [8-17]. In production practice, excessive application of nitrogen fertilizer often leads to a decrease in rice quality in order to increase yield. On the other hand, to improve the quality of rice, it was emphasized to apply less nitrogen fertilizer in the later stage, which leads to a decrease in yield. Due to the mismatch between nitrogen fertilizer application and variety characteristics, it was difficult to synergistically improve yield and quality. There have been many previous reports on the effect of nitrogen application rate on rice yield or quality [18-20]. However, there were not many reports on the effects of nitrogen application rate on the yield and quality of semi glutinous rice with excellent taste [21-23]. To ensure the excellent taste quality and yield of the Nanjing series varieties, and to achieve the matching of good varieties and good methods, this study used the Nanjing series excellent taste japonica rice varieties as the material to study the comprehensive regulation of nitrogen fertilizer application on yield and quality, to provide a reference for the high-quality and efficient cultivation of Nanjing series varieties.
2. Materials and Methods
2.1. Experimental Treatment Design
The experiment was conducted at the Nanjing Base of Jiangsu Academy of Agricultural Sciences in 2021-2022. The soil was sticky loam with 1.74% organic matter, 1.40 g/kg total nitrogen content, 32.1 mg/kg available phosphorus, and 165.8 mg/kg available potassium. In 2021, four nitrogen application rates (all pure nitrogen) were set: no nitrogen (N1: 0 kg/hm2), low nitrogen (N2: 150kg/hm2), medium nitrogen (N3: 300 kg/hm2), and high nitrogen (N4:450 kg/hm2). According to the experimental results of 2021, there are four nitrogen fertilizer treatments in 2022: N1: 120 kg/hm2, N2: 180 kg/hm2, N3: 240 kg/hm2, and N4: 300 kg/hm2. For both years, a split blot design was adopted, with nitrogen application rate as the main plot and variety as the split plot. The main plot and split plot were randomly arranged and repeated three times. Build soil embankments between each residential area for isolation and separate irrigation and drainage. Plant 18 rows in each plot, with 18 plants per row and 3 seedlings per hole, with a row spacing of 25cm x 13.3cm. On May 10th, the seeds were soaked in liquid medicine, sown on May 14th, and using hard ground seedling trays and sprinkler irrigation method to raise seedlings. The seedlings were transplanted on June 10th. Except for the N1 treatment in 2021, each plot uniformly uses compound fertilizer with N-P2O5-K2O content of 20% -12% -16% as the base fertilizer, and rotary tillage it into the soil during land preparation. After transplanting 7 and 14 days later, urea was applied as tillering fertilizer. When the fourth to last leaf came out, an equal amount of compound fertilizer with N- P2O5-K2O content of 16% -0% -16% was used as panicle fertilizer for each treatment, while urea was used for the rest nitrogen fertilizer to ensure the same amount of phosphorus and potassium fertilizers for each treatment. The nitrogen fertilizer management mode was base fertilizer: tiller fertilizer: panicle fertilizer=4:4:2. When the total number of tillers reaches around 270×104 /hm2, start draining the fields. After finish the drainage, except for establishing a shallow water layer from the booting stage to the flowering stage, the rest of the time was alternated between dry and wet irrigation, with moist irrigation. That was, after watering once in shallow water, let it naturally fall dry, and then watering again in shallow water until maturity. No more watering was applied from 10 days before harvest. Other cultivation management measures were implemented according to conventional cultivation requirements.
2.2. Test Varieties
In 2021, the tested rice varieties were Nanjing 46, Nanjing 9108, Nanjing 9308, and Nanjing Xiangnuo. In 2022, Nanjing 9108, Nanjing 5718, Nanjing 5758, and Nanjing 5818 with relatively consistent growth stages were used. Except for Nanjing 5758, which is non semi glutinous rice, and Nanjingxiangnuo, which is glutinous rice, all other varieties contain the low amylose content gene Wxmp and belong to the semi glutinous good taste japonica rice varieties. Nanjing 46 has a full growth period of 165 days and belongs to mid maturity late japonica rice. It is suitable for planting in the Yangtze River and southern Jiangsu regions of Jiangsu Province, Shanghai, and the Hangzhou Jiaxing Huzhou region of Zhejiang Province. Nanjing 9108 has a full growth period of 154 days and belongs to late maturing medium japonica rice. It is suitable for planting in the hilly area of Nanjing, Zhenjiang and Yangzhou in Jiangsu Province, and Chongming District in Shanghai. Nanjing 5718 has a full growth period of 148-150 days and belongs to the category of medium japonica rice. It is suitable for planting in the northern and central areas of Jiangsu Province, hilly area of Nanjing, Zhenjiang and Yangzhou in Jiangsu Province, the areas north of Huai River in Anhui Province, and the rice growing areas in southern Henan Province, and Chongming District of Shanghai. Nanjing 5818 has a full growth period of 145 days and belongs to medium maturity medium japonica rice, suitable for planting in the areas north of Huai River in Jiangsu Province. Nanjing 5758 has a full growth period of 149 days and belongs to the early maturing type in late maturing medium japonica rice. It is suitable for planting in the central areas of Jiangsu Province and hilly area of Nanjing, Zhenjiang and Yangzhou in Jiangsu Province. Nanjingxiangnuo has a full growth period of 156 days and belongs to early maturing late japonica rice, suitable for planting in the Yangtze River and southern Jiangsu regions of Jiangsu Province. The tested varieties have been widely promoted and planted in Jiangsu Province and surrounding provinces.
2.3. Characteristic Determination and Methods
2.3.1. Determination of Yield Traits
On the second day after transplantation, starting from the third hole in the diagonal second row of each plot, there were 5 consecutive holes, with 3 seedlings designated for each hole. Any excess 3 seedlings would be removed, and any less than 3 seedlings would be replenished. After maturity, harvest these 10 holes and bring them back indoors. Investigate the number of panicles in each hole, thresh them separately, pack them in sandbags and let them dry. When the moisture content was around 14%, measureed the total number of grains, empty grains, and thousand grain weight in each hole, calculated the number of grains per panicle and the setting rate, and took the average of the 10 holes as the characteristic value of the plot. All other plants in each plot were harvested, threshed, cleaned, and dried to a moisture content of about 14% to determine the yield of the plot, which is converted into yield per hectare.
2.3.2. Determination of Processing Quality
Randomly weigh 10 g (W1) of rice that has been tested for thousand grain weight, used a small brown rice mill (JLGJ4.5 model, Taizhou Grain Instrument Factory, Taizhou, China) to remove the rice husk, and weigh (W2) to calculate the brown rice rate (=W2/W1, %). Use a small rice milling machine (BLH-3120, Zhejiang Bethlehem Instrument Equipment Co., Ltd., Taizhou, China) to grind and weigh brown rice (W3), and calculate the rice milling rate (=W3/W1, %). After removing the broken rice from the milled rice, weigh it (W4) and calculate the head rice rate (=W4/W1, %). Repeat the measurement three times in each plot, and take the average as the plot trait value.
2.3.3. Determination of Protein Content
Weigh 10g of milled rice and use an experimental mill (JFS-13, Zhejiang Hangzhou Qianjiang Instrument Equipment Co., Ltd., Hangzhou, China) to grind it into rice powders. After passing a 100 mesh sieve, it was put into a paper bag for standby. The total nitrogen content in rice powders was determined by Kjeltec 8400 (FOSS, Denmark), and then multiplied by the conversion coefficient 5.95 to calculate the protein content (PC) of rice powders. Repeat the measurement three times and take the average as the plot trait value.
2.3.4. Determination of RVA Characteristic Values
The viscosity of rice powders was measured by RVA viscosity tester (TechMaster, Perten, Stockholm, Sweden), and the parameters were set according to the operating procedures of AACC61-01 and 61-02 of the American Grains Chemical Association. Put 3g rice powders into an aluminum box, and then mix it with 25 ml distilled water. First, use a plastic paddle with a speed of 960 rpm to stir the sample in the instrument pool, and then reduce the speed to 160 rpm. Heat the sample from 50 ℃ to 95 ℃, then cool it back to 50 ℃. Measure peak viscosity (PV), hot viscosity (HV), final viscosity (FV), pasting temperature (PaT), and peak time (PeT); Calculate the breakdown viscosity (BDV=PV-HV) and the setback viscosity (SBV=FV-PV). Repeat the measurement for each sample three times and take the average value.
2.3.5. Determination of Rice Taste Index
The appearance, hardness, viscosity, balance, and taste value of cooked rice were measured using a rice taste meter (STA-1A, Satake Company, Hiroshima, Japan). In 2022, the chalky grain rate, chalkiness degree, amylose content, and gel consistency were also measured.
2.3.6. Determination of Nitrogen Fertilizer Utilization Efficiency
Measure the agronomic nitrogen use efficiency (ANUE) and partial factor productivity of nitrogen (PFPN) according to the following formula [24].
ANUE (kg/kg)=(yield in nitrogen application area-yield in nitrogen free area)/nitrogen application rate
PFPN (kg/kg)=yield of nitrogen application area/nitrogen application rate
2.4. Data Analysis
According to the method introduced by Mo [25], perform variance analysis in Excel using a self-developed program, and use Duncan's new complex extreme difference method for multiple comparisons. Draw in Excel.
3. Results and Analysis
According to the meteorological data provided by the Nanjing Meteorological Observatory, the temperature, rainfall, and light during the rice growing period in 2021 were normal annual conditions close to the annual average. 2022 was a year of high temperature, with 33 out of 45 days from July 10th to August 23rd having the highest temperature above 35 ℃, which affected the setting rate of the experimental materials. Therefore, the yield of the tested varieties in 2022 was relatively low. The average temperature during the rice growth period in 2021 and 2022 is shown in Figure 1.
The variance analysis of the random split block design was conducted on two years of data, and the results showed that in 2021, the main plot errors of all traits did not reach a significant level of 5%. In 2022, except for hardness and balance of cooked rice, chalky grain rate, chalkiness degree, and yield, the main plot errors of other traits also did not reach a significant level of 5%. Therefore, for traits with insignificant main plot errors, the main plot errors and split plot errors were combined and retested. The results showed that the differences between different nitrogen application rates were significant at the 1% level, except for the milled rice rate, head rice rate, PV, SBV, and PaT in 2021, the panicle number, grain number per panicle, all RVA characteristic values, and amylose content in 2022. The differences between varieties were significant at the 5% or 1% level, except for the number of grains per panicle and hardness of cooked rice in 2021, the number of grains per panicle, seed setting rate, grain weight per plant, brown rice rate, milled rice rate, and PaT in 2022. The interaction between nitrogen application rate and variety reached a significant level of 5% or 1% only in terms of yield factors, processing quality, and rice protein content in 2021, and only in terms of eating and cooking quality, appearance quality, and peak viscosity in 2022 (Table 1 and Table 2).
3.1. The Effect of Nitrogen Application Rate on the Yield and Yield Components of Nanjing series japonica Rice with Good Taste
From the average values of different nitrogen fertilizer treatments, it could be seen that in 2021, with the increase of nitrogen application rate, the number of panicles and grains per panicle increased. Seed setting rate first rose and then fell, showing an overall downward trend. The thousand grain weight also showed a decreasing trend, while the grain weight per plant and plot yield increased. The N3 treatment had the highest number of panicles, with no significant difference compared to the N4 treatment, but significant differences compared to the N2 and N1 treatments. The N4 treatment had the highest number of grains per panicle, with no significant difference compared to the N3 treatment, but significant differences compared to the N2 and N1 treatments. The seed setting rate of N2 treatment was the highest, with no significant difference compared to N1 and N3 treatments, but significant difference compared to N4 treatment. The N1 treatment had the highest thousand grain weight, but except for a significant difference compared to the N2 treatment, there was no significant difference compared to the N3 and N4 treatments. The yield of the plot was highest in the N4 treatment, with no significant difference compared to the N3 treatment, but significant differences compared to the N2 and N1 treatments (Table 3, Figure 2A—F).
The difference in the number of panicles and grains per panicle between different nitrogen fertilizer levels in 2022 was not significant, but it showed an increasing trend. With the increase of nitrogen application rate, the seed setting rate showed a significant increasing trend, with N1 treatment being the lowest, N4 treatment being the highest, and N2 and N3 treatments being in the middle. The difference between N2 and N3 was not significant, but they were significantly different from N1 and N4 (Table 4, Figure 2 A—F). This was opposite to the trend of change in 2021, as the abnormally high temperatures in July and August 2022 led to a significant decrease in the seed setting rate of the tested varieties. As the nitrogen application rate increased, the thousand grain weight decreased, while the grain weight per plant and plot yield increased, which was consistent with the trend in 2021. Moreover, there was no interaction between nitrogen application rates and varieties in terms of yield over the past two years, indicating that the yield response trends of the tested varieties were consistent under different nitrogen application rates (Figure 3).
From the results of two years of experiments, it could be seen that the treatment with the highest nitrogen application rate (N4) had the highest yield and the most grains per panicle, but the difference with N3 treatment was not significant; The treatments N3 (2021) or N4 (2022) had the highest number of panicles, and the difference between N3 and N4 treatments was not significant for two years.
From the perspective of nitrogen fertilizer utilization efficiency, both agronomic nitrogen use efficiency (ANUE) and partial factor productivity of nitrogen (PFPN) decreased with the increase of nitrogen application rate, and the trend was consistent over the two years (Table 3 and 4, Figure 2 W and X). The results of the analysis of variance showed that the ANUE showed significant differences only between nitrogen application rates in 2021, and only between varieties in 2022. However, the differences in nitrogen application rates, varieties, and their interactions for PFPN were all significant at 1% level in both years. From Figure 4, it could be seen that in 2021, there were significant differences in PFPN among varieties at low nitrogen levels (N2), with the largest being Nanjingxiangnuo, followed by Nanjing 9108. As the nitrogen application rate increased, the differences between varieties gradually decreased. In 2022, Nanjing 5758had the highest PFPN under low nitrogen level (N1), far exceeding the other three varieties, all of which had the highest PFPN under N2 treatment.
3.2. The Effect of Nitrogen Application Rate on the Quality of Nanjing Series japonica Rice with Good Taste
3.2.1. Impact on Processing and Appearance Quality
From the average values of processing quality under different nitrogen fertilizer treatments, it could be seen that with the increase of nitrogen application rate, the rates of brown rice, milled rice, and head rice all showed an upward trend. Except for the first increase and then decrease in head rice (2021) or some increase and decrease (2022) with little change, the N1 treatment had the lowest rate, which was significantly different from the other three treatments, while the differences between the other three treatments were not significant (Table 3, Table 4, Figure 2 G—I). The interaction between nitrogen application rate and variety showed that in 2021, the brown rice rate, milled rice rate, and head rice rate all reached a significant level of 5% or 1%. However, in 2022, the three traits were not significant because the differences in brown rice rate and milled rice rate among the four varieties tested in 2022 were not significant (Table 1, Table 2, Figure 2 G—I). The chalky grain rate and chalkiness degree were only detected in 2022, and their trend of change was similar to that of processing quality. The N1 treatment had the lowest chalkiness rate, and with the increase of nitrogen application rate, the chalkiness rate and chalkiness degree increased. The changes between N2, N3, and N4 treatments were not significant (Table 4). The interaction between nitrogen application rate and variety, as well as the chalky grain rate and chalkiness degree, reached a significant level of 1% (Table 2), indicating that with the increase of nitrogen application rate, the changing trends of chalky grain rate and chalkiness degree in different varieties were significantly different.
3.2.2. Impact on Eating and Cooking Quality
The response trends of eating and cooking quality traits of tested varieties in 2021 were consistent under different nitrogen application rates. The interaction between varieties and nitrogen application rates, except for protein content reaching a significant level of 1%, did not reach a significant level of 5% in terms of appearance, hardness, viscosity, balance, and taste value of cooked rice (Table 1). From the average values of the tested varieties, the trend of changes in eating and cooking quality was that as the nitrogen application rate increased, the protein content increased, the appearance, stickiness, and balance of cooked rice decreased, the hardness of cooked rice increased, and the taste value decreased. From the significance of the difference in mean values, the protein content and hardness of cooked rice were highest in the N4 treatment, with no significant difference compared to the N3 treatment, but significant differences compared to the N2 and N1 treatments. The appearance, stickiness, and balance of cooked rice were the highest in N1 treatment, but except for significant differences with N4 treatment, there were no significant differences with N2 and N3 treatments. The taste value of N1 treatment was also the highest, with no significant difference compared to N2 treatment, but significant differences compared to N3 and N4 treatments. The differences between N3 and N4 treatments also reached a significant level (Table 3, Figure 2 J—O).
The response trends of eating and cooking quality traits of the tested varieties in 2022 were inconsistent under different nitrogen application rates, and there was a highly significant interaction between nitrogen application rates and varieties (Table 2). The taste values of Nanjing 9108, Nanjing 5718, and Nanjing 5818 showed a downward opening parabolic relationship with nitrogen application rate, with N3 treatment having the highest taste value. The taste value of Nanjing 5758 was highest in the N1 treatment, and gradually decreased with the increase of nitrogen application rate (Figure 5). From the average values of tested varieties, the changes in eating and cooking quality traits under different nitrogen application rates were not so large as in 2021. The hardness of cooked rice was the lowest in the N3 treatment, while the appearance, viscosity, balance, and taste values of cooked rice were the highest in the N3 treatment. The protein content was the lowest inthe N1 treatment and lower in the N3 treatment. It could be seen that for most of the eating and cooking quality traits N3 treatment were best (Table 4, Figure 2 J—O).
3.2.3. Impact on RVA Characteristics
The analysis of variance of RVA characteristics showed that there were no significant differences among all the traits among different nitrogen fertilizer treatments in 2022. In 2021, except for the insignificant differences in HV, SBV, and PaT among different nitrogen fertilizer treatments, all other traits reached a significant level of 5% or 1%. The interaction between nitrogen fertilizer treatment and variety did not reach a significant level for all the traits in two years (Table 1, Table 2).
From the average RVA characteristic values of different nitrogen fertilizer treatments in 2021, it could be seen that with the increase of nitrogen application rate, the PV, BDV, and FV all showed a downward trend, while the PeT showed an upward trend. The changes in HV, SBV, and PaT were not significant (Table 3, Figure 2 P—V). From the significance of the difference in mean values, the PV and BDV were highest in the N1 treatment and lowest in the N4 treatment. There was no significant difference between the N1 and N2 treatments, or between the N4 and N3 treatments. The FV was also highest in N1 treatment and lowest in N4 treatment, but except for significant differences between N1 and N3, N1 and N4 treatments, the differences between the other treatments were not significant. The PeT of N1 treatment was the shortest, with significant differences compared to N2, N3, and N4 treatments, while the differences between N2, N3, and N4 treatments were not significant. (Table 3, Figure 2 P—V).
3.3. Correlation Analysis Between Different Characteristics
The correlation analysis (Table 5) showed that among yield traits, the yield in 2021 was significantly and extremely significantly positively correlated with the number of panicle number per plant and grains per panicle, respectively. The grain weight per plant was highly significantly positively correlated with panicle number per plant and grains per panicle. In 2022, yield was significantly positively correlated with seed setting rate and grain weight per plant, while the number of panicles was significantly negatively correlated with thousand grain weight, the grain weight per plant was significantly positively correlated with seed setting rate. The correlations between other yield traits were not significant. The processing quality traits of brown rice rate, milled rice rate, and head rice rate were significantly positively correlated with each other for two years. There was a significant correlation among the six taste quality traits, with taste values showing a significant negative correlation with protein content and hardness of cooked rice, and a significant positive correlation with rice appearance, stickiness, and balance of cooked rice. Among the RVA characteristic values, most traits were significantly correlated with each other. PV was significantly positively correlated with BDV, FV was significantly correlated with HV and SBV, PeT was significantly positively correlated with HV, FV and SBV for two years.
From the correlation between different types of traits (Table 5), although there was a significant correlation between yield traits, eating and cooking quality, and RVA characteristic values for most traits, the performance of most correlations was inconsistent over two years, indicating that the correlation between these traits was unstable and greatly influenced by environmental factors such as climate and cultivation. Due to the significant impact of the abnormal high temperature in 2022 on the seed setting rate and yield, while 2021 was a normal year. Therefore, from the correlation between eating and cooking quality traits and yield traits in 2021, taste value, appearance, viscosity, and balance of cooked rice were significantly or extremely significantly negatively correlated with yield, grain weight per plant, number of panicles, and number of grains per panicle. Hardness of cooked rice was significantly or extremelysignificantly positively correlated with yield, grain weight per plant, number of panicles, and number of grains per panicle.The yield and grain weight per plant were significantly positively correlated with the brown rice rate for two years, while the taste value was highly significantly positively correlated with the appearance, hardness, stickiness, and balance of cooked rice for two years, and significantlynegatively correlated with protein content. In addition, according to the measurement results in 2022, the chalky grain rate and chalkiness degree were significantly positively correlated with the head rice rate, BDV, and PaT, and significantly negatively correlated with SBV.The amylose content was significantly positively correlated with HV, FV, SBV, and PeT, and significantly negatively correlated with BDV.
4. Discussions
4.1. Increasing Nitrogen Fertilizer Application Could Improve Yield with the Increase of the Number of Panicles and Grains per Panicle of Good Eating Quality japonica Rice
Nitrogen is the most important nutrient element for rice growth, which has a significant impact on rice yield and quality formation [26-28]. Nitrogen is also a component of various enzymes in rice plants, and enzymes are essential biocatalysts in the plant growth process. Nucleic acids, nuclear proteins, alkaloids, vitamins, and hormones also contain nitrogen [29], indicating that nitrogen plays a very important role in the growth and development of rice. Therefore, increasing nitrogen fertilizer application has become an important measure to increase yield in rice cultivation. However, more nitrogen fertilizer is not necessarily better. Numerous studies have shown that the response curve of rice yield to nitrogen fertilizer application follows a parabolic relationship with an opening downward [30]. Under the appropriate range of nitrogen fertilizer application and reasonable nitrogen fertilizer management, rice yield increases with the increase of nitrogen application rate. However, once nitrogen fertilizer exceeds the appropriate amount or the management method is unreasonable, it could actually cause excessive growth of rice, reduce lodging resistance and stress resistance, and decrease yield [31]. The results of this study indicated that with the increase of nitrogen application rate, the number of panicles increased, the number of grains per panicle increased, and the overall grain setting rate showed a decreasing trend (except for the influence of high temperature in 2022). The thousand grain weight also showed a decreasing trend, and the yield increased with the increase of nitrogen application rate (Table 3 and Table 4). There were significant differences in the response of yield factors to nitrogen application rate among varieties in 2021 (the interaction between nitrogen application rate and varieties was significant) (Table 1). Except for the Nanjingxiangnuo with the highest number of panicles in N3 treatment, Nanjing 46, Nanjing 9108, and Nanjing 9308 all had the highest number of panicles under N2 treatment. The number of grains per panicle for Nanjing 9108 and Nanjing 9308 was also the highest in N2 treatment. The seed setting rate of Nanjing 9108 in N2 treatment was the highest, while Nanjing 46, Nanjing 9308, and Nanjingxiangnuo were all the highest in N1 treatment. The correlation analysis showed that the number of panicles and grains per panicle were significantly positively correlated with yield (Table 7), indicating that with the increase of nitrogen application rate, although the seed setting rate and thousand grain weight of the Nanjing series japonica rice varieties showed a downward trend, the significant increase in the number of panicles and grains per panicle ultimately led to an increase in yield. The response of the yield factors to nitrogen application rate in 2022 showed consistent performance among varieties (the interaction between nitrogen application rate and varieties was not significant).
From this, it could be seen that although the N4 treatment with a nitrogen application rate of 450 kg hm-2 had the highest yield in 2021, there was no significant difference compared to the N3 treatment with a nitrogen application rate of 300 kg hm-2. The N3 treatment had the highest number of panicles, and there was no significant difference in the number of grains per panicle, seed setting rate, and thousand grain weight between the N3 treatment and the treatment with the highest values. The N4 treatment with a nitrogen application rate of 300 kg hm-2 in 2022 had the highest yield, the most panicles, the highest seed setting rate, and the highest grain weight per plant. Although the thousand grain weight was the lowest, the differences between treatments were small, and the differences in grain number per panicle between treatments were not significant. Therefore, based on the results of two years, a nitrogen application rate of 300 kg hm-2 was the optimal treatment for the yield and yield components of the tested varieties.
4.2. Excessive Nitrogen Fertilizer Application Could Lead to Poor Gelatinization Characteristics, Increased Protein Content, Decreased Taste Quality of Good Eating Quality japonica rice
There have been many research reports on the relationship between nitrogen nutrition and quality [31-36]. The studies by Xu et al. (2004) [37] and Liu et al. (2004) [38] showed that as the nitrogen application rate increased, the SBV gradually increased, while the PV, HV, FV, and BDV gradually decreased. Li et al. (2012) [39] found that with the increase of nitrogen fertilizer level, the SBV and PaT gradually increase, while the changes in HV, FV and consistency viscosity showed no obvious pattern. Jin et al. (2004) [40] found that with the increase of nitrogen application rate, the PaT tended to increase, but there was no significant difference between the treatment of applying 5g of nitrogen per pot and the treatment without fertilization, which was consistent with the research conclusions of Jin et al. (2001) [41] and Han et al. (1997) [42]. Kou et al. (2003) [43] and Yang et al. (2002) [44] believed that the amount of nitrogen fertilizer used had no significant effect on the PaT. The results of this study indicated that as the nitrogen application rate increased, the brown rice rate increased, while the milled rice rate and head rice rate did not change significantly. The protein content increased, while the appearance, viscosity, and balance of cooked rice decreased, hardness of cooked rice increased, and taste value decreased (Table 3 and Table 4). The PV, BDV, and FV all showed a decreasing trend, while the PeT showed an increasing trend. There were no significant changes in the HV, BDV and PaT (Table 3 and Table 4). And except for the brown rice rate, milled rice rate, head rice rate, and protein content in 2021, and the rice texture traits, taste value, protein content, PV, appearance quality, and gel consistency in 2022, the response trends of other quality traits and RVA values to nitrogen application rate were consistent among varieties (the interaction between nitrogen application rate and varieties was not significant) (Table 1 and Table 2). Correlation analysis showd that taste value was significantly negatively correlated with rice hardness and protein content, and significantly positively correlated with rice appearance, viscosity, and balance (Table 7). This indicated that with the increase of nitrogen application rate, the appearance, viscosity, and balance of cooked rice in the Nanjing series varieties decreased due to the increase of protein content, while hardness increases, ultimately leading to a decrease in taste value.
4.3. Moderate Nitrogen Fertilizer Application Could Synergistically Improve the Yield and Quality of Good Eating Quality japonica Rice
It is generally believed that high yield and high quality of rice are contradictory, and high yield often leads to a decline in quality. The negative correlation between taste value and yield (r=-0.690) and the significant negative correlation between taste value and protein content (r=-0.724) in previous studies and related analysis results in this study all prove this point. The yield increases with the increase of nitrogen application rate, while the taste value decreases with the increase of nitrogen application rate. But as mentioned earlier, the yield will not increase infinitely with the increase of nitrogen application, and the same goes for the quality. Wei et al. (2012) [21] studied high-quality japonica rice Nanjing 46 and set seven nitrogen application levels, including 0, 150, 187.5, 225.0, 262.5, 300, and 337.5 kg hm-2. They found that as the nitrogen application rate increased, the brown rice rate, milled rice rate, and head rice rate of Nanjing 46 showed an increasing trend. However, when the nitrogen application rate reached 262.5 kg hm-2, there was no significant difference compared to the treatments with nitrogen application rates of 300 kg hm-2 and 337.5 kg hm-2. Hu et al. (2018) [23] studied the effects of nitrogen, phosphorus, and potassium application rates on the yield and quality of soft rice variety Nanjing 9108 under straw returning conditions. The results showed that under the condition of full straw returning, the fertilizer application rates of N 270 kg hm-2, P 108 kg hm-2, and K 216 kg hm-2 for mechanical transplanted Nanjing 9108 could better coordinate the relationship between high yield and high quality. Yan et al. (2022) [31] studied the effects of different fertilizer amounts on the yield and quality of Nanjing 46 under the condition of machine transplanted slow mixed fertilization. The results showed that with the increase of fertilizer amount, the rice yield showed a trend of first increasing and then decreasing. Applying pure nitrogen 247.5 kg hm-2 slow mixed fertilizer could achieve the highest yield while maintaining rice quality. Zhang (2021) [45] studied the effects of nitrogen fertilizer on the yield and quality of Nanjing 5055 and Nanjing 46 by setting different nitrogen fertilizer application rates and management methods. The results showed that high yield and high quality could be achieved at a nitrogen fertilizer level of 240-300 kg hm-2.
From the average values and significant differences of yield and yield factors in 2021, except for the number of panicles, the yield and yield factors of N3 treatment were not the highest, but there was no significant difference compared to the highest treatment (N4). From the average values and significant differences of processing quality and taste quality, although N3 was not the treatment with the highest numerical value, there was no significant difference compared to the treatment with the highest numerical value (N1 or N4). From the average values of RVA characteristics and their significant differences, most traits showed no significant differences between N1 and N2 treatments and between N4 and N3 treatments, but significant differences between N1 and N2 treatments and N3 and N4 treatments. Therefore, the treatment with a nitrogen fertilizer application of 300 kg hm-2 (N3) resulted in a yield of 8191 kg hm-2 and a taste value of 87.1 points, which could achieve a synergistic improvement in yield and quality. From this, it could be seen that under the conditions of this experiment, N3 was the optimal treatment that balances yield and quality. However, considering the significant differences in most traits between N2 treatment and N3 treatment, it is worth further studying whether there is a better treatment level between N2 treatment and N3 treatment. So, in 2022, we added 2 treatments between 150 kg hm-2 and 300 kg hm-2, setting 4 treatments of 120 kg hm-2 (N1), 180kg hm-2 (N2), 240 kg hm-2 (N3), and 300 kg hm-2 (N4). The results of 2022 showed that the N4 treatment had the highest yield, with the highest number of panicles, seed setting rate, and grain weight per plant. However, there was no significant difference in yield, panicle number, and grain weight per plant between the N4 treatment and the N3 treatment, nor was there a significant difference in thousand grain weight between the N4 and N3 treatments. The N3 treatment has the highest taste value, which was significantly different from the N4 treatment. The appearance, viscosity, and balance of cooked rice in the N3 treatment were also the best, and the protein content was lower. The PFPN was close to 30 kg/kg. The comprehensive results of two years of the experiments indicated that the optimal nitrogen application rate for the variety used in this experiment was 240-300 kg hm-2, taking into account both yield and quality. This is consistent with the results of Wei et al. (2012) [21], Hu et al. (2018) [23], Yan et al. (2022) [31], and Zhang (2021) [45].
It is worth noting that the interaction between nitrogen application rate and variety for yield factors, processing quality, and rice protein content in 2021, cooking and taste quality, appearance quality, and peak viscosity in 2022 reached a significant level of 5% or 1%, indicating that there were differences in the response of different varieties to nitrogen fertilizer for these traits. The Nanjing series semi glutinous and excellent taste japonica rice varieties could still maintain good quality under higher nitrogen application rates, while Nanjingxiangnuo and Nanjing 5758 showed a marked decline in taste quality due to a significant increase in protein content under higher nitrogen application rates, indicating that these two varieties were more sensitive to excessive nitrogen application and suitable nitrogen application rates would be below 240 kg hm-2. This indicates that when formulating fertilization plans, variety characteristics should be taken into account and targeted fertilization should be implemented. In addition, this study only investigated the effect of nitrogen application rate on rice quality. Future research can further explore the comprehensive effects of nitrogen fertilizer management, nitrogen fertilizer types, and other factors on the yield and quality of southern japonica rice series, in order to improve the high-quality and high-yield cultivation technology system of Nanjing series japonica rice varieties.
5. Conclusions
Increasing nitrogen fertilizer application could increase the number of panicles and grains per panicle, ultimately improving yield. Increasing nitrogen fertilizer application could increase the brown rice yield and protein content, reduce PV, FV, and BDV. Applying nitrogen fertilizer could also led to an increase in hardness of cooked rice, a decrease in the appearance, viscosity and balance of cooked rice, as well as a deterioration in gelatinization characteristics, resulting in a significant decrease in taste value. Under the conditions of this experiment, a nitrogen application rate of 240-300 kg hm-2 could synergistically improve rice yield and quality. However, in actual production, the fertilization plan should be flexibly adjusted based on specific variety characteristics, soil fertility conditions, and climatic conditions to achieve the best balance between yield and quality.
Highlights
1. Increasing nitrogen fertilizer application could improve yield by increasing the number of spikes and grains per panicle;
2. Excessive nitrogen fertilizer application could increase protein content, reduce PV, FV, and BDV, increase hardness of cooked rice, decrease appearance, viscosity and balance of cooked rice, down starch gelatinization characteristics, and ultimately lead to a significant decrease of taste value.
3. Under the conditions of this experiment, a nitrogen application rate of 240-300 kg hm-2 could improve the quality of rice while maintaining high yield in the Nanjing series japonica rice varieties.
Author Contributions
X.W., Q.Z., field experiment, data collection and validation, writing the original draft and revise; C.Z. and L.Z., field experiment and data collection; T.C., Z.Z., K.L., L.H., L.Z., S.H. and Y.L., partial field experiment and data collection; C.W., supervision, funding acquisition, study design, data analysis, interpretation of data and manuscript revision; Y.Z., supervision, project administration and funding acquisition. All authors have read and agreed to the published version of the manuscript.
Funding
This work was supported by the National Key Research and Development Program in China (2022YFE0117800), the Earmarked Fund of China Agriculture Research System (CARS-1–67), the Jiangsu Key Research and Development Program (BE2021301) and Nanjing Major Agricultural Technology Collaborative Promotion Project (2024NJXTG (04)).
Institutional Review Board Statement
Not applicable.
Informed Consent Statement
Not applicable.
Data Availability Statement
The datasets presented in this study are included in the main text; further inquiries can be directed to the corresponding author.
Conflicts of Interest
The authors declare that they have no competing interests.
Abbreviations
| AC | Amylose content |
| ANOVA | Analysis of variance |
| ANUE | Agronomic nitrogen use efficiency |
| BDV | Breakdown viscosity |
| cP | Centipoise |
| CSV | Consistency viscosity |
| FV | Final viscosity |
| GC | Gel consistency |
| GT | Gelatinization temperature |
| HV | Hot viscosity |
| MS | Mean Square |
| PaT | Pasting temperature |
| PC | Protein content |
| PeT | Peak time |
| PFPN | Partial factor productivity of nitrogen |
| PV | Peak viscosity |
| RVA | Rapid Visco-analyzer |
| SBV | Setback viscosity |
| TV | Taste value |
References
- Wang, C.L.; Zhang, Y.D.; Zhu, Z.; Zhao, L.; Chen, T.; Lin, J. Breeding and utilization of new rice variety Nanjing 46 with good eating quality. China Rice, 2008, (3): 38-40. (in Chinese with English abstract).
- Wang, C.L.; Zhang, Y.D.; Zhu, Z.; Yao, S.; Zhao, Q.Y.; Chen, T.; Zhou, L.H.; Zhao, L. Breeding and application of new good eating quality rice variety Nanjing 9108. Jiangsu Agricultural Sciences, 2013, 41, 86–88, (in Chinese with English abstract). [Google Scholar] [CrossRef]
- Zhang, Y.D.; Zhu, Z.; Chen, T.; Zhao, Q.Y.; Feng, K.H.; Yao, S.; Zhou, L.H.; Zhao, L.; Zhao, C.F.; Liang, W.H.; Lu, K.; Wang, C.L. Breeding and characteristics of a new japonica rice variety Nangeng 5718 with good eating quality. China Rice, 2020, 26, 100–102, (in Chinese with English abstract). [Google Scholar] [CrossRef]
- Wang, C.L.; Zhang, Y.D.; Chen, T.; Zhu, Z.; Zhao, Q.Y.; Yao, S.; Zhao, L.; Zhao, C.F.; Zhou, L.H.; Wei, X.D.; Lu, K.; Liang, W.H. Rapid Breeding of New Semi Glutinous japonica Rice Varieties with Good Eating Quality by Sister-crossing. Chinese Journal of Rice Science, 2021, 35, 455–465, (in Chinese with English abstract). [Google Scholar] [CrossRef]
- Zhu, Z.; Zhang, Y.D.; Chen, T.; Zhao, Q.Y.; Zhao, L.; Zhou, L.H.; Yao, S.; Zhao, C.F.; Liang, W.H.; Lu, K.; Wang, C.L. Breeding and characteristics of a new japonica rice variety Nangeng 5758 with good quality and high yield. Jiangsu Agricultural Sciences, 2022, 50, 295–299, (in Chinese with English abstract). [Google Scholar] [CrossRef]
- Wang, C.L. 100 Questions on Key Practical Technologies for Good Taste Rice Industry. Beijing: China Agricultural Publishing House, 2021: 1-5. (in Chinese).
- Wang, C.L.; Zhang, Y. D, Zhao, C.F.; Wei, X.D.; Yao, S.; Zhou, L.H.; Zhu, Z.; Chen, T.; Zhao, Q.Y.; Zhao, L.; Lu. K.; Liang, W.H. Inheritance and breeding of japonica rice with good eating quality in Jiangsu province. Hereditas, 2021, 43, 442–458, (in Chinese with English abstract). [Google Scholar] [CrossRef]
- Lin, X.Q.; Zhu D., F.; Chen, H.Z.; Zhang, Y.P. Effects of plant density and nitrogen application rate on grain yield and nitrogen uptake of super hybrid rice. Rice Science, 2009, 16, 138–142. [Google Scholar] [CrossRef]
- Xie, L.H.; Ye, D.C.; Hu, P.S.; Chen, N.; Tang, S.Q.; Luo, J.; Jiao, G.A. Effects of nitrogen fertilizer application rate and management strategy on grain yield and quality of rice variety “Yong you 6”. Plant Nutrition and Fertilizer Science, 2011, 17, 789–794. [Google Scholar]
- Thu, P.T. T.; Yamakawa, T.; Moe, K. Effect of Nitrogen Application timing on growth, grain yield and eating quality of the KD18 and TH3-3 rice varieties. Journal of the Faculty of Agriculture, Kyushu University, 2014, 59, 55–64. [Google Scholar] [CrossRef]
- Dong, Z.Z.; Wu, L.H.; Chai, J.; Zhu, Y.H.; Chen, Y.L.; Zhu, Y.Z. Effects of nitrogen application rates on rice grain yield, nitrogen-use efficiency, and water quality in paddy field. Communications in Soil Science and Plant Analysis, 2015, 46, 1579–1594. [Google Scholar] [CrossRef]
- Cong, X.H.; Shi, F.Z.; Ruan, X.M.; Luo, Y.X.; Ma, T.C.; Luo, Z.X. Effects of nitrogen fertilizer application rate on nitrogen use efficiency and grain yield and quality of different rice varieties. Chinese journal of applied ecology, 2017, 28, 1219–1226, (in Chinese with English abstract). [Google Scholar] [CrossRef] [PubMed]
- Chen, M.Y.; Li, X.F.; Cheng, J.Q.; Ren, H.R.; Liang, J.; Zhang, H.C.; Huo, Z.Y. Effects of total straw returning and nitrogen application regime on grain yield and quality in mechanical transplanting japonica rice with good taste quality. Acta Agronomica Sinica, 2017, 43, 1802–1816, (in Chinese with English abstract). [Google Scholar] [CrossRef]
- Junior, I.B. M.; Chomsang, K.; Kanayama, T.; Kishimoto, K. Effects of the differences of nitrogen fertilizer and application frequency on the growth, yield and grain quality of rice cultivated by drip irrigation in upland field. Summary of the Crop Science Society of Japan, 2019; 1, 247. [Google Scholar] [CrossRef]
- Chen, Y.L.; Liu, Y.; Dong, S.Q.; Liu, J.G.; Wang, Y.; Hussain, S.; Wei, H.H.; Huo, Z.Y.; Xu, K.; Dai, Q.G. Response of Rice Yield and Grain Quality to Combined Nitrogen Application Rate and Planting Density in Saline Area. Agriculture, 2022, 12, 1788–1788. [Google Scholar] [CrossRef]
- Zhang, L.H.; Shen, C.C.; Zhu, S.B.; Ren, N.N.; Chen, K.; Xu, J.L. Effects of sowing date and nitrogen (N) application rate on grain yield, nitrogen use efficiency and 2-acetyl-1-pyrroline formation in fragrant rice. Agronomy, 2022, 12, 3035–3035. [Google Scholar] [CrossRef]
- Wang, Y.H.; Chen, L.J.; Cui, L.L.; Zhan, S.W.; Song, Y.; Chen, S.A.; Xie, Z.X.; Jiang, Z.W.; Wu, F.X.; Zhuo, C.Y.; Cai, Q.H.; Xie, H.A.; Zhang, J.F. Effects of nitrogen rate on photosynthesis, yield and grain quality of superior quality rice “Fuxiangzhan”. Chinese Journal of Rice Science, 2023, 37, 89–101, (in Chinese with English abstract). [Google Scholar] [CrossRef]
- Yun, Y.; Kim, G.; Cho, G.; Lee, Y.; Yun, T; Kim, H. Effect of nitrogen application methods on yield and grain quality of an extremely early maturing rice variety. Agriculture, 2023, 13 (4). [CrossRef]
- Tanaka R, Nakano H. Grain yield and quality responses to nitrogen application rate and timing in dry direct broadcast seeded rice under different weather conditions[J]. Agrosystems, Geosciences & Environment, 2024, 7(2). [CrossRef]
- Lu, B.; Xu, C.S.; Li, Z.Y.; Tang, X.A.; Yang, F.; Xu, D.Z.; Zhu, G.F.; Zhang, J.; Jiang, Y.; Li, W.W.; Liu, Z.H.; Ding, Y.F.; Li, G.H. Influence of the temperature during grain filling stage and nitrogen application rate on yield and quality of indica hybrid rice. Field Crops Research, 2024, 309. [CrossRef]
- Wei, H.Y.; Zhang, H.C.; Dai, Q.G.; Huo, Z.Y.; Xu, K. Effects of nitrogen application rate on the yield and quality of high-quality japonica rice Nanjing 46. Jiangsu Agricultural Sciences, 2012, 40, 50–52. (in Chinese). [Google Scholar] [CrossRef]
- Yu, X.; Zhao, Q.Y.; Liu, Y.Q.; Zhang, Y.D.; Zhu, Z.; Zhao, L.; Chen, T.; Zhou, L.H.; Yao, S.; Zhao, C.F.; Wang, C.L. Effects of nitrogen application on grain yield and quality of semi-glutinous japonica rice. Southwest China Journal of Agricultural Sciences, 2016, 29, 1633–1638, (in Chinese with English abstract). [Google Scholar] [CrossRef]
- Hu, Y.J.; Qian, H.J.; Wu, P.; Zhu, M.; Xing, Z.P.; Dai, Q.G.; Huo, Z.Y.; Wei, H.Y.; Xu, K.; Zhang H., C. Effects of nitrogen, phosphorus and potassium fertilizer rates on yield and grain quality of soft japonica rice under straw returning condition. Journal of Plant Nutrition and Fertilizers, 2018, 24, 817–824. [Google Scholar] [CrossRef]
- Yan, J.; Shen, Q.R.; Yin, B.; Zhang, S.L.; Zhu, Z.L. Effects of fertilizer n application rate on yields and use efficiencies in rice-wheat rotation system in Tai Lake region. Soils, 2009, 41, 372~376, (in Chinese with English abstract). [Google Scholar] [CrossRef]
- Mo, H.D. Agricultural experiment statistics. Shanghai: Shanghai Science and Technology Press, 1992: pp 151–166. (in Chinese).
- Xu, G.; Fan, X.; Miller, A.J. Plant nitrogen assimilation and use efficiency. Annu Rev Plant Biol, 2012, 63, 153–182. [Google Scholar] [CrossRef] [PubMed]
- Sun, Y.J.; Sun, Y.Y.; Xu, H.; Li, Y.; Yan, F.J.; Jiang, M.J.; Ma, J. Effects of water-nitrogen management patterns on nitrogen utilization characteristics and yield in rice cultivars with different nitrogen use efficiencies. Acta Agronomica Sinica, 2014, 40, 1639–1649, (in Chinese with English abstract). [Google Scholar] [CrossRef]
- Wang, B.F.; Yu, Z.Y.; Cheng, J.P.; Li, Y.; Zhang, Z.S.; Yang, X.L. Research progress of effects of nitrogen on yield and quality of rice. Journal of Huazhong Agricultural University, 2022, 41, 76–83, (in Chinese with English abstract). [Google Scholar] [CrossRef]
- Li, Z.K.; Yan, D.; Xue, Z.Y.; Gu, Y.B.; Li, S.J.; Liu, L.J.; Zhang, H.; Wang, Z.Q.; Yang, J.C.; Gu, J.F. Regulation of plant and development by cytokinins and their applications in rice production. Chinese Journal of Rice Science, 2018, 32, 311–324, (in Chinese with English abstract). [Google Scholar]
- Hu, D.D.; Li, D.M.; Song, H.J.; Liu, K.L.; Hu, Z.H.; Hu, H.W. Application and evaluation of nutrient expert system in double-cropping conventional rice model. Soils and Fertilizers Sciences in China. 2022, (9): 32-38. (in Chinese with English abstract). [CrossRef]
- Yan, K.; Jiang, Y.L.; Tang, J.Y.; Dai, Q.G. Effects of Nitrogen fertilizer rate and transplanting density on yield and grain quality on saline-alkaline land. Soils and Fertilizers Sciences in China, 2018, (2): 67-74. (In Chinese with English abstract).
- Honjo, K. Study on the Protein Content of Rice - Effects of Different Fertilization Conditions on the Protein Content and Total Protein Content of Brown Rice. Japanese Society of Crop Science, 1971, 40, 190–197, (In Japanese with English abstract). [Google Scholar]
- Que, J.H.; Zhang, H.C.; Dai, Q.G.; Huo, Z.Y.; Xu, K. Research progress on the effect of nitrogen fertilizer on rice quality. Jiangsu Journal of Agricultural Sciences, 2002, 06: 14-16. (In Chinese).
- Zhou, P.N.; Feng, W.Z.; Xu, N.X.; Zhang, Y.J.; Su, Z.F. Effects of nitrogen application rate and transplanting density on rice yield and quality. Jiangsu Agricultural Research, 2001, 22, 27–31, (In Chinese with English abstract). [Google Scholar]
- Shi, J.D.; Chen, L.G.; Zheng, S.P.; Dai, W.F.; Qian, X.F. Effect of different nitrogen fertilizer levels and operations on the yield and quality traits of Wuxiangjing 14. Shanghai Agricultural Science and Technology, 2005. 1: 19-20. (In Chinese with English abstract).
- Chen, Y.Y.; Hu, X.X.; Chen, J.D.; Yang, X.; Ma, Q.; Chen, Q.; Ge, M.J.; Dai, Q.G. Effect of nitrogen fertilizer level on the taste quality of early maturing late japonica rice in Jiangsu Province and the differences among varieties. Acta Agronomica Sinica, 2012. 38, 2086-2092. (In Chinese with English abstract).
- Xu, D.Y.; Jing, J.; Hu, S.Y.; Wang, X.H.; Gao, Y.; Zhu, Q.S. Effect of nitrogen, phosphorus, and potassium fertilizer application on the amylose content and starch viscosity characteristics of rice. Chinese Agricultural Science Bulletin, 2004, 5: 99-102. (In Chinese with English abstract).
- Liu, J.; Wei, Y.F.; Xia, L.R.; Wu, K.; Xu, S.A. Effect of different nitrogen fertilizer levels on rice quality and starch RVA profile characteristics. Journal of Jinling Institute of Technology, 2004, 20, 34–38, (In Chinese with English abstract). [Google Scholar]
- Li, M.; Zhang, H.C.; Li, G.Y. Ma, Q.; Yang, X.; Wei, H.Y. Effects of growth types and nitrogen application levels on the starch RVA profile characteristics of japonica rice. Acta Agronomica Sinica, 2012, 38, 293–300, (In Chinese with English abstract). [Google Scholar] [CrossRef]
- Jing, J.; Xu, D.Y.; Cai, Y.X.; HU, S.Y.; Ge, M.; Zhu, Q.S. Effect of nitrogen application rate on the main rice quality traits and RVA spectrum characteristic parameters of rice. Acta Agronomica Sinica, 2004, 30, 154–158, (In Chinese with English abstract). [Google Scholar]
- Jing, Z.X.; Qiu, T.Q.; Sun, Y.L.; Zhao, J.M.; Jin X. Y. Effect of nitrogen fertilizer on the chalkiness and cooking quality characteristics of rice. Plant Nutrition and Fertilizer Science, 2001. 7, 31-35. (in Chinese with English abstract).
- Han, C.L.; Hou, S.G.; Liu, X.P.; Wei, S.H.; Zou, J.B. Study on the effect and quantitative relationship of cultivation techniques on rice quality. Liaoning Journal of Agricultural Sciences, 1997, 18, 18–21. (in Chinese). [Google Scholar]
- Kou, H.P.; Wang, B L.; Wang, S.; Lv, J.; Zhang, C. Effect of water treatment on the cooking quality of northern japonica rice under different nitrogen levels. Journal of Jilin Agricultural University, 25, 481-484. (In Chinese with English abstract).
- Yang, Z.M.; Wang, W.J.; Cai, M.L.; Chen, G.X.; Lu, B.L.; Zhu, Y.G. Effect of nitrogen fertilizer application time and amount on rice quality. Journal of Huazhong Agricultural University, 2002. 21, 429-434. (In Chinese with English abstract).
- Zhang, Q. Characteristics of japonica rice with good taste and high yield in the Taihu Lake area and its nitrogen fertilizer management (Ph.D. thesis). Yangzhou University, Yangzhou, China, 2021. (In Chinese with English abstract). [CrossRef]
Figure 1.
Average temperature during the rice growth period in the experimental area from 2021 to 2022.
Figure 1.
Average temperature during the rice growth period in the experimental area from 2021 to 2022.
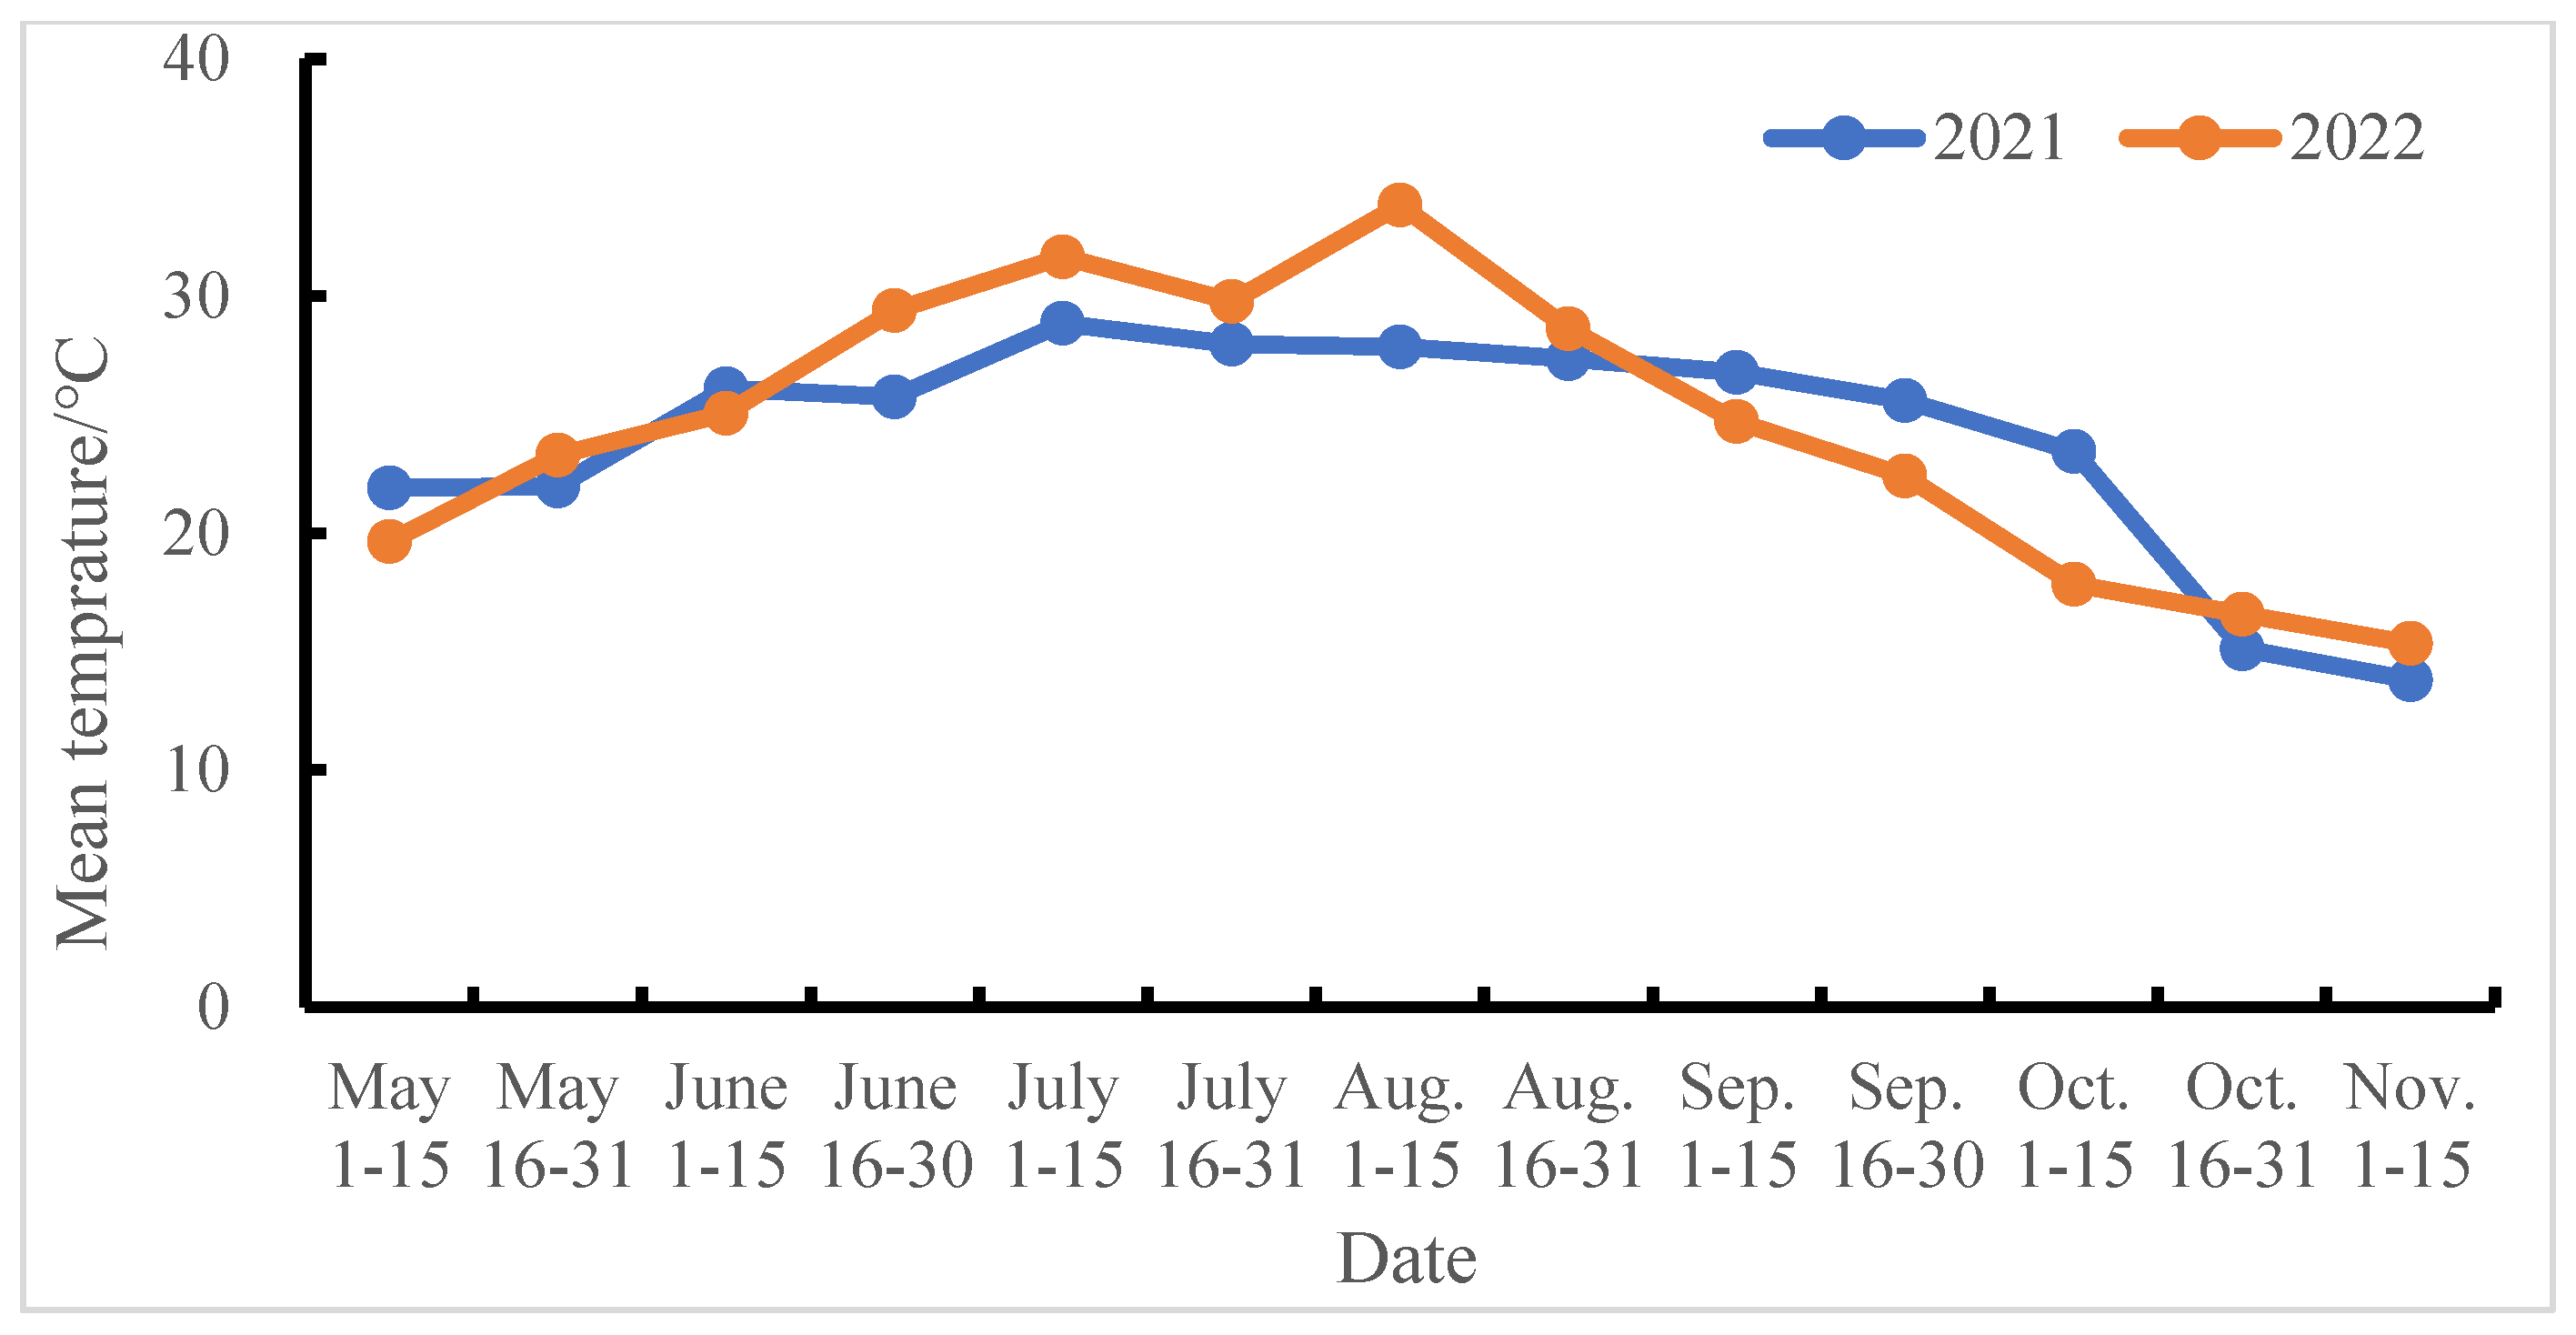
Figure 2.
Response of different traits to nitrogen application levels in 2021 and 2022. PN=panicle number per plant, SP=spikelets per panicle, SSR=seed setting rate, TGW=1000-grain weight, GW=grain weight per plant, GY=grain yield, BR=brawn rice percentage, MR=milled rice percentage, HR=head rice percentage, AP= appearance of cooked rice, HA=hardness of cooked rice, ST=stickiness of cooked rice, BA=balance of cooked rice, TV=taste value, PC= protein content, PV=peak viscosity, HV=hot viscosity, BDV=breakdown viscosity, FV=final viscosity, SBV=setback viscosity, PeT=peak time and PaT=pasting temperature, ANUE=agronomic nitrogen use efficiency, PFPN=partial factor productivity of nitrogen.
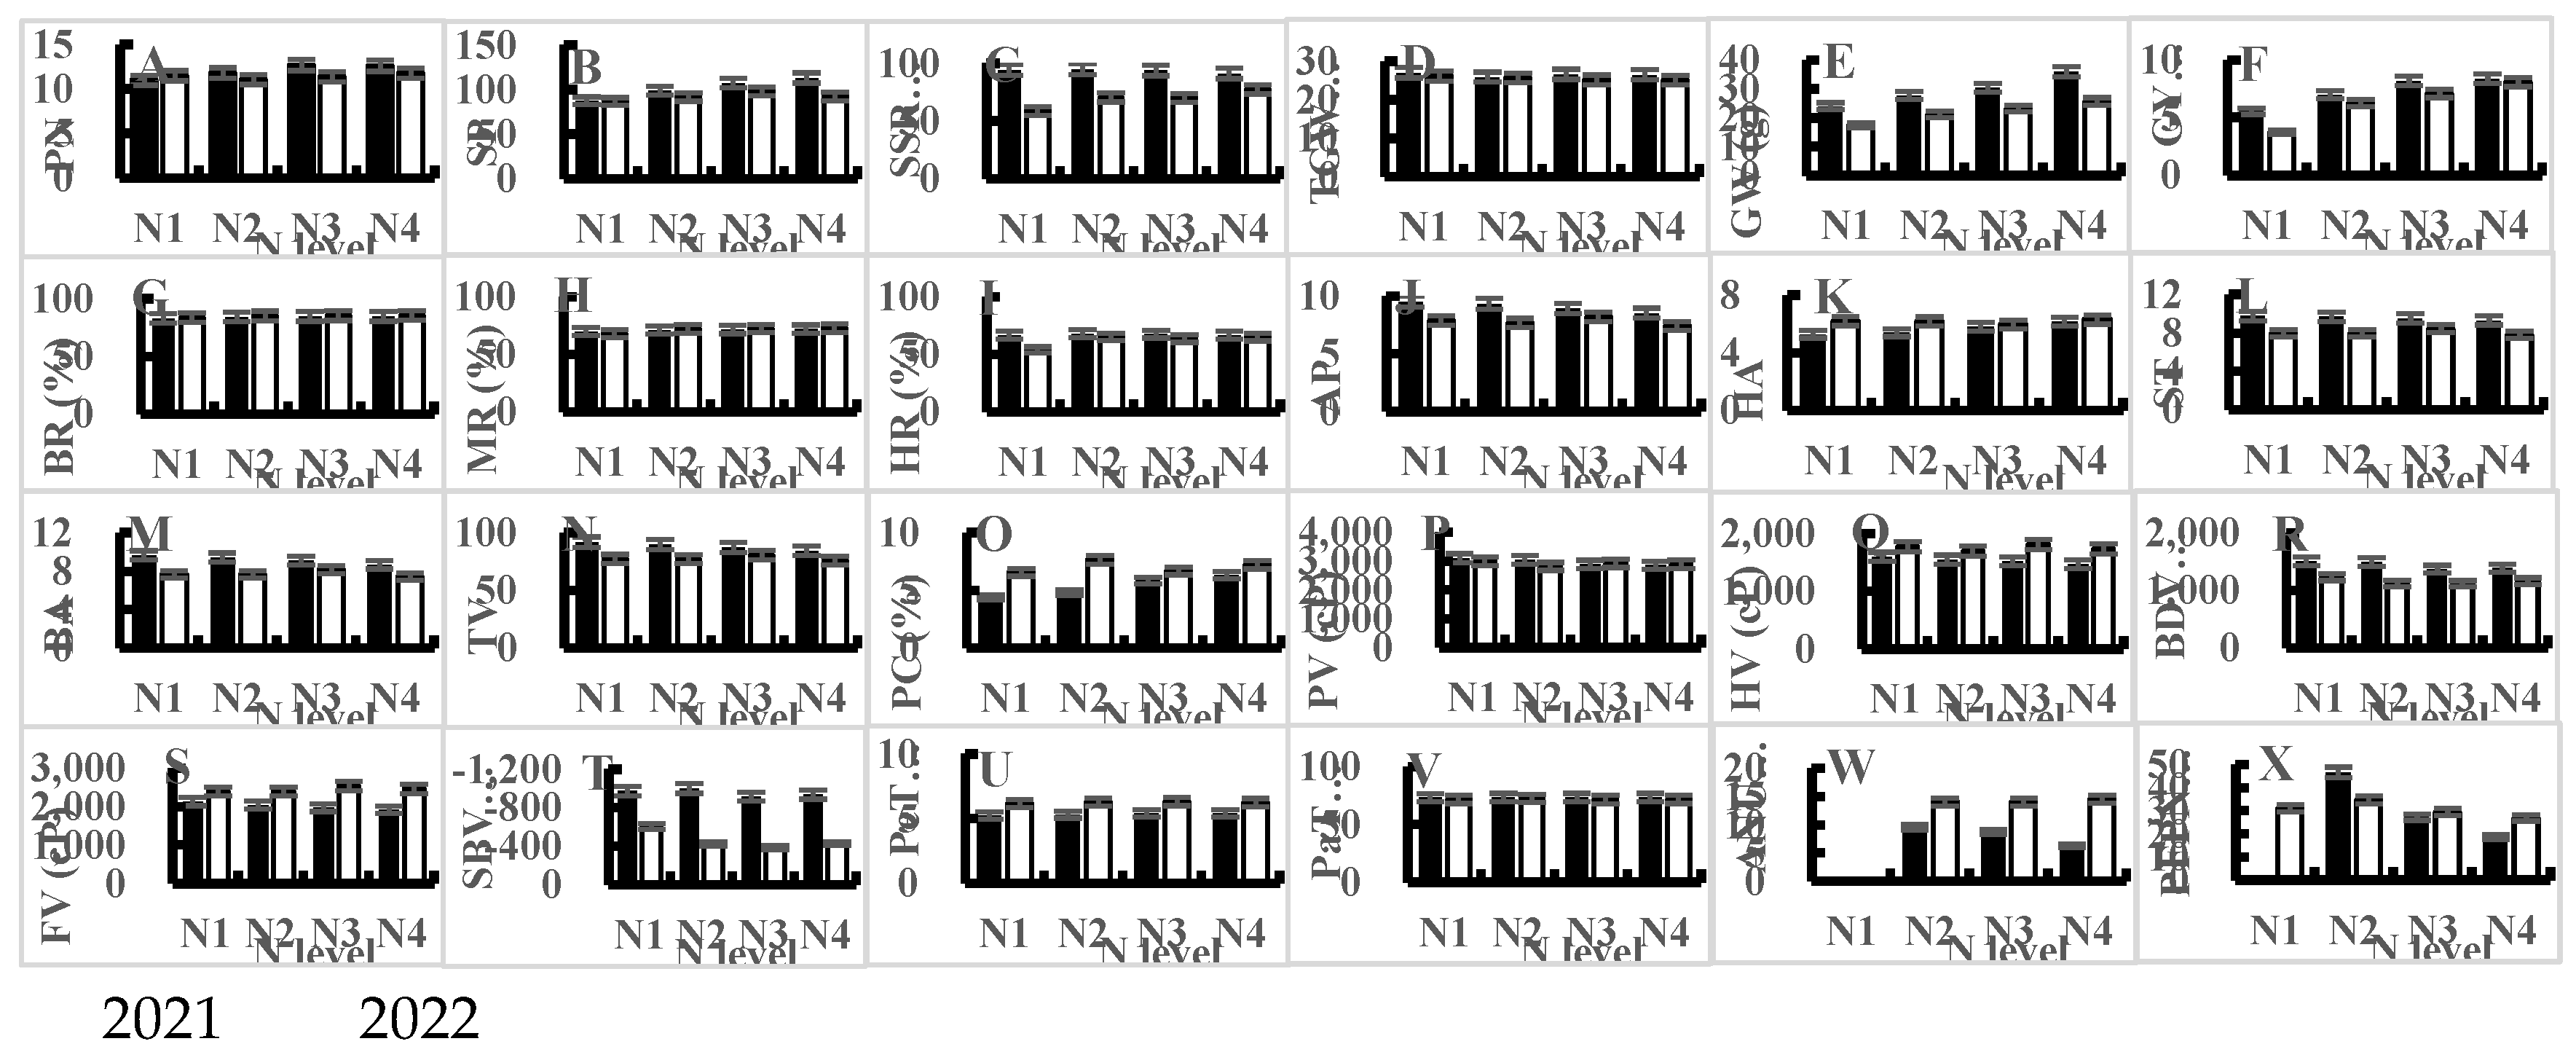

Table 1.
Trait means for tested varieties at different nitrogen levels in 2021.
| N level | Variety | PN | SP | SSR (%) | TGW (g) | GW (g) | GY (t/hm2) | BR(%) | MR (%) | HR (%) | AP | HA | ST | BA | TV | PC (%) | PV (cP) | HV (cP) | BDV (cP) | FV (cP) | SBV (cP) | PeT (min) | PaT (℃) |
|---|---|---|---|---|---|---|---|---|---|---|---|---|---|---|---|---|---|---|---|---|---|---|---|
| N1 | Nanjing46 | 10.5 | 72.2 | 93.8 | 28.7 | 23.5 | 5.2 | 84.4 | 71.9 | 70.3 | 9.5 | 5.5 | 9.8 | 9.7 | 91.4 | 3.9 | 3203 | 1666 | 1537 | 2228 | -975 | 5.8 | 73.0 |
| Nanjing9108 | 9.7 | 100.2 | 95.3 | 25.7 | 23.0 | 5.9 | 82.2 | 67.0 | 63.4 | 9.7 | 5.1 | 9.8 | 9.8 | 92.4 | 4.5 | 3406 | 1815 | 1591 | 2502 | -904 | 5.6 | 74.3 | |
| Nanjing9308 | 12.3 | 79.5 | 95.7 | 25.7 | 22.5 | 5.4 | 81.6 | 69.0 | 66.9 | 9.2 | 5.5 | 9.6 | 9.4 | 89.1 | 4.5 | 3682 | 2109 | 1573 | 2796 | -886 | 5.8 | 75.0 | |
| Nanjingxiangnuo | 11.4 | 98.7 | 92.8 | 27.8 | 27.2 | 5.7 | 83.1 | 71.4 | 66.0 | 9.8 | 5.1 | 9.8 | 9.8 | 94.6 | 4.7 | 2127 | 804 | 1323 | 999 | -1127 | 3.7 | 71.0 | |
| N2 | Nanjing46 | 12.0 | 99.2 | 95.9 | 26.1 | 31.0 | 6.1 | 85.7 | 73.5 | 71.6 | 9.6 | 5.1 | 9.8 | 9.6 | 91.6 | 4.1 | 3103 | 1554 | 1548 | 2091 | -1012 | 5.8 | 73.6 |
| Nanjing9108 | 11.2 | 91.3 | 93.1 | 25.7 | 22.7 | 7.4 | 83.3 | 66.8 | 63.4 | 9.5 | 5.3 | 9.8 | 9.7 | 90.8 | 5.0 | 3339 | 1832 | 1506 | 2426 | -913 | 5.8 | 74.9 | |
| Nanjing9308 | 12.7 | 99.7 | 95.4 | 25.7 | 30.4 | 6.7 | 83.7 | 71.9 | 67.8 | 8.7 | 5.7 | 9.4 | 8.9 | 85.9 | 4.9 | 3507 | 1920 | 1586 | 2540 | -966 | 5.8 | 74.1 | |
| Nanjingxiangnuo | 11.3 | 105.0 | 95.9 | 26.1 | 27.3 | 7.8 | 83.9 | 71.8 | 69.0 | 9.6 | 5.5 | 9.8 | 9.5 | 90.3 | 5.4 | 2204 | 885 | 1319 | 1100 | -1104 | 3.7 | 70.9 | |
| N3 | Nanjing46 | 12.7 | 110.8 | 88.8 | 26.2 | 33.6 | 7.8 | 84.7 | 71.7 | 68.6 | 9.3 | 5.5 | 9.7 | 9.6 | 90.4 | 5.6 | 2956 | 1688 | 1268 | 2195 | -761 | 6.0 | 74.2 |
| Nanjing9108 | 12.6 | 108.0 | 96.6 | 26.7 | 27.0 | 8.8 | 84.6 | 70.4 | 66.1 | 8.7 | 5.9 | 9.4 | 8.9 | 86.0 | 5.6 | 3140 | 1724 | 1415 | 2281 | -859 | 5.8 | 74.2 | |
| Nanjing9308 | 13.3 | 111.9 | 95.1 | 24.8 | 32.1 | 8.4 | 85.0 | 72.3 | 67.1 | 8.4 | 6.2 | 9.3 | 8.6 | 83.7 | 6.0 | 3355 | 1917 | 1438 | 2475 | -880 | 6.0 | 74.1 | |
| Nanjingxiangnuo | 12.2 | 99.6 | 95.3 | 28.7 | 29.0 | 7.8 | 84.3 | 72.1 | 68.3 | 9.3 | 5.7 | 9.7 | 9.2 | 88.3 | 6.3 | 2095 | 750 | 1345 | 929 | -1166 | 3.7 | 71.5 | |
| N4 | Nanjing46 | 12.2 | 132.5 | 86.1 | 26.7 | 35.6 | 7.9 | 83.9 | 70.1 | 64.9 | 8.2 | 6.5 | 9.0 | 8.3 | 82.1 | 6.5 | 2977 | 1636 | 1341 | 2150 | -827 | 6.0 | 73.7 |
| Nanjing9108 | 12.3 | 93.9 | 92.6 | 25.1 | 26.4 | 8.9 | 85.1 | 73.3 | 70.6 | 8.9 | 5.8 | 9.6 | 9.1 | 87.2 | 5.8 | 3161 | 1726 | 1436 | 2297 | -865 | 5.8 | 74.1 | |
| Nanjing9308 | 11.8 | 108.3 | 92.0 | 25.4 | 33.7 | 8.4 | 85.2 | 72.9 | 64.8 | 8.3 | 6.3 | 9.1 | 8.5 | 82.9 | 5.9 | 3258 | 1799 | 1459 | 2342 | -916 | 6.0 | 74.4 | |
| Nanjingxiangnuo | 14.1 | 117.7 | 94.3 | 28.7 | 48.2 | 8.4 | 84.7 | 71.9 | 66.5 | 8.8 | 6.1 | 9.4 | 8.8 | 85.0 | 7.1 | 2023 | 713 | 1310 | 890 | -1133 | 3.7 | 71.8 | |
| ANOVA | N level (N) | ** | ** | ** | ** | ** | ** | ** | NS | NS | ** | ** | ** | ** | ** | ** | ** | NS | ** | ** | NS | ** | NS |
| Variety (V) | ** | NS | ** | ** | ** | ** | ** | * | ** | ** | NS | * | ** | ** | ** | ** | ** | ** | ** | ** | ** | ** | |
| N×V | ** | ** | ** | ** | * | NS | ** | * | ** | NS | NS | NS | NS | NS | ** | NS | NS | NS | NS | NS | NS | NS |
*, **: Significant at 5% or 1% levels, respectively, NS: not significant. PN=panicle number per plant, SP=spikelets per panicle, SSR=seed setting rate, TGW=1000-grain weight, GW=grain weight per plant, GY=grain yield, BR=brawn rice percentage, MR=milled rice percentage, HR=head rice percentage, AP=appearance of cooked rice, HA=hardness of cooked rice, ST=stickiness of cooked rice, BA=balance of cooked rice, TV=taste value, PC= protein content, PV=peak viscosity, HV=hot viscosity, BDV=breakdown viscosity, FV=final viscosity, SBV=setback viscosity, PeT=peak time and PaT=pasting temperature.
Table 2.
Trait means for tested varieties at different nitrogen levels in 2022.
| N level | Variety | PN | SP | SSR (%) | TGW (g) | GW (g) | GY (t/hm2) | BR (%) | MR (%) | HR (%) | AP | HA | ST | BA | TV | PC (%) | PV (cP) | HV (cP) | BDV (cP) | FV (cP) | SBV (cP) | PeT (min) | PaT (℃) | CG (%) | CD (%) | AC (%) | GC (mm) |
|---|---|---|---|---|---|---|---|---|---|---|---|---|---|---|---|---|---|---|---|---|---|---|---|---|---|---|---|
| N1 | Nanjing9108 | 12.7 | 75.7 | 57.2 | 24.6 | 16.3 | 3.3 | 83.5 | 69.3 | 49.3 | 8.4 | 5.9 | 8.8 | 8.4 | 82.0 | 6.5 | 2786 | 1630 | 1156 | 2304 | -482 | 6.1 | 72.5 | 60.0 | 12.9 | 9.5 | 85.3 |
| Nanjing5718 | 9.8 | 89.8 | 52.6 | 29.8 | 14.7 | 3.0 | 84.1 | 68.2 | 58.9 | 6.4 | 6.9 | 6.3 | 6.0 | 66.5 | 7.4 | 3395 | 1749 | 1645 | 2167 | -1227 | 6.0 | 69.6 | 26.6 | 7.0 | 11.3 | 85.3 | |
| Nanjing5818 | 11.7 | 90.0 | 59.2 | 25.3 | 16.8 | 3.3 | 82.5 | 65.2 | 54.4 | 8.2 | 6.1 | 7.7 | 7.7 | 77.4 | 6.5 | 2630 | 1526 | 1104 | 2141 | -489 | 6.1 | 73.3 | 20.8 | 4.6 | 11.6 | 75.0 | |
| Nanjing5758 | 11.8 | 91.5 | 65.8 | 25.0 | 22.3 | 5.4 | 83.8 | 68.9 | 53.0 | 8.6 | 5.9 | 9.0 | 8.6 | 83.8 | 5.8 | 3184 | 2165 | 1019 | 2963 | -221 | 6.5 | 72.0 | 16.9 | 2.5 | 19.4 | 80.7 | |
| N2 | Nanjing9108 | 12.7 | 87.1 | 64.9 | 24.2 | 20.8 | 5.8 | 84.9 | 72.9 | 65.1 | 8.9 | 5.6 | 9.4 | 9.0 | 86.3 | 7.4 | 2502 | 1380 | 1123 | 2002 | -500 | 6.0 | 72.2 | 34.0 | 6.1 | 9.0 | 79.3 |
| Nanjing5718 | 9.9 | 92.3 | 69.1 | 29.2 | 19.8 | 6.1 | 84.7 | 72.0 | 67.4 | 6.4 | 6.8 | 6.5 | 6.2 | 67.8 | 7.8 | 2964 | 1594 | 1371 | 2135 | -829 | 6.1 | 73.2 | 86.4 | 37.9 | 11.3 | 79.0 | |
| Nanjing5818 | 11.1 | 90.1 | 65.1 | 25.0 | 20.2 | 6.8 | 85.4 | 72.0 | 66.1 | 8.1 | 5.9 | 7.9 | 7.9 | 78.9 | 7.3 | 2972 | 1717 | 1255 | 2357 | -615 | 6.2 | 73.6 | 78.8 | 29.6 | 13.0 | 92.0 | |
| Nanjing5758 | 10.4 | 96.7 | 82.7 | 24.2 | 24.0 | 6.4 | 85.5 | 71.4 | 62.0 | 7.3 | 6.4 | 8.1 | 7.5 | 76.0 | 8.1 | 2823 | 2091 | 731.3 | 3087 | 264.7 | 6.8 | 71.7 | 15.0 | 2.6 | 19.1 | 71.7 | |
| N3 | Nanjing9108 | 12.0 | 104.2 | 65.7 | 23.7 | 23.3 | 6.0 | 84.9 | 73.4 | 65.1 | 9.0 | 5.5 | 9.4 | 9.1 | 87.4 | 6.5 | 2501 | 1557 | 943.7 | 2262 | -239 | 6.2 | 69.6 | 40.2 | 7.0 | 9.6 | 51.0 |
| Nanjing5718 | 9.9 | 111.8 | 65.5 | 28.3 | 21.7 | 7.1 | 85.3 | 71.9 | 64.6 | 7.2 | 6.5 | 7.3 | 7.0 | 72.9 | 7.5 | 3287 | 1886 | 1400 | 2456 | -830 | 6.2 | 72.7 | 73.5 | 31.7 | 11.3 | 89.7 | |
| Nanjing5818 | 11.2 | 86.6 | 78.3 | 24.6 | 25.0 | 7.6 | 86.0 | 73.0 | 67.0 | 8.6 | 5.7 | 8.5 | 8.5 | 82.3 | 6.6 | 3067 | 1740 | 1326 | 2393 | -674 | 6.1 | 73.1 | 56.2 | 20.2 | 13.2 | 83.7 | |
| Nanjing5758 | 12.4 | 89.4 | 70.9 | 24.1 | 22.9 | 7.7 | 85.4 | 71.7 | 57.9 | 7.9 | 6.1 | 8.5 | 8.0 | 79.5 | 6.2 | 2843 | 2053 | 790.3 | 3049 | 205.7 | 6.7 | 71.5 | 17.2 | 3.4 | 19.0 | 74.0 | |
| N4 | Nanjing9108 | 12.3 | 107.4 | 78.4 | 24.4 | 29.9 | 7.7 | 84.5 | 73.6 | 67.8 | 8.7 | 5.7 | 9.2 | 8.8 | 85.1 | 6.6 | 2841 | 1562 | 1278 | 2191 | -650 | 6.0 | 70.6 | 37.3 | 6.2 | 9.4 | 71.0 |
| Nanjing5718 | 10.3 | 93.7 | 79.4 | 28.4 | 24.2 | 8.4 | 86.0 | 73.1 | 68.6 | 6.7 | 6.6 | 6.9 | 6.6 | 69.9 | 7.6 | 3255 | 1820 | 1435 | 2394 | -861 | 6.1 | 72.5 | 89.4 | 39.8 | 11.0 | 79.7 | |
| Nanjing5818 | 13.0 | 92.1 | 75.1 | 24.5 | 25.3 | 8.2 | 85.9 | 73.2 | 66.8 | 8.2 | 6.0 | 8.0 | 8.0 | 79.1 | 7.6 | 2847 | 1714 | 1133 | 2361 | -487 | 6.2 | 73.0 | 72.9 | 29.2 | 11.4 | 84.0 | |
| Nanjing5758 | 11.5 | 76.0 | 76.6 | 23.2 | 23.7 | 8.1 | 85.4 | 71.3 | 56.6 | 6.2 | 6.9 | 7.2 | 6.4 | 68.8 | 7.1 | 2628 | 1827 | 801 | 2921 | 292.3 | 6.6 | 70.9 | 15.5 | 3.7 | 18.7 | 72.3 | |
| ANOVA | N level (N) | NS | NS | ** | ** | ** | ** | ** | ** | ** | ** | ** | * | ** | ** | ** | NS | NS | NS | NS | NS | NS | NS | ** | ** | NS | ** |
| Variety (V) | ** | NS | NS | ** | NS | ** | NS | NS | ** | ** | ** | ** | ** | ** | ** | ** | ** | ** | ** | ** | ** | NS | ** | ** | ** | ** | |
| N×V | NS | NS | NS | NS | NS | NS | NS | NS | NS | ** | ** | ** | ** | ** | ** | * | NS | NS | NS | NS | NS | NS | ** | ** | NS | ** |
*, **: Significant at 5% or 1% levels, respectively, NS: not significant. PN=panicle number per plant, SP=spikelets per panicle, SSR=seed setting rate, TGW=1000-grain weight, GW=grain weight per plant, GY=grain yield, BR=brawn rice percentage, MR=milled rice percentage, HR=head rice percentage, AP= appearance of cooked rice, HA=hardness of cooked rice, ST=stickiness of cooked rice, BA=balance of cooked rice, TV=taste value, PC= protein content, PV=peak viscosity, HV=hot viscosity, BDV=breakdown viscosity, FV=final viscosity, SBV=setback viscosity, PeT=peak time and PaT=pasting temperature, CG=chalky grain percentage, CD=chalkiness degree, AC=amylose content, GC=gel consistency.
Table 3.
Means for tested traits at different nitrogen levels in 2021.
| N level | PN | SP | SSR (%) | TGW (g) | GW (g) | GY (t/hm2) | BR (%) | MR (%) | HR (%) | AP | HA | ST | BA | TV | PC (%) | PV (cP) | HV (cP) | BDV (cP) | FV (cP) | SBV (cP) | PeT (min) | PaT (℃) | ANUE (kg/kg) | PFPN (kg/kg) |
|---|---|---|---|---|---|---|---|---|---|---|---|---|---|---|---|---|---|---|---|---|---|---|---|---|
| N1 | 11.0±1.2 | 87.7±13.9 | 94.4±1.3 | 27.0±1.5 | 24.1±2.2 | 5.6±0.3 | 82.8±1.2 | 69.8±2.3 | 66.6±2.9 | 9.5±0.3 | 5.3±0.2 | 9.8±0.1 | 9.7±0.2 | 91.9±2.3 | 4.4±0.3 | 3104±681 | 1598±561 | 1506±124 | 2131±789 | -973±110 | 5.2±1.0 | 73.3±1.8 | — | — |
| N2 | 11.8±0.7 | 98.8±5.7 | 95.1±1.3 | 25.9±0.3 | 27.8±3.8 | 7.0±0.7 | 84.2±1.1 | 71.0±2.9 | 68.0±3.4 | 9.3±0.4 | 5.4±0.3 | 9.7±0.2 | 9.4±0.4 | 89.6±2.5 | 4.8±0.5 | 3038±580 | 1548±469 | 1490±118 | 2039±655 | -999±81 | 5.3±1.1 | 73.4±1.7 | 9.5±3.2 | 46.7±4.9 |
| N3 | 12.7±0.5 | 107.6±5.6 | 93.9±3.5 | 26.6±1.6 | 30.4±3.0 | 8.2±0.5 | 84.6±0.3 | 71.6±0.9 | 67.5±1.2 | 8.9±0.5 | 5.8±0.3 | 9.5±0.2 | 9.1±0.4 | 87.1±2.9 | 5.9±0.3 | 2886±552 | 1520±523 | 1367±77 | 1970±704 | -916±174 | 5.4±1.1 | 73.5±1.3 | 8.7±1.3 | 27.3±1.6 |
| N4 | 12.6±1.0 | 113.1±16.2 | 91.3±3.6 | 26.5±1.7 | 36.0±9.1 | 8.4±0.4 | 84.8±0.6 | 72.0±1.4 | 66.7±2.7 | 8.5±0.4 | 6.2±0.3 | 9.3±0.3 | 8.7±0.3 | 84.3±2.3 | 6.3±0.6 | 2855±567 | 1468±508 | 1387±72 | 1920±691 | -935±137 | 5.4±1.1 | 73.5±1.2 | 6.3±0.4 | 18.7±0.9 |
PN=panicle number per plant, SP=spikelets per panicle, SSR=seed setting rate, TGW=1000-grain weight, GW=grain weight per plant, GY=grain yield, BR=brawn rice percentage, MR=milled rice percentage, HR=head rice percentage, AP= appearance of cooked rice, HA=hardness of cooked rice, ST=stickiness of cooked rice, BA=balance of cooked rice, TV=taste value, PC= protein content, PV=peak viscosity, HV=hot viscosity, BDV=breakdown viscosity, FV=final viscosity, SBV=setback viscosity, PeT=peak time and PaT=pasting temperature, ANUE=agronomic nitrogen use efficiency, PFPN=partial factor productivity of nitrogen.
Table 4.
Means for tested traits at different nitrogen levels in 2022.
| N level | PN | SP | SSR (%) | TGW (g) | GW (g) | GY (t/hm2) | BR (%) | MR (%) | HR (%) | AP | HA | ST | BA | TV | PC (%) | PV (cP) | HV (cP) | BDV (cP) | FV (cP) | SBV (cP) | PeT (min) | PaT (℃) | CG (%) | CD (%) | AC (%) | GC (mm) | PFPN (kg/kg) |
|---|---|---|---|---|---|---|---|---|---|---|---|---|---|---|---|---|---|---|---|---|---|---|---|---|---|---|---|
| N1 | 11.5±1.2 | 86.7±7.4 | 58.7±5.5 | 26.1±2.4 | 17.5±3.3 | 3.7±0.3 | 83.5±0.7 | 67.9±1.8 | 53.9±4.0 | 7.9±1.0 | 6.2±0.5 | 8.0±1.2 | 7.7±1.2 | 77.4±7.8 | 6.6±0.7 | 2999±352 | 1768±281 | 1231±282 | 2394±386 | -605±433 | 6.2±0.3 | 71.9±1.6 | 31.1±19.7 | 6.8±4.5 | 13.0±4.4 | 81.6±4.9 | 31.1±9.3 |
| N2 | 11.1±1.2 | 91.5±4.1 | 70.5±8.4 | 25.6±2.4 | 21.2±1.9 | 6.3±0.7 | 85.1±0.4 | 72.1±0.6 | 65.2±2.3 | 7.7±1.1 | 6.2±0.5 | 8.0±1.2 | 7.7±1.1 | 77.2±7.7 | 7.6±0.3 | 2815±220 | 1695±298 | 1120±278 | 2395±484 | -420±476 | 6.3±0.3 | 72.7±0.9 | 53.6±34.6 | 19.0±17.4 | 13.1±4.3 | 80.5±8.4 | 34.8±2.3 |
| N3 | 11.4±1.1 | 98.0±12.0 | 70.1±6.0 | 25.2±2.1 | 23.2±1.3 | 7.1±0.5 | 85.4±0.4 | 72.5±0.8 | 63.7±4.0 | 8.2±0.8 | 6.0±0.4 | 8.5±0.9 | 8.2±0.9 | 80.5±6.0 | 6.7±0.6 | 2924±335 | 1809±211 | 1115±295 | 2540±349 | -384±466 | 6.3±0.3 | 71.7±1.6 | 46.8±23.9 | 15.6±13.0 | 13.3±4.1 | 74.6±17.0 | 29.6±3.2 |
| N4 | 11.8±1.1 | 92.3±12.9 | 77.3±1.9 | 25.1±2.3 | 25.7±2.8 | 8.1±0.4 | 85.4±0.7 | 72.8±1.0 | 65.0±5.6 | 7.4±1.2 | 6.3±0.6 | 7.8±1.0 | 7.4±1.1 | 75.7±7.8 | 7.2±0.5 | 2893±262 | 1731±124 | 1162±270 | 2467±316 | -426±503 | 6.2±0.2 | 71.8±1.2 | 53.8±33.5 | 19.7±17.6 | 12.6±4.2 | 76.8±6.2 | 27.0±1.0 |
PN=panicle number per plant, SP=spikelets per panicle, SSR=seed setting rate, TGW=1000-grain weight, GW=grain weight per plant, GY=grain yield, BR=brawn rice percentage, MR=milled rice percentage, HR=head rice percentage, AP= appearance of cooked rice, HA=hardness of cooked rice, ST=stickiness of cooked rice, BA=balance of cooked rice, TV=taste value, PC= protein content, PV=peak viscosity, HV=hot viscosity, BDV=breakdown viscosity, FV=final viscosity, SBV=setback viscosity, PeT=peak time and PaT=pasting temperature, CG=chalky grain percentage, CD=chalkiness degree, AC=amylose content, GC=gel consistency, PFPN=partial factor productivity of nitrogen.
Table 5.
Correlation coefficients between different traits.
| Character | PN | SP | SSR (%) | TGW (g) | GW (g) | GY (t/hm2) | BR (%) | MR (%) | HR (%) | AP | HA | ST | BA | TV | PC (%) | PV (cP) | HV (cP) | BDV (cP) | FV (cP) | SBV (cP) | PeT (min) | PaT (℃) |
|---|---|---|---|---|---|---|---|---|---|---|---|---|---|---|---|---|---|---|---|---|---|---|
| PN | -0.264 | -0.002 | -0.772** | 0.242 | 0.060 | -0.144 | 0.115 | -0.237 | 0.727** | -0.713** | 0.767** | 0.762** | 0.760** | -0.526* | -0.653** | -0.269 | -0.470 | -0.027 | 0.395 | 0.043 | -0.006 | |
| SP | 0.470 | 0.173 | 0.243 | 0.415 | 0.242 | 0.141 | 0.334 | 0.538* | 0.140 | -0.170 | 0.095 | 0.124 | 0.135 | 0.144 | 0.219 | 0.040 | 0.200 | -0.124 | -0.241 | -0.078 | -0.185 | |
| SSR (%) | -0.039 | -0.471 | -0.306 | 0.866** | 0.838** | 0.703** | 0.643** | 0.510* | -0.079 | 0.014 | 0.085 | 0.027 | 0.014 | 0.240 | -0.072 | 0.303 | -0.335 | 0.431 | 0.401 | 0.427 | 0.086 | |
| TGW (g) | 0.018 | -0.077 | 0.014 | -0.413 | -0.221 | -0.059 | -0.166 | 0.223 | -0.622* | 0.618* | -0.764** | -0.711** | -0.699** | 0.441 | 0.746** | -0.001 | 0.800** | -0.354 | -0.767** | -0.449 | 0.078 | |
| GW (g) | 0.722** | 0.720** | -0.298 | 0.268 | 0.846** | 0.598* | 0.738** | 0.548* | 0.229 | -0.294 | 0.373 | 0.327 | 0.325 | -0.032 | -0.122 | 0.173 | -0.278 | 0.286 | 0.313 | 0.285 | -0.101 | |
| GY (t/hm2) | 0.565* | 0.641** | -0.204 | -0.216 | 0.484 | 0.850** | 0.800** | 0.622* | -0.082 | -0.009 | 0.039 | 0.007 | 0.001 | 0.192 | 0.014 | 0.246 | -0.194 | 0.336 | 0.268 | 0.329 | 0.112 | |
| BR (%) | 0.426 | 0.330 | -0.118 | 0.031 | 0.500* | 0.576* | 0.819** | 0.664** | -0.198 | 0.105 | -0.092 | -0.120 | -0.127 | 0.448 | 0.154 | 0.274 | -0.067 | 0.296 | 0.144 | 0.286 | 0.054 | |
| MR (%) | 0.466 | 0.135 | 0.012 | 0.131 | 0.434 | 0.300 | 0.782** | 0.779** | 0.123 | -0.233 | 0.246 | 0.216 | 0.224 | 0.292 | -0.089 | -0.086 | -0.022 | -0.016 | 0.044 | 0.041 | -0.062 | |
| HR (%) | 0.176 | -0.310 | 0.198 | 0.145 | -0.001 | -0.079 | 0.511* | 0.737** | -0.022 | -0.079 | -0.098 | -0.037 | -0.025 | 0.529* | 0.115 | -0.273 | 0.355 | -0.349 | -0.360 | -0.295 | 0.100 | |
| AP | -0.599* | -0.564* | 0.329 | 0.269 | -0.505* | -0.631** | -0.363 | -0.266 | 0.200 | -0.990** | 0.915** | 0.979** | 0.977** | -0.565* | -0.440 | -0.276 | -0.237 | -0.189 | 0.126 | -0.127 | 0.076 | |
| HA | 0.591* | 0.606* | -0.365 | -0.069 | 0.586* | 0.691** | 0.383 | 0.289 | -0.178 | -0.953** | -0.910** | -0.975** | -0.976** | 0.518* | 0.439 | 0.298 | 0.217 | 0.207 | -0.110 | 0.138 | -0.085 | |
| ST | -0.533* | -0.674** | 0.397 | 0.193 | -0.559* | -0.562* | -0.306 | -0.229 | 0.291 | 0.967** | -0.929** | 0.977** | 0.977** | -0.568* | -0.542* | -0.123 | -0.476 | 0.059 | 0.395 | 0.138 | -0.129 | |
| BA | -0.622* | -0.630** | 0.278 | 0.169 | -0.583* | -0.648** | -0.367 | -0.305 | 0.198 | 0.979** | -0.966** | 0.972** | 0.999** | -0.567* | -0.500* | -0.202 | -0.364 | -0.064 | 0.267 | 0.010 | -0.007 | |
| TV | -0.616* | -0.598* | 0.265 | 0.212 | -0.557* | -0.690** | -0.379 | -0.266 | 0.185 | 0.979** | -0.972** | 0.947** | 0.986** | -0.567* | -0.498* | -0.218 | -0.348 | -0.083 | 0.250 | -0.008 | -0.032 | |
| PC (%) | 0.658** | 0.748** | -0.345 | 0.127 | 0.726** | 0.839** | 0.367 | 0.232 | -0.211 | -0.645** | 0.778** | -0.641** | -0.718** | -0.724** | 0.171 | -0.098 | 0.267 | -0.171 | -0.250 | -0.098 | 0.184 | |
| PV (cP) | -0.188 | -0.313 | 0.025 | -0.679** | -0.444 | -0.200 | -0.185 | -0.310 | -0.132 | -0.252 | 0.026 | -0.157 | -0.095 | -0.151 | -0.445 | 0.478 | 0.665** | 0.079 | -0.574* | -0.141 | 0.090 | |
| HV (cP) | -0.125 | -0.228 | -0.076 | -0.708** | -0.396 | -0.108 | -0.143 | -0.290 | -0.146 | -0.319 | 0.100 | -0.221 | -0.151 | -0.212 | -0.362 | 0.989** | -0.338 | 0.901** | 0.435 | 0.786** | -0.042 | |
| BDV (cP) | -0.401 | -0.588* | 0.443 | -0.373 | -0.529* | -0.532* | -0.313 | -0.307 | -0.036 | 0.101 | -0.291 | 0.154 | 0.170 | 0.143 | -0.676** | 0.777** | 0.674** | -0.681** | -0.984** | -0.819** | 0.131 | |
| FV (cP) | -0.160 | -0.244 | -0.063 | -0.696** | -0.412 | -0.135 | -0.157 | -0.310 | -0.145 | -0.288 | 0.069 | -0.194 | -0.122 | -0.183 | -0.387 | 0.993** | 0.998** | 0.700** | 0.771** | 0.957** | -0.109 | |
| SBV (cP) | 0.000 | 0.115 | -0.445 | -0.634** | -0.182 | 0.183 | -0.001 | -0.253 | -0.176 | -0.395 | 0.249 | -0.320 | -0.224 | -0.287 | -0.049 | 0.761** | 0.842** | 0.214 | 0.835** | 0.876** | -0.147 | |
| PeT (min) | -0.071 | -0.079 | -0.255 | -0.629** | -0.245 | 0.001 | 0.101 | -0.144 | -0.055 | -0.392 | 0.189 | -0.310 | -0.223 | -0.279 | -0.267 | 0.917** | 0.948** | 0.539* | 0.947** | 0.892** | -0.120 | |
| PaT (℃) | -0.029 | -0.127 | -0.125 | -0.683** | -0.272 | 0.026 | -0.098 | -0.359 | -0.255 | -0.348 | 0.138 | -0.252 | -0.186 | -0.259 | -0.209 | 0.932** | 0.952** | 0.599* | 0.952** | 0.852** | 0.923** |
The lower left and upper right corners of the diagonal in the table represent the correlation coefficients for 2021 and 2022, respectively. PN=panicle number per plant, SP=spikelets per panicle, SSR=seed setting rate, TGW=1000-grain weight, GW=grain weight per plant, GY=grain yield, BR=brawn rice percentage, MR=milled rice percentage, HR=head rice percentage, AP= appearance of cooked rice, HA=hardness of cooked rice, ST=stickiness of cooked rice, BA=balance of cooked rice, TV=taste value, PC= protein content, PV=peak viscosity, HV=hot viscosity, BDV=breakdown viscosity, FV=final viscosity, SBV=setback viscosity, PeT=peak time and PaT=pasting temperature, CG=chalky grain percentage, CD=chalkiness degree, AC=amylose content, GC=gel consistency, PFPN=partial factor productivity of nitrogen.
Disclaimer/Publisher’s Note: The statements, opinions and data contained in all publications are solely those of the individual author(s) and contributor(s) and not of MDPI and/or the editor(s). MDPI and/or the editor(s) disclaim responsibility for any injury to people or property resulting from any ideas, methods, instructions or products referred to in the content. |
© 2025 by the authors. Licensee MDPI, Basel, Switzerland. This article is an open access article distributed under the terms and conditions of the Creative Commons Attribution (CC BY) license (http://creativecommons.org/licenses/by/4.0/).
Copyright: This open access article is published under a Creative Commons CC BY 4.0 license, which permit the free download, distribution, and reuse, provided that the author and preprint are cited in any reuse.


