Submitted:
16 February 2025
Posted:
18 February 2025
Read the latest preprint version here
Abstract
Household budgeting is crucial for financial stability, yet many individuals find it challenging due to the lack of structured financial planning tools. This paper introduces a rule-based system that optimizes expenses by considering family size, income, and spending behavior. Unlike traditional budgeting tools, our system dynamically distributes income across essential categories such as housing, food, medical care, education, and savings using predefined rules. The system leverages dynamic input processing and predefined allocation rules to provide real-time insights into budgeting constraints. Experimental results show that the proposed model achieves 90% accuracy in budget allocation, ensuring financial sustainability and preventing overspending. Our system provides a transparent, flexible, and user-friendly alternative to machine learning-based budget models, making it accessible to households of all financial backgrounds.
Keywords:
Introduction
2. Literature Review
2.1. Monthly Household Budget Systems
2.2. Related Work on Household Budget Analysis
2.3. Comparative Analysis of Existing Research
| Study | Method | Key Findings | Limitations | Our Contribution |
| Latimaha et al. (2017) | Economic analysis | Budget shortfalls in middle-income families | No real-time adjustments | Rule-based automation for instant budget planning |
| Vermont et al. (2024) | Basic needs budget | Minimum income estimates | Excludes modern expenses | Incorporates digital payment and telecommunication expenses |
| Sharma et al. (2016) | Observational study | High-income allocation to necessities | No savings recommendations | Includes savings recommendations |
| Sweet & Bumpass et al. (2018) | Machine Learning | Budget optimization | Requires extensive training data | Computationally |
| Galperti et al. (2019) | Smart Expense Model | Automated financial planning | High setup cost, complex implementation | Rule-based system requiring minimal setup |
3. Methodology
3.1. Categories of Budget
- Housing: Rent, utilities, taxes, insurance, repairs.
- Food: Rice, cereal, vegetables, milk, meat.
- Medical: Insulin, medicine, general healthcare.
- Education: Primary, secondary, higher education.
- Transportation: Car, gas, public transport
- Debt Payment: Credit card, loans.
- Other Expenses: Groceries, entertainment, miscellaneous.
- Savings: Stock, bonds, emergency funds.
3.2. System Architecture
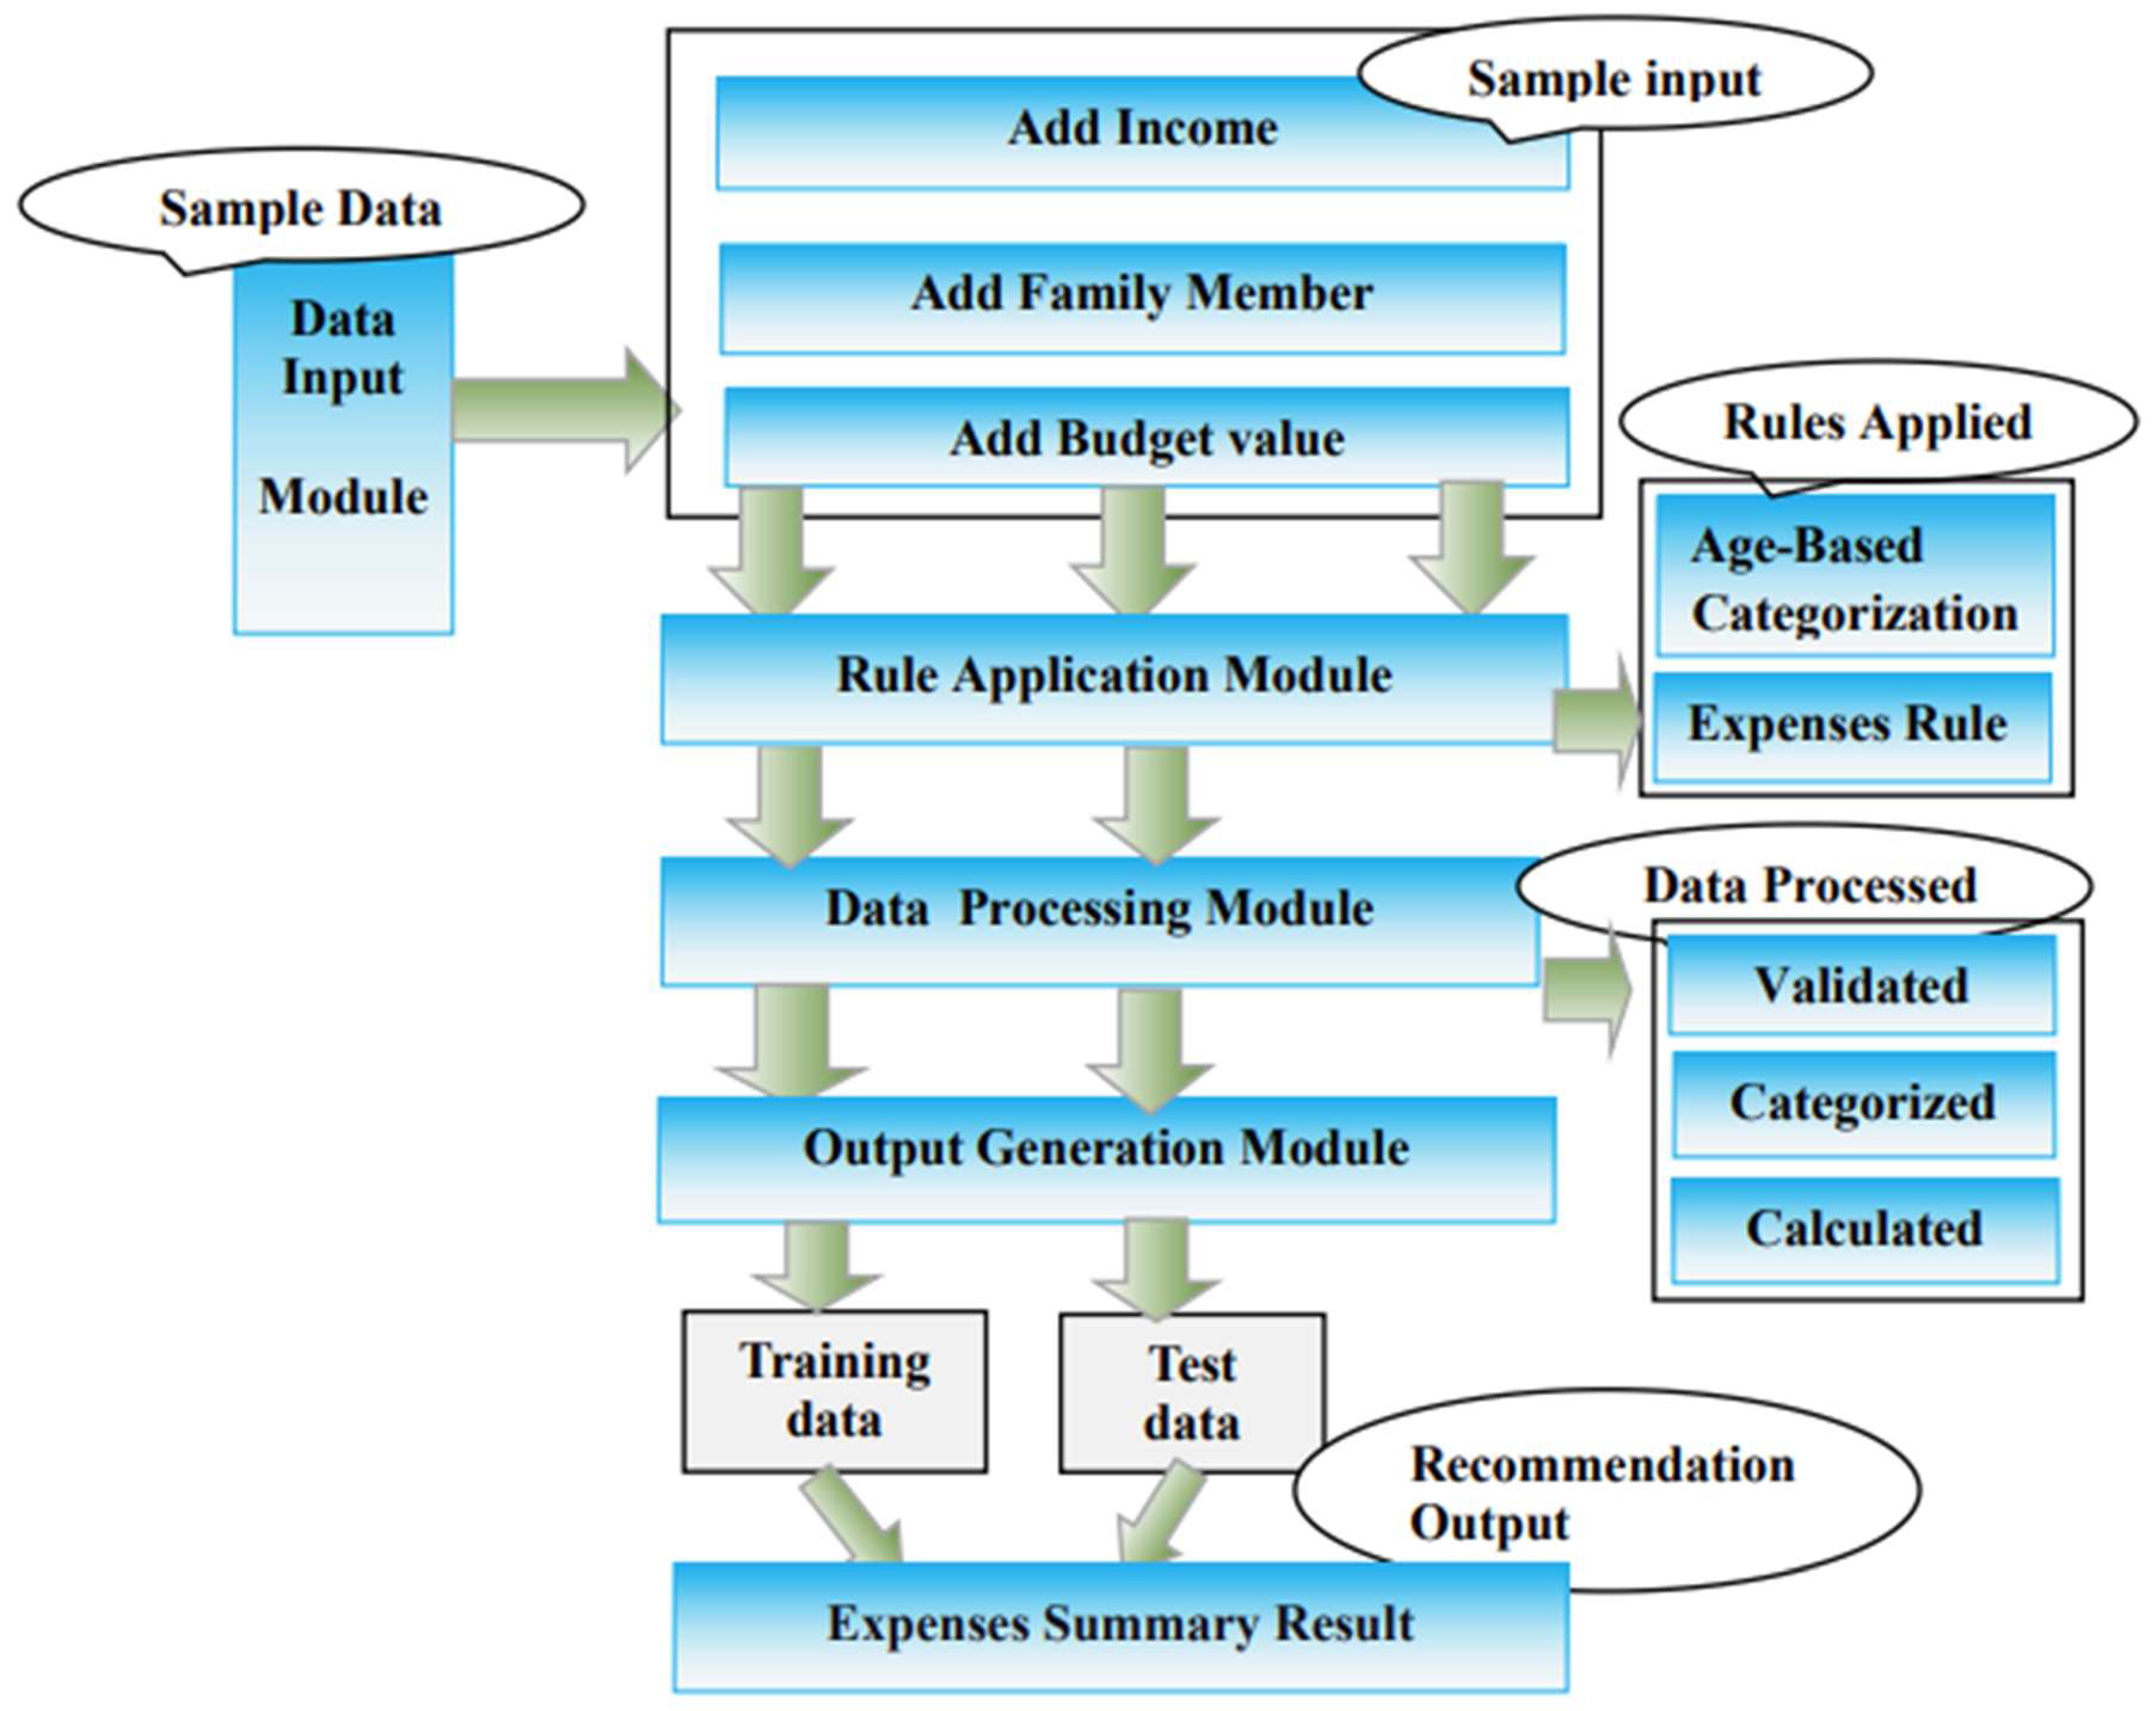
- Data Input Module: Users enter income, family size, and budget details.
- Rule Application Module: Allocates expenses dynamically based on predefined rules.
- Data Processing Module: Validates and categorizes expenses.
- Output Generation Module: Displays financial summaries, recommendations, and budget status (cash in hand or debt payment).
3.2.1. Data Input Module
- ·
-
Purpose: This module serves as the entry point for user data. It collects essential information from the user, such as:
- Income
- Family details (number of members, their ages)
- Budget
- Function: The collected data is sent to the next module for processing. This module ensures that the user can input necessary details easily and in an organized manner.
3.2.2. Rule Application Module
- Purpose: This module applies predefined rules to dynamically allocate expenses. It determines how to distribute the users budget among different categories based on:
- Income levels
- Family members age groups
- The specific needs of each age group (e.g., housing, food, medical, education expenses).
- Function: The rules ensure that each category gets the appropriate allocation. For example, it will apply a rule that assigns a fixed percentage of income for housing, food, transportation, etc., or tailor certain expenses like education for children and insulin for adults and the elderly.
3.2.3. Data Processing Module
- · Purpose: This module performs the necessary validation and categorization of user input data. It processes the input to ensure that all the fields are filled correctly and that the rules are applied properly.
- Function: It checks for any inconsistencies or missing data and categorizes the input according to the predefined expense categories (housing, food, education, medical, etc.). This module makes sure that all expenses are correctly attributed to the respective family members and age groups.
3.2.4. Output Generation Module
- · Purpose: After processing the data and applying rules, this module generates and displays the
- final output.
- Function: It presents the user with a detailed breakdown of their household budget. This includes:
- Recommendations based on the income and budget (e.g., whether the income covers the expenses).
- Financial summaries such as total expenses, cash in hand, or debt payment.
- A clear display of the expenses for each family member categorized by their age group (infant, child, teenager, adult, etc.).
- A visual representation of the data in colorful, easy-to-read tables.
- From Input to Output: The data starts in the Data Input Module and flows through the Rule Application and Data Processing Modules before reaching the Output Generation Module.
- Validation & Categorization: Data is validated and categorized in the Data Processing Module, while the Rule Application Module ensures the correct allocation of budget to different expense categories.
- Output Display: Finally, the Output Generation Module displays the financial information in a user-friendly format.

3.3. Collecting Datasets Description
3.4. Data Processing Module
- Housing.
- Food.
- Medical.
- Education.
- Transportation.
- Debt Payment.
- Other Expenses.
- Savings.

3.5. Establish Three Classification Models for Comparison
3.5.1. K Narest Algorithm
- a represents the input data point.
- n represents a data point from the training set.
- Income (Xincome): Family members income.
- Food Expenditure (Xfood): Monthly spending on food.
- Medical Expenditure (Xmedical): Monthly medical costs.
- Other Expenditure (Xother): Spending on non-essential or miscellaneous items.
- Family income.
- Family size (number of members and their age group).
- Budget.
- Housing expenditures.
- Food expenditures.
- Medical expenditures.
- Education expenditures.
- Transportation.
- Other expenditures.
- Debt expenditures.
- Savings.
-
Workflow of KNN for Household Budget
- a.
- Training Phase:
- •
- Store the entire training datasets, including income, family size, and various expenditures.
- b.
- Distance Calculation:
- •
- For a new data point, calculate its distance to every data point in the training set using the Euclidean Distance formula.
- c.
- Neighbor Selection:
- •
- Identify the k nearest neighbors based on the calculated distances.
- d.
- Majority Voting:
- •
- Determine the class of the new data point by taking the majority class among its k nearest neighbors.
- e.
- Classification Output:
- •
- Assign the new data point to the category predicted by majority voting (e.g., "lower-middle," "middle," "rich").

| Family Income | Family Members |
Budget | Housing Cost |
Food Cost |
Medical Cost |
Education Cost |
Transport Cost |
Debt Cost |
Other Cost |
Saving |
|---|---|---|---|---|---|---|---|---|---|---|
| 18395 | 11 | 18000 | 4446 | 15798 | 0 | 3452 | 2049 | 200 | 0 | 0 |
| 25800 | 11 | 25000 | 3780 | 21781 | 74 | 129 | 0 | 0 | 987 | 0 |
| 26765 | 11 | 26000 | 11610 | 66174 | 46 | 75 | 55904 | 24 | 0 | 0 |
| 30721 | 10 | 30000 | 5790 | 16450 | 1168 | 468 | 0 | 0 | 1845 | 5000 |
| 48802 | 6 | 48000 | 8766 | 24141 | 0 | 3120 | 2405 | 180 | 15000 | 0 |
| 49437 | 7 | 49000 | 9750 | 16703 | 7724 | 1176 | 0 | 3000 | 1084 | 10000 |
| 50102 | 11 | 50000 | 5484 | 37111 | 210 | 1290 | 0 | 0 | 6007 | 0 |
| 105200 | 10 | 105000 | 13000 | 73299 | 812 | 2440 | 850 | 0 | 14281 | 0 |
| 500000 | 12 | 500000 | 85080 | 213816 | 19320 | 25800 | 85 | 0 | 112120 | 50000 |
| 600000 | 11 | 600000 | 93780 | 306132 | 22880 | 11600 | 180 | 0 | 107482 | 50000 |
| 740110 | 11 | 740000 | 84000 | 181926 | 11060 | 2000 | 0 | 0 | 158129 | 0 |
| 10518 | 13 | 105000 | 67740 | 238375 | 28910 | 45000 | 0 | 120 | 133418 | 500000 |
- i.
- Square each attribute:
- ⋅ 183952=338,355,025
- ⋅ 112=12111^2 = 121112=121
- ⋅ 180002=324,000,00018000^2 = 324,000,000180002=324,000,000
- ⋅ 44462=19,756,9164446^2 = 19,756,91644462=19,756,916
- ⋅ 157982=249,755,60415798^2 = 249,755,604157982=249,755,604
- ⋅ 02=00^2 = 002=0
- ⋅ 34522=11,906,9043452^2 = 11,906,90434522=11,906,904
- ⋅ 20492=4,199,0012049^2 = 4,199,00120492=4,199,001
- ⋅ 2002=40,000200^2 = 40,0002002=40,000
- ⋅ 02=00^2 = 002=0
- ⋅ 02=00^2 = 002=0
| Family Income | Family Members | Budget | Housing Cost | Food Cost | Medical Cost | Education Cost | Transport Cost | Debt Cost | Other Cost | Saving | Distance |
|---|---|---|---|---|---|---|---|---|---|---|---|
| 18395 | 11 | 18000 | 4446 | 15798 | 0 | 3452 | 2049 | 200 | 0 | 0 | 52315.80 |
| 25800 | 11 | 25000 | 3780 | 21781 | 74 | 129 | 0 | 0 | 987 | 0 | 56720.16 |
| 30721 | 10 | 30000 | 5790 | 16450 | 1168 | 468 | 0 | 0 | 1845 | 5000 | 56768.42 |
| 49437 | 7 | 49000 | 9750 | 16703 | 7724 | 1176 | 0 | 3000 | 1084 | 10000 | 66945.35 |
| 48802 | 6 | 48000 | 8766 | 24141 | 0 | 3120 | 2405 | 180 | 15000 | 0 | 70097.15 |
| 50102 | 11 | 50000 | 5484 | 37111 | 210 | 1290 | 0 | 0 | 6007 | 0 | 75731.87 |
| 26765 | 11 | 26000 | 11610 | 66174 | 46 | 75 | 55904 | 24 | 0 | 0 | 96345.30 |
| 105200 | 10 | 105000 | 13000 | 73299 | 812 | 2440 | 850 | 0 | 14281 | 0 | 132601.06 |
| 500000 | 12 | 500000 | 85080 | 213816 | 19320 | 25800 | 85 | 0 | 112120 | 50000 | 559003.51 |
| 10518 | 13 | 105000 | 67740 | 238375 | 28910 | 45000 | 0 | 120 | 133418 | 500000 | 579903.63 |
| 600000 | 11 | 600000 | 93780 | 306132 | 22880 | 11600 | 180 | 0 | 107482 | 50000 | 684722.14 |
| 740110 | 11 | 740000 | 84000 | 181926 | 11060 | 2000 | 0 | 0 | 158129 | 0 | 779111.05 |
3. Nearest Neighbors (k=3)
| Family Income | Family Members | Budget | Housing Cost | Food Cost | Medical Cost | Education Cost | Transport Cost | Debt Cost | Other Cost | Saving | Distance |
|---|---|---|---|---|---|---|---|---|---|---|---|
|
18395 |
11 | 18000 | 4446 | 15798 | 0 | 3452 | 2049 | 200 | 0 | 0 | 52315.80 |
| 25800 | 11 | 25000 | 3780 | 21781 | 74 | 129 | 0 | 0 | 987 | 0 | 56720.16 |
| 30721 | 10 | 30000 | 5790 | 16450 | 1168 | 468 | 0 | 0 | 1845 | 5000 | 56768.42 |
4. Majority Voting
- Row 3: Family Income = 30721, Distance = 56768.42
- Row 0: Family Income = 18395, Distance = 52315.8
- Row 1: Family Income = 25800, Distance = 56720.16
5. Classification Output
| Family Income | Family Members | Budget | Housing Cost | Food Cost | Medical Cost | Education Cost | Transport Cost | Debt Cost | Other Cost | Saving | Distance |
|---|---|---|---|---|---|---|---|---|---|---|---|
|
18395 |
11 | 18000 | 4446 | 15798 | 0 | 3452 | 2049 | 200 | 0 | 0 | 52315.80 |
| 25800 | 11 | 25000 | 3780 | 21781 | 74 | 129 | 0 | 0 | 987 | 0 | 56720.16 |
| 30721 | 10 | 30000 | 5790 | 16450 | 1168 | 468 | 0 | 0 | 1845 | 5000 | 56768.42 |
| 100000 | 8 | 80000 | 10000 | 30000 | 2000 | 1000 | 3000 | 500 | 1500 | 50000 | 114,857 |
| 200000 | 6 | 150000 | 20000 | 40000 | 3000 | 2000 | 4000 | 1000 | 2000 | 60000 | 13724 |
| Attribute | Training Data (Row 1) | New Data 1 (100,000) | Squared Difference (Pi−Qi)^2 | Squared Difference(Pi−Qi)^2 |
|---|---|---|---|---|
| Family Income | 18,395 | 100,000 | (18395−100000)^2=6660162025 | (18395 - 200000)^2 = 3303026025 |
| Family Members | 11 | 8 | (11 - 8)^2 =9 | (11 - 6)^2 =25 |
| Budget | 18,000 | 80,000 | (18000−80000)^2=3844000000 | (18000 - 150000)^2 = 12960000000 |
| Housing Cost | 4,446 | 10,000 | ((4446 - 10000)^2 =30714516 | (4446 - 20000)^2 = 225116004 |
| Food Cost | 15,798 | 30,000 | (15798 - 30000)^2 = 201616804 | (15798 - 40000)^2 = 585648004 |
| Medical Cost | 0 | 2,000 | (0 - 2000)^2=4000000 | (0 - 3000)^2 = 9000000 |
| Education Cost | 3,452 | 1,000 | (3452 - 1000)^2 = =6038416 | (3452 - 2000)^2 = 2109024 |
| Transport Cost | 2,049 | 3,000 | (2049 - 3000)^2 =902401 | (2049 - 4000)^2 = 3902001 |
| Debt Cost | 200 | 500 | (200 - 500)^2=90000 | (200 - 1000)^2 = 640000 |
| Other Cost | 0 | 1,500 | (0 - 1500)^2=2250000 | (0 - 2000)^2 = 4000000 |
| Saving | 0 | 50,000 | (0 - 50000)^2 = 2500000000 | (0 - 60000)^2 = 3600000000 |
- Row 1: Distance = 114,857
- Row 2: Distance = 25800
- Row 3: Distance = 30721
- Row 1: Distance = 13,724
- Row 2: Distance =25800
- Row 3: Distance = 30721
- Low Income (L): ≤ 30,000
- Middle Income (M): 30,001 - 100,000
- High Income (H): > 100,000
- The 3 nearest neighbors: Row 1 (L), Row 2 (L), Row 3 (M).
- Predicted class: Middle Income (M).
- The 3 nearest neighbors: Row 1 (L), Row 2 (L), Row 3 (M).
- Predicted class: High Income (H).
| Family Income | Class |
|---|---|
| 18,395 | L |
| 25,800 | L |
| 26,765 | L |
| 30,721 | M |
| 48,802 | M |
| 49,437 | M |
| 50,102 | M |
| 105,200 | H |
| 500,000 | H |
| 600,000 | H |
| 740,110 | H |
- For New Data 1 (100,000): After sorting the distances, we check the classes of the 3 nearest neighbors. If most of them belong to the middle class, the predicted class for New Data 1 will be middle.
- Similarly, for New Data 2 (200,000): After sorting the distances, we check the classes of the 3 nearest neighbors. If most of them belong to the middle class, the predicted class for New Data 2 will be high.
3.5.2. Naive Bayes
3.5.2.1. Dataset Description
| Net Income | Family Member | Total Housing Cost | Total Food Cost | Total Medical Cost | Total Education Cost | Total Transport Cost | Total Dept Cost | Other Cost | Saving |
|---|---|---|---|---|---|---|---|---|---|
| XX | XX | XX | XX | XX | XX | XX | XX | XX | XX |
| XX | XX | XX | XX | XX | XX | XX | XX | XX | XX |
- Total household income.
- Housing expenditure.
- Total food expenditures.
- Education expenditures.
- Medical expenditures.
- Transport expenditures.
- Debt payment expenditures.
- Other expenses.
- Savings.
3.5.2.2. Feature Selection and Data Transformation
- a.
-
Feature Selection:
- ⋅
- Predictors: Expenditures (Housing Cost, Food Cost, etc.)
- ⋅
- Target Variable: Income class (categorized into ranges: Low, Middle, High)
- b.
-
Data Transformation: We can categorize Family Income into classes, for example:
- •
- Low Income (L): ≤ 30,000
- •
- Middle Income (M): 30,001 - 100,000
- •
- High Income (H): > 100,000
| Monthly Income Range | Income Class |
|---|---|
| P5000-8000 | Lower |
| P9000-11000 | Lower |
| P10000-20000 | Lower |
| P20011-30000 | Lower |
| P30038-60000 | Middle |
| P60100-80000 | Middle |
| P80600-100000 | Middle |
| P100004-200000 | High |
| P203675-300000 | High |
| P300300-above | High and rich |
3.5.2.3. Empirical research design
3.5.2.4. Feature Scores and Interpretation:
| Features | Scores |
|---|---|
| Total Housing expenditure | 0.0158 |
| Total Food expenditure | 0.0766 |
| Total Education expenditure | 1.117 |
| Total Medical expenditure | 0.00074 |
| Total Transport expenditure | 0.00024 |
| Total Dept Payment expenditure | 0.000135 |
| Total other expenditure | 1.708 |
| Total Saving | 0.00002428 |
3.5.3. Rule-Based System for Household Budget Recommendations
3.5.3.1. Components of the Rule-Based System
- Rules: Logical conditions and actions for budget recommendations.
- Working Memory: Stores facts, user inputs, and intermediate results.
- Inference Engine: Matches rules against facts to draw conclusions.
|
Algorithm 1: Backhand_DB Input: user_name and password Output: Login success or failure message
|
|
Algorithm 2: Finding a Rule-Based Household Budget. Input:
|
- Input: Number of family members, their income, and the monthly budget.
- Calculate: The total expenses for various categories (e.g., housing, food, medical, transportation).
-
Compare: Budgeted vs. actual expenses.
- If budget ≥ expenses, the household budget is balanced.
- If budget < expenses, display a negative balance and recommend debt payment.
- Allocate: Any remaining budget to savings or debt repayment as needed.
- Output: A summary of budget status, expense categories, and recommendations for savings or adjustments.
3.5.3.2 Modules of the Household Budget System
- a)
- Record Family Income & Budget
- •
-
Input:
- •
- Income Sources (e.g., salaries, rental income, business, etc.).
- •
- Enter the Total Monthly Income.
- •
- Enter the Planned Monthly Budget.
- •
- System Action:
- •
- The system will calculate the available budget based on income sources and planned budget.
- •
- Display whether income is sufficient or insufficient to meet the budget.
- •
- If income < expenses, suggest cost-cutting or debt management strategies.
- b).
- Record Family Members
- •
-
Input:
- ♦
- Number of Family Members: User inputs how many members to include.
- ♦
- Age Group of Family Members: The system will categorize family members into age groups such as Infant, Child, Teenager, Adult, Middle-aged, and Old.
- ∙
-
System Action:
- ♦
- Based on the age group, the system will assign appropriate categories for expenses (e.g., Cereal for Infants, Education for Children, Medical care for the Elderly).
- ♦
- Expenses will be dynamically adjusted based on the age of the member and the assigned category.
- 3.
- Estimate Contingency Expenses
-
Input:
- ♦
- Allocate a fixed or flexible percentage of income to Contingency Fund (e.g., 5% of total income).
-
System Action:
- ♦
- Track unexpected expenses (e.g., urgent repairs, medical emergencies).
- ♦
- Allow the user to adjust the contingency fund for flexibility, ensuring they stay within budget.
- ♦
- The system will also show a progress tracker for achieving financial goals while managing contingency expenses.
4. Track Expenses
-
Input:
- ♦
-
Categorized Expenses:
- ▪
- Housing, Food, Education, Medical, Transportation, Debt, Other Expenses, and Savings.
- ▪
- Users input the actual spending amounts for each category.
-
System Action:
- ♦
- Monitor and compare actual expenses against the allocated budget.
- ♦
- Show a summary of spending trends, identifying areas of overspending.
- ♦
- The system will generate alerts or recommendations for adjustments (e.g., Reduce Discretionary Spending or Increase Income Sources)
| Age Group | Food Expenses | Education Expenses | Medical Expenses |
|---|---|---|---|
| Infant (Age < 5) | Only cereal is included (no rice, meat, or vegetables). | None | Basic care like vaccinations and check-ups. |
| Child (Age 5–10) | Full range: rice, flour, oil, fish, milk, etc. | Primary education (school fees, books, supplies). | General care for common childhood illnesses. |
| Teenager (Age 10–18) | Full range: rice, flour, oil, fish, meat, vegetables. | Secondary education (tuition, supplies). | Seasonal illnesses or injury treatments. |
| Young Adult (Age 18–25) | Full range, higher consumption of protein (meat, fish). | Higher education (college fees, textbooks). | Regular check-ups, dental care, insulin (if needed). |
| Middle-aged Adult (Age 30–50) | Full range, focus on healthy items (vegetables, fish). | None (unless personal education is pursued). | Regular health maintenance (e.g., blood pressure medicine). |
| Elderly (Age > 50) | Softer food options like vegetables for easier consumption. | None (unless pursuing adult education). | Frequent care for age-related conditions (e.g., insulin, chronic illness medicines). |
- A.
- Budget Estimate Rule
- Budget is Adequate: When the allocated amount is less than or equal to income.
- Budget is Insufficient: When the allocatedamount exceeds income.
- B.
- Expense Estimate
- o
-
Available Balance (ABALANCE):
- ▪
- ABALANCE = INCOME – COST
- ▪
-
Where:
- ▪
- INCOME = Total income of the user.
- ▪
- COST = Total amount of the user's periodic expenses.
| Rule | IF | THEN |
| R1 | Income>Budget | The plan is useful. |
| R2 | Income>=Budget | The plan is useful. |
| R3 | Income<Budget | The plan is not useful because income is less than our budget. |
| R4 | Income<Budget | The plan is not useful because income is less than or equal our budget. If income is less or equal budget user may face depth payment. |
| Rule | IF | THEN |
| R1 | Budget>Expense | The plan is useful. |
| R2 | Budget>=Expense | The plan is useful. |
| R3 | Budget<Expense | The plan is not useful because income is less than our budget. |
| R4 | Budget<Expense | The plan is not useful because income is less than or equal our budget. If income is less or equal budget user may face depth payment. |
| R5 | Expense=Positive | When expense is not exceeding then income. The user can purchase which is needed & A budget is created by allowing the user to necessary amount allotted to one more future commitment for the current month, periodic, budget and saving plan. |
| R6 | Expense=Negative | The user cannot afford the purchase Where expense is exceed their income. |
| Rule | Income | Budget | Expense Status | Household budget status |
| R1 | If income =16000 | Then budget=15000 | Total expenses>16000 | So the rule R1 has been fulfilled |
| Where income>budget | ||||
| R2 | If income=26000 | Then budget=25000 | Total expenses=26000 | So the rule R2 has been fulfilled |
| Where income>=budget | ||||
| R3 | If income=100000 | Then budget=110000 | Total expenses=110000 | So the rule R3 has been fulfilled |
| Where income<budget | ||||
| R4 | If income=200000 | Then budget=220000 | Total expenses=220000 | So the rule R4 has been fulfilled |
| Where income<=budget |
| Rule1: IF income= 16000 AND budget=15000 THEN income>budget |
Rule2: IF income= 26000 AND budget=25000 THEN income>=budget |
| Rule3: IF income= 100000 AND budget=110000 THEN income<budget |
Rule4: IF income= 200000 AND budget=2200000 THEN income<=budget |
| Rule | Income | Budget | Expense | Household budget status |
|---|---|---|---|---|
| R1 | If income =20000 | Then budget=15000 |
Total expenses=20000 Where expense>budget |
So the condition of rule R1 has been met. |
| R2 | If income=16000 | Then budget=16000 | Total expenses=16000 | So The condition of rule R2 has been met. |
| Where expense>=budget | ||||
| R3 | If income=25500 | Then budget=30000 | Total expenses=35266 | So The condition of rule R3 has been met. |
| Where expense<budget | ||||
| R4 | If income=35981 | Then budget=50000 | Total expenses=45981 | So The condition of rule R4 has been met. |
| Where expense<=budget | ||||
| R5 | If income=55000 | Then budget=55000 | Total expenses=55000 | So The condition of rule R5 has been met. |
| Where expense=positive | ||||
| R6 | If income=60000 | Then budget=65000 | Total expenses=70000 | So The condition of rule R6 has been met. |
| Where expense=negative |
| Rule1: IF income=20000 AND budget=15000 THEN expense>budget |
Rule2: IF income=16000 AND budget=16000 THEN expense>=budget |
Rule3: IF income=25500 AND budget=30000 THEN expense<budget |
| Rule4: IF income=35981 AND budget=50000 THEN expense<=budget |
Rule5: IF income=55000 AND budget=55000 THEN expense=positive |
Rule6: IF income=60000 AND budget=65000 THEN expense=negative |
| Feature | KNN | Naive Bayes | Rule-Based System |
|---|---|---|---|
| Ease of Implementation | Moderate (requires tuning and distance calculations). | Moderate (probability-based calculations). | Easy (predefined rules). |
| Interpret ability | Low (black-box model). | Low (complex probabilistic output). | High (transparent and explicit). |
| Accuracy | High (depends on quality of training data). | Moderate (assumes feature independence). | Moderate (depends on rule quality). |
| Real-Time Suitability | Low (computationally expensive). | High (fast probability computation). | High (instant processing). |
| Scalability | Low (slower with large datasets). | High (handles large datasets well). | High (fixed rule set). |
| Practical Usability | Moderate (requires technical understanding). | Low (less intuitive for users). | High (simple and user-friendly). |
4.1. Experimental Setup and Environment
- Processor: Intel(R) Core(TM) i5-7200U CPU @ 2.50GHz (2 cores, 4 logical processors).
- RAM: 8 GB.
- Operating System: Windows 10 (64-bit).
- phpMyAdmin: For managing MySQL databases.
- Dreamweaver: Used for web design with support for HTML, CSS, and JavaScript.
- SublimeText: A lightweight text editor for coding.
- XAMPP: Local server environment for testing PHP-based applications.
- JupyterNotebook: For data analysis and visualization.
- HTML and CSS: For front-end design.
- JavaScript and jQuery: For dynamic behavior and interactivity.
- AJAX: For asynchronous data retrieval.
- PHP: To connect and process data from the MySQL database.
4.2. Dataset Generation and Characteristics
- IncomeDetails: Covers gross salary, bonuses, rental income, and other sources.
- ExpenseCategories: Includes housing, food, education, medical, transportation, debt payments, and savings.
- Demographics: Captures family composition, including member count and age groups.
- total_income: The total household income.
- budget_amount: The budget set by the user for household expenses.
- num_members: The total number of family members.
- age_x: The age of each family member.
- age_group_x: The age group category for each family member (e.g., Infant, Child, Teenager, etc.).
| id | total_income | budget_amount | num_members | age_1 | age_group_1 | age_2 | age_group_2 | age_3 | age_group_3 | age_4 | age_group_4 |
|---|---|---|---|---|---|---|---|---|---|---|---|
| 1 | 150,000 | 120,000 | 3 | 35 | Middle-aged | 10 | Child | 5 | Infant | NULL | NULL |
| 2 | 200,000 | 180,000 | 4 | 40 | Middle-aged | 17 | Teenager | 13 | Teenager | 5 | Infant |
| 3 | 250,000 | 220,000 | 5 | 30 | Middle-aged | 12 | Child | 8 | Young | 3 | Infant |
| 4 | 500,000 | 450,000 | 6 | 45 | Middle-aged | 20 | Young Adult | 18 | Teenager | 15 | Teenager |
| 5 | 1,000,000 | 900,000 | 4 | 50 | Old | 25 | Adult | 22 | Adult | NULL | NULL |
- id: This is the unique identifier for each entry in the table. In this example, the record is identified as 1.
- total_income: This field stores the total income of the household, which is 150,000 BDT in this example. This income might include wages, rental income, and other sources of earnings.
- budget_amount: The household budget allocated for expenses, which is 120,000 BDT in this case.
- num_members: This value indicates that the family has 3 members.
- age_1: The first family member is 35 years old, classified as "Middle-aged".
- age_group_1: "Middle-aged" is the category this family member falls under based on their age.
- age_2: The second family member is 10 years old, classified as "Child".
- age_group_2: "Child" is the category this family member falls under.
- age_3: The third family member is 5 years old, classified as "Infant".
- age_group_3: "Infant" is the category for the third family member.
4.3 Rule-Based Budget Recommendation
- FamilyIncome (Income): Total monthly income.
- FamilyMembers: Number of people in the household, including their age group.
- Budget: User-defined target for total expenses.
- Housing.
- Food.
- Medical.
- Education.
- Transport.
- DebtPayment.
- OtherExpenses.
- Savings.
-
Housing Allocation:
- •
-
Rule: Allocate 30-35% of income based on family size.
- ▪
- If Family Members > 4: Housing = 35% of income.
- ▪
- Otherwise: Housing = 30% of income.
-
FoodAllocation:
-
Rule: Allocate 20-25% of income for food.
- ▪
- If Family Members > 4: Food = 25% of income.
- ▪
- Otherwise: Food = 20% of income.
-
-
Medical and Education Costs:
- Rule: Set to a minimum of 5% of income, adjustable by the user.
-
Transport Costs:
- Rule: Allocate 5% of income, adjustable for specific needs.
-
DebtPayment:
- Rule: Allocate 5-10% of income based on the debt level.
-
Savings:
- Rule: Allocate 10-20% of income, prioritizing higher savings if possible.
-
Other Expenses:
- Rule: Assign the remaining income to discretionary expenses.
4.4. Sample Scenario:
- Income: 9,111 BDT
- FamilyMembers: 5
- Budget: 9,000 BDT
| Family Member | Age | AgeGroup | ExpenseCategories |
| Member 1 | 35 | Middle-aged (30+) | Full expense allocation (Housing, Food, Medical, Education, Transport) |
| Member 2 | 10 | Child (5-10) | Full expense allocation (Housing, Food, Medical, Education, Transport) |
| Member 3 | 5 | Infant (Under 5) | Food (Cereal), Medical (Vaccines), No education expenses |
| Member 4 | 70 | Old (50+) | Full expense allocation (Food, Medical—Insulin, Education if applicable) |
| Member 5 | 30 | Young Adult (25-30) | Full expense allocation (Housing, Food, Medical, Education, Transport) |
| Category | Subcategory | Percentage | Amount (BDT) | Family Member 1 (Age 35) | Family Member 2 (Age 10) | Family Member 3 (Age 5) | Family Member 4 (Age 70) | Family Member 5 (Age 30) |
|---|---|---|---|---|---|---|---|---|
| Housing | Rent/Mortgage | 15% | 1,367 | 1,367 | 1,367 | 1,367 | 1,367 | 1,367 |
| Utilities | 5% | 455 | 455 | 455 | 455 | 455 | 455 | |
| Taxes | 5% | 455 | 455 | 455 | 455 | 455 | 455 | |
| Insurance | 5% | 455 | 455 | 455 | 455 | 455 | 455 | |
| Food | Rice | 6% | 546 | 546 | 546 | 546 | 546 | 546 |
| Cereal | 2% | 182 | 182 | - | 182 | 182 | 182 | |
| Flour | 3% | 273 | 273 | 273 | 273 | 273 | 273 | |
| Milk | 3% | 273 | 273 | 273 | 273 | 273 | 273 | |
| Fish & Meat | 4% | 364 | 364 | 364 | 364 | 364 | 364 | |
| Vegetables | 4% | 364 | 364 | 364 | 364 | 364 | 364 | |
| Medical | Insulin | 2% | 182 | - | - | - | 182 | - |
| Pressure Medicine | 2% | 182 | 182 | 182 | 182 | 182 | 182 | |
| Other Medical Expenses | 1% | 91 | 91 | 91 | 91 | 91 | 91 | |
| Education | Primary Education | 3% | 273 | - | 273 | - | - | - |
| Secondary Education | 2% | 182 | - | - | - | - | - | |
| Transport | Car | 2% | 182 | 182 | 182 | 182 | 182 | 182 |
| Public Transportation | 1% | 91 | 91 | 91 | 91 | 91 | 91 | |
| Debt Payment | Credit Card Payment | 1% | 91 | 91 | 91 | 91 | 91 | 91 |
| Personal Loan Payment | 2% | 182 | 182 | 182 | 182 | 182 | 182 | |
| Other Expenses | Groceries | 2% | 182 | 182 | 182 | 182 | 182 | 182 |
| Phone | 1% | 91 | 91 | 91 | 91 | 91 | 91 | |
| Clothes | 1% | 91 | 91 | 91 | 91 | 91 | 91 | |
| Entertainment | 1% | 91 | 91 | 91 | 91 | 91 | 91 | |
| Miscellaneous | 1% | 91 | 91 | 91 | 91 | 91 | 91 | |
| Savings | Stocks | 10% | 911 | 911 | 911 | 911 | 911 | 911 |
| Bonds | 5% | 455 | 455 | 455 | 455 | 455 | 455 |
4.4. Model Training
4.4.1. Key Metrics:
- Accuracy: The proportion of correct predictions (True Positives + True Negatives) among total predictions.
- Precision: The proportion of True Positives relative to all positive predictions (True Positives + False Positives), indicating the systems reliability in expense classification.
- Recall: The proportion of True Positives identified out of all actual positives, representing the systems ability to capture all relevant expenses.
4.4.2. Data Structure and Splitting
- Net Family Income
- Budget
- Family Members
- Total Housing Expenditure
- Total Food Expenditure
- Total Medical Expenditure
- Total Education Expenditure
- Total Transportation Expenditure
- Total Debt Payment Expenditure
- Other Expense Expenditure
- Training Set: 80% (648 entries) to build the model.
- Testing Set: 20% (163 entries) to evaluate model performance.
4.4.3. Training Data Example
| Train Data | Net Family Income | Budget | Family Members | Total Housing Cost | Total Food Cost | Total Medical Cost | Total Education Cost | Total Transportation Cost | Total Debt Payment Cost | Other Expense Cost |
|---|---|---|---|---|---|---|---|---|---|---|
| 37 | 24800 | 24800 | 2 | 6252 | 11938 | 1100.00 | 0 | 1762.00 | 0 | 2526 |
| 172 | 87612 | 92612 | 6 | 10638 | 68484 | 266.00 | 200 | 725.00 | 3996 | 5000 |
| 48 | 28321 | 33321 | 4 | 6720 | 12455 | 6000.00 | 0 | 3457.00 | 2514 | 5000 |
| 319 | 18044 | 18844 | 1 | 4626 | 11126 | 2770.00 | 130 | 778.00 | 900 | 0 |
| 623 | 49968 | 49968 | 3 | 10062 | 35206 | 0.00 | 1008 | 0.00 | 0 | 1692 |
| ... | ... | ... | ... | ... | ... | ... | ... | ... | ... | ... |
| 763 | 100015 | 100015 | 11 | 15000 | 62934 | 145.00 | 2520 | 0.00 | 5570 | 10846 |
| 192 | 100000 | 103000 | 6 | 20000 | 25000 | 10000.00 | 15000 | 150.00 | 3000 | 15000 |
| 629 | 50075 | 50075 | 2 | 3906 | 29805 | 0.00 | 720 | 0.00 | 0 | 644 |
| 559 | 49201 | 54201 | 6 | 9930 | 35279 | 318.00 | 8208 | 5000.00 | 0 | 466 |
| 684 | 50561 | 50561 | 1 | 7200 | 21156 | 50.00 | 4020 | 0.00 | 0 | 2135 |
| Train Data | Total Savings Expenditure |
|---|---|
| 37 | 2000.00 |
| 172 | 0.00 |
| 48 | 0.00 |
| 319 | 0.00 |
| 623 | 2000.00 |
| ... | ... |
| 763 | 3000.00 |
| 192 | 10000.00 |
| 629 | 15000.00 |
| 559 | 0.00 |
| 684 | 16000.00 |
4.4.4. Testing Data Example
| Test Data | Net Family Income | Budget | Family Member | Total Housing Cost | Total Food Cost | Total Medical Cost | Total Education Cost | Total Transport Cost | Total Debt Payment Cost | Other Expense Cost |
|---|---|---|---|---|---|---|---|---|---|---|
| 613 | 49823 | 49823 | 2 | 13710 | 30839 | 660.00 | 180 | 0.00 | 0 | 2432 |
| 202 | 123015 | 123015 | 4 | 7200 | 73459 | 8060.00 | 610 | 11730.00 | 0 | 6390 |
| 55 | 31400 | 31400 | 2 | 9090 | 10938 | 50.00 | 0 | 75.00 | 0 | 0 |
| 478 | 29174 | 29174 | 1 | 6000 | 16663 | 260.00 | 900 | 0.00 | 0 | 1271 |
| 27 | 17800 | 17800 | 1 | 3090 | 8514 | 274.00 | 0 | 450.00 | 0 | 472 |
| ... | ... | ... | ... | ... | ... | ... | ... | ... | ... | ... |
| 71 | 40000 | 53000 | 3 | 5532 | 19433 | 41.00 | 300 | 570.00 | 13164 | 0 |
| 49 | 29174 | 29174 | 2 | 6000 | 16663 | 260.00 | 0 | 3520.00 | 0 | 3351 |
| 416 | 27000 | 30000 | 7 | 6360 | 23754 | 20.00 | 25 | 3134.00 | 0 | 0 |
| 240 | 173710 | 173710 | 2 | 16560 | 81975 | 0.00 | 0 | 120.00 | 0 | 22000 |
| 116 | 52000 | 52000 | 3 | 8700 | 26414 | 0.00 | 2040 | 128.00 | 0 | 4846 |
| Total Test Data | Total Savings Expenditure |
|---|---|
| 613 | 2000.00 |
| 202 | 20000.00 |
| 55 | 5000.00 |
| 478 | 2000.00 |
| 27 | 5000.00 |
| ... | ... |
| 71 | 0.00 |
| 49 | 2000.00 |
| 416 | 0.00 |
| 240 | 40000.00 |
| 116 | 10000.00 |
| 613 | 2000.00 |
4.4.5. Model Performance
| Algorithm | Precision | Recall | F1 Score | Accuracy (%) |
|---|---|---|---|---|
| KNN | 0.96 | 0.95 | 0.95 | 96.67 |
| Naive Bayes | 0.90 | 0.93 | 0.91 | 93.00 |
| Rule-Based System | 0.85 | 0.90 | 0.90 | 90.00 |
4.4.6. Evaluation Metrics
- Precision: High precision (0.96 for KNN) ensures fewer incorrect budget classifications.
- Recall: High recall (0.93 for Naive Bayes) captures all critical expense categories.
- Accuracy: The KNN classifiers 96.67% accuracy makes it the most reliable for predicting expenses.
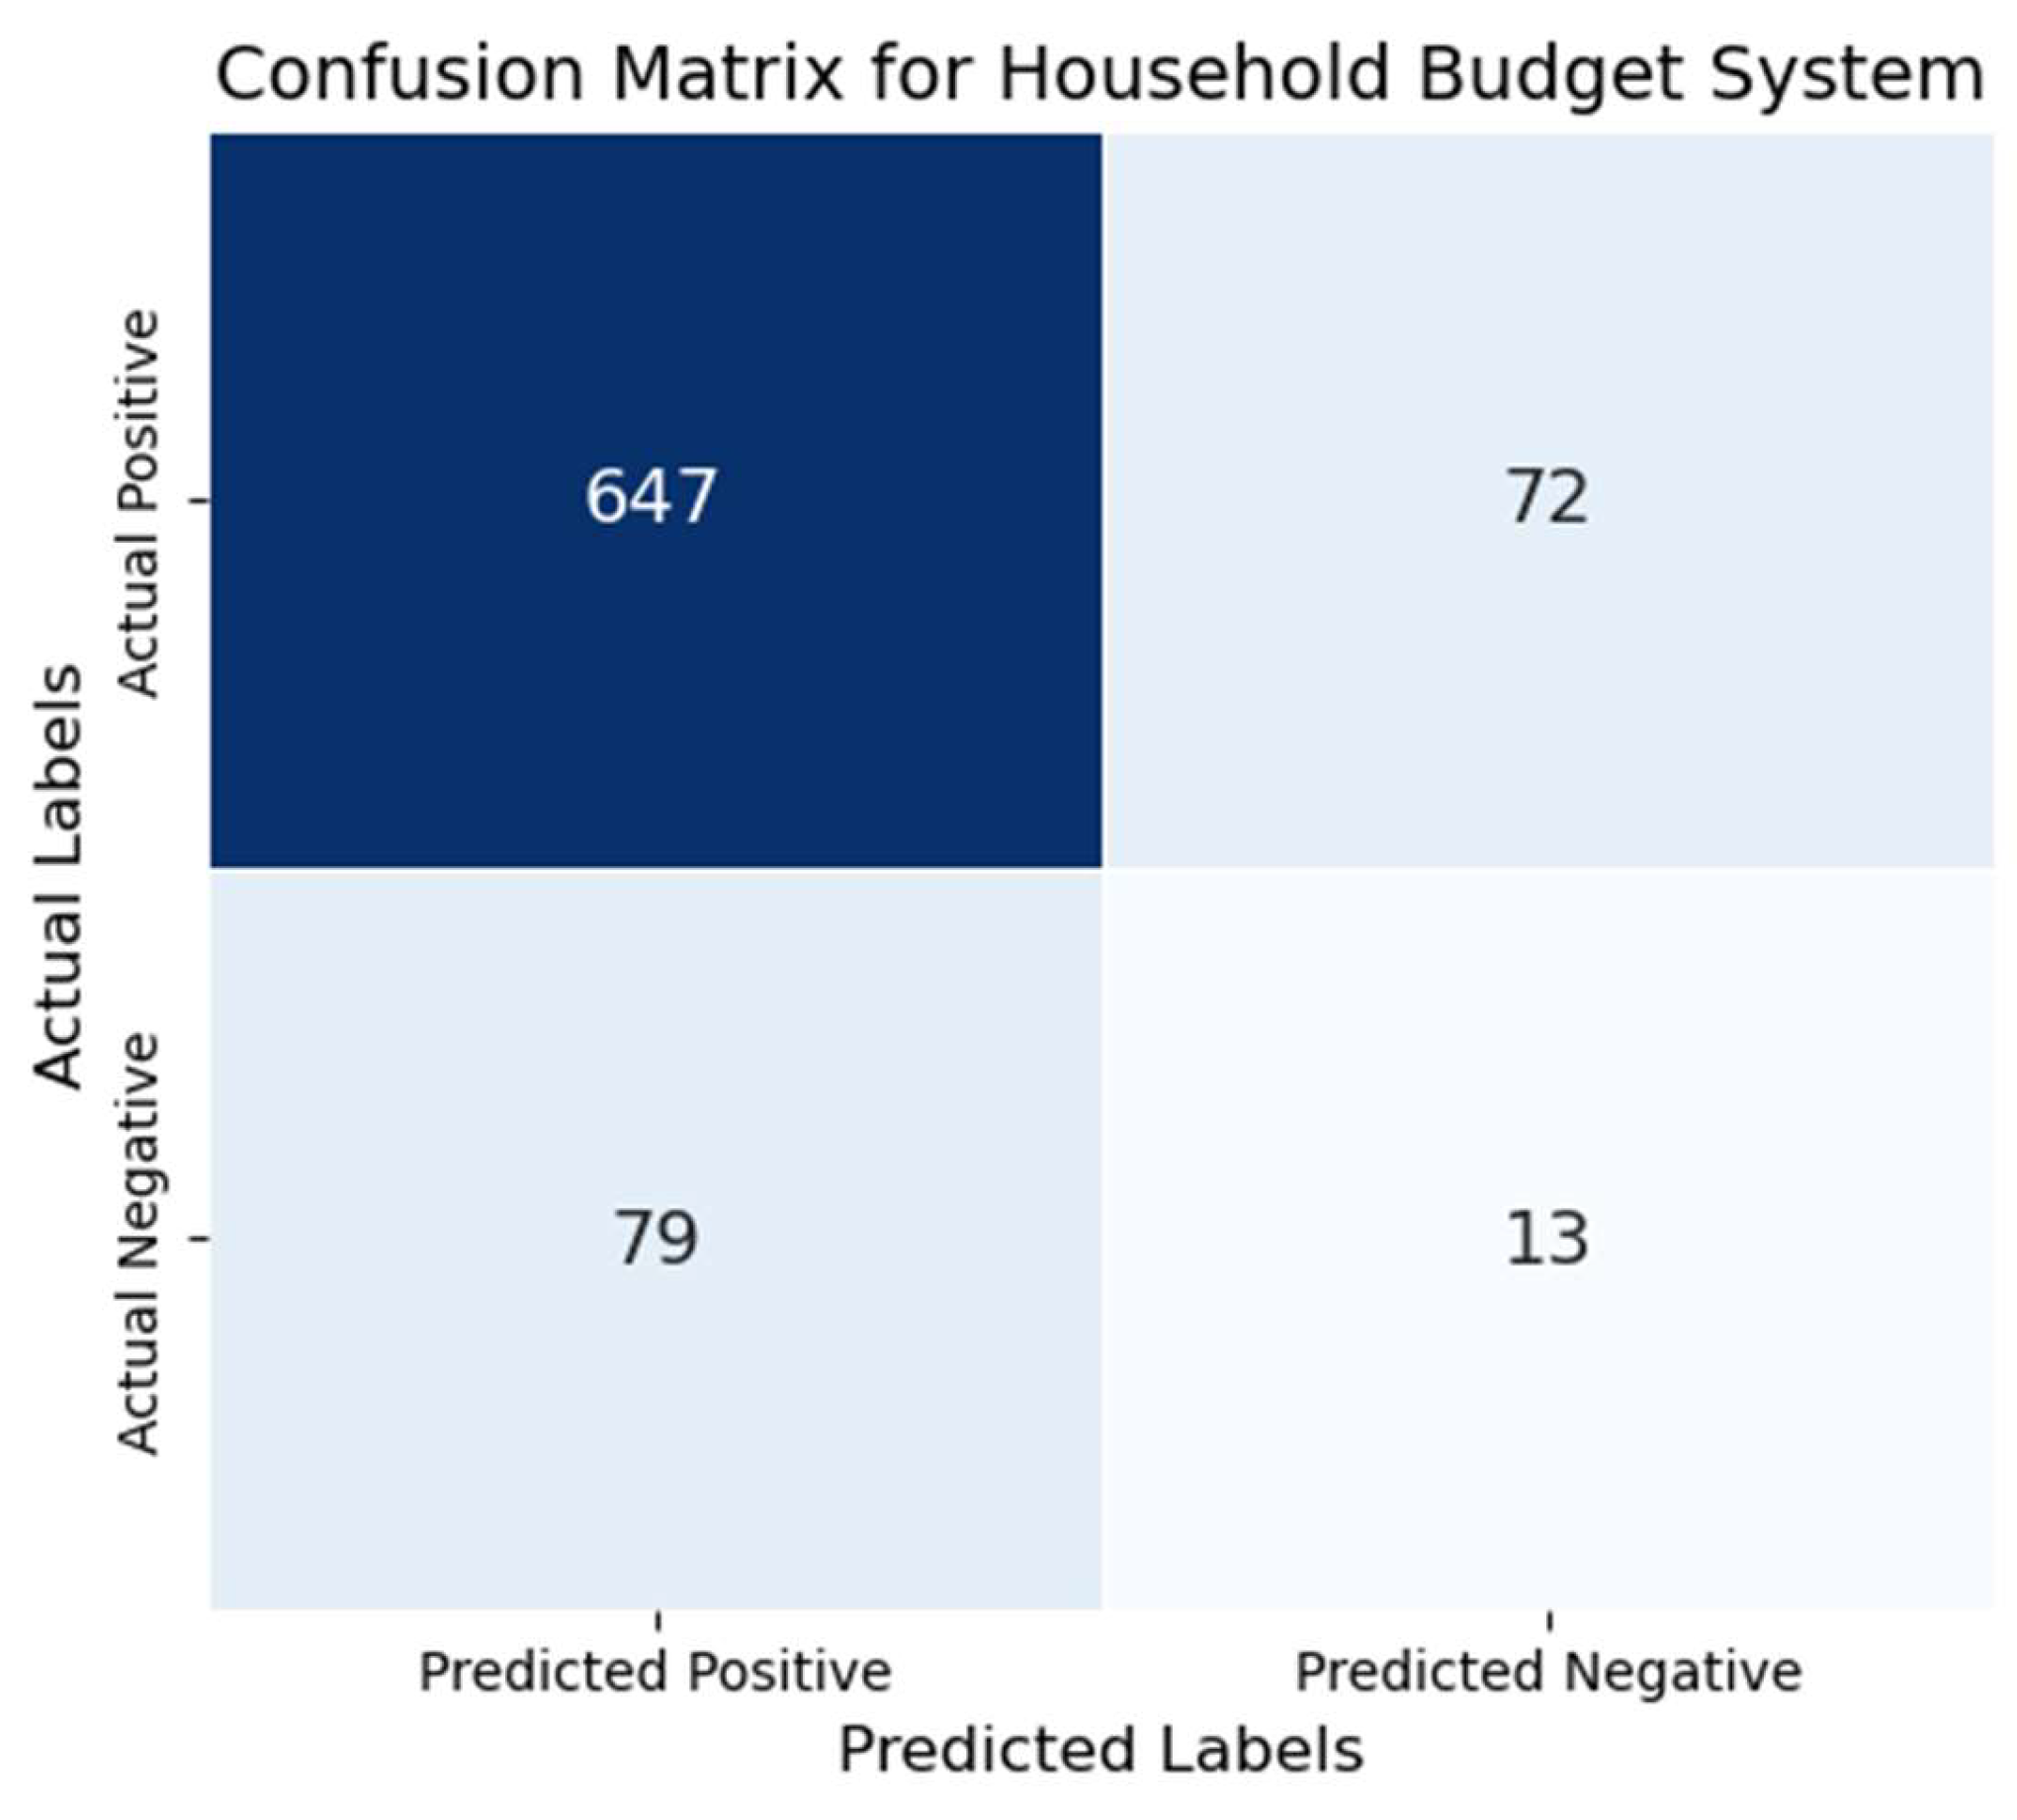
4.4.7. Confusion Matrix Analysis
- True Positives (TP): Correct positive predictions.
- True Negatives (TN): Correct negative predictions.
- False Positives (FP): Incorrect positive predictions.
- False Negatives (FN): Incorrect negative predictions.
| Actual / Predicted | Predicted Positive | Predicted Negative |
|---|---|---|
| Actual Positive | True Positive (647) | False Negative (72) |
| Actual Negative | False Positive (79) | True Negative (13) |
- ⋅ True Positives: 647
- ⋅ False Positives: 79
- ⋅ False Negatives: 72
- ⋅ True Negatives: 13
| Data Frame Description |
Net Family Income | Budget | Family Members | Total Housing Cost | Total Medical Cost | Total Education Cost | Total Transport Cost | Total Debt Payment Cost | Other Expense Cost | Total Saving Cost |
|---|---|---|---|---|---|---|---|---|---|---|
| count | 811.00 | 811.00 | 811.00 | 811.00 | 810.00 | 811.00 | 810.00 | 811.00 | 811.00 | 809.00 |
| mean | 76813.17 | 78683.39 | 4.18 | 13208.55 | 2064.63 | 2441.30 | 1840.13 | 978.60 | 10236.35 | 8362.75 |
| std | 106866.43 | 106592.73 | 3.32 | 17893.91 | 9873.24 | 4928.83 | 5395.09 | 2808.48 | 24962.19 | 26086.98 |
| min | 5000.00 | 5500.00 | 1.00 | 824.00 | 0.00 | 0.00 | 0.00 | 0.00 | 0.00 | 0.00 |
| 25% | 28166.50 | 28946.50 | 2.00 | 5610.00 | 70.00 | 150.00 | 0.00 | 0.00 | 1000.00 | 0.00 |
| 50% | 49590.00 | 50040.00 | 3.00 | 8226.00 | 230.50 | 720.00 | 0.00 | 0.00 | 2271.00 | 3000.00 |
| 75% | 87612.00 | 89300.00 | 6.00 | 13200.00 | 896.25 | 2456.00 | 833.25 | 496.00 | 6863.00 | 10000.00 |
| max | 1051758.00 | 1051758.00 | 23.00 | 191856.00 | 205420.00 | 56100.00 | 55904.00 | 27314.00 | 264349.00 | 500000.00 |

4.5. Implementation:
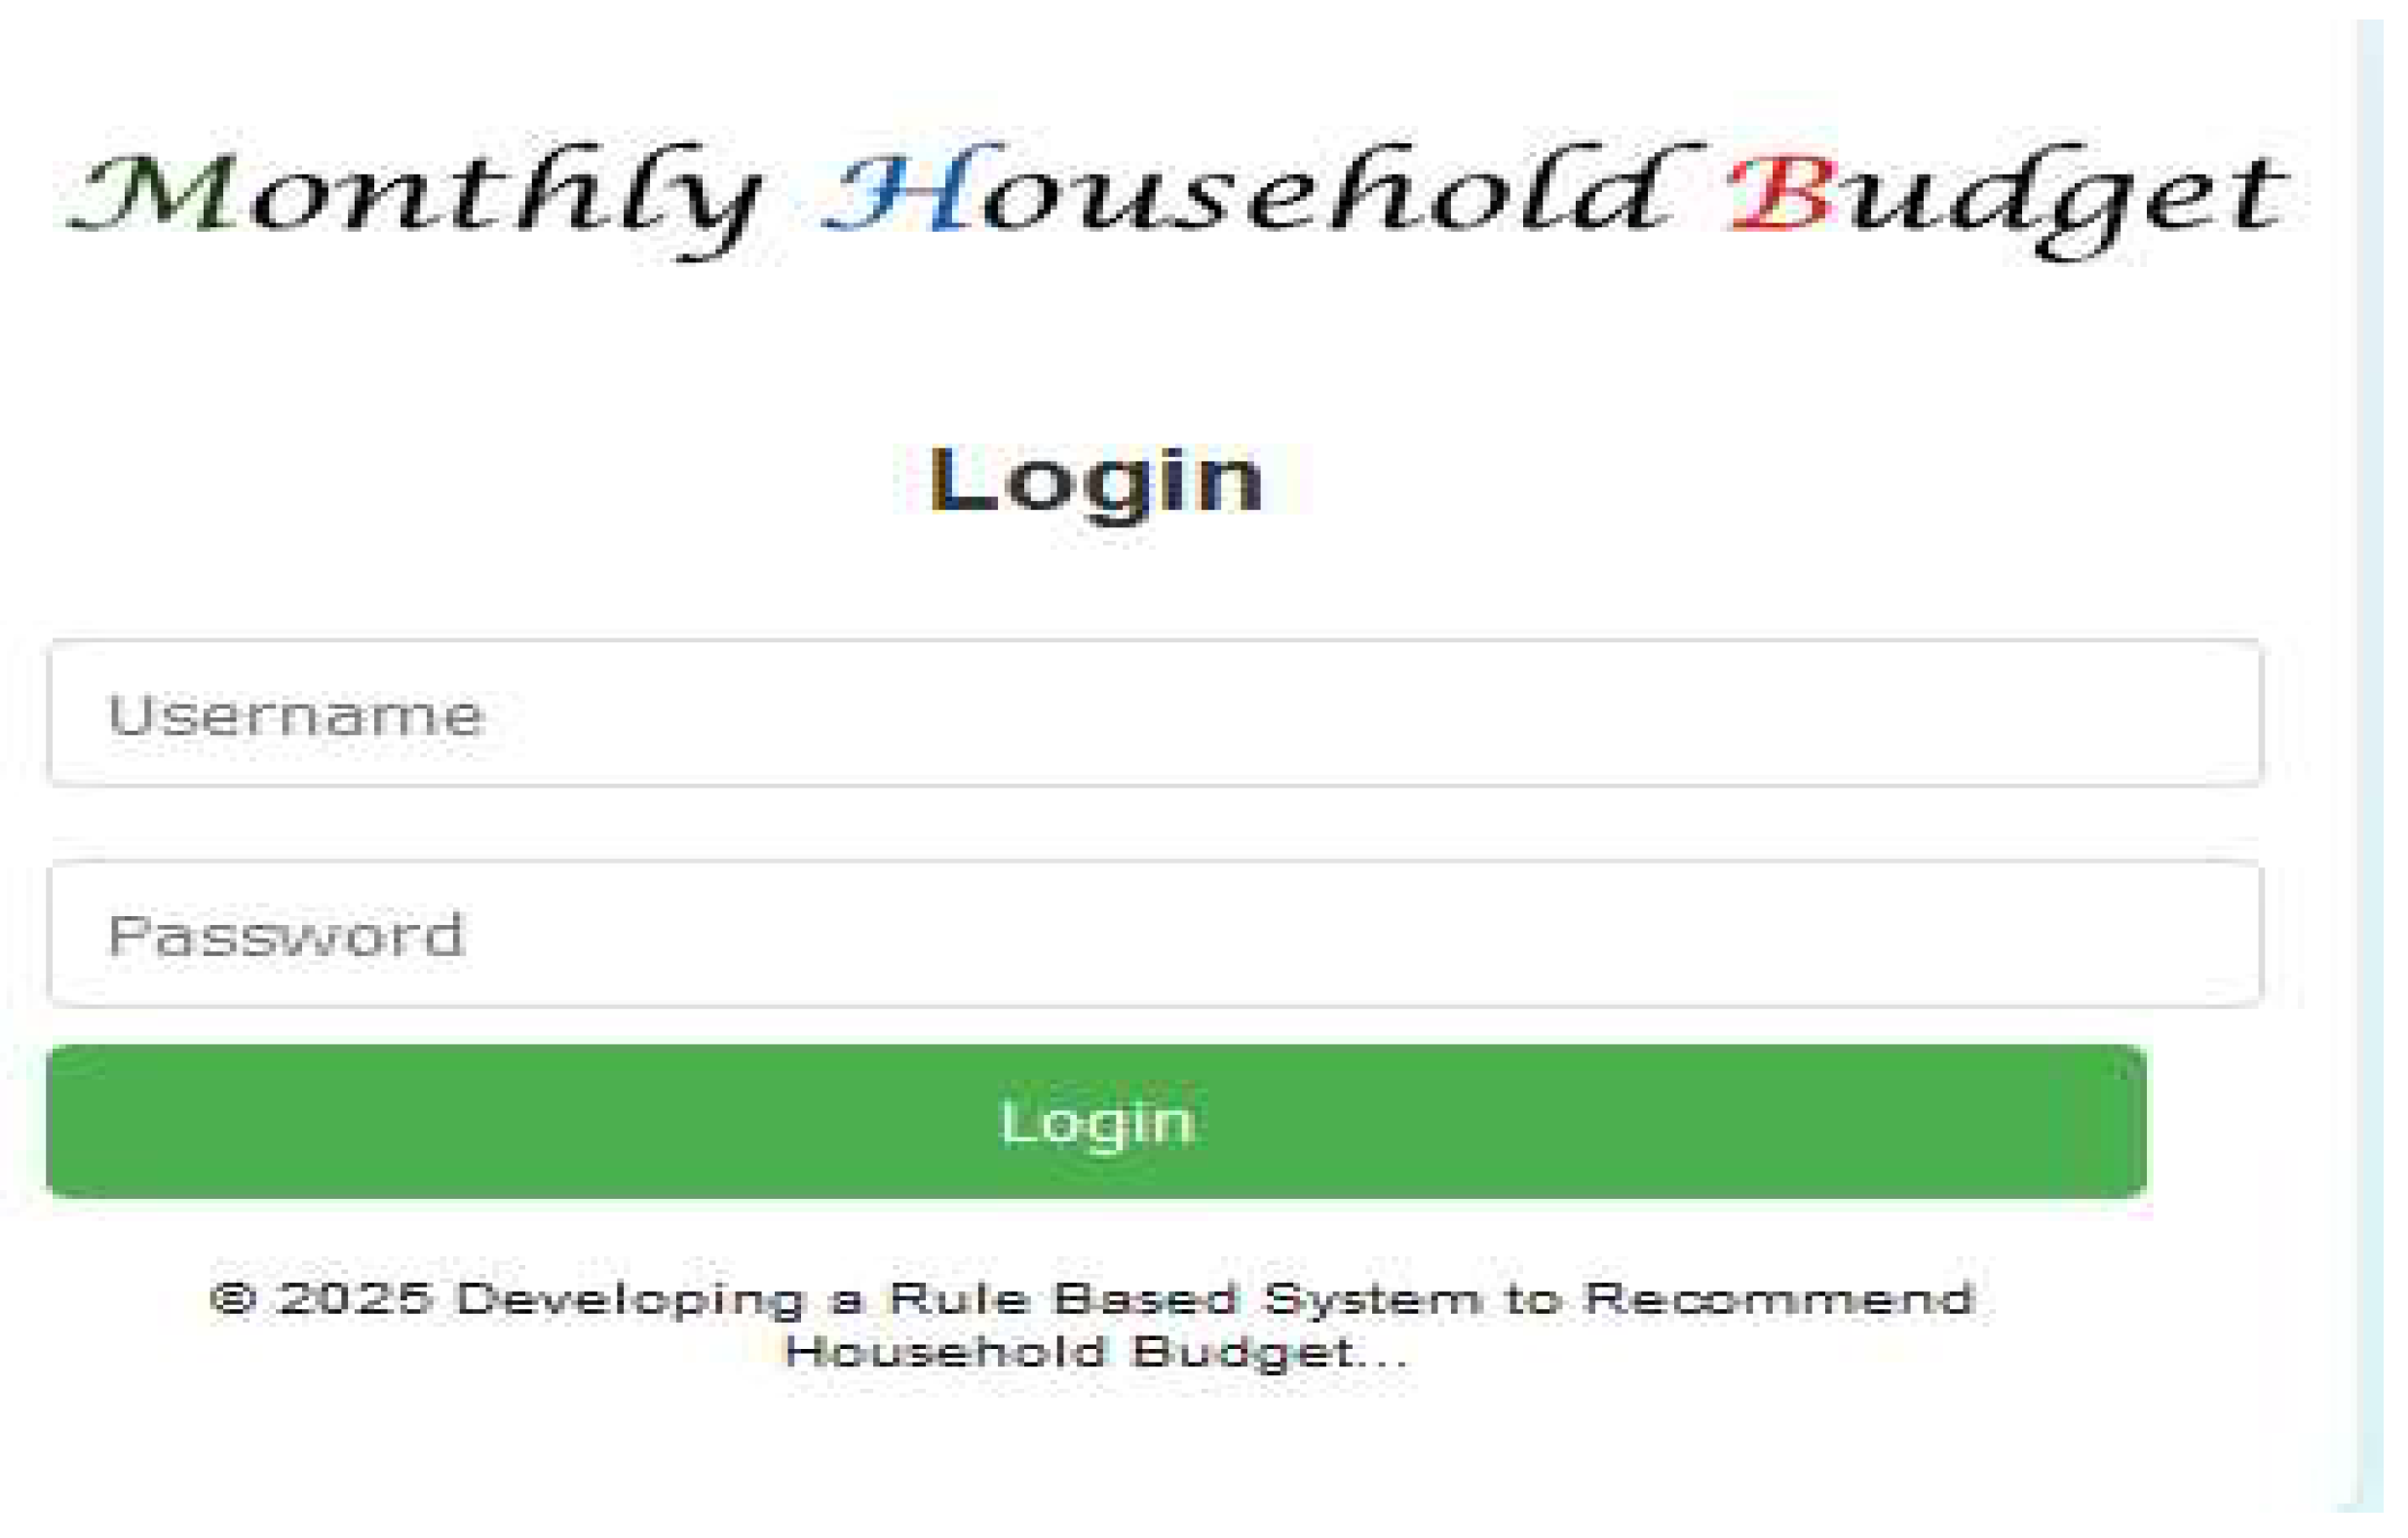
4.5.1. Login Page Explanation
-
User Input Fields: The page includes two input fields:
- ♦
- Username: A text field where the user enters their unique identifier.
- ♦
- Password: A password field that masks input for security.
-
Validation:
- ♦
- The system checks the provided username and password against predefined credentials.
- ♦
- Invalid credentials result in an error message displayed on the same page.
-
Session Management
- ♦
- Upon successful login, a session is initiated to track the user's authenticated state.
- ♦
- The user is then redirected to the input page (input.php), where they can begin interacting with the system.
- Feedback: If the authentication fails, a user-friendly error message is displayed, prompting the user to retry with correct credentials. User feedback is provided via error messages to guide them toward successful authentication.

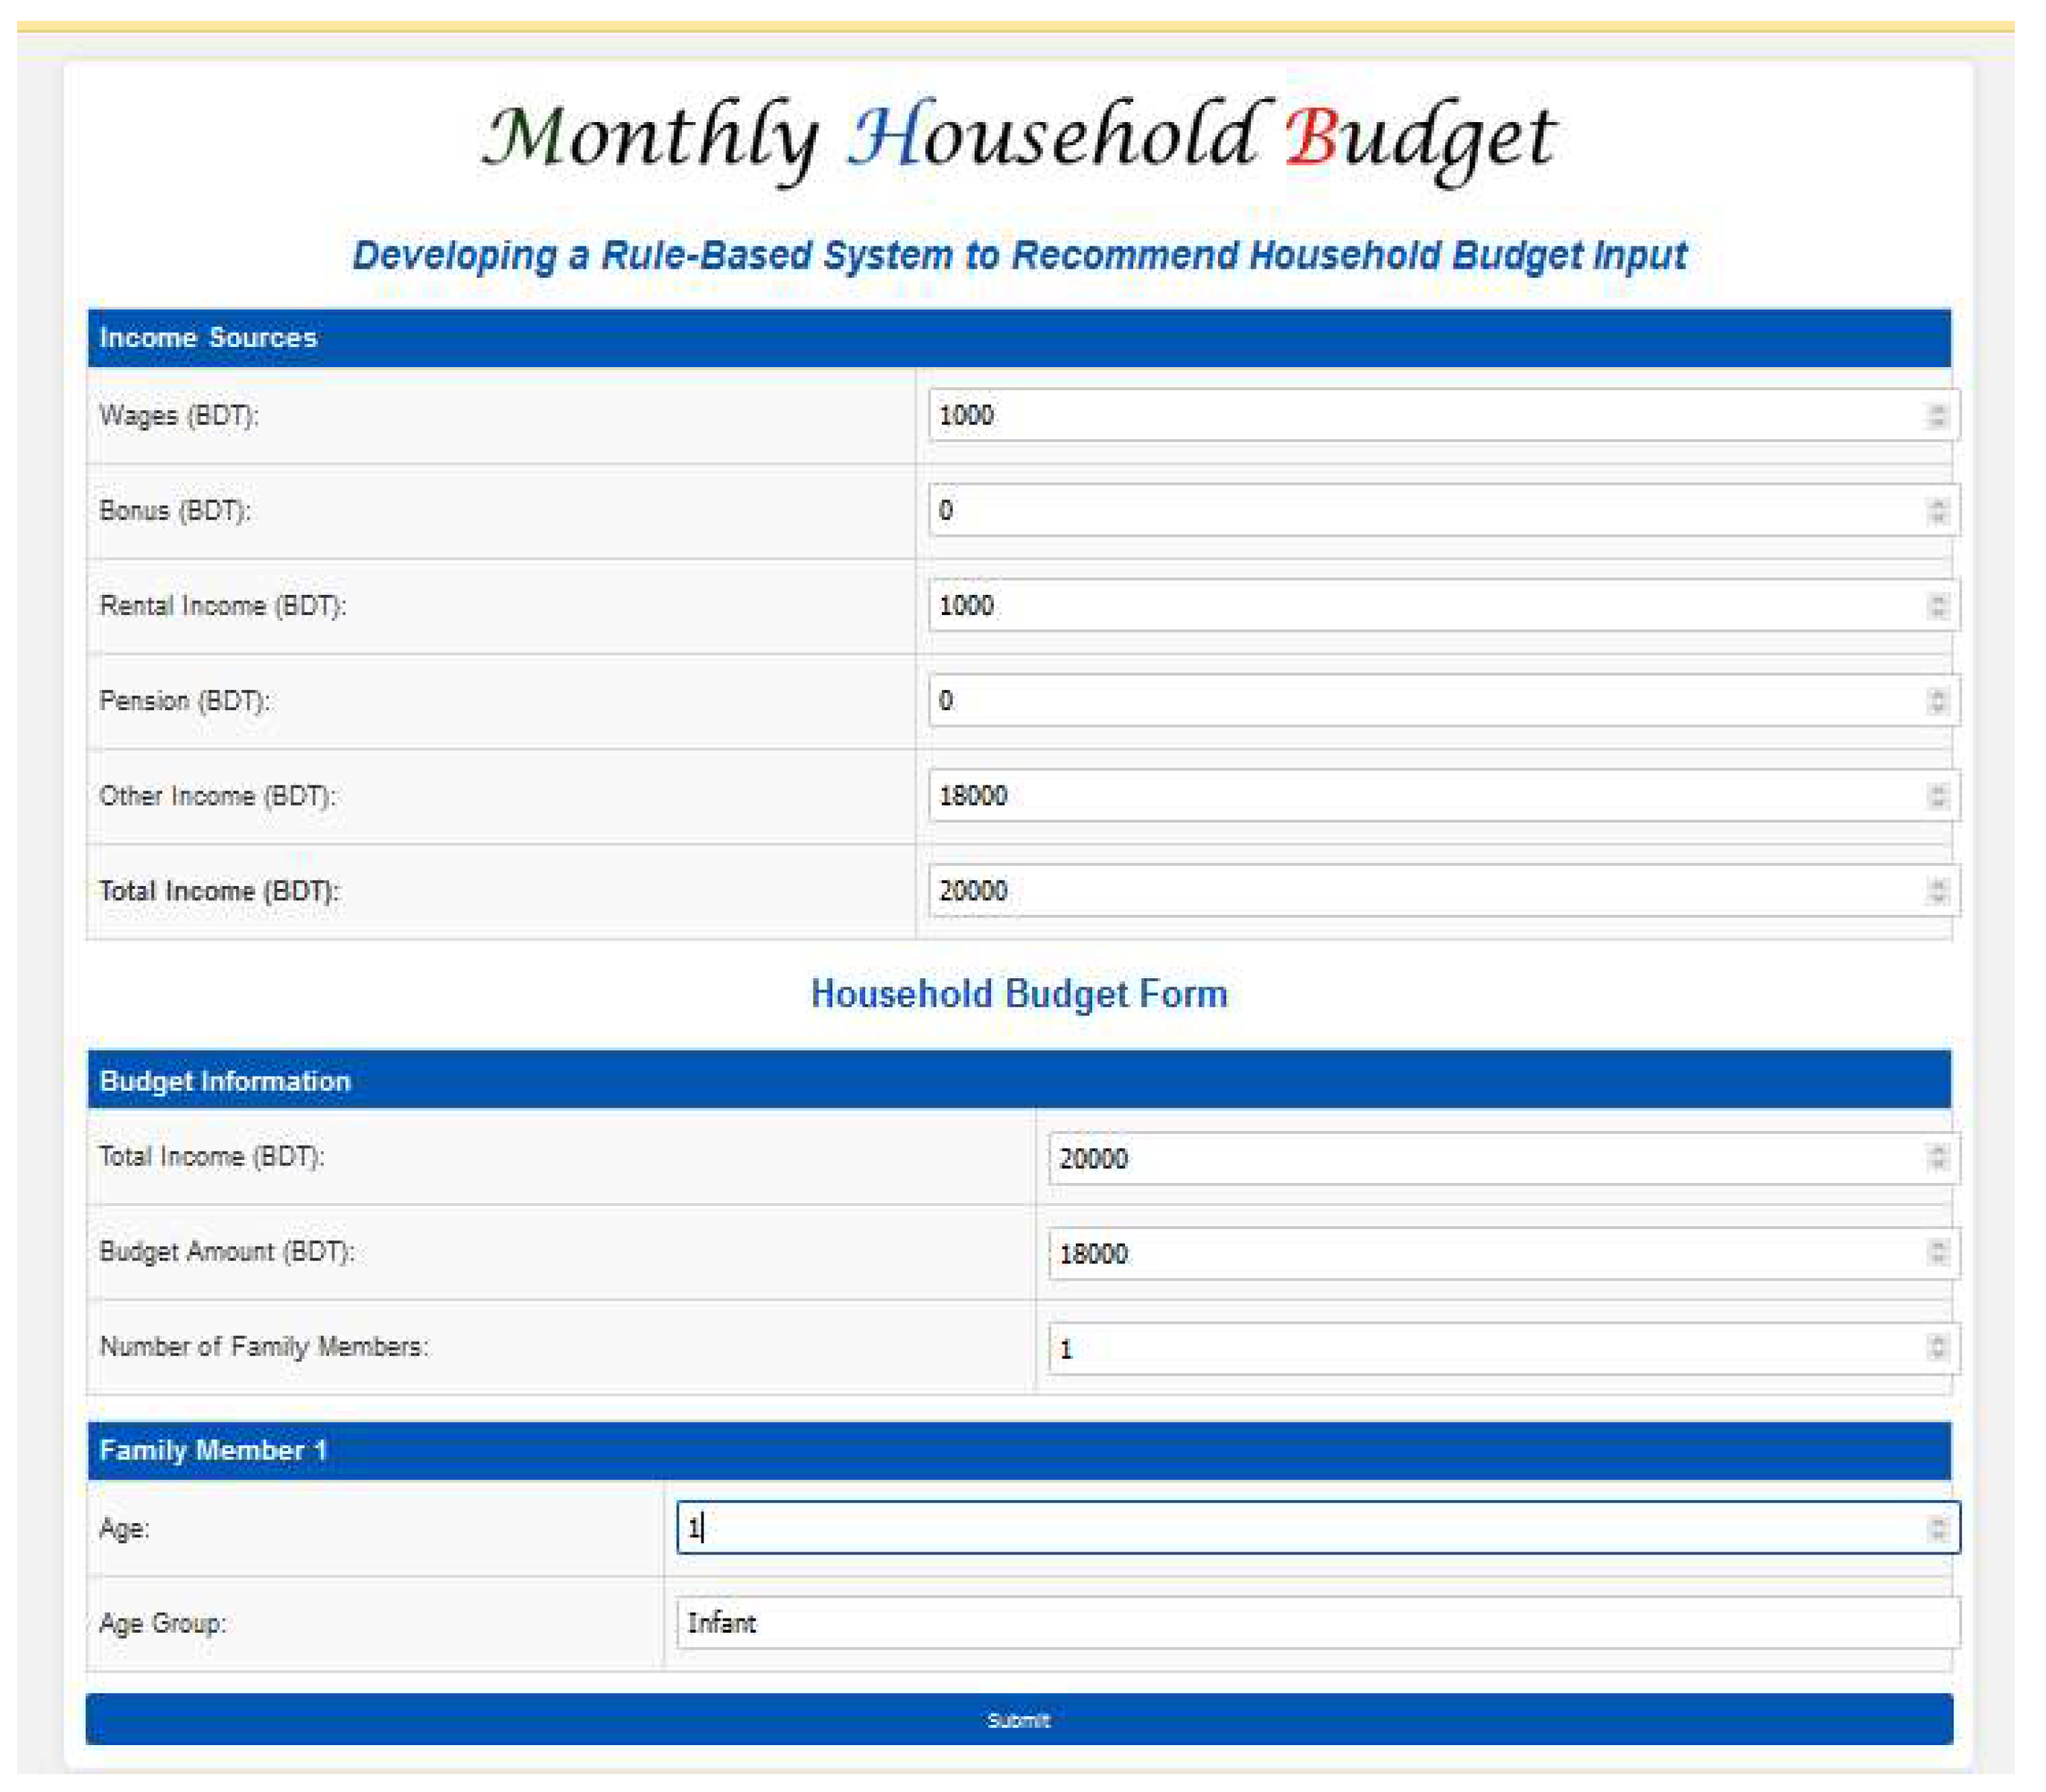
4.5.2. Input Design and Functionality
- Total household income.
- Total budget amount.
- Number of family members.
- Ages of each family member.
-
Total Income Field:This field allows users to enter their household income in Bangladeshi Taka (BDT).
-
Total Budget Amount Field:This field collects the overall budget amount specified by the user.
-
Number of Family Members:This field prompts users to specify the number of individuals in their household.
-
Dynamic Age Inputs:After specifying the number of family members, the system dynamically generates input fields to collect the ages of each family member. The user will enter the ages, and these values will help determine how to allocate the household income across the relevant expense categories (housing, food, medical, education, transportation, debt payments, other expenses, and savings).
-
Expense Calculation:Once the data is submitted, the system will calculate the recommended expenses for each category (housing, food, medical, education, etc.) based on the user's input. These expenses will be displayed on the output page, along with the remaining money after all expenses are accounted for.
-
Housing ExpensesIncludes Rent/Mortgage, Utilities, Taxes, Insurance, Repairs, Improvement, and Others.
-
Food ExpensesIncludes Rice, Cereal, Flour, Oil, Salt & Sugar, Fish & Meat, Milk, Vegetables, Fruits, and Others.
-
Medical ExpensesIncludes Insulin, Pressure Medicine, and Other general medical needs.
-
Education ExpensesIncludes Primary Education, Secondary Education, Higher Education, and Others.
-
Transportation ExpensesIncludes Car, Gas, Oil, Parking Fees, Public Transportation, and Other transportation-related expenses.
-
Debt PaymentIncludes Credit Card, Personal Loan, Student Loan, and Other debt-related payments.
-
Other ExpensesIncludes Groceries, Phone, Clothes, Entertainment, Miscellaneous, and Other personal expenses.
-
SavingsIncludes Stock, Bonds, and Other savings or investment options.
- Infant (age < 5)
- Child (age > 5 & < 10)
- Teenager (age > 10 & < 18)
- Young Adult (age < 25)
- Middle-aged (age > 30)
- Old (age > 50)
- Housing: 30-35% of income, based on family size.
- Food: 20-25% of income, based on family size.
- Medical & Education: Minimum 5% of income.
- Transportation: 5% of income (adjustable for special needs).
- Debt Payment: 5-10% of income, depending on debt levels.
- Other Expenses: Remaining income after essentials.
- Savings: 10-20% of income, depending on goals.
-
Infants (age < 5):
- ▪
- Only cereal is required under food expenses.
- ▪
- No education expenses.
- ▪
- General health care costs are included under medical expenses, but no specific treatments like insulin or pressure medication.
-
Children (age > 5 & < 10):
- ▪
- Full range of food expenses is required (rice, oil, fish, etc.).
- ▪
- Primary Education expenses are required.
- ▪
- Medical expenses may include general health care (e.g., vaccinations, doctor’s visits) but no insulin.
-
Teenagers (age > 10 & < 18):
- ▪
- Full range of food expenses.
- ▪
- Secondary Education expenses are required.
- ▪
- Medical expenses may include treatments for common illnesses, but no insulin.
-
Young Adults (age < 25):
- ▪
- Full range of food expenses.
- ▪
- Higher Education expenses, such as college fees and textbooks, if applicable.
- ▪
- Regular medical expenses, including insulin for diabetes (if applicable), and dental care.
-
Middle-aged (age > 30):
- ▪
- Full range of food expenses.
- ▪
- Typically no education expenses unless they have children.
- ▪
- Regular health maintenance (e.g., blood pressure medicine, chronic condition treatments).
-
Old (age > 50):
- ▪
- Full range of food expenses, with a focus on softer food (more vegetables, etc.).
- ▪
- No education expenses unless they are pursuing adult education.
- ▪
- Frequent medical expenses, including insulin for diabetes, and treatments for age-related conditions.
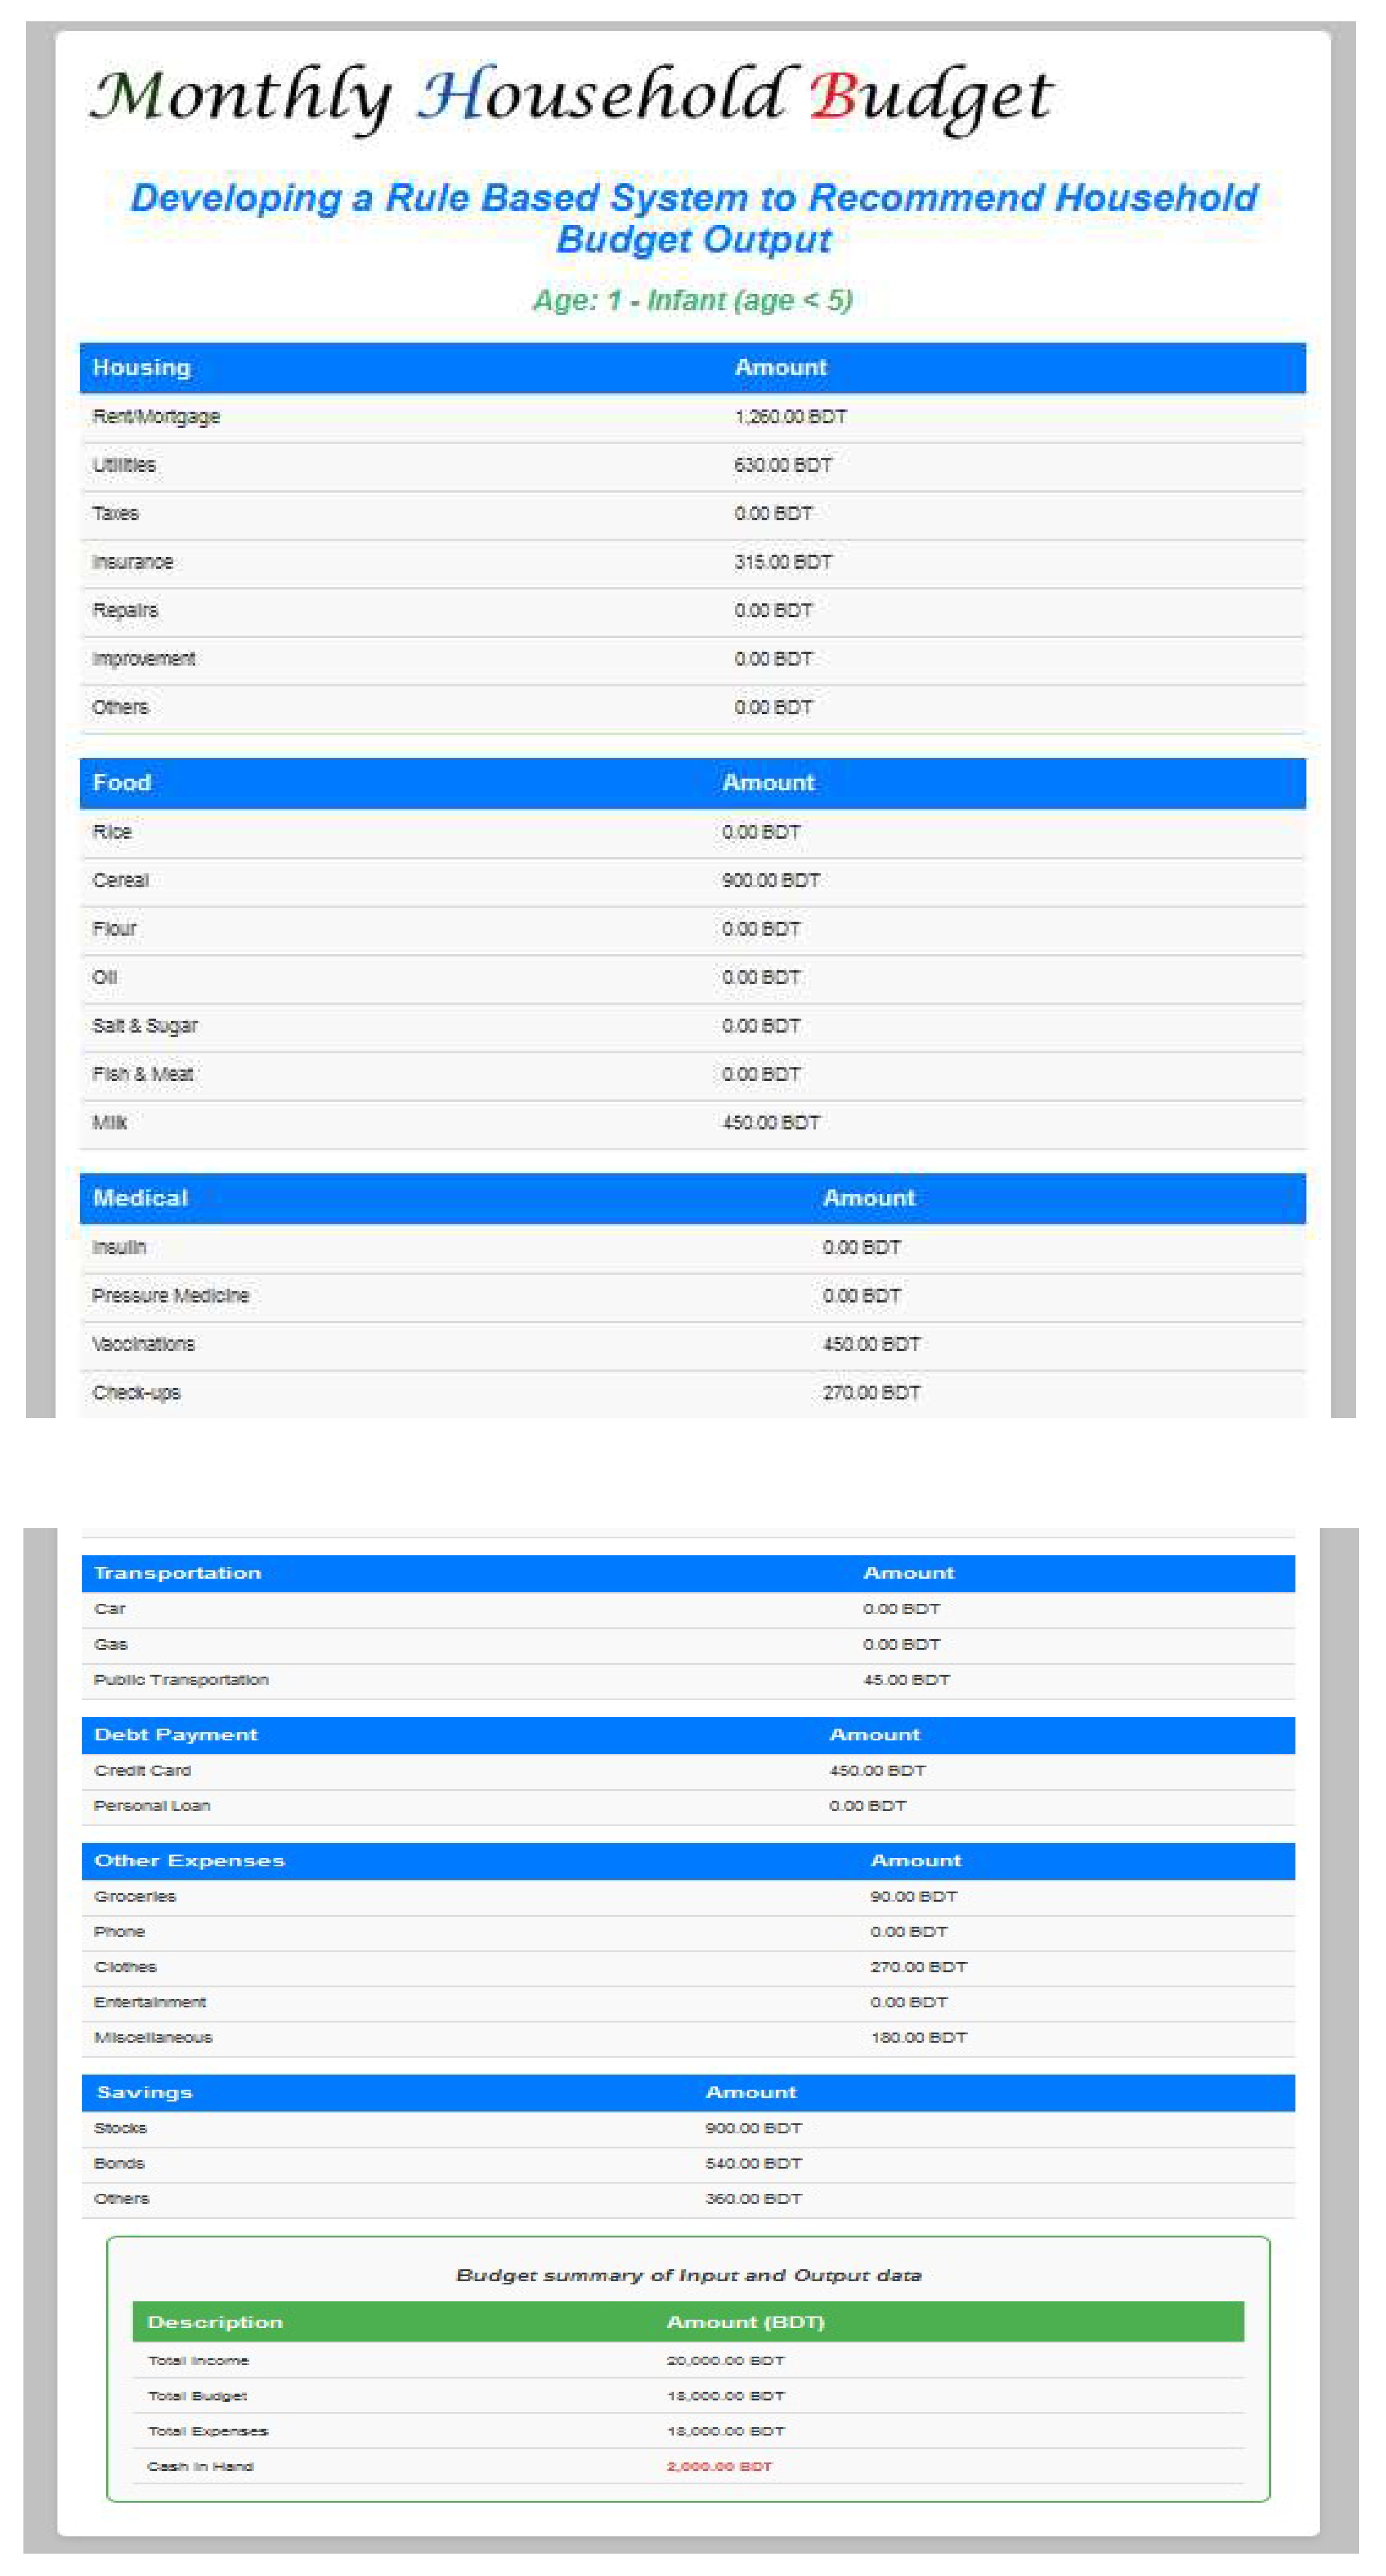
- The output page will show either the available cash in hand or the debt payment status, depending on the remaining budget after all expenses are calculated.
- If the total expenses are less than the income, the remaining balance is considered "cash in hand."
- If the total expenses exceed the income, the system will show the debt payment status and suggest areas for optimization.
4.6.3. Implementation Summary
4.7. Discussion
4.8. Conclusion
- Enhancing user customization : Allows users to personalize recommendations based on lifestyle.
- Integrating financial APIs : Helps track real-time transactions for better accuracy.
- Developing a mobile application : Expands accessibility for users managing budgets on the go..
References
- Debt.org. (n.d.). How to create and manage a budget. Retrieved from https://www.debt.org/advice/budget/.
- Delray Credit Counseling. (n.d.). The importance of a household budget. Retrieved from http://www.delraycc.com/budgeting/the-importance-of-a-household-budget/.
- Financial Mentor. (n.d.). Budget calculator. Retrieved from https://financialmentor.com/calculator/budget-calculator.
- Economics Discussion. (n.d.). Family budgets: Meaning, importance, and Engel’s law of family expenditure. Retrieved from http://www.economicsdiscussion.net/articles/family-budgets-meaning-importance-and-engels-law-of-family-expenditure/1457.
- Dominick, S. R., Widmar, N. O., Acharya, L., & Bir, C. (2018). A best-worst analysis of the relative importance of household budget categories. Journal of Consumer Studies.
- Stride, M. (2018). Budget 2018. Her Majesty’s Treasury Journal.
- A'Hearn, B., Amendola, N., & Vecchi, G. (2016). On historical household budgets. Journal of Historical Economics.
- Ogori, A. F., Adebayo, C. Y., & Apeh, M. O. (2013). The effect of budgeting on family living: A case for low-income earners of Kontagora, Nigeria. International Open Journal.
- Garg, T., & Sharma, G. (n.d.). Budgeting as a means to manage household finances. Journal of Household Financial Management.
- Ibragimova, D. (2012). Money management in Russian families. Journal of Finance and Economics.
- Latimaha, R., Bahari, Z., & Ismail, N. A. (2017). The basic needs budget of middle-income earners in high-cost cities in Malaysia using OLS regression analysis. Prosiding Perkim, 12, 633–641. ISSN: 2231-962X.
- Vermont Legislative Joint Fiscal Office. (2019). Vermont basic needs budgets and livable wage. Prepared in accordance with 2 V.S.A. § 505, January 15, 2019.
- Bekaroo, G., & Sunhaloo, S. (2007). Intelligent online budget tracker. Proceedings of the 2007 Computer Science and IT Education Conference.
- Sharma, S. (2016). Analysis of ideal monthly expenses of a family in Nepal. Tribhuvan University, Students.
- Noll, H.-H. (2007). Household consumption, household incomes, and living standards. Journal of Economic Studies.
- Yadav, S., Malhotra, R., & Tripathi, J. (2016). Smart expense management model for smart homes. Proceedings of the 2016 International Conference on Computational Techniques in Information and Communication Technologies (ICCTICT).
- Saunders, P. (1998). Household budgets and income distribution over the longer term: Evidence for Australia. SPRC Discussion Paper No. 89.
- Galperti, S. (2017). A theory of personal budgeting. University of California, San Diego - Department of Economics.
- Allegretto, S. A. (n.d.). Basic family budgets: Working families' incomes often fail to meet living expenses in the United States. International Journal of Health Services.
- JavaTpoint. (n.d.). Decision tree algorithm. Retrieved from https://www.javatpoint.com/machine-learning-decision-tree-classification-algorithm.
- FreeCodeCamp. (n.d.). K-nearest algorithm. Retrieved from https://www.freecodecamp.org/news/k-nearest-neighbors-algorithm-classifiers-and-model-example/.
- Apus, J. O., Mantalaba, K. D. V., Mackno, A. J. B., & Bokingkito, P. B. Jr. (n.d.). Predicting the Filipino household income using Naïve Bayes classification algorithm. International Journal of Computing and Digital Systems.
- Althnian, A. (2021). Design of a rule-based personal finance management system based on financial well-being. International Journal of Advanced Computer Science and Applications (IJACSA), 12(1).
- Latimaha, R., Bahari, Z., & Ismail, N. A. (2020). Monthly budget shortfalls in Malaysia. Journal of Financial Studies.
- Araji, S. Z., et al. (2021). Affordable housing challenges. International Journal of Housing Policy.
- Bumpass, R., & Sweet, L. (2019). Household budget analysis techniques. American Economic Review.
- Saunders, P., & Galperti, S. (2022). Smart financial planning models. Journal of Technology and Finance.
Disclaimer/Publisher’s Note: The statements, opinions and data contained in all publications are solely those of the individual author(s) and contributor(s) and not of MDPI and/or the editor(s). MDPI and/or the editor(s) disclaim responsibility for any injury to people or property resulting from any ideas, methods, instructions or products referred to in the content. |
© 2025 by the authors. Licensee MDPI, Basel, Switzerland. This article is an open access article distributed under the terms and conditions of the Creative Commons Attribution (CC BY) license (http://creativecommons.org/licenses/by/4.0/).


