
Submitted:
12 February 2025
Posted:
12 February 2025
You are already at the latest version
Abstract
Pectin is a complex and versatile polysaccharide crucial for various industries. It functions as a thickener, gelling agent, emulsifier, and low-calorie food. Its anti-inflammatory and immunomodulatory properties have attracted biomedical interest, while its biodegradability and biocompatibility make it valuable for biomaterial applications. The effectiveness of these applications depends on the quality of pectin extraction procedures While traditional extraction methods exist, green methodologies and alternative techniques have improved pectin's physicochemical properties—a significant advantage for industrial applications. Pectin can be extracted from various sources, with its molecular structure and functional groups analyzed through different characterization techniques. Modern green extraction methods include ultrasound-assisted extraction, pulsed ultrasound-assisted extraction, pulsed electric field, moderate electric field mediated extraction, microwave-assisted extraction, subcritical water extraction, enzyme-assisted extraction, ohmic heating-assisted extraction, ultrasound-assisted microwave extraction, ultrasound-assisted ohmic heating extraction, hydrothermal processing, high-pressure processing extraction, and dielectric barrier discharge extraction. This review examines these methods' advantages and disadvantages, along with their applications and future possibilities; it serves as a comprehensive guide for researchers exploring new pectin-rich sources and green extraction technologies for commercial applications.
Keywords:
Pectin
; Extraction
; Physical Properties
; Characterization
; Greener Techniques
1. Introduction
Fruit processing industries generate substantial waste, primarily consisting of seeds and peels. In juice production facilities, approximately 50% of fruit becomes waste material, with peels accounting for 50–55% of this waste. This creates serious environmental challenges as microbial decomposition leads to the mission of greenhouse gases [1]. Consequently, it is now imperative that fruit waste be managed sustainably [2]. Food processing produces byproducts of bioactive compounds, including pectin. These pectins from the food processing industries are considered non-toxic heteropolysaccharides [3] that have also been actively used in the cosmetic and pharmaceutical industries [4]. Pectin has a variety of uses in the food, pharmaceutical, and healthcare industries, as well as in packaging regulations. In food processing, it acts as a thickener, emulsifier, and stabilizing agent. The pharmaceutical industry employs pectin to develop medications for lowering blood cholesterol, treating gastrointestinal disorders, and cancer therapy [5]. To support its continued use in the food industry, pectin must be recovered and extracted from food waste materials [6,7]. In plants, pectin naturally occurs in cell walls, intercellular spaces, and the central lamella, connected through glycosidic linkages [8]. This compound is essential for mechanical strength and intercellular connections, providing plant tissue with its firmness and structure. Additionally, it contributes to plant cells' turgidity and resilience [9]. The term "pectin" encompasses various polymers that differ in molecular mass, chemical composition, and sugar concentration, as different plants produce pectin with distinct functional properties. Common sources of pectin include citrus peel, apple pomace, cocoa husk, and potato pulp [10]. Certain fruits such as apples, citrus fruits, blackberries, cranberries, gooseberries, grapes, and plums contain high levels of pectic components in their polysaccharides. Notably, mature banana peels contain higher pectin concentrations compared to other fruits [11]. Furthermore, the abundance of pectin in various fruits and vegetables demonstrates its role in maintaining cell wall strength, flexibility, and biological processes. Pectin content varies significantly by source: citrus peels contain 20-30% pectin, sugar beet yields 10-20%, while apple pomace contains less than 15% on a dry weight basis [12].
Louis Nicolas Vauquelin isolated the molecule pectin from the fruit known as tamarind for the first time in 1790. Henri Braconnot first used pectin in 1825, derived from the Greek word "pektikos," which means solidifying or coagulating [13]. Modern nutritionists have shown particular interest in pectins as they serve as dietary fiber that increases transit time and glucose absorption in the digestive tract, leading to notable physiological effects [14]. The structure of pectin determines its physicochemical characteristics, making it essential to investigate the extracted pectin's structure. The source of the pectin, plant growth phases, and their extraction conditions significantly impact pectin structures [15]. The backbone of pectin is made up of galacturonic acids (GalpA) joined by (1,2)-linked β- L- rhamnose (Rhap). Galacturonic acid and its units are linked with additional substances found in the cell walls of plants, such as lignin, cellulose, or polyphenols [16]. Homogalacturonan (HG) and rhamnogalacturonan I (RG-I) are the most prevalent classes of these extremely complex polysaccharides that are covalently bonded. Rhamnogalacturonan II (RG-II), xylogalacturonan (XGA), and apiogalacturonan (AGA) are examples of small constituents of substituted galacturonans [17]. Given the intricate structure of the polysaccharides in pectin and the fact that plants retain the many genes needed to synthesise pectin, it is likely that pectin serves a variety of purposes in the growth and development of plants. During ripening, the pectin structure is hydrolyzed by enzymes such as pectinase and pectinesterase. The main job of the enzyme pectinase is to break down the pectin's whole structure by cleaving the primary pectin chain and its side branches, changing it into a common soluble polymer [18]. The chemical structure of pectin is very interesting as it consists of linear polysaccharides with a higher molecular weight varying between 75,000-125,000 g/mol [19]. The carboxyl groups can be found free or as salts with calcium, sodium, or other tiny counterion of residual uronic acid. They can also be found naturally esterified in certain situations, typically with methanol. The presence of free carboxyl groups contributes to pectin's acidic nature The chemical structure of pectin is affected by its physicochemical properties, such as molar masses, extent of methylation, and esterification, which in turn is vital for functional characteristics like gelling, solubility, and viscosity [20]. The structure of pectin can be modified by non-sugar components like methanol, acetic acid, phenolic acids, and sometimes amide groups. In addition, these non-sugar components consist of polyesters, polyhydric alcohols, poly acids, reduced carbohydrates, certain polar carboxyl groups, and non-polar methyl groups [21].
The process of separating pectin from the source plant matter is the first step in using it. Historically, using acid for commercially extracting pectin has become the norm [22]. However, pectin extraction techniques remain an important challenge requiring further research. Optimizing the extraction process and improving the quality of the pectin need the use of an efficient extraction technique. Green extraction techniques have emerged as an alternative approach in recent years due to the growing awareness of environmental protection. Later on, several eco-friendly extraction techniques, such as enzyme-assisted extraction (EAE), microwave-assisted extraction (MAE), and ultrasound-assisted extraction (UAE), have been developed to improve pectin quality and efficiency [23,24,25]. This review will discuss many other green techniques for pectin extraction.
Pectin has many potential applications, from the industrial and pharmaceutical sectors to the primary food processing industries. Various applications of pectin have been demonstrated in Figure 1. The compound has gained significant importance in nutrition, food, and health sectors. Its molecular structure, comprising polar and nonpolar components, enables seamless integration into various food items [26]. Contemporary data suggests that people are more focused on healthy diets and are actively looking for feasible substitutes for petroleum-based plastic used in food packaging [27]. The edible polymers make excellent alternatives to these plastics, given their non-toxicity, environmental friendliness, and compatibility with most foods. Because of its capacity to gel and transport active substances like antimicrobials and antioxidants, pectin has justly found application in edible packaging [28,29]. Pectin is a valuable thickener [30], stabilizer [31,32,33], and emulsifier [34] in the food industry because of its multipurpose qualities. Pectin is frequently employed in jams, marmalades, and jellies because it can create a viscoelastic solution and a structural network. Pectin’s origin and the way it is processed directs particular qualities, resulting in its varied uses. For instance, in comparison to pectin from other plant fruits, apple pectin is characteristically more viscous and provides dark shades. As a result, it works better with fillings and pastries. However, compared to apple pectin, citrus pectin is lighter and better fit as a texturing ingredient for jam and sweet jellies. So, it can be inferred that the structure of pectin can influence its use [35]. Additionally, pectin has also been shown to have biomedical and biomaterial applications. Although humans cannot digest or absorb pectin, it helps with good bacteria in the large intestine to provide prebiotic qualities [36]. Several researchers [37,38] have documented the health benefits of pectin use, which include preventing inflammatory and allergic illnesses, supporting cancer treatment, and reducing blood sugar and cholesterol levels. While numerous literature reviews cover pectin's extraction, structural chemistry, pharmaceutical applications, and its nutritional and functional properties in food packaging [39,40,41,42,43], comprehensive research on greener extraction techniques and their applications remains limited. This review examines green extraction methodologies of pectin, their physiochemical properties, structural characterization, and future multidisciplinary applications.
2. Physiochemical Properties
2.1. Percentage Yield
The extraction yield percentage varies based on several factors: the compound's nature, solvent type and polarity, temperature conditions, extraction method, presence of interfering substances, and the sample-to-solvent volume ratio. The pectin’s yield was calculated using a conventional method and was determined using the following formula:
The pectin extraction depends on different factors and conditions. The temperature, pH and time for the utmost yield (23.64 %) for the isolation of pectin from citrus fruit is 94.13 °C, 1.45, and 114.7 min, respectively, according to Kamal et al. [44]. At a temperature of 80 °C, 1.5 pH and 60 min time with citric acid, the yield became 76 %, as concluded by Devi et al. [45]. The yield was maximum for the mango peel under temperature, pH, and time conditions, which were 90 °C, 1.5, and 120 min, respectively [46]. Meanwhile, the yield was 10.4 % to 59.3 % for the sundried peels under different conditions of temperature, pH, and time for the process [47]. Pectin obtained from cardamom lemon and China lemon is 8.08% and 12.73% using tartaric acid and ethanol [48,49]. Extraction of pectin from pomelo peel by the different methods of hot acid extraction (HAE), Microwave-assisted extraction (MAE), Ultrasound-assisted extraction (UAE) and Enzyme-assisted extraction (EAE) concludes that the outcome is highest in MAE and lowest in EAE. The instrumental data suggests no significant difference occurred among the different methods in the chemical structure. Still, the physicochemical properties are much different [50].. The demand for pectin is increasing across food, pharmaceutical, and fragrance industries, highlighting the need for a more efficient, simple, and environmentally friendly extraction process.
2.2. Color
Pectin powder, which is used across various industries, ranges from white to light brown in color. Its specific color varies by source due to the presence of additional compounds like essential oils and vitamins. Different citrus peels produce distinct colors: orange peel yields brown pectin, lime and white grapefruit peels produce golden yellow, lemon peel creates yellow, and red grapefruit peel results in golden yellow. These additional compounds help boost immunity, effectively turning waste materials into valuable resources [51,52,53].
2.3. Moisture and Ash Content
Pectin obtained from any source is a hygroscopic compound. The following formula is used to get any sample's moisture content. Usually, 5gm of dried sample in a Petri dish is placed in a hot air oven at 130°C for 2 hours, cold and kept in a desiccator, and later, the weight is taken to calculate the moisture content.
W1 = Weight of the Petri dish with sample (g); W2= Weight of the petri dish with dried sample (g)
The pectin extracted from lemon has a moisture content of 8.59–8.62 %, less than other citrus fruits. Low moisture content prevents the microorganisms from growing and is easier to store for a long time [54]. However, the orange peel powder showed higher MC values of 10.12% and 9.6% compared to sweet lime peel (9.4% and 9.0 %) and papaya peel (8.92% and 8.8%) extracted through similar treatment with HCl and citric acid [55]. The formation of gels from pectin is better in quality if the ash content is less. Hence, determining ash content is one of the main requirements for usage in different industries. The below equation calculates the percentage of ash. In this process, 1.2 g. of sample is ignited and heated for 3-4 hours at 600ºC, cooled and weighted accurately until a constant reading is obtained.
Where W1= Weight of the empty Petri dish (g) W2 = Weight of the Petri dish with ash (g)
The papaya peel powder contained higher amounts of ash content (3%) than the orange peel (2.6%) and sweet lime peel (2.4%) extracted with HCl. However, different scenarios were observed with citric acid, where sweet lime showed higher ash amounts (3.28%) than papaya peel (2.9%) and orange peel (2.1%). The ash content in the pectin obtained from lemon peel is much lower than that of other fruits, so it is widely used in making gels [56].
2.4. Galacturonic Acid Content
In plants, pectin mainly contains galacturonic acid units. The amount of pectin in plants decreases from the primary cell wall to the plasma membrane. Galacturonic acid is also noted as a pectin carbohydrate. Plants have three pectin domains: homogalacturonan, rhamnogalacturonan I, and rhamnogalacturonan II. Xylogalacturonan and homogalacturonan are also terms of pectin because of the presence of homogalacturonan as a backbone. This is known as substituted galacturonan, and the backbone comprises d-galacturonic acid units [57]. Gelling ability depends on the degree of methyl esterification. The names higher and lower methoxy pectin are based on the degrees of methyl esterification, which will be higher and lower than 50%, respectively [58]. The pectin content is higher in citrus and apple pomace than others, so these fruits are used for commercial extraction of pectin. The pectin extracted contains more than 65% galacturonic acid for the gel formation [31,59]. Pectin commonly represses a natural sugar, rhamnogalacturonan, that affects braking and knots in the galacturonic acid chain [12,60]. Galacturonic acid content was estimated using the formula:

Where, 176 and 31 are the molecular weights of galacturonic acid and methoxyl groups, respectively.
2.5. Equivalent Weight and Molecular Weight
It is necessary to determine the equivalent weight, which is vital in knowing the pectin’s quality. The molecular chain of pectin, which contains the free galacturonic acid, is the equivalent weight of the pectin. The physical properties, like viscosity, water binding, etc., are due to free galacturonic acid [49]. The titration method can be used to determine the equivalent weight in this process 0.5 g of pectin sample was mixed with 5 ml of ethanol and 1.0 g of sodium chloride along with 100 ml of distilled water so that all the sample was dissolved well which will be titrated with 0.1 M sodium hydroxide solution using the phenol red indicator. Pectin obtained from different citrus fruits, including citrus sinensis (10,000 g/mol) and citrus maxima (1250 g/mol), have higher and lower equivalent weights. It concludes that citrus sinensis has more viscosity and water-binding properties than others, leading to its usage in food and cosmetics [61,62,63]. The equivalent weight fluctuates based on the solvent used and pH in the extraction of pectin [64]. At lower pH, pectin polymerisation occurs, reducing free acid content and creating pectin with a higher equivalent mass. In contrast, higher pH produces pectin with a lower equivalent mass. Pectin is a large molecule typically found with high molecular weight, making it difficult to digest in its natural form. Human digestive enzymes cannot break down pectin effectively, so its structure needs modification to enhance its biological activity. The molecular mass of black mulberry is also higher, which indicates higher antioxidant properties [60,65]. The low-molecular-weight pectin extracted from okra gained interest because of its improved physicochemical properties, which could be helpful in industry for different applications. The low molecular weight is better than the higher one in the food industry. It could be used as an effective gelling agent and emulsifier, which is increasingly applied for its prebiotic values in functional foods.
2.6. Methoxyl Content (MeO)
Methoxyl content in the pectin greatly influences its gel capacity. Usually, commercial pectin contains 8–11% methoxyl content and causes high sugar gels exceeding 65%. Pectin has a higher methoxyl content when dissolved in water than pectin, which has a lower methoxyl content [66]. Yu et al. [67] reported that microwave-assisted extracted pectin (MAE) has 8.35% methoxyl content and exhibited higher apparent viscosity, thermal and emulsion properties. The pectin obtained via ultrasound-assisted extraction (UAE), enzyme-assisted extraction (EAE) and hot acid extraction methods (HAE) does not show significant differences in methoxyl content. In MAE, elevated microwave radiation levels decrease pH, and prolonged irradiation can reduce value [68]. Pectin extracted from apple pomace using an organic acid mixture (ORGS) showed a methyl content of 10.85%. This might be because ORGS has lower hydrolyzing capabilities and a lower dissociation constant [69]. Details of the methoxyl content of the pectin obtained from various sources and methods are listed in Table 1 [67,69,70,71,72,73,74,75,76,77,78,79,80,81,82,83,84,85,86,87,88,89].
2.7. Degree of Esterification (DE)
The DE value shows the number of esterified carboxylic acids in pectin, comparing the total number of carboxylic acid groups. In industry, this parameter indicates the gel-forming capacity of pectin. When DE exceeds 50% pectin, it is categorized as high methoxyl pectin (HM); lower than 50% is classified as low methoxyl content (LM). HM pectin quickly forms a gel at high temperatures and low pH. In contrast, LM pectin forms rigid gels by cross-linkage with calcium or multivalent cations [90]. Details of the degree of esterification of pectin obtained from various sources and methods are listed in Table 1 and Table 2. A significant change in the DE value was reported for pectin obtained from Pomelo peel [67]. The harsh conditions, followed in MAE and UAE, caused higher de-esterification of polygalacturonic chains, which reduced DE value. Citric acid, ultrasonic, and traditional heat extraction did not appear to change the degree of esterification of apple pectin [69], while the sonication time exhibited a negative effect on the DE for pectin obtained from dragon fruit peel [91]. An increase in the sonication time from 15 to 35 minutes reduced the DE value from 37.84 to 31.48%. Under prolonged exposure to sonication, an increase in de-esterification of polygalacturonic chains occurs, causing the decrement in DE value.
In the citric acid extraction method (CE), a decrease in pH value resulted in a reduction in DE value (65 to 57%) as reported for pectin extracted from Saveh pomegranate peel [92], while a decrease in DE value (44.7% to 24.3%) during the increase in the citric acid concentration by Hundie et al. [93]. A similar trend was seen in the pectin extracted from Pulp in Pods of Riang by Apirattananusorn et al. [94].
2.8. Polydispersity Index (PDI)
The polydispersity index (PDI) indicates the range of molecular weight distribution. It is the ratio between the average molecular weight (Mw) and the number of average molecular weights (Mn). A larger PDI indicates a wider Mw distribution. It can be seen that the values of PDI are quite divergent from each other for all samples. This behaviour is acceptable since pectin from the exact origin has a wide range on the polydispersity index value (Table 3) [74,95,96,97,98]. High temperatures and longer extraction times used in hydrothermal (HT) and conventional solvent methods break C-O bonds, causing the PDI value [74]. PDI of HT-extracted pectin was near the commercial pectin value, indicating a lower range of molecular mass distribution. A higher PDI value was reported for pectin extracted from dragon fruit using the enzyme-assisted method by Du et al. [95]. It was higher when comparing the PDI value of pectin extracted using ultrasonic-assisted hot acid extraction to cold or hot water extraction for pectin from pitaya [96]. This is attributed to the cavitation force possibly causing fragmentation of the pectin, leading to a decrease in Mw. Time taken for the hydrolysis-extraction process under the influence of high temperature and pressure decreases the molecular weight, which is the PDI value for pectin extracted from apples and sunflowers. At the start of the hydrolysis process, pectin degradation did not start. As it proceeds, the destruction of aggregated pectin occurs through a decrease in the polydispersity, which indicates the enrichment of pectin in the hydrolysis-extraction process by linear homogalacturonan chains [97]. As mentioned earlier, like the effect of extraction conditions, environmental growth can affect the molecular mass and, thereby, the PDI, as reported by Apirattananusorn et al. [94].
2.9. Acetyl Value
The Acetyl groups at O-2 or O-3 on homogalacturonan, which is the backbone of pectin, play a significant role in emulsification. Pectin has a lower acetyl value and shows higher gelling capability. The reported value for pectin extracted from different sources is given in Table 2 [85,86,87,88,89]. The degree of acetylation for pectin extracted from sugar beet flakes by various methods was performed by Dranca et al. [85]. Pectin extracted using pulsed ultrasound-assisted extraction (PUAE) showed a higher degree of acetylation. Yang et al. [86] showed that pectin obtained by acetic acid extraction is more compared to other acid extraction methods. Acetic acid is a weaker acid that can retain more methyl-ester.
2.10. Water and Oil Holding Capacity
Water and oil holding capacity (WHC and OHC) are two essential properties of pectin. It can be defined as the amount of oil/water entrapped by pectin after mixing, incubation, and centrifugation. These properties are controlled by the constituents' hydrophobic/hydrophilic character and the total charge density [98]. Oil holding capacity (OHC) controls its emulsifying property in the food industry. Water holding capacity (WHC) of pectin, due to the presence of -OH in its structure, helps decrease the syneresis rate in food products. The high degree of esterification increases the WHC value of pectin. Details of the WHC and OHC of pectin extracted from different sources are summarized in Table 4 [78,99,100,101,102,103,104,105,106,107,108,109,110,111,112,113,114,115].
3. Structural Characterization
3.1. Fourier Transform Infrared Spectroscopy (FTIR)
The potential capability of IR spectroscopy as a tool for quantitative analysis of pectin was pointed out by the beginning of the 1960s [116]. The peak value from FTIR spectra of commercial pectin is summarized in Table 5. A summary of FTIR results from various literature is given in Table 6 [69,70,71,72,73,74,75,85,91,93,117,118]. A significant difference was not observed between extracted and commercial pectin FTIR, as indicated by Wathoni et al. [77]. Also, the peak of the main structure of the pectin was not influenced by the different extraction methods.
3.2. Thermal Analysis
It's important to conduct thermogravimetric analysis (TGA) and differential scanning calorimeter (DSC) for extracted pectin to gather information regarding its thermal behaviour and identify possible target applications.
3.2.1. Thermogravimetric Analysis (TGA)
For pectin, temperature has a greater influence on the loss of mass, structural changes, conformational changes, changes of state, chemical reactions, degradation, etc. The thermal stability and mass loss of pectin can be measured using TGA as a function of temperature. Pectin typically undergoes a three-step degradation process: The first step below 100°C corresponds to water loss [98], and the second step is between 200 and 400°C due to pyrolytic decomposition and breaking of hydrolytic bonds. It consists of a primary and secondary decarboxylation involving the acid side group and a carbon in the ring. Due to oxidative reactions, the third stage was postponed, particularly for linoleic residues, as expected for the oxygen-scavenging effect of the double bonds [75,119]. Like commercial pectin, the pectin extracted from Citrus Limetta peels showed three-step degradations [74].
3.2.2. Differential Scanning Calorimeter (DSC)
For pectin, the DSC thermogram shows two prominent peaks: One for the endothermic property of pectin, which can be affected by extraction temperature, and another for exothermic property, affected by its constituents and raw material [120]. The first endothermic peak, between 50 and 150°C, is due to the evaporation of water molecules [98], followed by an exothermic peak between 210 and 270°C, which is associated with pectin degradation. DSC analysis for pectin extracted from pomelo peel with different extraction techniques was reported by Yu et al. [67]. Irrespective of the extraction method, all pectin showed exothermic peaks between 240 and 265°C, where the pectin degradation begins, and a significant difference was not observed for exothermic peak values. Notably, the pectin obtained by microwave-assisted extraction had a broader exothermic peak, indicating that the pectin had a higher thermal stability. In contrast, Mahmoud et al. [69], showed that pectin extracted by citric acid exhibited an endothermic peak that shifted slightly towards lower temperatures due to greater water content and altered pectin structure.. Another study by Dranca et al. [85] found varying thermal profiles in pectin samples: sugar beet flake pectins showed one or two endothermic peaks and one exothermic peak, while pectin from Malus domestica 'Fălticeni' apple pomace showed no endothermic peaks. Specifically, for CE and MAE pectin from sugar beet flakes, the first endothermic peak appeared at 156.42°C and 160.45°C respectively, with the second peak at 183.97°C and 190.08°C respectively. These endothermic peaks were linked to pectin melting, potentially caused by conformational changes and chemical bond cleavage preceding polysaccharide degradation [121]. The absence of endothermic peaks in the apple pomace pectin suggests no elimination of bound water from these samples. The pectin extracted from sea buckthorn peel also showed a melting temperature of 133.48°C, and the enthalpy of degradation was 269.03°C [72].
3.3. Scanning Electron Microscopy (SEM)
The particle size greatly influences the characteristics and end applications of pectin. Pectin with smaller particle sizes can quickly disperse in solutions, enhancing solubility and interaction with other food components. Scanning Electron Microscopy (SEM) can be used to investigate the effect of extraction methods and conditions on the morphology of the pectin [73,74,75,76,77,79,117,122,123]. Pereira et al. [117] studied the morphology of pectin extracted from passion fruit rinds using conventional, sub-critical water and pressurized natural deep eutectic solvents. The pectin extracted using water showed a uniform surface, while the acidified mixtures led to more heterogeneous surfaces.
The effect of the extraction method (MAE, UAE, and CE) on the morphology of apple pomace was studied by Dranca et al. [73]. The CE pectin had a homogeneous, smooth and porous structure compared to MAE pectin. Rapid increases in temperature and pressure in the MAE process can cause a rough surface for the pectin. The SEM of UAE pectin showed higher fragmentation but was closely packed. Similar morphology was reported for potato pectin extracted by combined ultrasound microwave-assisted acid extraction [122]. The pectin extracted from lemon peel also exhibited roughness and irregularity in morphology [75]. Das et al. [74] reported a visible structural difference between pectin obtained through hydrothermal (HT) and conventional solvent extraction with commercial samples. The morphology of HT extracted pectin closely resembled that of commercial pectin, which has a loose surface and some fractural changes. SEM of pectin extracted from feijoa using a conventional heating method showed relatively compact with a honeycomb surface, despite several cracks and potholes on the surface [76]. The surface of the apple waste using an organic acid mixture and ultrasonication was more compact, multilaminated, and flaky and looked extremely hard [79]. The high amount of neutral sugar in the pectin extracted from cocoa pod resulted in heterogeneous morphology [123]. The morphology of pectin extracted from mangosteen rind was compared with commercial pectin by Wathoni et al. [77]. The extracted pectin had a surface with relatively smaller particles than standard pectin.
3.4. X-Ray Diffraction (XRD)
X-ray Diffraction (XRD) can analyze the variation in amorphous and crystalline nature attributed to the source and extraction methods and conditions. A comprehensive summary of XRD results of pectin obtained from different sources is given in Table 7 [76,78,89,124,125,126,127,128,129,130,131]. Mahmoud et al. [69] used XRD to study how different extraction methods affect pectin's crystalline and amorphous nature from apple waste. The peaks below 2θ less than 20° indicate the pectin's semi-crystalline nature. A sharp peak disappeared for MIC, HC and ORG-extracted pectin due to the decrease in its molecular weight. A similar XRD pattern was reported for the pectin obtained from Indonesian mangosteen and standard pectin by Wathoni et al. [77]. In contradiction to the above, Duggal et al. [78] revealed that commercial pectin is more crystalline than pectin extracted from kinnow peel, having 2θ values at 14.31, 37.93 and 43.16°.
3.5. Nuclear Magnetic Resonance (NMR) Spectroscopy
Pectin is a complex structure with diverse heterogeneous polysaccharide groups usually found on the surface of the plant’s cell and in the cementing layer between the primary walls of adjacent cells, mainly responsible for the pectin’s mechanical strength and flexibility. By interacting with other components' cell walls, these also significantly influence their industrial applications. NMR spectroscopy is a valuable technique for component characterization and structure elucidation. It is a promising device for quantitatively determining functional groups of complicated structures where all the equivalent nuclei possibly bring about signals with equal intensity despite their chemical background. This NMR technique has been well established for determining pectin structure related to the macromolecule chain (Table 8). The preparation of solutions for NMR analysis is complex. However, it is easily dissolved in water, making it more viscous, which could complicate NMR solution preparation for its analysis.
4. Eco-Friendly Extraction Techniques
In recent years, the demand for pectin—a versatile polysaccharide widely used in food, pharmaceutical, and cosmetic industries—has surged due to its gelling, thickening, and stabilizing properties. Traditional pectin extraction methods typically rely on acid hydrolysis and extensive thermal processing, both of which consume significant amounts of energy and generate chemical waste, raising environmental and economic concerns [135]. Researchers have increasingly turned to eco-friendly extraction techniques that improve efficiency while reducing environmental impact to address these challenges. These greener methods minimize the use of harmful solvents and excessive energy consumption and maintain the extracted pectin's structural integrity and quality. Innovations such as ultrasound-assisted extraction, pulsed ultrasound-assisted extraction, pulsed electric field, moderate electric field mediated extraction, microwave-assisted extraction, subcritical water extraction, enzyme-assisted extraction, ohmic heating-assisted extraction, ultrasound-assisted microwave extraction, ultrasound-assisted ohmic heating extraction, hydrothermal processing using water, high-pressure processing extraction, and dielectric barrier discharge extraction present promising pathways for achieving more efficient and environmentally responsible pectin production.
4.1. Ultrasound-Assisted Extraction (UAE)
This method increases mass transfer and extraction efficiency by using ultrasonic waves. Ultrasound waves cause cavitation bubbles in the solvent to abruptly burst, releasing shock waves that degrade cell walls and facilitate extraction. The sound waves here have frequencies higher than human hearing; they usually fall between 20 and 40 kHz for pectin extraction. Ultrasound irradiation of raw materials fulfils several goals. On the one hand, ultrasonic irradiation increases cell disintegration by cavitation, exposing the cells' inner structure to the solvent. On the other hand, sonication speeds the rehydration of dry materials, boosting solvent penetration. Nevertheless, extended ultrasonic irradiation with heat should be avoided since it may promote fast pectin degradation, resulting in a decreased yield [21,136,137,138,139,140,141]. Overall, the UAE mechanism maximizes mass transfer, cavitation, and cell disruption, thereby improving extraction yield and efficiency. The mechanism (Figure 2) is described as follows:
- As ultrasound waves travel through a liquid, they produce alternating high and low-pressure cycles. The low-pressure phase of the liquid is when bubbles, which are tiny holes filled with vapour, form. As the pressure rises, these bubbles suddenly pop. Cell walls and tissues might be harmed by shock waves from the collapse's concentrated high temperatures and pressures.
- The energy produced during cavitation causes plant cell walls to rupture, allowing solvents to enter and dissolve the required ingredients. When the cell wall breaks down, the solvent may more readily penetrate the material, improving contact and interaction between the solvent and the target molecule. Furthermore, mechanical movement can make the solventless viscous and extraction easier.
- Cavitation can produce localized heating, increasing the solubility of some substances, even though UAE is often conducted at mild temperatures to preserve sensitive compounds. The type of material removed and the ultrasonic frequency, power, and duration can all impact UAE performance.
4.2. Pulsed Ultrasound-Assisted Extraction (PUAE)
A sophisticated method called Pulsed Ultrasound-Assisted Extraction (PUAE) uses sporadic ultrasonic pulses to separate pectin from plant components. This technique maximizes extraction efficiency, minimizes possible heat-induced deterioration, and takes advantage of ultrasounds. The mechanism of the PUAE technique (Figure 3) could be elaborated as below [136,140,142,143]:
- PUAE alternates between periods of rest and sound application using short bursts or pulses of ultrasonic energy. This pulse allows for cooling periods, which aid in temperature regulation and reduce the danger of heat-induced damage to sensitive molecules.
- Cavitation during ultrasonic pulses causes microbubbles to expand and collapse. This activity breaks down the plant material's cell walls, making pectin easier to release.
- By using ultrasonic radiation and pulsed application to promote solvent diffusion into the plant matrix, pectin extraction is accomplished more effectively.
- The technique prevents excessive temperature buildup by pulsing the ultrasonic, which is crucial for maintaining the integrity of pectin and other sensitive bioactive components.
4.3. Pulsed Electric Field (PEF) and Moderate Electric Field (MEF) Mediated Extraction
Two cutting-edge methods that use electric fields to improve the extraction of bioactive chemicals from plant materials are pulsed electric field (PEF) and moderate electric field (MEF) extraction [139,140,144,145,146,147,148]. The possible extraction mechanism of PEF (Figure 3) is as follows:
- Plant tissues are subjected to brief, high-voltage electric field bursts by PEF. The term "electroporation" describes how electric fields cause cell membranes to break down electrically.
- Temporary membrane ruptures brought on by cell membrane disruption let intracellular substances, like pectin, phenolics, and essential oils, leak out into the surrounding solvent.
- Solvents may enter the matrix more rapidly due to the more porous cell walls, which facilitates the extraction of the required molecules.
Meanwhile, MEF employs lower-intensity electric fields than PEF. The basic approach relies on constantly producing an electrical field to improve the extraction process without creating a lot of electroporation. Charged molecules and ions may travel more freely in an electric field, increasing chemical solubilization and cell wall breakdown.
4.4. Microwave-Assisted Extraction (MAE)
The Microwave-Assisted Extraction (MAE) technique uses microwave radiation to enhance the extraction of bioactive compounds from solid materials, including plant tissues. This approach consists of oscillating electric and magnetic fields perpendicular to one other. Microwave radiation exposes plant skin tissues quickly and extensively because it breaks down the cell wall matrix and ruptures parenchymal cells [8,21]. As a result, the extracting agent and the source material employed in the extraction process will interact more; the extracting agent will penetrate deeper into more pectin [139,140]. The following extraction procedures (Figure 3) could be followed for MAE [149,150,151,152,153,154]:
- When subjected to microwave electromagnetic radiation, polar molecules—like water—vibrate quickly, producing heat inside the sample.
- The pressure generated by the quick heating and evaporation of intracellular water leads to cell rupture and increased release of target molecules.
- The interaction of heat and solvent enhances the extracted chemicals' solubility and diffusion, hence boosting extraction efficiency.
- Rapid heating and effective energy transfer lead to short extraction time.
4.5. Subcritical Water Extraction (SWE)
Subcritical water (SCW) is a rapidly growing approach for extracting bioactive compounds from different food sources [21]. Water is maintained at temperatures between 100°C and 374°C and pressure high enough to conserve the liquid state of water (less than the critical pressure of 22 MPa). This technique uses water under subcritical temperatures and pressures with a dielectric constant and a higher ion product change to extract valuable compounds from biomass. It takes advantage of the unique properties of water when heated under pressure [21,120], allowing it to act as both a solvent and a reactant. SCW usually follows the following extraction mechanism (Figure 4) [139,140,155,156]:
- Water is heated to subcritical temperatures (100ºC–374ºC) while under pressure to avoid boiling.
- Water dissolves nonpolar compounds more easily at subcritical temperatures because its dielectric constant decreases. As a result, it can potentially extract a wider range of polar and nonpolar compounds.
- Many compounds become more soluble at higher temperatures, allowing mass transfer from the solid matrix to the solvent.
- Heat and pressure can aid in releasing bioactive compounds from the plant matrix by dissolving the cell walls.
4.6. Enzyme-Assisted Extraction (EAE)
Enzyme-Assisted Extraction (EAE) is a technique that employs enzymes to extract bioactive compounds from plant or animal tissues. Enzyme extraction and ultrasonic extraction both make use of enzymes' ability to catalyze processes, resulting in shorter extraction times and less alcohol volume in the precipitation step. EAE offers significant benefits for extracting pectin from plant feeds, wastes, and byproducts. This method improves pectin extraction yield while improving energy consumption. The mechanism (Figure 3) of EAE is as follows [157,158,159,160,161]:
- The kind of biomass and target compounds are considered while selecting enzymes.
- The biomass is treated with the selected enzymes under certain pH, temperature, and time conditions to maximize their activity.
- Cell walls' proteins and polysaccharides are hydrolyzed by enzymes, which permits solvents to enter and remove the required ingredients.
Generally, the above-mentioned techniques are excellent for extracting pectin from different sources in terms of physical properties and showed low, medium, and higher percentages of yield and other valuable contents [139,140,142,154,155,156,157,158,159,160,161,162]. Table 9 and Table 10 below represent a general comparison of these extraction methods.
L=Low, M= Medium, H=High, VH=Very High, V=Variable, L-to-M= Low to Medium, M-to-H= Medium to High, MR= Medium Retention, HR=High Retention.
4.7. Ohmic Heating-Assisted Extraction (OHAE)
Ohmic Heating-Assisted Extraction (OHAE) uses electrical resistance to achieve rapid and uniform heating of the plant matrix, facilitating the extraction of pectin. Applying an electric current generates heat within the sample, leading to cell wall breakdown and improving bioactive compounds' solubility [163,164]. Figure 5 shows a schematic representation of the extraction process.
This method is particularly advantageous due to its uniform heating, which minimizes the thermal degradation of pectin. Additionally, OHAE offers significant energy efficiency compared to traditional heating methods and reduces the overall processing time. The rapid heating process enhances extraction yields, making it suitable for industrial applications. However, challenges remain in the adoption of OHAE. The initial investment in specialized equipment is high, which may limit its availability to smaller operations. Optimization of electrical parameters, such as voltage and current, is critical to prevent overheating and pectin degradation. Furthermore, scalability to industrial levels is complex due to the technical intricacies of maintaining consistent heating across large volumes [163]. Despite the above challenges, Gavahian and Chu successfully used the techniques for pineapple core valorization [165]. Sharifi et al. developed optimal conditions for extracting pomegranate pectin by ohmic heating. Extraction yield and galacturonic acid percentage were 8.16% and 82.86%, respectively [166].
4.8. Ultrasound-Assisted Microwave Extraction (UAME)
Building on the efficiency of OHAE, Ultrasound-Assisted Microwave Extraction (UAME) introduces a dual mechanism that enhances extraction further by combining ultrasound waves and microwave heating. UAME combines ultrasonic waves with microwave radiation to enhance the pectin extraction process; the synergistic effects of these two technologies result in efficient cell disruption and heating, leading to improved mass transfer and pectin release. Microwaves increase the internal temperature and pressure of plant cells, while ultrasound waves disrupt the cell walls, facilitating the release of pectin molecules [167,168,169]. Sonication before microwave results in efficient cell disruption, giving a better quality of pectin.
This method significantly reduces solvent usage and shortens extraction time, making it both cost-effective and environmentally friendly. The quality and purity of the extracted pectin are often superior due to the mild processing conditions. Despite its advantages, UAME presents several challenges. The need for specialized dual-function equipment increases initial costs. Furthermore, pectin degradation may occur if the heat generated by microwaves is not carefully controlled. Optimizing the balance between microwave power and ultrasound intensity is crucial to achieving efficient extraction without compromising pectin integrity [168]. Yang and coworkers applied Box–Behnken design to optimize the UAME process for potato pectin extraction. Under optimal conditions, the pectin yield and galacturonic acid percentage were 23% and 42%, respectively. As depicted in Table 11, the potato pectin had an Mw of 1.537×10⁵ g/mol. It was classified as a low methoxyl (DM, 32.58%), but highly acetylated (DA, 17.84%) pectin [170]. Lasunon and Sengkhamparn studied the effect of ultrasound-assisted, microwave-assisted, and ultrasound-microwave-assisted extraction on pectin extraction from industrial tomato waste [171]. They found that the combined ultrasound and microwave techniques gave a better pectin yield of 34%. Although some researchers subjected the raw sample to microwave heating before applying ultrasound, as depicted in Figure 6, Forouhar and coworkers showed that ultrasonic pretreatment changed the morphology of the raw powder, leading to better extraction efficiency. They reported a 19% extraction yield of pectin from watermelon rind and a galacturonic acid content of 69% [172].
4.9. Ultrasound-Assisted Ohmic Heating Extraction (UAOHE)
In a similar vein, Ultrasound-Assisted Ohmic Heating Extraction (UAOHE) leverages ultrasound technology but replaces microwaves with ohmic heating. Ultrasound waves effectively disrupt cell walls, while ohmic heating ensures rapid and uniform heating, facilitating mass transfer and enhancing extraction yields [173,174]. This combination method offers several advantages, including reduced energy consumption, higher yields, and shorter processing times. The dual-action mechanism improves pectin extraction's overall efficiency and quality, making it a promising technique for large-scale production. However, the complexity of integrating ultrasound and ohmic heating systems poses significant challenges. The cost of equipment capable of performing both functions is high, which can be a barrier to widespread adoption. Additionally, precise control of process parameters, such as temperature and ultrasound intensity, is necessary to avoid pectin degradation. Prolonged ultrasound irradiation with heat leads to pectin degradation. These factors complicate the scalability of UAOHE for industrial applications.
In spite of some drawbacks, researchers employed UAOHE to extract pectin. For example, Wang et al. used the technique successfully for the extraction of pectin from grapefruit peel achieving a yield of 27%. The study showed that pectin extracted by this method possessed lower viscosity and molecular weight than the traditional heating extraction method [175]. Xu studied the effects of ultrasound and/or heating on the extraction of pectin from grapefruit peel. The study found that UAOHM significantly enhanced pectin's extraction rate, leading to an improved yield in shorter extraction time and at a lower temperature (Figure 7) [176].
4.10. Hydrothermal (HT) Processing
For a solvent-free approach, hydrothermal (HT) processing provides an alternative that relies solely on water. The hydrothermal (HT) process uses subcritical water—water heated to temperatures between 100°C and 200°C under pressure—as a solvent for pectin extraction. This technique takes advantage of water’s altered physical properties under high temperatures and pressures to enhance its solvent capabilities [135]. Figure 8 depicts a simplified representation of the HT process. The HT process is environmentally friendly, using water instead of chemical solvents, reducing the risk of contamination and making the process safer for operators and consumers. Additionally, the simplicity and cost-effectiveness of the process make it attractive for sustainable extraction practices. Nevertheless, the HT process is energy-intensive due to maintaining high temperatures and pressures. Thermal degradation of pectin is a concern if the temperature is not carefully controlled. Moreover, the process can be challenging to optimize, as slight variations in temperature and pressure can significantly impact pectin yield and quality.
Extraction of pectin using HT is relatively rare, mainly if it is done in supercritical water. Recently, Pińkowska and coworkers studied the Hydrothermal Extraction of pectin from sugar beet pulp [177]. The study focused on the effect of extraction temperature and holding time on the course of hydrothermal extraction of pectin, showing that yield, degrees of methoxylation, and acetylation varied with varying temperatures and holding times. Das and Arora applied a one-stage hydrothermal (HT) process using water as an extraction medium to extract pectin from sweet lime peels [74]. As shown in Table 11, the extract was rich in galacturonic acid (70.6±1.3%) and high in degree of esterification (71.2±1.0%).
4.11. High-Pressure Processing Extraction (HPPE)
Shifting the focus from temperature to pressure, High-Pressure Processing Extraction (HPPE) offers a low-temperature method that maintains pectin integrity by applying high pressure. HPPE employs pressures between 100MPa and 600MPa to disrupt plant cell walls and facilitate pectin release. The pectin extraction process using HPPE is schematically shown in Figure 9. Unlike traditional thermal methods, HPPE can be conducted at low temperatures, preserving the integrity of heat-sensitive pectin molecules [178,179]. This method offers several advantages, including increased extraction yield, reduced processing time, and minimal solvent use. The ability to maintain the quality and purity of pectin makes HPPE particularly suitable for food-grade applications. However, the implementation of HPPE is hindered by high equipment costs and maintenance requirements. The process requires skilled operators to manage and optimize pressure conditions. Additionally, scaling up HPPE to industrial levels poses challenges due to the complexity of maintaining consistent high-pressure conditions [179].
4.12. Dielectric Barrier Discharge Extraction (DBDE)
Dielectric Barrier Discharge Extraction (DBDE) uses plasma technology to extract pectin solvent-free and energy-efficiently to further explore non-thermal methods. DBDE uses plasma generated by dielectric barriers to produce reactive species that facilitate the extraction of pectin. This non-thermal method operates at atmospheric pressure and does not require solvents, making it an eco-friendly option [180,181]. DBDE preserves the quality of heat-sensitive compounds and offers energy efficiency compared to thermal methods. The enhanced cell wall disruption leads to higher pectin yields and reduced processing times. Figure 10 depicts the DBDE process.
Despite its potential, DBDE faces challenges regarding equipment complexity and cost. The precise control of plasma parameters, such as the types and concentrations of reactive species, is critical to avoid pectin degradation. Additionally, scaling up DBDE for industrial use remains challenging due to the need for specialized equipment and process optimization [179]. The DBDE method is usually used to modify the structure of the extracted pectin or pre-treat its extraction. Recently, the DBDE was successfully applied to extract pectin from watermelon. Forouhar et al. studied the effects of high-voltage dielectric barrier discharge on the extraction and properties of pectins from watermelon rinds [182]. In this study, the extracted yield of pectin was reported to be 18.5% and pectin was rich in galacturonic acid content (79-80%).
The brief data provided in Table 11 clearly indicates that the extraction yield and the galacturonic acid (GalA) content vary greatly depending on the pectin source and the technique used to extract it. Adopting greener pectin extraction techniques offers promising avenues for sustainable and efficient production. Each technique provides unique advantages in terms of yield, energy efficiency, and environmental impact. However, equipment costs, process optimization, and scalability challenges must be addressed to facilitate their broader industrial application. Continued research and development are essential to overcome these barriers and enhance the feasibility of these eco-friendly methods. Table 12 and Table 13 summarize the advantages, disadvantages and applications of the above techniques.
5. Future Perspectives and Conclusions
Pectin contains a distinct structure with versatile polysaccharides. It is in high demand because of its gelling, stabilizing, and thickening properties in the food, pharmaceutical, and cosmetic industries. However, extraction methods can significantly impact the backbone structure of pectin. Therefore, understanding the degradation mechanism is crucial when modifying polysaccharides to achieve desired functional properties and predict their behaviour. Conventional pectin extraction, primarily relying on acid hydrolysis and extensive thermal treatment, poses significant environmental and economic challenges due to high energy consumption and chemical waste generation. Moreover, the scarcity of commercial sources and limited knowledge of pectin occurrence in various plant species necessitates the exploration of alternative sources and modification of existing extraction methods. Accordingly, researchers have gradually shifted to sustainable extraction techniques that could improve efficacy while lowering negative ecological impacts. The thirteen discussed technologies could be an alternative to conventional methods in order to decrease harmful solvents, excessive energy consumption and uphold the extracted pectin's structural reliability and quality. Each one of the techniques above presents distinct advantages and limitations that must be carefully evaluated, with selection based on specific applications. The pectin exhibits a large water and oil-holding capacity with potential emulsifying properties, which makes it viable as a textural ingredient and emulsifier in different food products and pharmaceutical enhancements. It may also potentially be used as a replacement for fat and sugar in low-calorie foods. Therefore, further research into advanced extraction and analytical methods is essential for expanding the production and applications of pectin. This research will likely uncover new potential applications for this versatile natural compound and ultimately contribute to a circular economy.
Author Contributions
Conceptualization, A.K. and S.M.H.; writing—original draft preparation, S.M.H., E.R., M.E., S.S.G., S.P.A., A.S.; writing—review and editing, A.K., S.M.H., E.R., M.E., S.S.G., S.P.A. All authors have read and agreed to the published version of the manuscript.
Funding
This research received no external funding.
Data Availability Statement
No new data were created or analyzed in this study. Data sharing is not applicable to this article.
Conflicts of Interest
The authors declare no conflicts of interest.
References
- Nadar, C. G.; Arora, A.; Shastri, Y. Sustainability Challenges and Opportunities in Pectin Extraction from Fruit Waste. ACS Eng. Au. 2022, 2, 61–74. [Google Scholar] [CrossRef]
- Tongkham, N.; Juntasalay, B.; Lasunon, P.; Sengkhamparn, N. Dragon fruit peel pectin: microwave-assisted extraction and fuzzy assessment. Agric. Nat. Resour. 2017, 51, 262–267. [Google Scholar] [CrossRef]
- Allain, M.C.N.P.; Ramasawmy, B.; Emmambux, M. N. Extraction, characterisation, and application of pectin from tropical and sub-tropical fruits: A review. Food Rev. Int. 2022, 38(3), 282–312. [Google Scholar] [CrossRef]
- Roman-Benn, A.; Contador, C.A.; Li, M.W.; Lam, H.M.; Ah-Hen, K.; Ulloa, P.E.; Cristina Ravanal, M. Pectin: An overview of sources, extraction and applications in food products, biomedical, pharmaceutical and environmental issues. Food Chem. Adv. 2023, 2, 100192. [Google Scholar] [CrossRef]
- Bartolazzi, A. Galectins in Cancer and Translational Medicine: From Bench to Bedside. Int. J. Mol. Sci. 2018, 19, 2934. [Google Scholar] [CrossRef] [PubMed]
- Pasandide, B.; Khodaiyan, F.; Mousavi, Z. E.; Hosseini, S.S. Optimization of aqueous pectin extraction from Citrus medica peel. Carbohydr. Polym. 2017, 178, 27–33. [Google Scholar] [CrossRef] [PubMed]
- Ciriminna, R.; Fidalgo, A.; Avellone, G.; Danzì, C.; Timpanaro, G.; Locatelli, M.; Carnaroglio, D.; Meneguzzo, F.; Ilharco, L. M.; Pagliaro, Mario. Integral extraction of Opuntia ficus-indica peel bioproducts via microwave assisted hydrodiffusion and hydrodistillation. ACS Sustain. Chem. Eng. 2019, 7(8), 7884–7891. [Google Scholar] [CrossRef]
- Öztürk, T.; Özbek, H.N.; Koçak Yanık, D. Environmentally Friendly Approach to Pectin Extraction from Grapefruit Peel: Microwave-Assisted High-Pressure CO2/H2O. Foods. 2024, 13, 476. [Google Scholar] [CrossRef]
- Parre, E.; Geitmann, A. Pectin and the role of the physical properties of the cell wall in pollen tube growth of solanum chacoense. Planta. 2005, 220(4), 582–592. [Google Scholar] [CrossRef]
- Chandel, V.; Biswas, D.; Roy, S.; Vaidya, D.; Verma, A.; Gupta, A. Current Advancements in Pectin: Extraction, Properties and Multifunctional Applications. Foods. 2022, 11(17), 2683. [Google Scholar] [CrossRef]
- Emaga, T.H.; Andrianaivo, R.H.; Wathelet, B.; Tchango, J.T.; Paquot, M. Effects of the stage of maturation and varieties on the chemical composition of banana and plantain peels. Food Chem. 2007, 103, 590–600. [Google Scholar] [CrossRef]
- Gawkowska, D.; Cybulska, J.; Zdunek, A. Structure-Related Gelling of Pectins and Linking with Other Natural Compounds: A Review. Polymers. 2018, 10, 762. [Google Scholar] [CrossRef] [PubMed]
- Dominiak, M.; Søndergaard, K. M.; Wichmann, J.; Vidal-Melgosa, S.; Willats, W.G.T.; Meyer, A. S.; Mikkelsen, J. D. Application of Enzymes for Efficient Extraction, Modification, and Development of Functional Properties of Lime Pectin. Food Hydrocoll. 2014, 40, 273–282. [Google Scholar] [CrossRef]
- Olano-Martin, E.; Gibson, G.R.; Rastall, R. Comparison of the in vitro bifidogenic properties of pectins and pectic-oligosaccharides. J. Appl. Microbiol. 2002, 93, 505–511. [Google Scholar] [CrossRef]
- Belkheiri, A.; Forouhar, A.; Ursu, A.V.; Dubessay, P.; Pierre, G.; Delattre, C.; Djelveh, G.; Abdelkafi, S.; Hamdami, N.; Michaud, P. Extraction, Characterization, and Applications of Pectins from Plant By-Products. Appl. Sci. 2021, 11, 6596. [Google Scholar] [CrossRef]
- Harholt, J.; Suttangkakul, A.; Vibe Scheller, H. Biosynthesis of pectin. Plant Phys. 2010, 153, 384–395. [Google Scholar] [CrossRef] [PubMed]
- Beukema, M.; Faas, M. M.; de Vos, P. The effects of different dietary fiber pectin structures on the gastrointestinal immune barrier: impact via gut microbiota and direct effects on immune cells. Exp. Mol. Med. 2020, 52, 1364–1376. [Google Scholar] [CrossRef]
- Pooja, S. N.; Yadav, S. K. Conventional and Emerging Novel Techniques for the Extraction of Pectin and Applications of Pectin. Austin J. Biotechnol. Bioeng. 2022, 9(1), 1115. [Google Scholar]
- Srivastava, P.; Malviya, R. Sources of pectin, extraction and its applications in pharmaceutical industry- An overview. Ind. J. Nat. Prod. Res. 2011, 2, 10–18. [Google Scholar]
- Cui, J.; Zhao, C.; Feng, L.; Han, Y.; Du, H.; Xiao, H.; Jinkai, Z. Pectins from fruits: relationships between extraction methods, structural characteristics, and functional properties. Trends in Food Sci. Technol. 2021, 110, 39–54. [Google Scholar] [CrossRef]
- Putra, N. R.; Aziz, A. H. A.; Faizal, A. N. M.; Che Yunus, M. A. Methods and potential in valorization of banana peels waste by various extraction processes: in review. Sustainability. 2022, 14, 10571. [Google Scholar] [CrossRef]
- Mandal, V.; Mohan, Y.; Hemalatha, S. Microwave Assisted Extraction-an innovative and Promising Extraction Tool for Medicinal Plant Research. Pharmacognosy Rev. 2007, 1, 7–18. [Google Scholar]
- Israel, K. A. T. C.; Amian, J. F. R.; Garibay, Z. J. S.; Leyeza, V. E. B.; Sarte, A. J. T. A comparative study on characteristics of pectins from various fruit peel wastes extracted using acid and microbial enzymes. J. Micro. Biotechnol. Food Sci. 2019, 9(2), 216–221. [Google Scholar] [CrossRef]
- Llompart, M.; Garcia-Jares, C.; Celeiro, M.; Dagnac, T. Extraction | Microwave-Assisted Extraction. In Encyclopedia of analytical science; Worsfold, P., Poole, C., Townshend, A., Miró, M., Eds.; Academic Press, 2019; pp. 67–77. [Google Scholar] [CrossRef]
- Toma, M.; Vinatoru, M.; Paniwnyk, L.; Mason, T. J. Investigation of the effects of ultrasound on vegetal tissues during solvent extraction. Ultrasonics Sonochem. 2001, 8(2), 137–142. [Google Scholar] [CrossRef] [PubMed]
- Nasrollahzadeh, M.; Nezafat, Z.; Shafiei, N.; Soleimani, F. Chapter 2-Polysaccharides in food industry in Biopolymer-Based Metal Nanoparticle Chemistry for Sustainable Applications; Nasrollahzadeh, Mahmoud, Ed.; Elsevier, 2021; pp. 47–96. [Google Scholar]
- Serra-Majem, L.; Tomaino, L.; Dernini, S.; Berry, E.M.; Lairon, D.; Ngo de la Cruz, J.; Bach-Faig, A.; Donini, L.M.; Medina, F.-X.; Belahsen, R.; et al. Updating the Mediterranean Diet Pyramid towards Sustainability: Focus on Environmental Concerns. Int. J. Environ. Res. Public Health 2020, 17, 8758. [Google Scholar] [CrossRef]
- Aldana, D. S.; Andrade-Ochoa, S.; Aguilar, C. N.; Contreras-Esquivel, J. C.; Nevarez-Moorillon, G. V. Antibacterial activity of pectic-based edible films incorporated with Mexican lime essential oil. Food Control. 2015, 50, 907–912. [Google Scholar] [CrossRef]
- Freitas, C. M. P.; Coimbra, J. S. R.; Souza, V. G. L.; Sousa, R. C. S. Structure and applications of pectin in food, biomedical, and pharmaceutical industry: a review. Coatings. 2021, 11(8), 922. [Google Scholar] [CrossRef]
- Ptichkina, N.; Markina, O.; Rumyantseva, G. Pectin extraction from pumpkin with the aid of microbial enzymes. Food Hydrocoll. 2008, 22, 192–195. [Google Scholar] [CrossRef]
- May, C. D. Industrial pectins: Sources, production and applications. Carbohydr. Polym. 1990, 12, 79–99. [Google Scholar] [CrossRef]
- Mesbahi, G.; Jamalian, J.; Farahnaky, A. A comparative study on functional properties of beet and citrus pectins in food systems. Food Hydrocoll. 2005, 19, 731–738. [Google Scholar] [CrossRef]
- Thakur, B. R.; Singh, R. K.; Handa, A. K.; Rao, M. Chemistry and uses of pectin-A review. Crit. Rev. Food Sci. Nutr. 1997, 37, 47–73. [Google Scholar] [CrossRef]
- Korish, M. Potential utilization of Citrullus lanatus var. Colocynthoides waste as a novel source of pectin. J. Food Sci. Technol. 2015, 52, 2401–2407. [Google Scholar] [CrossRef] [PubMed]
- Matia-Merino, L.; Lau, K.; Dickinson, E. Effects of low-methoxyl amidated pectin and ionic calcium on rheology and microstructure of acid-induced sodium caseinate gels. Food Hydrocoll. 2004, 18, 271–281. [Google Scholar] [CrossRef]
- Blanco-Pérez, F.; Steigerwald, H.; Schülke, S.; Vieths, S.; Toda, M.; Scheurer, S. The dietary fiber pectin: Health benefits and potential for the treatment of allergies by modulation of gut microbiota. Current Aller. Asthma Rep. 2021, 21, 43. [Google Scholar] [CrossRef] [PubMed]
- Palko- Łabuz, A.; Maksymowicz, J.; Sobieszczańska, B.; Wikiera, A.; Skonieczna, M.; Wesołowska, O.; Sroda-Pomianek, K. Newly obtained apple pectin as an adjunct to irinotecan therapy of colorectal cancer reducing E. coli adherence and β-glucuronidase activity. Cancers 2021, 13((12), 2952. [Google Scholar] [CrossRef]
- Liu, Y.; Dong, M.; Yang, Z.; Pan, S. Anti-diabetic effect of citrus pectin in diabetic rats and potential mechanism via PI3K/Akt signaling pathway. Inter. J. Biol. Macromol. 2016, 89, 484–488. [Google Scholar] [CrossRef]
- Zhang, W.; Xu, P.; Zhang, H. Pectin in Cancer Therapy: A Review. Trends Food Sci. Technol. 2015, 44, 258–271. [Google Scholar] [CrossRef]
- Christiaens, S.; Van Buggenhout, S.; Houben, K.; Jamsazzadeh Kermani, Z.; Moelants, K.R.N.; Ngouémazong, E.D.; Van Loey, A.; Hendrickx, M. E. G. Process–Structure–Function Relations of Pectin in Food. Crit. Rev. Food Sci. Nutr. 2016, 56, 1021–1042. [Google Scholar] [CrossRef]
- Huang, J.; Hu, Z.; Hu, L.; Li, G.; Yao, Q.; Hu, Y. Pectin-based active packaging: A critical review on preparation, physical properties and novel application in food preservation. Trends Food Sci. Technol. 2021, 118, 167–178. [Google Scholar] [CrossRef]
- Li, D. Q.; Li, J.; Dong, H. L.; Li, X.; Zhang, J. Q.; Ramaswamy, S.; Xu, F. Pectin in biomedical and drug delivery applications: A review. Int. J. Biol. Macromol. 2021, 185, 49–65. [Google Scholar] [CrossRef]
- Bhatia, M. S.; Deshmukh, R.; Choudhari, P.; Bhatia, N. M. Chemical Modification of Pectins, Characterization and Evaluation for Drug Delivery. Sci. Pharm. 2008, 76, 775–784. [Google Scholar] [CrossRef]
- Kamal, M. M.; Kumar, J.; Mamun, M. A. H.; Ahmed, M. N. U.; Shishir, M. R. I.; Mondal S., C. Extraction and Characterization of Pectin from Citrus Sinensis Peel. J. Biosyst. Eng. 2021, 46, 16–25. [Google Scholar] [CrossRef]
- Devi, W. E.; Shukla, R. N.; Bala, K. L.; Kumar, A.; Mishra, A.A.; Yadav, K. C. Extraction of Pectin from Citrus Fruit Peel and Its Utilization in Preparation of Jelly. Int. J. Eng. Res. Technol. 2014, 3, 1925–1932. [Google Scholar]
- Kanmani, P.; Dhivya, J.; Kumaresan, K. Extraction and Analysis of Pectin from Citrus Peels: Augmenting the Yield from Citrus limon Using Statistical Experimental Design. Iran. J. Energy Environ. 2014, 5, 303–312. [Google Scholar] [CrossRef]
- Sayed, M. A.; Kumar, J.; Rahman, M. R.; Noor, F.; Ashraful Alam, M. Effect of extraction parameters on the yield and quality of pectin from mango (Mangifera indica L.) peels. Discov Food. 2022, 2, 28. [Google Scholar] [CrossRef]
- Ahmed, S.; Belal, M.; Sikder, H. Extraction, Characterization and Application of Three Varieties of Citrus Limon L. Pectin in Jelly Product. Food Appl. Biosci. J. 2019, 7, 31–50. [Google Scholar]
- Baraiya, K.; Yadav, V. K.; Choudhary, N.; Ali, D.; Raiyani, D.; Chowdhary, V. A.; Alooparampil, S.; Pandya, R. V.; Sahoo, D. K.; Patel, A.; Tank, J. G. A Comparative Analysis of the Physico-Chemical Properties of Pectin Isolated from the Peels of Seven Different Citrus Fruits. Gels. 2023, 9. [Google Scholar] [CrossRef]
- Yu, Y.; Lu, P.; Yang, Y.; Ji, H.; Zhou, H.; Chen, S.; Qiu, Y.; Chem, H. Differences in Physicochemical Properties of Pectin Extracted From Pomelo Peel With Different Extraction Techniques. Scientific Reports, 2024, 14, 9182. [Google Scholar] [CrossRef]
- Vekiari, S. A.; Protopadakis, E. E.; Papadopoulou, P.; Papanicolau, D.; Panou, C.; Vamvakias, M. Composition and seasonal variation of the essential oil from leaves and peel of a cretan lemon variety. J. Agri. Food Chem. 2002, 50, 147–153. [Google Scholar] [CrossRef]
- Oloye, M. T.; Jabar, J. M.; Adetuyi, A. O.; Lajide, L. Extraction and characterization of pectin from fruit peels of Irvingiagabonensis and pulp of Cola milleni and Theobroma cacao as precursor for industrial applications. Biomass Conver. Bioref. 2021, 13, 2125–2133. [Google Scholar] [CrossRef]
- Etebu, E; Nwauzoma, A. B. A review on sweet orange (Citrus sinensis): health, diseases and management. Amer. J. Res. Commun. 2014, 2(2), 33–70.
- Muhmadzadeh, J.; Sadeghi-Mahoonak, A. R.; Yaghbani, M.; Aalami, M. Extraction of pectin from sunflower head residues of selected Iranian cultivars. World Appl. Sci. J. 2010, 8, 21–24. [Google Scholar]
- Yadav, S.R; Khan, Z. H.; Kunjwani, S. S.; Mular, S. M. Extraction and characterization of Pectin from different fruits. Inter. J. Appl. Res. 2015, 1(9), 91–94. [Google Scholar]
- Castillo-Israel, K. A. T.; Baguio, S. F.; Diasanta, M. D. B.; Lizardo, R. C. M.; Dizon, E. I.; Mejico, M. I. F. Extraction and characterization of pectin from Saba banana [Musa ‘saba’(Musa acuminata x Musa balbisiana)] peel wastes: A preliminary study. Inter. Food Res. J. 2015, 22, 202–207. [Google Scholar]
- Zdunek, A.; Pieczywek, P. M.; Cybulska, J. The primary, secondary, and structures of higher levels of pectin polysaccharides. Compr. Rev. Food Sci. Food Saf. 2021, 20, 1101–1117. [Google Scholar] [CrossRef]
- Bemiller, J. N. An Introduction to Pectins: Structure and Properties. Chemistry and Function of Pectins. ACS Symp. Ser. 1986, 310, 2–12. [Google Scholar]
- Ciriminna, R.; Fidalgo, A.; Delisi, R.; Ilharco, L. M.; Pagliaro, M. Pectin production and global market. Agro Food Ind. Hi Tech. 2016, 27, 17–20. [Google Scholar]
- Riyamol; Chengaiyan, J.G.; Rana, S. S.; Ahmad, F.; Haque, S.; Capanoglu, E. Recent Advances in the Extraction of Pectin from Various Sources and Industrial Applications. ACS Omega. 2023, 8(49), 46309–46324. [Google Scholar] [CrossRef]
- Priya, Verma R.K., Lakhawat S., Yadav V.K., Gacem A., Abbas M., Yadav K.K., Park H.-K., Jeon B.-H., Mishra S. Millets: Sustainable Treasure House of Bioactive Components. Int. J. Food Prop. 2023, 26, 1822–1840. [CrossRef]
- Thapa, A.; Kaushik, R.; Arora, S.; Jaglan, S.; Jaswal, V.; Yadav, V. K.; Singh, M.; Bains, A.; Chawla, P.; Khan, A. , et al. Biological Activity of Picrorhiza Kurroa: A Source of Potential Antimicrobial Compounds against Yersinia Enterocolitica. Int. J. Mol. Sci. 2022, 23, 14090. [Google Scholar] [CrossRef]
- Wongkaew, M.; Sommano, S. R.; Tangpao, T.; Rachtanapun, P.; Jantanasakulwong, K. Mango Peel Pectin by Microwave-Assisted Extraction and Its Use as Fat Replacement in Dried Chinese Sausage. Foods. 2020, 9, 450. [Google Scholar] [CrossRef] [PubMed]
- Muthukumaran, C.; Banupriya, L.; Harinee, S.; Sivaranjani, S.; Sharmila, G.; Rajasekar, V.; Kumar, N. M. Pectin from Muskmelon (Cucumis Melo Var. Reticulatus) Peels: Extraction Optimization and Physicochemical Properties. 3 Biotech. 2017, 7, 66. [Google Scholar] [CrossRef] [PubMed]
- Mosayebi, V.; Yazdi, F. T. Optimization of microwave assisted extraction (MAE) of pectin from black mulberry (Morus Nigra L.) pomace. J. Food Bioprocess Eng. 2018, 1, 57–66. [Google Scholar]
- Constenla, D.; Lozano, J. E. Kinetic model of pectin demethylation. Lat. Am. Appl. Res. 2003, 33, 91–95. [Google Scholar]
- Yu, Y.Y.; Lu, P.; Yang, Y.; Ji, H.; Zhou, H.; Chen, S.; Qiu, Y.; Chen, H. Differences in physicochemical properties of pectin extracted from pomelo peel with different extraction techniques. Scientific Rep. 2024, 14, 9182. [Google Scholar] [CrossRef]
- Hosseini, S. S. , Khodaiyan, F., & Yarmand, M. S. Optimization of microwave assisted extraction of pectin from sour orange peel and its physicochemical properties. Carbohydr. Polym. 2016, 140, 59–65. [Google Scholar]
- Mahmoud, H. M.; Abu-Salem, F. M.; Azab, D. E. S. H. A Comparative Study of Pectin Green Extraction Methods from Apple Waste: Characterization and Functional Properties. Int. J. Food Sci. 2022, 2865921. [Google Scholar]
- Zouambia, Y.; Youcef Ettoumi, K.; Krea, M.; Moulai-Mostefa, N. A new approach for pectin extraction: Electromagnetic induction heating, Arab. J Chem. 2017, 10, 480–487. [Google Scholar] [CrossRef]
- Figueira, O.; Pereira, V.; Castilho, P. C. A Two-Step Approach to Orange Peel Waste Valorization: Consecutive Extraction of Pectin and Hesperidin. Foods. 2023, 12, 3834. [Google Scholar] [CrossRef]
- Zhu, Y.; Liu, K.; Yuen, M.; Yuen, T.; Yuen, H.; Peng, Q. Extraction and characterization of a pectin from sea buckthorn peel. Front. Nutr. 2022, 9, 969465. [Google Scholar] [CrossRef]
- Dranca, F.; Vargas, M.; Oroian, M. Physicochemical properties of pectin from Malus domestica ‘Fălticeni’ apple pomace as affected by non-conventional extraction techniques. Food Hydrocoll. 2020, 100, 105383. [Google Scholar] [CrossRef]
- Das, I.; Arora, A. One stage hydrothermal treatment: A green strategy for simultaneous extraction of food hydrocolloid and co-products from sweet lime (Citrus Limetta) peels. Food Hydrocoll. 2023, 134, 107947. [Google Scholar] [CrossRef]
- Dambuza, A.; Rungqu, P.; Oyedeji, A.O.; Miya, G.M.; Kuria, S.K.; Hosu, S.Y.; Oyedeji, O.O. Extraction, Characterization, and Antioxidant Activity of Pectin from Lemon Peels. Molecules. 2024, 29, 3878. [Google Scholar] [CrossRef] [PubMed]
- Wang, D.; Wang, B.; Xuejiao, J.; Yuanyuan, P.; Jinyan, Z.; Meng, Z.; Yunlu, W.; Zhijian, L.; Qiyang, C. Microwave-enzyme-assisted extraction of pectin from feijoa (Acca sellowiana) fruit: Extraction optimization, physicochemical and functional properties. LWT - Food Sci. Technol. 2024, 204, 116445. [Google Scholar] [CrossRef]
- Wathoni, N.; Shan, C. Y.; Shan, W. Y.; Tina, R.; Bayu, I. R.; Rimadani, P.; Muchtaridi, M. Characterization and antioxidant activity of pectin from Indonesian mangosteen (Garcinia mangostana L. ) rind, Heliyon. 2019, 5, e02299. [Google Scholar] [CrossRef]
- Duggal, M.; Singh, D. P.; Singh, S.; Khubber, S.; Garg, M.; Krishania, M. Microwave-assisted acid extraction of high-methoxyl kinnow (Citrus reticulata) peels pectin: Process, techno-functionality, characterization and life cycle assessment. Food Chem. Mol. Sci. 2024, 9, 100213. [Google Scholar] [CrossRef] [PubMed]
- Mahmud, M. M.; Belal, M.; Ahmed, S.; Hoque, M. M.; Zzaman, W. Microwave-assisted extraction and characterization of pectin from citrus fruit wastes for commercial application. Food Res. 2021, 5(5), 80–88. [Google Scholar] [CrossRef]
- Rungraeng, N.; Kraithong, S. Effect of Acid Type and Concentration on Properties of Pectin Extracted from Unripe Cavendish Banana Peel and Its Application in Raspberry Jam. Eng. Agri. Environ. Food. 2020, 13(1), 1–8. [Google Scholar] [CrossRef]
- Hamed, A. A. R.; Mustafa, S. E. Extraction and assessment of pectin from pumpkin peels. Biofarmasi J. Nat. Prod. Biochem. 2018, 16, 1–7. [Google Scholar] [CrossRef]
- Obaid Zaidan, S. H.; Al-Obaidi, L. F. H. Extraction of Pectin from Eggplant Peels and Calyxes and Studying its Physicochemical and Functional Properties. Migr. Lett. 2023, 20, 590–601. [Google Scholar]
- Hernández-Madrigal, F.; Saavedra-Díaz, R. O.; Hernández-Córdova, R. Pectin Extracted from Orange Peel (Citrus Sinensis) to Obtain Bioplastic: Synergistic Effects with Alginate. J. Basic Sci. 2024, 10(28), 1–9. [Google Scholar] [CrossRef]
- Kubola, J.; Nitthaisong, P.; Jitthaisong, A.; Ratananikom, K. Extraction and characterization of pectin from selected indigenous fruits for further commercial application in food industries. Food Agr. Sci. Technol. 2023, 9(1), 76–89. [Google Scholar]
- Leong, C. M.; Noranizan, M. A.; Kharidah, M.; Choo, W. S. Physicochemical properties of pectin extracted from jackfruit and chempedak fruit rinds using various acids. Inter. Food Res. J. 2016, 23(3), 973–978. [Google Scholar]
- Yang, J. S.; Mu, T. H.; Ma, M. M. Extraction, structure, and emulsifying properties of pectin from potato pulp. Food Chem. 2018, 244, 197–205. [Google Scholar] [CrossRef]
- Sarkar, R.; Nain, L.; Kundu, A.; Dutta, A.; Das, D.; Sethi, S.; Saha, S. De-Oiled Citrus Peels as Feedstock for the Production of Pectin Oligosaccharides and Its Effect on Lactobacillus fermentum, Probiotic Source. Front. Nutr. 2022, 9, 826250. [Google Scholar] [CrossRef] [PubMed]
- Dranca, F.; Mironeasa, S. Green Extraction of Pectin from Sugar Beet Flakes and Its Application in Hydrogels and Cryogels. Gels 2024, 10, 228. [Google Scholar] [CrossRef]
- Biratu, G.; Woldemariam, H. W.; Gonfa, G. Optimization of pectin yield extracted from coffee Arabica pulp using response surface methodology. Heliyon. 2024, 10, 29636. [Google Scholar] [CrossRef]
- Majumdar, S.; Srirangam, R. Solubility, Stability, Physicochemical Characteristics and In Vitro Ocular Tissue Permeability of Hesperidin: A Natural Bioflavonoid. Pharm. Res. 2009, 26, 1217–1225. [Google Scholar] [CrossRef]
- Chua, B. L.; Tang, S. F.; Ali, A.; Chow, Y. H. Optimisation of pectin production from dragon fruit peels waste: drying, extraction and characterization studies. SN Appl. Sci. 2020, 2, 621. [Google Scholar] [CrossRef]
- Leila, N.; Fatemeh, Z.; Maryam, Z. Optimize the Extraction Conditions of Pectin Extracted from Saveh Pomegranate Peels. Iran. J. Chem. Chem. Eng. 2022, 41(11), 3835. [Google Scholar]
- Hundie, K. B.; Abdissa Akuma, D. Extraction and Characterization of Pectin from Lemon Waste for Commercial Applications. J. Turk. Chem. Soc. Sec A Chem. 2021, 8(4), 1111–1120. [Google Scholar] [CrossRef]
- Apirattananusorn, S.; Lumsa-Ed, J.; Tongta, S.; Piyachomkwan, K. Composition and Characterization of Water Extractable Pectin from Pulp in Pods of Riang (Parkia timoriana (DC.) Merr.). Trends Sci. 2022, 19(11), 4480. [Google Scholar] [CrossRef]
- Du, H.; Olawuyi, I. F.; Said, N. S.; Lee, W. Y. Comparative Analysis of Physicochemical and Functional Properties of Pectin from Extracted Dragon Fruit Waste by Different Techniques. Polymers. 2024, 16, 1097. [Google Scholar] [CrossRef] [PubMed]
- Wang, Y.; Fang, Q.; Shu, C.; Zhang, T.; Cao, J. Non-methylesterified pectin from pitaya (Hylocereus undatus) fruit peel: optimization of extraction and nanostructural characterization. Food Innov. Adv. 2024, 3(2), 181–190. [Google Scholar] [CrossRef]
- Gorshkova, R.; Slobodova, D.; Uspensky, A. A.; Slobodov, A. Influence of the parameters of hydrolysis-extraction high temperature process on еруyield, physico-chemical and molecular mass characteristics of pectin substances. 3rd International Conference on Rheology and Modeling of Materials (ic-rmm3). IOP Conf. Series: Journal of Physics: Conf. Series 2018, 1045, 012015. [Google Scholar] [CrossRef]
- Elleuch, M.; Bedigian, D.; Roiseux, O.; Besbes, S.; Blecker, C.; Attia, H. Dietary fibre and fibre-rich by-products of food processing: Characterisation, technological functionality and commercial applications: A review. Food Chem. 2011, 124, 411–421. [Google Scholar] [CrossRef]
- Frosi, I.; Colombo, R.; Pugliese, R.; Milanese, C.; Papetti, A. Pectin Microwave Assisted Extraction from Pumpkin Peels: Process Optimization and Chemical-Physical and Rheological Characterization. Foods 2024, 13, 3157. [Google Scholar] [CrossRef]
- Elleuch, M.; Bedigian, D.; Roiseux, O.; Besbes, S.; Blecker, C.; Attia, H. Dietary fibre and fibre-rich by-products of food processing: Characterisation, technological functionality and commercial applications: A review. Food Chem. 2011, 124, 411–421. [Google Scholar] [CrossRef]
- Xu, M. Polysaccharides from Sunflower Stalk Pith: Chemical, Structural, and Partial Physicochemical Characterization. Food Hydrocoll. 2020, 100, 105082. [Google Scholar] [CrossRef]
- Namir, M.; Siliha, H.; Ramadan, M. F. Fiber pectin from tomato pomace: Characteristics, functional properties and application in low-fat beef burger. J. Food Meas. Charact. 2015, 9, 305–312. [Google Scholar] [CrossRef]
- Kazemi, M.; Khodaiyan, F.; Hosseini, S.S. Eggplant peel as a high potential source of high methylated pectin: Ultrasonic extraction optimization and characterization. LWT 2019, 105, 182–189. [Google Scholar] [CrossRef]
- Asgari, K.; Labbafi, M.; Khodaiyan, F.; Kazemi, M.; Hosseini, S.S. High-methylated pectin from walnut processing wastes as a potential resource: Ultrasound assisted extraction and physicochemical, structural and functional analysis. Int. J. Biol. Macromol. 2020, 152, 1274–1282. [Google Scholar] [CrossRef] [PubMed]
- Rubio-Senent, F.; Rodríguez-Gutiérrez, G.; Lama-Muñoz, A.; Fernández-Bolaños, J. Pectin extracted from thermally treated olive oil by-products: Characterization, physico-chemical properties, in vitro bile acid and glucose binding. Food Hydrocoll. 2015, 43, 311–321. [Google Scholar] [CrossRef]
- Kazemi, M.; Khodaiyan, F.; Labbafi, M.; Hosseini, S.S.; Hojjati, M. Pistachio green hull pectin: Optimization of microwave-assisted extraction and evaluation of its physicochemical, structural and functional properties. Food Chem. 2019, 271, 663–672. [Google Scholar] [CrossRef]
- Mzoughi, Z.; Abdelhamid, A.; Rihouey, C.; Le Cerf, D.; Bouraoui, A.; Majdoub, H. Optimized extraction of pectin-like polysaccharide from Suaeda fruticosa leaves: Characterization, antioxidant, anti-inflammatory and analgesic activities. Carbohydr. Polym. 2018, 185, 127–137. [Google Scholar] [CrossRef] [PubMed]
- Romdhane, M.B.; Haddar, A.; Ghazala, I.; Jeddou, K.B.; Helbert, C.B.; Ellouz-Chaabouni, S. Optimization of polysaccharides extraction from watermelon rinds: Structure, functional and biological activities. Food Chem. 2017, 216, 355–364. [Google Scholar] [CrossRef]
- Muhammad, N.W.F.; Nurrulhidayah, A.F.; Hamzah, M.S.; Rashidi, O.; Rohman, A. Physicochemical properties of dragon fruit peel pectin and citrus peel pectin: a Comparison Food Research 4 (Suppl. 1): 266-273.
- Kareem, A. H.; Naji, E. Z. Study of the Physical and Functional Properties of Pectin Extracted from Some Plant Residues. Forest. Chem. Rev. 2022, 1271–1282. [Google Scholar]
- de Moura, F. A.; Macagnan, F. T.; Dos Santos, L. R.; Bizzani, M.; de Oliveira Petkowicz, C. L.; Da Silva, L. P. Characterization and physicochemical properties of pectins extracted from agroindustrial by-products. J. Food Sci. Technol. 2017, 54, 3111–3117. [Google Scholar] [CrossRef]
- Femenia, A.; Lefebvre, A. C.; Thebaudin, J. Y.; Robertson, J.; Bourgeois, C. M. Physical and sensory properties of model foods supplemented with cauliflower fiber. J. Food Sci. 1997, 62, 635–639. [Google Scholar] [CrossRef]
- Hartwig, V. G.; Ponce Cevallos, P. A.; Schmalko, M. E.; Brumovsky, L. A. ; Effects of spray drying conditions on the stability and antioxidant properties of spray-dried soluble maté. Int. J. Food Eng. 2014, 10, 131–138. [Google Scholar] [CrossRef]
- Pinkaew, T.; Inthachat, W.; Khemthong, C.; Kemsawasd, V.; On-Nom, N.; Temviriyanukul, P. High Pectin Recovery from Cocoa Husks Using an Autoclave Approach: An Analysis of Its Physicochemical, Structural, and Genotoxicity Properties. Foods. 2024, 13, 669. [Google Scholar] [CrossRef]
- Zampini, I.C.; Torres, S.; Isla, M. I. Functional Characterization and Toxicity of Pectin from Red Chilto Fruit Waste (Peels). Plants 2023, 12, 2603. [Google Scholar] [CrossRef]
- Aldemir, H.; Kamiloğlu, A.; Çakır, O. Optimization of pectin extraction from crab apple peel and usage in a model meat emulsion system. J. Food Measur. Character. 2024, 18, 3827–3838. [Google Scholar] [CrossRef]
- Reintjes, M.; Musco, D.D.; Joseph, G. H. Infrared Spectra of Some Pectic Substances. Food Sci. 1962, 27(5), 441–445. [Google Scholar] [CrossRef]
- Pereira, D. T. V.; Mendez-Albinana, P.; Mendiola, J.A.; Villamie, M.; Cifuentes, A.; Martínez, J.; Ibanez, E. An eco-friendly extraction method to obtain pectin from passion fruit rinds (Passiflora edulis sp.) using subcritical water and pressurized natural deep eutectic solvents. Carbohydr. Polym. 2024, 326, 121578. [Google Scholar] [CrossRef] [PubMed]
- Salima, B.; Seloua, D.; Djamel, F.; Samir, M. ; Structure of pumpkin pectin and its effect on its technological properties. Appl. Rheol. 2022, 32, 34–55. [Google Scholar] [CrossRef]
- Calce, E.; Bugatti, V. V. V.; De Luca, S. Solvent-free synthesis of modified pectin compounds promoted by microwave irradiation. Molecules. 2012, 17, 12234–12242. [Google Scholar] [CrossRef] [PubMed]
- Wang, X.; Chen, Q.; Lü, X. Pectin extracted from apple pomace and citrus peel by subcritical water. Food Hydrocoll. 2014, 38, 129–137. [Google Scholar] [CrossRef]
- Einhorn-Stoll, U.; Kunzek, H. Thermoanalytical Characterisation of Processing-Dependent Structural Changes and State Transitions of Citrus Pectin. Food Hydrocoll. 2009, 23, 40–52. [Google Scholar] [CrossRef]
- Yang, J. S.; Mu, T. H.; Ma, M. M. Optimization of ultrasound-microwave assisted acid extraction of pectin from potato pulp by response surface methodology and its characterization. Food Chem. 2019, 289, 351–359. [Google Scholar] [CrossRef]
- Munoz-Almagro, N.; Valadez-Carmona, L.; Mendiola, J. A.; Ibanez, E.; Villamiel, M. Structural characterisation of pectin obtained from cacao pod husk. Comparison of conventional and subcritical water extraction. Carbohydr. Polym. 2019, 217, 69–78. [Google Scholar] [CrossRef] [PubMed]
- Rahmani, Z.; Khodaiyan, F.; Kazemi, M.; Sharifan, A. Optimization of microwave-assisted extraction and structural characterization of pectin from sweet lemon peel. Int. J. Biol. Macromol. 2020, 147, 1107–1115. [Google Scholar] [CrossRef]
- Supreetha, R.; Bindya, S.; Deepika, P.; Vinusha, H. M.; Hema, B. P. Characterization and biological activities of synthesized citrus pectin-MgO nanocomposite, Res. Chem. 2021, 3, 100156. [Google Scholar]
- Mamiru, D.; Gonfa, G. ; Extraction and characterization of pectin from watermelon rind using acetic acid. Heliyon. 2023, 9, 13525. [Google Scholar] [CrossRef]
- Mahdy Sara, Z. A.; Amin Alaa, S.; Abouzeid, R.; Moustafa Islam M., I.; Youssef Ahmed, M.; Habbasha E. S., E. Development and Evaluation of Pectin extracted from Citrus sinensis peel and micro/nanocellulose from the solid fraction of citrus wastes. Egypt. J. Chem. 2024, 67, 615–623. [Google Scholar] [CrossRef]
- Kumar, A.; Chauhan, G. S. Extraction and characterization of pectin from apple pomace and its evaluation as lipase (steapsin) inhibitor. Carbohydr. Polym. 2010, 82, 454–459. [Google Scholar] [CrossRef]
- Chien, W. J.; Saputri, D.S.; Yanti, S.; Agrawal, D. C. Response surface methodology for simple non-acid ultrasonic-assisted extraction of pectin from Taiwan’s citrus depressa H. peels. CMUJ. Nat. Sci. 2022, 21(4), 2022062. [Google Scholar] [CrossRef]
- Liang, Y.; Yang, Y.; Zheng, L.; Zheng, X.; Xiao, D.; Wang, S.; Ai, B.; Sheng, Z. Extraction of Pectin from Passion Fruit Peel: Composition, Structural Characterization and Emulsion Stability. Foods. 2022, 11, 3995. [Google Scholar] [CrossRef]
- Pokhrel, S.; Dahal, S.; Samantha, K.C. Extraction and Characterization of Pectin from Orange Peel. J. Nepal Chem. Soc. 2024, 44(2), 110–119. [Google Scholar] [CrossRef]
- Fanchao, N.; Wei, X.; Chaozhang, H.; Hongqiao, L.; Yanjun, H.; Miao, G.; Jun, Y. Development of an analysis method for determination of pectin in tobacco by solid state 13C CP / MAS NMR. J. Uni. Sci. Technol. China. 2021, 51, 637–646. [Google Scholar]
- Zhu, X.; Liu, B.; Zheng, S.; Gao, Y. Quantitative and structure analysis of pectin in tobacco by 13C CP/MAS NMR spectroscopy. Anal. Methods. 2014, 6, 6407–6413. [Google Scholar] [CrossRef]
- Winning, H.; Viereck, N.; Nørgaard, L.; Larsen, J.; Engelsen, S. B. Quantification of the degree of blockiness in pectins using 1H NMR spectroscopy and chemometrics. Food Hydrocoll 2007, 21, 256–266. [Google Scholar] [CrossRef]
- Li, D.; Duan, X.; Zhang, X.; Zhang, Y.; Zhang, Z.; Liu, C. Effects of Hydrothermal Process on the Extraction and Physicochemical Properties of Pectin from Orange Peel. Food Hydrocoll. 2019, 97, 105204. [Google Scholar]
- Wani, K. M.; Uppaluri, R. V. S. Efficacy of ultrasound-assisted extraction of bioactive constituents from Psidium guajava leaves. Appl. Food Res. 2022, 2, 100096. [Google Scholar] [CrossRef]
- Sarangi, P. K.; Mishra, S.; Mohanty, P.; Singh, P.K.; Srivastava, R.K.; Pattnaik, R.; Adhya, T.K.; Das, T.; Lenka, B.; Gupta, V.K.; Sharma, M.; Sahoo, U.K. Food and fruit waste valorization for pectin recovery: Recent process technologies and future prospects. Int. J. Biol. Macromol. 2023, 235, 123929. [Google Scholar] [CrossRef]
- Minjares-Fuentes, R.; Femenia, A.; Garau, M. C.; Meza-Velázquez, J. A.; Simal, S.; Rosselló, C. Ultrasound-assisted extraction of pectin from grape pomace using citric acid: a response surface methodology approach. Carbohydr. Polym. 2014, 106(1), 179–189. [Google Scholar] [CrossRef] [PubMed]
- Basak, S.; Annapure, U. S. The potential of subcritical water as a “green” method for the extraction and modification of pectin: A critical review. Food Res. Int. 2022, 161, 111849. [Google Scholar] [CrossRef]
- Majid, I.; Khan, S.; Aladel, A.; Aamir Hussain, D.; Adnan, M.; Idreesh Khan, A.; Awadelkareem, A.M.; Ashraf, S. A. Recent insights into green extraction techniques as efficient methods for the extraction of bioactive components and essential oils from foods, CyTA – J. Food. 2023, 21(1), 101–114. [Google Scholar] [CrossRef]
- Mehta, N.; Jeyapriya, S.; Kumar, P.; Verma, A. K.; Umaraw, P.; Khatkar, S. K.; Khatkar, A. B.; Pathak, D.; Kaka, U.; Sazili, A. Q. Ultrasound-Assisted Extraction and the Encapsulation of Bioactive Components for Food Applications. Foods. 2022, 11, 2973. [Google Scholar] [CrossRef]
- Wani, K.M.; Uppaluri, R. V. S. Characterization of pectin extracted from pomelo peel using pulsed ultrasound-assisted extraction and acidic hot water extraction process. Appl. Food Res. 2023, 3, 100345. [Google Scholar] [CrossRef]
- Dranca, F.; Mironeasa, S. Green Extraction of Pectin from Sugar Beet Flakes and Its Application in Hydrogels and Cryogels. Gels. 2024, 10, 228. [Google Scholar] [CrossRef] [PubMed]
- Luo, W. B.; Han, Z.; Zeng, X. A.; Yu, S. J.; Kennedy, J. F. Study on the degradation of chitosan by pulsed electric fields treatment. Innov. Food Sci. Emerg. Technol. 2010, 11(4), 587–591. [Google Scholar] [CrossRef]
- Ma, S.; Wang, Z. H. Pulsed electric field-assisted modification of pectin from sugar beet pulp. Carbohydr. Polym. 2013, 92(2), 1700–1704. [Google Scholar] [CrossRef] [PubMed]
- Moens, L. G.; De Laet, E.; Van Wambeke, J.; Van Loey, A. M.; Hendrickx, M. E. Pulsed electric field and mild thermal processing affect the cooking behaviour of carrot tissues (Daucus carota) and the degree of methyl esterification of carrot pectin. Inn. Food Sci. Emer. Technol. 2020, 66, 102483. [Google Scholar] [CrossRef]
- Abou-Shady, A.; El-Araby, H. A comprehensive analysis of the advantages and disadvantages of pulsed electric fields during soil electrokinetic remediation. Int. J. Environ. Sci. Technol. 2024. [Google Scholar] [CrossRef]
- Gavahian, M.; Chu, Y.H.; Sastry, S. Extraction from Food and Natural Products by Moderate Electric Field: Mechanisms, Benefits, and Potential Industrial Applications. Compr Rev Food Sci Food Saf. 2018, 17(4), 1040–1052. [Google Scholar] [CrossRef]
- Hazal, F.; Ozbek, H. N.; Gögüs, F.; Yanık, D.K. A Comprehensive Review on Valuable Components in Food Processing Waste and Their Recovery by Microwave Assisted Extraction. Euroasia J. Math. Eng. Nat. Med. Sci. 2023, 10, 164–184. [Google Scholar]
- Maran, J. P.; Sivakumar, V.; Thirugnanasambandham, K.; Sridhar, R. Optimization of Microwave Assisted Extraction of Pectin from Orange Peel. Carbohydr. Polym. 2013, 97, 703–709. [Google Scholar] [CrossRef]
- Karbuz, P.; Tugrul, N. Microwave and Ultrasound Assisted Extraction of Pectin from Various Fruit Peel. J. Food Sci. Technol. 2021, 58, 641–650. [Google Scholar] [CrossRef]
- Bagherian, H.; Ashtiani, F. Z.; Fouladitajar, A.; Mohtashamy, M. Comparisons between conventional, microwave- and ultrasound-assisted methods for extraction of pectin from grapefruit. Chem. Eng. and Process.: Process. Intensification 2011, 50, 1237–1243. [Google Scholar] [CrossRef]
- Kratchanova, M.; Pavlova, E.; Panchev, I. The effect of microwave heating of fresh orange peels on the fruit tissue and quality of extracted pectin, Carbohydr. Polym. 2004, 56, 181–185. [Google Scholar]
- Danlami, J. M.; Arsad, A.; Zaini, M. A. A.; Hanizam, S. A comparative study of various oil extraction techniques from plants. Rev.Chem. Eng. 2014, 30(6), 605–626. [Google Scholar] [CrossRef]
- Chen, H. M.; Fu, X.; Luo, Z. G. Properties and extraction of pectin-enriched materials from sugar beet pulp by ultrasonic-assisted treatment combined with subcritical water. Food Chem. 2015, 168, 302–310. [Google Scholar] [CrossRef]
- Mlyuka, E.; Mbifile, M.; Zhang, S.; Zheng, Z.; Chen, J. Strategic Applications and the Challenges of Subcritical Water Extraction Technology in Food Industries. Chiang Mai. J. Sci. 2018, 45(2), 1015–1029. [Google Scholar]
- Freitas, C.M.P.; Sousa, R.C.S.; Dias, M. M. S.; Coimbra, J. S. R. Extraction of pectin from passion fruit peel, Food Eng. Rev. 2020, 12, 460–472. [Google Scholar]
- Poojary, M. M.; Orlien, V.; Passamonti, P.; Olsen, K. Enzyme-assisted extraction enhancing the umami taste amino acids recovery from several cultivated mushrooms. Food Chem. 2017, 234, 236–244. [Google Scholar] [CrossRef]
- Munarin, F.; Tanzi, M.C.; Petrini, P. Advances in biomedical applications of pectin gels. Int. J. Biol. Macromol. 2012, 51, 681–689. [Google Scholar] [CrossRef]
- Rhein-Knudsen, N.; Ale, M. T.; Meyer, A. S. Seaweed hydrocolloid production: an update on enzyme assisted extraction and modification technologies. Marine drugs. 2015, 13, 3340–3359. [Google Scholar] [CrossRef]
- Rosa, R.; Spinelli, R.; Neri, P.; Pini, M.; Barbi, S.; Montorsi, M.; Maistrello, L.; Marseglia, A.; Caligiani, A.; Ferrari, A.M. Life Cycle Assessment of Chemical vs Enzymatic-Assisted Extraction of Proteins from Black Soldier Fly Prepupae for the Preparation of Biomaterials for Potential Agricultural Use. ACS Sust. Chem. Eng. 2020, 8(39), 14752–14764. [Google Scholar] [CrossRef]
- Turan, O.; Isci, A.; Sılanur Yılmaz, M.; Tolun, A.; Sakiyan, O. Microwave-assisted extraction of pectin from orange peel using deep eutectic solvents. Sust. Chem. Pharm. 2024, 2024, 101352. [Google Scholar] [CrossRef]
- Jaeschke, D. P.; Ferreira, S. R. S.; Dariva, C.; Oliveira, J. V. Ohmic Heating-Assisted Extraction of Bioactive Compounds from Plants: A Review. Innov. Food Sci. Emerg. Technol. 2019, 54, 210–225. [Google Scholar]
- Sarkis, J. R.; Jaeschke, D. P.; Tessaro, I. C.; Marczak, L. D. F. Effects of Ohmic and Conventional Heating on the Extraction Yield and Composition of Pectin from Passion Fruit Peel. Food Res. Int. 2013, 54, 847–852. [Google Scholar]
- Gavahian, M.; Chu, R. Ohmic Heating Extraction at Different Times, Temperatures, Voltages, and Frequencies: A New Energy-Saving Technique for Pineapple Core Valorization. Foods. 2022, 11, 2015. [Google Scholar] [CrossRef]
- Sharifi, A.; Hamidi-Esfahani, Z. .; Gavlighi, H. A.; Saberian, H. Assisted ohmic heating extraction of pectin from pomegranate peel. Chem. Eng. Process.Process Inten. 2022, 172, 108760. [Google Scholar] [CrossRef]
- Zhang, L.; Xu, C.; Zhang, W.; Liu, H.; Li, X.; Yu, H. Application of Ultrasound and Microwave for Efficient Extraction of Pectin from Citrus Peels: A Review. Ultrason. Sonochem. 2020, 61, 104856. [Google Scholar]
- Wang, W.; Ma, X.; Xu, Y.; Cao, Y.; Jiang, Z.; Ding, T.; Ye, X.; Liu, D. Ultrasound-Assisted Microwave Extraction of Pectin from Citrus Peel: Optimization, Characterization and Bioactivity. Carbohydr. Polym. 2017, 169, 344–352. [Google Scholar]
- Karbuz, P. and Tugrul, N. Microwave and ultrasound assisted extraction of pectin from various fruits peel. J. food Sci. Tech. 2021, 58, 641–650. [Google Scholar] [CrossRef]
- Yang, J. S.; Mu, T.-H.; Ma, M. M. Optimization of ultrasound-microwave assisted acid extraction of pectin from potato pulp by response surface methodology and its characterization. Food Chem. 2019, 289, 351–359. [Google Scholar] [CrossRef]
- Lasunon; P. ; Sengkhamparn, N. Effect of Ultrasound-Assisted, Microwave-Assisted and Ultrasound-Microwave-Assisted Extraction on Pectin Extraction from Industrial Tomato Waste. Molecules, 2022, 27, 1–13. [Google Scholar]
- Forouhar, A.; Hamdami, N.; Djelveh, G.; Gardarin, C.; Pierre, G.; Ursu, A.V.; Michaud, P. The Effect of Ultrasound Pretreatment on Pectin Extraction from Watermelon Rind Using Microwave-Assisted Extraction. Appl. Sci. 2023, 13, 5558. [Google Scholar] [CrossRef]
- Castro, J. P.; Nobre, C.; de Carvalho, C. W. P.; Soares, M. H.; da Rosa, G. S.; Trindade, C. S. F. Ultrasound-Assisted Ohmic Heating for Pectin Extraction: A New Hybrid Process. J. Food Eng. 2018, 227, 88–96. [Google Scholar]
- Azmir, J.; Zaidul, I. S. M.; Rahman, M. M.; Sharif, K. M.; Mohamed, A.; Sahena, F.; Jahurul, M. H. A.; Ghafoor, K.; Norulaini, N. A. N.; Omar, A. K. M. Techniques for Extraction of Bioactive Compounds from Plant Materials: A Review. J. Food Eng. 2013, 117, 426–436. [Google Scholar] [CrossRef]
- Wang, W.; Ma, X.; Xu, Y.; Cao,Y. ; Jiang, Z.; Ding, T.; Ye, X.; Liu, D. Ultrasound-assisted heating extraction of pectin from grapefruit peel: Optimization and comparison with the conventional method. Food Chem. 2015, 178, 106–114. [Google Scholar] [CrossRef]
- Xu,Y. ; Zhang, L.; Bailina, Y.; Ge, Z.; Ding, T.; Ye, X.; Liu, D. Effects of ultrasound and/or heating on the extraction of pectin from grapefruit peel. J. Food Eng. 2014, 126, 72–81. [Google Scholar] [CrossRef]
- Pińkowska, H.; Wolac, P.; Kryzywonos, M.; Złocińska, A. Comprehensive Study of Hydrothermal Extraction of Pectin From Sugar Beet Pulp. Waste and Biomass Valor. 2021, 12, 4587–4598. [Google Scholar] [CrossRef]
- Huang, H. W.; Wu, S. J.; Lu, J. L.; Shyu, Y. T.; Wang, C. Y. Current Status and Future Trends of High-Pressure Processing in the Food Industry. Food Control. 2019, 93, 328–345. [Google Scholar] [CrossRef]
- Barba, F. J.; Terefe, N. S.; Buckow, R.; Knorr, D.; Orlien, V. New Opportunities and Perspectives of High-Pressure Treatment to Improve Health and Safety Attributes of Foods: A Review. Food Res. Int. 2016, 89, 735–748. [Google Scholar] [CrossRef]
- Thirumdas, R.; Sarangapani, C.; Annapure, U. S. Cold Plasma: A Novel Non-Thermal Technology for Food Processing. Food Biophys. 2015, 10(1), 1–11. [Google Scholar] [CrossRef]
- Misra, N. N.; Keener, K. M.; Bourke, P.; Mosnier, J. P.; Cullen, P. J. In-Package Atmospheric Pressure Cold Plasma Treatment of Cherry Tomatoes. J. Food Eng. 2016, 190, 1–8. [Google Scholar] [CrossRef]
- Forouhar, A.; Hamdami, N.; Djelveh, G.; Lecerf, D.; Rihouey, C.; Gardarin, C.; Pierre, G.; Ursu, A. V.; Michaud, P. Effects of high voltage dielectric barrier discharge on the extraction and properties of pectins from watermelon rinds. Innov. Food Sci. Emerg. Technol. 2024, 91, 103558. [Google Scholar] [CrossRef]
Figure 1.
Various applications of pectin.
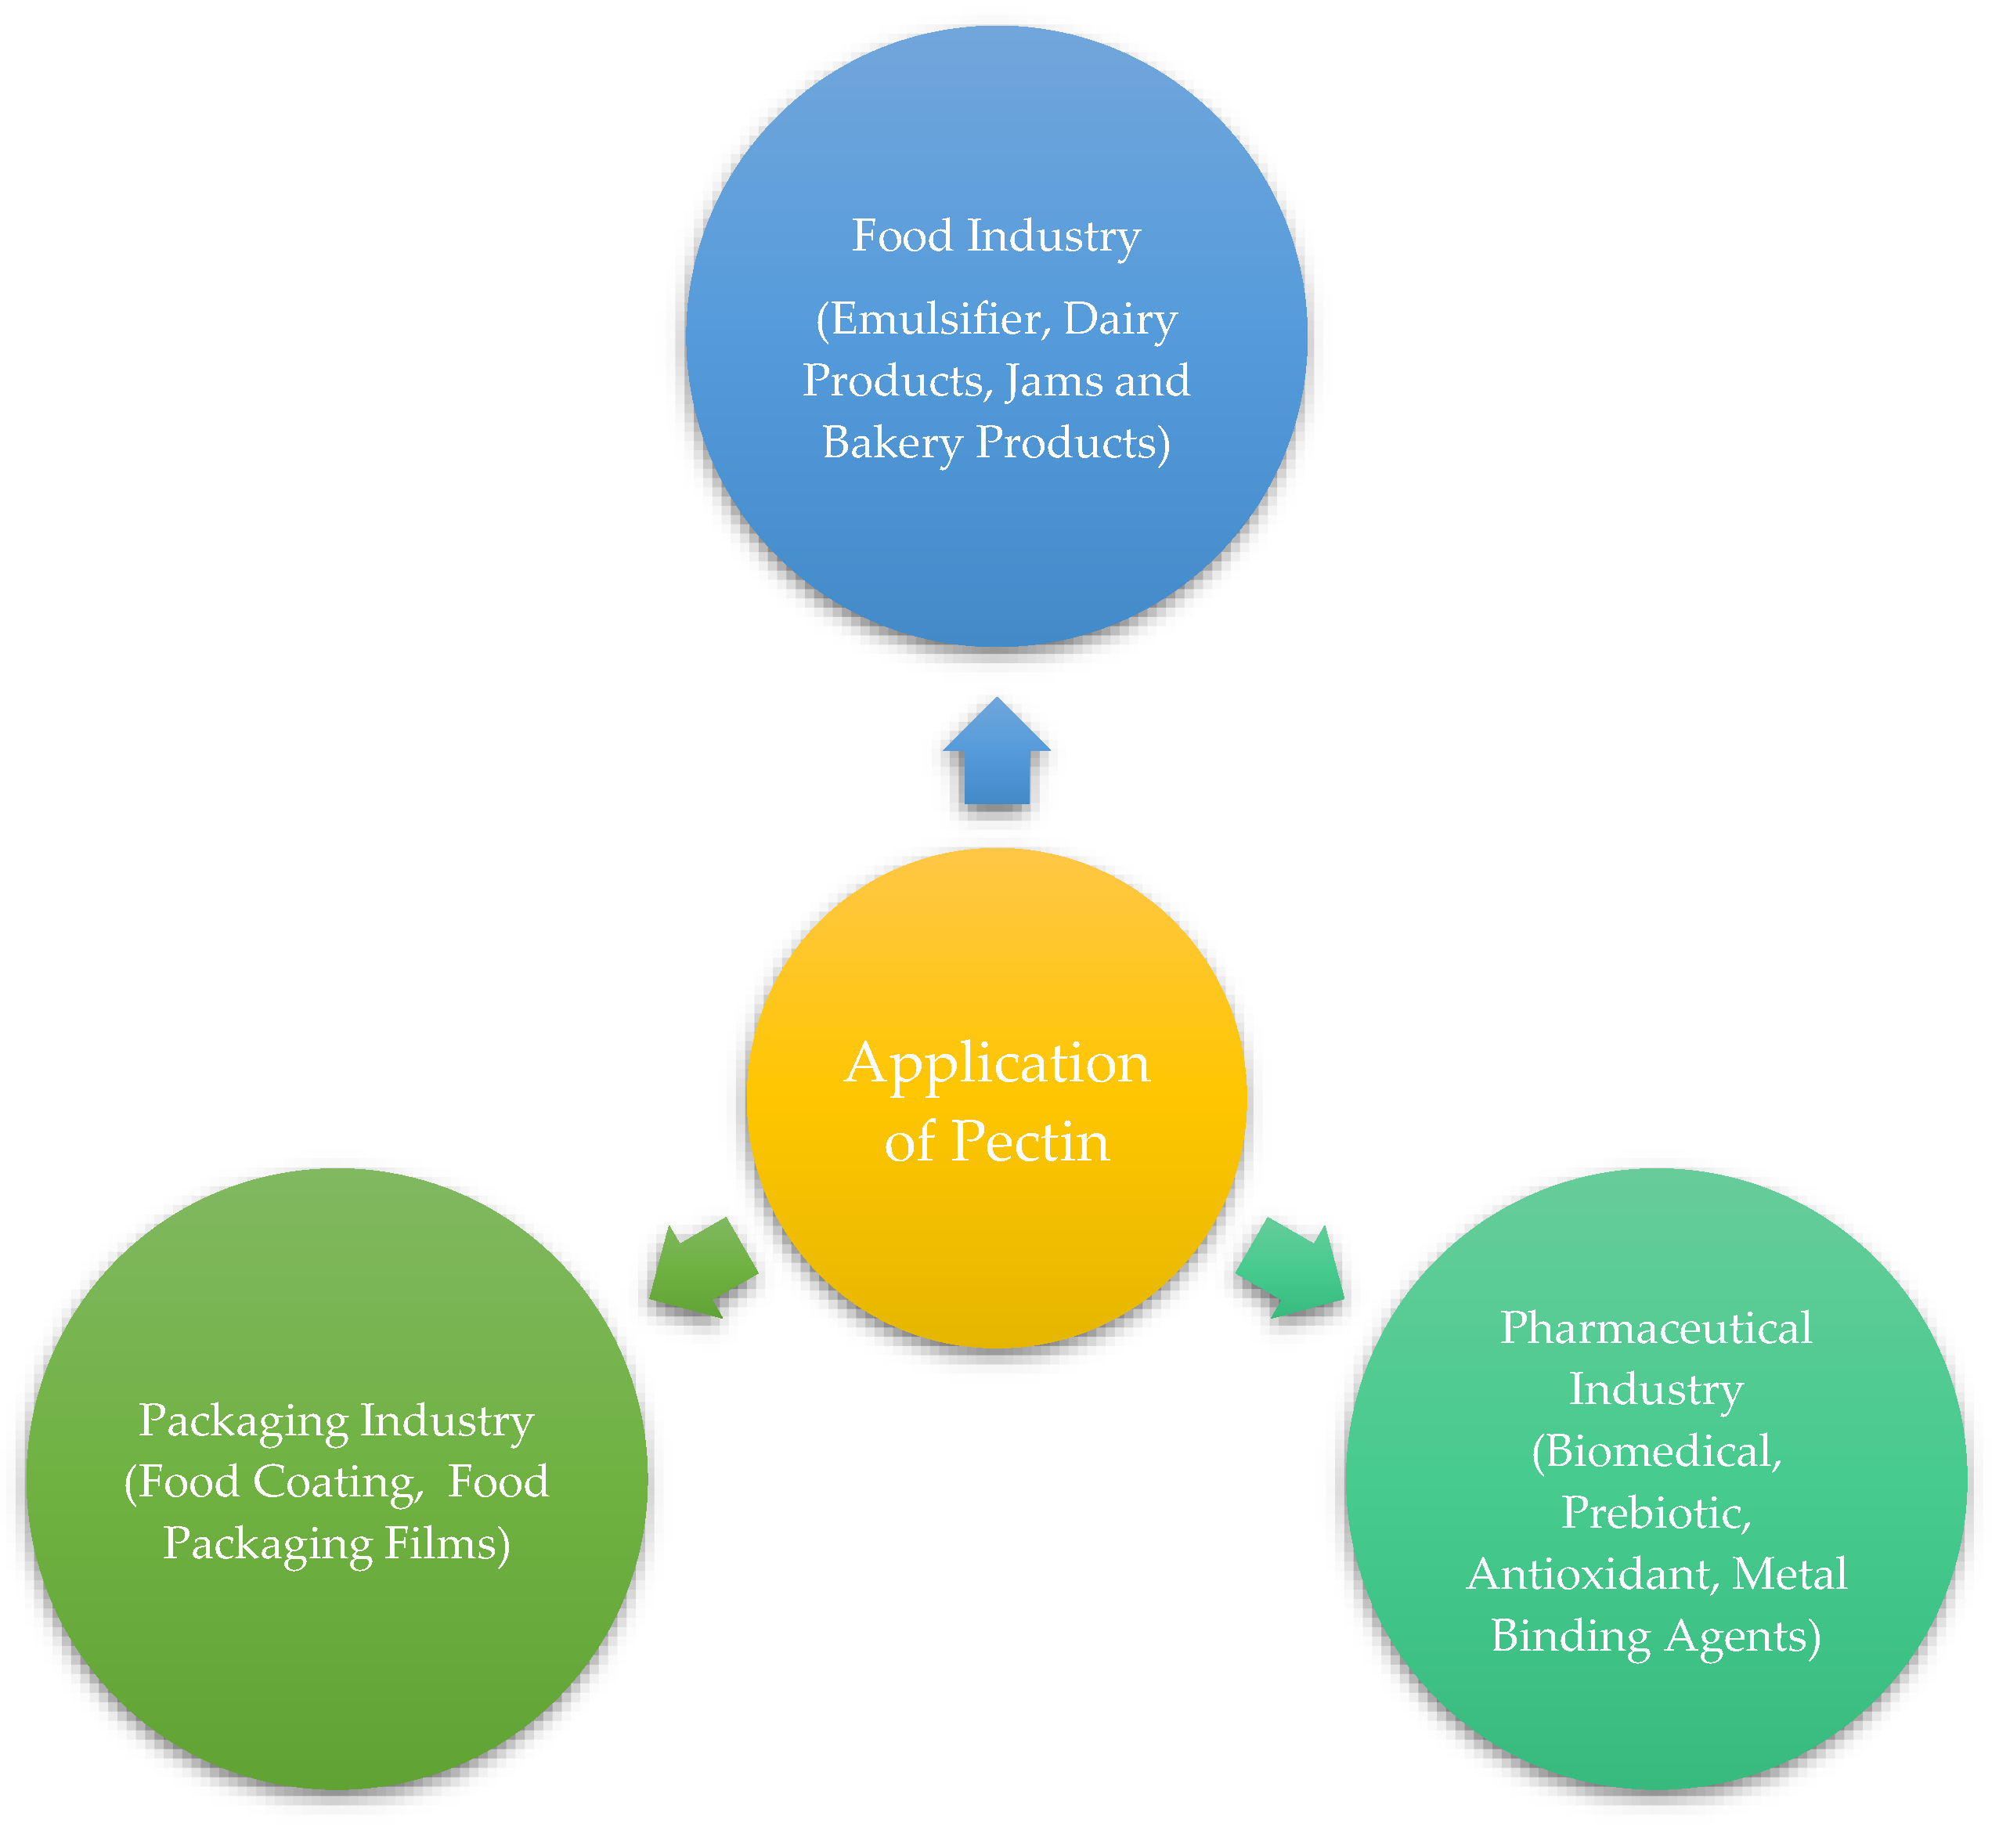
Figure 2.
Schematic representation of Ultrasound-Assisted Extraction technique.
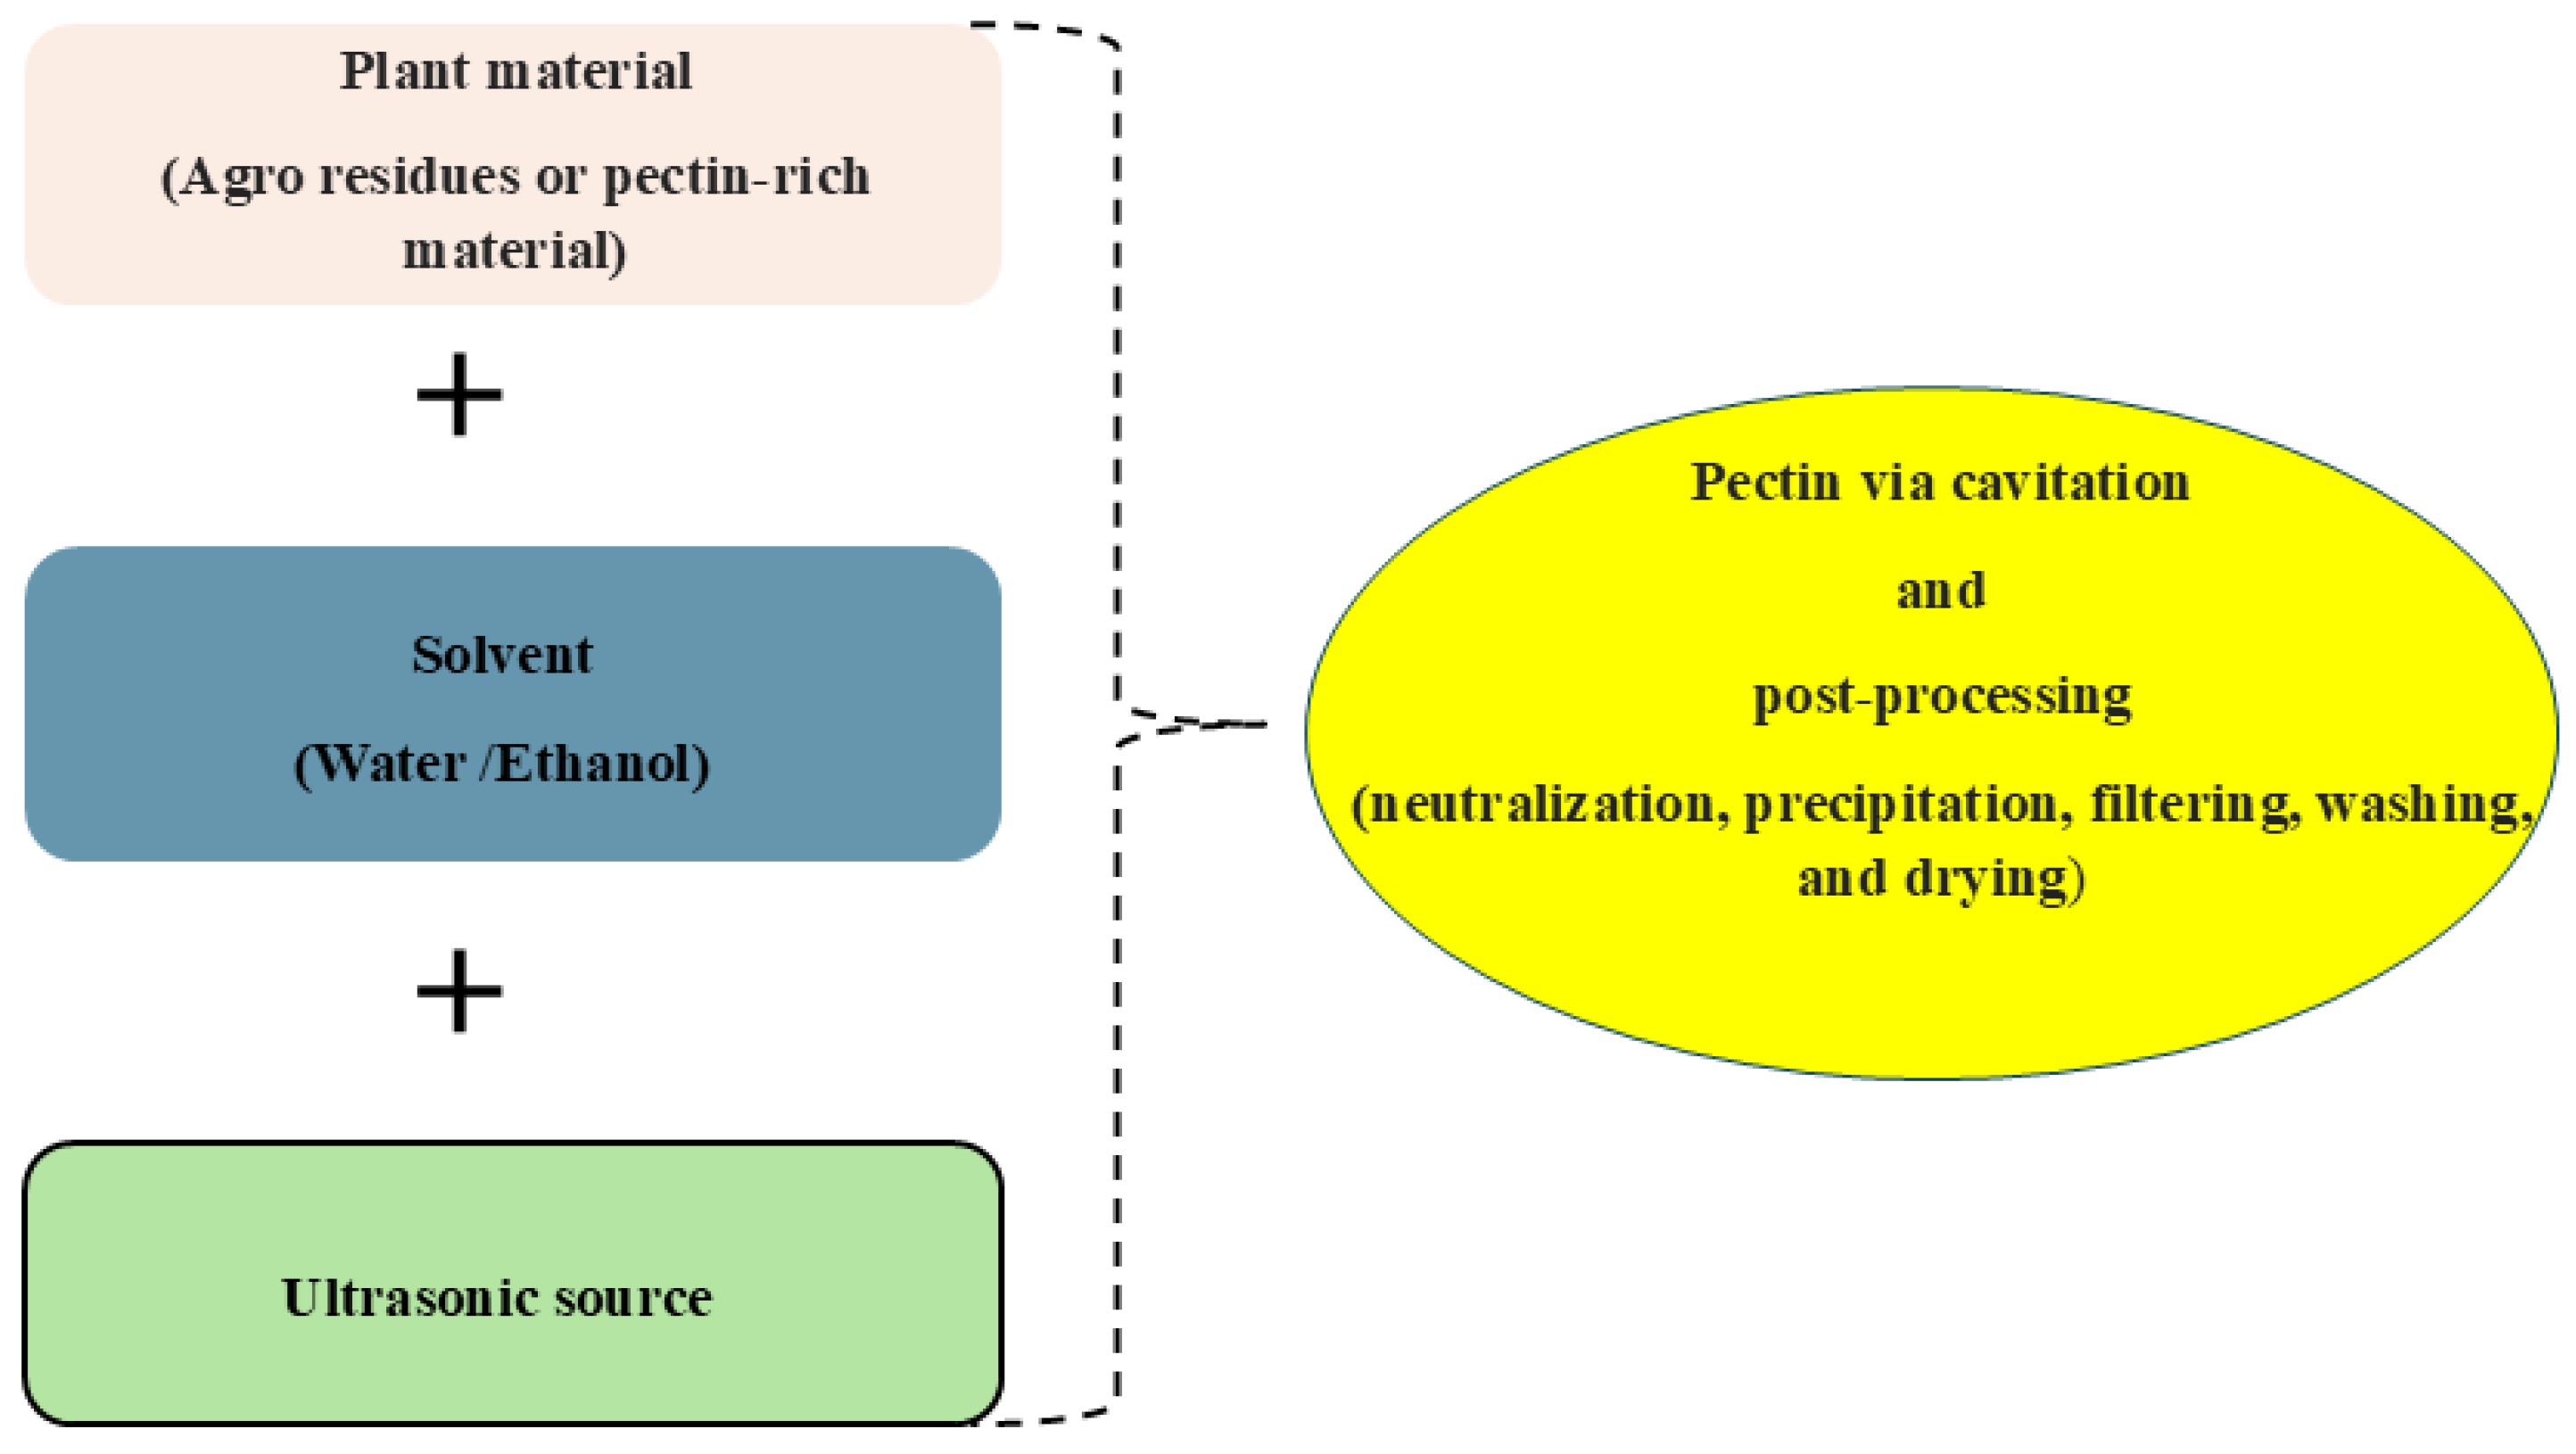
Figure 3.
Schematic representation of PUAE, PEF, MAE and EAE extraction techniques.
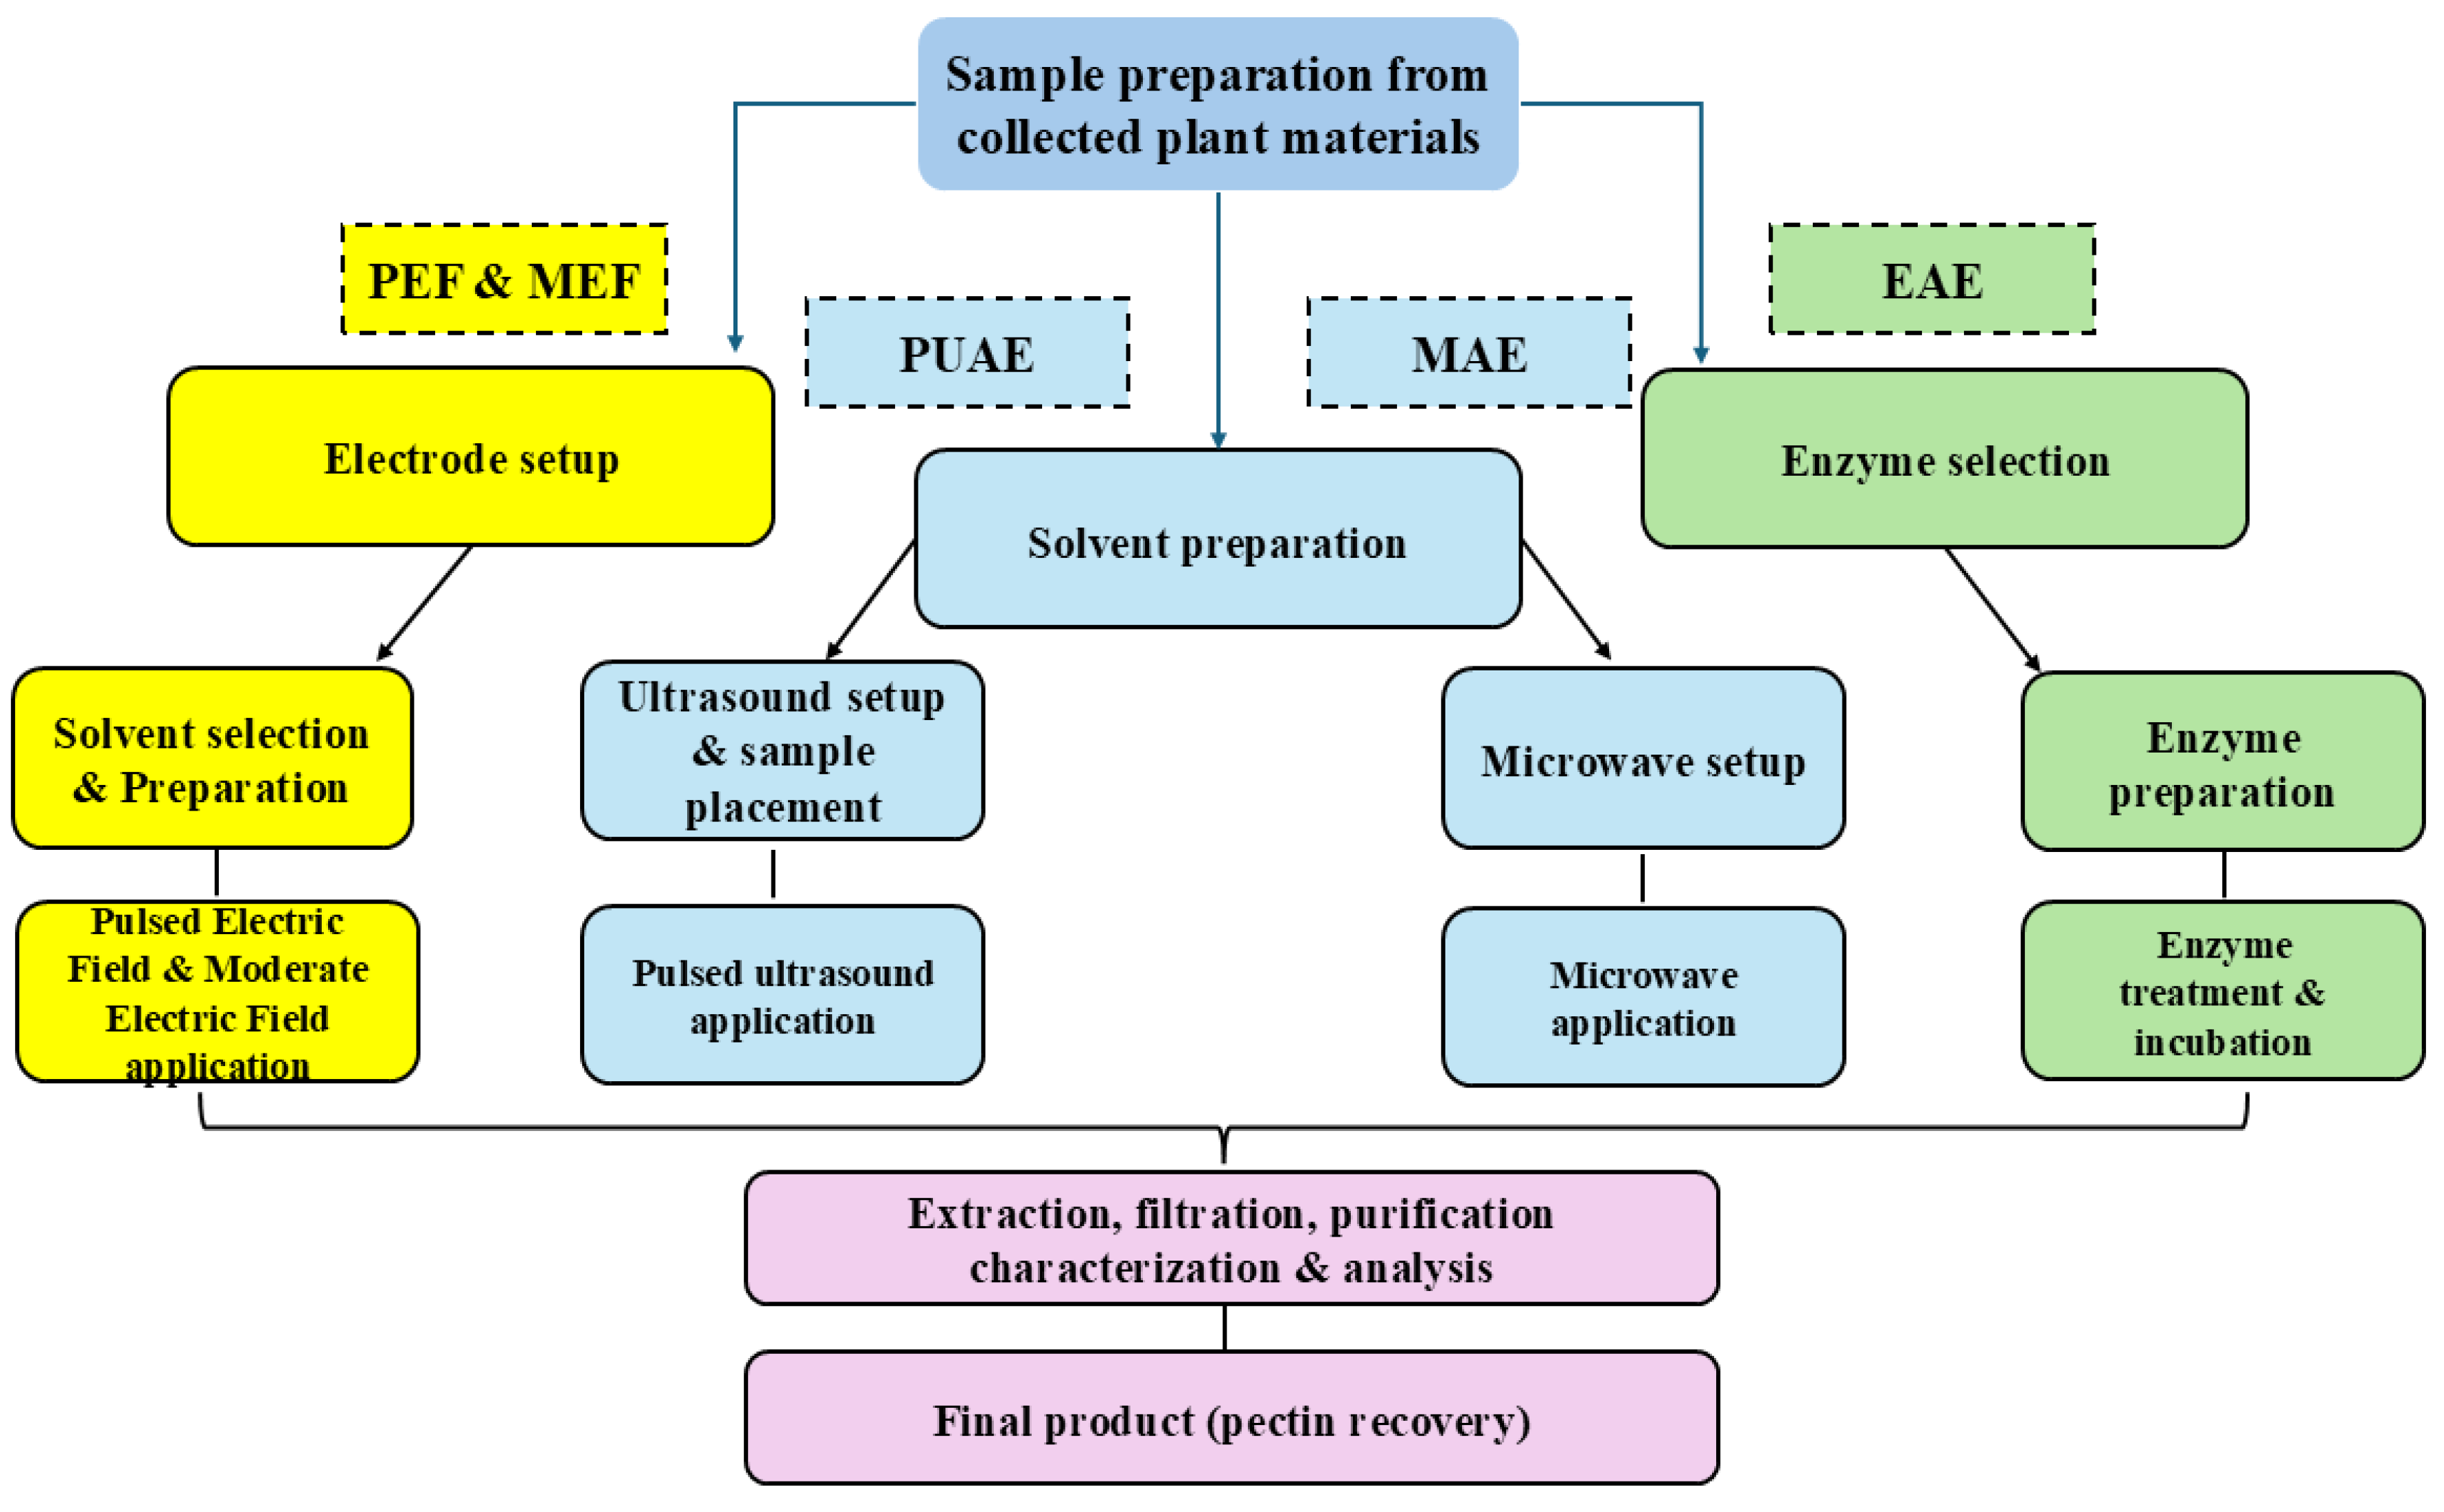
Figure 4.
Schematic representation of the SWE technique.
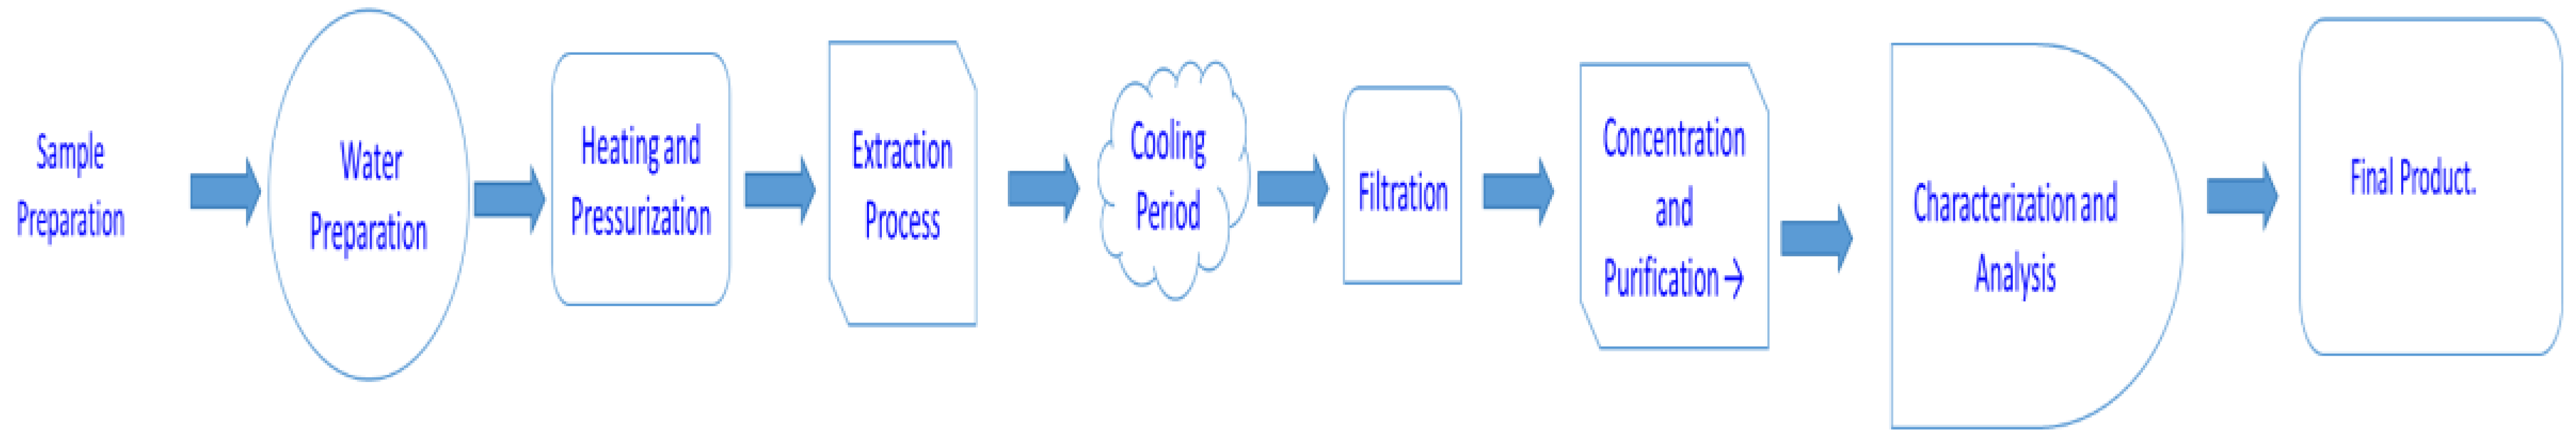
Figure 5.
Schematic representation of the Ohmic Heating-Assisted Extraction (OHAE) process.
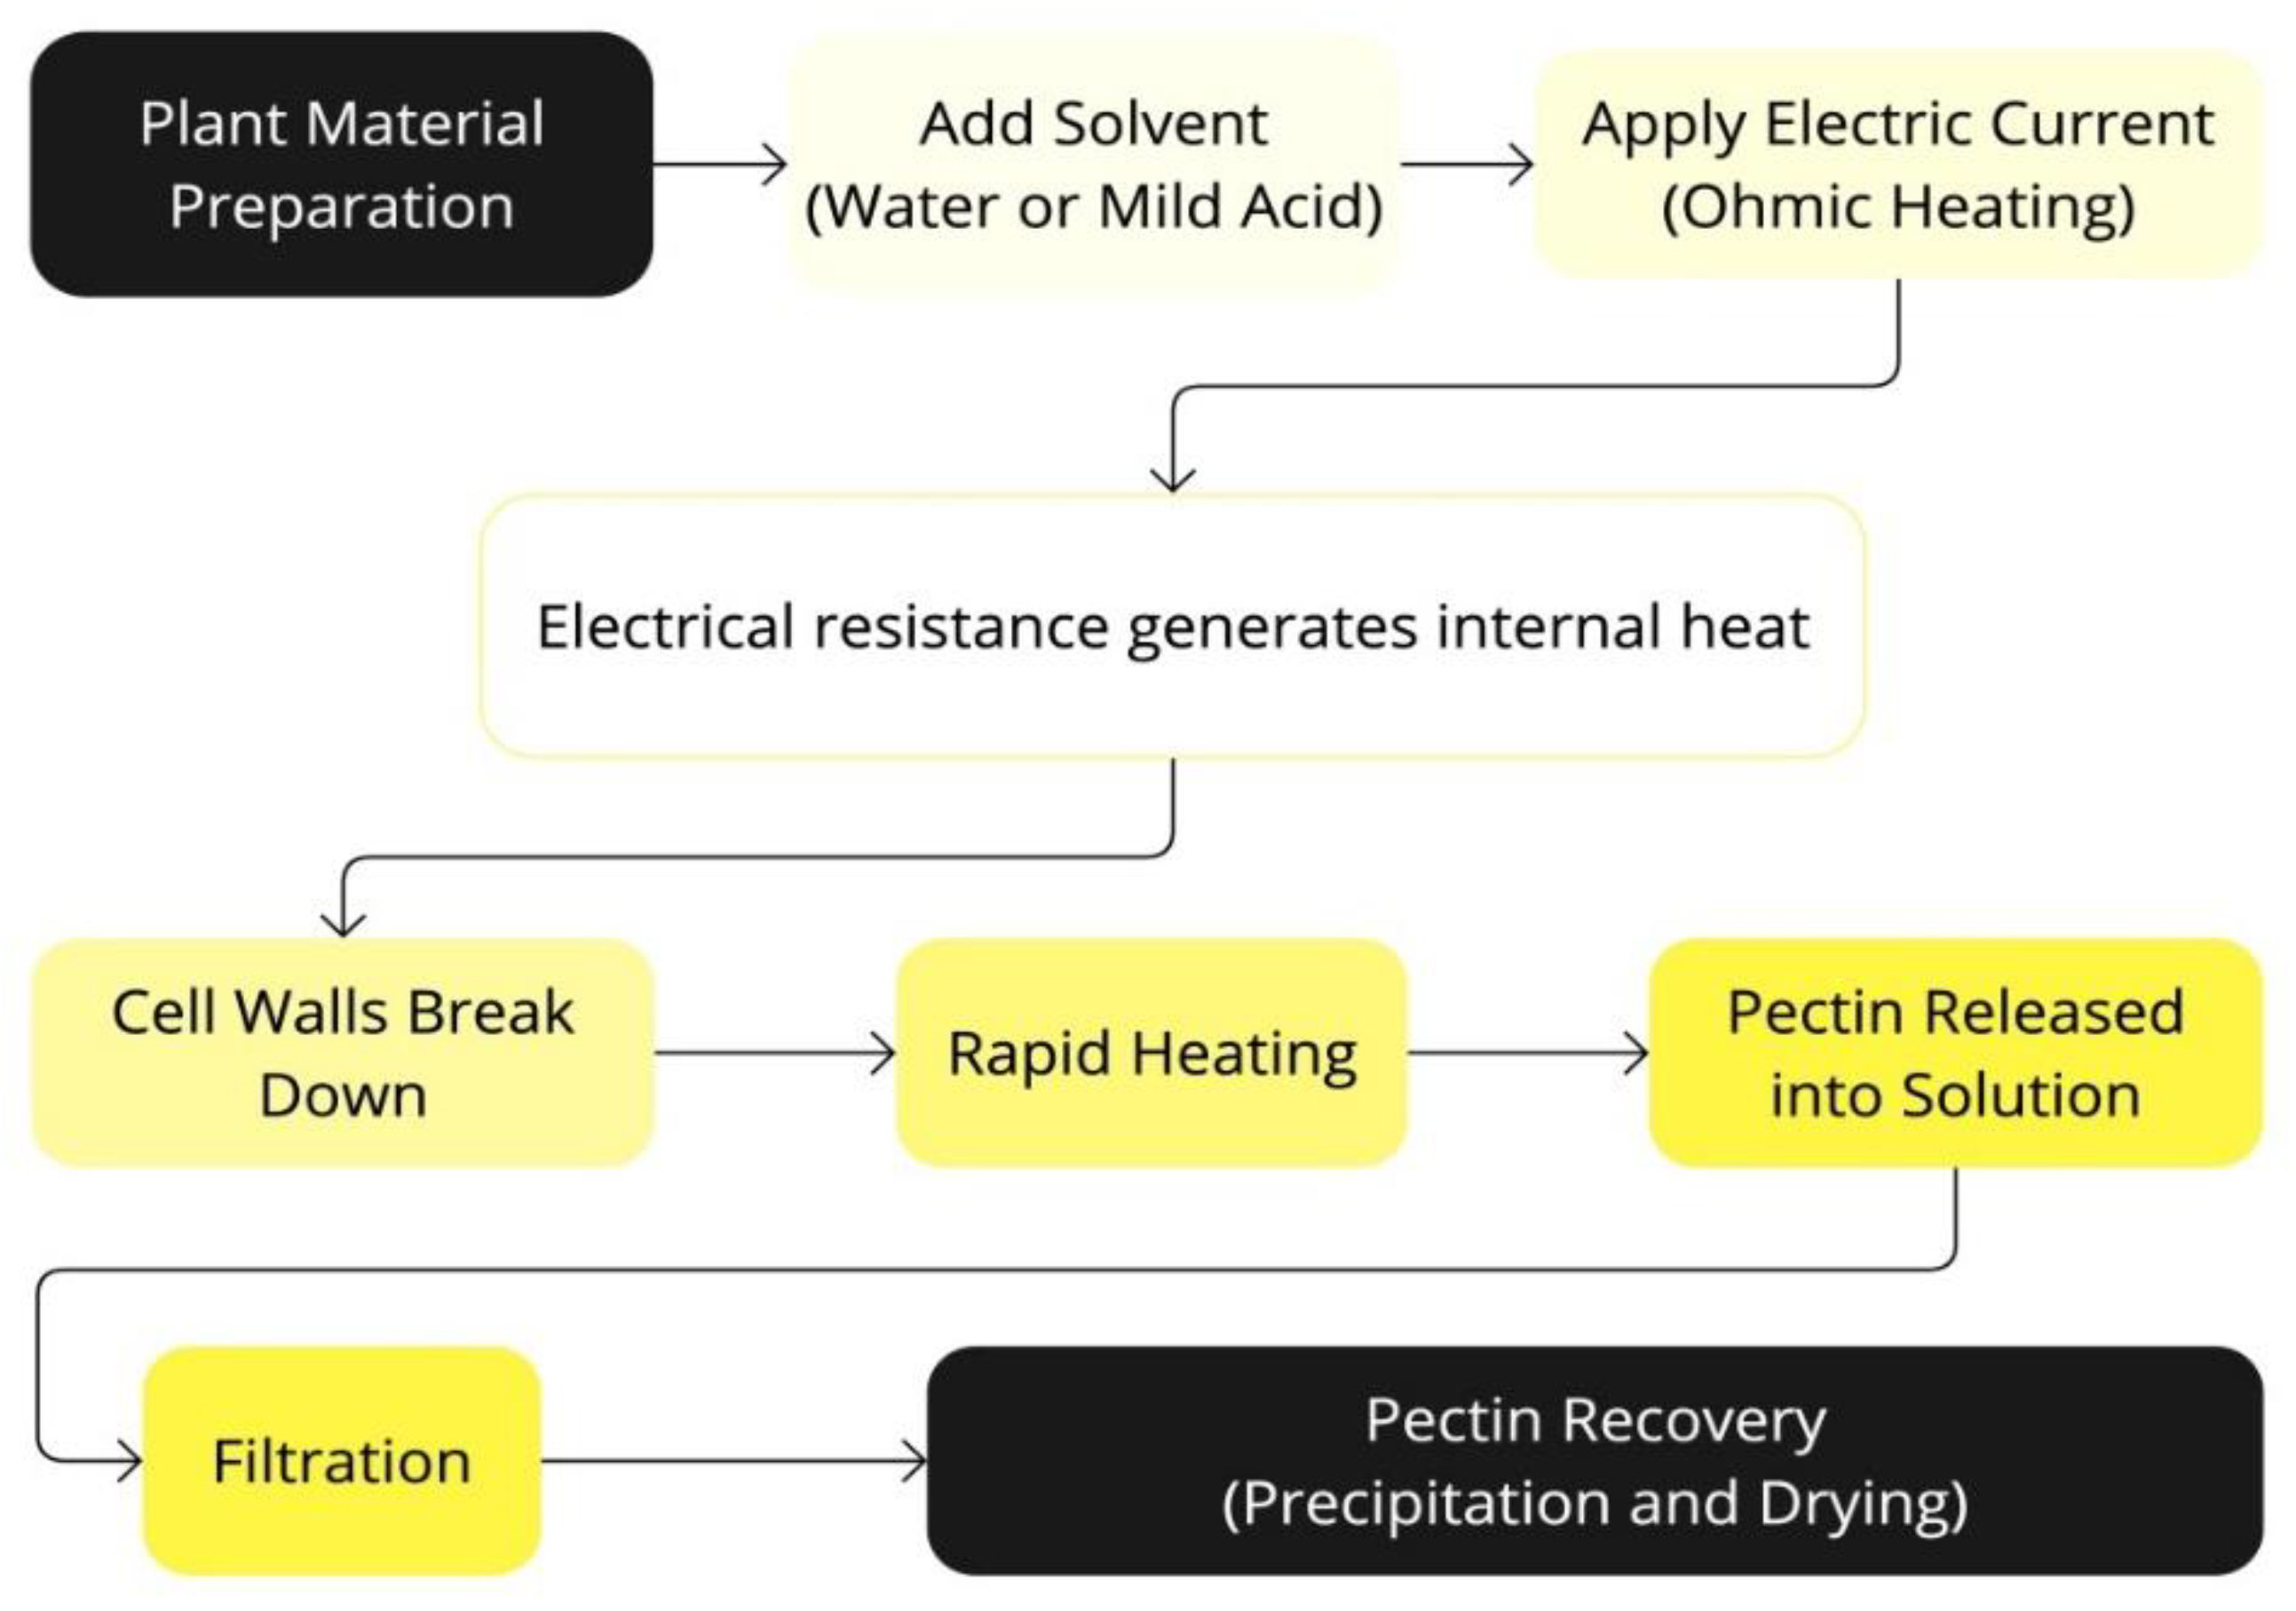
Figure 6.
Schematic representation of the Ultrasound-Assisted Microwave Extraction (UAME) process.
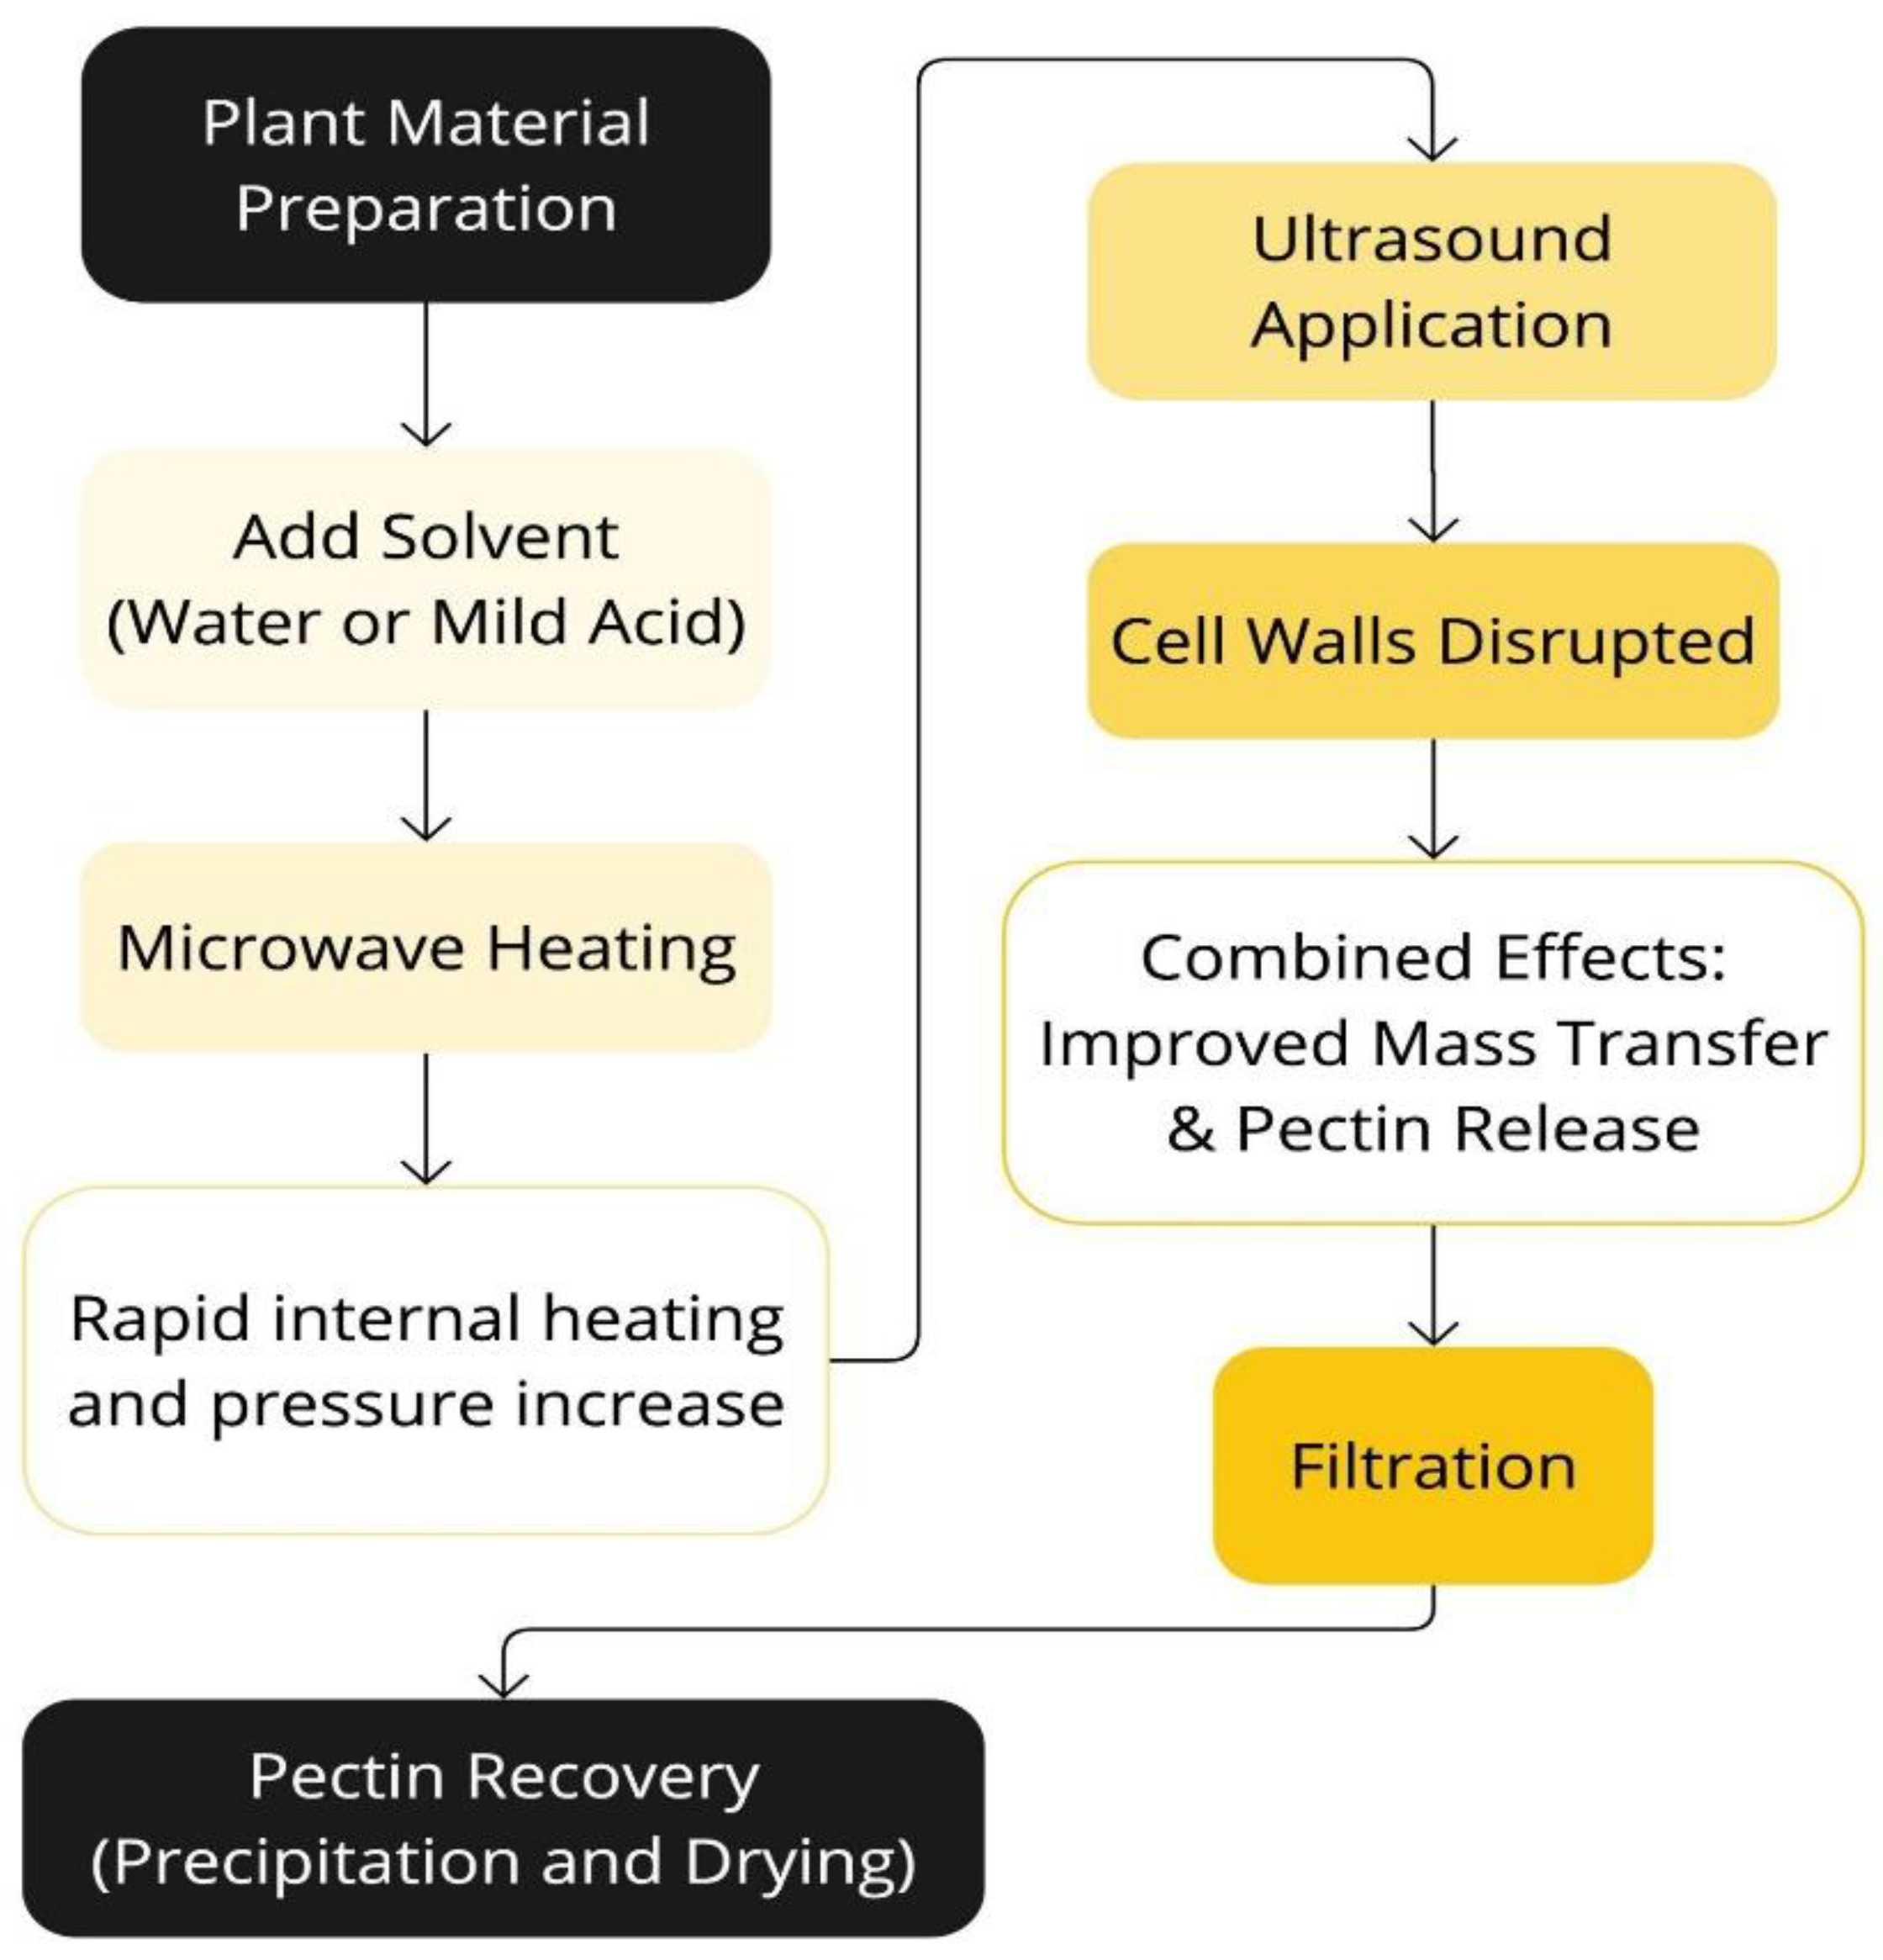
Figure 7.
Schematic representation of the process of Ultrasound-Assisted Ohmic Heating Extraction (UAOHE).
Figure 7.
Schematic representation of the process of Ultrasound-Assisted Ohmic Heating Extraction (UAOHE).
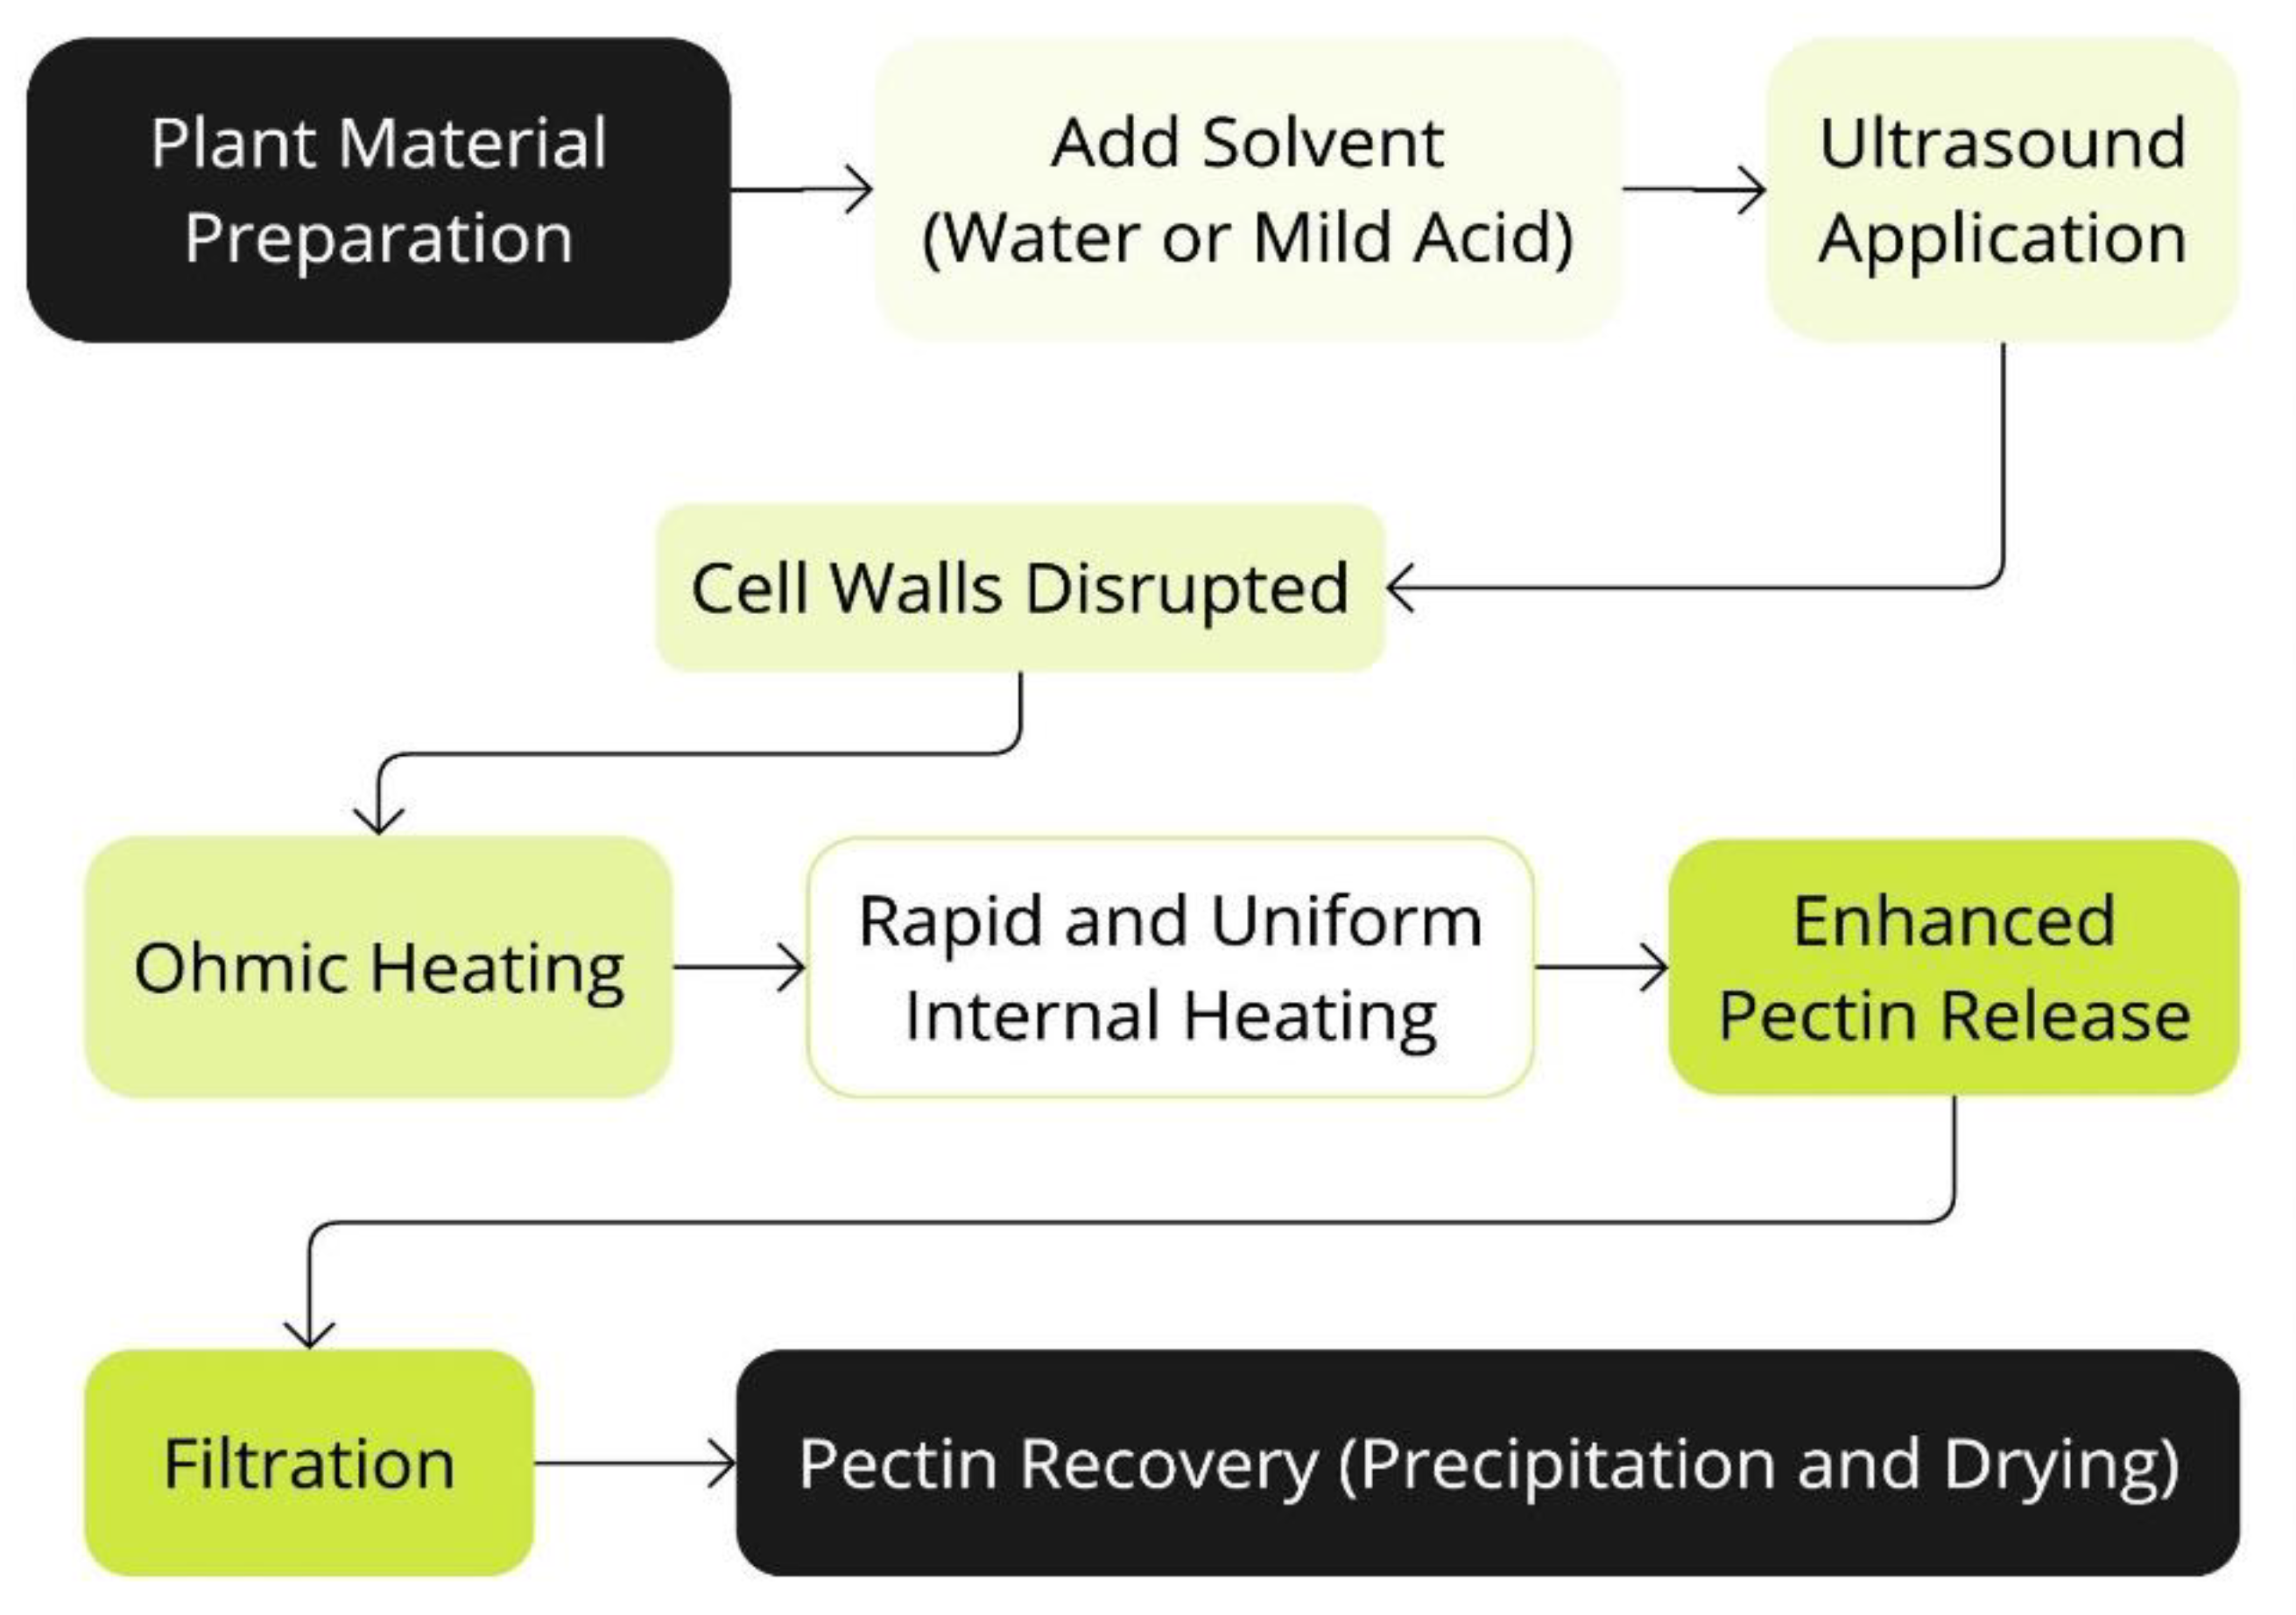
Figure 8.
Schematic representation of the Hydrothermal Extraction process (HTE).
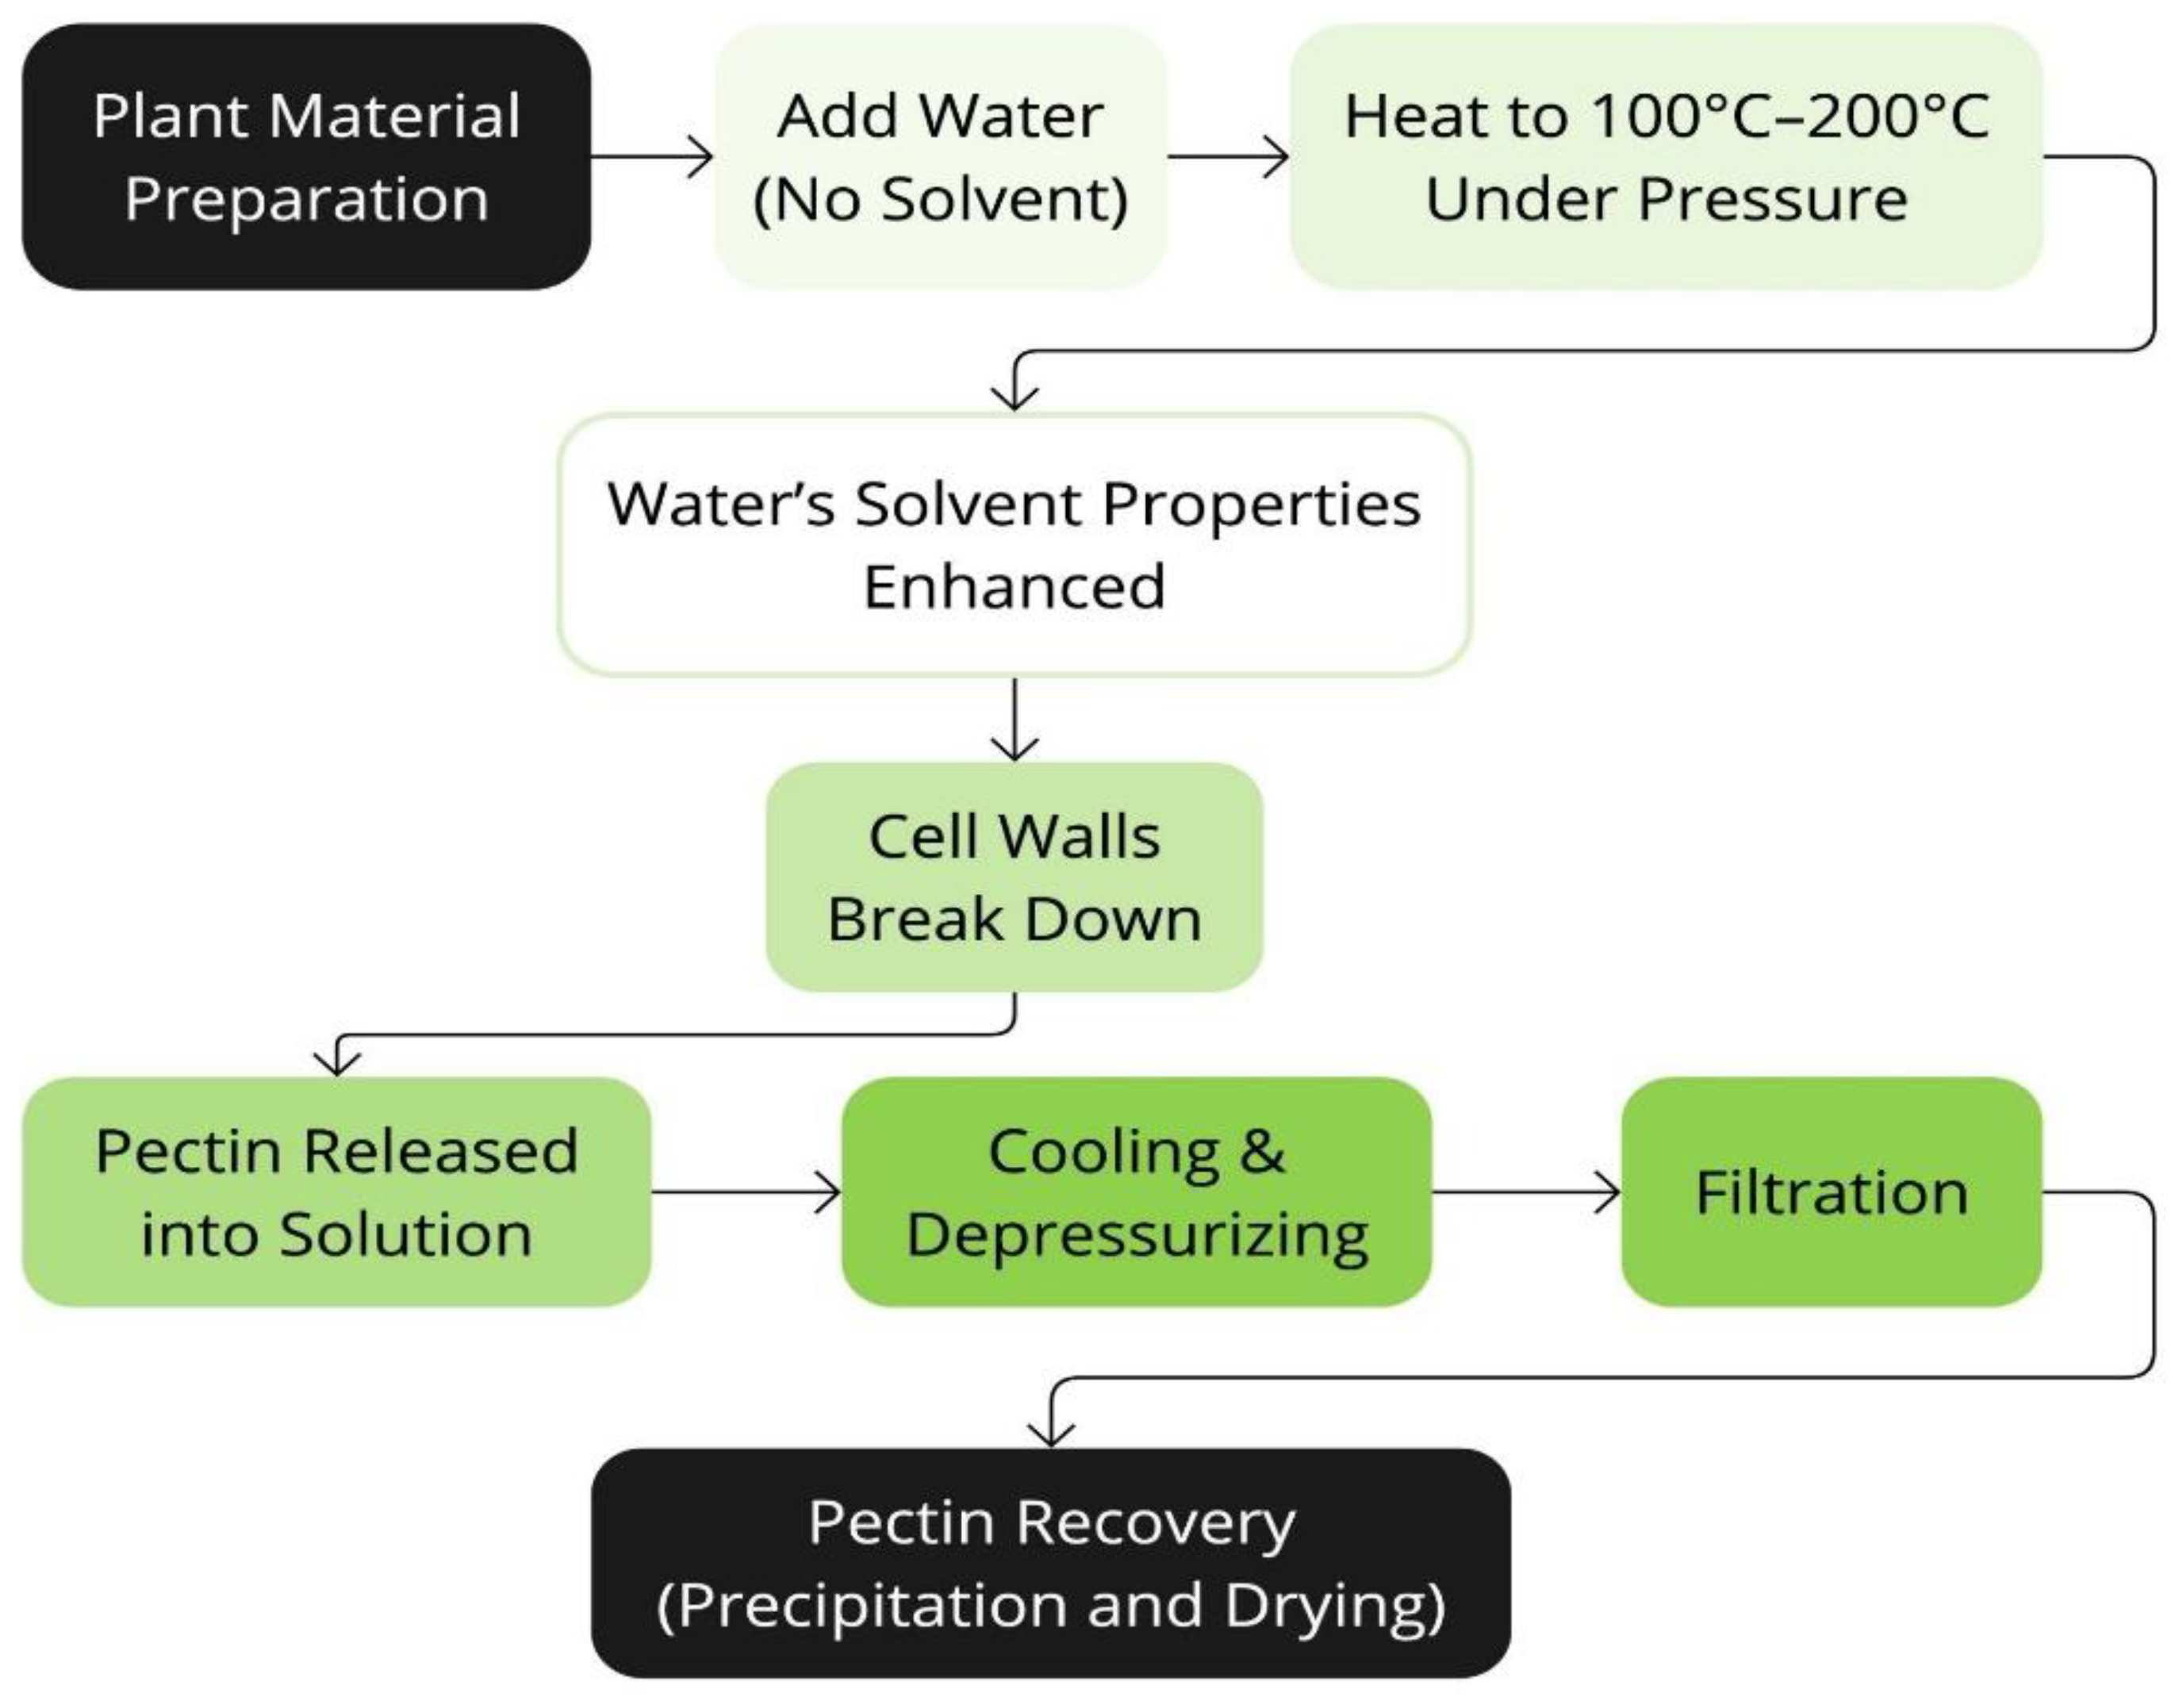
Figure 9.
Schematic representation of the High-Pressure Processing Extraction technique (HPPE).
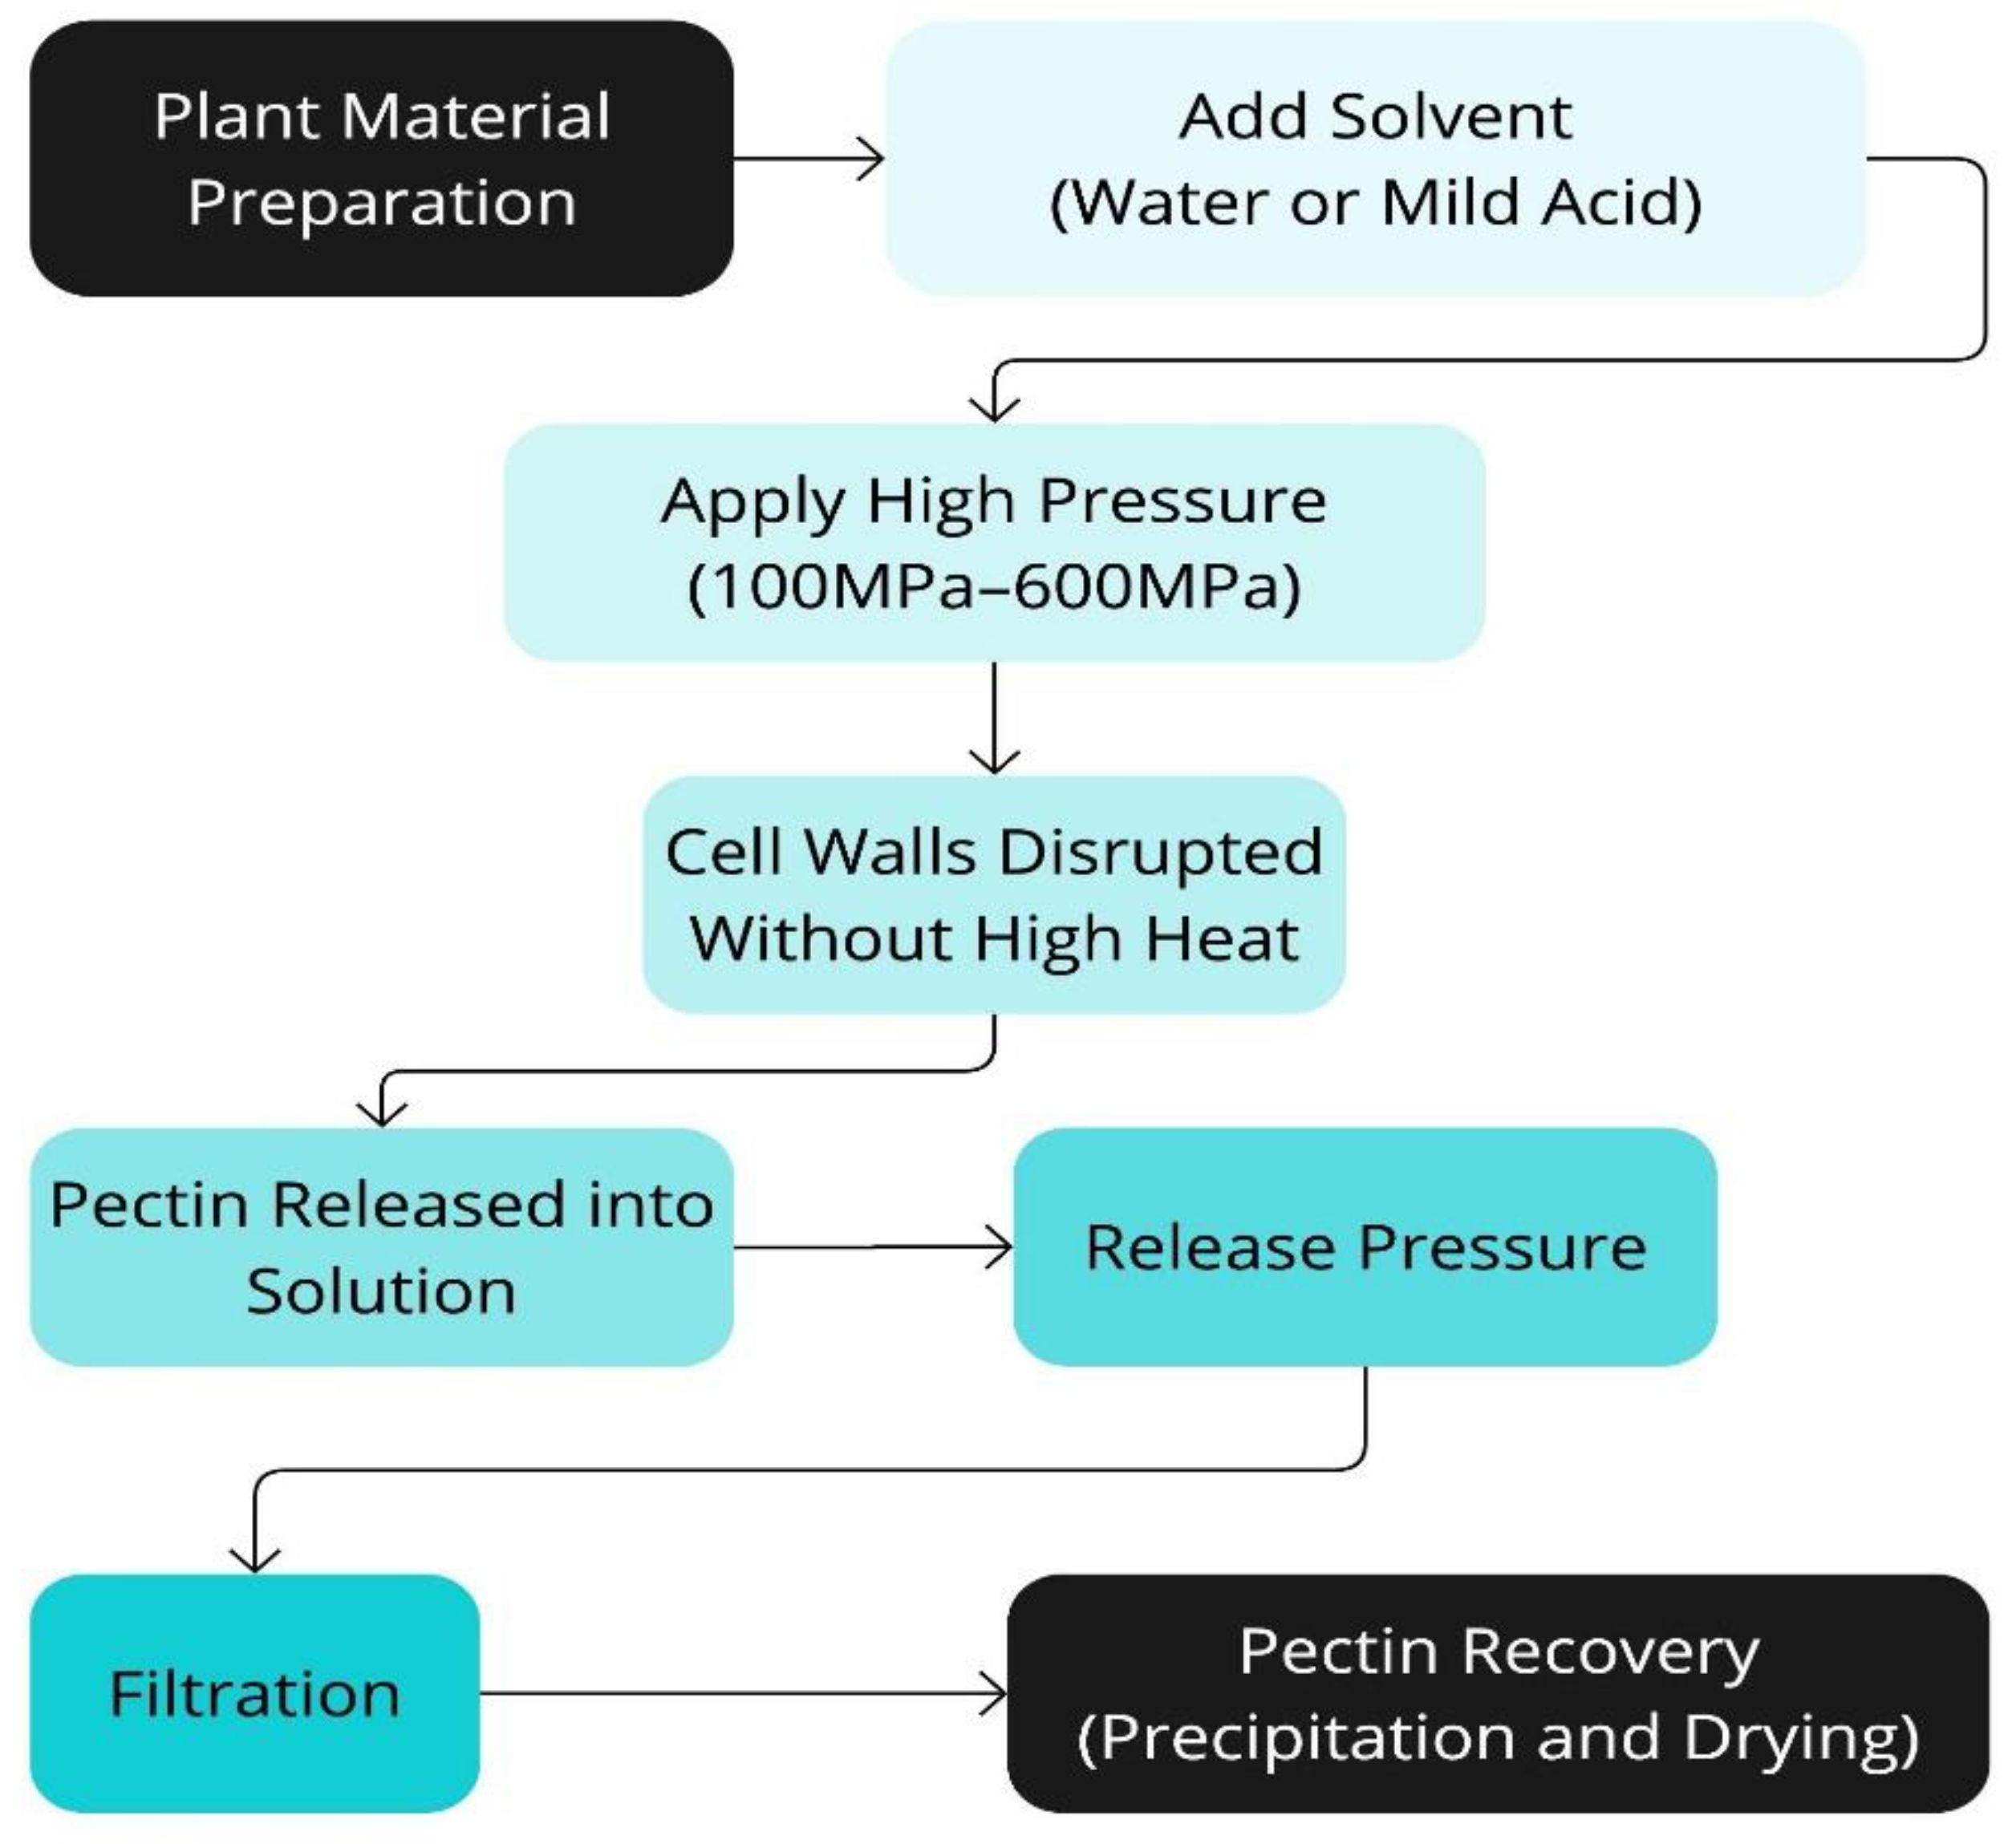
Figure 10.
Schematic representation of the Dielectric Barrier Discharge Extraction (DBDE) process.
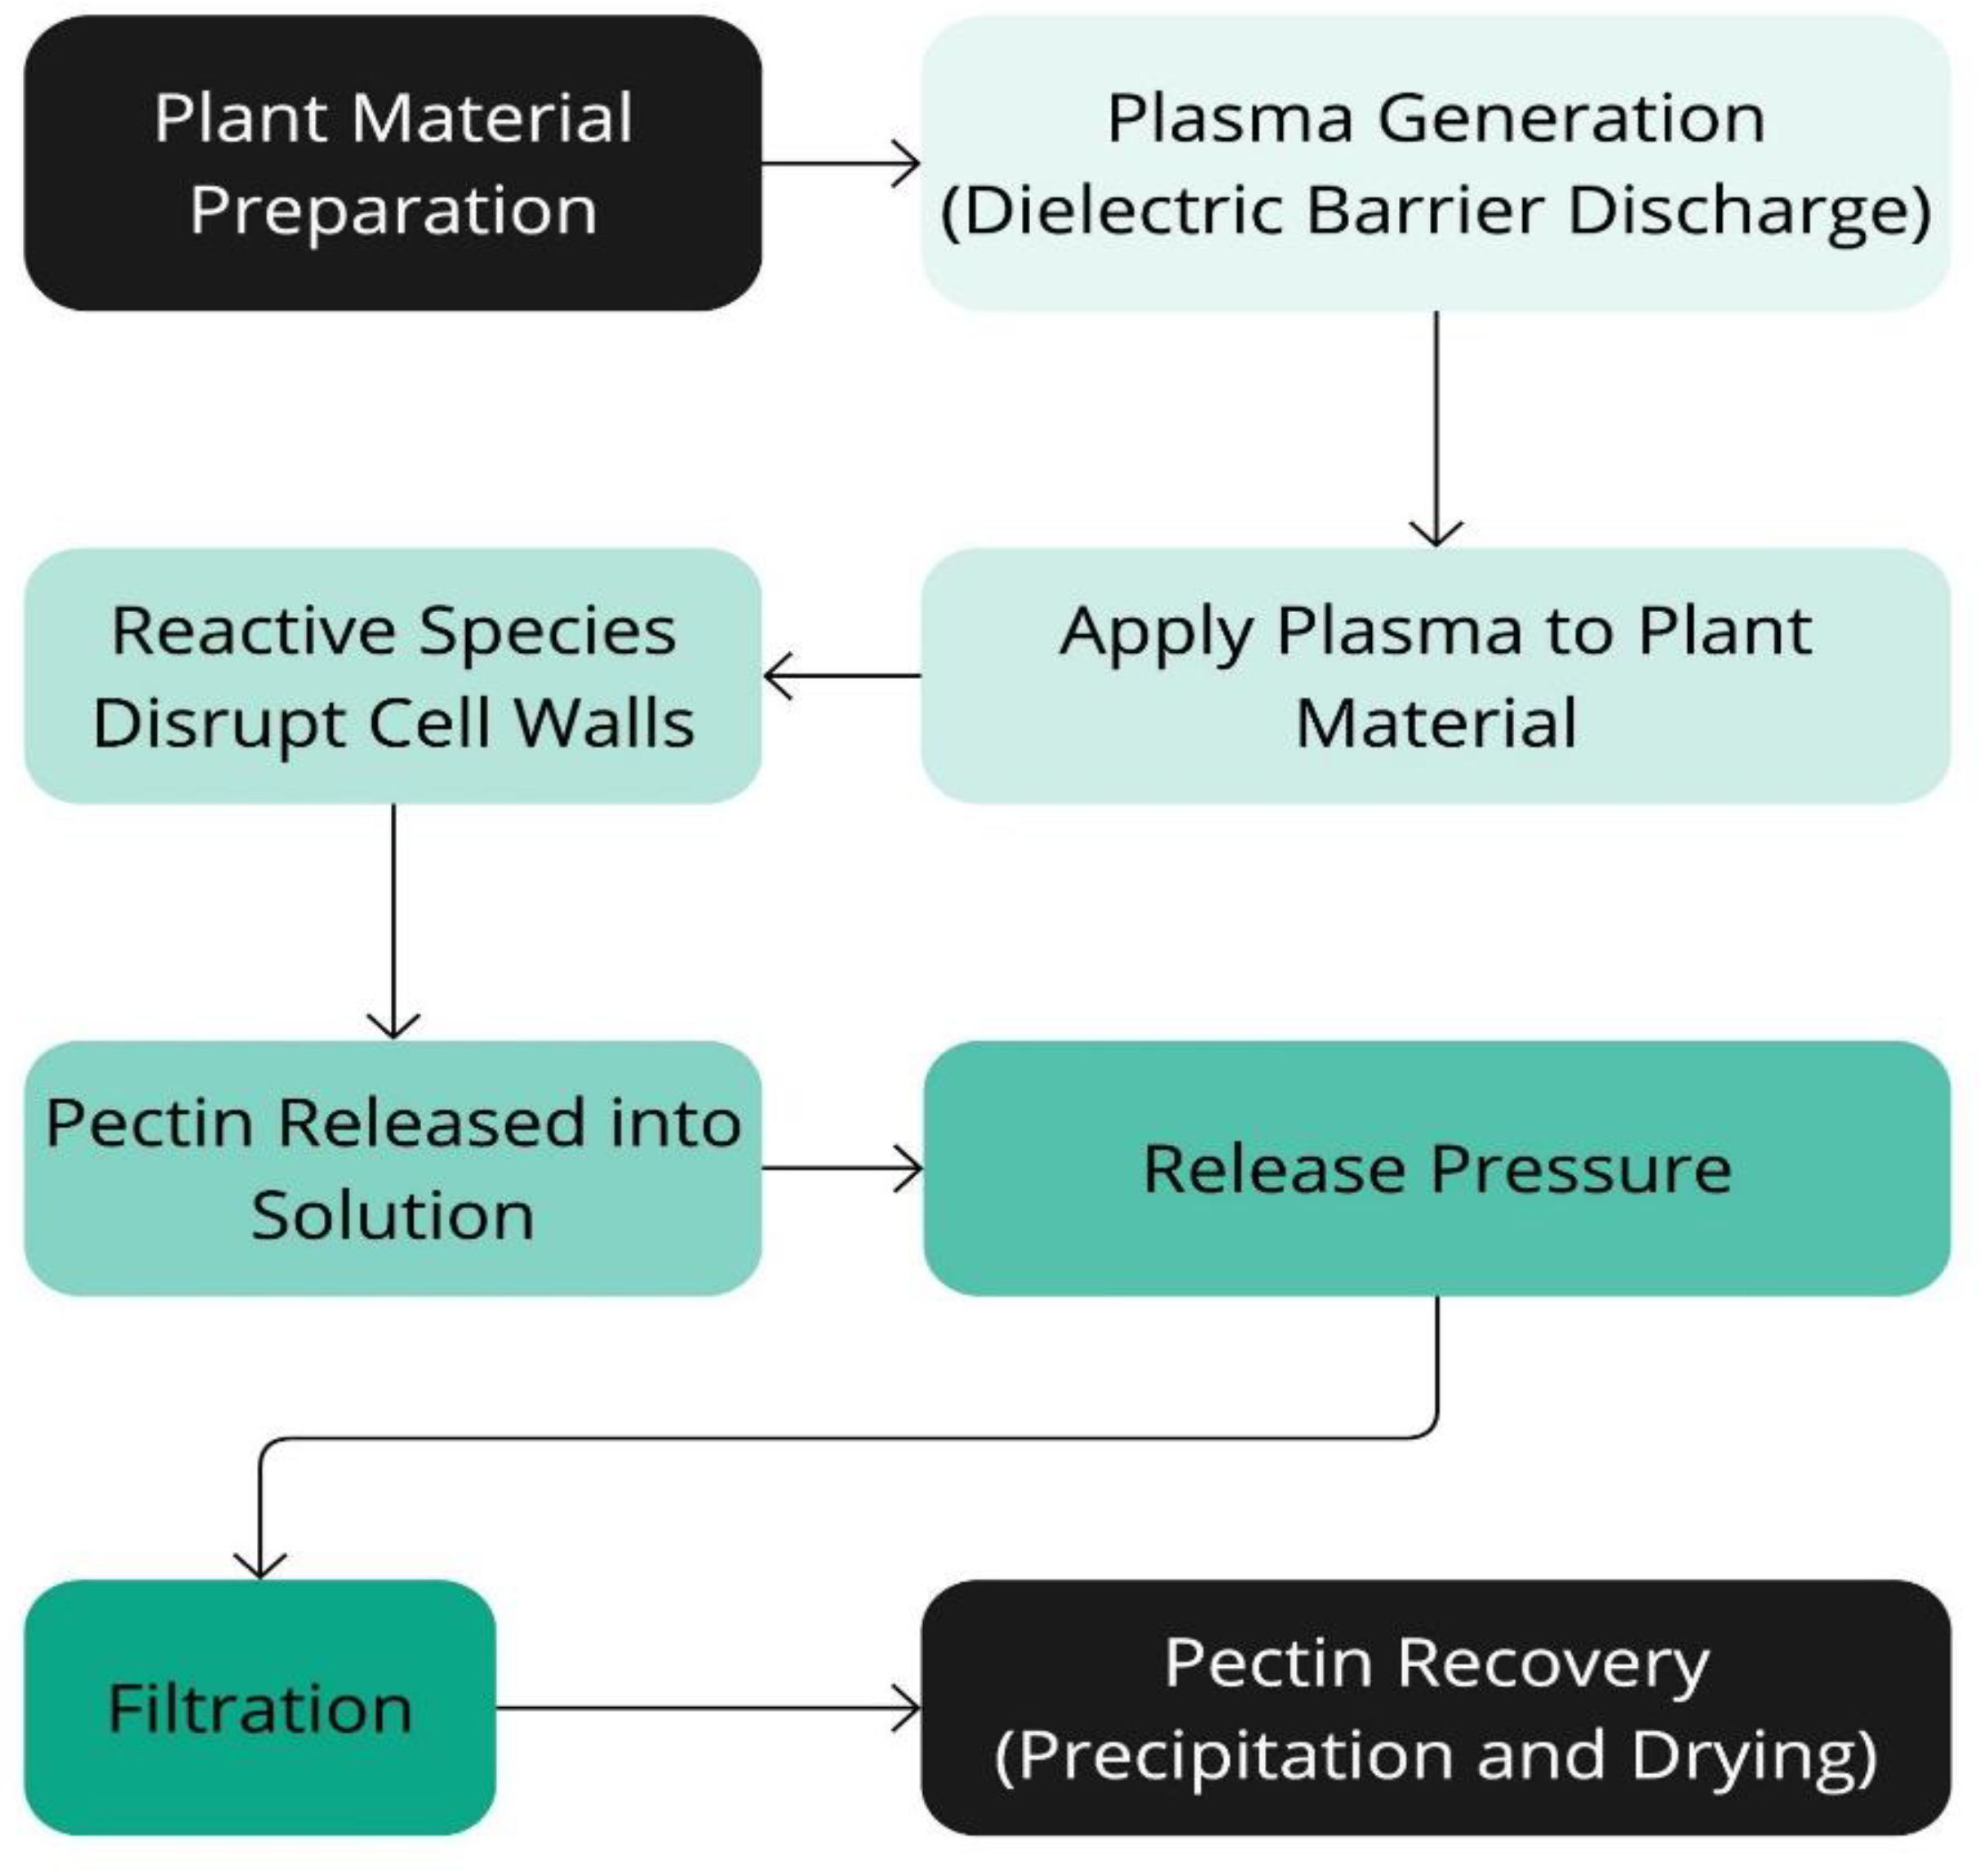

Table 1.
Details of methoxyl content (MeO) and Degree of esterification (DE) for pectin extracted from various sources using different methods.
Table 1.
Details of methoxyl content (MeO) and Degree of esterification (DE) for pectin extracted from various sources using different methods.
| Pectin Source | Extraction method | MeO (%) | DE (%) | Ref. |
|---|---|---|---|---|
| Pomelo peel | Hot acid extraction | 7.43 | 55.67 | [67] |
| Microwave-assisted extraction | 8.35 | 55.34 | ||
| Ultrasound-assisted extraction | 7.08 | 51.42 | ||
| Enzyme-assisted extraction | 6.62 | 47.71 | ||
| Apple pomace | Hot acid extraction | 8.13 | 63.80 | [69] |
| Extraction using citric acid | 9.69 | 63.42 | ||
| Organic acid mixture extraction | 10.85 | 64.55 | ||
| Microwave-assisted extraction | 9.30 | 64.80 | ||
| Ultrasound-assisted extraction | 8.79 | 64.18 | ||
| Citrus sinensis-Poncirus trifoliata | Hot acid extraction | 10.20 | 62.50 | [70] |
| Electromagnetic induction extraction | 09.9 | 61.00 | ||
| Orange Peel Waste | Extraction using HCl | - | 59.37 | [71] |
| Sea buckthorn peel | Extraction using citric acid | - | 57.75 | [72] |
| Fălticeni’ apple Pomace | Extraction using citric acid | 3.04 | 84.4 | [73] |
| Microwave-assisted extraction | 4.77 | 73.8 | ||
| Ultrasound extraction with and without heat treatment | 4.22 | 77 | ||
| Enzyme-assisted extraction-ultrasound treatment | 3.9 | 47.6 | ||
| Sweet lime | Hydrothermal extraction | 8.8 | 71.2 | [74] |
| Conventional solvent extraction | 6.8 | 61.1 | ||
| Lemon peels | Extraction using HCl | 9.3 | 82.7 | [75] |
| Feijoa (Acca sellowiana) fruit | Microwave-enzyme-assisted extraction | - | 68.43 | [76] |
| Enzyme-assisted extraction | - | 67.89 | ||
| Indonesian mangosteen | Acid extraction using H2SO4 | 2.86 | 75.98 | [77] |
| Citrus Reticulata peels | Microwave-assisted extraction | 09.30 | 78.95 | [78] |
| Citrus fruit wastes | Microwave-assisted extraction | 4.91 | 31.36 | [79] |
| Banana peel | Extraction using HCl | - | 27.63 | [80] |
| Extraction using citric acid | - | 50.27 | ||
| Maleic acid extraction | - | 44.88 | ||
| Pumpkin peels | Extraction using HNO3 | 6.20 | 66.53 | [81] |
| Extraction using citric acid | 7.23 | 66.57 | ||
| Eggplant Peels | Extraction using citric acid | 5.76 | 61.33 | [82] |
| Orange peel | Hot water extraction | 13.81 | 96.58 | [83] |
| Breadfruit’s peel | Acidic extraction using HCl | 15.78 | 96.70 | [84] |
| Papaya’s peel | 5.5 | 33.67 |
Table 2.
Details Degree of esterification (DE) and Degree of acylation (DA) for pectin extracted from various sources using different methods.
Table 2.
Details Degree of esterification (DE) and Degree of acylation (DA) for pectin extracted from various sources using different methods.
| Pectin Source | Extraction method | DE (%) | DA (%) | Ref. |
|---|---|---|---|---|
| Jack fruit | Extraction using citric acid | 75.82 | 0.478 | [88] |
| Jack fruit | Extraction using HNO3 | 74.82 | 0.418 | [88] |
| Potato pulp | Extraction using HCl | 11.92 | [86] | |
| Mosambi peels | Extraction using HCl | 51.81 | 0.51 | [87] |
| Sugar Beet Flakes | Extraction using citric acid | 21.90 | [85] | |
| Kinnow peels | Extraction using HCl | 51.86 | 0.47 | [87] |
| Sugar Beet Flakes | Microwave-assisted extraction | 21.90 | [85] | |
| Potato pulp | Extraction using H2SO4 | 10.51 | [86] | |
| Orange peels | Extraction using HCl | 53.55 | 0.48 | [87] |
| Jack fruit | Extraction using H2SO4 | 72.82 | 0.567 | [88] |
| Sugar Beet Flakes | Pulsed ultrasound-assisted extraction | 22.58 | [85] | |
| Chempedak | Extraction using citric acid | 69.01 | 0.060 | [88] |
| Potato pulp | Extraction using HNO3 | 10.51 | [86] | |
| Chempedak | Extraction using HNO3 | 69.1 | 0.328 | [88] |
| Potato pulp | Extraction using citric acid | 9.21 | [86] | |
| Potato pulp | Extraction using acetic acid | 15.38 | [86] | |
| Chempedak | Extraction using H2SO4 | 66.34 | 0.328 | [88] |
| Coffee Arabica pulp | Extraction using H2SO4 | 78.5 | 1.10 | [89] |
Table 3.
Polydispersity index for pectin extracted from various sources using different methods.
| Source | Extraction method | PDI | Ref. |
|---|---|---|---|
| Sweet lime | Hydrothermal extraction | 2.71 | [74] |
| Conventional solvent extraction | 3.42 | ||
| Fresh dragon fruit | Cold-Water Extraction | 4.81 | [95] |
| Hot-Water Extraction | 4.19 | ||
| Ultrasonic-Assisted Extraction | 4.22 | ||
| Enzyme-Assisted Extraction | 13.04 | ||
| Pulp in Pods of Riang | Extraction using citric acid | 4.31 | [96] |
| Apple | Hydrolysis-extraction | 8 | [97] |
| Sunflower | 5 | ||
| Rhubard | 2.3 | ||
| Pumpkin Peels | Microwave-Assisted Extraction | 2.67 | [98] |
Table 4.
Summary of the WHC and OHC of pectin extracted from different sources.
| Pectin Sources | WHC (water/g powder) | OHC (oil/g powder) | Ref. |
|---|---|---|---|
| Citrus reticulata | 8.27 | 0.10 | [78] |
| Pumpkin peels | 1.55 | 2.51 | [99] |
| Sunflower stalk pith | 40.2 | 40.4 | [100] |
| Tomato pomace | 3.57 | 2.65 | [101] |
| Eggplant | 6.02 | 6.02 | [102] |
| Walnut | 5.84 | 2.22 | [103] |
| By-product from olive oil production | 1.87 | 6.17 | [104] |
| Pistachio green hull | 4.11 | 2.02 | [105] |
| Opuntia ficus indica | 4.84 | 1.01 | [106] |
| Watermelon rind | 2 | 4 | [107] |
| Dragon fruit peel pectin | 4.08 | 2.18 | [108] |
| Watermelon peels | 3.65 | 1.12 | [109] |
| Pumpkin peels | 2.65 | 1.15 | |
| Pomelo peels | 4.57 | 1.49 | |
| Pomegranate peels | 2.43 | 1.17 | |
| Soy hull Passion fruit peel | 6.08 | - | [110] |
| Orange pomace | 7.57 | - | |
| Mango | 6.4 | 1.6 | [111] |
| Pineapple | 14.6 | 0.7 | |
| Royal Gala apple | 1.58 | 0.93 | [112] |
| Cocoa Husk | 11.05 | 11.58 | [113] |
| Red chilli peel | 4.19 | 2.02 | [114] |
| Crab apple peel | 8.1 | 8.5 | [115] |
Table 5.
Summary of the FTIR peaks of pectin.
| Wave number (cm-1) | Group |
|---|---|
| 3200-3500 | stretching of oxygen-hydrogen bond (–OH). |
| 2920 | C–H bond (including CH, CH2, and CH3) vibration. |
| 1730 | C=O stretching vibration of ester. |
| 1600-1400 | C=O stretching vibration of carboxylate ion. |
| 1200-1000 | C–O and C–C vibration bands of glycosidic bonds and pyranoid rings. |
| 1070 | –COC– stretching of the galacturonic acid. |
Table 6.
Summary of FTIR results of pectin obtained from different sources.
| Pectin Source | Extraction method | Results | Ref. |
|---|---|---|---|
| Apple pomace | Hot acid extraction | Results revealed that the pyranose was absent due to the extraction procedures. Ultrasound-assisted and Microwave-assisted extraction methods may partially disrupt the covalent bonds between pectin and non-pectic polysaccharides. | [69] |
| Extraction using citric acid | |||
| Microwave-assisted extraction | |||
| Organic acid mixture | |||
| Ultrasound-assisted extraction | |||
| Citrus sinensis-Poncirus trifoliata | Hot acid extraction | Analysis of spectra shows that the heating type does not significantly affect the extracted pectin's structural properties. | [70] |
| Electromagnetic induction | |||
| Orange peel waste | Extraction using HCl | Spectra of the extracted pectin exhibited consistent functional groups with the standard, although with varying intensities in some instances. | [71] |
| Sea buckthorn peel | Extraction using citric acid | The peak at 1,745 cm-1 was stronger than 1,635 cm-1, indicating that sea buckthorn contains high methoxy pectin. | [72] |
| Fălticeni’ apple Pomace | Extraction using citric acid | All pectin samples obtained by different extraction methods had a similar transmission pattern to those of commercial apple and citrus pectin samples. | [73] |
| Microwave-assisted extraction | |||
| Ultrasound extraction with and without heat treatment | |||
| Enzyme-assisted extraction-ultrasound treatment. | |||
| Sweet lime | Hydrothermal extraction | The obtained results were compared with conventionally extracted pectin and commercial citrus pectin. | [74] |
| Conventional solvent extraction | |||
| Lemon peels | Extraction using HCl | FTIR spectra of all samples were nearly identical. | [75] |
| Sugar beet flakes | Extraction using citric acid | In CE pectin, the peak at 1718 cm-1 was higher when compared with the spectra of MAE and PUAE pectin samples, indicating a higher degree of esterification of the CE sample. | [85] |
| Microwave-assisted extraction | |||
| Pulsed ultrasound-assisted extraction (PUAE) | |||
| Dragon fruit peel | Ultrasound-assisted extraction | Extracted pectin has functional groups similar to commercial-grade pectin and is rich in polygalacturonic acid. | [91] |
| Saveh Pomegranate Peels | Extraction using citric acid | There is no significant difference between extracted pectin and standard pectin. | [92] |
| Lemon Waste | Extraction using Citric acid | FTIR spectra were similar to the 55 – 70% degree of esterification of citrus pectin | [93] |
| Passion Fruit Rinds | Subcritical Water Extraction | The type of solvent used in the different extraction methods affects the degree of methyl esterification. | [117] |
| Pressurized Natural Deep Eutectic Solvents under different temperature | |||
| Pumpkin Peels | Microwave Assisted Extraction | The relative intensity of the ester band increased according to the DE of the pectin, while the intensity of the carboxylic stretching band decreased. | [118] |
Table 7.
Summary of XRD results of pectin obtained from different sources.
| Pectin Source | Extraction method | 2θ values | Ref. |
|---|---|---|---|
| Feijoa (Acca sellowiana) fruit | Conventional Heating (CHE) | Four characteristic peaks at 2θ = 13.14°, 21.05°, 43.41° and 50.39° were 11observed in pectin obtained by CHE method. CHE exhibited much broader and stronger diffraction peaks at 12° than MEAE and EAE samples. Besides, the peaks around about 2θ = 21.05°, 43.41°, and 50.39° in MEAE and EAE samples exhibited less sharp, and the peak at around 2θ = 13.14° was not detected. | [76] |
| Microwave-enzyme-assisted extraction (MEAE) | |||
| Enzyme-assisted extraction (EAE) | |||
| Citrus Reticulata peels | Microwave-assisted extraction | Kinnow pectin is less crystalline compared to commercial pectin. Peak values were observed at 2θ = 14.31°, 37.93° and 43.16° while for commercial citrus pectin at 21.33°and 22. 57°. | [78] |
| Coffee pulp pectin | Acid extraction using sulfuric acid. | Coffee pulp powder is more amorphous compared to the coffee pulp pectin. Coffee pulp pectin exhibited sharp peaks at 2θ = 15.72, 19.52, 20.90, 22.94, 25.02, 26.88, 28.44, 29.59, 31.59, 32.94, 35.88, 38.32, 44.5, 46.66, 48.2, and 51.44°. Coffee pulp pectin has a higher degree of crystallinity than coffee pulp powder. | [89] |
| Sweet lemon peel pectin | Microwave-assisted extraction | Peaks observed at 2θ =12.36°, 13.96◦, 14.91◦, 19.61◦, 18.91◦, 21.36◦, 32.46◦, and 36.66◦ | [124] |
| Orange peels | Extraction using HCl. | Peaks observed at 2θ =13.222°, 15.37°, 21.78°, 25.28°, 27.87° and has crystallinity value, 68.97%. | [125] |
| Watermelon rind | Extraction using acetic acid. | Shows a weak characteristic diffraction peak at 2θ = 12.1° 21.3°. | [126] |
| Orange waste | Extraction using H2SO4. | Pectin shows crystalline peaks in its diffractogram at 2θ = 9.5, 11.5, 20.8 28.9, 30.9, and 31.5°, which indicates that it is crystalline. | [127] |
| Apple pomace | Extraction using HCl. | Pectin extracted from the Royal (Malus pumila) apple was more crystalline than Golden (Spondias dulcis). | [128] |
| Taiwan’s Citrus depressa Hayata Peels | Ultrasonic method | Peaks were observed at 2θ = 16.06, 18.92, and 21.19° XRD pattern was similar to commercial pectin, only that commercial pectin showed intense peaks at 20.84, 25.59 and 30.3°. | [129] |
| Passion Fruit Peel | Acid Extraction (AE) | The crystal structures of pectin extracted by AE and SEA are similar but different from those of UA and USEA. The ultrasonic-assisted process changes the crystal structure of pectin. | [130] |
| Ultrasonic-Assisted Acid Extraction (UA) | |||
| Steam Explosion Pretreatment Combined with Acid Extraction (SEA) | |||
| Ultrasonic-assisted steam Explosion Pretreatment Combined with Acid Extraction (USEA) | |||
| Orange peel pectin | Alcohol precipitation method | Peaks observed at 2θ = 12°, 16°, 18°, 27° and 29° while by enzymatic method was 16°, 26°, 29°, and 30°. | [131] |
Table 8.
NMR information for the characterization of pectin.
| Instrumentation | Results | Ref. |
|---|---|---|
| Bruker Avance III (400 MHz) was used and applied with 400.15 MHz for 1H and 100.63 MHz for 13C, equipped with a mass probe of 7 mm H/S to collect spectral information. The NaCl powder was mixed with the sample of about 170 ±1 mg into the cylindrical zirconium dioxide rotors with an outer diameter of about 7 mm with silicon rubber tubing. |
|
[132] |
| The 13C high-resolution NMR manufactured by Bruker (Avance AV 400), applied at 400 MHz and equipped with a 4 mm outer diameter, included 62.5 kHz rf-field strength and 15 kHz as spin rate. The carbonyl peak at 176.05 ppm of glycine was a reference for all spectral data. The software MestReNova 6.1.1 was used for the analysis & interpretation. |
|
[133] |
| The Bruker (Germany) 400 Advance Ultra 9.4 T was controlled at 400 MHz with a broad band inverse probe at 303 K. D2O was used to prepare the pectin samples (0.5%, w/w) and reference as perdeuterated 3-(trimethylsilyl) propionate sodium salt. The acquisition time was 1.98 s with a pulse of 301 and a relaxation delay time of 8 s with scans of 128, including an 8278.15 Hz as sweep width. |
|
[134] |
Table 9.
Comparison considering different parameters: yield, color, moisture, protein content, galacturonic acid and methoxyl content.
Table 9.
Comparison considering different parameters: yield, color, moisture, protein content, galacturonic acid and methoxyl content.
| Extraction Method | Yield | Color | Moisture | Protein Content | Galacturonic Acid | Methylxyl Content |
|---|---|---|---|---|---|---|
| UAE | M-to-H | MR | H | V | V | M-to-H |
| PUAE | H | HR | L | H | H | H |
| REF | M | MR | H | V | V | V |
| MEF | H | MR | M | M | H | M |
| MAE | H | MR | H | H | M | H |
| SWE | M-to-H | MR | H | V | H | M |
| EAE | H | MR | H | H | M | H |
Table 10.
The comparison considers different parameters: degree of esterification, polydispersity index, equivalent weight, molecular weight, acetyl value, oil holding capacity, and water holding capacity.
Table 10.
The comparison considers different parameters: degree of esterification, polydispersity index, equivalent weight, molecular weight, acetyl value, oil holding capacity, and water holding capacity.
| Extraction Method | Degree of Esterification | Polydispersity Index | Equivalent Weight | Molecular Weight | Acetyl Value | Oil Holding Capacity | Water Holding Capacity |
|---|---|---|---|---|---|---|---|
| UAE | M | L-to-M | V | V | V | M | H |
| PUAE | M | L | V | H | V | H | H |
| REF | H | H | H | H | H | M | M |
| MEF | M | L-to-M | H | V | V | M-to-H | M |
| MAE | M | L | V | L | V | H | H |
| SWE | V | L | V | V | L | M | H |
| EAE | H | L | V | H | H | H | VH |
Table 11.
Non-conventional techniques are used for the extraction of pectin from different food sources.
Table 11.
Non-conventional techniques are used for the extraction of pectin from different food sources.
| Technique | Pectin source | Yield (%) | GalA (%) | Ref. |
|---|---|---|---|---|
| OHAE | Pomegranate | 8.1 | 83 | [166] |
| UAME | Potato | 23 | 42 | [170] |
| Tomato | 34 | 69 | [171] | |
| Watermelon | 19 | 68 | [172] | |
| UAOHE | Grape | 27 | [176] | |
| HT | Sugar beet pulp | 13.6 | [177] | |
| lime peels | 23.8 | 70.6 | [74] | |
| DBDE | Watermelon rinds | 18.5 | 80 | [182] |
Table 12.
Comparison between different non-conventional extraction techniques in terms of advantages and disadvantages.
Table 12.
Comparison between different non-conventional extraction techniques in terms of advantages and disadvantages.
| Techniques | Advantages | Disadvantages |
|---|---|---|
| UAE |
|
|
| PUAE |
|
|
| PEF |
|
|
| MEF |
|
|
| MAE |
|
|
| SWE |
|
|
| OHAE |
|
|
| UAME |
|
|
| UAOHE |
|
|
| HT |
|
|
| HPPE |
|
|
| DBDE |
|
|
Table 13.
Applications of various non-conventional extraction techniques.
| Industry Type | Applications |
|---|---|
| Food Industry |
|
| Pharmaceuticals |
|
| Cosmetics and Personal Care |
|
| Environmental Applications |
|
| Nutraceuticals |
|
| Biofuels |
|
Disclaimer/Publisher’s Note: The statements, opinions and data contained in all publications are solely those of the individual author(s) and contributor(s) and not of MDPI and/or the editor(s). MDPI and/or the editor(s) disclaim responsibility for any injury to people or property resulting from any ideas, methods, instructions or products referred to in the content. |
© 2025 by the authors. Licensee MDPI, Basel, Switzerland. This article is an open access article distributed under the terms and conditions of the Creative Commons Attribution (CC BY) license (http://creativecommons.org/licenses/by/4.0/).
Copyright: This open access article is published under a Creative Commons CC BY 4.0 license, which permit the free download, distribution, and reuse, provided that the author and preprint are cited in any reuse.


