
Submitted:
10 February 2025
Posted:
11 February 2025
You are already at the latest version
Abstract
The steady thermal model for conformal coating white LEDs is successfully developed to determine the temperature value in the package volume. The Matlab software (version 2017) and finite element method are utilized to solve the heat equation and visualize the temperature distribution, respectively. The thermal model is applied to study the temperature behavior of white LEDs under different injection currents of 50 mA, 150 mA, 250 mA, and 350 mA. The temperature value of each location is determined correspondingly by the temperature interpolation and comparing the color between color bar and color of the pcW-LEDs package structure. Beside, the effect of mesh size on the temperature simulation on the simulation result is also investigated. The result shows that the smaller mesh size provides higher resolution of temperature. The obtained result is meaningful for white LEDs thermal management to reduce the negative effect of heat during the operation process.
Keywords:
steady thermal model
; conformal coating white LEDs
; temperature interpolation
; LED thermal management
1. Introduction
Solid state lighting has an important role in our modern life [1,2]. Lighting fixtures using light emitting diodes have shown many advantages such as energy saving, quick response after being driven, high color rendering index, longtime operation, less thermal radiation emission, less heat generation, mercury free, and compact size [3,4,5]. An efficient and popular method for generating white light is covering a conversion wavelength fluorescent material on the top of a blue LED die. The white LEDs can be packaged using some package structure such as phosphor dome type, phosphor remote type, and phosphor conformal type [6,7,8].
In comparison to phosphor dome type and phosphor remote type, the packaging configuration of conformal type is prefered due to its advantages such as compact size and high luminous efficiency. Figure 1 shows the 3D view of conformal packaging structure of pcW-LEDs. A blue LED die is mounted on a sub-mount substrate by die bonding techniques. The gold alloy is used to connect the electrode on the blue LED’s top electrical circuit and electrical circuit on the sub-mount substrate through a wire bonding process. The yellow is dispensed on the top side of the blue LED die. Finally, the structure is covered by a polymer material (silicone gel or epoxy gel) for protection and to increase the light extraction purpose.
When pcW-LEDs are operated by forward bias. Blue die emits blue light toward through the yellow phosphor layer. The yellow phosphor is excited by blue light and then emits the yellow light through the processes of absorption and long wavelength conversion. Due to the high transparent encapsulant polymer lens, the mixture of yellow light and unabsorbed blue light transmitted through it easily. Under perception of human eyes through a photochemical reaction, human eyes have a white light perception feeling.
Due to some inherent limitation in efficiency quantum efficiency, Stoke loss, optical loss so the heat always occurs during the operation process of pcW-LEDs [9,10]. In adition , the thin layer of yellow phosphor compared to encapsulant thickness leads to a heat accumulated at the blue and yellow phosphor region. The low thermal conductivity of polymer encapsulant lenses causes the heat accumulated to be more serious [11].
The negative effects of generated heat including modification to optical properties of output light, cause the photo biological safety due to blue light leakage, damage, thermal stress, and shortened lifespan [11,12,13]. The reduction of the negative effect of heat on pcW-LEDs is a required and urgent demand.
The topic of thermal management for pcW-LEDs is alway a hot topic and it has attracted much work from related expertises. Related to the topics of thermal behavior of pcW-LEDs, many solutions have been proposed and reported [12,13,14,15,16,17,18,19,20]. Different software has been used to model the thermal state of LEDs such as CFD software, COMSOL, and ANSYS [14,15,16,17]. The heat transfer model which utilized the software simulation to predict the temperature characteristics in packaging configuration is an helpful metho in understanding the relation of forwarded electrical current on thermal behavior of white LEDs. Also, it is an easy way to control the thermal decay of output white light emission. However, the factors that are affect to simulation result should be taken care.
In this study, we have built a thermal model to determine the temperature behavior of the conformal package under different electrical injection currents. Matlab software is applied to solve the heat diffusion equations. The finite element method is applied to identify the internal temperature distribution inside the conformal package structure. The spatial temperature distribution is defined by temperature interpolation. Besides, the factors of element size are investigated to understand its effect on the simulation result.
2. Thermal Model Description
In terms of mathematical description, the thermal model for heat phenomena is based on the heat diffusion equation established by the theory of heat transfer [19,20]. The thermal model for LED is related to heat transfer modes including conduction, convection and radiation. The governed equation for the thermal model is heat diffusion equation. Solving the heat diffusion equation, the temperature values are defined [21,22]. In practice, the heat diffusion equation is solved using the boundary condition. Simulation software is an efficient tool to solve the heat equation. The finite element method is applied to visualize the temperature distribution inside the structure where the heat phenomena is happening. In this study, the steady-state thermal model was established using MATLAB software to program and apply. Different parameters in the LED thermal model are set and simulated to determine the temperature distribution [19,20,21,22]. Thermal model is verified by comparing the similarity between simulation and experiment. In the thermal model, the temperature within the white LED structure is interpolated efficiency.
A brief summary of thermal models for pcW-LED conformal structure includes the following main steps. Firstly, the type of thermal model in the simulation is defined as a steady state. Secondly, the geometry of the pcW-LEDs conformal structure is programmed and visualized. In the third step, the finite element is applied so that the geometry of the conformal structure is meshed with a suitable finite element. In the fourth step, the boundary conditions (e.g. temperature) is set for each part of the pcW-LEDs geometry. In the fifth step, the thermal parameters for materials of each part of the pcW-LEDs geometry are set in the code line. In the sixth step, the codes are run to obtain the temperature distribution result. In the final step, the verification of the thermal model is done by comparison of simulation results with experimental measurements. The high similarity between the simulation results with experimental measurements indicate the trustable level of the established thermal model.
3. Simulation Result
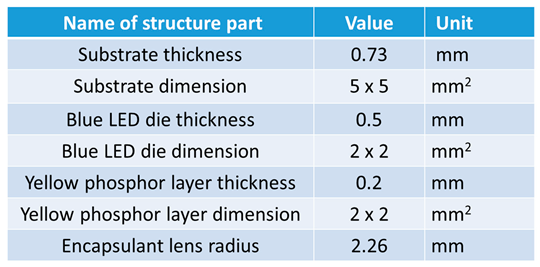
In this section, the result of mained steps that are referred above are presented. The steady state thermal model is built and run to obtain the results. Figure 2 shows the section view of geometry of the pcW-LEDs conformal structure. In the simulation of the steady state thermal model, the cross section of the LED is programmed and visualized. Table 1 shows the parameters of each geometry block setting in simulation.Each edges are labeled with a specific symbol. (e.g. the symbol E1 means edges no.1). The geometry includes the main block of Substrate, Encapsulant lens, Blue LED die, and Yellow phosphor regions. Each block of geometry is defined by several edges. Block of substrate: the rectangles constructed by E1, E2, E4, E10, E11, E12, E13, E14, E15, and E16. Block of encapsulant lens : the regions constructed by E14, E4, E15, E19, and E20. Block of Blue LED die: the rectangles constructed by E4, E5, E7, and E9. Block of yellow phosphor regions: the rectangles constructed by E3, E6, E8, and E9.
Table 1. Setting geometry parameters in simulation.
After finishing the geometry building, each block is meshed with many small elements which are related to the finite element method. The finite element is applied so that the geometry of the conformal structure is meshed with a suitable finite element as shown in Figure 3. The geometry type of element is triangle. Their maximum size is set as 0.2 mm in the simulation code.
In a steady state thermal model, solving the heat diffusion equation needs boundary conditions. Thus setting the boundary conditions for temperature is set for each part of the pcW-LEDs geometry. Besides, since each geometry block is a different material so their thermal properties are not the same. It requires setting the thermal parameters for materials of each part of the pcW-LEDs geometry in the simulation code line. In detail, the boundary conditions for temperature are shown in Table 2. The thermal parameters for materials of each part of the pcW-LEDs geometry is shown in Table 3.
Table 2. The boundary conditions for temperature is shown in simulation.
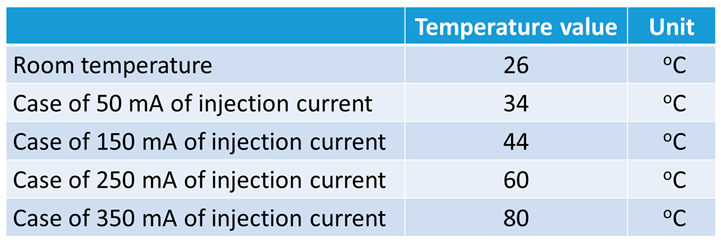
Table 3. The thermal parameters for materials of each part of the pcW-LEDs geometry is shown in simulation.
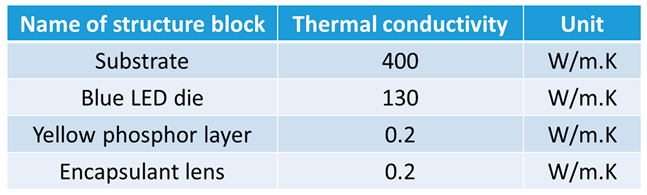
Figure 4 shows the temperature distribution of pcW-LED structure at the initial conditions (e.g. room temperature conditions) when pcW-LED is still not operated. The temperature is uniform for different locations of the structure. There is no heat source in the structure.
Figure 5 shows the simulation result of the temperature distribution vs. Injection current of 50 mA, 150 mA, 250 mA, and 350 mA. At a low injection current of 50 mA, the temperature distribution is relatively more uniform compared to that of the cases of 150 mA,250 mA, and 350 mA. The non-uniformity of temperature distribution for cases of higher injection currents show the higher temperature value in the region close to Blue LED dies and conformal yellow phosphor layer. The temperature distribution also indicates that the heat transfer is from the LED die to the outer surface which is the interface between the encapsulant and air ambient. Temperature distribution showed that the temperature at the farthest region from the Led die is lowest. This result of temperature behaviors is related to the low thermal conductivity of encapsulant material . The heat is accumulated in the region of LED die and conformal phosphor regions. There is a big difference in temperature distribution at the substrate, LED die-covered conformal yellow phosphor is always higher than that of the encapsulant lens region. This big difference is due to the thermal conductivity of the substrate being larger than that of the encapsulant lens region. Thus, the heat is move to this direction is easier than the direction which have lower thermal conductivity.
To further determine the value of temperature in each location in the package volume, the temperature interpolation is applied in simulation. Figure 6 shows the interpolation results of temperature distribution vs. injection current of 50 mA, 150 mA, 250 mA, and (d) 350 mA. In each case, the region that has the same temperature is confined to the region having the same color. Compare the color between color bar and color in the pcW-LEDs package structure, the value of each location is determined correspondingly.
4. Effect of Mesh Size on the Obtained Simulation Result
In simulation, the selection of mesh size is important. if the size is too big, the number of finite elements will be small, the temperature does not reflect exactly the temperature behavior at that location in the package structure. If the size is too small, the number of finite elements will be big, the temperature simulation result at that location in the package structure is more exact. However, time consuming simulation running may be significant. To understand, the effect of mesh size on the obtained temperature simulation result. Geometry blocks with different sizes are investigated . Figure 7 shows the simulation result of the geometry block is meshed with different maximum size of 0.05 mm, 0.2 mm, 0.3 mm and 0.4 mm. As shown in Figure 7, the smaller triangular mesh is, the more dense the finite element is.
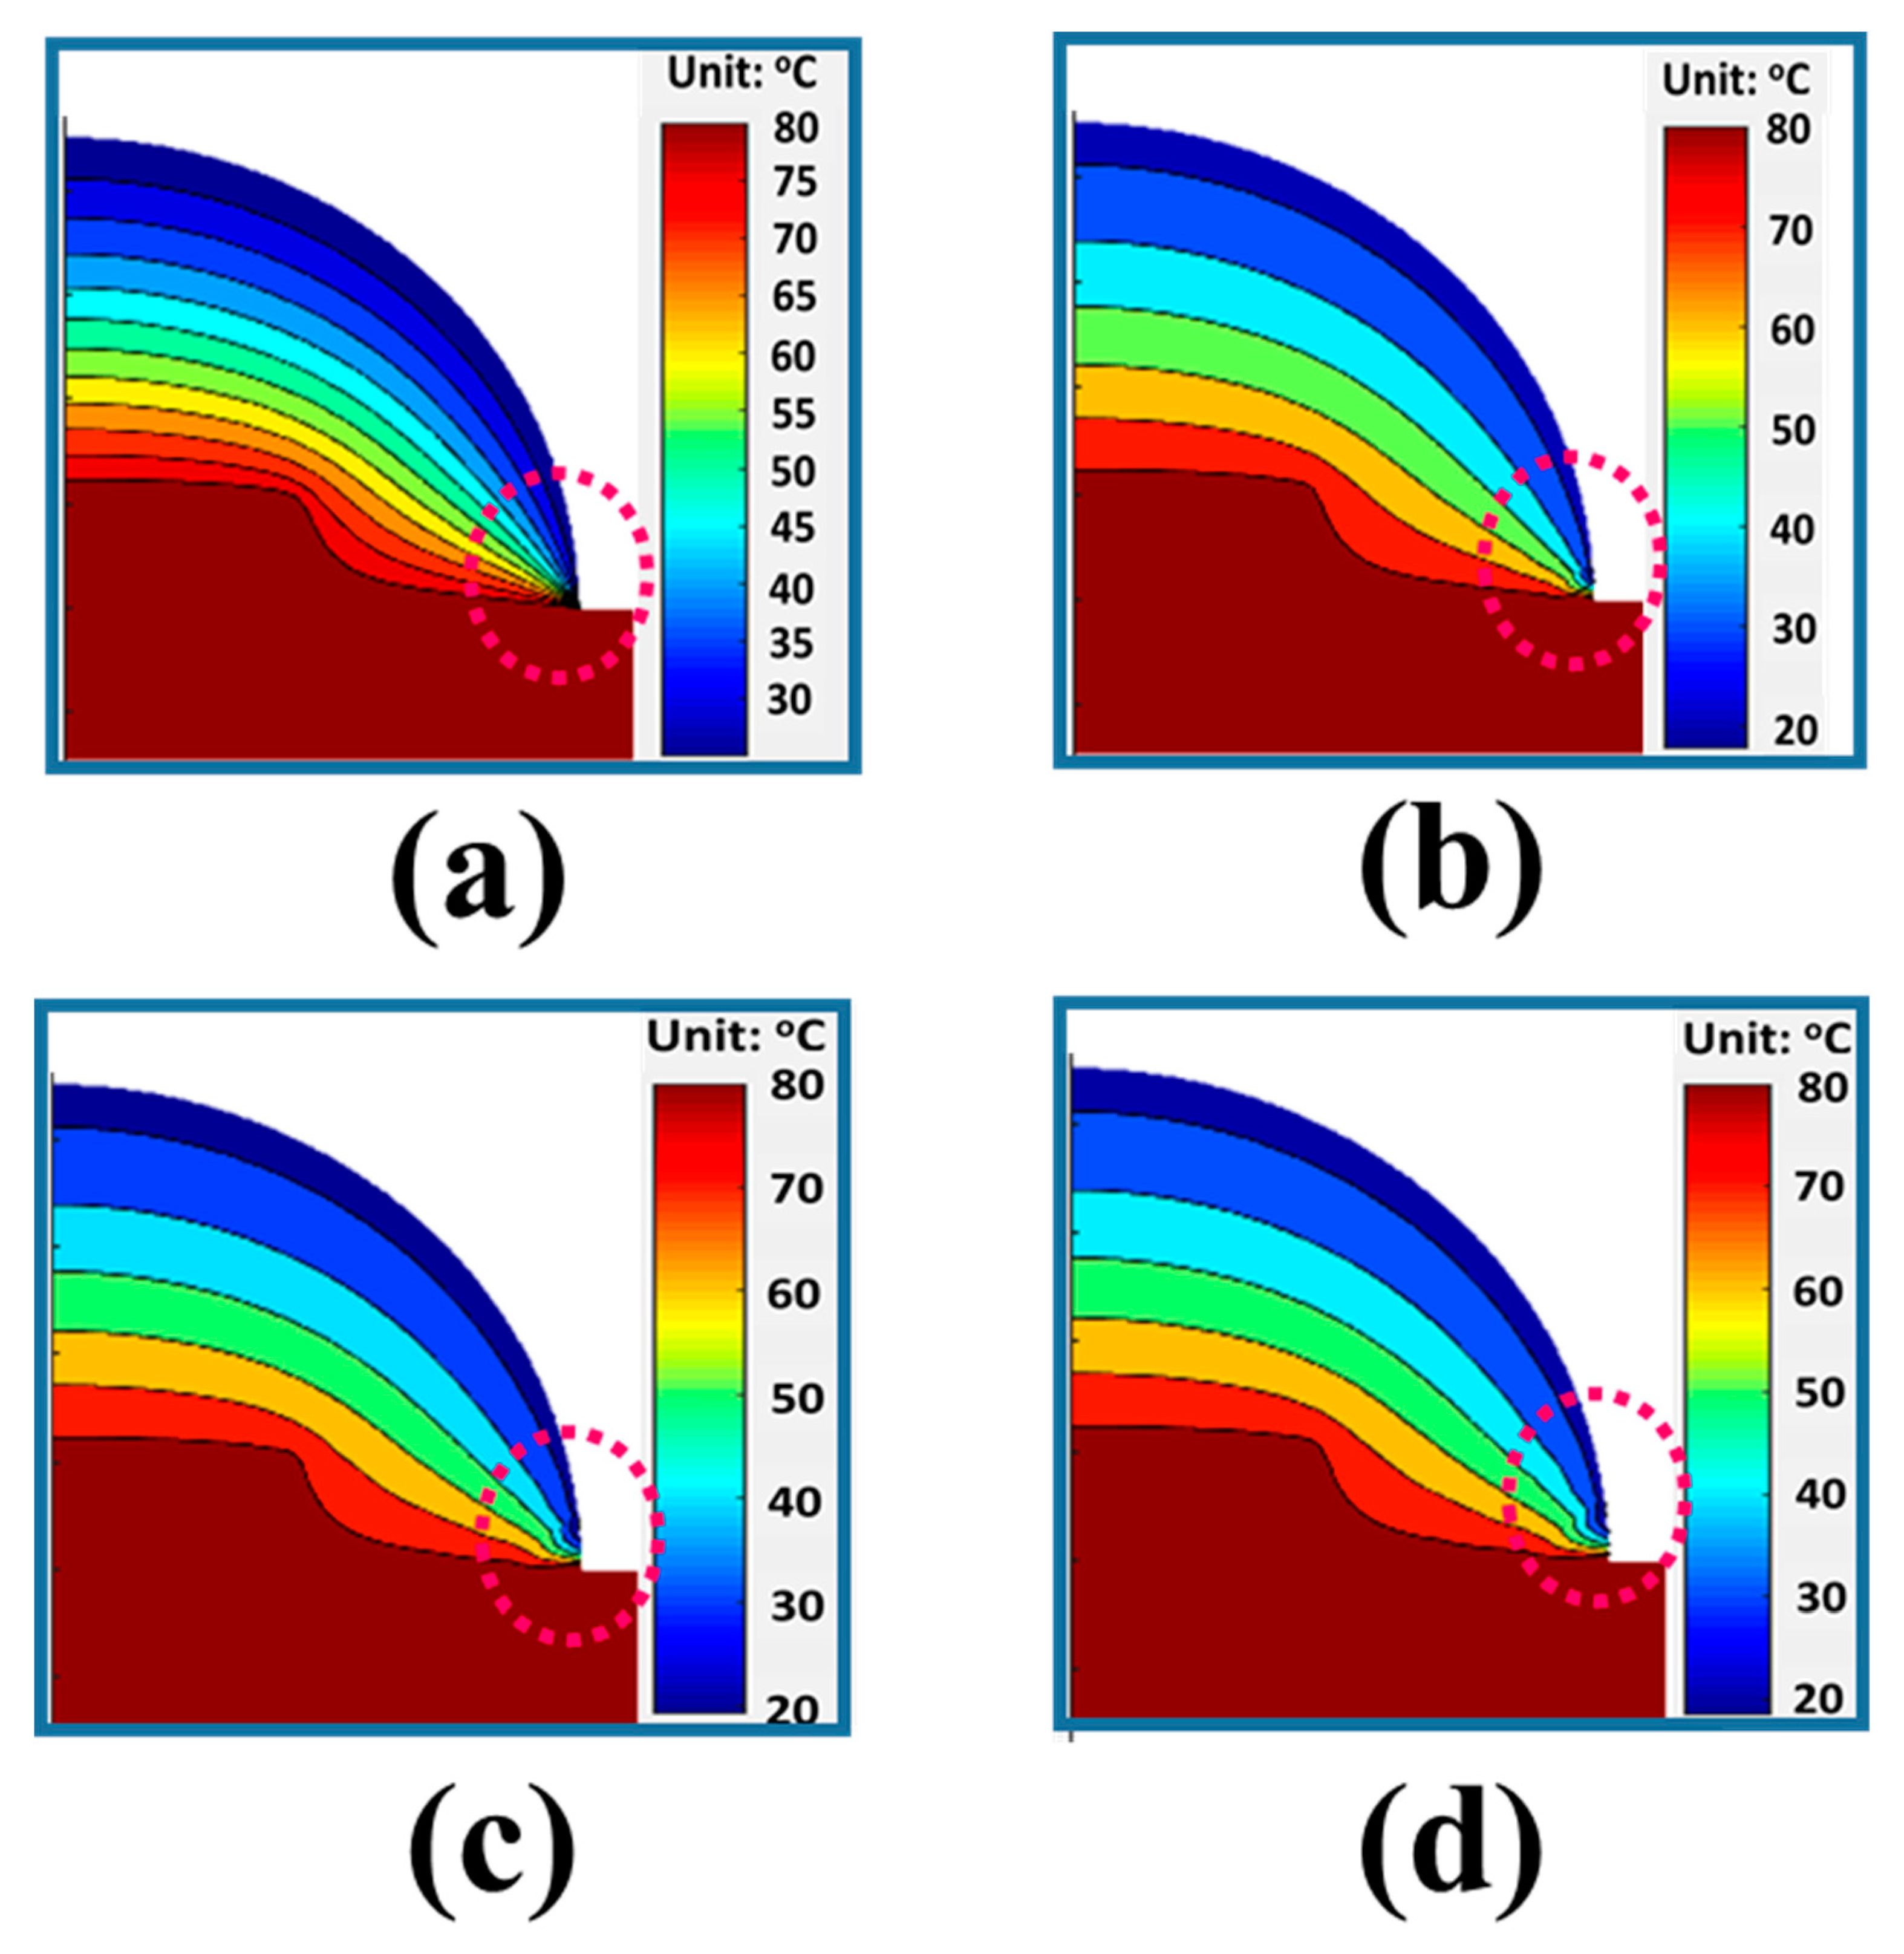
Figure 8 shows the effect of mesh size on the obtained result. All settings in the simulation are done for the same injection current of 350 mA, the difference is related to the size of the mesh size. The obtained result shows a difference between the case of maximum mesh size of 0.05 mm and cases of maximum mesh size of 0.2 mm, 0.3 mm and 0.4 mm. In detail, the result indicates that the smaller mesh size provides higher resolution of temperature as shown in Figure 8(a). The results as shown in Figs 8 (b) –(d) indicate that the larger mesh size is not only giving poorer resolution but also causes strange signals which are marked as the red dashed line circle.
5. Conclusions
The steady thermal model for conformal coating pcW-LEDs is succesful developed. The finite element method is applied to determine the temperature value in the package volume. The heat equation is solved by using the Matlab software (version 2017).
The thermal model is applied to study the temperature behavior of pcW-LEDs under different injection current of 50 mA, 150 mA, 250 mA, and 350 mA. Cases of higher injection currents show a non-uniformity of temperature distribution. The higher temperature value in the region close to Blue LED dies and conformal yellow phosphor layer. Temperature distribution showed that the temperature at the farthest region from the Led die is lowest. This result of temperature behaviors is related to the low thermal conductivity of encapsulant material that cause the heat accumulation in the region of LED die and conformal phosphor regions.
The temperature distribution also indicates that the heat transfer is from the LED die to the outer surface is weaker than the direction from the LED die to the substrate.
The temperature interpolation is applied to deduce the value of temperature by Comparing the color between color bar and color in the pcW-LEDs package structure, the value of each location is determined correspondingly. Result show that the region that has the same temperature is confined to the region having the same color.
The effect of mesh size on the temperature simulation result show that the smaller mesh size provides higher resolution of temperature. In addition, the larger mesh size is not only giving poorer resolution but also causes strange signals.
References
- Schubert, E.-F.; Kim, J.- K. Solid-state light sources getting smart. Science 2005, 308, 1274–1278. [Google Scholar] [CrossRef] [PubMed]
- Thi-Minh-Ly Vo, Trong-Nam Tran, Trung-Kien Nguyen, Thi-Hanh Nguyen, Thi-Yen-Nhi Pham, Thien-Bao Huynh, Le-Minh-Khang Tran Dang-Khoa Pham, Quoc-Cuong Nguyen, Quang-Khoi Nguyen, "Development of an efficient optical model for leds-based white light spectrum design applications", Journal of Innovations in Business and Industry, Vol. 02, No. 03, 185-192 (2024).
- Narendran, N.; Gu, Y. Life of LED-Based White Light Sources. J. Display Technol. 2005, 1, 167–171. [Google Scholar] [CrossRef]
- Schubert, E. (2006). Light-Emitting Diodes (2nd ed.). Cambridge: Cambridge University Press. [CrossRef]
- Chang, M.-H.; Das, D.; Varde, P.; Pecht, M. Light emitting diodes reliability review. Microelectron. Reliab. 2012, 52, 762–782. [Google Scholar] [CrossRef]
- Efremov, A.-A.; Bochkareva, N.-I.; Gorbunov, R.-I.; Lavrinovich, D.-A.; Rebane, Y.-T.; Tarkhin, D.-V.; Shreter, Y.-G. Effect of the joule heating on the quantum efficiency and choice of thermal conditions for high-power blue InGaN/GaN LEDs. Semiconductors 2006, 40, 605–610. [Google Scholar] [CrossRef]
- Narendran, N.; Gu. Y. Life of LED-Based White Light Sources. J. Disp. Technol 2005, 1, 167–171. [Google Scholar] [CrossRef]
- Lin, Y.-C; Bettinelli, M.; Sharma, S.-K.; Redlich, B.; Speghini, A.; Karlsson, M. Unraveling the impact of different thermal quenching routes on the luminescence efficiency of the Y3Al5O12:Ce3+ phosphor for white light emitting diodes. J. Mater. Chem. C 2020, 8, 14015. [Google Scholar] [CrossRef]
- Narendran, N.; Gu, Y.; Jayasinghe, L.; Freyssinier, J.-P. Zhu,Y. Long-term performance of white LEDs and systems. Proceeding of First International Conference on White LEDs and Solid-State lighting, 2007, 174-179. Tokyo, Japan, November 26-30.
- Singh, P.; Tan, C.-M. Degradation Physics of High-Power LEDs in Outdoor Environment and the Role of Phosphor in the degradation process. Sci. Rep. 2016, 6, 24052. [Google Scholar] [CrossRef]
- Chi-Cuong Tran, and Quang-Khoi Nguyen. "An Efficient Method to Determine the Thermal Behavior of Composite Material with Loading High Thermal Conductivity Fillers" Journal of Composites Science 6, no. 7: 214. 2022.
- Quang-Khoi Nguyen, Benoit Glorieux, Gilles Sebe, Tsung-Hsun Yang, Yeh-Wei Yu & Ching-Cherng Sun."Passive anti-leakage of blue light for phosphor-converted white LEDs with crystal nanocellulose materials", Scientific Reports volume 13, Article number: 13039 (2023).
- Ching-Cherng Sun, Quang-Khoi Nguyen, Tsung-Xian Lee, Shih-Kang Lin, Chi-Shou Wu, Tsung-Hsun Yang, and Yeh-Wei Yu. Active thermal-fuse for stopping blue light leakage of white light-emitting diodes driven by constant current. Scientific Reports 12, 12433 (2022).
- Krzysztof Baran, Marcin Leśko, Henryk Wachta, and Antoni Różowicz. Thermal Modeling and Simulation of High Power LED Module. AIP Conference Proceedings. 2019, 2078, 020048. [CrossRef]
- Han-Kuei Fu, Chien-Ping Wang, Hsin-Chien Chiang, Tzung-Te Chen, Chiu-Ling Chen, Pei-Ting Chou. Evaluation of temperature distribution of LED module. Microelectron. Reliab. 2013, 53, 554–559. [Google Scholar] [CrossRef]
- Chen Maoxing, Xu Chen, Xu Kun, and Zheng Lei. Thermal simulation and analysis of flat surface flip-chip high power light-emitting diodes. J. Semicond. 2013, 34, No. 12. [Google Scholar]
- Q.-K. Nguyen, T.-P.-L. Q.-K. Nguyen, T.-P.-L. Nguyen, V.-T. Huynh, N.-T. Phan, and H.-T.-A. Nguyen, “An efficient decay model for studying the luminous flux behavior of phosphor-converted white light-emitting diodes”, Photonics Lett. Pol., vol. 15, no. 4, pp. 72–74, Dec. 2023.
- Quang-Khoi Nguyen, “An Optimized method of thermoelectric cooler-based thermal management for improving the luminous efficacy of light-emitting diodes ”, Photonics Lett. Pol.., vol. 16, no. 1, pp. 10–12, Apr. 2024.
- Quang-Khoi Nguyen, and Thi-Hanh-Thu Vu. "An Efficient Method for Simulating the Temperature Distribution in Regions Containing YAG:Ce3+ Luminescence Composites of White LED" Journal of Composites Science 7, no. 7: 301. 2023. [CrossRef]
- Trong-Nam Tran, Van-Tuan Huynh, Thi-Hanh-Thu Vu, Nguyet-Thuan Phan, Huynh-Tuan-Anh Nguyen, Quang-Khoi Nguyen, "Study of steady state thermal model for white light LEDs thermal management application at encapsulant level ". Photonics Lett. Pol., vol. 16, no. 1, pp. 13–15, Apr, 2024.
- Partial Differential Equation Toolbox for use with MATLAB. The MathWorks, Inc. 1995.
- Heat Transfer. Mathwork.com. https://www.mathworks.com/help/pde/heat-transfer-and-diffusion-equations.htmls_tid=CRUX_lftnav.
Figure 1.
The 3D view of conformal packaging structure of pcW-LEDs.
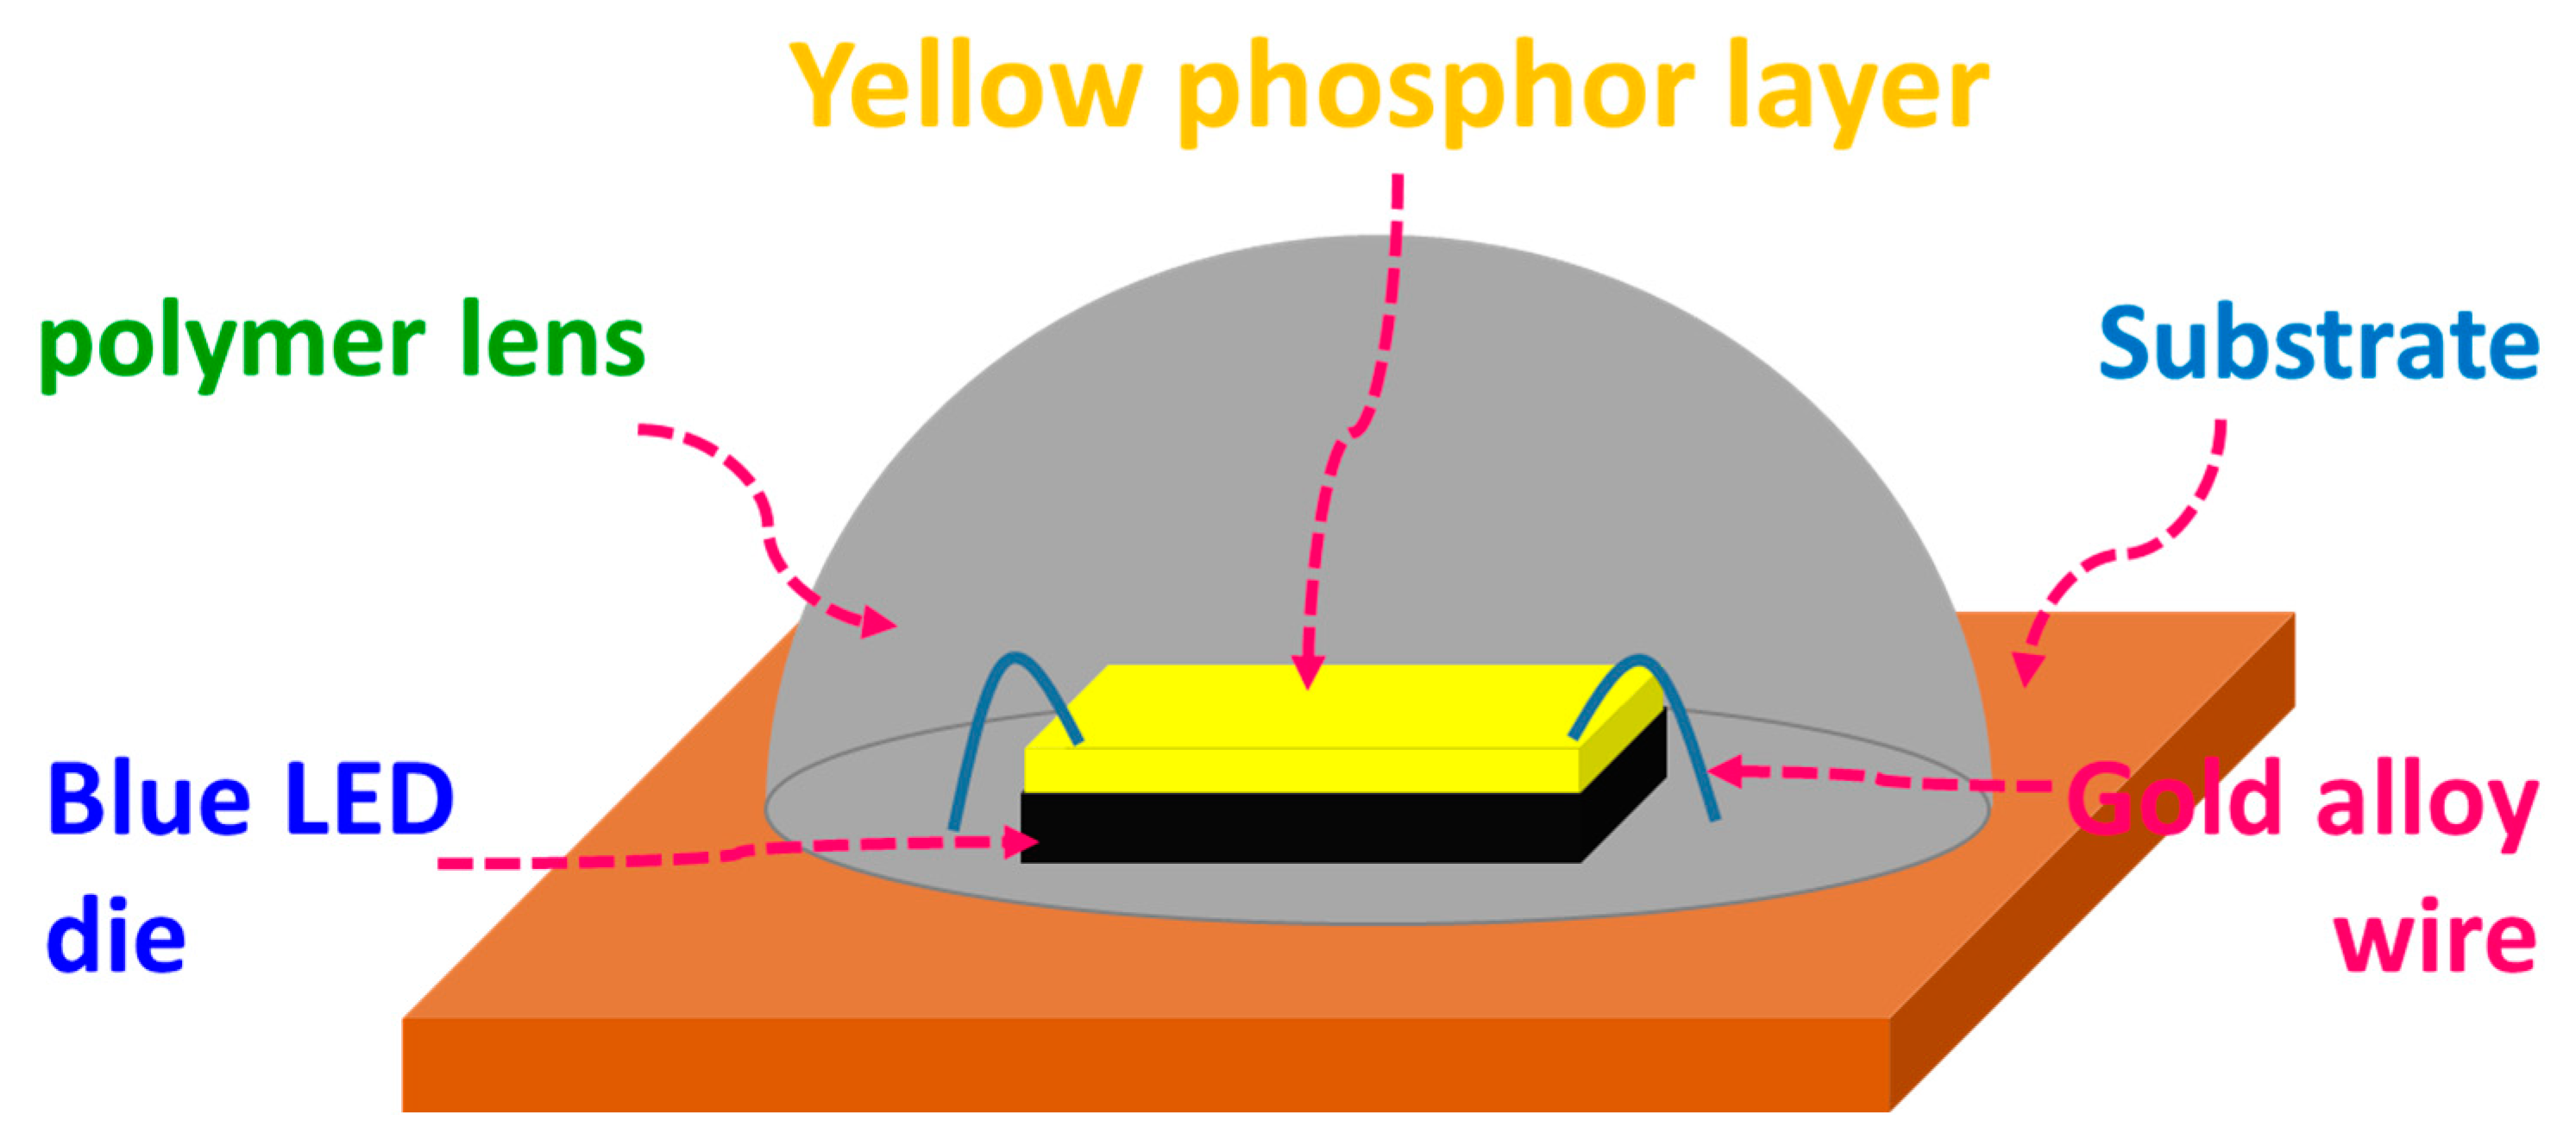
Figure 2.
The cross section of LED.
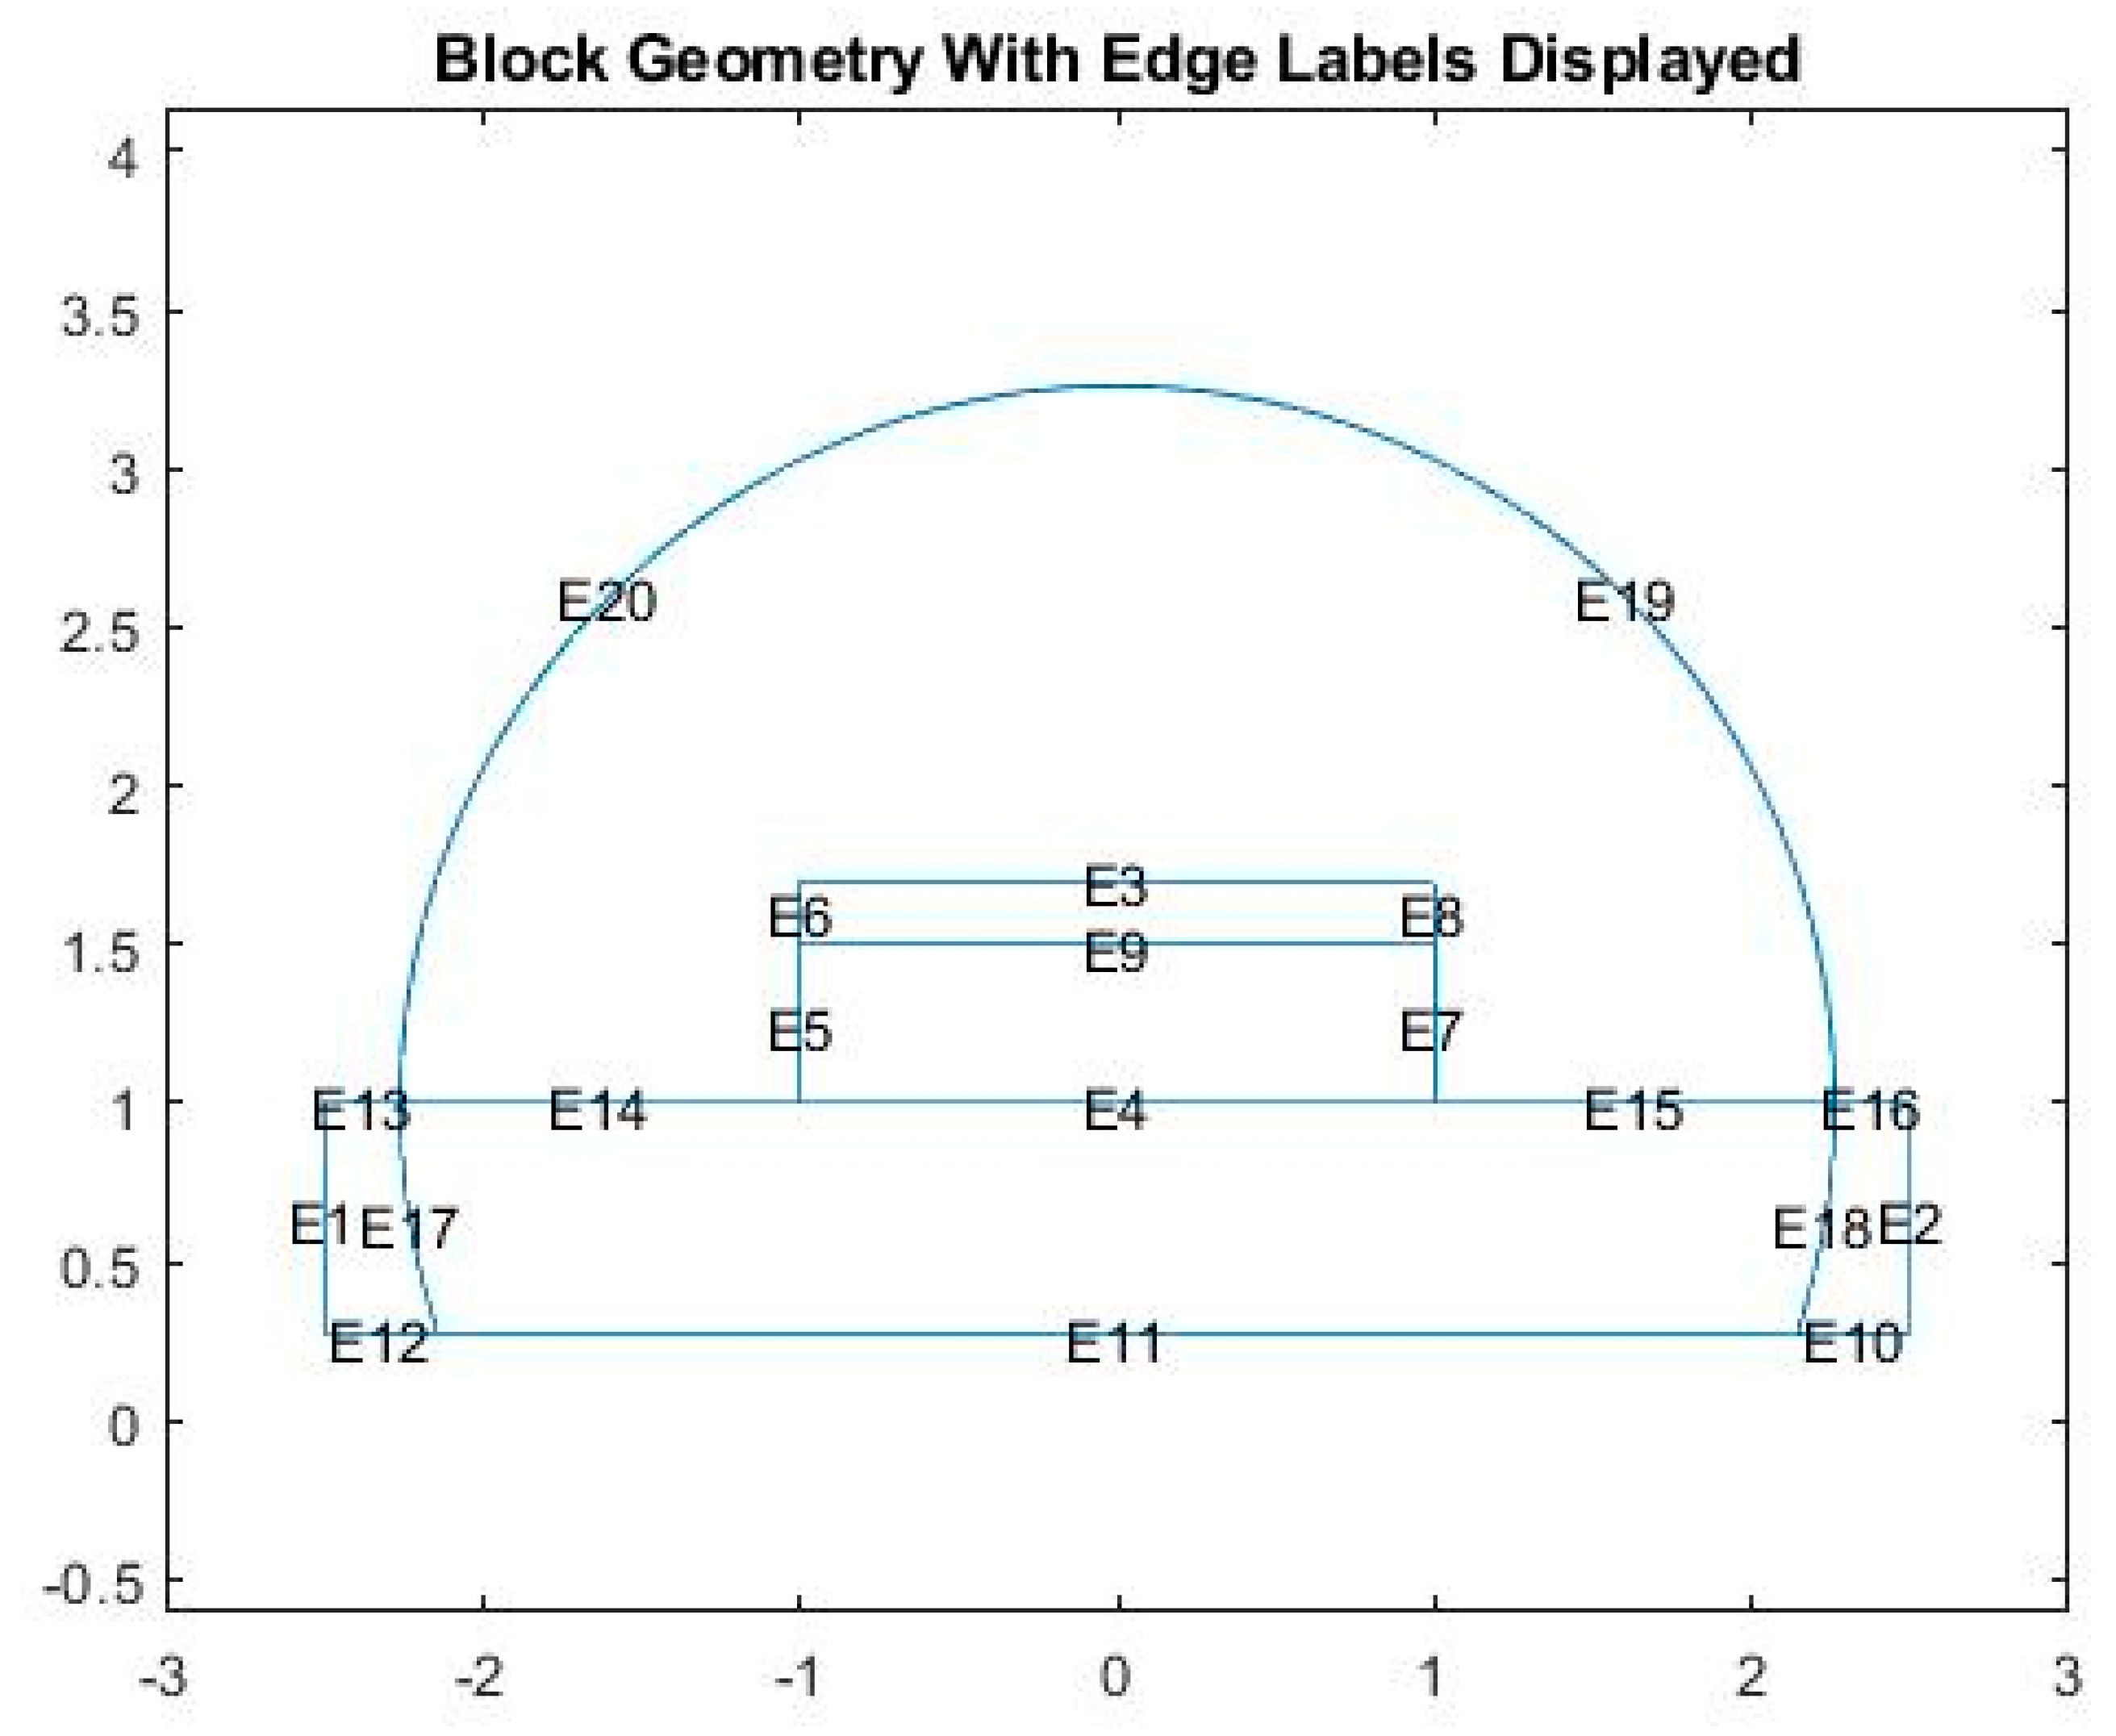
Figure 3.
The cross section of LED with meshing the finite elements.
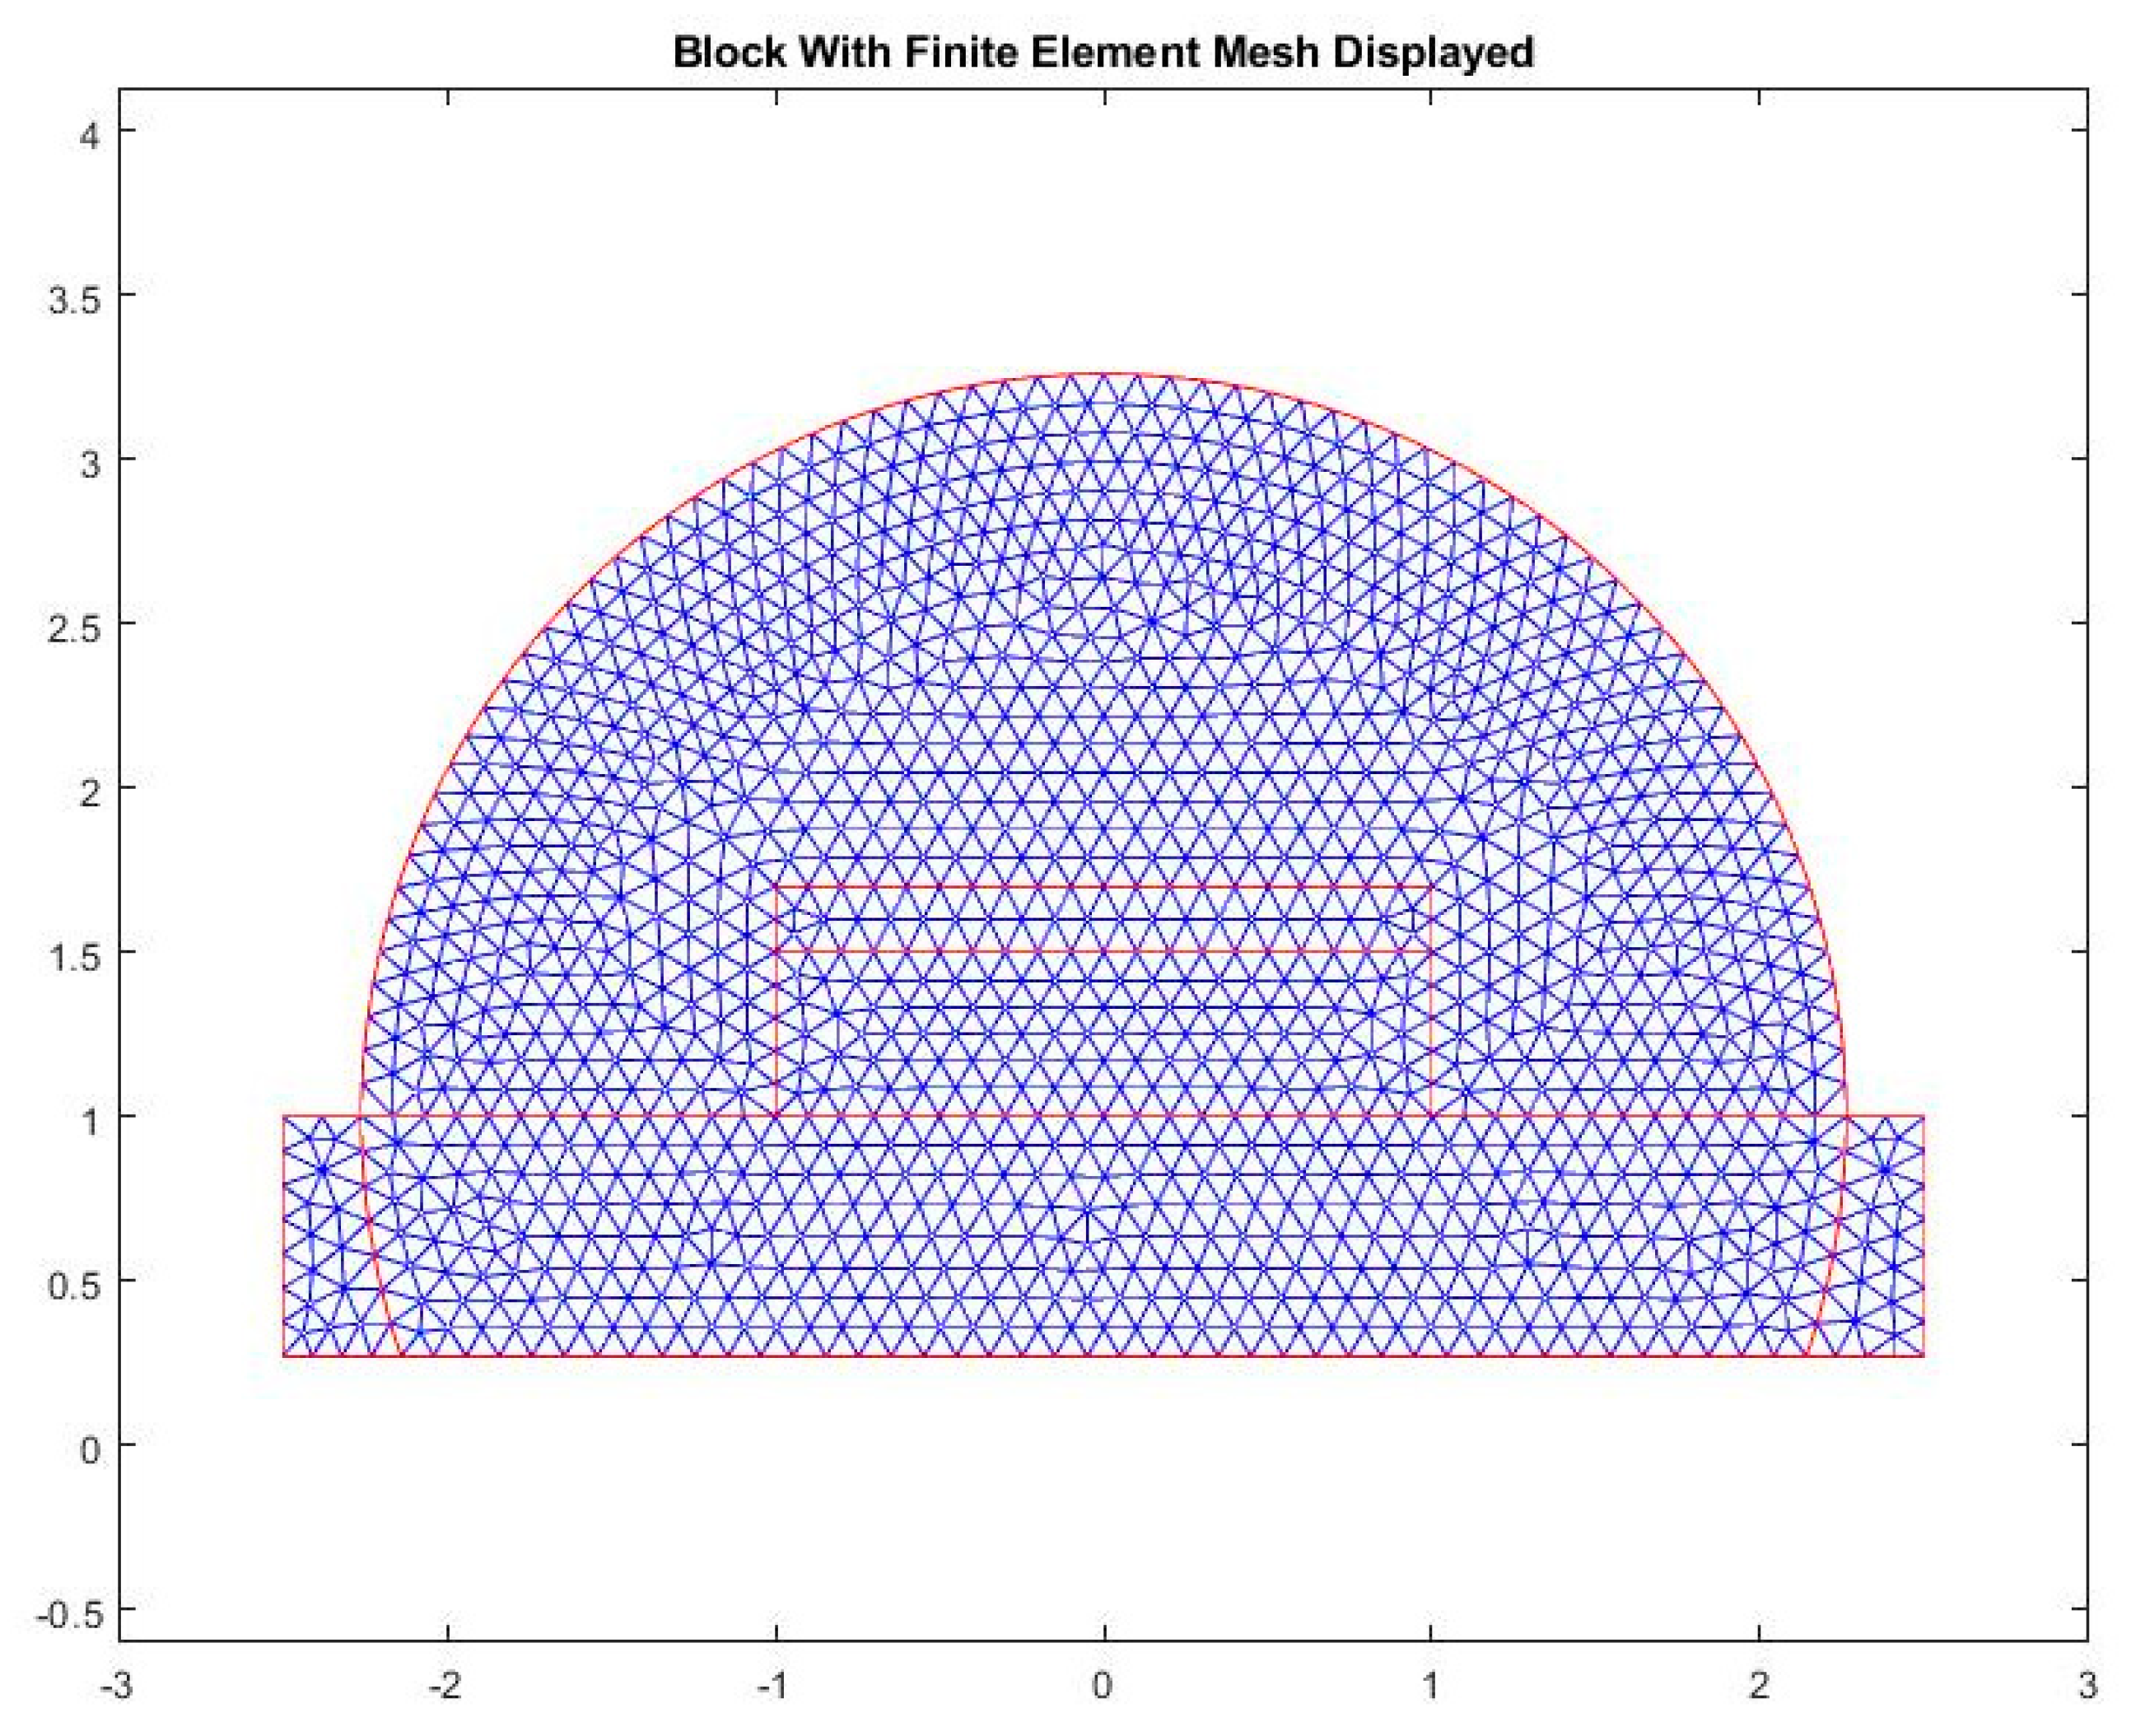
Figure 4.
The temperature distribution of pcW-LED structure when pcW-LED is still not operated.
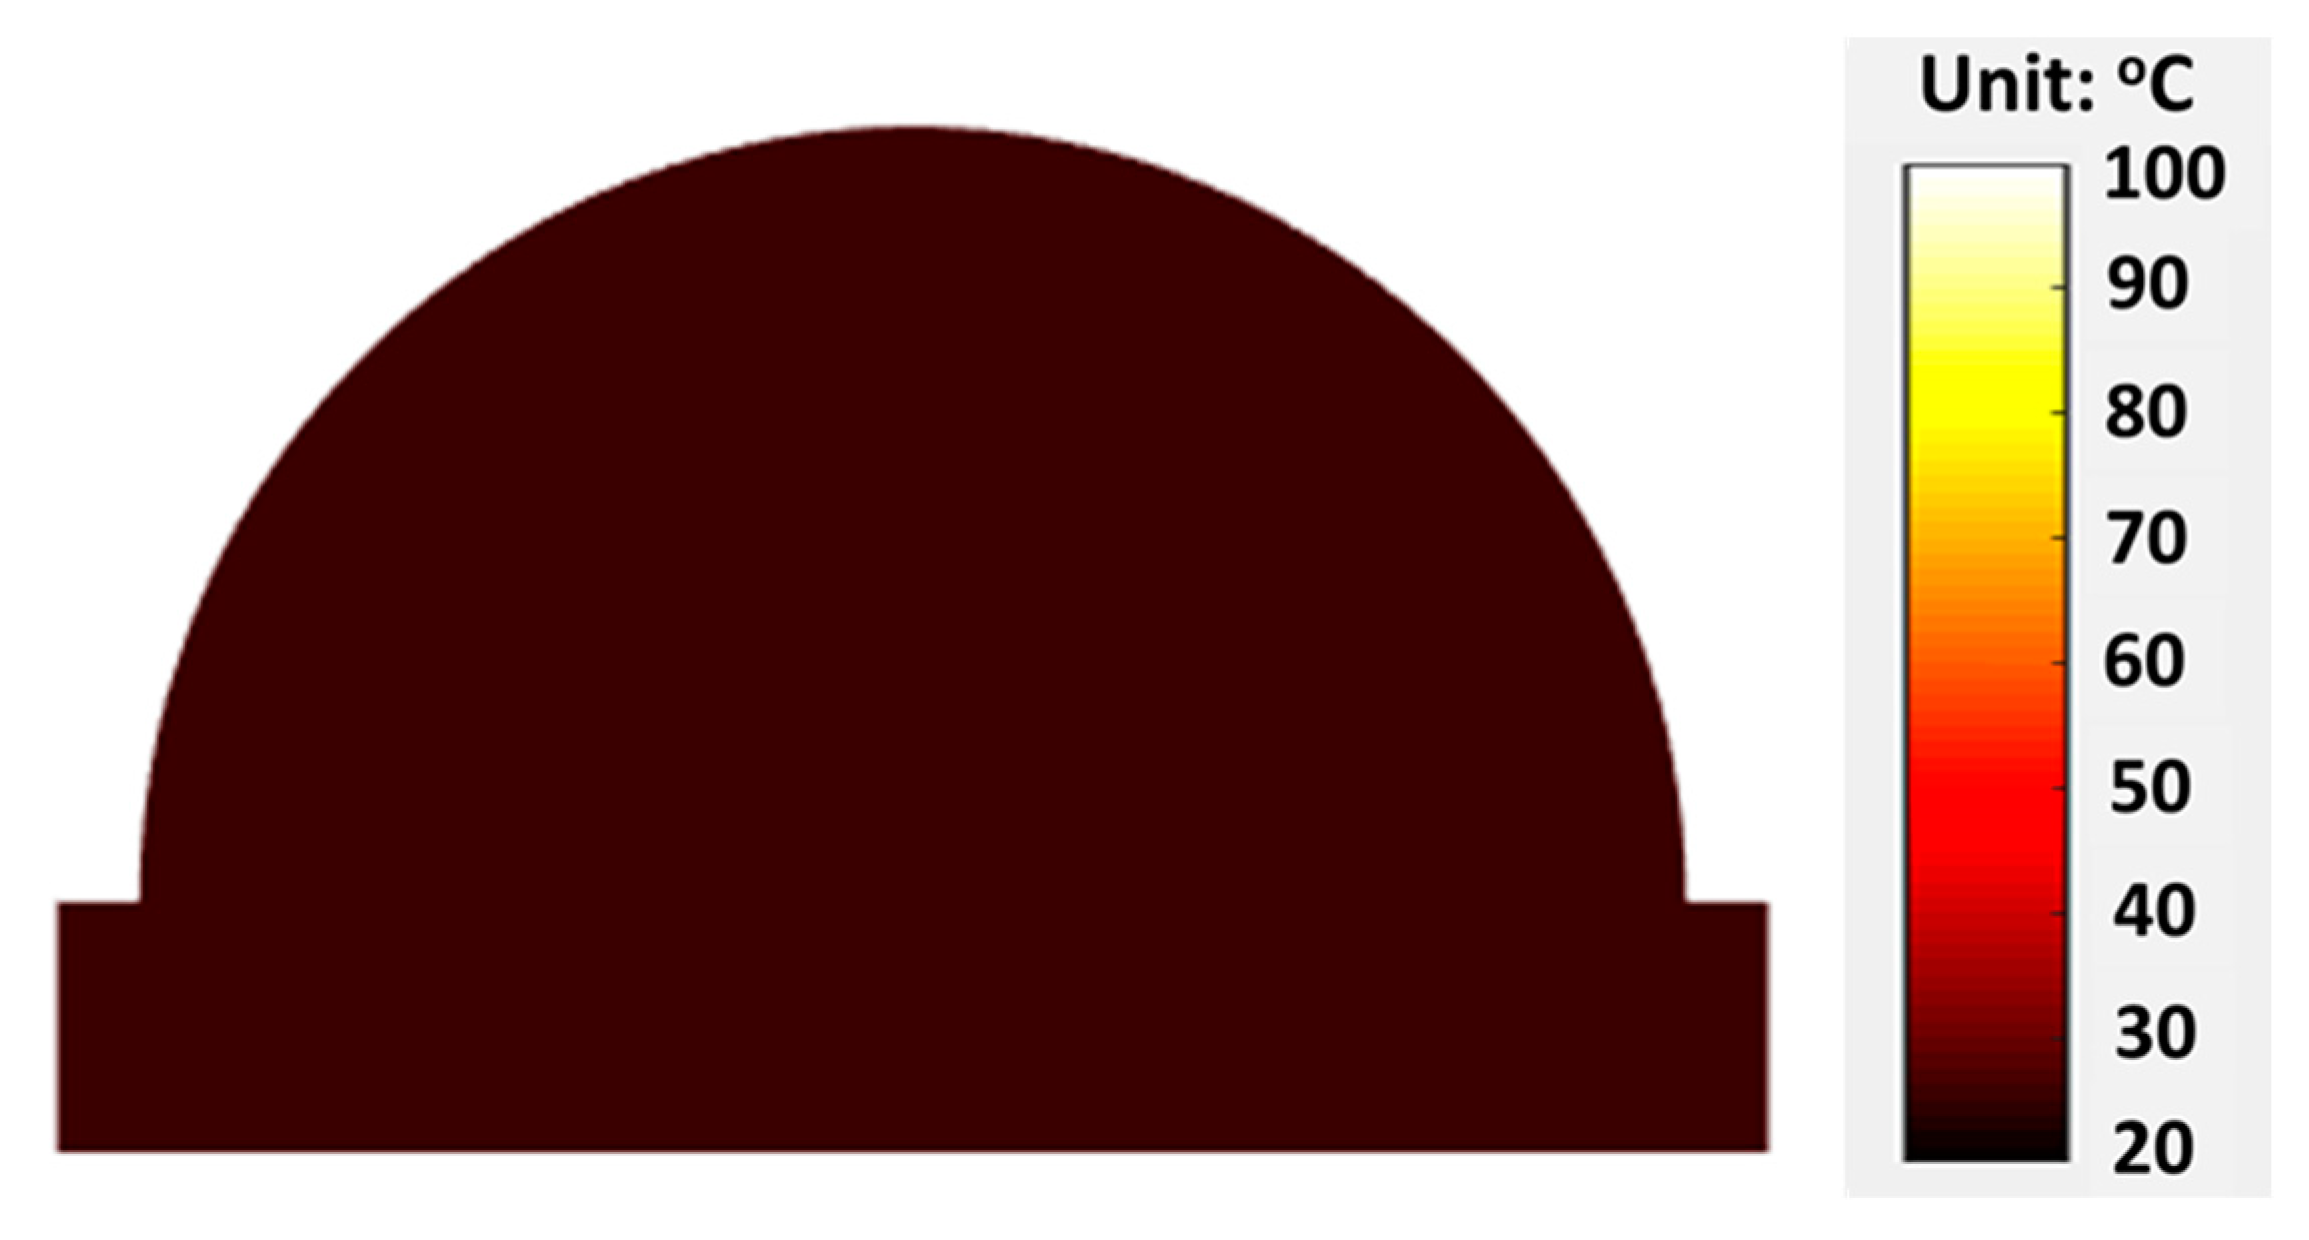
Figure 5.
Simulation result of the temperature distribution vs. Injection current. (a) 50 mA. (b) 150 mA. (c) 250 mA. And (d) 350 mA.
Figure 5.
Simulation result of the temperature distribution vs. Injection current. (a) 50 mA. (b) 150 mA. (c) 250 mA. And (d) 350 mA.
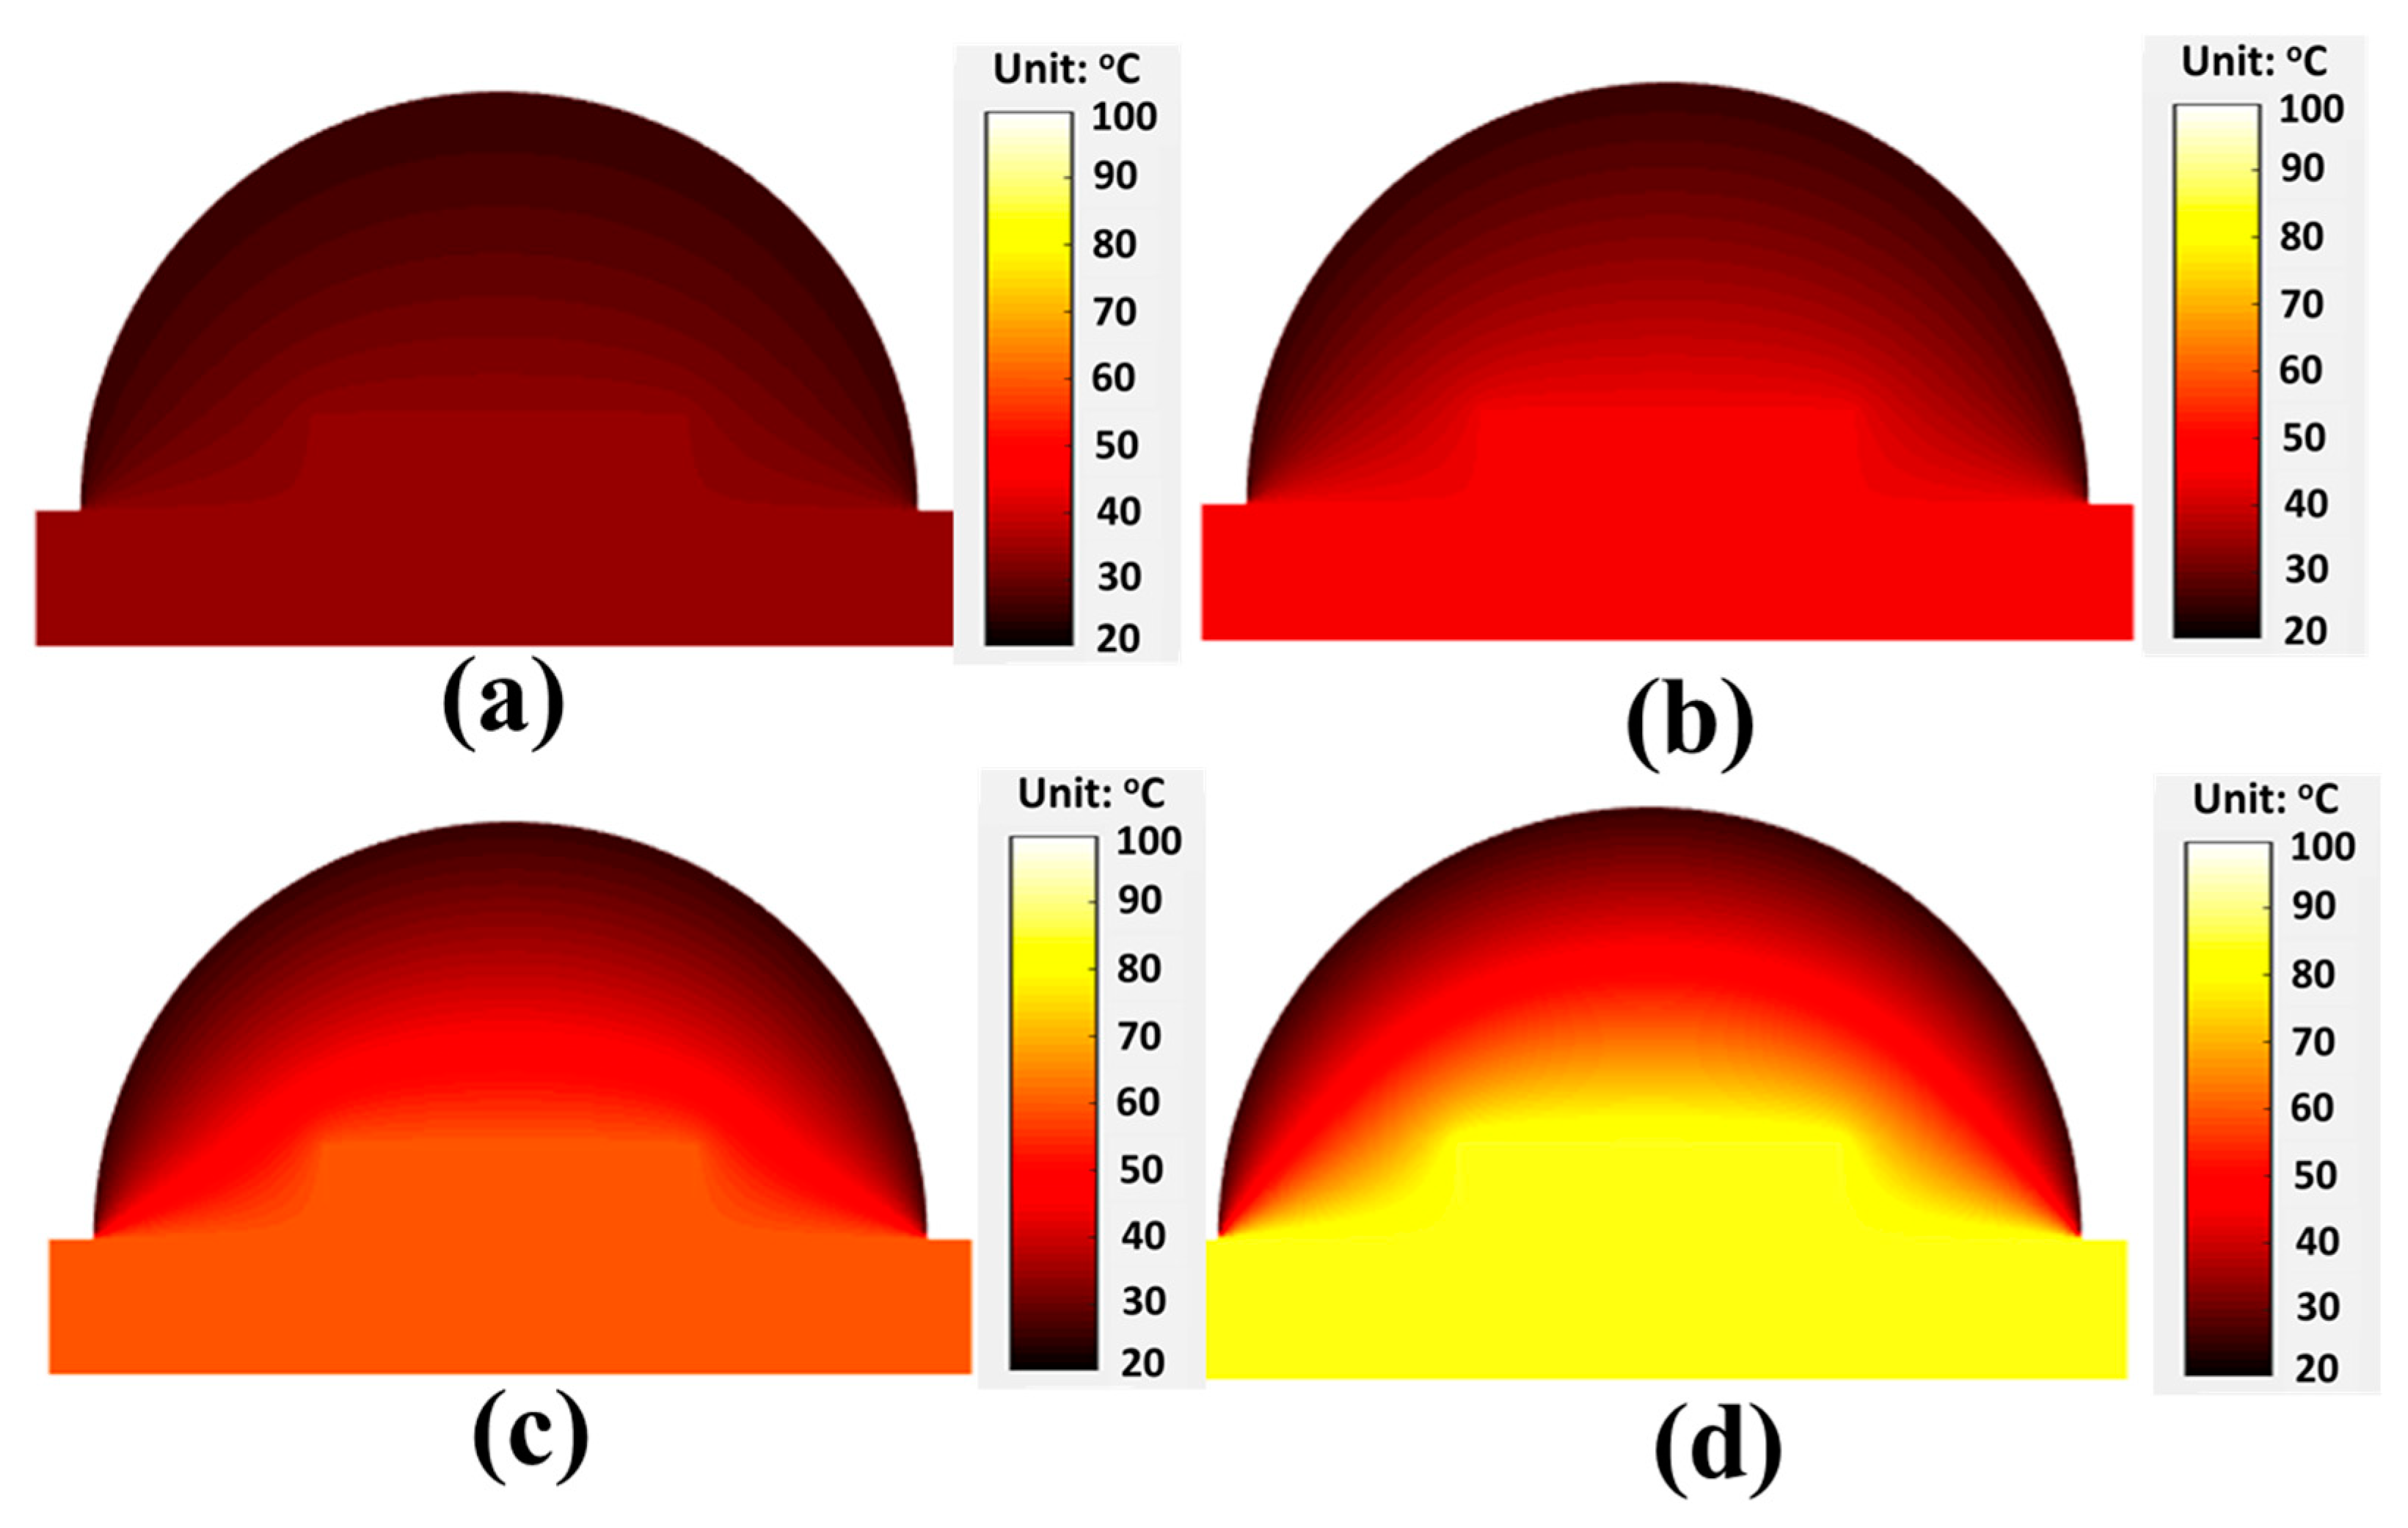
Figure 6.
Interpolation Temperature distribution vs. Injection current. (a) 50 mA. (b) 150 mA. (c) 250 mA. And (d) 350 mA.
Figure 6.
Interpolation Temperature distribution vs. Injection current. (a) 50 mA. (b) 150 mA. (c) 250 mA. And (d) 350 mA.
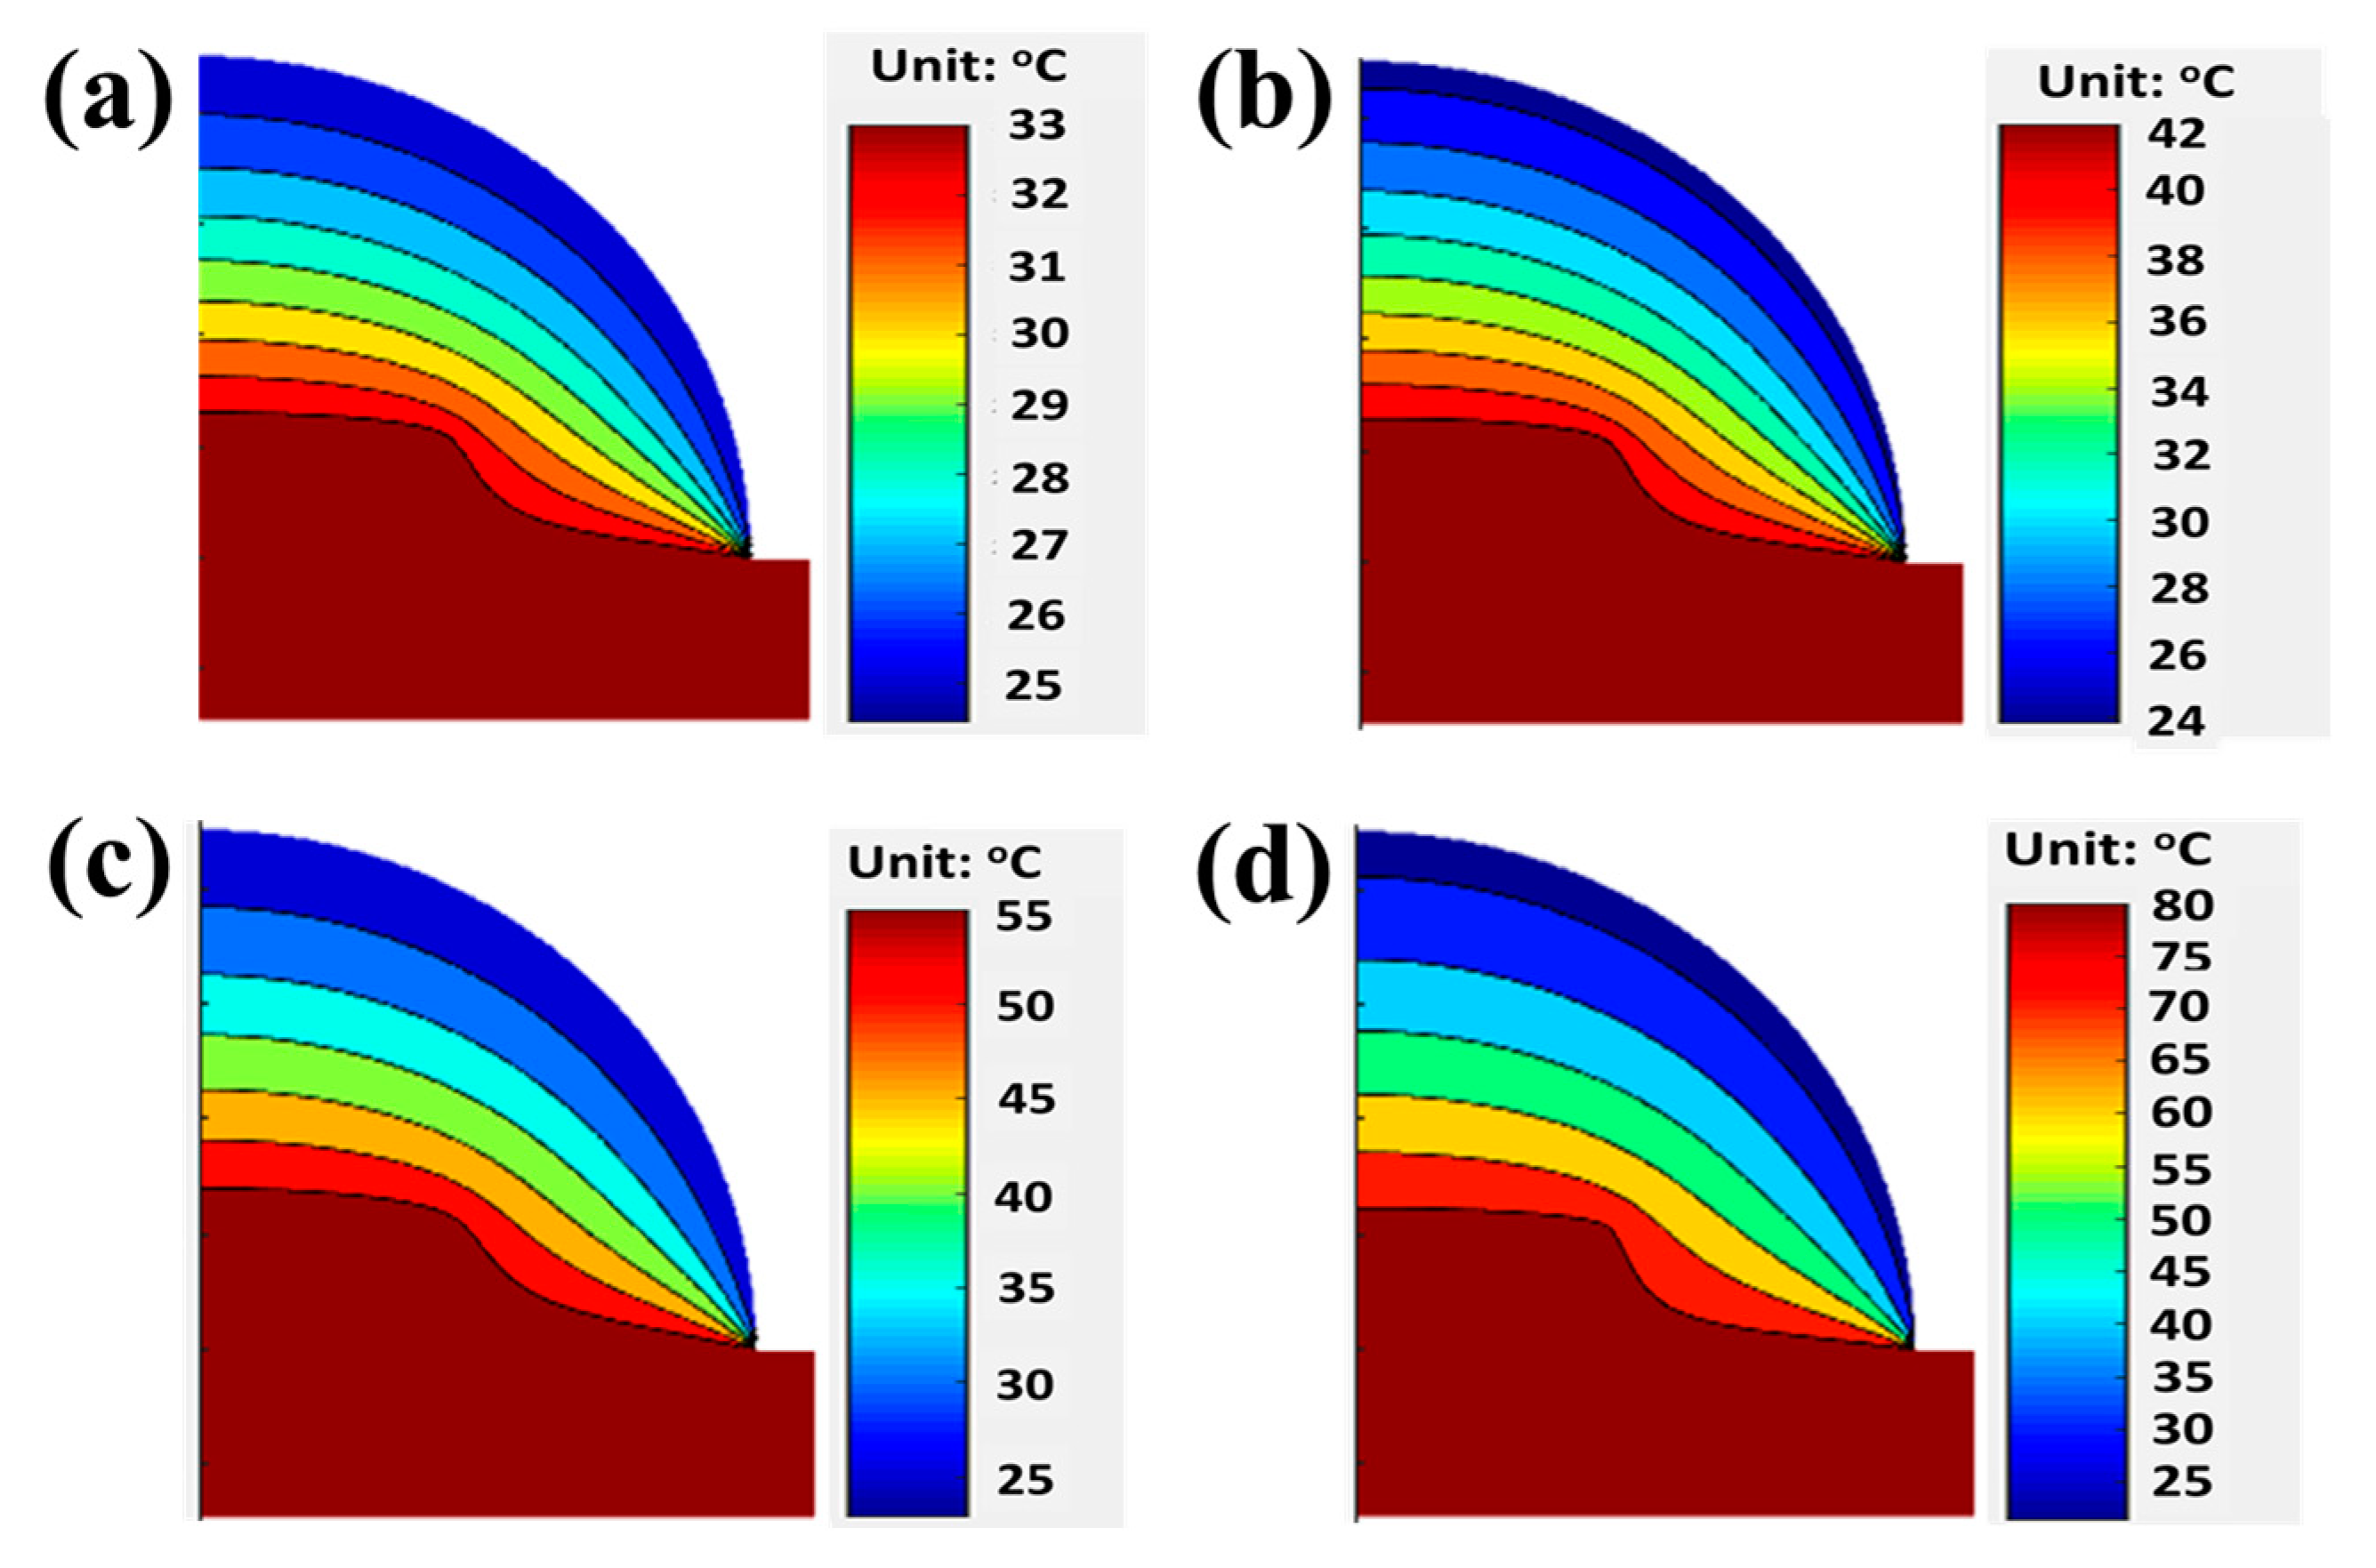
Figure 7.
Geometry block is meshed with different size.(a) Mesh size: Hmax=0.05. (b) Mesh size: Hmax=0.2. (c) Mesh size: Hmax=0.3. (d) Mesh size: Hmax=0.4.
Figure 7.
Geometry block is meshed with different size.(a) Mesh size: Hmax=0.05. (b) Mesh size: Hmax=0.2. (c) Mesh size: Hmax=0.3. (d) Mesh size: Hmax=0.4.
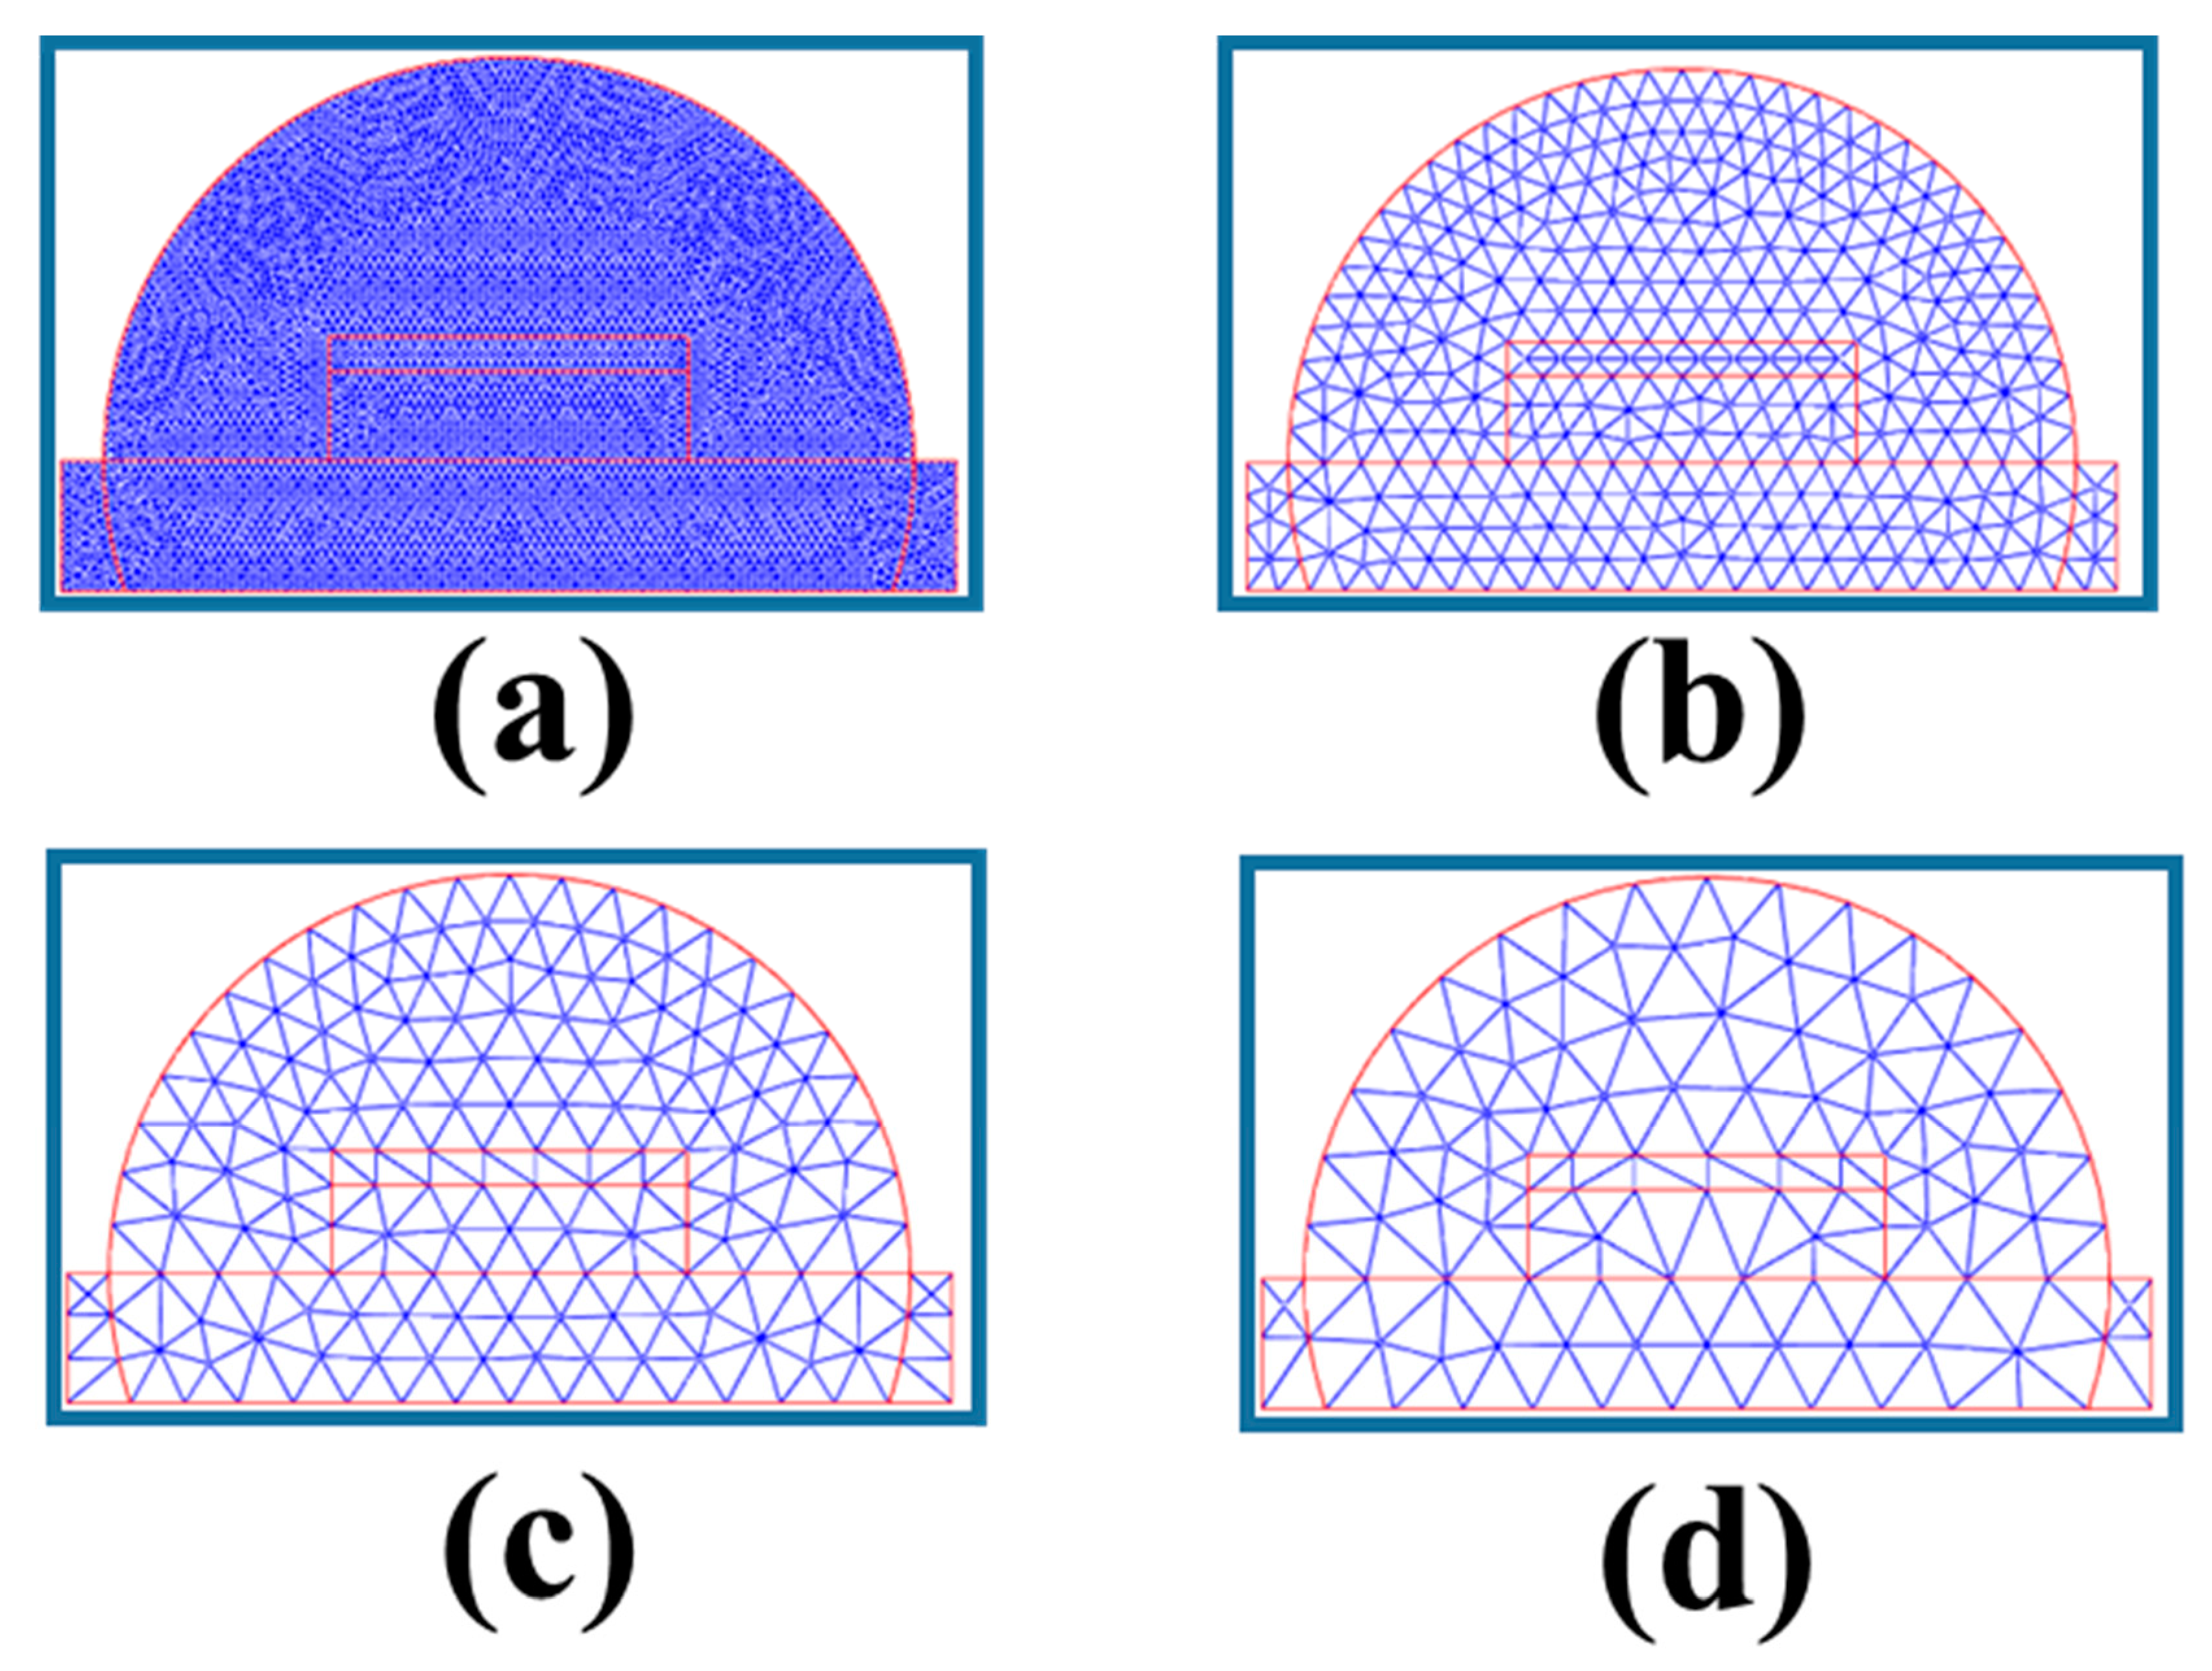
Figure 8.
The effect of mesh size on the obtained result in temperature simulation.
Disclaimer/Publisher’s Note: The statements, opinions and data contained in all publications are solely those of the individual author(s) and contributor(s) and not of MDPI and/or the editor(s). MDPI and/or the editor(s) disclaim responsibility for any injury to people or property resulting from any ideas, methods, instructions or products referred to in the content. |
© 2025 by the authors. Licensee MDPI, Basel, Switzerland. This article is an open access article distributed under the terms and conditions of the Creative Commons Attribution (CC BY) license (http://creativecommons.org/licenses/by/4.0/).
Copyright: This open access article is published under a Creative Commons CC BY 4.0 license, which permit the free download, distribution, and reuse, provided that the author and preprint are cited in any reuse.


