
Submitted:
10 February 2025
Posted:
11 February 2025
You are already at the latest version
Abstract
The transformation of the Cerrado biome into areas with different levels of activity and anthropic pressure negatively impacts biodiversity. This study evaluated the response of the dung beetle community to changes in land-use systems: forests, rubber trees, pastures, and soybeans. Five areas were sampled in each system with a minimum distance of 2 km between them. Dung beetles were collected using pitfall traps, and both local and landscape-related environmental variables were measured. In total, 2,294 specimens were collected and distributed among 34 species and 18 genera. There was no significant difference in abundance between the systems, but differences in the number of species and biomass were observed between Forest and Soybean, as well as a separation of communities between the tree-covered (Forest and Rubber Tree) and open (Pasture and Soybean) systems. Density and arboreal basal area were the main predictive variables for the diversity of the dung beetle community, reinforcing the importance of vegetation cover for maintaining diversity, whereas local and landscape-related variables influenced community composition.
Keywords:
bioindicator
; biodiversity
; coprophagous beetle
; habitat shift
; Scarabaeinae
; land-use intensification
1. Introduction
Anthropogenic activities result in changes in land use systems, leading to massive loss of habitats and biodiversity [1], which threatens the maintenance of ecosystem balance [2,3] and risk to human health and well-being [3]. One of the most visible changes in the landscape is habitat fragmentation, a process that alters the environment and landscape, in addition to generating the edge effect, which interferes with the physical and chemical parameters of the environment [4,5,6]. These changes can favor the colonization of exotic species and, consequently, modify the structures of plant and animal communities [7,8], as well as influencing the flow of fauna [9]. Although some synanthropic species may benefit from these environmental changes, others are more sensitive and do not tolerate them [10,11]. Thus, ecological studies on the impacts of different land uses are fundamental to understanding this dynamic, as assessing habitat changes and their consequences on natural communities is a great challenge in ecology [12].
The Cerrado, the second largest biome in Brazil, extends over ten Brazilian states (Bahia, Goiás, Tocantins, Mato Grosso, Mato Grosso do Sul, Maranhão, Piauí, São Paulo, Minas Gerais, Rondônia, Paraná and the Federal District) [13] and originally covered an area of approximately 198 million hectares 23.3% of the Brazilian territory [14]. Its diversity of phytophysiognomies, including Cerrado Stricto-Sensu, Campo Sujo, Campo Limpo, Veredas, Gallery Forests, High-Altitude Grasslands and Cerradão, gives the biome a high structural heterogeneity [15]. However, the Cerrado is under strong pressure from human activities and is considered a biodiversity hotspot because of the high diversity of species and the intense threats it faces [16]. Despite its ecological relevance, public conservation policies aimed at this biome are limited, making it highly vulnerable to degradation [13,17]. Currently, only 3.1% of the total area of the Cerrado is protected by permanent preservation units, such as national parks, while 5.5% are classified as sustainable-use areas [14]. Approximately more than 50% of the original area of the biome has already been converted to other land use systems [14], with the expansion of the agricultural frontier being one of the main threats driven mainly by projects linked to agribusiness [14,18].
Agricultural expansion in the Cerrado has resulted in the replacement of native vegetation by monocultures of soybeans, corn, pastures for intensive livestock and commercial plantations of eucalyptus and pine [19,20,21]. These different land uses alter local environmental characteristics and the landscape, modifying the availability of resources and microclimatic conditions and factors that directly influence fauna [2,22,23]. To understand the impact of these changes on ecosystems, it is essential to use bioindicators capable of reflecting environmental transformations and habitat degradation [24].
Dung beetles (Scarabaeidae: Scarabaeinae) are widely used as bioindicators of environmental quality because they have a great diversity of species, are well known from a taxonomic, biological, and ecological point of view, and perform fundamental ecological functions such as nutrient cycling, soil bioturbation, increased fertility, secondary seed dispersal, population control and dispersal of flies and gastrointestinal parasites from cattle, trophic regulation, and pollination [25,26,27,28]. In addition, they can be easily sampled using standardized, low-cost, and high-efficiency methodologies [29,30]. The sensitivity of beetles to environmental changes makes them ideal for assessing the effects of land use transformation [10,22].
Given this scenario, this study aimed to evaluate the response of beetle communities to changes in land use systems (SUTs) in the Cerrado, compare community parameters between different systems, and verify the influence of local environmental and landscape variables. We tested the following hypothesis:
i) The abundance, richness, biomass, and uniformity of beetle communities decreased with increasing land use intensity due to resource reduction and habitat degradation.
ii) The composition of the beetle community varies according to the type of land use, reflecting the replacement of species that are more sensitive to environmental change.
iii) Local environmental and landscape changes influence the composition of the beetle community owing to modifications in habitat structure and resource availability.
iv) Different species of beetles act as indicators of each land-use system, as each system offers specific ecological conditions that favor different sets of species.
2. Materials and Methods
2.1. Study Area and Dung Beetle Sampling
The study was conducted in the municipality of Frutal, Minas Gerais (20°1’11″’’S, 48°55’10’’″ W), which has an area of 2,526 km2 and 60,012 inhabitants, with a demographic density of 22 inhabitants per km2 [31]. The municipality is part of the Cerrado biome and presents a fragmented matrix formed by pastures and areas of perennial, semi-perennial, and annual crops, with few forest fragments. The agribusiness sector moves large amounts of resources into this region [31]. The climate in Frutal is defined as Aw according to the classification of Köppen-Geiger, tropical with a dry and cold season during winter, while the summer period is characterized by higher rainfall indices [32], with mean temperature and rainfall of 23.8 °C and 1626.9 mm, respectively.
Dung beetles were collected in four different land use systems (from five areas of each system), totaling twenty areas: forest, rubber trees, pasture and soybean (Table 1; Figure 1) and separated by at least 2 km [33]. The selected systems are economically important for the municipality and were chosen to form a gradient of intensity of land use.
The beetles were collected using pitfall traps (19 cm diameter and 11 cm depth), with human feces (25 g) as bait. Traps were installed throughout a 300-m transect containing five traps separated by 50 m from each other and at the edges of the area. The traps remained in the study area for 48 h; after this period, they were collected and stored in plastic bags containing alcohol 70% (v/v) and the source data were sent to the Laboratory of Environmental Research of the Minas Gerais State University (UEMG). In the laboratory, beetles were sorted using a stereomicroscope, packed in entomological blankets, and dried in an oven at 40 °C until a constant weight was achieved. All individuals were weighed on an analytical scale (precision, 0.0001 g).
The insects were morphologically identified and compared with specimens from the reference collection of the Laboratory of Ecology of Social Insects (LEIS) of the Federal University of Uberlândia (UFU). For some species, confirmation was performed by the taxonomist Prof. Dr. Fernando Z. Vaz-de-Mello. The voucher specimens were deposited in the collections of UEMG and the Entomological Section of the Zoological Collection of the Federal University of Mato Grosso (UFMT).
2.2. Sampling of Environmental Variables
A survey of the understory density and fractal dimension was carried out according to the methodology proposed by [34], which consists of the analysis of photographs of the understory using a standardized procedure. Next to each trap, a black cloth of 1 m2 was vertically stretched close to the soil, and four photographs perpendicular to the cloth were obtained in each of the four quadrants surrounding the pitfall trap at 3 m from the cloth, totaling 20 photographs per area.
The photographs were analyzed using the software SideLook 1.1.01 [34], which calculates the density and fractal dimension of the herbaceous vegetation by means of dichromatic image contrast (percentage of black and white pixels) available in the software. The vegetation density was calculated using the following equation:
Where DV is the vegetation density and height, and width represents the total area of the bulkhead. Both fractal dimension and vegetation density were used as proxies for the complexity of vegetation.
The quadrant point method was used to estimate the density and basal area of tree vegetation. At each sampling point around the pitfall trap, four quadrants were randomly defined [35]. The circumference perimeter of the nearest tree in each direction was measured with the aid of a measuring tape at chest height (P); thus, based on this value, the measurement of the basal area (AB) was performed according to the equation below.
AB = P²/4π
Where AB is the basal area of the trees, and P is the perimeter.
The density of tree vegetation was calculated from the distance of the central point of the pitfall traps in the four quadrants around the transect’s central point (north, south, east, and west) using the following equation:
Where D is the estimated density, R is the measured distance, n is the number of pitfall traps, i is the number of sampling points, and j is the number of quadrants [36].
The density and basal area were used as proxies for tree vegetation. Trees located > 800 m from the central point of each pitfall were considered zero. The depth of the plant litter was measured around each pitfall using a digital caliper.
A portable meter that provides the electrical conductance (mV) and water content in the soil (%) was used. Soil resistance (kPa) was determined using a conical manual penetrometer. Before data collection, the plant layer surrounding each pitfall trap was removed, totaling five sampling points per area. Soil resistance was determined at each 2.5 cm, up to a depth of 60 cm.
The spatial data of the sampling units were registered and processed using ArcGIS 10.5 [37]. Land use coverage was classified using the databank of the Annual Project of Brazilian Soil Use and Mapping (MapBiomas) - Collection 4.1, with a collection on a scale of 1:250,000 and the standard RBG legend [14]. The platform aims to map land use systems in Brazil based on satellite data, such as Landsat (5-TM, 7-ETM + and 8-OLI). Altogether, nine classes of land use were defined: forest formation, savanna formation, rural formation, another non-forest formation, pasture, annual or perennial crops, semi-perennial crops, mosaic between agriculture and pasture, urban infrastructure, mining, and water bodies [14]. A buffer of 2 km was delimited around the central pitfall of each sampled area and all soil coverage was classified.
2.3. Data Analysis
For all analyses, the area was considered a replicate to avoid the spatial pseudo-replicate effect. To verify the sampling coverage, rarefaction curves were calculated based on the number of captured individuals and in the interpolation and extrapolation, together with the confidence interval of 95%, by means of the R package “iNext.” Differences in the number of individuals, species, and biomass sampled among the land use systems were evaluated using the Kruskal-Wallis test, followed by Dunn’s post-hoc test, when differences were found among systems. The post-hoc test was carried out with the adjustment of Bonferroni correction, with the land use system considered a response variable and richness, biomass, and abundance as determinant variables. These analyzes were performed with the aid of the software R 4.0.3 [38]. A diagram of Veen was made to graphically indicate the number of exclusive species shared among distinct systems.
To visualize the ordering of the composition of the dung beetle community, principal coordinate analysis (PCO) was carried out based on the matrix of similarity and using the Bray-Curtis index. The data were standardized and transformed into square roots for this analysis. Subsequently, we applied a permutational multivariate analysis of dispersion (PERMDISP) to test for heterogeneity in multivariate dispersions between LUSs [39]. The differences in community composition among land-use systems were analyzed by means of a Permutational Analysis of Variance (PERMANOVA) [40]. These analyses were performed using PRIMER v6 PERMANOVA + software [41].
The distribution of abundance was performed with the aim of verifying species evenness according to the land-use system. The curves ordered the species from most abundant to least abundant. Ranks were constructed for different land use systems. For this analysis, the data were transformed into logarithms (log + 1).
To identify bioindicator species in each land use system, Indicator Species Analysis was performed, which considers the occurrence of species in samples within each system. This analysis was performed using PC-ORD 4.10 [42]. The species were categorized with an indication value (IV), and when above 70% (p < 0.05), were considered as indicators, while the species found with values between 45-70% (p < 0.05) were considered as detectors [43,44,45].
The relationship between the community composition of dung beetles and environmental variables was evaluated using distance-based linear models (DistLM) [46]. Correlation analysis was previously performed, and those with an R-value above 70 were excluded from the model. The variables used after exclusion were fractal dimension and density of the understory, tree distance, tree basal area, density of vegetation, plant little depth, soil humidity, resistance at depths of 7.5, 30, and 60 cm, quantity of forest, savanna and field, pasture, and other cover formations. We used a stepwise procedure for selection and adjusted the R2 as the criterion for selection. DistLM was illustrated using distance-based redundancy analysis (dbRDA) [46]. These analyses were performed using PRIMER v6 PERMANOVA + software [41]. Both DistLM and dbRDA were constructed with the dissimilarity matrix based on the Bray-Curtis index, with data being standardized and transformed into square roots with 999 permutations. These analyses were carried out using Primer v. 6 software with PERMANOVA+ [47].
3. Results
This study provides information about the response of dung beetle communities to the intensification of land use in the city of Frutal, Minas Gerais, a region with high agricultural intensity [31] that has not yet been studied. The extremes of the systems (forest and pasture) presented differences in relation to species richness and biomass, and were higher and statistically similar in relation to forest, rubber trees, and pasture. The composition of the dung beetle community presented two distinct groups: one formed by tree systems (forest and rubber tree) and the other formed by open systems (pasture and soybean). The results of this study demonstrate that the soybean system is the most harmful to the dung beetle community.
We collected 2294 beetles that were distributed among 34 species, 18 genera, and five Neotropical tribes, including 207 individuals from three species of the tribe Ateuchini, 192 individuals from six species of the tribe Deltochilini, 1339 from 15 species of the tribe Coprini, 145 from three species of the tribe Onthophagini, and 411 individuals belonging to seven species of the tribe Phanaeini. There were 25 species in the forest system, 17 in pasture, 19 in rubber trees, and 17 in soybean (Table 2).
In the study area, 17.64% (six species) were shared among all SUTs. Four species (11.76%) were exclusive to the forest system and four other species occurred only in the pasture system, whereas soybean presented a single exclusive species and the rubber tree system did not present any exclusive species (Figure 2).
The species rarefaction curve by interpolation and extrapolation revealed that all areas approached the asymptote, with a tendency for the curve to stabilize, indicating sufficient sampling [48]. The accumulated richness of species in the forest was superior to that of the other land-use systems (Figure 3).
Dichotomius nisus (Hope, 1838) was the most dominant species in terms of abundance in the forest system and was also represented as one of the main species in other systems (Figure 4A). The species Canthidium refugens was the most abundant in the rubber tree system, while Trichillum externepunctatum was the most dominant in pasture and soybean systems; however, its relative dominance extended to all land-use systems (Figure 4A). Regarding the biomass of the dung beetles, D. nisus was dominant in all systems (Figure 4B).
The number of individuals did not vary among the land use systems investigated in this study (Figure 5A, KW, X2(3) = 7.6615, p = 0.05355), but both species richness and biomass differed between the forest and soybean systems (Figure 5B-C) (KW; X2(3) = 10.115; p = 0.01762; KW; X2(3) = 12.957; p = 0.00473, respectively). The forest system presented a greater richness in relation to soybeans (Figure 5B, KW = 2.74; padj = 0.0365), whereas rubber trees and pastures did not show any significant differences among SUTs. The biomass of dung beetles presented the same pattern for species richness, differing only between the forest and pasture (Figure 5C, KW = 3.54; padj = 0.00241).
The composition of the dung beetle community differed among the land-use systems (PERMANOVA, Pseudo-F = 2.8982; p = 0.002). In the paired-PERMANOVA test, the two open systems (soybean and pasture) did not differ from each other, like the closed systems (forest and rubber trees) (Figure 6; Table 3). These differences occurred because of the alteration in the community composition, instead of data dispersion (PERMDISP, F = 0.4278; p = 0.83) (Table 3) or the homogeneity of variance of data.
Agamopus viridis presented an indication value of 60.0% (p = 0.0332), and Ontherus sp. 3 displayed an indication value of 50.9% (p = 0.0384), both in the pasture system, while all other species did not present significant values for this variable. Both values of IV were lower than 70%, which indicates that the species are classified as environmental detectors in pasture systems.
The complete DistLM was visualized using dbRDA (Figure 7).
The first two axes of dbRDA captured almost 69.5% of the variability in the adjusted model, which was approximately 35.1% of the total variation in the dung beetle community data cloud. The vector overlap revealed that the first dbRDA axis is strongly related to the soil resistance at 2.5 cm, while the height of plant litter, density, tree basal area and soil resistance at 2.5 cm are related to the second axis of dbRDA (Figure 7). These four variables were statistically significant (marginal test; Table 4) to explain community composition. In the sequential test, the best model included eight variables (basal area, density of vegetation, fractal dimension, savanna and pasture formations, soil resistance at 2.5 cm, plant litter, and soil humidity) that together explained about 60% of the variation (Table 4).
4. Discussion
As expected, the abundance, species richness, biomass, and species evenness tended to decrease with increasing land-use intensity. Differences in community composition were anticipated across all land-use systems, following a gradient from lower values in forests to higher values in soybean fields.
However, significant differences were only observed between the two extremes of this gradient (forest and soybean) in terms of biomass and species richness (Figure 5). The fragmentation, degradation, and conversion of natural habitats into intensive and extensive agricultural systems consistently affect dung beetle abundance, richness, and community composition [22,23,49,50]. These alterations may be linked to the loss of forest cover and associated animal and plant resources [22,23].
The PCO analysis (Figure 6) revealed two distinct groups: open systems (soybean and pasture) and closed systems (forest and rubber tree). Environmental data supported this grouping, indicating that dung beetle communities respond to habitat changes, food availability [51], and macro/microclimatic conditions [52]. Human activities frequently convert closed systems into open ones by clearing vegetation and intensifying land use, particularly through monocultures, which have been linked to declines in mammal diversity [26]. Since dung beetles depend on mammal feces, their diversity is affected accordingly. In general, beetles thrive in forested areas, where denser vegetation provides more shade and stabilizes humidity and temperature [52,53].
The similarities observed among the land use systems evaluated in this study are mostly due to the characteristics of the Cerrado biome in which this study was conducted. In pastures used for livestock production, there is a greater abundance of fecal resources from a single mammal species that causes soil compaction, which may exert negative impacts on the dung beetle community [20,54,55]. Thus, a reduction in community parameters was expected, which was not observed in relation to the number of individuals in distinct systems. This biome has evolved over millions of years as an open system with wide plain areas of pasture and savanna [13] thus, it has species adapted to open areas that can colonize open and closed environments; however, this subtle change affects dung beetles [56].
The conversion of Cerrado into other land use systems drastically alters the landscape, affecting the structure and complexity of vegetation [56]. Although dung beetles colonize modified environments, natural vegetation usually provides a greater variety of resources and habitats for survival [57]. However, there are indications that vegetation-related parameters are more important than food resources available for dung beetles in this biome [56]. Several studies have indicated that vegetation plays a major role as a predictor of the abundance and richness of this group of beetles [22,23,56,58]. In addition, the species present in this biome may be persistent if there is sufficient time and the habitat has a structure like of that the original matrix [58], including exotic systems [54].
The species of dung beetles present in field phytophysiognomies can be numerically and qualitatively different between native and exotic fields [54]; thus, it might be possible that this is true for the soybean systems evaluated in this study. In addition, larger beetles tend to become extinct more frequently during the SUT shift [10], even though this is not a universal trend [59]. When such changes occur, abiotic factors also shift, such as temperature, which seems to be the main factor in the replacement of large-sized beetles by smaller-sized species [10]. This might explain some of the obtained data, where the biomass and species of the forest and soybean systems were different, while the number of individuals was similar, possibly because of functional compensation. Hypothetically, the parameter biomass should present intense differences among SUTs, which vary according to the other evaluated components in these systems, such as resource availability, changes in the soil structure, vegetation, and land use intensity [22,51].
The differences found between the dung beetle communities of the forest and soybean systems could be due to the intensity of land use. The traditional cultivation of soybean presents a strong need for the application of inputs for its maintenance [60], which intensifies land use, especially in monocultures that alternate production cycles (sugarcane and soybean). Therefore, the conversion of native forest areas into soybean crops leads to higher losses in the number of species and biomass of dung beetles, but there was no loss in the number of individuals (Figure 7). In addition, shifts in land use systems result in the formation of mosaics, causing the appearance of different-sized fragments that cohabitate with areas used for other SUTs with greater intensification of human action [61]. The distribution of environmental data is related to the responses of dung beetles to available habitats and food [51], as well as macro-and microclimatic conditions [52]. Presumably, dung beetles are more successful in colonizing forested areas, where the coverage provided by the vegetation is denser, ensuring higher shading, humidity, and temperature retention [52], compared to open areas [53]. However, human action tends to transform closed systems into open systems by suppressing vegetation, causing a rapid and immediate impact on the community.
Forest production systems may have a positive effect on dung beetle communities [52] compared to monocultures such as soybean crops. The areas destined for agricultural production tend to exclude a large part of mammals that support dung beetles [62], reducing the diversity and abundance of the mammal fauna and impacting the community-related parameters of dung beetles [25,26]. Thus, the increased variety of habitats can be considered an important factor for the maintenance of the diversity of dung beetle species and the critical maintenance of the ecosystem services provided [25,28,62].
In this study, a wide occurrence of the genus Dichotomius (Hope, 1838) was verified, represented by the species D. nisus, D. bos, D. aff. carbonarius, and D. glaucus, which have the highest biomass among the Scarabaeinae, with 170 valid species being representative of field areas and other open systems [63]. D. nisus presented a high abundance and biomass in all land use systems evaluated in this study (Figure 4). D. nisus and D. bos are frequently found on Brazilian pastures [64,65,66], but the abundance of D. bos in this study was low in relation to other species of the genus Dichotomius, especially in comparison to other studies carried out in the Brazilian Cerrado, which reported this species as one of the most representative in abundance and biomass [27,64,65,66,67]. The species D. bos, D. nisus, T. externepunctatum, and O. appendiculatus are regularly found in pasture environments, and their importance in this land-use system is recognized by the wide increase in biomass, distribution, and incorporation of manure into the soil [66].
The genus Deltochilum, represented in this study by D. aff. guyanense (Paulian, 1938), can be considered as a relevant finding, showing that this genus is sensitive to anthropic action [69]. Its occurrence is limited to a single individual in a forest system. Literature suggests that its occurrence is related to less disturbed environments that have constant increments of organic matter [70]. Therefore, this finding raises the hypothesis that changes in the environmental quality of forests in the study area may have occurred, corroborated by means of the low occurrence of the genus Canthon (limited to three species), which is also an indicator of good environmental quality [69,71]. In addition, A. viridis and Ontherus sp. 3 were identified as IV in pastures and were considered detector species in this land-use system. A relationship was identified for both species with the time of exposure to fecal resources, that is, there is apparently a preference for places with abundant and frequent deposition of resources, as observed in the pastures used for livestock production [72,73].
5. Conclusions
The parameters evaluated for the dung beetle communities in the four land use systems presented differences only in relation to species richness and biomass between the forest and soybean systems. This fact indicates that managements that include forest systems are less impacting for this group of insects, seeing that the current world scenario tends towards environmental degradation and fragmentation; therefore, studies like the present one are needed to evaluate the impacts of these processes on animal communities.
The use of bioindicator species, such as members of the Scarabaeidae family, is an important diagnostic tool, with a separation between closed (forest and rubber tree) and open (pasture and soybean crops) systems, indicating that forest coverage is an important parameter for the separation of communities that occur in each SUT. Forest cover influences a few environmental factors, such as solar incidence, temperature, and humidity, which can directly or indirectly influence the food resources used by beetles, and consequently their community.
In summary, our findings indicate the important role of environmnental variables in determining the dung beetle community [62], since there are varied responses for multiple taxonomic groups, as well as local factors [22,25,52]. In addition, it was possible to verify the importance of systems other than natural ones, as they have been shown hosting a similar community of dung beetles in relation to natural environments. Thus, local variables (basal area, density of vegetation, fractal dimension, soil resistance at 2.5 cm, plant litter and soil moisture), together with landscape variables (pasture and savanna formation), proved to be a main predictor of the diversity of dung beetles in the studied land use systems.
Author Contributions
Conceptualization, V.K. and J.F.M.; methodology, V.K.; software, V.K.. and H.L.M.,; validation, V.K., H.L.M., and J.F.M.; formal analysis, V.K. and J.F.M.; investigation, P.G.P., H.L.M., A.L.F. and G.S.B.; resources, V.K. and J.F.M.; data curation, P.G.P.; writing—original draft preparation, P.G.P., H.L.M, A.L.F. G.S.B.; writing—review and editing, P.G.P., A.L.F. and G.S.B.; visualization, G.S.B.; supervision, J.F.M and V.K.; project administration, J.F.M. and V.K.; funding acquisition, V.K. All authors have read and agreed to the published version of the manuscript.
Funding
This research was funded by FAPEMIG.
Data Availability Statement
The authors will provide copies of the obtained data upon reasonable request directed at the corresponding author.
AI Statement
The authors use AI for translation and grammatical correction for enhances efficiency and accessibility in multilingual communication.
Acknowledgments
The authors thank Mr. Elias Murakami (Japa ‘ nese) from Sodoma for his support at all times, especially during the collections.
Conflicts of Interest
The authors declare no conflicts of interest.
Abbreviations
The following abbreviations are used in this manuscript:
| dbRDA | Distance-Based Redundancy Analysis |
| distLM | Distance-Based Linear Models |
| g | gram |
| PCO | Ordering of Main Components |
| SUTs | Land Use Systems |
| v/v | volume/volume |
References
- Kim, D.; Sexton, J.O.; Townshend, Jr. Accelerated deforestation in the humid tropics from the 1990s to the 2000s. Geophysical Research Letters 2015, 42, 3495–3501. [Google Scholar] [CrossRef] [PubMed]
- Silva, P.G.; Hernández, M.I.M. Spatial variation of dung beetle assemblages associated with forest structure in remnants of southern Brazilian Atlantic Forest. Rev Bras Entomol 2016, 60, 73–81. [Google Scholar] [CrossRef]
- Pei, S.; et al. Anthropogenic land consolidation intensifies zoonotic host diversity loss and disease transmission in human habitats. Nature Ecology & Evolution 2024, 9, 99–110. [Google Scholar] [CrossRef]
- Davies-Colley, R.J. Payne, G. W.; Van-Elswijk, M. Microclimate gradients across a forest edge. New Zealand Journal of Ecology 2000, 24, 111–121. [Google Scholar]
- Redding, T.E.; Hope, G.D.; Fortin, M.J.; Schmidt, M.G.; Bailey, W.G. Spatial patterns of soil temperature and moisture across subalpine forest-clearcut edges in the southern interior of British Columbia. Canadian Journal of Soil Science 2003, 83, 121–130. [Google Scholar] [CrossRef]
- Haddad, N.M.; et al. Habitat fragmentation and its lasting impact on Earth’s ecosystems. Science Advances 2015, e1500052. [Google Scholar] [CrossRef]
- Liu, J.; Maxwelll, M.; Hu, G.; Liu, J.; Wu, J.; Yu, M. How does habitat fragmentation affect the biodiversity and ecosystem functioning relationship? Landscape Ecology 2018, 33, 341–352. [Google Scholar] [CrossRef]
- Bitencourt, B.S. ; Forest Complexity Drives Dung Beetle Assemblages along an Edge-interior Gradient in the Southwest Amazon Rainforest”. Ecological Entomology 2020, 45, 259–68. [Google Scholar] [CrossRef]
- Desrochers, A.; Fortin, M.J. Understanding avian responses to forest boundaries: a case study with chickadee winter flocks. Oikos 2000, 91, 376–384. [Google Scholar] [CrossRef]
- Gardner, T.A.; Hernández, M.I.M.; Barlow, J.; Peres, C.A. Understanding the biodiversity consequences of habitat change: the value of secondary and plantation forests for neotropical dung beetles. Journal of Applied Ecology 2008, 45, 883–893. [Google Scholar] [CrossRef]
- Korasaki, V.; Lopes, J.; Brown, G.G.; Louzada, J. Using dung beetles to evaluate the effects of urbanization on Atlantic Forest biodiversity. Insect Science 2013, 20, 393–406. [Google Scholar] [CrossRef] [PubMed]
- Davis, A.L.V. Scholtz, C. H.Dung beetle conservation biogeography in southern Africa: current challenges and potential effects of climatic change. Biodiversity and Conservation 2020, 29, 667–693. [Google Scholar] [CrossRef]
- Klink, C.A.; Machado, R.B. Conservation of the brazilian Cerrado. Conservation Biology 2005, 19, 707–713. [Google Scholar] [CrossRef]
- MapBiomas, Coleção 9.0. Série Anual de Mapas de Cobertura e Uso da Terra do Brasil. 2025. Access: https://brasil.mapbiomas.org/infograficos/.
- Ab’saber, A.N. O domínio dos cerrados: introdução ao conhecimento. Ed. Fundação Centro de Formação do Servidor Público. 3, 4, 41-55, 1983.
- Myers, N.; Mittermeier, R.A.; Mittermeier, C.G.; Fonseca, G.; Kent, J. Biodiversity hotspots for conservation priorities. Nature 2000, 403, 853–858. [CrossRef]
- Overbeck, G. E.; et al. Conservation in Brazil needs to include non-forest ecosystems. Diversity and Distributions 2015, 21, 1455–1460. [Google Scholar] [CrossRef]
- Correa, C. M. A.; Lara, M. A.; Puker, A. Cerrado vegetation conversion into exotic pastures negatively impacts flower chafer beetle assemblages in the west-central brazil. International Journal of Tropical Insect Science 2021, 41, 2459–2467. [Google Scholar] [CrossRef]
- Hernández, M.I.M.; Vaz-de-Mello, F.Z. Seasonal and spatial species richness variation of dung beetle (Coleoptera, Scarabaeidae s. str.) in the Atlantic Forest of southeastern Brazil. Revista Brasileira de Entomologia 2009, 153, 607–613. [Google Scholar] [CrossRef]
- Gries, R.; Louzada, J.; Almeida, S.; Macedo, R.; Barlow, J. Evaluating the impacts and conservation value of exotic and native tree afforestation in Cerrado grasslands using dung beetles. Insect Conservation and Diversity 2011, 5, 175–185. [Google Scholar] [CrossRef]
- Filgueiras, B.; Tabarelli, M.; Leal, I.; Vaz-De-Mello, F.Z.; Iannuzzi, L. Dung beetle persistence in human-modified landscapes: combining indicator species with anthropogenic land uses and fragmentation-related effects. Ecological Indicators 2015, 55, 65–73. [Google Scholar] [CrossRef]
- Nichols, E.; Larsen, T.; Spector, S.; Davis, A.L.; Escobar, F.; Favila, M.; Vulinec, K. Global dung beetle response to tropical forest modification and fragmentation: a quantitative literature review and meta-analysis. Biological Conservation 2007, 137, 1–19. [Google Scholar] [CrossRef]
- Gómez-Cifuentes, A.; Munevar, A.; Gimenez, V.C.; Gatti, M.G.; Zurita, G.A. Influence of land use on the taxonomic and functional diversity of dung beetles (Coleoptera: Scarabaeinae) in the southern Atlantic Forest of Argentina. Journal of Insect Conservation 2017, 21, 147–156. [Google Scholar] [CrossRef]
- Parmar, T.K.; Rawtani, D.; Agrawal, Y.K. Bioindicators: the natural indicator of environmental pollution. Frontiers in Life Science 2016, 9, 110–118. [Google Scholar] [CrossRef]
- Nichols, E.; Spector, S.; Louzada, J.; Larsen, T.; Amezquitad, S.; Favila, M.E. Ecological functions and ecosystem services provided by Scarabaeinae dung beetles. Biological Conservation 2008, 141, 1461–1474. [Google Scholar] [CrossRef]
- Nichols, E. ; Gardner, T.; Peres, C.A.; Spector, S. Co-declining mammals and dung beetles: an impending ecological cascade. Oikos 2009, 118, 481–487. [CrossRef]
- Braga, R.F.; Korasaki, V.; Audino, L.D.; Louzada, J. Are dung beetles driving dung-fly abundance in traditional agricultural areas in the amazon? Ecosystems 2012, 15, 1173–1181. [Google Scholar] [CrossRef]
- Braga, R.F.; Korasaki, V.; Andresen, E.; Louzada, J. Dung Beetle Community and Functions along a Habitat-Disturbance Gradient in the Amazon: A Rapid Assessment of Ecological Functions Associated to Biodiversity. PLoS ONE 2013, 8, e57786. [Google Scholar] [CrossRef]
- Vaz-de-Mello, F.Z. Estado actual de conhecimento dos Scarabaeidae s. str. (Coleoptera: Scarabaeoidea) do Brasil. Proyecto Iberoamericano de Biogeografía y Entomología Sistemática : PRIBES 2000 : trabajos del 1er taller iberoamericano de entomología sitemáica. 2000, ISBN 84-922495-1-X, 183-195.
- Marsh, C.J.; Louzada, J.; Beiroz, W.; Ewers, R.M. Optimizing Bait for Pitfall Trapping of Amazonian Dung Beetles (Coleoptera: Scarabaeinae). Plos One 2013, 8, e73147. [Google Scholar] [CrossRef]
- IBGE – Brazilian Institute of Geography and Statistics. Cidades. Access: https://www.ibge.gov.br/cidades-e-estados/mg/frutal.
- Álvares, C.A.; Stape, J.L.; Sentelhas, P.C.; Gonçalves JL d, M.; Sparovek, G. Köppen’s climate classification map for brazil. Meteorologische Zeitschrift 2013, 22, 711–728. [Google Scholar] [CrossRef]
- Silva, J.L.; Silva, R.J.; Fernandes, I.M.; Sousa, W.O.; Vaz-De-Mello, F.Z. Species composition and community structure of dung beetles (Coleoptera: Scarabaeidae: Scarabaeinae) compared among savanna and forest formations in the southwestern Brazilian Cerrado. Zoologia 2020, 37, 1–12. [Google Scholar] [CrossRef]
- Nobis, M. “SideLook 1.1-Imaging software for the analysis of vegetation structure with true-colour photographs.” http://www. appleco. ch/ (2005).
- Mitchell, K. Quantitative analysis by the point-centered quarter method. arXiv 2010, arXiv:1010.3303. [Google Scholar]
- Hijbeek, R.; Koedam, N.; Khan, M.N.I.; Kairo, J.G.; Schoukens, J.; Dahdouh-Guebas, F. An evaluation of plotless sampling using vegetation simulations and field data from a mangrove forest. PLoS ONE 2013, 8, e67201. [Google Scholar] [CrossRef] [PubMed]
- ESRI - Environmental Systems Research Institute. “Topographic”. Base map collection. 19 de fevereiro de 2020. Access: http://www.arcgis.com/home/.
- R Core Team. 2020. R: A language and environment for statistical computing. Vienna, Austria: R Foundation for Statistical Computing. Retrieved from https://www.R-project.
- Anderson, M.J.; Ellingsen, K.; McArdle, B.H. Multivariate dispersion as a measure of beta diversity. Ecology Letters 2006, 9, 683–693. [Google Scholar] [CrossRef] [PubMed]
- Anderson, M.J. A new method for non-parametric multivariate analysis of variance. Austral Ecology 2001, 26, 32–46. [Google Scholar] [CrossRef]
- Clarke, K.R.; Gorley, R.N. PRIMER v6: User Manual/Tutorial (Plymouth Routines in Multivariate Ecological Research). PRIMER-E, Plymouth. 2006.
- McCune, B.; Mefford, M.J. PC-ORD Multivariate Analysis of Ecological Data. Version 4. MjM Software Design, Gleneden Beach, Oregon, USA. 1999.
- Dufrêne, M.; Legendre, P. Species Assemblages and Indicator Species: The Need for a Flexible Asymmetrical Approach. Ecological Monographs 1977, 67, 345–366. [Google Scholar] [CrossRef]
- McGeoch, M.A.; Rensburg, B.J.V.; Botes, A. The verification and application of bioindicators: a case study of dung beetles in a savanna ecosystem. Journal of Applied Ecology 2002, 39, 661–672. [Google Scholar] [CrossRef]
- Verdú, J.R.; Numa, C.; Hernández-Cuba, O. The influence of landscape structure on ants and dung beetles diversity in a mediterranean savanna—forest ecosystem. Ecological Indicators 2011, 11, 831–839. [Google Scholar] [CrossRef]
- Legendre, P.; Anderson, M.J. Distance-based redundancy analysis: testing multispecies responses in multifactorial ecological experiments. Ecological Monographs 1999, 69, 1–24. [Google Scholar] [CrossRef]
- Anderson, M.J.; Gorley, R.N.; Clarke, K.R. PERMANOVA+ for PRIMER: guide to software and statistical methods. PRIMER-E Ltd, Plymouth Marine Laboratory, Plymouth, UK. 214. 2008.
- Chao, A.; Jost, L. Coverage-based rarefaction and extrapolation: standardizing samples by completeness rather than size. Ecology 2012, 93, 2533–2547. [Google Scholar] [CrossRef]
- Sánchez-de-Jesús, H.A.; Arroyo-Rodríguez, V.; Andresen, E.; Escobar, F. Forest loss and matrix composition are the major drivers shaping dung beetle assemblages in a fragmented rainforest. Landscape Ecology 2015, 31, 843–854. [Google Scholar] [CrossRef]
- Hernández, M.I.M.; Barreto, P.S.C.S.; Costa, V.H.; Creão-Duarte, A.J.; Favila, M.E. Response of a dung beetle assemblage along a reforestation gradient in restinga forest. Journal of Insect Conservation 2014, 18, 539–546. [Google Scholar] [CrossRef]
- Verdú, J.R.; Galante, E. Behavioural and morphological adaptations for a low-quality resource in semi-arid environments: dung beetles (Coleoptera, Scarabaeoidea) associated with the european rabbit (Oryctolagus cuniculusl. ). Journal of Natural History 2004, 38, 705–715. [Google Scholar] [CrossRef]
- Righi, C.A.; Sandoval-Rodríguez, C.; Ferreira, E.N.L.; Godoy, W.A.C.; Cognato, A.I. Microclimatic conditions for dung beetle (Coleoptera: Scarabaeidae) occurrence: land use system as a determining factor. Environmental Entomology 2018, 47, 1420–1430. [Google Scholar] [CrossRef] [PubMed]
- Costa, B. M.; Pantoja, D. L.; Sousa, H. C.; Queiroz, T. A.; Colli, G.R. Long-term, fire-induced changes in habitat structure and microclimate affect cerrado lizard communities. Biodiversity and Conservation 2019, 29, 1659–1681. [Google Scholar] [CrossRef]
- Almeida, S.S.P.; Louzada, J.; Sperber, C.F.; Barlow, J. Subtle land-use change and tropical biodiversity: dung beetle communities in cerrado grasslands and exotic pastures. Biotropica 2011, 43, 704–710. [Google Scholar] [CrossRef]
- Farias, P.M.; Arellano, L.; Hernández, M.I.M.; Ortiz, S.L. Response of the copronecrophagous beetle (Coleoptera: Scarabaeinae) assemblage to a range of soil characteristics and livestock management in a tropical landscape. Journal of Insect Conservation 2015, 19, 947–960. [Google Scholar] [CrossRef]
- Macedo, R.; Audino, L. D.; Korasaki, V.; Louzada, J. Conversion of cerrado savannas into exotic pastures: the relative importance of vegetation and food resources for dung beetle assemblages. Agriculture, Ecosystems &Amp; Environment 2020, 288, 106709. [Google Scholar] [CrossRef]
- Martello, F.; Andriolli, F.S.; Souza, T.B.; Dodonov, P.; Ribeiro, M.C. Edge and land use effects on dung beetles (coleoptera: scarabaeidae: scarabaeinae) in brazilian cerrado vegetation. Journal of Insect Conservation 2016, 20, 957–970. [Google Scholar] [CrossRef]
- Costa, C.M.Q.; Oliveira, V.H.F.; Maciel, R.; Beiroz, W.; Korasaki, V.; Louzada, J. Variegated tropical landscapes conserve diverse dung beetle communities. PeerJ 2017, 5, e3125. [Google Scholar] [CrossRef]
- Larsen, T.H.; Williams, N.M.; Kremen, C. Extinction order and altered community structure rapidly disrupt ecosystem functioning. Ecology Letters 2005, 8, 538–547. [Google Scholar] [CrossRef]
- Artuzo, F.D.; Foguesatto, C.R.; Souza, Â.R.L.; Silva, L.X. Costs management in maize and soybean production. Review of Business Management 2018, 20, 2–273. [Google Scholar] [CrossRef]
- Aleixo, A. Effects of selective logging on a bird community in the brazilian atlantic forest. The Condor 1999, 101, 537–548. [Google Scholar] [CrossRef]
- Reynolds, C.; et al. (2018) Inconsistent effects of landscape heterogeneity and land-use on animal diversity in an agricultural mosaic: a multi-scale and multi-taxon investigation. Landscape Ecology 2018, 33, 241–255. [Google Scholar] [CrossRef]
- Nunes, R.V.; Vaz-de-Mello, F. Z. New brachypterous species of Dichotomius Hope, with taxonomic notes in the subgenus Luederwaldtinia Martínez (Coleoptera: Scarabaeidae: Scarabaeinae). Zootaxa 2013, 3609, 411–420. [Google Scholar] [CrossRef] [PubMed]
- Marchiori, C.H.; Caldas, E.R.; Almeida, K. Succession of scarabaeidae on bovine dung in Itumbiara, Goiás, Brazil. Neotropical Entomology 2003, 32, 173–176. [Google Scholar] [CrossRef]
- Rodrigues, S.R.; Barros, A.T.M.; Puker, A.; Taira, T.L. Diversidade de besouros coprófagos (coleoptera, scarabaeidae) coletados com armadilha de interceptação de voo no pantanal sul-mato-grossense, brasil. Biota Neotropica 2010, 10, 123–127. [Google Scholar] [CrossRef]
- Tissiani, A.S.O.; Vaz-de-Mello, F.Z.; Campelo-Junior, J.H. Dung beetles of brazilian pastures and key to genera identification (coleoptera: scarabaeidae). Pesquisa Agropecuária Brasileira 2017, 52, 401–418. [Google Scholar] [CrossRef]
- Merritt, R.; Anderson, J. The effects of different pasture and rangeland ecosystems on the annual dynamics of insects in cattle droppings. Hilgardia 1977, 45, 31–70. [Google Scholar] [CrossRef]
- Correa, C.M.A.; Peres, N.D.; Holdbrook, R. Patterns of alimentary resource use by dung beetles in introduced brazilian pastures: cattle versus sheep dung. Entomological Science 2020, 23, 271–279. [Google Scholar] [CrossRef]
- Barretto, J.W.; Cultid-Medina, C.A.; Escobar, F. Annual abundance and population structure of two dung beetle species in a human-modified landscape. Insects 2018, 10. [Google Scholar] [CrossRef]
- Pompeo, P.N.; Oliveira-Filho, L.C.I.; Klauberg-Filho, O.; Mafra, A.L.; Baretta, C.R.D.M.; Baretta, D. Diversidade de Coleoptera (Arthropoda: Insecta) e atributos edáficos em sistemas de uso do solo no Planalto Catarinense. Scientia Agraria Paranaensis 2016, 2016. 17, 16–28. [Google Scholar] [CrossRef]
- Bogoni, J.A.; Hernández, M.I.M. Attractiveness of native mammal’s feces of different trophic guilds to dung beetles (coleoptera: scarabaeinae). Journal of Insect Science 2014, 14, 1. [Google Scholar] [CrossRef] [PubMed]
- Tixier, T.; Bloor, J.; Lumaret, J. Species-specific effects of dung beetle abundance on dung removal and leaf litter decomposition. Acta Oecologica 2015, 69, 31–34. [Google Scholar] [CrossRef]
- Louzada, J.N.C.; Silva,P.R. Utilisation of introduced Brazilian pastures ecosystems by native dung beetles: diversity patterns and resource use. Insect Conservervation and Diversity 2009, 2:45–52. [CrossRef]
Figure 1.
Profile of the sites evaluated in this study.
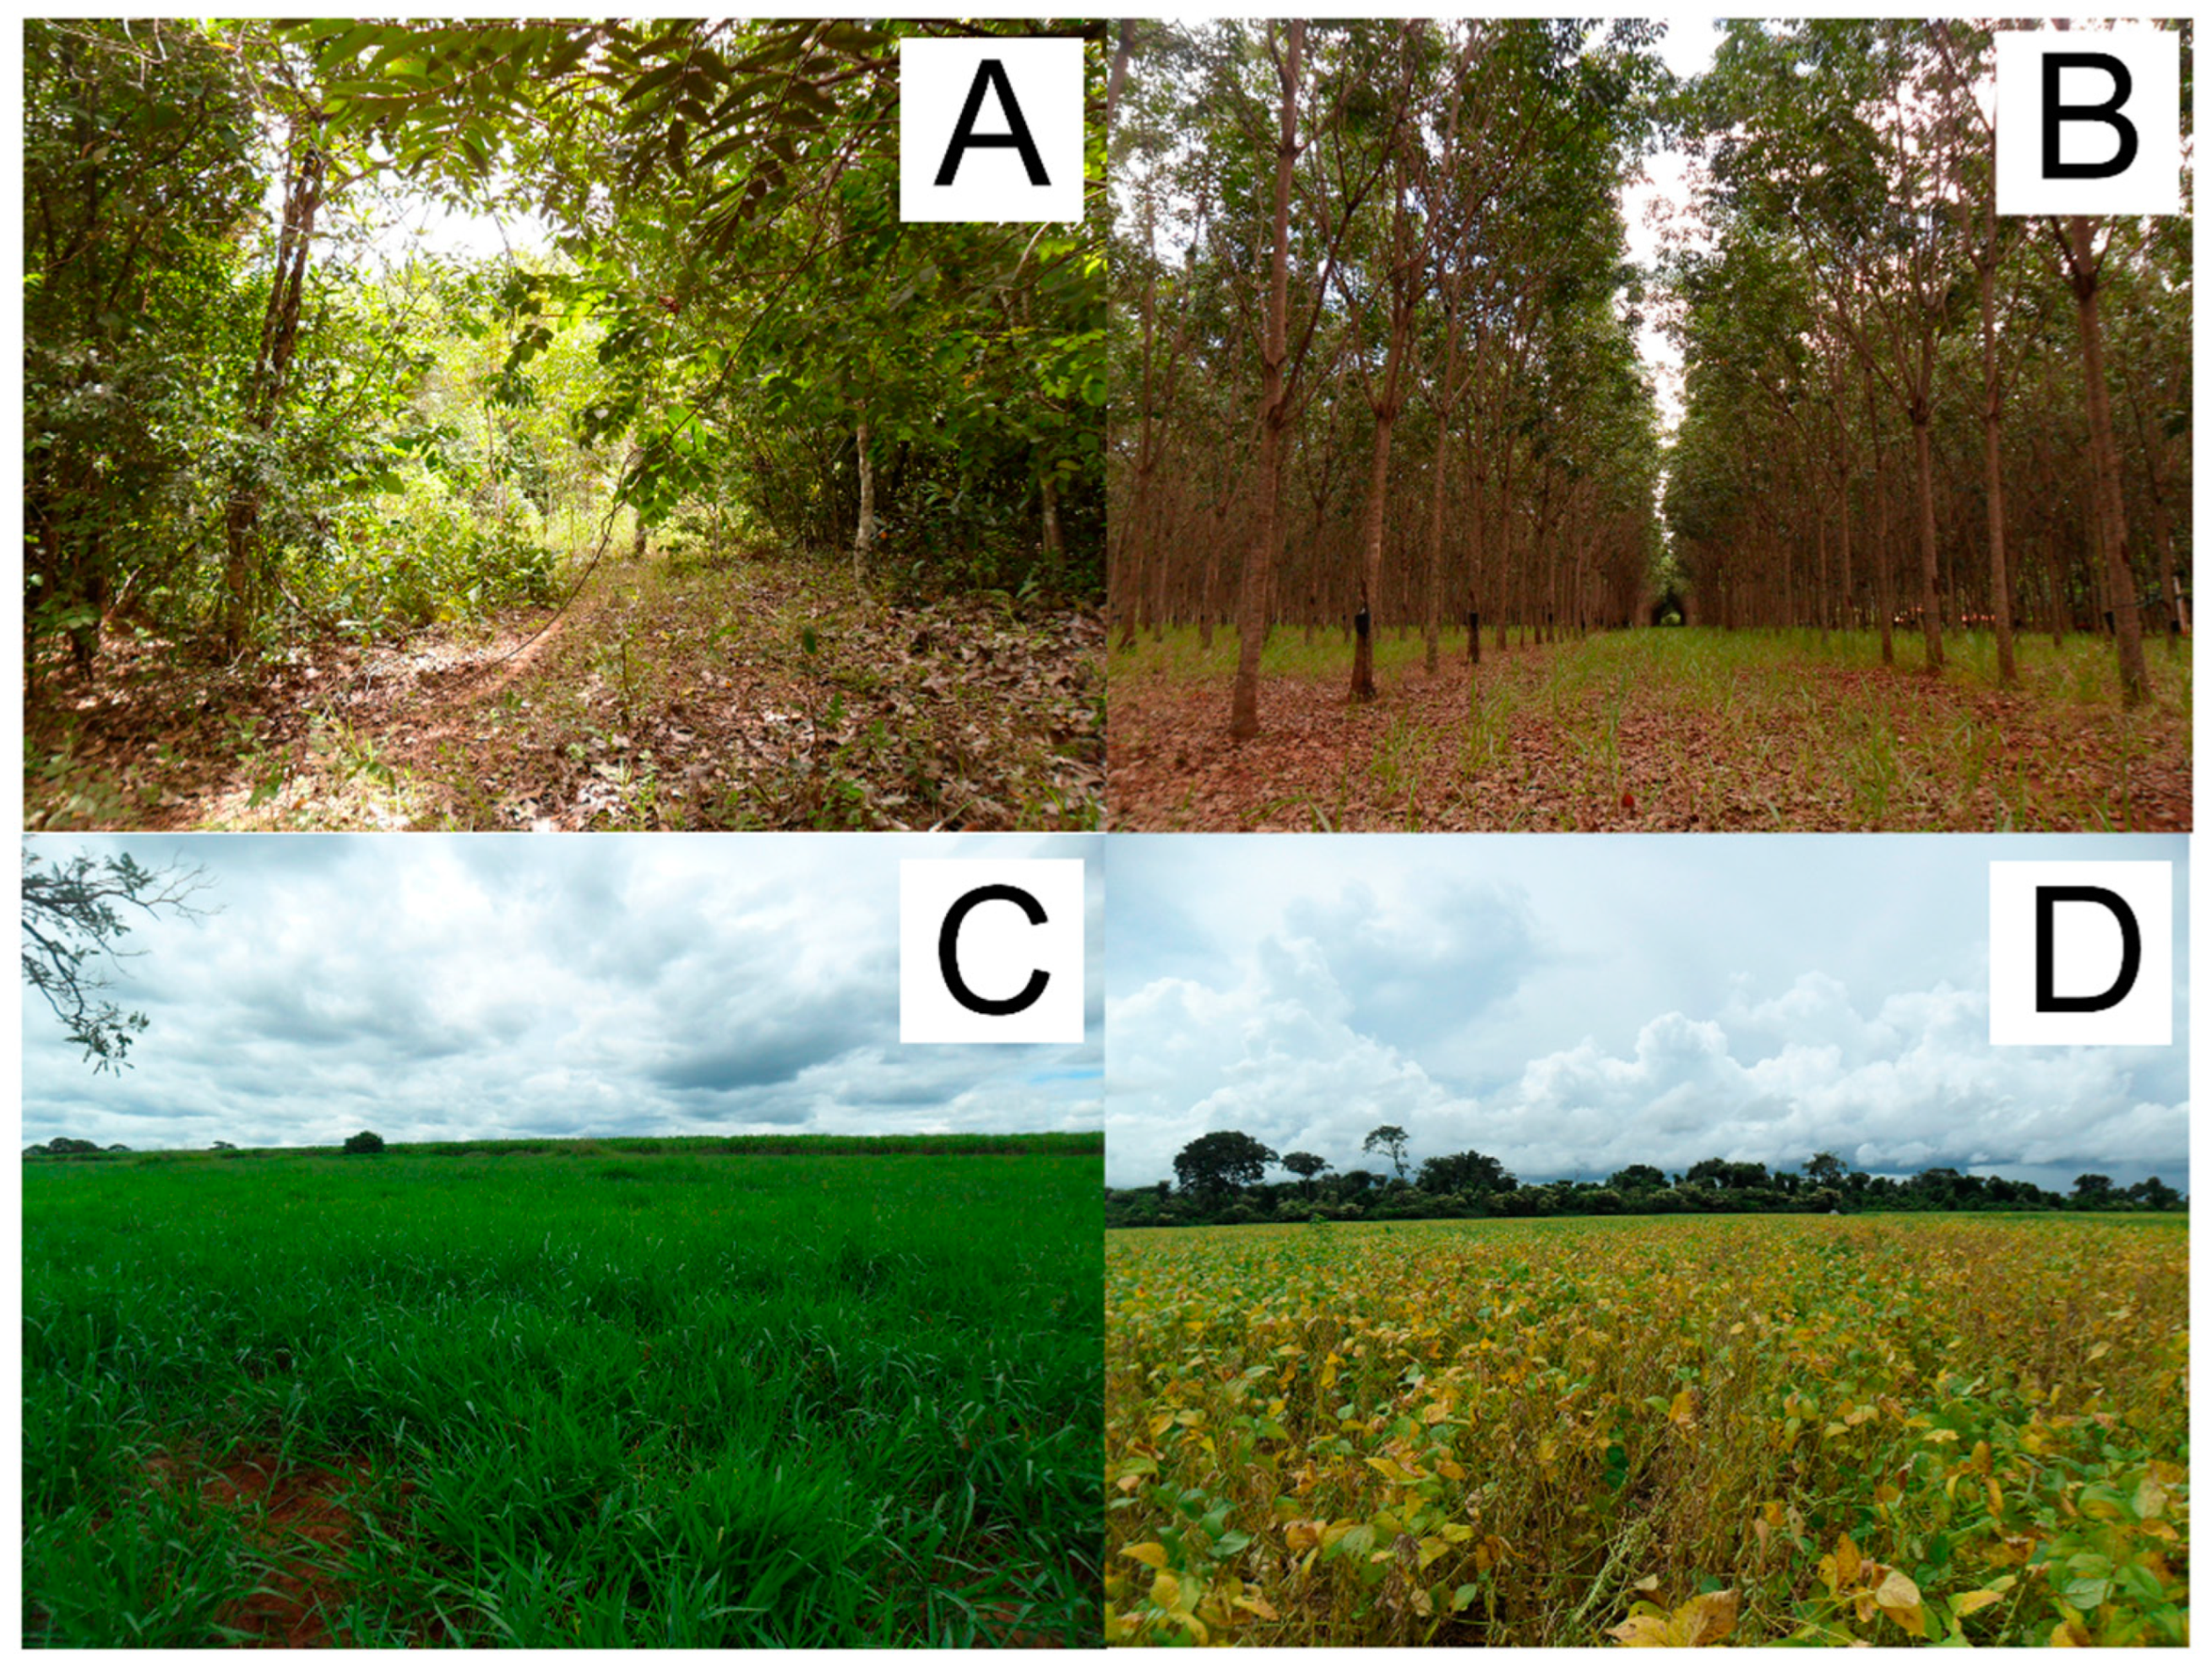
Figure 2.
Venn diagram indicating multiple occurrences of species among different land-use systems.
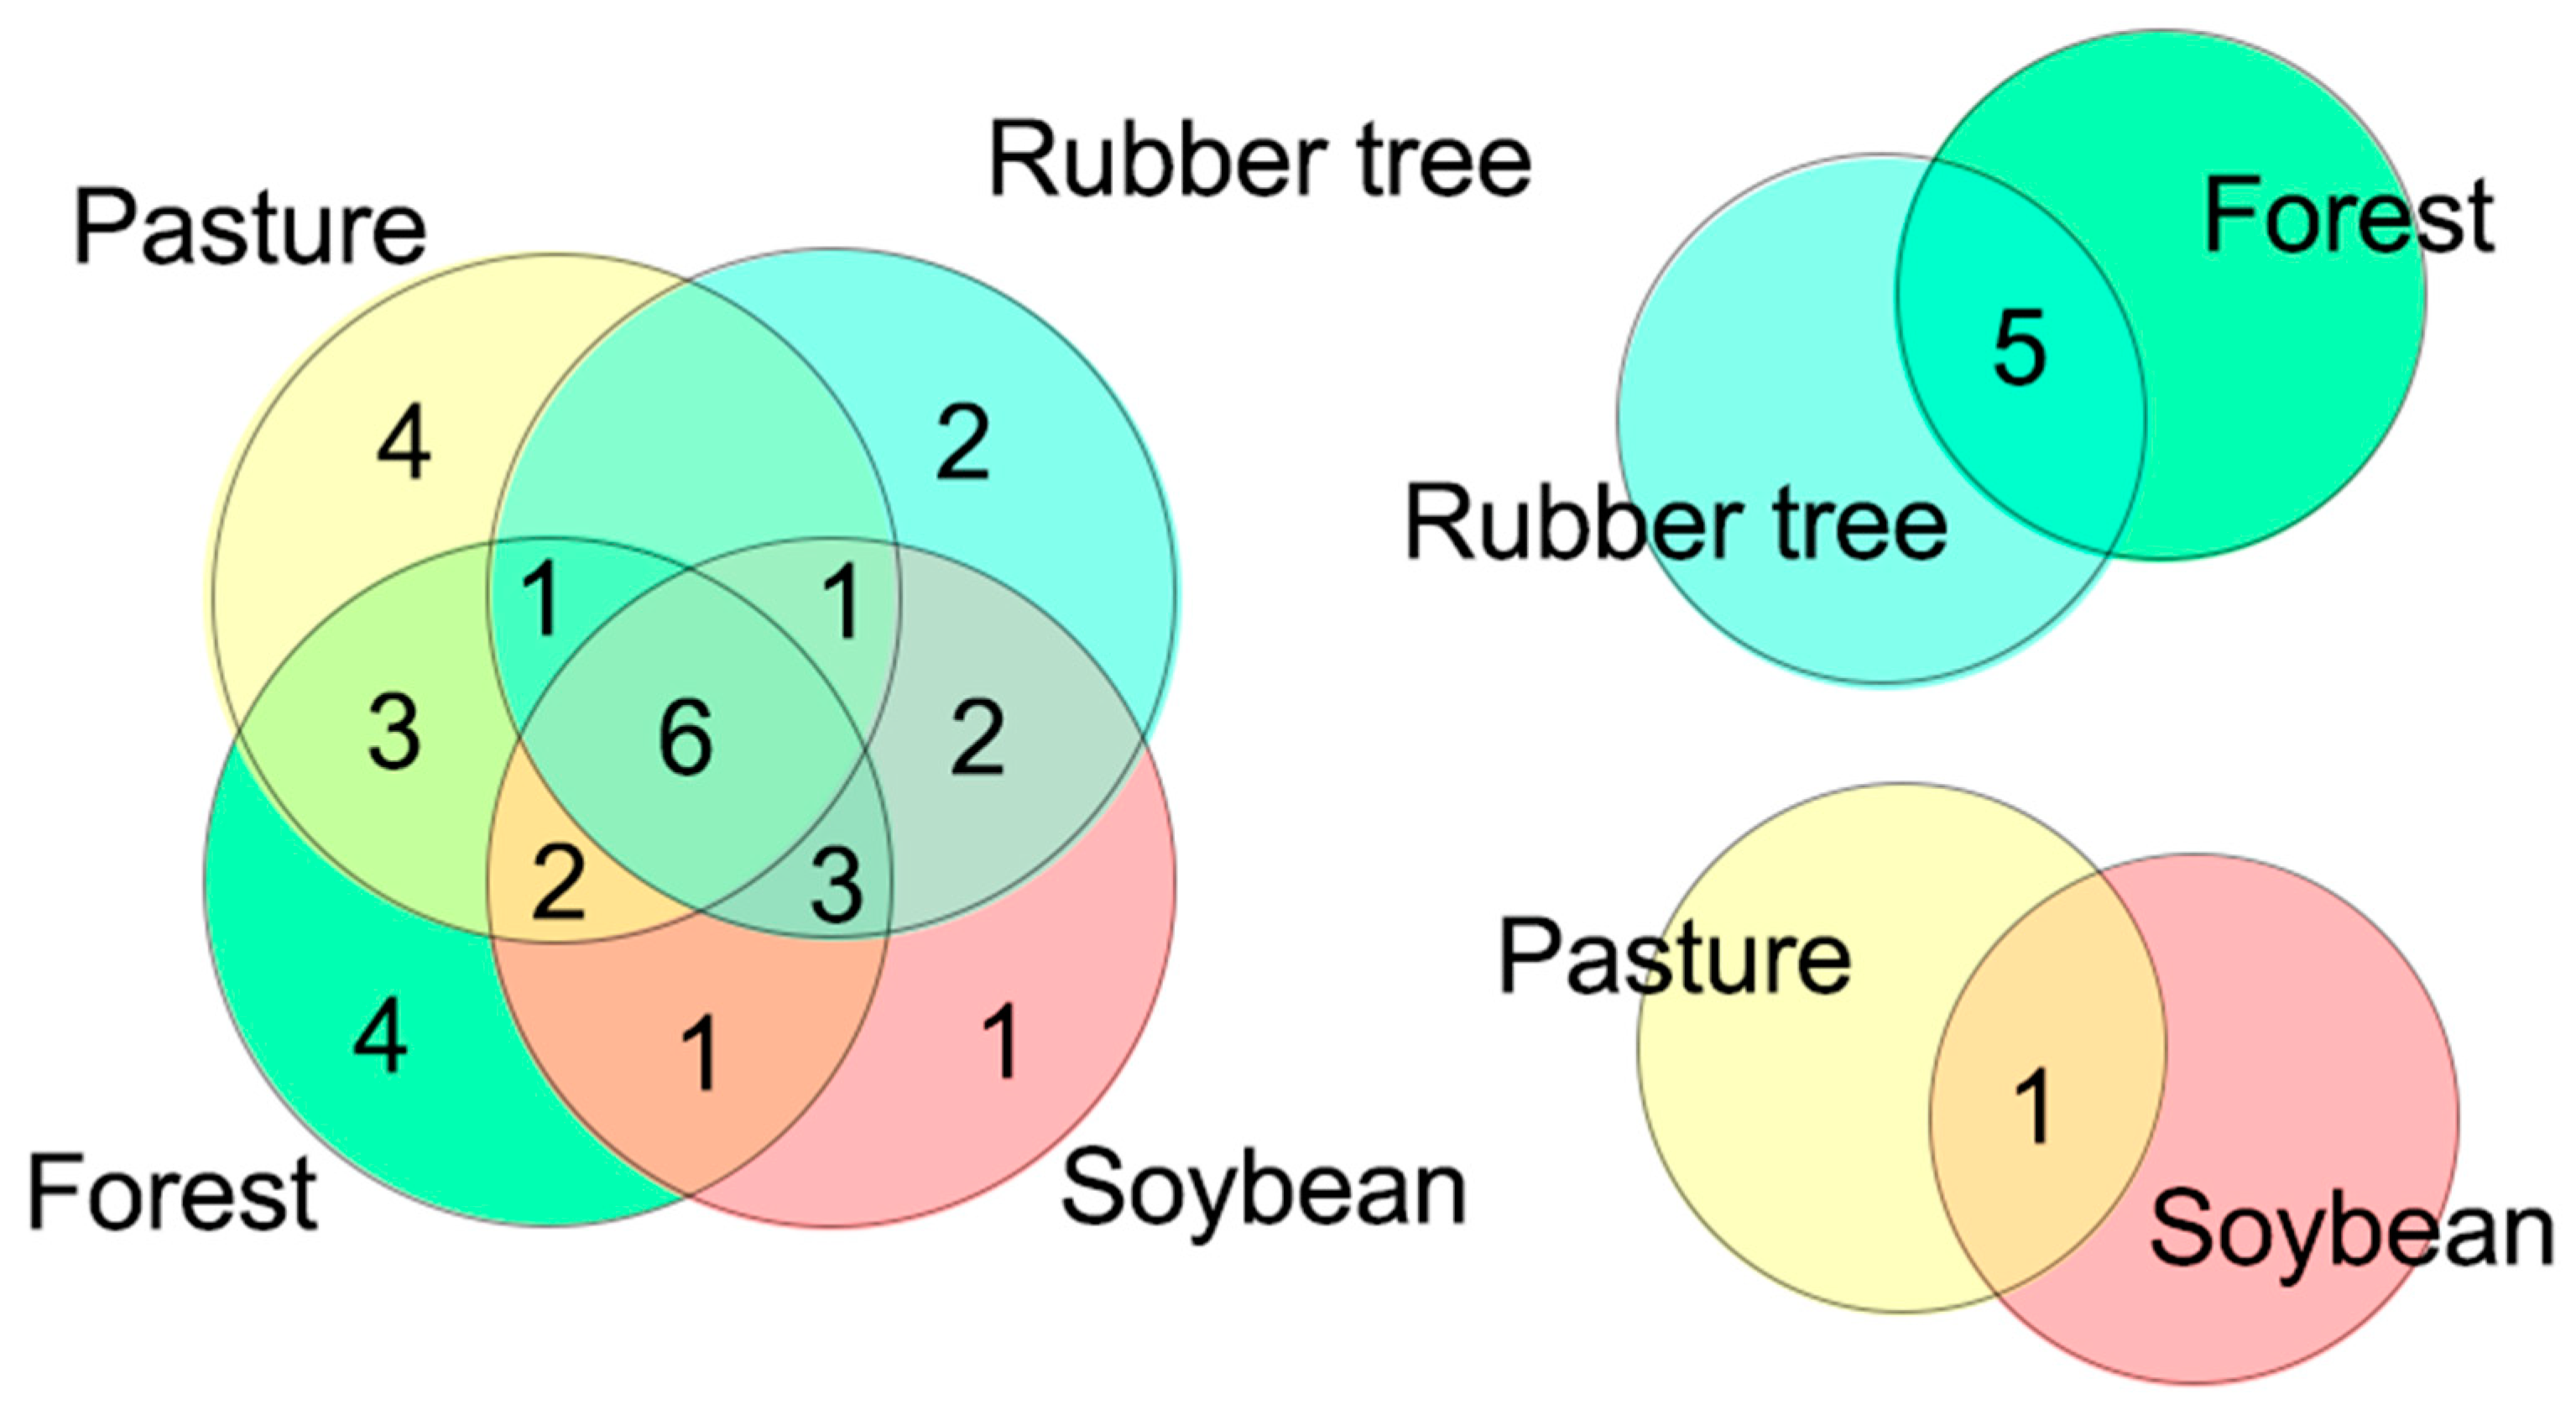
Figure 3.
Rarefaction curve based on the number of individuals collected.
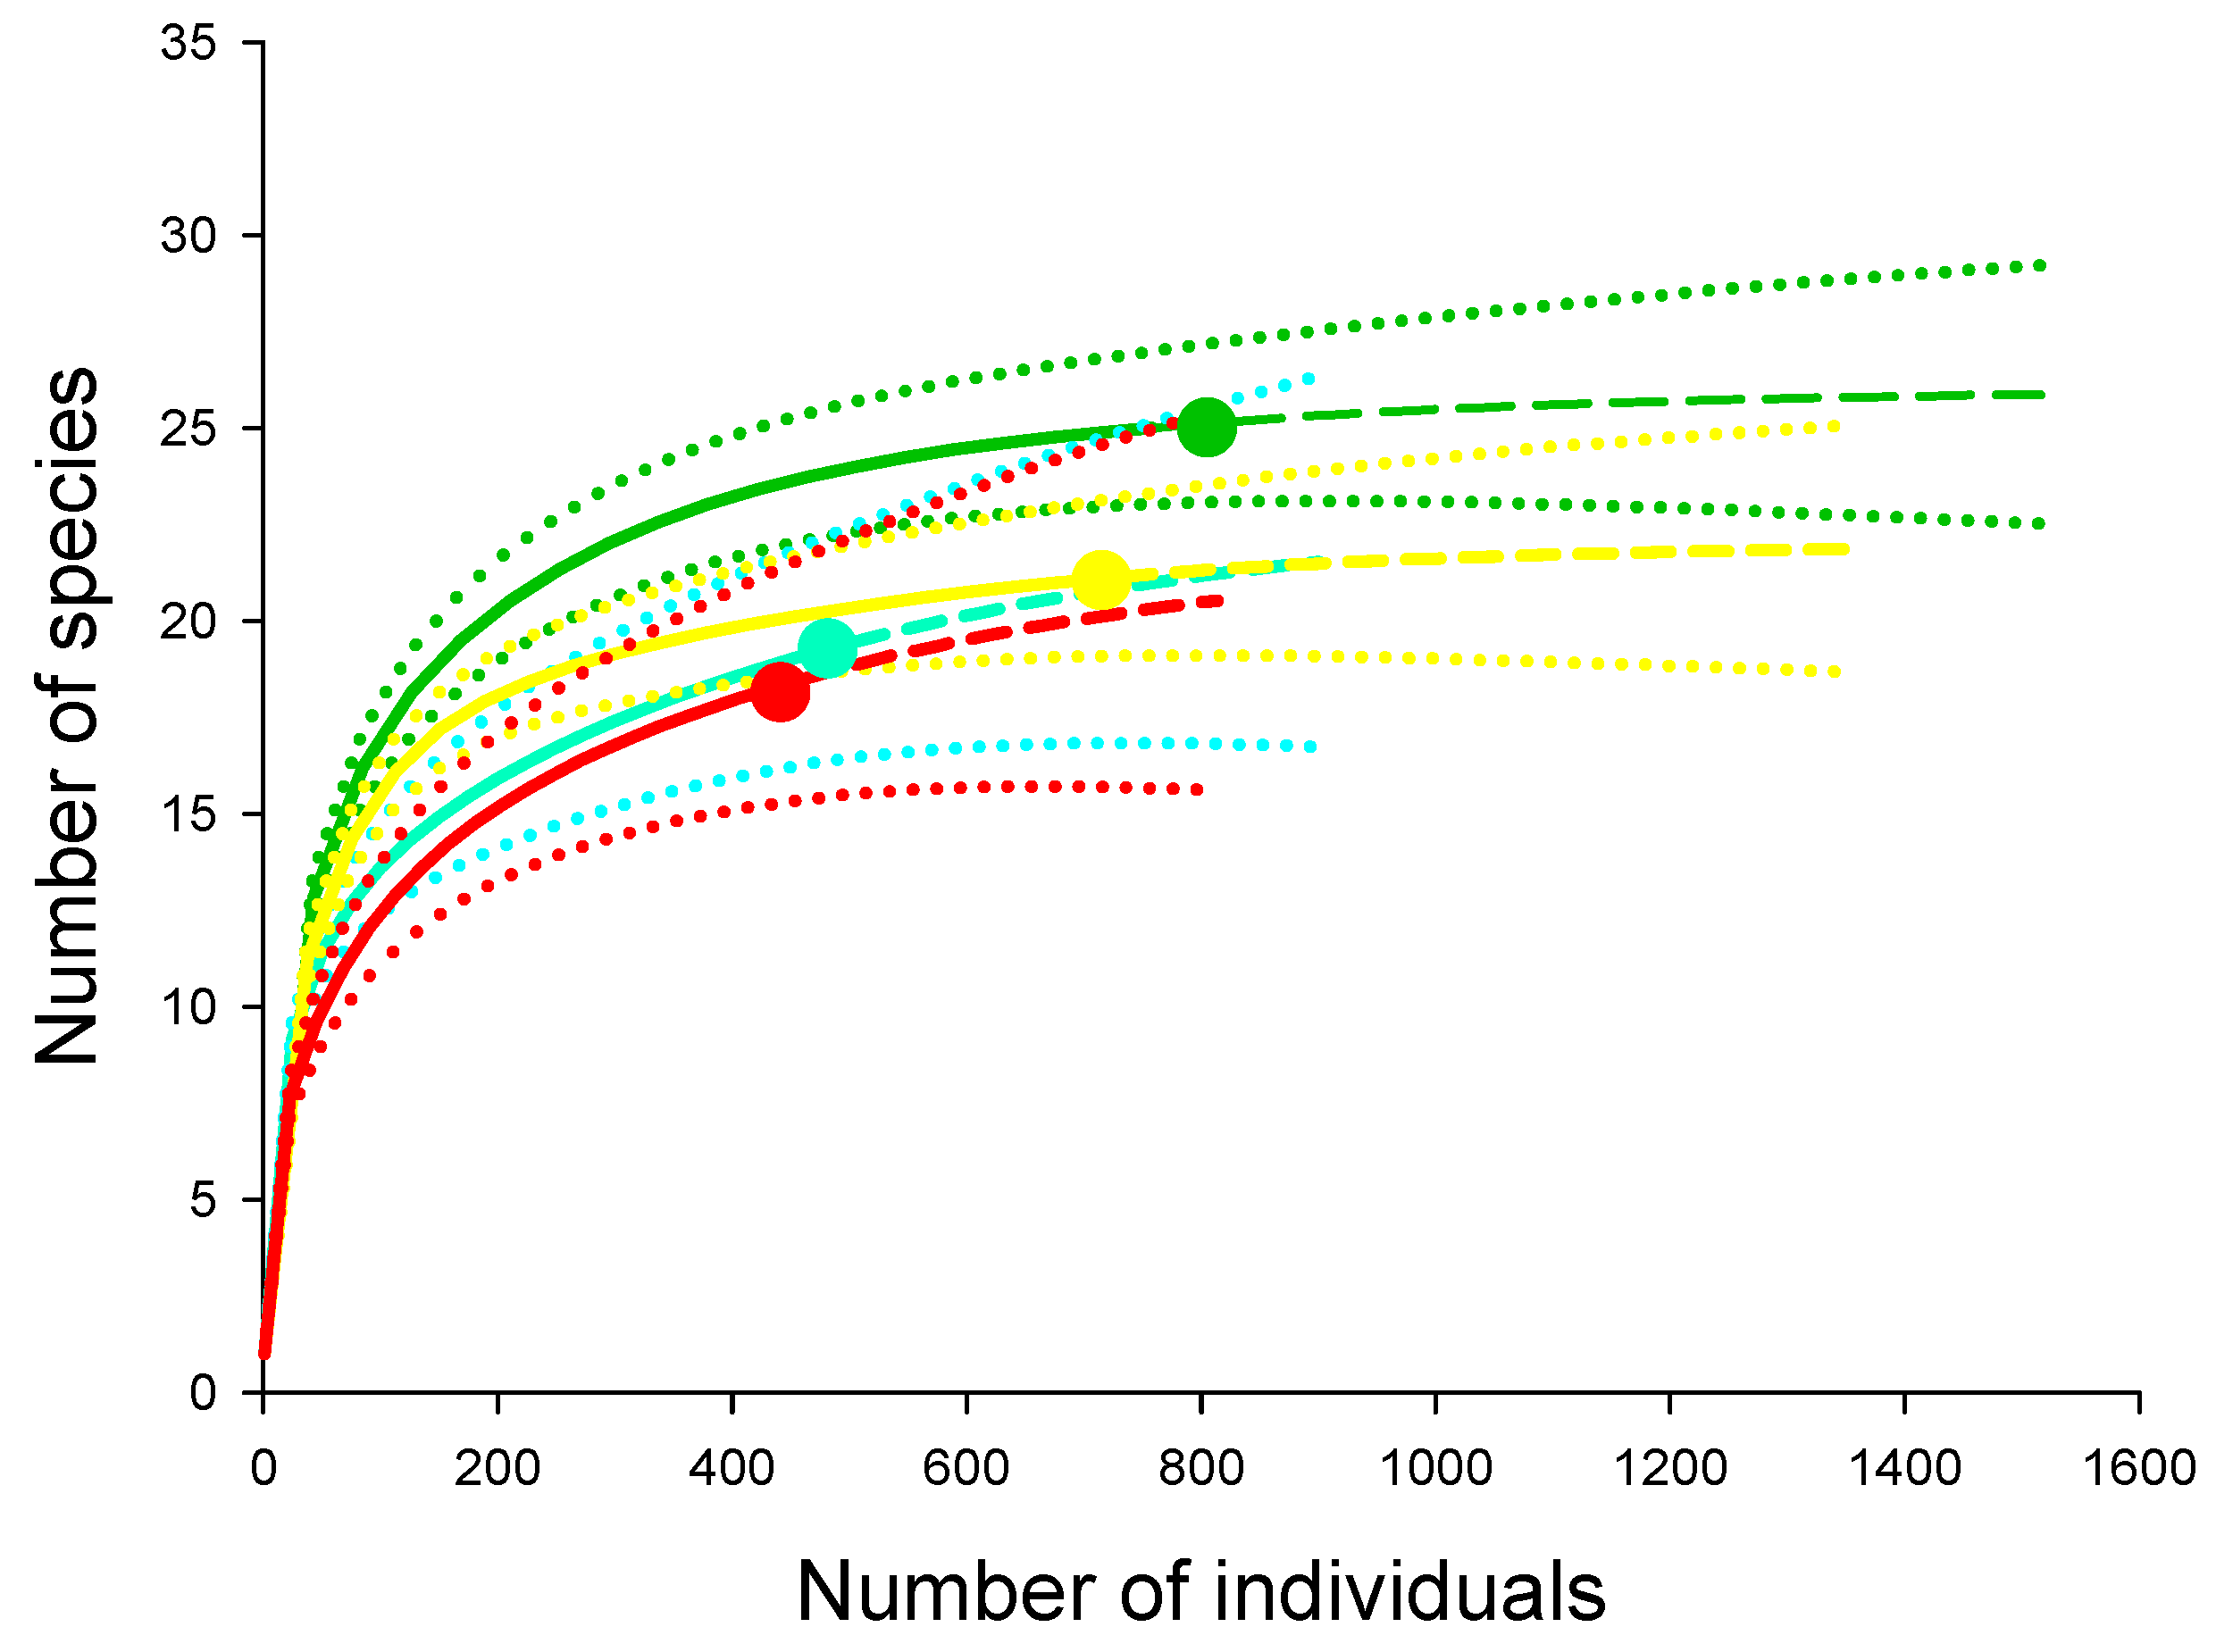
Figure 4.
Abundance (A) and biomass (B) ranking of Scarabaeinae beetles in four land-use systems, Frutal. Minas Gerais.
Figure 4.
Abundance (A) and biomass (B) ranking of Scarabaeinae beetles in four land-use systems, Frutal. Minas Gerais.
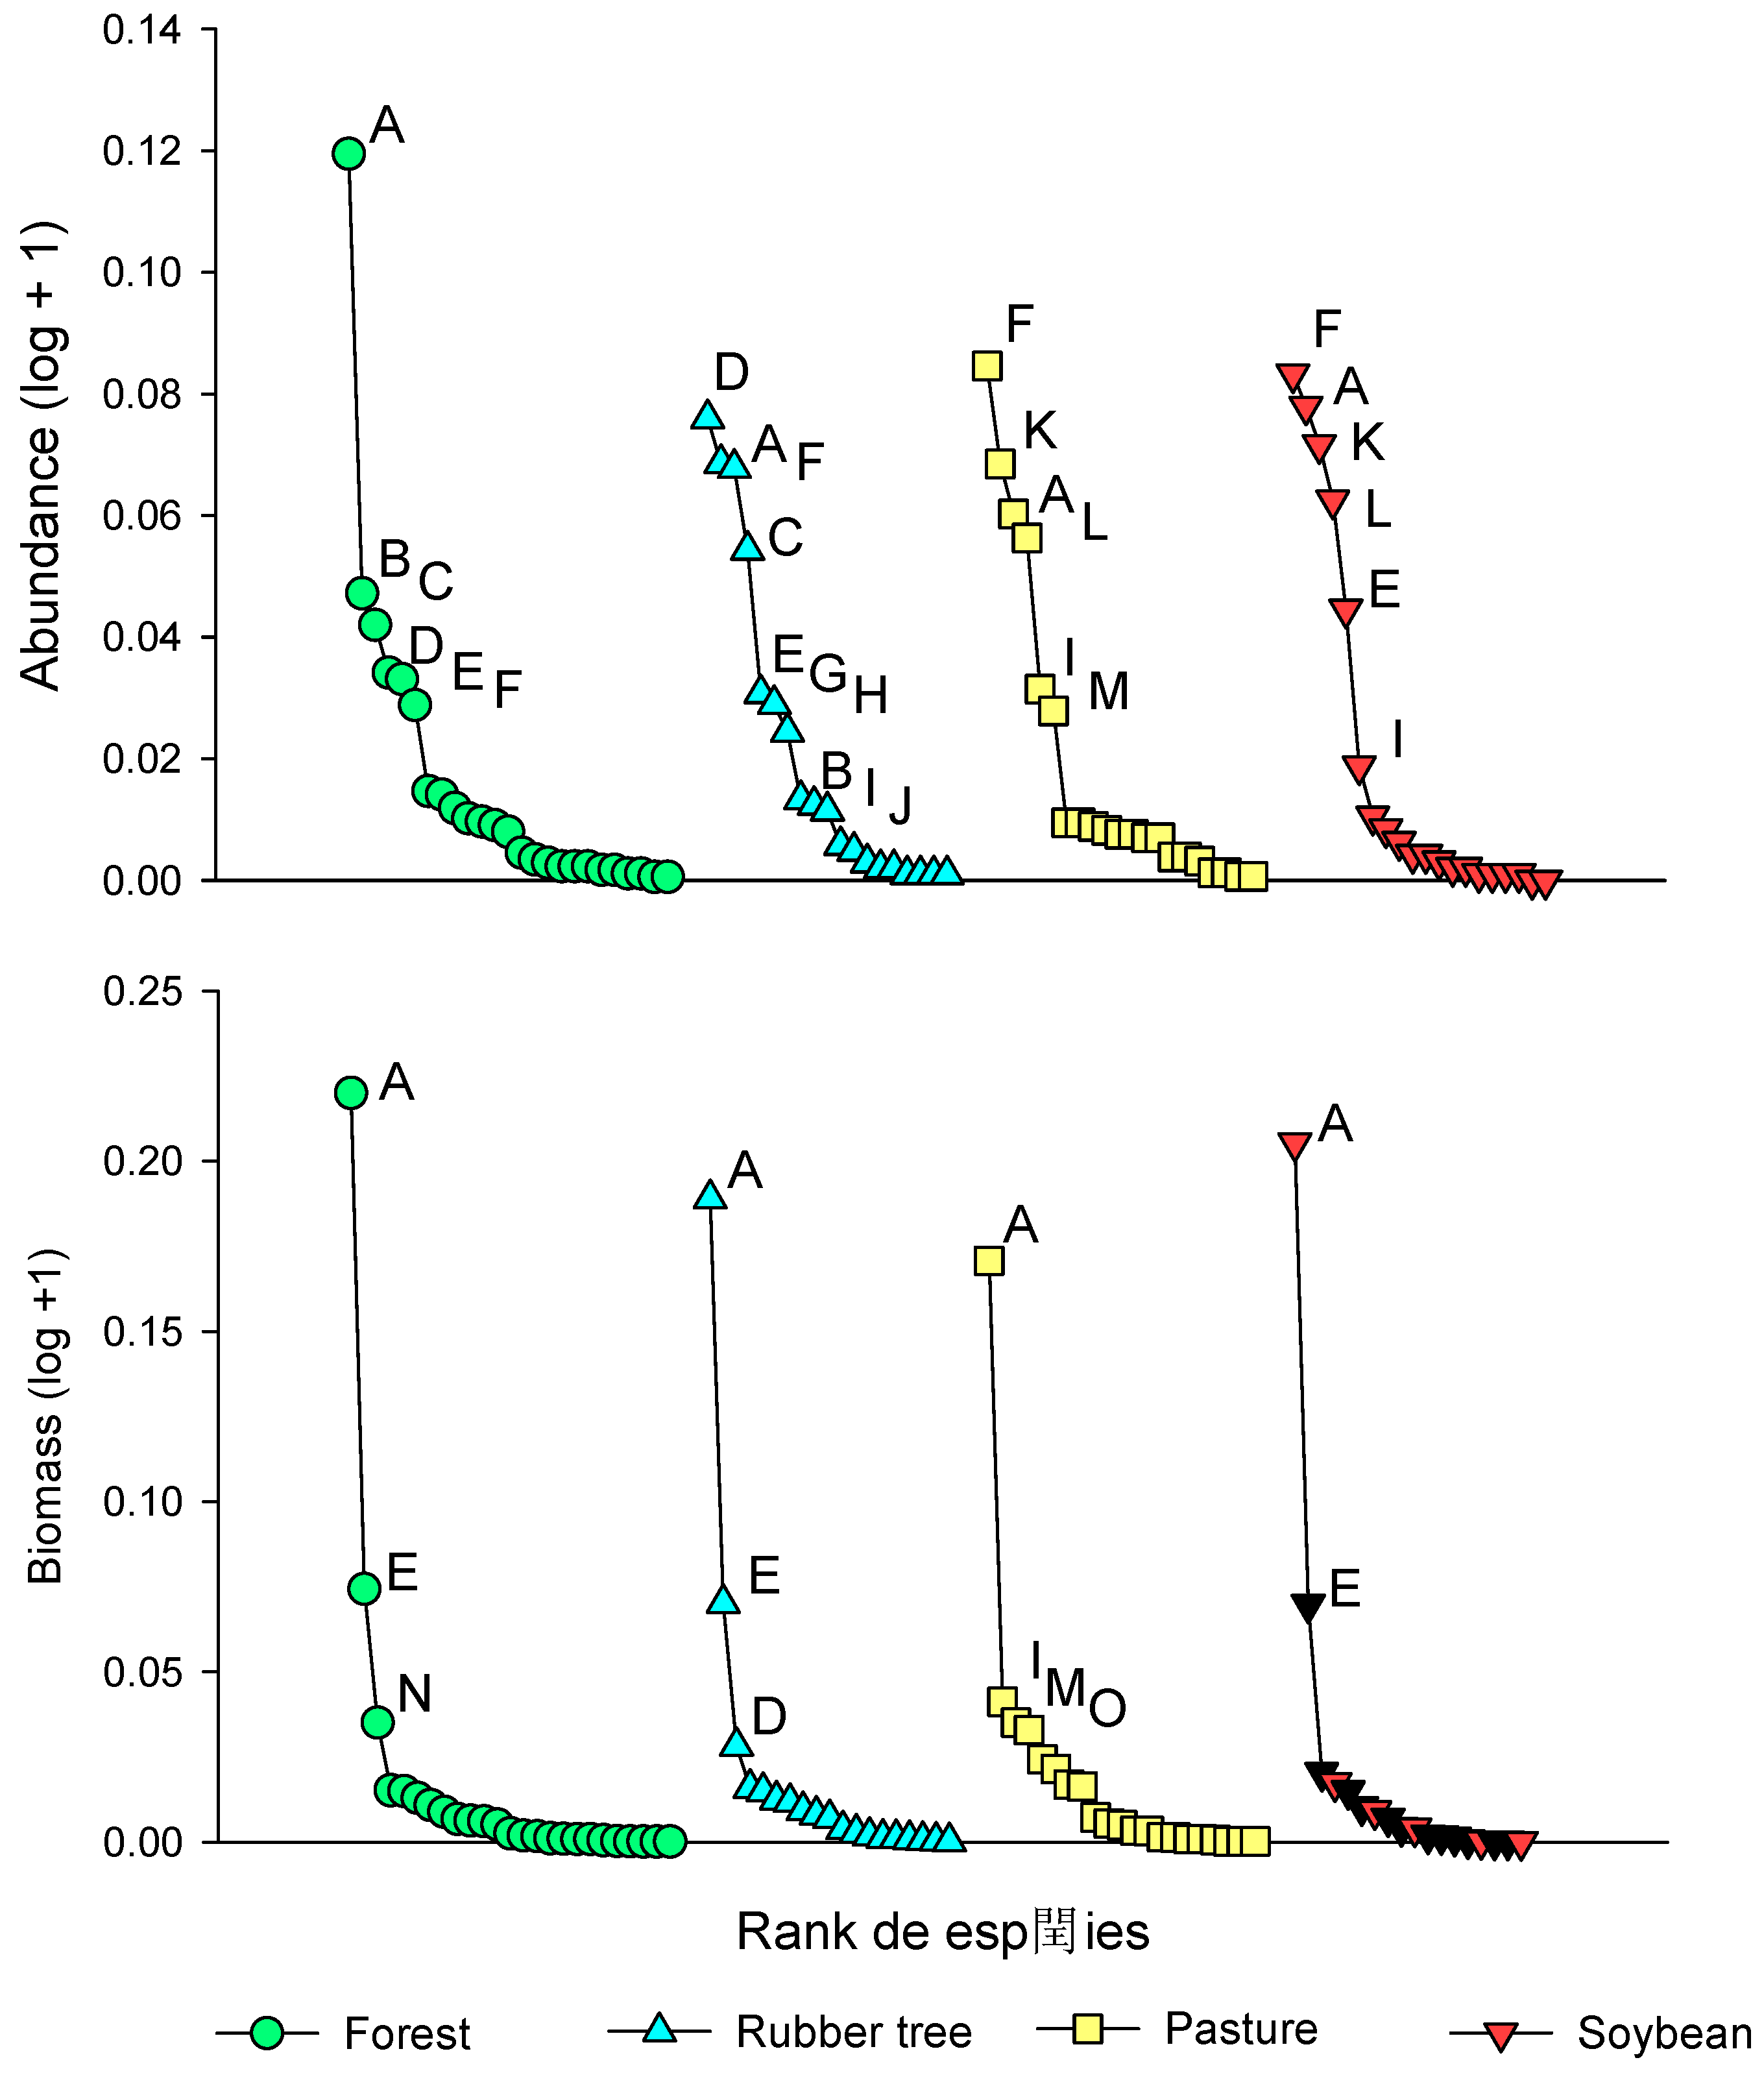
Figure 5.
Representation of community parameters in different land-use systems in Frutal, Minas Gerais. A. Abundance, B. Wealth and C. Biomass.
Figure 5.
Representation of community parameters in different land-use systems in Frutal, Minas Gerais. A. Abundance, B. Wealth and C. Biomass.
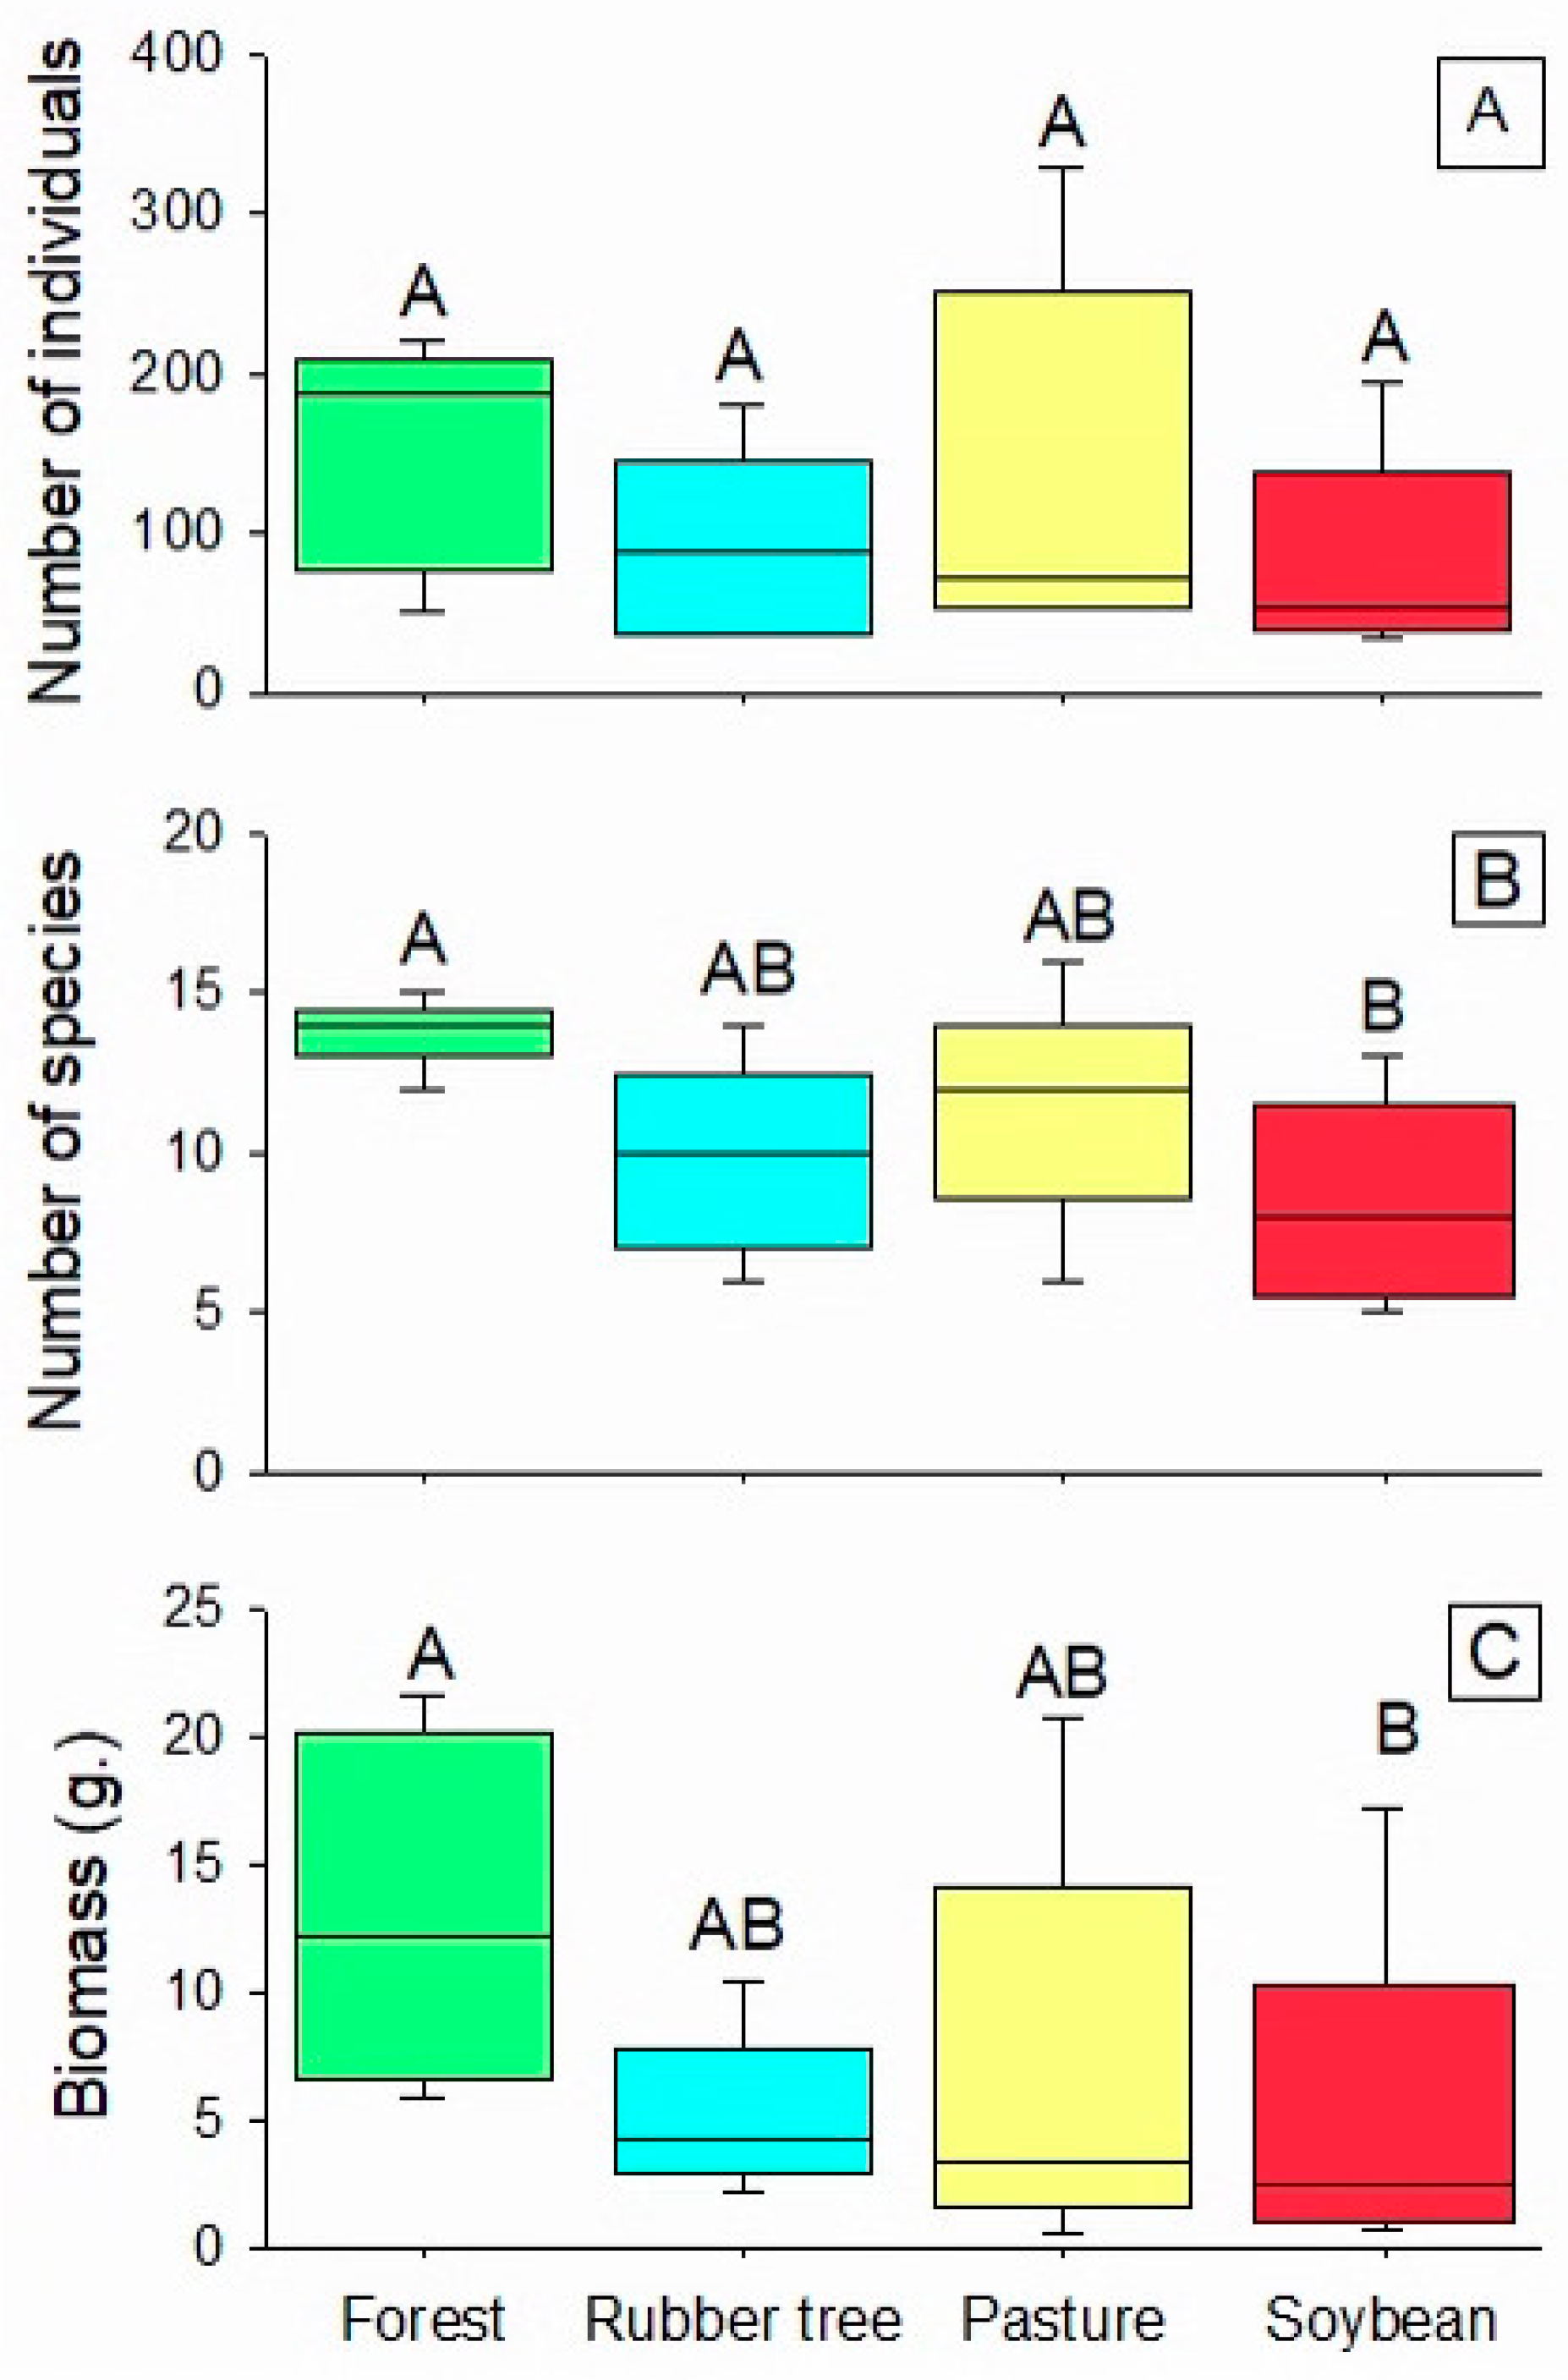
Figure 6.
Ordering of Main Components (PCO) of land use systems scaled by the composition of the beetle turtle community
Figure 6.
Ordering of Main Components (PCO) of land use systems scaled by the composition of the beetle turtle community
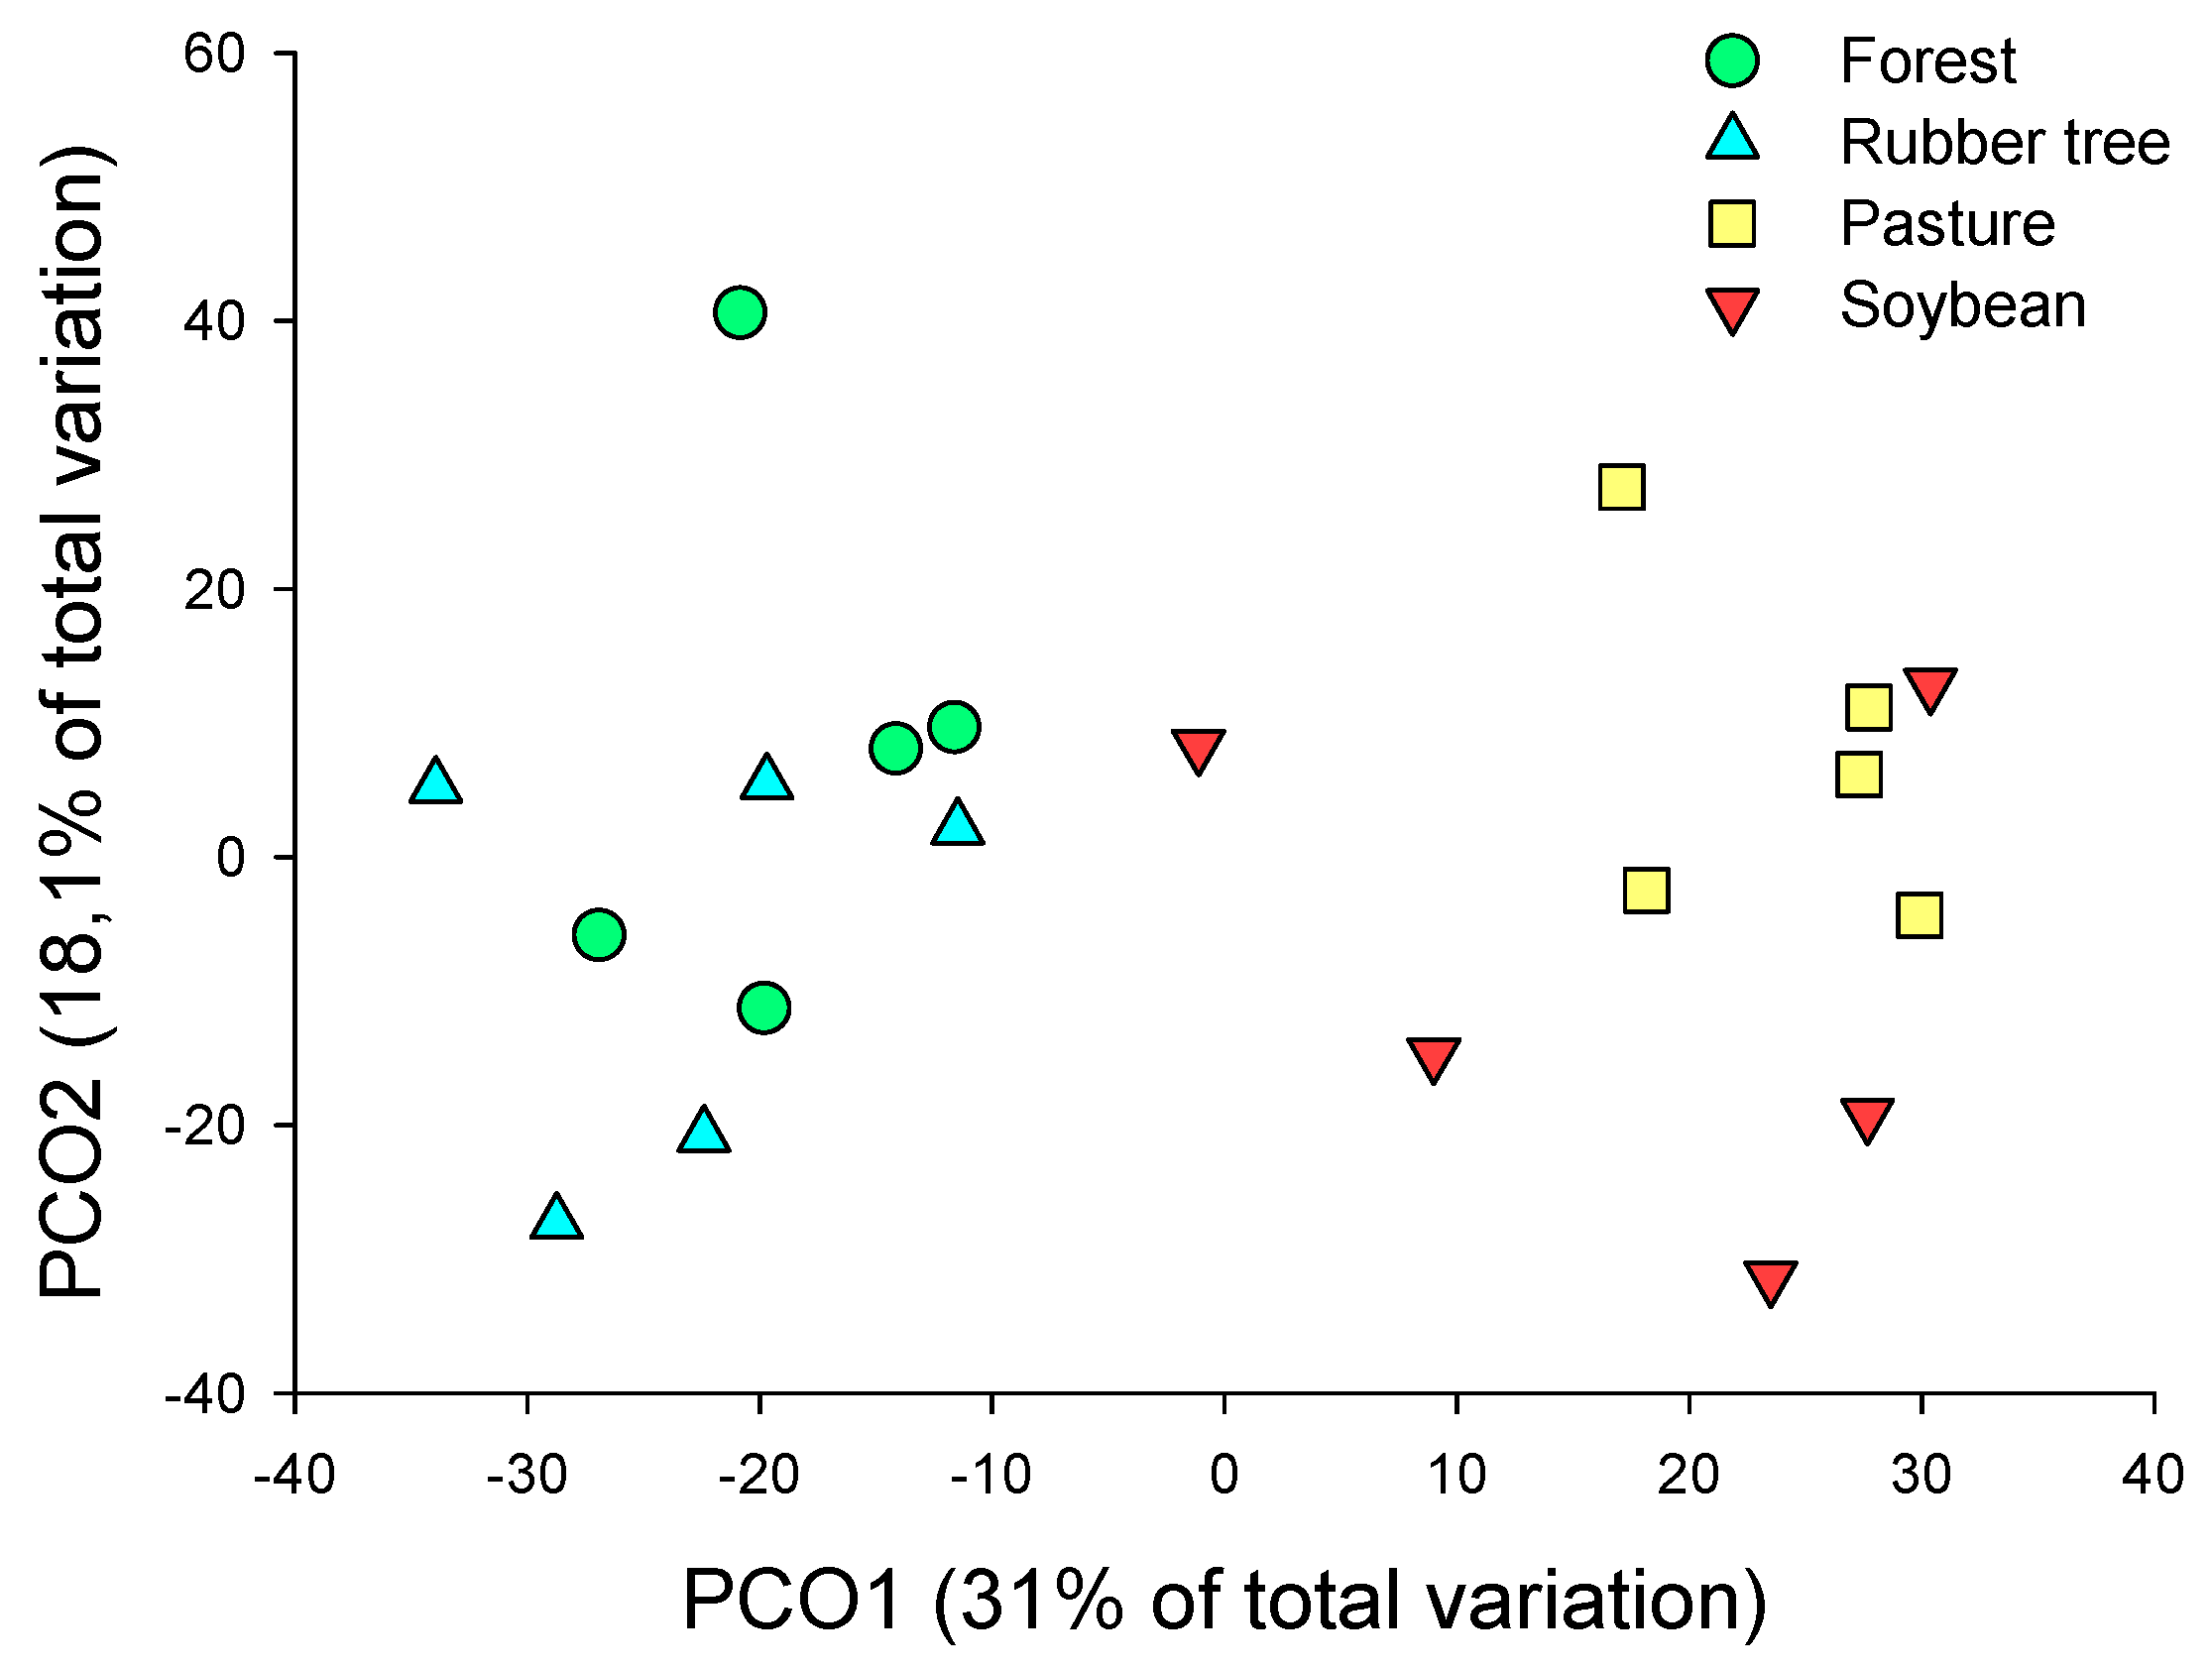
Figure 7.
Distance-based redundancy analysis (dbRDA) relationships between the ordering of collections based on the composition of scarab beetles and the environmental variables analyzed.
Figure 7.
Distance-based redundancy analysis (dbRDA) relationships between the ordering of collections based on the composition of scarab beetles and the environmental variables analyzed.
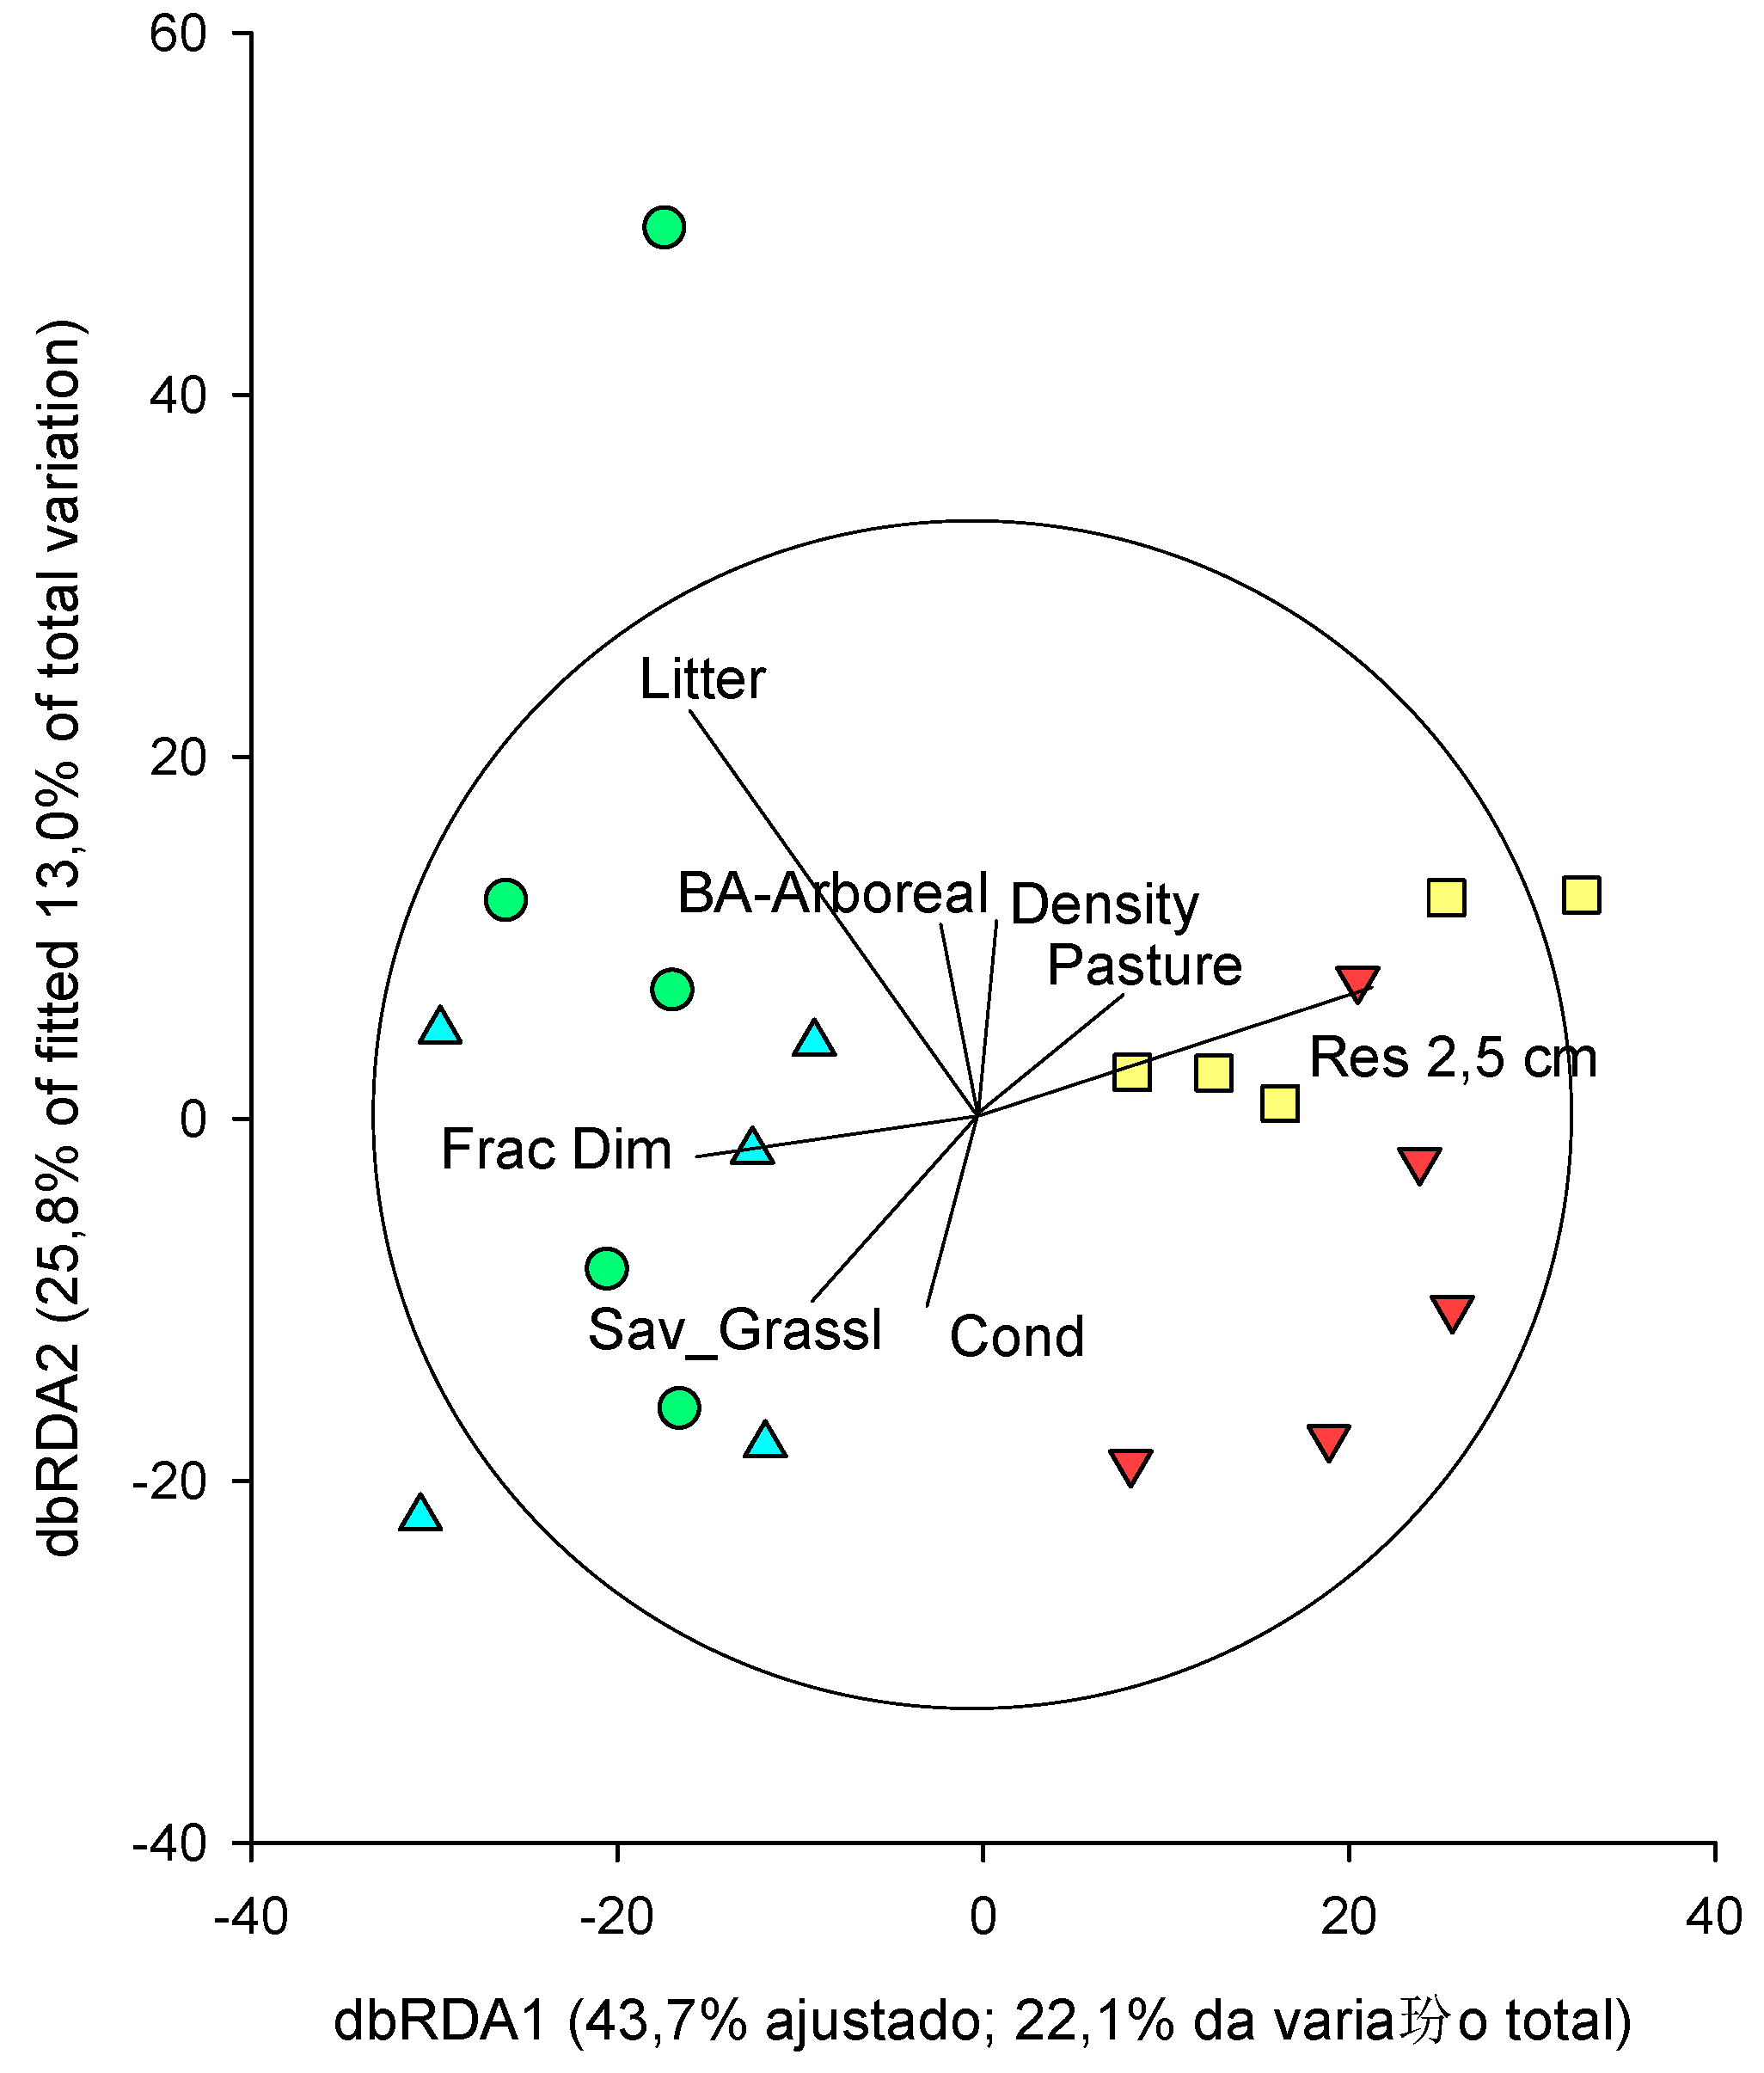

Table 1.
Description of each land-use system located in the municipality of Frutal.
| Land Use | Caracterização |
|---|---|
| Forest | Areas with a predominance of tree species cover, with no history of cutting and felling |
| Rubber tree | Plantations of Hevea brasiliensis L. (rubber tree), the main management carried out are: land clearing, straw maintenance to control the growth of the herbaceous stratum and the understory |
| Pasture | Consisting of areas intended for livestock production, formed by exotic pastures, with a predominance of Urochloa spp. (Syn. Brachiaria spp.). |
| Soy | Consisting of conventional soybean monocultures (Glycine max (L.) Merr.). |
Table 2.
Número de indivíduos por espécie capturada em quatro sistemas de uso da terra em Frutal, em Minas Gerais.
Table 2.
Número de indivíduos por espécie capturada em quatro sistemas de uso da terra em Frutal, em Minas Gerais.
| Tribo/Espécie | Sistema | Total | |||
|---|---|---|---|---|---|
| Floresta | Pastagem | Seringueira | Soja | ||
| Ateuchini | |||||
| Agamopus viridis (Boucomont, 1928) | - | 15 | - | - | 15 |
| Genieridium bidens (Balthasar, 1938) | - | 101 | 1 | 73 | 184 |
| Ateuchus sp. 1 | - | 2 | - | 1 | 3 |
| Coprini | |||||
| Canthidium refulgens (Boucomont, 1928) | 62 | 15 | 86 | 8 | 171 |
| Canthidium sp. 1 | 3 | - | 3 | - | 6 |
| Canthidium sp. 2 | 1 | - | 3 | - | 4 |
| Canthidium sp. 3 | 6 | 11 | 26 | - | 43 |
| Canthidium sp. 4 | 2 | - | 1 | - | 3 |
| Canthidium sp. 5 | 14 | - | 5 | 63 | 82 |
| Dichotomius bos (Blanchard, 1843) | 2 | 6 | - | 4 | 12 |
| Dichotomius aff. carbonarius (Mannerhein, 1829) | 60 | - | 33 | 44 | 137 |
| Dichotomius glaucus (Harold, 1869) | 8 | - | - | - | 8 |
| Dichotomius nisus (Oliver, 1789) | 240 | 116 | 77 | 80 | 513 |
| Isocopris inhatus (German, 1824) | - | - | 1 | 1 | 2 |
| Ontherus appendiculatus (Mannerheim, 1829) | 16 | - | 31 | - | 47 |
| Ontherus sp. 1 | 26 | 11 | 13 | 18 | 68 |
| Ontherus sp. 2 | 18 | 12 | 6 | 10 | 46 |
| Ontherus sp. 3 | 21 | - | 12 | - | 33 |
| Deltochilini | |||||
| Anomiopus sp. 1 | 3 | - | - | - | 3 |
| Canthon conformis (Harold, 1868) | 77 | - | 60 | 6 | 77 |
| Canthon lituratus (Germar, 1824) | 4 | - | - | 4 | 8 |
| Canthon ornatus (Redtennbacher, 1868) | - | 6 | - | - | 6 |
| Deltochilum aff. guyanense (Paulian, 1938) | 1 | - | - | 1 | |
| Pseudocanthon sp. 1 | 4 | 14 | - | - | 28 |
| Onthophagini | |||||
| Onthophagus buculus (Mannerheim, 1829) | 25 | 13 | - | 3 | 41 |
| Onthophagus hircus (Billberg, 1815) | 87 | - | - | 87 | |
| Onthophagus ptox (Erichson, 1847) | - | - | 14 | 1 | 15 |
| Phanaeini | |||||
| Coprophanaeus cyanescens (d’Olsoufieff, 1924) | 17 | - | 2 | - | 19 |
| Coprophanaeus spitzi (Pessôa, 1935) | 4 | 5 | 1 | 1 | 11 |
| Dendropaemon nitidicollis (d’Olsoufieff, 1924) | - | 1 | - | - | 1 |
| Diabroctis mimas (Linnaeus, 1758) | - | 1 | - | 1 | |
| Gromphas inermis (Harold, 1869) | - | - | - | 2 | 2 |
| Phanaeus palaeno (Blanchard & Brullé, 1845) | 5 | 12 | - | - | 17 |
| Trichillum externepunctatum (Borre, 1886) | 52 | 146 | 76 | 86 | 360 |
| Number of Species | 25 | 17 | 19 | 17 | 34 |
| Number of Individuals | 758 | 679 | 751 | 406 | 2101 |
Table 3.
Results of PERMANOVA analysis (differences between groups) and PERMDISP (differences in dispersion of groups) comparing pairs of land use systems scaled by the composition of the dung beetle community in Frutal, Minas Gerais.
Table 3.
Results of PERMANOVA analysis (differences between groups) and PERMDISP (differences in dispersion of groups) comparing pairs of land use systems scaled by the composition of the dung beetle community in Frutal, Minas Gerais.
| GROUP | PERMANOVA | PERMDISP | |||
|---|---|---|---|---|---|
| T | P (Perm.) | T | P (Perm.) | ||
| Soybean X Forest | 1,761 | 0,007 | 0,29698 | 0,888 | |
| Soybean X Pasture | 1,0752 | 0,344 | 0,6901 | 0,6 | |
| Soybean vs. Rubber Tree | 1,8527 | 0,011 | 1,094 | 0,282 | |
| Forest vs. Pasture | 1,9018 | 0,011 | 0,70553 | 0,616 | |
| Forest X Rubber Tree | 0,90103 | 0,628 | 0,84589 | 0,619 | |
| Pasture X Rubber Tree | 2,34 | 0,005 | 0.02549 | 0,984 | |
Disclaimer/Publisher’s Note: The statements, opinions and data contained in all publications are solely those of the individual author(s) and contributor(s) and not of MDPI and/or the editor(s). MDPI and/or the editor(s) disclaim responsibility for any injury to people or property resulting from any ideas, methods, instructions or products referred to in the content. |
© 2025 by the authors. Licensee MDPI, Basel, Switzerland. This article is an open access article distributed under the terms and conditions of the Creative Commons Attribution (CC BY) license (http://creativecommons.org/licenses/by/4.0/).
Copyright: This open access article is published under a Creative Commons CC BY 4.0 license, which permit the free download, distribution, and reuse, provided that the author and preprint are cited in any reuse.


