Submitted:
10 February 2025
Posted:
10 February 2025
You are already at the latest version
Abstract
The propagation of peach rootstocks, particularly adventitious root (AR) formation, is influenced by multiple factors, with substrate temperature being crucial. This experiment studied the differential gene expression patterns of GF677 rootstock cuttings treated with 200 mg/L IBA under various substrate temperatures (unheated, 19℃, 22℃, 25℃, and 28℃) and cutting periods (7, 14, and 21 days). The results showed a maximum rooting rate of 91% at 25℃ for 40 days, with the highest number of differentially expressed genes (DEGs) observed between 22-25℃. Therefore, the optimal temperature for propagation was determined to be 25℃. Gene ontology (GO) and Kyoto Encyclopedia of Genes and Genomes (KEGG) analyses highlighted “starch and sucrose metabolism” and “plant hormone signal transduction” as enriched pathways. Specifically, 26 plant hormone signaling pathways (ARFs, LBDs, SAURs, and GH3) and 22 AR formation-related pathways (AUR3, LRP1, RGF1, AIR9, AP2, and NAC) were identified from these DEGs. Weighted gene co-expression network analysis (WGCNA) clarified the involvement of various transcription factors (WRKYs, ERFs, NACs, bHLHs, bZIPs, and MYBs) in AR formation. These findings indicate significant differences in gene expression under different combinations of substrate temperatures and cutting periods. Overall, this study enhances our understanding of the molecular mechanisms underlying peach tree asexual reproduction.
Keywords:
cottage
; substrate temperatures
; adventitious root
; transcriptome analysis
; differentially expressed genes
; WGCNA
; Prunus persica
1. Introduction
Seedling rootstocks are predominantly used in peach tree propagation due to their low-cost seeds and easier sexual reproduction compared to cutting propagation [1,2]. However, genetic heterogeneity from seed propagation can lead to the loss of crucial traits, thereby potentially affecting orchard productivity [3]. In addition, compared to self-rooted plants, grafted plants have multiple advantages, including enhanced resistance to biotic and abiotic stress [4], improved field performance (increased yield, earlier maturity), and optimized orchard horticultural management practices [5]. Nonetheless, certain tree species face challenges in forming adventitious root (AR) during cutting propagation [6]. ARs play a crucial role in plant growth and development by facilitating water and nutrient absorption, enhancing plant stability, and increasing stress resistance [7,8]. However, peach trees are among the tree species that exhibit difficulty in rooting through cutting propagation, resulting in a consistently low rooting rate throughout the propagation process. Additionally, the rooting of peach branch cuttings is influenced by numerous regulatory factors [9], with temperature being a significant determinant. Maintaining an optimal substrate temperature conducive to rooting is crucial during the cutting process [10]. Therefore, it is particularly important to deeply explore and determine the appropriate substrate temperature for adventitious root formation in the practice of cutting propagation.
‘GF677’ (P. amygdalus × P. persica) is a peach rootstock variety developed in France during the 1960s. This variety has a well-developed root system, robust growth, and resistance to calcium alkaline soil iron deficiency chlorosis, replant disease, and drought. Furthermore, its excellent genetic traits must be maintained through vegetative propagation [10,11,12]. However, there is no established vegetative propagation production technology system for ‘GF677’ in China, and the hardwood cuttings have a low rooting rate, which restricts the development of the peach industry. Therefore, there is an urgent need to develop a vegetative propagation technology system for ‘GF677’ to solve the problem of difficult peach grafting.
Auxin, primarily indole-3-acetic acid (IAA), serve as an effective inducer of AR formation [13]. The transport, reception, and response to auxin signals in plants are regulated by a complex set of molecular mechanisms. Auxin-responsive genes are classified into three major families: Auxin/Indole-3-Acetic Acid (Aux/IAA), Gretchen Hagen3 (GH3), and Small Auxin Up RNA (SAUR) gene families [7]. The Aux/IAA genes have an inhibitory effect on the expression of auxin-responsive factors (ARFs) [8]. The ARF transcription factor family plays a crucial role in auxin signal transduction by promoting lateral root formation through interaction with auxin response elements [14]. RNA-seq analysis has confirmed that PeARFs play diverse regulatory roles in poplar adventitious root development [15]. Lateral Organ Boundaries Domain (LBD) protein, acting downstream of ARFs, have been shown to be involved in the process of adventitious root formation [16]. Research have indicated that CmLBD1 functions as a positive regulator in response to auxin fluctuations, thereby connecting auxin signal transduction with the process of lateral root formation [17]. SAURs are the largest family of early auxin-responsive genes and play vital roles in various processes such as cell expansion, leaf growth and senescence, auxin transport, and tropic growth [18]. It has been confirmed that SAURs participate in the molecular mechanism of root development across multiple species, including Salvia [19], poplar [20], and cucumber [21]. GH3 proteins primarily function as IAA-amide synthetases, which are essential for maintaining auxin homeostasis through conjugation of IAA with amino acids [22]. In Arabidopsis, several genes related to root formation are influenced by auxin signaling pathways, such as Lateral Root Primordium 1 (LRP1), Root Meristem Growth Factor (RGF), and Auxin-Induced in Roots 12 (AIR12) [23,24,25]. It is reported that several transcription factors are involved in the early transcriptional regulation of adventitious root formation, including AP2/ERF-ERF, bHLH, WRKY, NAC, MYB, and bZIP [26].
In this study, we selected the peach rootstock GF677 as the subject of research to deeply investigate the effects of different cutting days and temperature conditions on the process of adventitious root formation. Subsequently, we employed transcriptome sequencing technology and Weighted Gene Co-expression Network Analysis (WGCNA) to analyze differentially expressed genes (DEGs) that emerged under different substrate temperatures (unheated, 19℃, 22℃, 25℃, and 28℃) and cutting periods (7, 14, and 21 days). The aim was to identify the optimal temperature conditions and key regulatory genes involved in adventitious root formation. This research not only lays a solid foundation for comprehensively elucidating the molecular mechanisms underlying the regulation of adventitious root formation by cutting duration and temperature in peach trees, but also provides a valuable theoretical reference for this field.
2. Materials and methods
Plant Material and Sample Preparation
This experiment was conducted under controlled conditions in a greenhouse at the Gansu Academy of Agricultural Sciences to investigate the hardwood cutting propagation of the peach rootstock ‘GF677’. The cuttings were selected from the middle and upper portions of current-year branches, ensuring they were free of pests and diseases and had diameters ranging from 0.5 to 1.0 cm. The optimal length of the cuttings was 15 to 20 cm. A cutter was used to create a 40 to 45° bevel at the base near the basal bud. The top of the cutting was cut flat, and it was advisable to apply a plant wound healing agent to the flat surface. The substrate consisted of a 1:1:1 volume ratio of perlite, peat moss, and vermiculite. The cuttings were dipped in a solution of 200 mg/L indole-3-butyric acid (IBA) for 20s before planting, while the control group was dipped in water. The cuttings were exposed to five substrate temperatures: no heating, 19℃, 22℃, 25℃, and 28℃, using electric heating wires. Sampling was conducted on the 7th day (labeled as T1, T2, T3, T4, and T5), the 14th day (labeled as CK14, T6, T7, T8, and T9), and the 21st day (labeled as CK21, T10, T11, T12, and T13). Among them, CK1 represents the untreated control group. In this study, three biological replicates were set for each treatment to ensure the reliability of the results.
RNA Library Construction and High-Throughput Sequencing
Following the manufacturer’s instructions, total RNA was extracted from the plants using a Pure Plant RNA Extraction Kit (Tiangen, China). The concentration and purity of the extracted RNA were measured using a NanoDrop 2000 spectrophotometer (Thermo, USA). The Hieff NGS Ultima Dual-mode mRNA Library Prep Kit (compatible with Illumina platform, Yeasen, China) was utilized to construct the sequencing library. The library fragments were purified using AMPure XP beads (Beckman Coulter, USA). Subsequently, the cDNA products were amplified by polymerase chain reaction (PCR), and finally sequenced on an Illumina HiSeq2500 genomic sequencer by Biomarker Biotechnology Co., Ltd.
RNA-Sequencing Data Analysis
By processing the raw data, we eliminated reads containing adapters, poly-N sequences, and low-quality reads to obtain high-quality clean reads. All subsequent downstream analyses were conducted based on these high-quality clean reads. Subsequently, we aligned these clean reads to the reference genome sequence (Prunus persica) and annotated them accordingly. To map unannotated reads in the reference genome and determine their positional information, we employed miRDeep2 software [27]. Finally, gene expression levels were estimated based on Fragments Per Kilobase of transcript per Million mapped reads (FPKM) [28]. Differential expression analysis under different treatment conditions in peach was conducted using the DESeq2 method. Genes with a P-value≤0.05 and |log2Ratio|≥1 were considered as DEGs. Gene Ontology (GO) annotations were obtained through egg NOG. Functional pathway enrichment analysis for all common DEGs was performed using the Kyoto Encyclopedia of Genes and Genomes (KEGG) platform.
Weighted Gene Co-Expression Network Construction
The Pearson correlation coefficient is computed based on gene expression profiles across diverse samples, followed by transformation into an adjacency matrix using a weighting function. A soft thresholding power (β) is determined to ensure that the gene expression matrix conforms to the requirements of a scale-free network. Subsequently, visualization of gene modules is performed using Cytoscape.
3. Results
Root Phenotype Analysis
Firstly, we conducted a root phenotype analysis on peach rootstocks propagated by cutting under different substrate temperatures (19℃, 21℃, 25℃, and 28℃) for 20 days. The results revealed that root development was optimal under the condition of 25℃ (Figure 1a). Since the rooting rate at 20 days post-cutting was not satisfactory, we further conducted statistics and analysis on the rooting rate of the rootstocks at 40 days post-cutting (Figure 1b). The results indicated that the highest rooting rate, 91%, was obtained at a substrate temperature of 25℃ (Figure 1b). Consequently, we can conclude that the optimal temperature for the propagation of peach rootstocks by cutting is 25℃.
Overview of RNA-Seq Data
We conducted an in-depth sequencing analysis on 39 libraries of peach rootstocks under three different cutting time points (7, 14, and 21 days) and five substrate temperature conditions (non-heating, 19℃, 22℃, 25℃, and 28℃). This sequencing effort yielded over 2.1 billion raw reads, with an average of approximately 45 million reads per library (Table 1). After rigorous filtering process, RNA-Seq technology generated between 39 million and 48 million high-quality clean reads for each sample, with an average Q20 value exceeding 98.62% and a Q30 value exceeding 95.79% (Table 1). These high-quality data were utilized for all subsequent expression analyses. The filtered and cleaned reads were successfully aligned to the reference genome of Prunus persica, with an average genome alignment rate of 91.02% (Table 1). Furthermore, we conducted detailed statistical analysis on the alignment regions of each sample and found that exon regions accounted for up to 96.26% of the total number of reads (Table S1).
We performed a comprehensive analysis of gene expression levels within our dataset using the featureCounts tool from the subread package. Specifically, Table S2 presents a detailed read count expression matrix for 26,978 individual genes across various samples. Notably, the three biological replicates of the samples exhibited high Pearson correlation coefficients (R2≥0.773, Figure 2a), indicating strong reproducibility in our data. To gain further insights into the differences and relationships between the samples, we employed Principal Component Analysis (PCA) method and successfully grouped the samples into 15 clusters. Among them, peach rootstock cuttings incubated for 7 days at different temperatures (non-heating, 19℃, 22℃, 25℃, 28℃) are classified as CT1, CT2, CT3, CT4, and CT5, respectively; those incubated for 14 days at different temperatures are classified as CT6, CT7, CT8, CT9, and CT10; while another set of cuttings incubated for 21 days are classified as CT11, CT12, CT13, CT14, and CT15. The control group is classified as CT0 (Figure 2b,c). Furthermore, we employed various visualization techniques, including density plots, violin plots, and boxplots to conduct a comprehensive and meticulous examination of the gene expression distribution across the samples (Figure 2d–f).
Screening and Analysis of DEGs
We conducted a detailed comparative analysis of DEGs in 12 groups, comparing each sample with CT0, CT1, CT6, and CT11 (P-value≤0.05, |log2Ratio|≥1). Overall, the number of DEGs exhibited an increasing trend with the extension of cutting days and the elevation in temperature (Figure 3a). Specifically, the highest count of DEGs in peach rootstock cuttings was observed on the 7th and 21st days after cutting at temperatures of 25℃ and 28℃. Conversely, the peak number on the 14th day post-cutting was noted at temperatures ranging from 22℃ to 25℃ (Figure 3a). From the significance analysis of upregulated and downregulated genes, the optimal temperature range for peach rootstock cuttings at 7- and 21-days post-insertion was determined to be 25℃ to 28℃, whereas for cuttings at 14 days post-insertion, the optimal range shifted to 22℃ to 25℃. Notably, the samples collected on the 21st day after cutting showed more prominent variations in differential gene expression levels under different temperatures (Figure 3a). Therefore, we can conclude that the optimal temperature for peach rootstock cuttings is 25℃. Subsequently, we performed a heatmap analysis on the 14,380 DEGs identified in various comparisons (Figure 3b).
Furthermore, in the comparison between CT1 and CT0, there were 2,629 upregulated genes and 1,512 downregulated genes. In the comparison between CT2 and CT6, there were 609 upregulated genes and 953 downregulated genes. Similarly, in the comparison between CT2 and CT11, 557 and 1,172 single genes were upregulated and downregulated, respectively. In the comparison between CT2 and CT1, 327 single genes were upregulated, with 389 single genes downregulated. More notably, there were 49 DEGs shared among the four comparisons, while 3,065, 443, 682, and 135 DEGs were uniquely expressed in the comparisons of CT1 vs CT0, CT2 vs CT6, CT2 vs CT11, and CT2 vs CT1, respectively (Figure 3c).
GO Enrichment and KEGG Pathway Analysis of DEGs
In this work, GO analysis was used to categorize the functions of annotated DEGs processed under different temperatures and cutting durations. When comparing CT1 vs CT4, the most significantly enriched GO terms in biological processes were “microtubule-based movement”, “cellular process”, and “photosynthesis”. Among the cellular components, three GO terms “thylakoid part”, “photosynthetic membrane”, and “photosystem” were highly enriched. In the comparisons of CT6 vs CT9, the most significantly enriched GO terms in biological processes were “response to stress” and “defense response”. When comparing CT11 vs CT14, the most significantly enriched GO terms in biological processes were “movement of cell or subcellular component”, “microtubule-based process”, and “DNA-dependent DNA replication” (Figure 4a). Across these comparisons, “copper ion binding” and “microtubule motor activity” were significantly enriched in terms of molecular function (Figure 4a).
KEGG enrichment analysis was also conducted to identify the enriched metabolic pathways. The results indicated that significantly enriched KEGG pathways were mainly associated with photosynthesis processes, specifically including “Starch and sucrose metabolism” (Figure 4b). Furthermore, several other enriched pathways related to hormones and metabolites were identified, including “Flavonoid biosynthesis”, “Plant hormone signal transduction”, and “Zeatin biosynthesis” (Figure 4b).
Identify DEGs Involved in the Formation of AR-Related Pathways
We systematically screened for DEGs that may be involved in AR formation under various cutting temperatures and durations. Previous studies have shown that ARFs regulate the development of adventitious roots by specifically binding to auxin response elements [29]. In this study, we successfully identified five key ARFs (gene id: 18775811, 18774376, 18772269, 18791569, and 18786733). Their expression levels were relatively low at 21 days after cutting and significantly decreased with increasing cutting temperature. Notably, the LATERAL ORGAN BOUNDARIES DOMAIN (LBD) gene family, as the primary downstream targets of ARFs, have been shown to be involved in the process of adventitious root formation [30]. In this screening, we found six differentially expressed LBD genes with varying expression patterns across different samples. Notably, the expression levels of LBD genes in the cutting group were 1.36 to 6.85 times higher than those in the control group. The SAUR family constitutes the largest group of specific auxin-responsive factors participating in root development [31]. Among the screened 10 SAURs, their expression levels exhibited significant differences compared to control samples, with fold changes ranging from 1.01 to 42.09. On the other hand, members of the auxin-responsive GH3 family play a crucial role in regulating auxin homeostasis through the synthesis of auxin conjugates in higher plants [32]. Notably, the GH3 gene (gene id: 18768891) showed prominent differential expression across various sample tests (Figure 5). In summary, these genes closely associated with auxin signaling may collectively participate in the formation of AR.
In Arabidopsis, genes related to root formation are influenced by auxin, such as LRP1, RGF, and AIR12 [23,24,25]. During the formation of AR in peach cuttings, the expression level of the rooting-related gene AUR3 (gene id: 18786669) significantly increases and peaks at 7 days after cutting at 28℃. Concurrently, during the AR formation period, the maximum expression levels of LRP1 (gene id: 18786210, and 18781220) increased by 18.2-fold and 8-fold, respectively. Additionally, four RGF1 genes (gene id: 18769572, 18790800, 18777415, and 18775914) exhibit increased expression during AR formation. Furthermore, the rooting-related gene AIR9 (gene id: 18780861) was also significantly upregulated during the formation of AR. Its expression reached the maximum value 7 days after cutting at 28℃, increasing by 2.58 times compared to the control group (Figure 5). These findings suggest that cellular division and proliferation activities are significantly enhanced during the development of ARs in peach cuttings.
Furthermore, the NAM/ATAF1/2/CUC2 (NAC) transcription factor family and the APETALA2 (AP2) gene family are also widely involved in multiple aspects of plant organ development, such as root stem cell development and cell differentiation [33,34]. Through in-depth analysis, we have identified eight differentially expressed NAC genes and six differentially expressed members of the AP2 family (Figure 5). The changes in the expression of these genes indicate that their regulatory roles in the formation of adventitious roots.
Weighted Gene Co-Expression Network Analysis (WGCNA)
To accurately screen for genes closely related to the response to cutting temperature and duration, we initially evaluate the number of candidate genes. If the total number of genes does not exceed 45,000, we will utilize expression data from all genes as the basis for further WGCNA analysis. After this screening process, we ultimately identified 26,978 genes that will serve as the core for constructing the weighted gene co-expression network. We select the power value corresponding to R²=0.8 as the soft threshold for our analysis (Figure S1).
All genes were precisely categorized into 68 modules (Figure 6a), with the number of genes in each module ranging from 34 to 4,072. Among these, 44 modules exhibited a high correlation with the samples mentioned in this study (R > 0.90, Figure 6b). Notably, we found an extremely close correlation between the CK1 sample and the MEmediumorchid module (R=0.994572), and a tight correlation between the CK3 sample and the MEdarkolivegreen module (R=0.996928). Additionally, significant correlations were also observed between the T6-1 sample and the MEpaleturquoise module (R=0.994412), as well as between the T9-2 sample and the MEplum module (R=0.994312). Based on the clear heatmap of FPKM values, four modules exhibited distinct expression patterns at specific time points (Figure 6c). Further analysis revealed that these four modules contained various transcription factors involved in the formation of AR-related genes, including 4 members of the WRKY family, 8 members of the ERF family, 6 members of the NAC family, 11 members of the bHLH family, 5 members of the bZIP family, and 14 members of the MYB family (Table S3). These transcription factors play crucial regulatory roles in the formation of AR, and their high expression levels during the corresponding periods fully support this point.
4. Discussion
The primary method of reproduction for woody plants is cuttage, which not only significantly enhances efficiency but also effectively preserves various valuable genetic traits [35]. In practical production operations, agronomic management measures such as cutting duration, substrate temperatures, and the quality of the cuttings themselves all have a notable influence on the formation process of root systems in cuttings [36]. In this study, based on the comparative analysis of DEGs from transcriptome data and the statistics of rooting rates after 40 days of cutting propagation, the optimal temperature for peach rootstock cuttings was determined to be 25℃. Further Go and KEGG enrichment analyses revealed that the differences in rooting performance of peach rootstocks under different cutting times and temperatures are primarily attributed to fluctuations in auxin levels. Based on these findings, we conducted an in-depth exploration of differential gene expression under different cutting environmental conditions, aiming to establish a solid molecular biological foundation for understanding the mechanism underlying adventitious root formation in peach rootstocks.
In the field of horticultural propagation techniques, the formation of adventitious roots is a crucial developmental stage. Auxin, serving as a universal regulatory factor in controlling root development and structural establishment, plays a crucial role in this process [37]. Studies have demonstrated that auxin can effectively induce adventitious root formation in various plants, such as Camellia sinensis [38], tomato [39], rice [40], and apple [41]. Notably, research focusing on Mango (Mangifera indica L.) has reported that overexpressing MiARF2 inhibits the growth of roots and hypocotyls in Arabidopsis [42]. In our research, we screened five differentially expressed ARFs. These ARFs exhibited relatively low expression levels at the 21-day cutting stage, and their expression gradually declined with increasing cutting temperature. This phenomenon suggests that ARFs play different regulatory roles under varying cutting environmental conditions. However, further comprehensive research is required to elucidate the molecular mechanisms underlying these specific functions of ARFs. In Arabidopsis, the activation of LBD16 expression initiates organ development by promoting cell proliferation and establishing root primordium identity [43]. According to our RNA-seq analysis results, we identified six differentially expressed LBD genes, with their expression levels upregulated by approximately 1.36- to 6.85-fold in the cutting groups compared to the control group. According to reports, SAUR36 controls adventitious root development in poplar via the auxin pathway [20]. Based on transcriptome data, we screened for 10 SAUR genes, among which the highest expression was 1.01 to 42.09 times higher than that of the control samples. These results indicate that ARF, SAUR, and LBD may have conserved roles in the process of AR formation. Some GH3 proteins bind to auxin and negatively regulate root or AR development [44]. Among our results, the expression level of GH3 (gene id: 18768891) varied most significantly across all samples.
Through WGCNA analysis, we identified several transcription factors involved in the formation of AR-related genes, including WRKYs, ERFs, NACs, bHLHs, bZIPs, and MYBs, which may play a defensive role by regulating the expression of downstream genes. WRKY proteins exert dynamic roles in numerous plant processes involving responses to abiotic and biotic stresses, as well as secondary metabolism [45]. The transcription factor WRKY75 modulates hydrogen peroxide levels to regulate the development of adventitious roots, lateral buds, and callus tissues in poplar [46]. As an auxin-responsive transcription factor, OsAP2/ERF plays a pivotal role in promoting the growth and development of adventitious roots in various plant species such as rice [47] and poplar [48]. NAC1 has been identified as a key regulator of lateral root development, with its expression mechanism closely related to auxin signaling pathways during lateral root growth [49]. However, recent reports have found that NAC1 plays a role in the regeneration of adventitious roots in leaf explants triggered by auxin [50]. All the above evidence further confirms the concept that NAC participates in different regulatory pathways during root development. Furthermore, this study identified 8 differentially expressed NACs and 6 differentially expressed AP2 members. bHLHs promote plant root development and play a crucial role in gibberellin metabolism and hormone regulation [51,52]. Evidence suggests that bZIP significantly contributes to auxin-regulated root growth by binding to downstream genes and regulating auxin-related transcriptional activity [53]. MYBs can regulate the growth and development of plant roots through jasmonic acid signaling pathways, ROS/PCD-dependent pathways, and abscisic acid response mechanisms [18,54,55]. However, the molecular regulatory roles of these transcription factors in the formation of adventitious roots in peach rootstocks remain to be further investigated.
This study investigated the influence of cutting time and temperature on adventitious root formation in peach rootstocks. Phenotypic analysis determined that the most suitable substrate temperature for peach rootstock cuttings is 25℃. Transcriptome data revealed different gene sets regulated by cutting time and temperature, thereby identifying a group of potential regulatory genes involved in adventitious root formation. These genes include auxin-related genes, root development-related genes, and some transcription factors. These findings offer new perspectives and clues for understanding the molecular mechanisms underlying adventitious root formation in peach rootstocks.
Supplementary Materials
The following supporting information can be downloaded at: www.preprints.org.com/xxx/s1.
Author Contributions
F.Z. designed the research and extracted RNA and constructed cDNA Library. C.W. performed the transcriptome data processing and analysis. X.W. and M.G. drafted the manuscript. H.W. provided the experimental conditions and reviewed the manuscript. All authors have read and approved the manuscript.
Funding
This work was supported by the grants from the National Natural Science Foundation of China Project (No. 32360717) and the Modern Agricultural Industry Technology System Construction Special Project (No. CARS-30-1-6).
Institutional Review Board Statement
Not applicable.
Informed Consent Statement
Not applicable.
Data Availability Statement
Not applicable.
Conflicts of Interest
The authors declare no conflict of interest.
Abbreviations
The following abbreviations are used in this manuscript:
| (AR) | adventitious root |
| (IAA) | indole-3-acetic acid |
| (GH3) | Gretchen Hagen3 |
| (SAUR) | Small Auxin Up RNA |
| (ARFs) | auxin-responsive factors |
| (LBD) | Lateral Organ Boundaries Domain |
| (LRP1) | Lateral Root Primordium 1 |
| (RGF) | Root Meristem Growth Factor |
| (AIR12) | Auxin-Induced in Roots 12 |
| (WGCNA) | Weighted Gene Co-expression Network Analysis |
| (DEGs) | differentially expressed genes |
| (FPKM) | Fragments Per Kilobase of transcript per Million mapped reads |
| (PCA) | Principal Component Analysis |
| (GO) | Gene Ontology |
| (KEGG) | Kyoto Encyclopedia of Genes and Genomes |
References
- Sabbadini, S.; Pandolfini, T.; Girolomini, L.; Molesini, B.; Navacchi, O. Peach (Prunus persica L.). Methods Mol. Biol. 2015, 1224, 205–215. [Google Scholar] [CrossRef] [PubMed]
- Adaskaveg, J.E.; Schnabel, G.; Förster, H. The peach: botany, production and uses; The peach: botany, production and uses.: 2008. [Google Scholar]
- Lavania, U.C.; Srivastava, S.; Lavania, S. Ploidy-mediated reduced segregation facilitates fixation of heterozygosity in the aromatic grass, Cymbopogon martinii (Roxb.). J. Hered. 2010, 101, 119–123. [Google Scholar] [CrossRef]
- Melnyk, C.W. Plant grafting: insights into tissue regeneration. Regeneration 2017, 4, 3–14. [Google Scholar] [CrossRef] [PubMed]
- Feng, M.; Augstein, F.; Kareem, A.; Melnyk, C.W. Plant grafting: Molecular mechanisms and applications. Mol. Plant 2024, 17, 75–91. [Google Scholar] [CrossRef]
- Druege, U.; Hilo, A.; Pérez-Pérez, J.M.; Klopotek, Y.; Acosta, M.; Shahinnia, F.; Zerche, S.; Franken, P.; Hajirezaei, M.R. Molecular and physiological control of adventitious rooting in cuttings: phytohormone action meets resource allocation. Ann. Bot. 2019, 123, 929–949. [Google Scholar] [CrossRef]
- Druege, U.; Franken, P.; Hajirezaei, M.R. Plant Hormone Homeostasis, Signaling, and Function during Adventitious Root Formation in Cuttings. Front. Plant Sci. 2016, 7, 381. [Google Scholar] [CrossRef] [PubMed]
- Ahkami, A.H. Systems biology of root development in Populus: Review and perspectives. Plant Sci. : Int. J. Exp. Plant Biol. 2023, 335, 111818. [Google Scholar] [CrossRef]
- Beckman; TG; Nyczepir; AP; Myers; SC. Performance of peach rootstocks propagated as seedlings vs. cuttings. Acta Hortic 2006. [Google Scholar]
- Tsipouridis, C.; Thomidis, T.; Michailides, Z. Influence of some external factors on the rooting of GF677, peach and nectarine shoot hardwood cuttings. Aust. J. Exp. Agric. 2005, 45, 107–113. [Google Scholar] [CrossRef]
- Tsipouridis, G.; Thomidis, T.; Bladenopoulou, S. Seasonal variation in sprouting of GF677 peach × almond (Prunus persica × Prunus aygdalus) hybrid root cuttings. New Zealand J. Crop Hortic. Sci. 2006, 34, 45–50. [Google Scholar] [CrossRef]
- Ricci, A.; Mezzetti, B.; Sabbadini, O.N.B. In vitro regeneration, via organogenesis, from leaves of the peach rootstock GF677 (P. persica × P. amygdalus). Acta Hortic. 2023, 81–85. [Google Scholar] [CrossRef]
- Veloccia, A.; Fattorini, L.; Della Rovere, F.; Sofo, A.; D'Angeli, S.; Betti, C.; Falasca, G.; Altamura, M.M. Ethylene and auxin interaction in the control of adventitious rooting in Arabidopsis thaliana. J. Exp. Bot. 2016, 67, 6445–6458. [Google Scholar] [CrossRef] [PubMed]
- Wilmoth, J.C.; Wang, S.; Tiwari, S.B.; Joshi, A.D.; Hagen, G.; Guilfoyle, T.J.; Alonso, J.M.; Ecker, J.R.; Reed, J.W. NPH4/ARF7 and ARF19 promote leaf expansion and auxin-induced lateral root formation. Plant J. 2005, 43, 118–130. [Google Scholar] [CrossRef]
- Yang, C.; Xu, M.; Xuan, L.; Jiang, X.; Huang, M. Identification and expression analysis of twenty ARF genes in Populus. Gene 2014, 544, 134–144. [Google Scholar] [CrossRef]
- Lee, H.W.; Cho, C.; Pandey, S.K.; Park, Y.; Kim, M.J.; Kim, J. LBD16 and LBD18 acting downstream of ARF7 and ARF19 are involved in adventitious root formation in Arabidopsis. BMC Plant Biol. 2019, 19, 46. [Google Scholar] [CrossRef] [PubMed]
- Zhu, L.; Zheng, C.; Liu, R.; Song, A.; Zhang, Z.; Xin, J.; Jiang, J.; Chen, S.; Zhang, F.; Fang, W.; et al. Chrysanthemum transcription factor CmLBD1 direct lateral root formation in Arabidopsis thaliana. Sci. Rep. 2016, 6, 20009. [Google Scholar] [CrossRef]
- Wang, Z.; Li, X.; Gao, X.R.; Dai, Z.R.; Peng, K.; Jia, L.C.; Wu, Y.K.; Liu, Q.C.; Zhai, H.; Gao, S.P.; et al. IbMYB73 targets abscisic acid-responsive IbGER5 to regulate root growth and stress tolerance in sweet potato. Plant Physiol. 2024, 194, 787–804. [Google Scholar] [CrossRef]
- Wang, W.; Zheng, Y.; Qiu, L.; Yang, D.; Zhao, Z.; Gao, Y.; Meng, R.; Zhao, H.; Zhang, S. Genome-wide identification of the SAUR gene family and screening for SmSAURs involved in root development in Salvia miltiorrhiza. Plant Cell Rep. 2024, 43, 165. [Google Scholar] [CrossRef]
- Liu, R.; Wen, S.S.; Sun, T.T.; Wang, R.; Zuo, W.T.; Yang, T.; Wang, C.; Hu, J.J.; Lu, M.Z.; Wang, L.Q. PagWOX11/12a positively regulates the PagSAUR36 gene that enhances adventitious root development in poplar. J. Exp. Bot. 2022, 73, 7298–7311. [Google Scholar] [CrossRef]
- Luan, J.; Xin, M.; Qin, Z. Genome-Wide Identification and Functional Analysis of the Roles of SAUR Gene Family Members in the Promotion of Cucumber Root Expansion. Int. J. Mol. Sci. 2023, 24. [Google Scholar] [CrossRef]
- Staswick, P.E.; Serban, B.; Rowe, M.; Tiryaki, I.; Maldonado, M.T.; Maldonado, M.C.; Suza, W. Characterization of an Arabidopsis enzyme family that conjugates amino acids to indole-3-acetic acid. Plant Cell 2005, 17, 616–627. [Google Scholar] [CrossRef]
- Singh, S.; Yadav, S.; Singh, A.; Mahima, M.; Singh, A.; Gautam, V.; Sarkar, A.K. Auxin signaling modulates LATERAL ROOT PRIMORDIUM1 (LRP1) expression during lateral root development in Arabidopsis. Plant J. : Cell Mol. Biol. 2020, 101, 87–100. [Google Scholar] [CrossRef]
- Shinohara, H. Root meristem growth factor RGF, a sulfated peptide hormone in plants. Peptides 2021, 142, 170556. [Google Scholar] [CrossRef] [PubMed]
- Gibson, S.W.; Todd, C.D. Arabidopsis AIR12 influences root development. Physiol. Mol. Biol. Plants 2015, 21, 479–489. [Google Scholar] [CrossRef] [PubMed]
- Ai, Y.; Qian, X.; Wang, X.; Chen, Y.; Zhang, T.; Chao, Y.; Zhao, Y. Uncovering early transcriptional regulation during adventitious root formation in Medicago sativa. BMC Plant Biol. 2023, 23, 176. [Google Scholar] [CrossRef]
- Friedländer, M.R.; Mackowiak, S.D.; Li, N.; Chen, W.; Rajewsky, N. miRDeep2 accurately identifies known and hundreds of novel microRNA genes in seven animal clades. Nucleic Acids Res. 2012, 40, 37–52. [Google Scholar] [CrossRef]
- Trapnell, C.; Williams, B.A.; Pertea, G.; Mortazavi, A.; Kwan, G.; van Baren, M.J.; Salzberg, S.L.; Wold, B.J.; Pachter, L. Transcript assembly and quantification by RNA-Seq reveals unannotated transcripts and isoform switching during cell differentiation. Nat. Biotechnol. 2010, 28, 511–515. [Google Scholar] [CrossRef] [PubMed]
- Tao, G.Y.; Xie, Y.H.; Li, W.F.; Li, K.P.; Sun, C.; Wang, H.M.; Sun, X.M. LkARF7 and LkARF19 overexpression promote adventitious root formation in a heterologous poplar model by positively regulating LkBBM1. Commun. Biol. 2023, 6, 372. [Google Scholar] [CrossRef]
- Kirolinko, C.; Hobecker, K.; Cueva, M.; Botto, F.; Christ, A.; Niebel, A.; Ariel, F.; Blanco, F.A.; Crespi, M.; Zanetti, M.E. A lateral organ boundaries domain transcription factor acts downstream of the auxin response factor 2 to control nodulation and root architecture in Medicago truncatula. New Phytol. 2024, 242, 2746–2762. [Google Scholar] [CrossRef]
- Zhou, Y.; Li, A.; Du, T.; Qin, Z.; Zhang, L.; Wang, Q.; Li, Z.; Hou, F. A Small Auxin-Up RNA Gene, IbSAUR36, Regulates Adventitious Root Development in Transgenic Sweet Potato. Genes 2024, 15. [Google Scholar] [CrossRef]
- Cano, A.; Sánchez-García, A.B.; Albacete, A.; González-Bayón, R.; Justamante, M.S.; Ibáñez, S.; Acosta, M.; Pérez-Pérez, J.M. Enhanced Conjugation of Auxin by GH3 Enzymes Leads to Poor Adventitious Rooting in Carnation Stem Cuttings. Front. Plant Sci. 2018, 9, 566. [Google Scholar] [CrossRef] [PubMed]
- Li, S.; Wang, N.; Ji, D.; Zhang, W.; Wang, Y.; Yu, Y.; Zhao, S.; Lyu, M.; You, J.; Zhang, Y.; et al. A GmSIN1/GmNCED3s/GmRbohBs Feed-Forward Loop Acts as a Signal Amplifier That Regulates Root Growth in Soybean Exposed to Salt Stress. Plant Cell 2019, 31, 2107–2130. [Google Scholar] [CrossRef]
- Guyomarc'h, S.; Boutté, Y.; Laplaze, L. AP2/ERF transcription factors orchestrate very long chain fatty acid biosynthesis during Arabidopsis lateral root development. Mol. Plant 2021, 14, 205–207. [Google Scholar] [CrossRef] [PubMed]
- Bannoud, F.; Bellini, C. Adventitious Rooting in Populus Species: Update and Perspectives. Front. Plant Sci. 2021, 12, 668837. [Google Scholar] [CrossRef]
- Hilo, A.; Shahinnia, F.; Druege, U.; Franken, P.; Melzer, M.; Rutten, T.; von Wirén, N.; Hajirezaei, M.R. A specific role of iron in promoting meristematic cell division during adventitious root formation. J. Exp. Bot. 2017, 68, 4233–4247. [Google Scholar] [CrossRef] [PubMed]
- Overvoorde, P.; Fukaki, H.; Beeckman, T. Auxin control of root development. Cold Spring Harb. Perspect. Biol. 2010, 2, a001537. [Google Scholar] [CrossRef]
- Wei, K.; Ruan, L.; Wang, L.; Cheng, H. Auxin-Induced Adventitious Root Formation in Nodal Cuttings of Camellia sinensis. Int. J. Mol. Sci. 2019, 20. [Google Scholar] [CrossRef]
- Guan, L.; Tayengwa, R.; Cheng, Z.M.; Peer, W.A.; Murphy, A.S.; Zhao, M. Auxin regulates adventitious root formation in tomato cuttings. BMC Plant Biol. 2019, 19, 435. [Google Scholar] [CrossRef]
- Lin, C.; Sauter, M. Polar Auxin Transport Determines Adventitious Root Emergence and Growth in Rice. Front. Plant Sci. 2019, 10, 444. [Google Scholar] [CrossRef]
- Bai, T.; Dong, Z.; Zheng, X.; Song, S.; Jiao, J.; Wang, M.; Song, C. Auxin and Its Interaction With Ethylene Control Adventitious Root Formation and Development in Apple Rootstock. Front. Plant Sci. 2020, 11, 574881. [Google Scholar] [CrossRef]
- Wu, B.; Li, Y.H.; Wu, J.Y.; Chen, Q.Z.; Huang, X.; Chen, Y.F.; Huang, X.L. Over-expression of mango (Mangifera indica L.) MiARF2 inhibits root and hypocotyl growth of Arabidopsis. Mol. Biol. Rep. 2011, 38, 3189–3194. [Google Scholar] [CrossRef] [PubMed]
- Liu, W.; Yu, J.; Ge, Y.; Qin, P.; Xu, L. Pivotal role of LBD16 in root and root-like organ initiation. Cell. Mol. Life Sci. : CMLS 2018, 75, 3329–3338. [Google Scholar] [CrossRef]
- Gutierrez, L.; Mongelard, G.; Floková, K.; Pacurar, D.I.; Novák, O.; Staswick, P.; Kowalczyk, M.; Pacurar, M.; Demailly, H.; Geiss, G.; et al. Auxin controls Arabidopsis adventitious root initiation by regulating jasmonic acid homeostasis. Plant Cell 2012, 24, 2515–2527. [Google Scholar] [CrossRef]
- Nuruzzaman, M.; Cao, H.; Xiu, H.; Luo, T.; Li, J.; Chen, X.; Luo, J.; Luo, Z. Transcriptomics-based identification of WRKY genes and characterization of a salt and hormone-responsive PgWRKY1 gene in Panax ginseng. Acta Biochim. Et Biophys. Sin. 2016, 48, 117–131. [Google Scholar] [CrossRef] [PubMed]
- Zhang, Y.; Yang, X.; Nvsvrot, T.; Huang, L.; Cai, G.; Ding, Y.; Ren, W.; Wang, N. The transcription factor WRKY75 regulates the development of adventitious roots, lateral buds and callus by modulating hydrogen peroxide content in poplar. J. Exp. Bot. 2022, 73, 1483–1498. [Google Scholar] [CrossRef]
- Neogy, A.; Garg, T.; Kumar, A.; Dwivedi, A.K.; Singh, H.; Singh, U.; Singh, Z.; Prasad, K.; Jain, M.; Yadav, S.R. Genome-Wide Transcript Profiling Reveals an Auxin-Responsive Transcription Factor, OsAP2/ERF-40, Promoting Rice Adventitious Root Development. Plant Cell Physiol. 2019, 60, 2343–2355. [Google Scholar] [CrossRef] [PubMed]
- Trupiano, D.; Yordanov, Y.; Regan, S.; Meilan, R.; Tschaplinski, T.; Scippa, G.S.; Busov, V. Identification, characterization of an AP2/ERF transcription factor that promotes adventitious, lateral root formation in Populus. Planta 2013, 238, 271–282. [Google Scholar] [CrossRef]
- Xie, Q.; Frugis, G.; Colgan, D.; Chua, N.H. Arabidopsis NAC1 transduces auxin signal downstream of TIR1 to promote lateral root development. Genes Dev. 2000, 14, 3024–3036. [Google Scholar] [CrossRef]
- Chen, X.; Cheng, J.; Chen, L.; Zhang, G.; Huang, H.; Zhang, Y.; Xu, L. Auxin-Independent NAC Pathway Acts in Response to Explant-Specific Wounding and Promotes Root Tip Emergence during de Novo Root Organogenesis in Arabidopsis. Plant Physiol. 2016, 170, 2136–2145. [Google Scholar] [CrossRef]
- Du, J.; Ge, X.; Wei, H.; Zhang, M.; Bai, Y.; Zhang, L.; Hu, J. PsPRE1 is a basic helix-loop-helix transcription factor that confers enhanced root growth and tolerance to salt stress in poplar. For. Res. 2023, 3, 16. [Google Scholar] [CrossRef]
- Guo, P.; Yang, Q.; Wang, Y.; Yang, Z.; Xie, Q.; Chen, G.; Chen, X.; Hu, Z. Overexpression of SlPRE3 alters the plant morphologies in Solanum lycopersicum. Plant Cell Rep. 2023, 42, 1907–1925. [Google Scholar] [CrossRef] [PubMed]
- Zhang, Y.; Yang, X.; Cao, P.; Xiao, Z.; Zhan, C.; Liu, M.; Nvsvrot, T.; Wang, N. The bZIP53-IAA4 module inhibits adventitious root development in Populus. J. Exp. Bot. 2020, 71, 3485–3498. [Google Scholar] [CrossRef] [PubMed]
- Tong, B.; Liu, Y.; Wang, Y.; Li, Q. PagMYB180 regulates adventitious rooting via a ROS/PCD-dependent pathway in poplar. Plant Sci. 2024, 346, 112115. [Google Scholar] [CrossRef] [PubMed]
- Pan, J.; Sohail, H.; Sharif, R.; Hu, Q.; Song, J.; Qi, X.; Chen, X.; Xu, X. Cucumber JASMONATE ZIM-DOMAIN 6 interaction with transcription factor MYB6 impairs waterlogging-triggered adventitious rooting. Plant Physiol. 2024. [Google Scholar] [CrossRef]
Figure 1.
Analysis of root phenotype in peach rootstock propagated by cutting under different substrate temperatures (19℃, 21℃, 25℃, and 28℃). (a) Phenotypic analysis of root system in peach rootstock propagated by cuttings over a 20-day period at different substrate temperatures (19℃, 21℃, 25℃, and 28℃). (b) Statistics and analysis of rooting rate of peach rootstock cuttings after 40 days at different substrate temperatures.
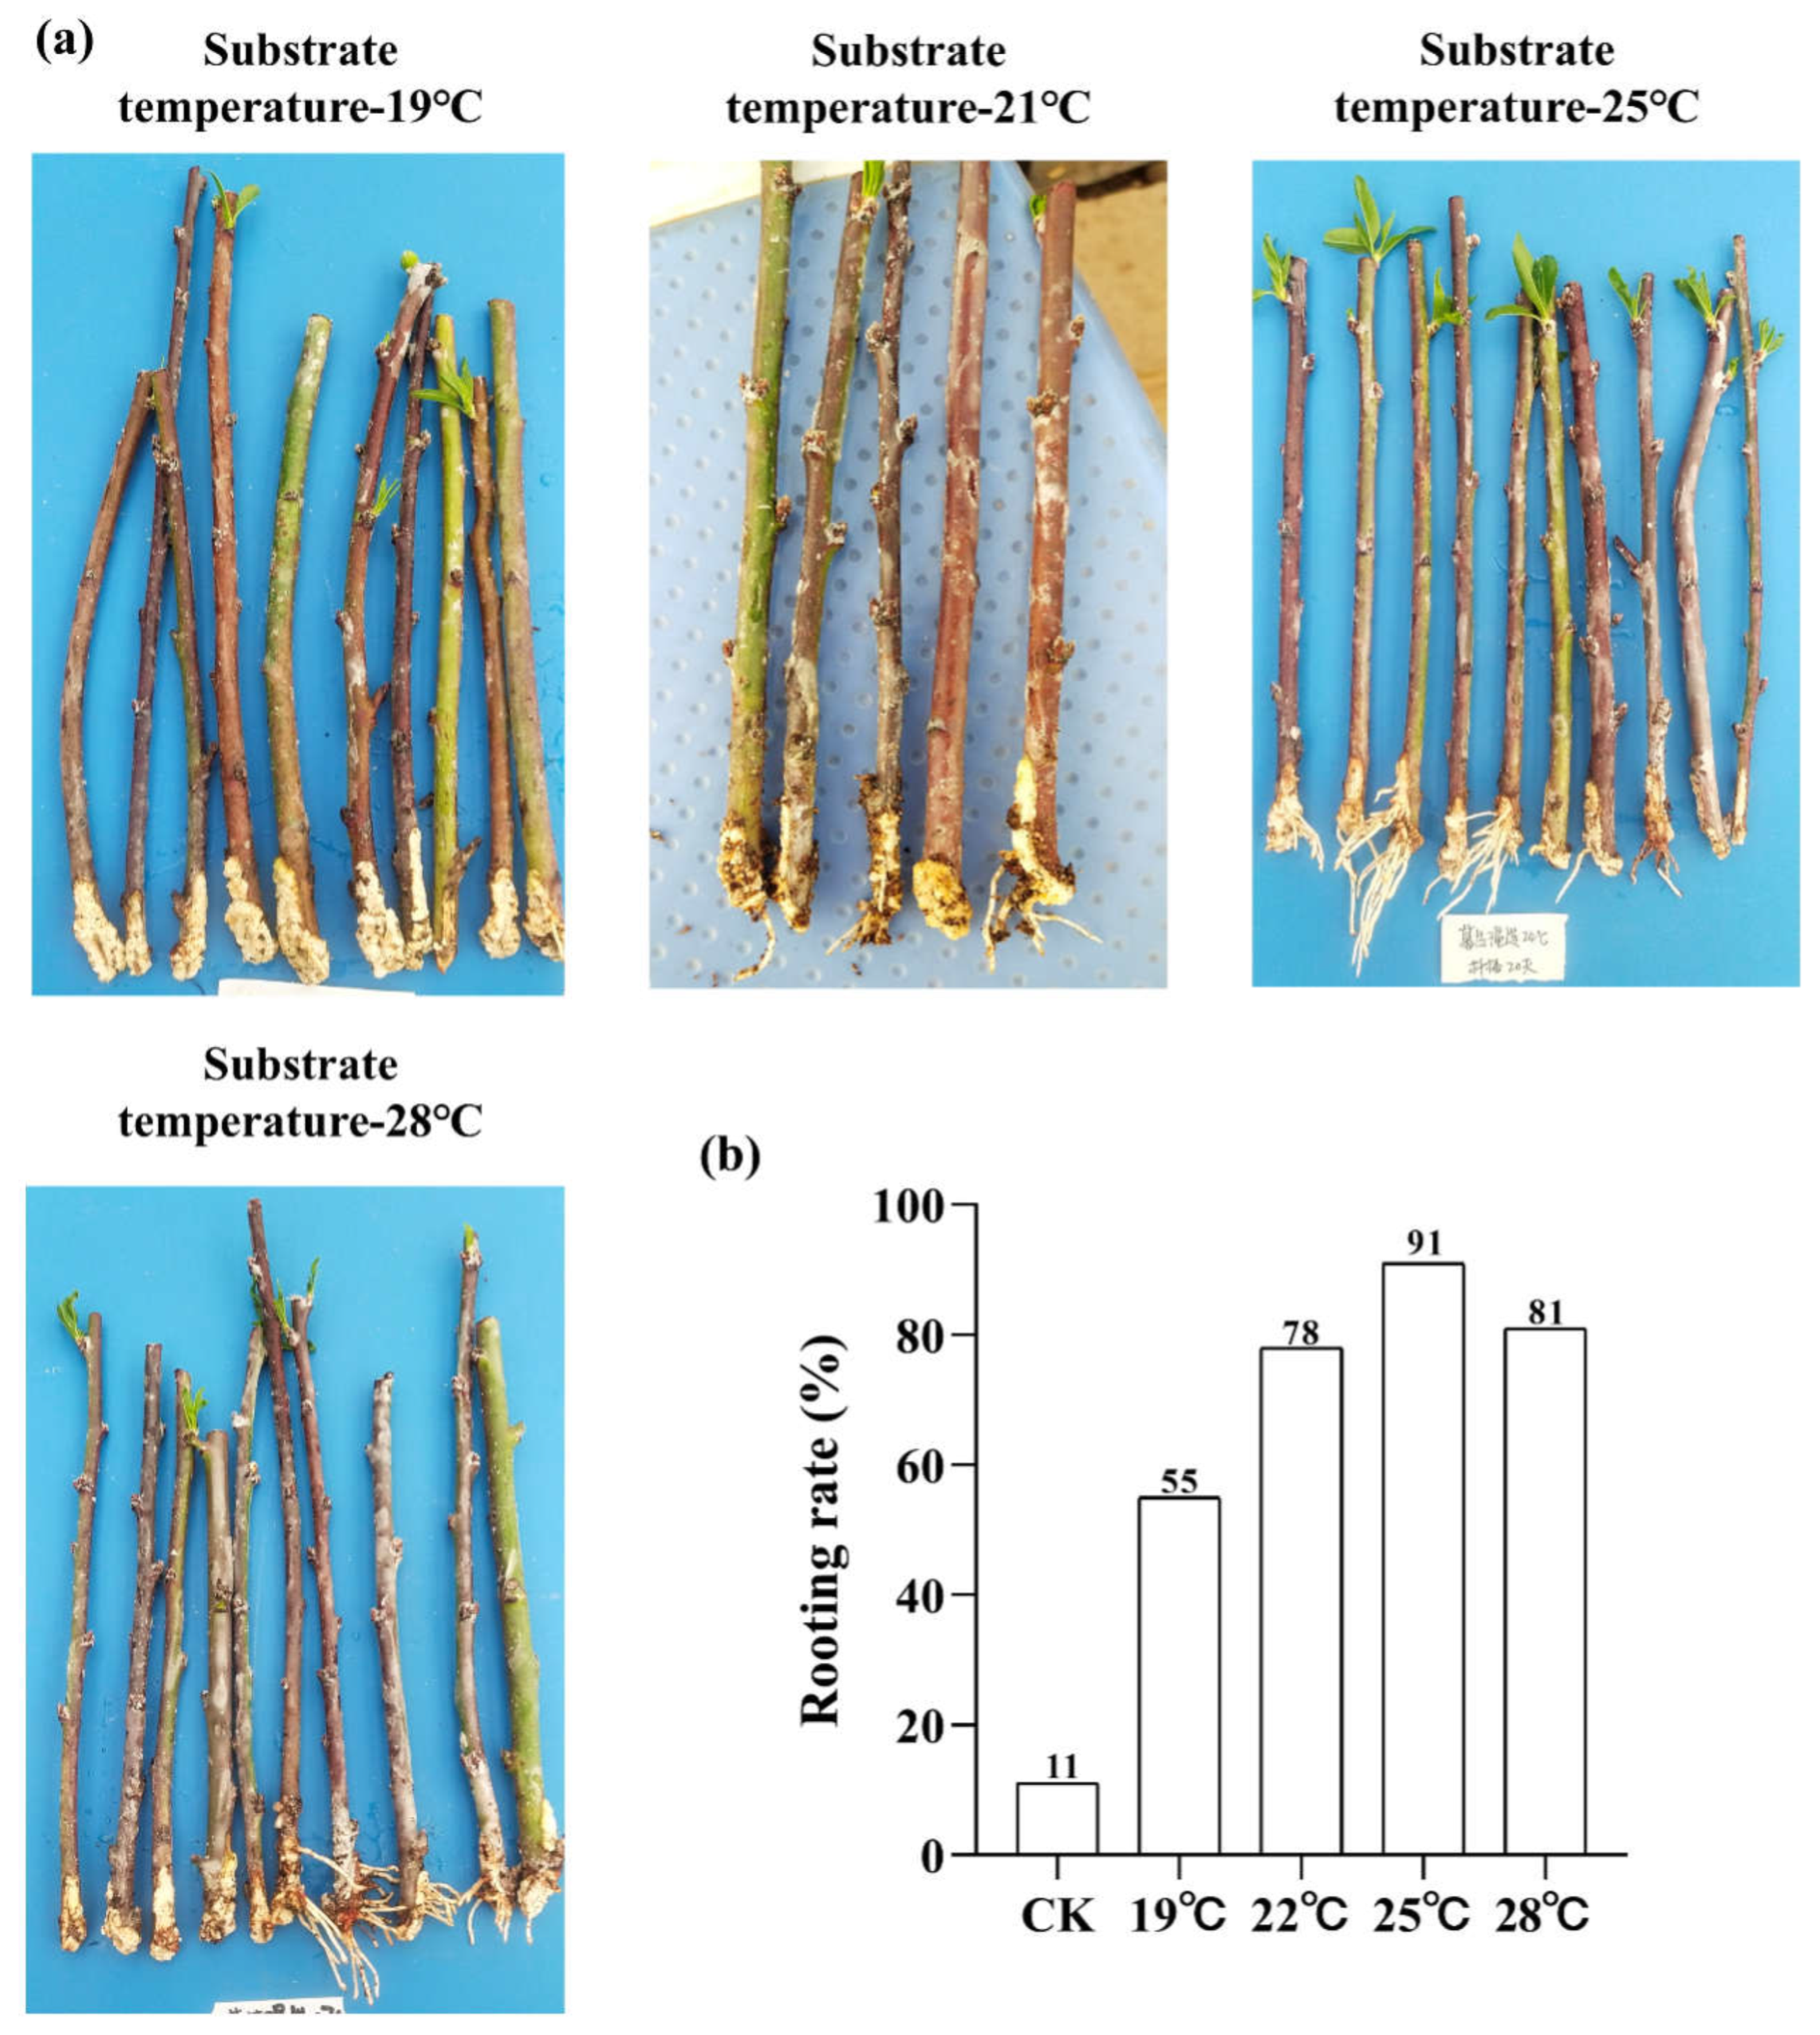
Figure 2.
Overview of RNA-Seq data. (a) Pearson correlation analysis between samples. Values close to 1 indicate a strong positive correlation, values close to -1 indicate a strong negative correlation, and values close to 0 indicate no linear relationship. (b) 2D result plots of principal component analysis for various samples. Each point in the plot represents a sample, and its position reflects its scores along the first two principal components. (c) 3D result plots of principal component analysis for various samples. (d-f) Density plots, violin plots, and boxplots are used to visualize the distribution of gene expression levels within a sample.
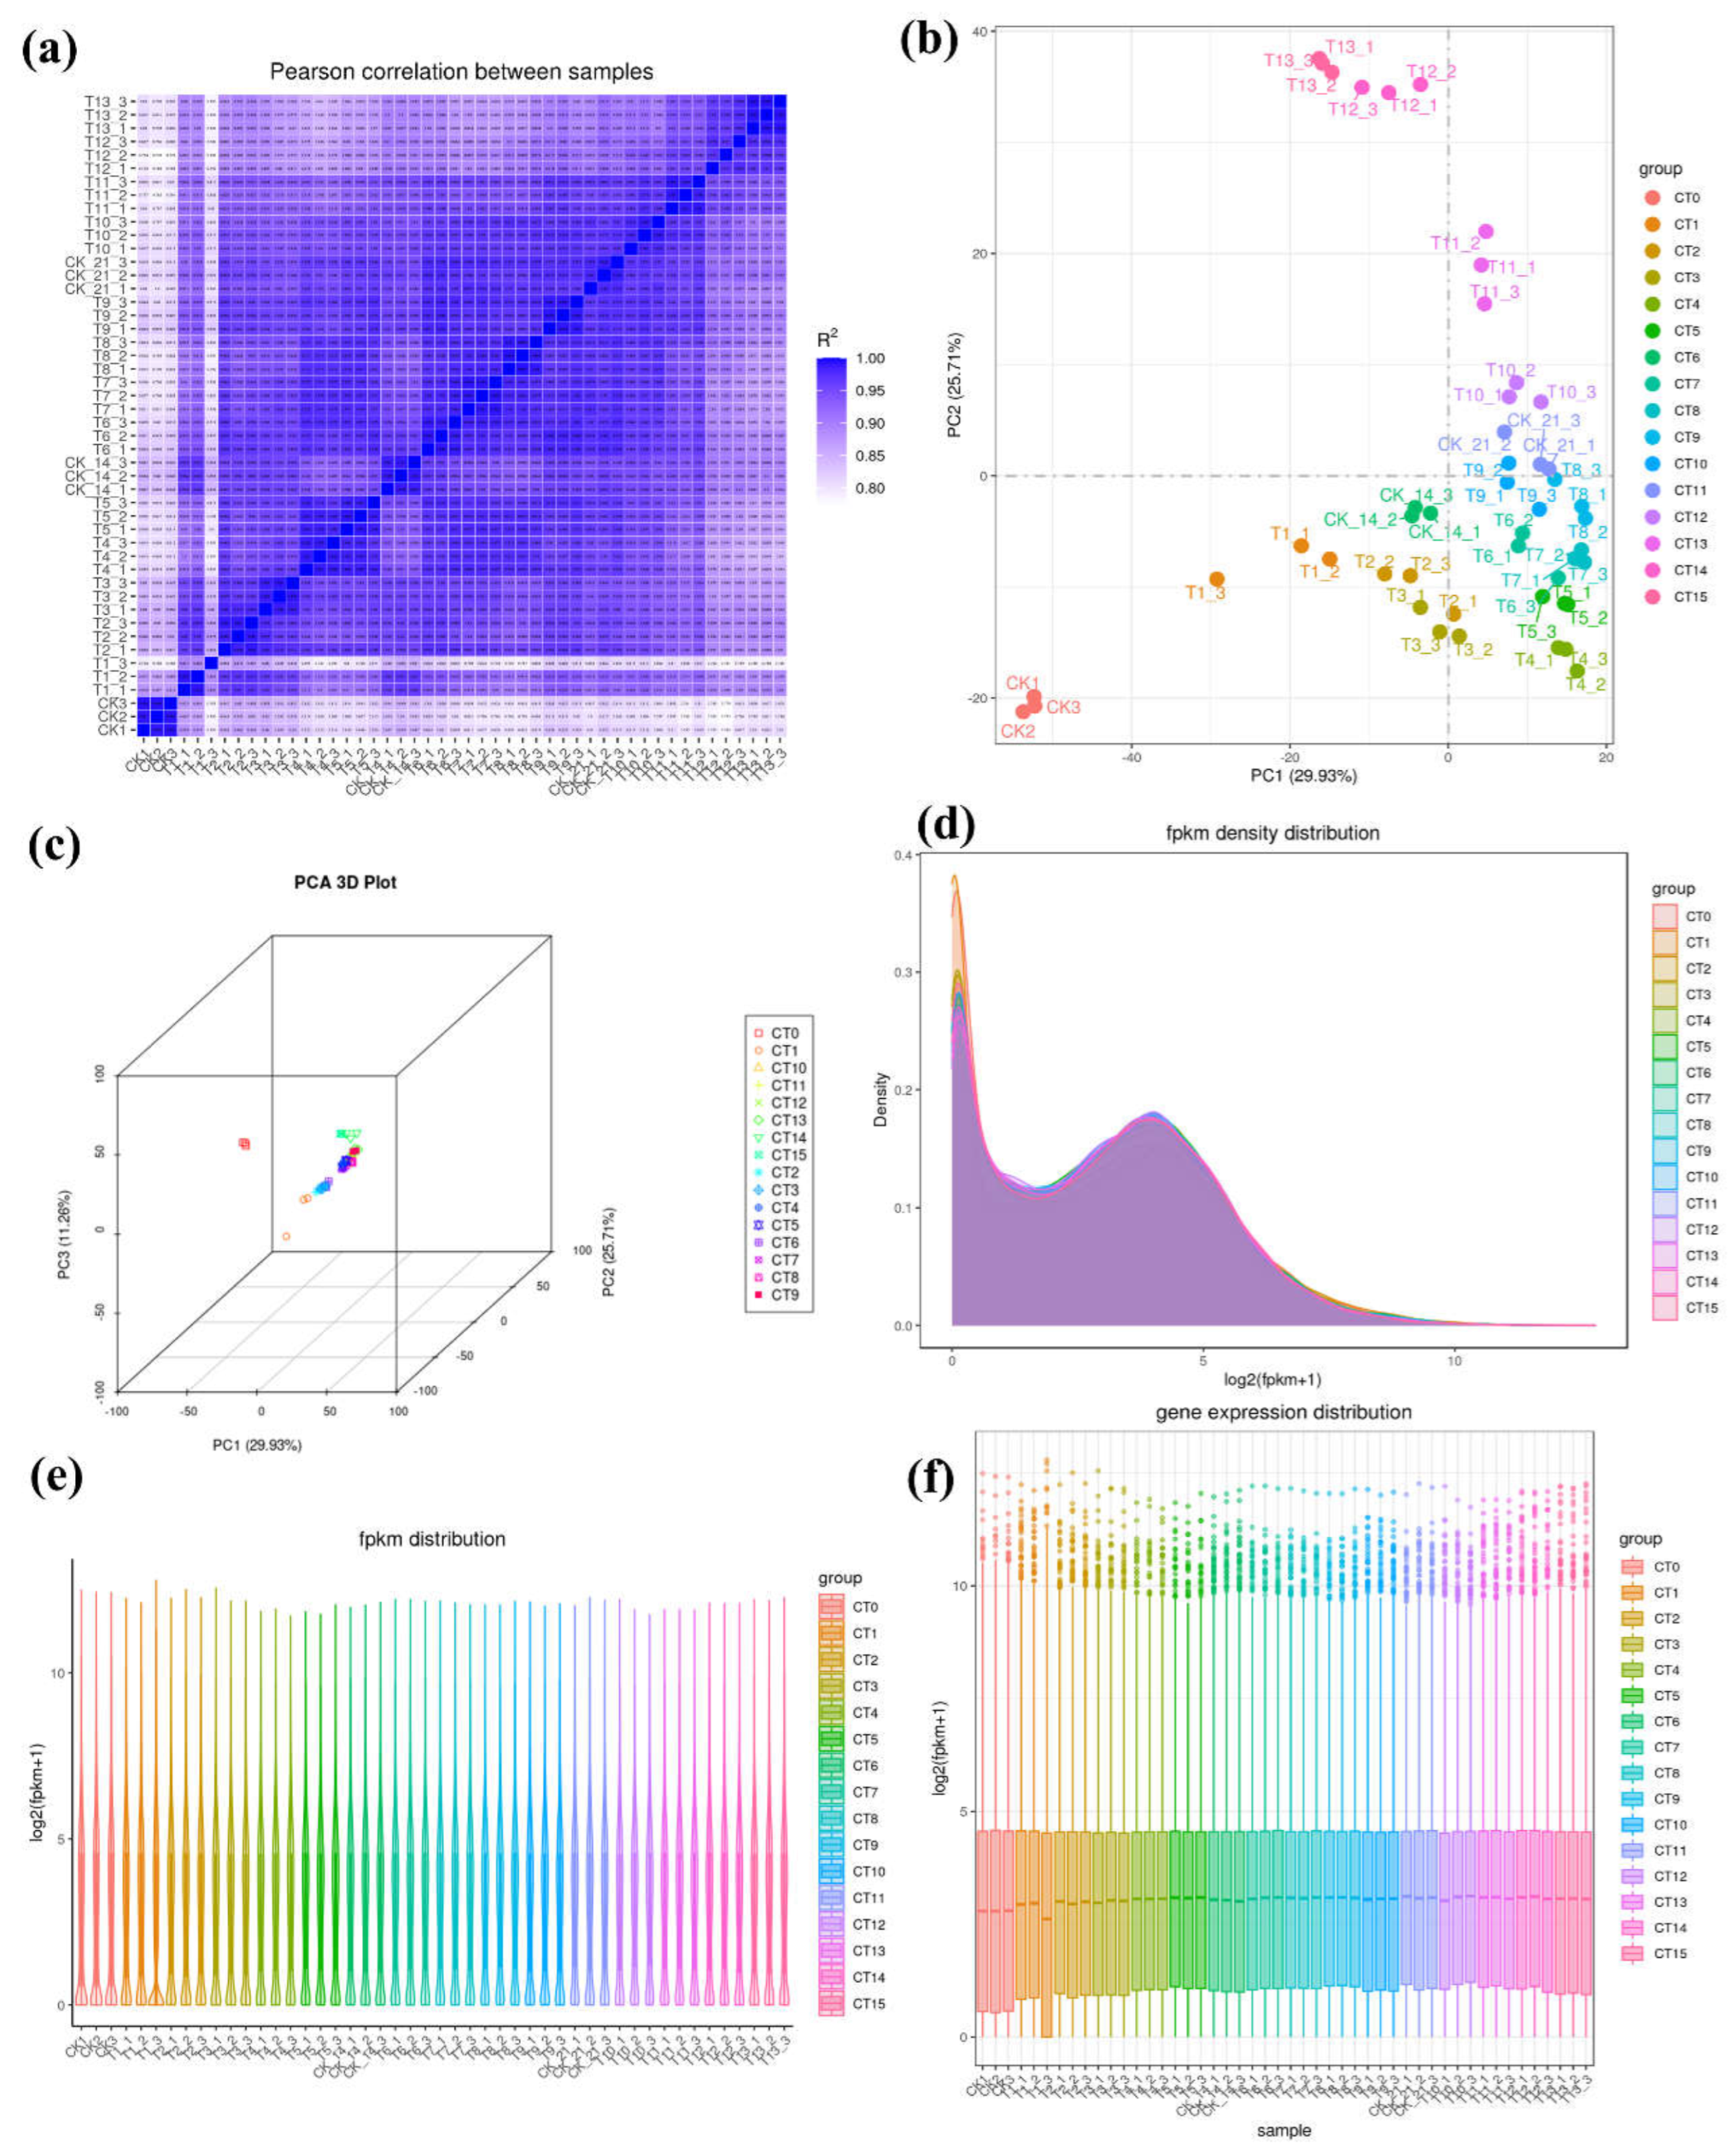
Figure 3.
Comparative analysis of DEGs under different temperatures treated by different cutting days. (a) The number of up and down-regulated DEGs between the 12 comparisons. (b) Heatmap analysis was conducted for 14,380 differentially expressed genes across various comparisons. (c) Venn diagram of the number of DEGs between the four comparisons (CT1 vs CT0, CT2 vs CT6, CT2 vs CT11, and CT2 vs CT1).
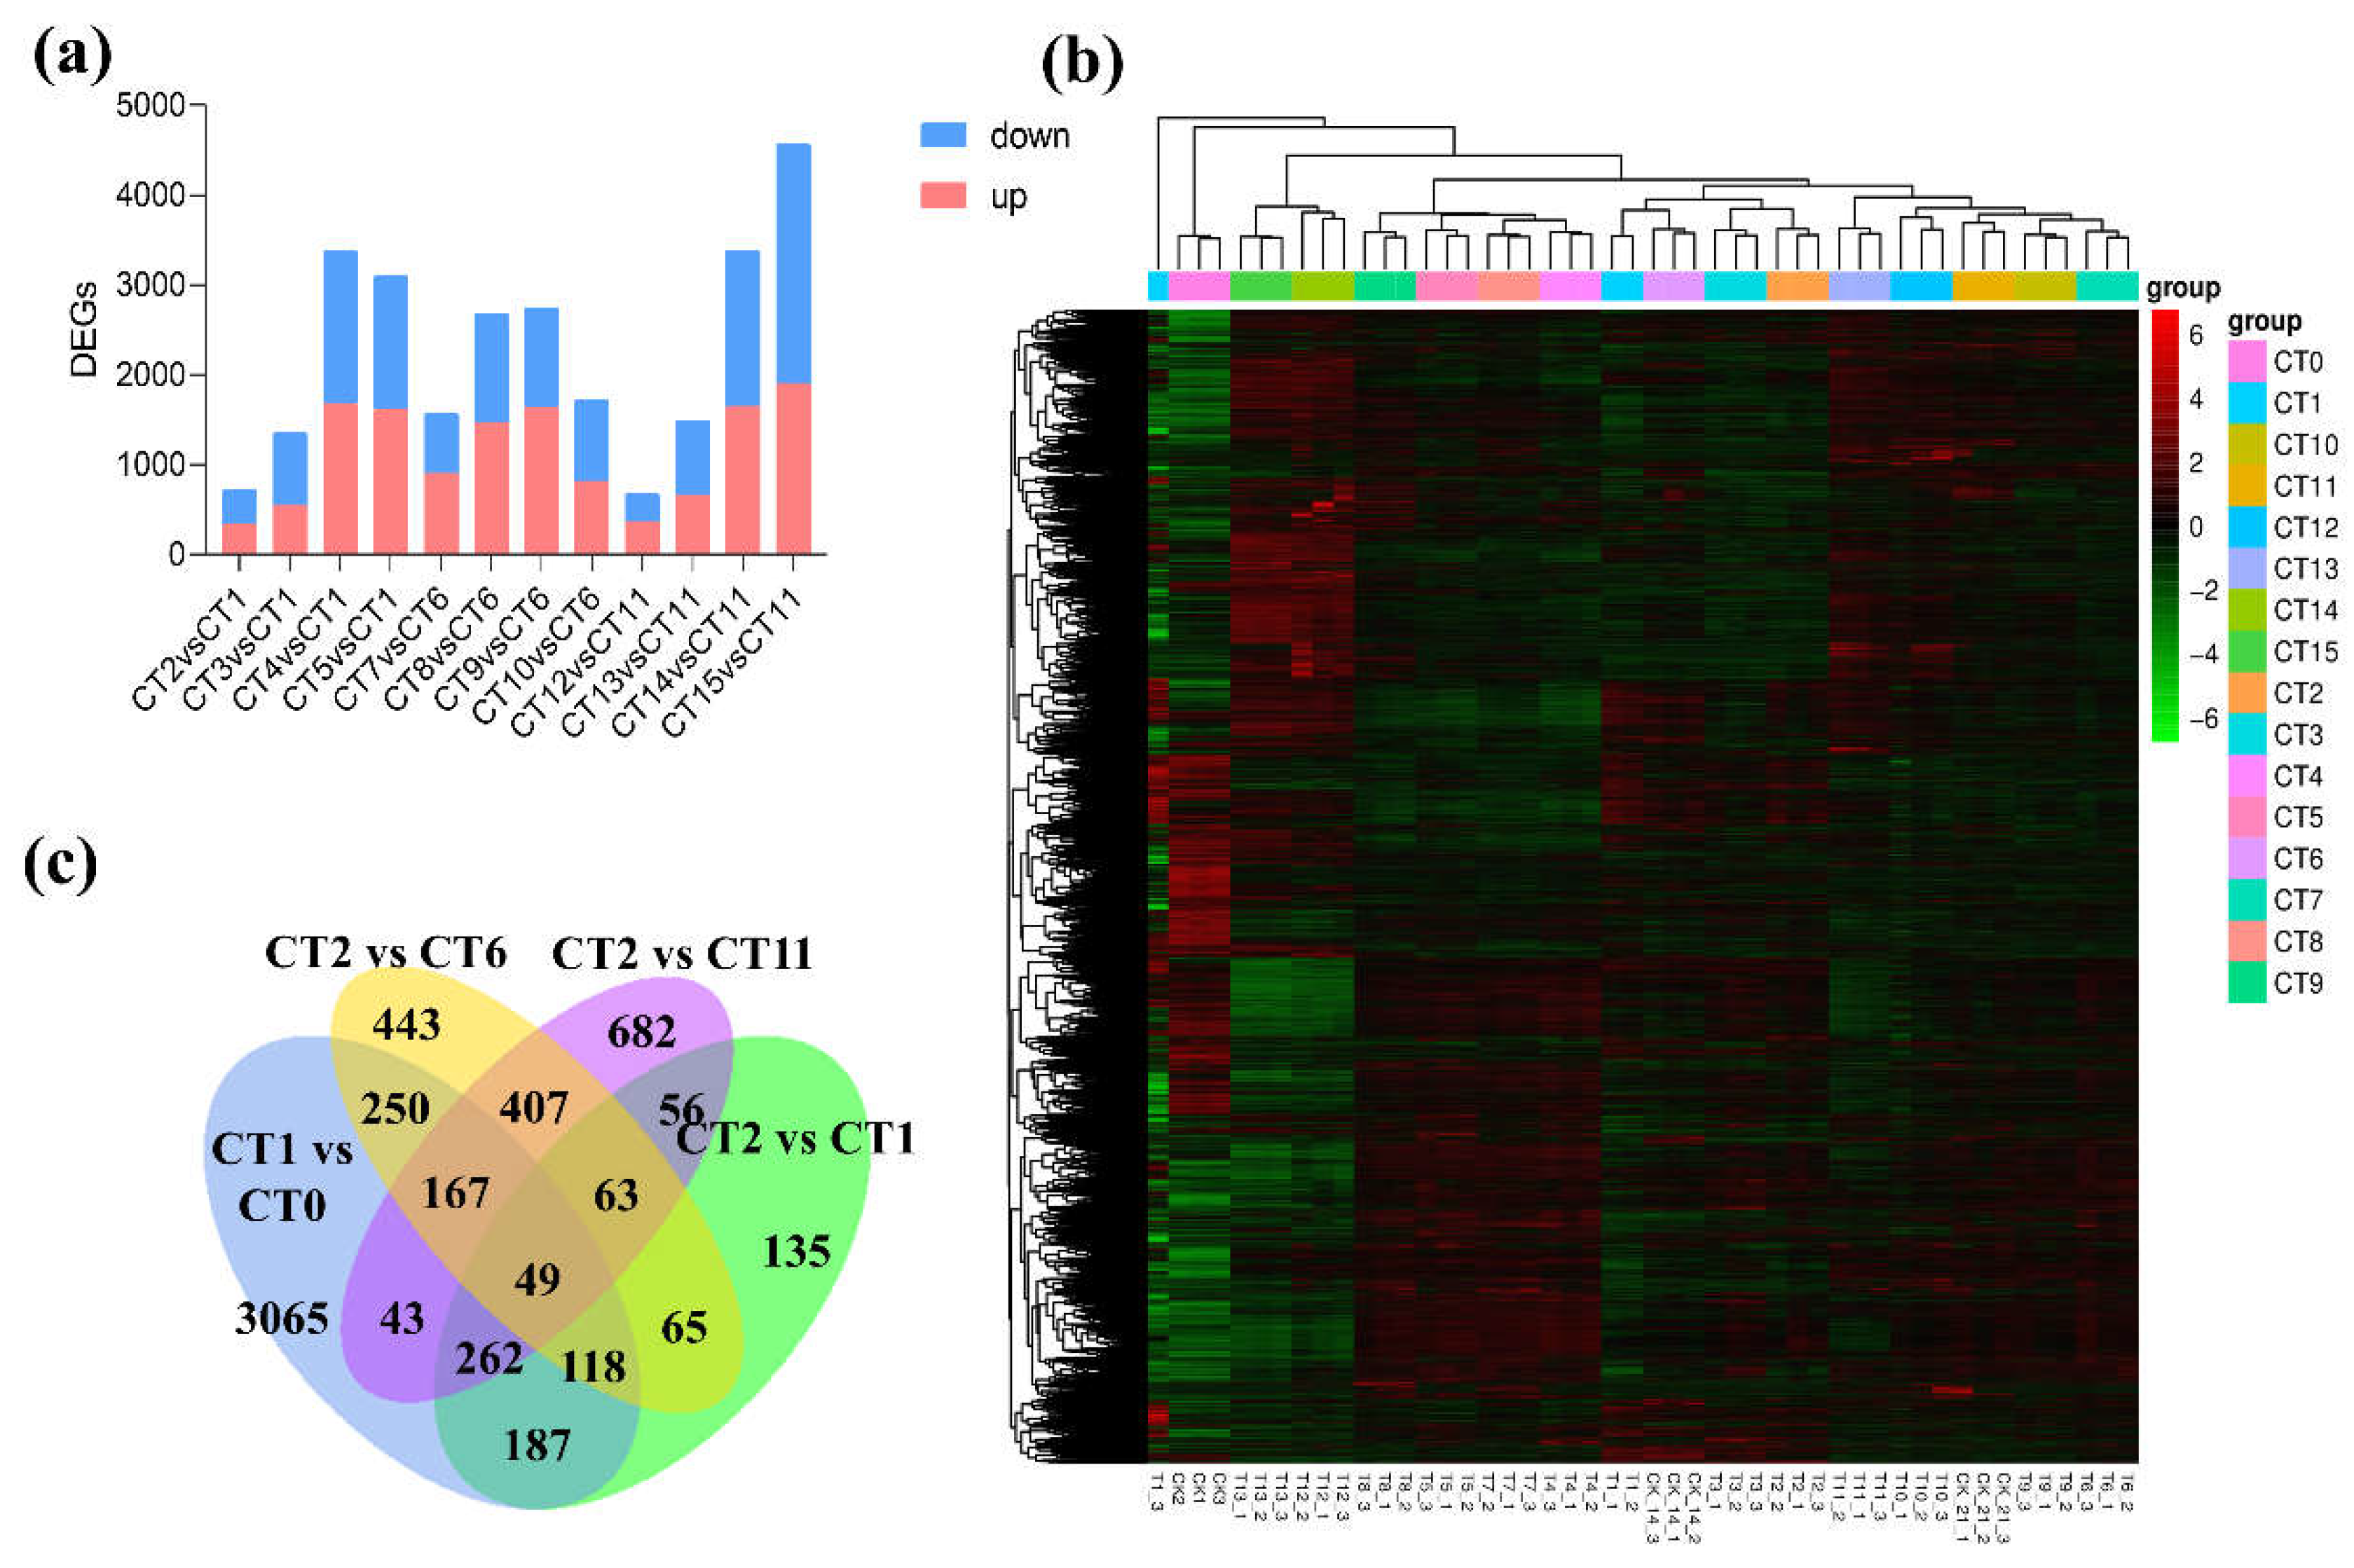
Figure 4.
GO enrichment and KEGG pathway analysis of DEGs. (a) The GO enrichment analysis results between the four comparisons (CT1 vs CT4, CT6 vs CT9 and CT11 vs CT14). (b) The KEGG pathway analysis results between the four comparisons (CT1 vs CT4, CT6 vs CT9, and CT11 vs CT14).
Figure 4.
GO enrichment and KEGG pathway analysis of DEGs. (a) The GO enrichment analysis results between the four comparisons (CT1 vs CT4, CT6 vs CT9 and CT11 vs CT14). (b) The KEGG pathway analysis results between the four comparisons (CT1 vs CT4, CT6 vs CT9, and CT11 vs CT14).
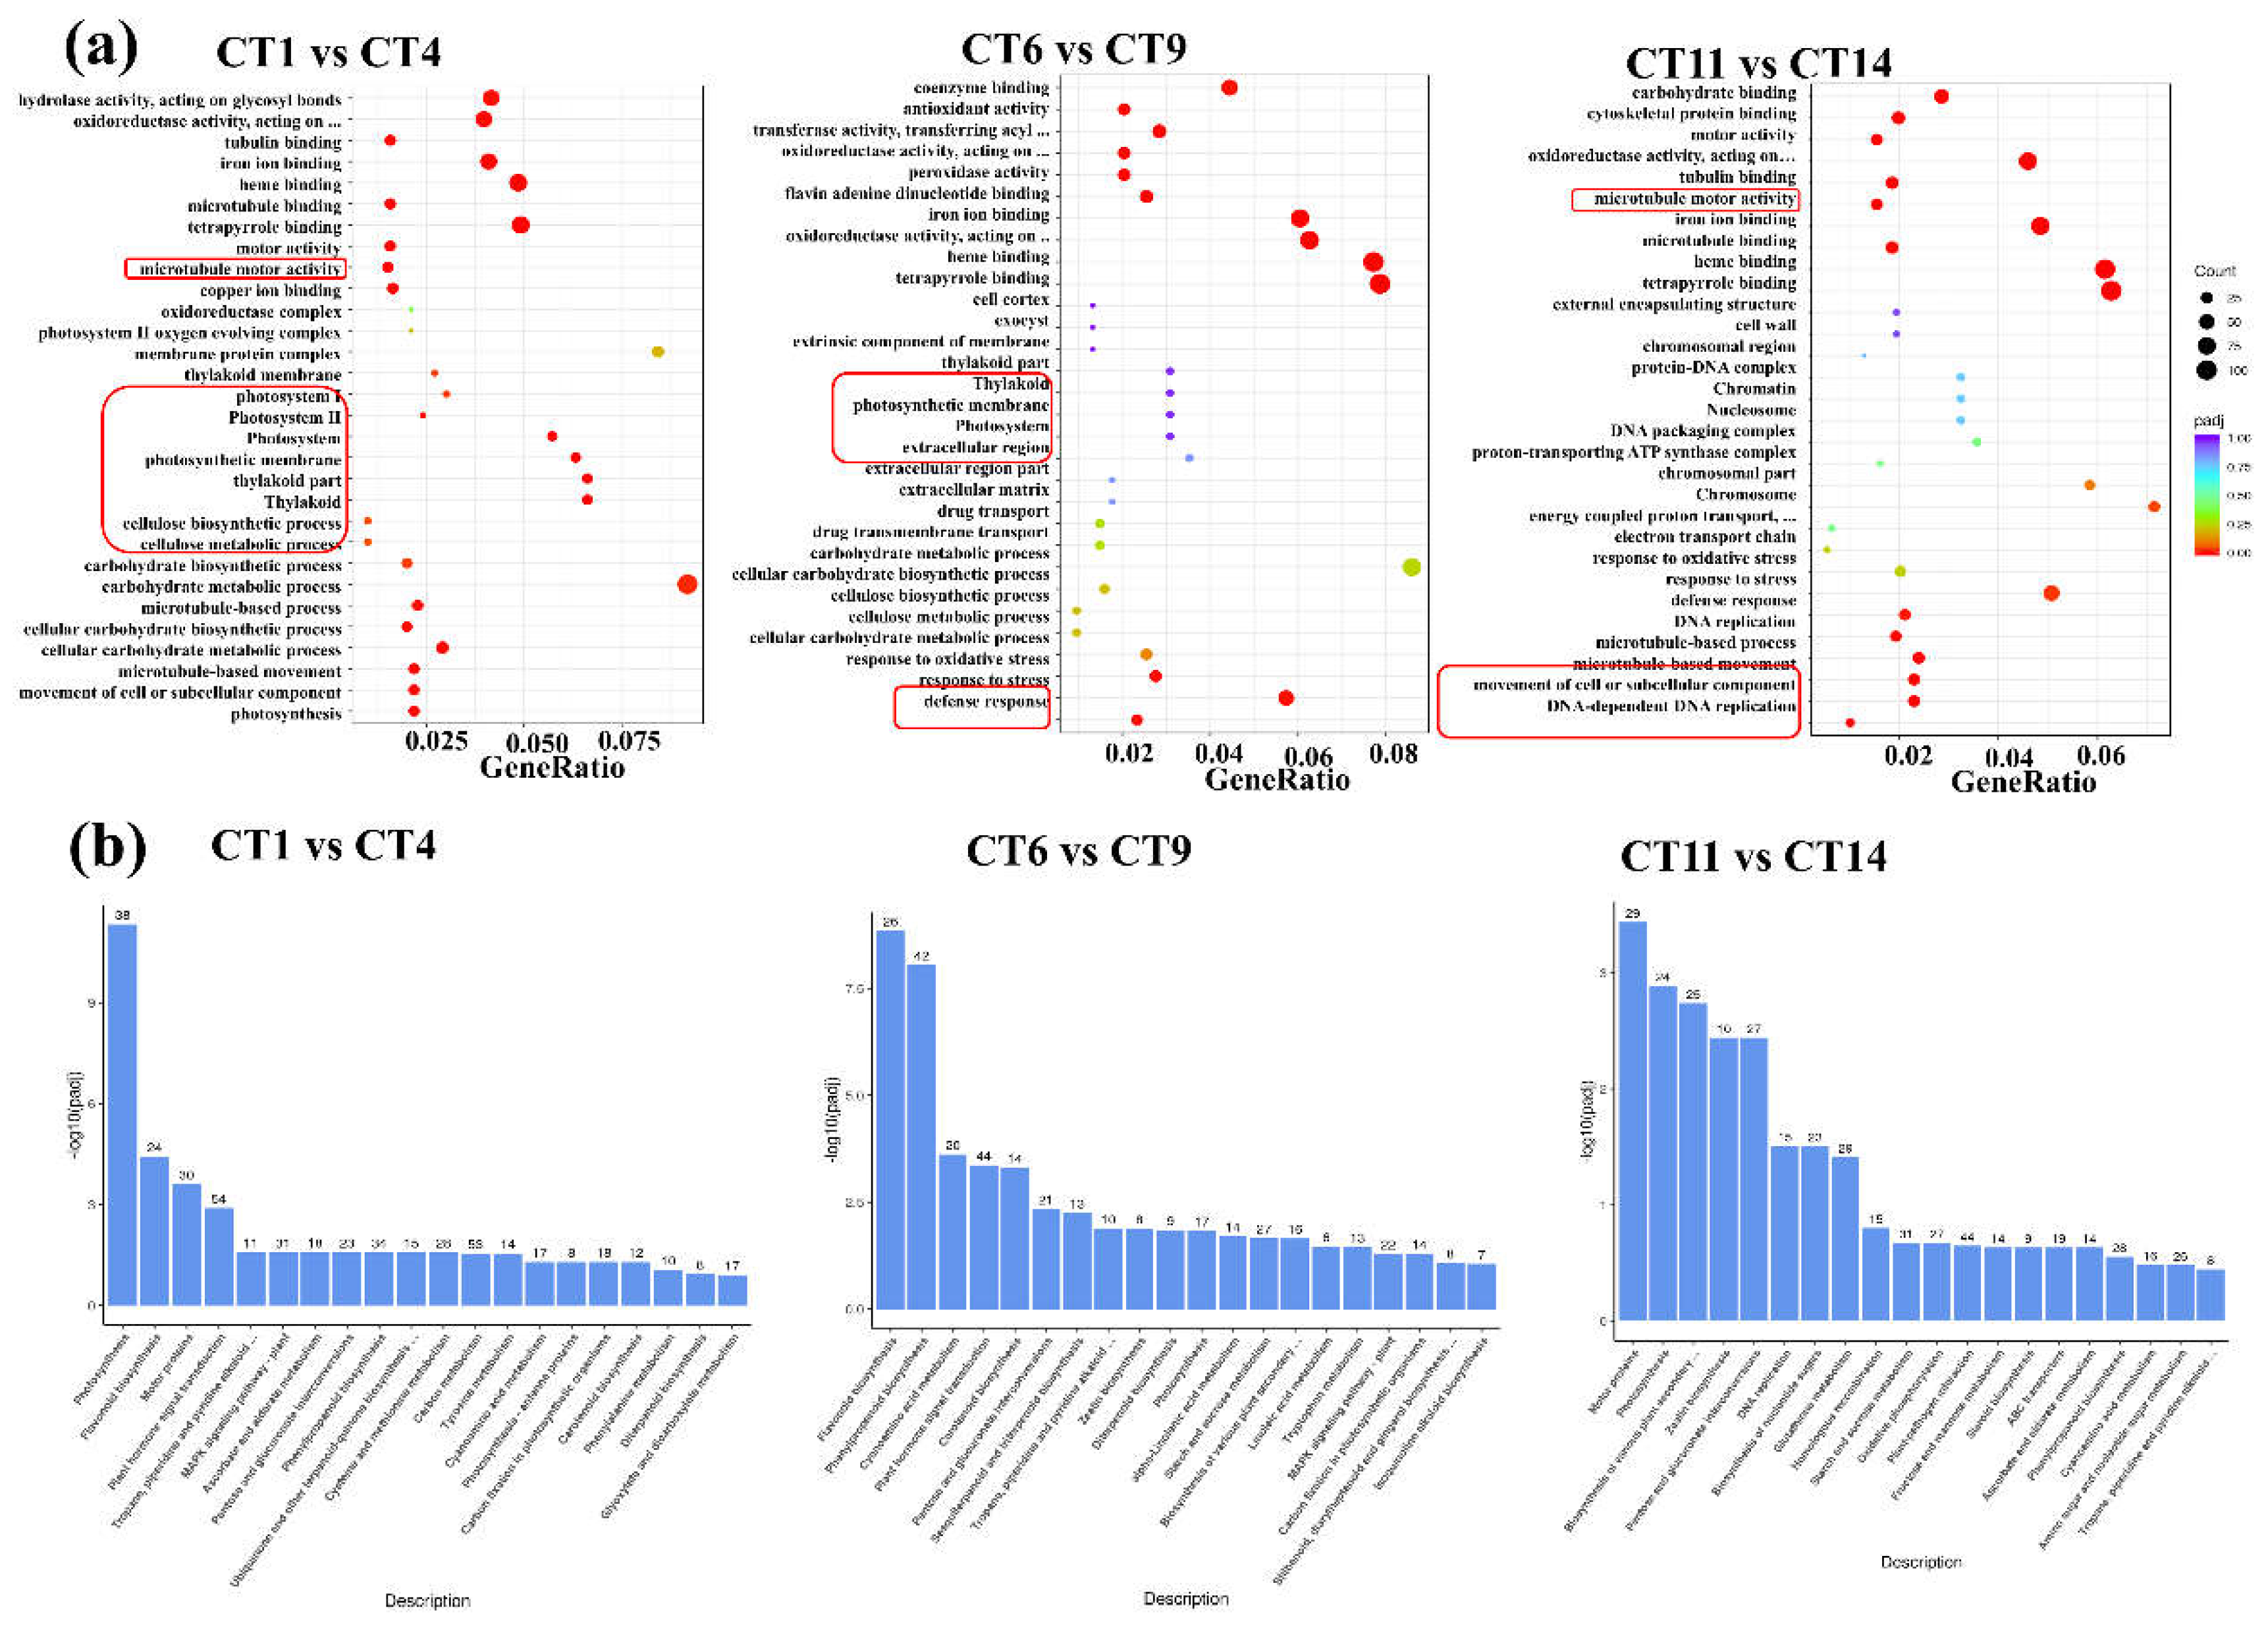
Figure 5.
Heatmap of gene expression related to root development and auxin signaling during the AR formation process in poplar cuttings. In this heatmap, each row represents a specific gene, while each column corresponds to a different sample or time point during the AR formation. The color intensity within each cell indicates the level of gene expression, with red colors signifying higher expression levels and blue colors representing lower expression levels.
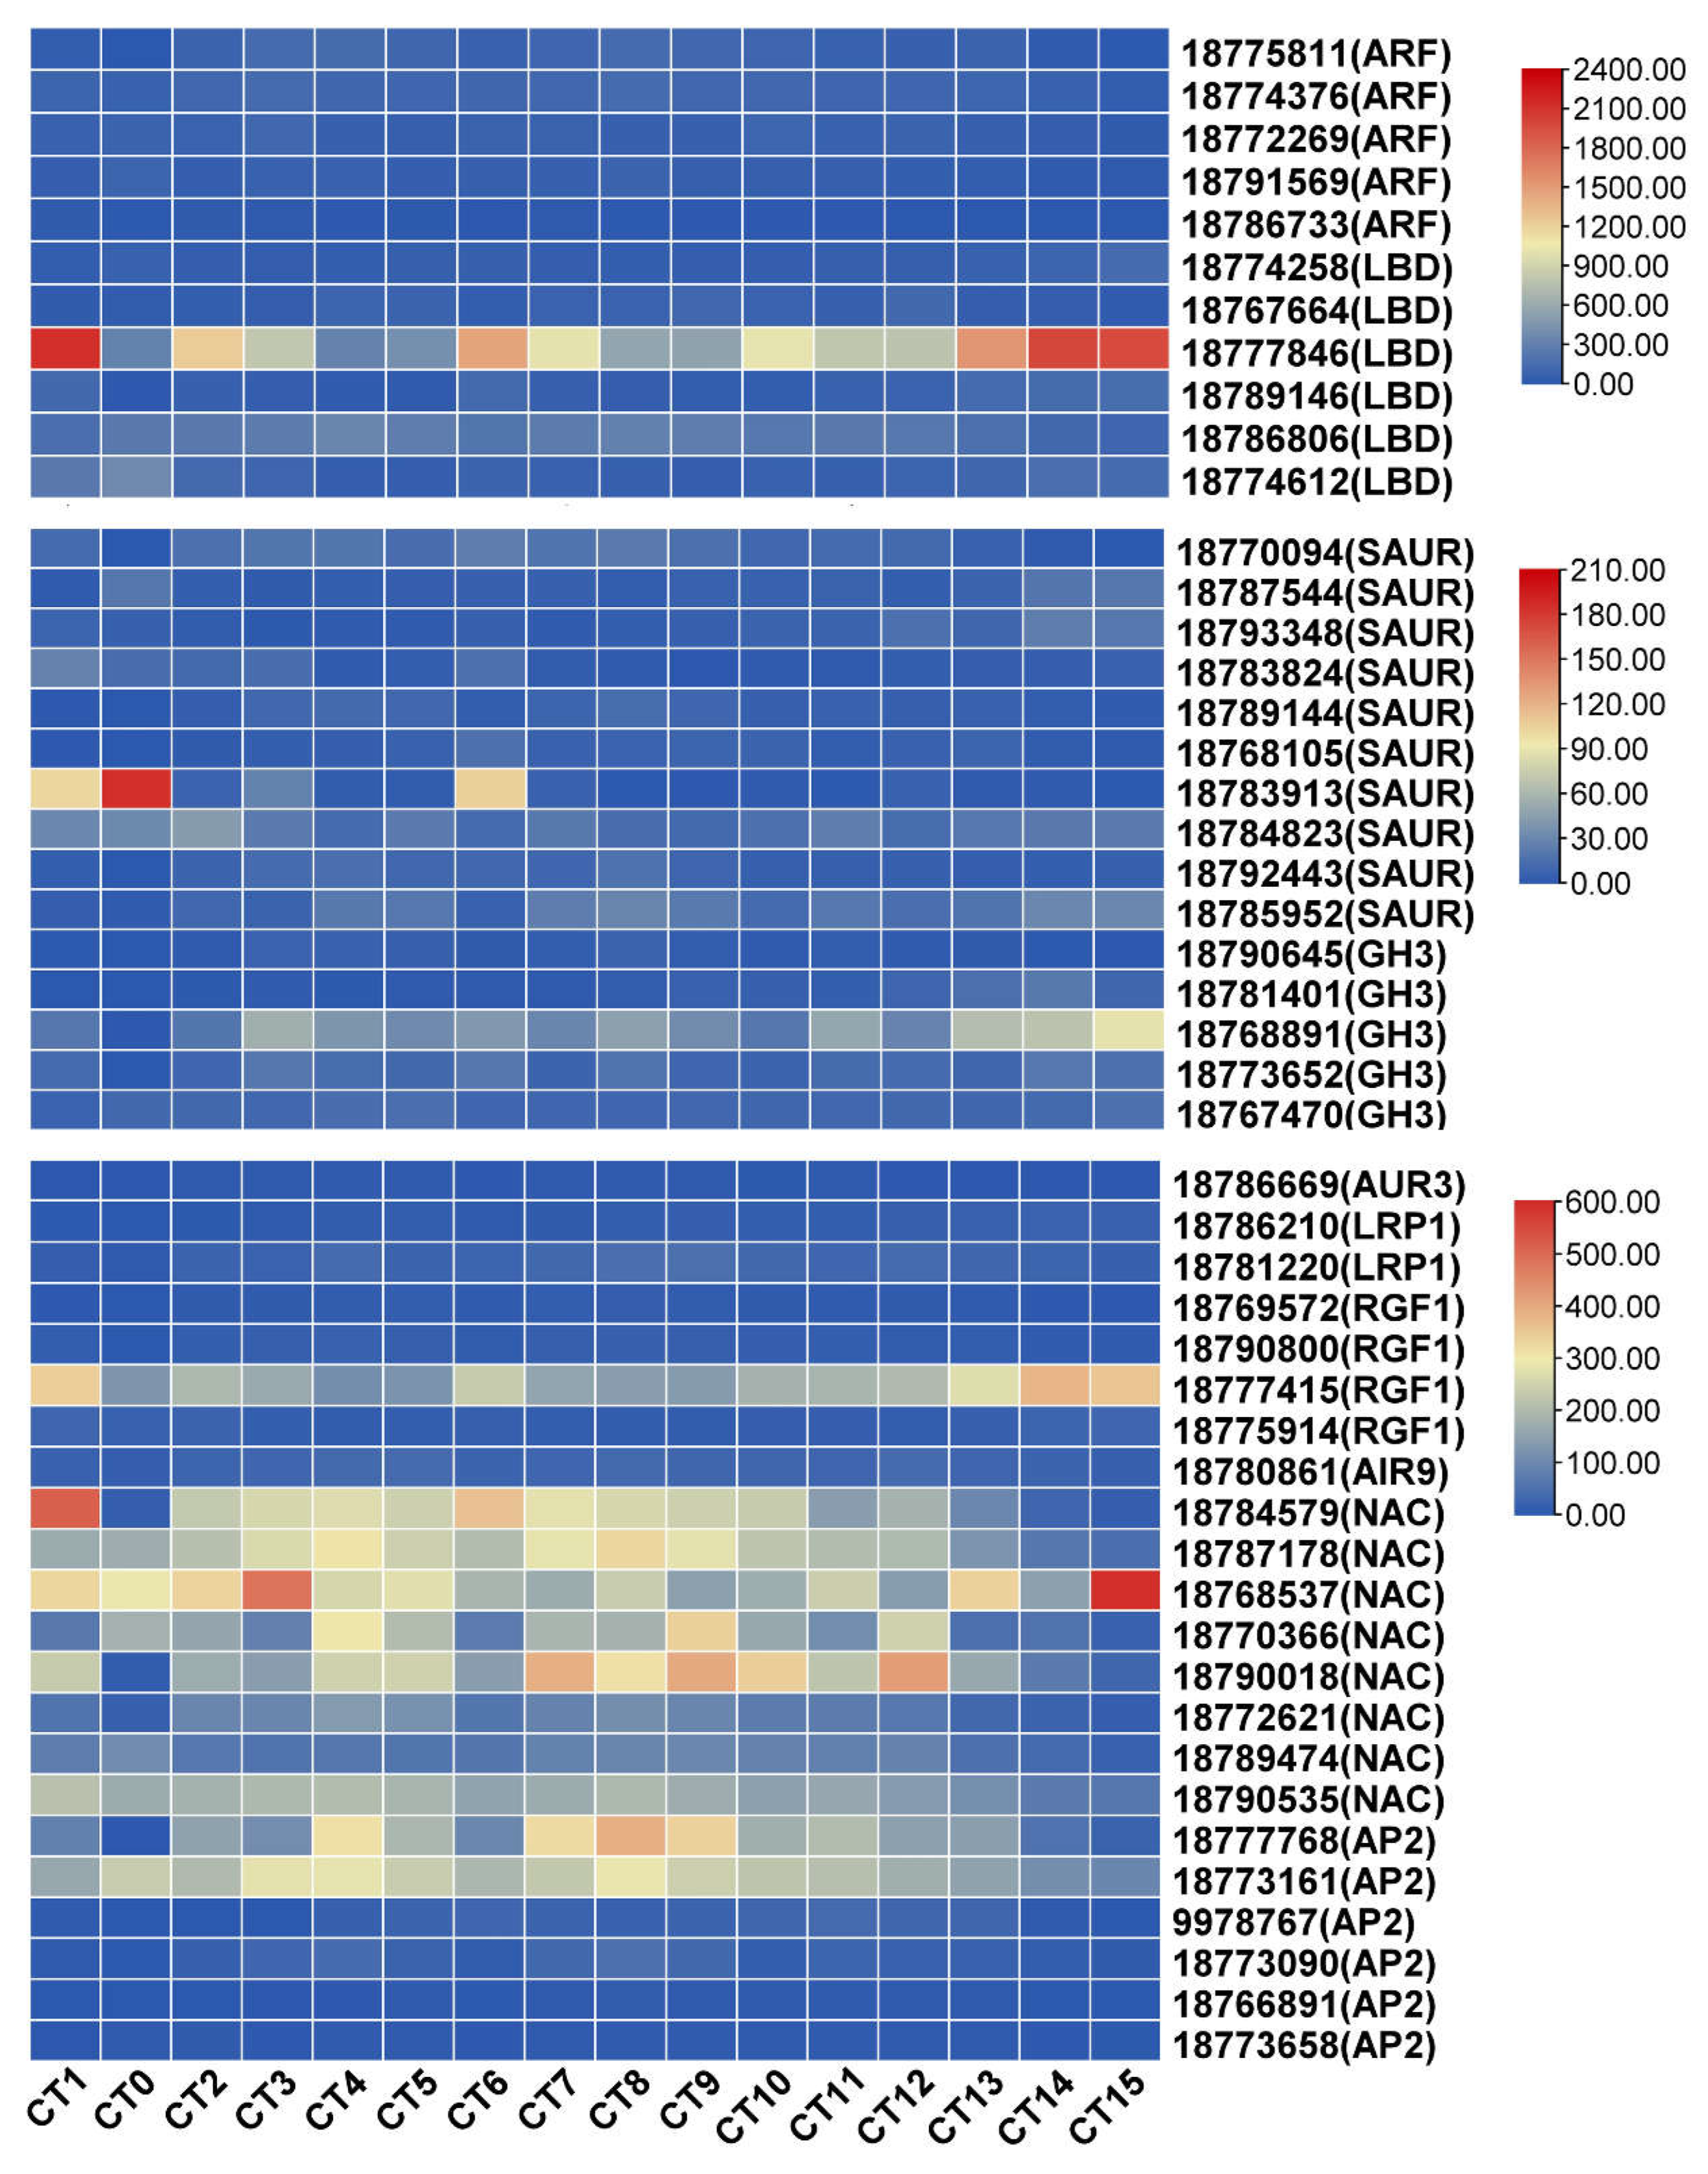
Figure 6.
Weighted gene co-expression network analysis. (a) Clustering and module delineation. (b) Module-and-Sample correlation. This analysis can quantify the degree of association between the gene expression patterns within each module and specific sample groups. (c) Heatmap of gene expression within the modules is used to visualize the relationships between gene expression patterns and sample groups.
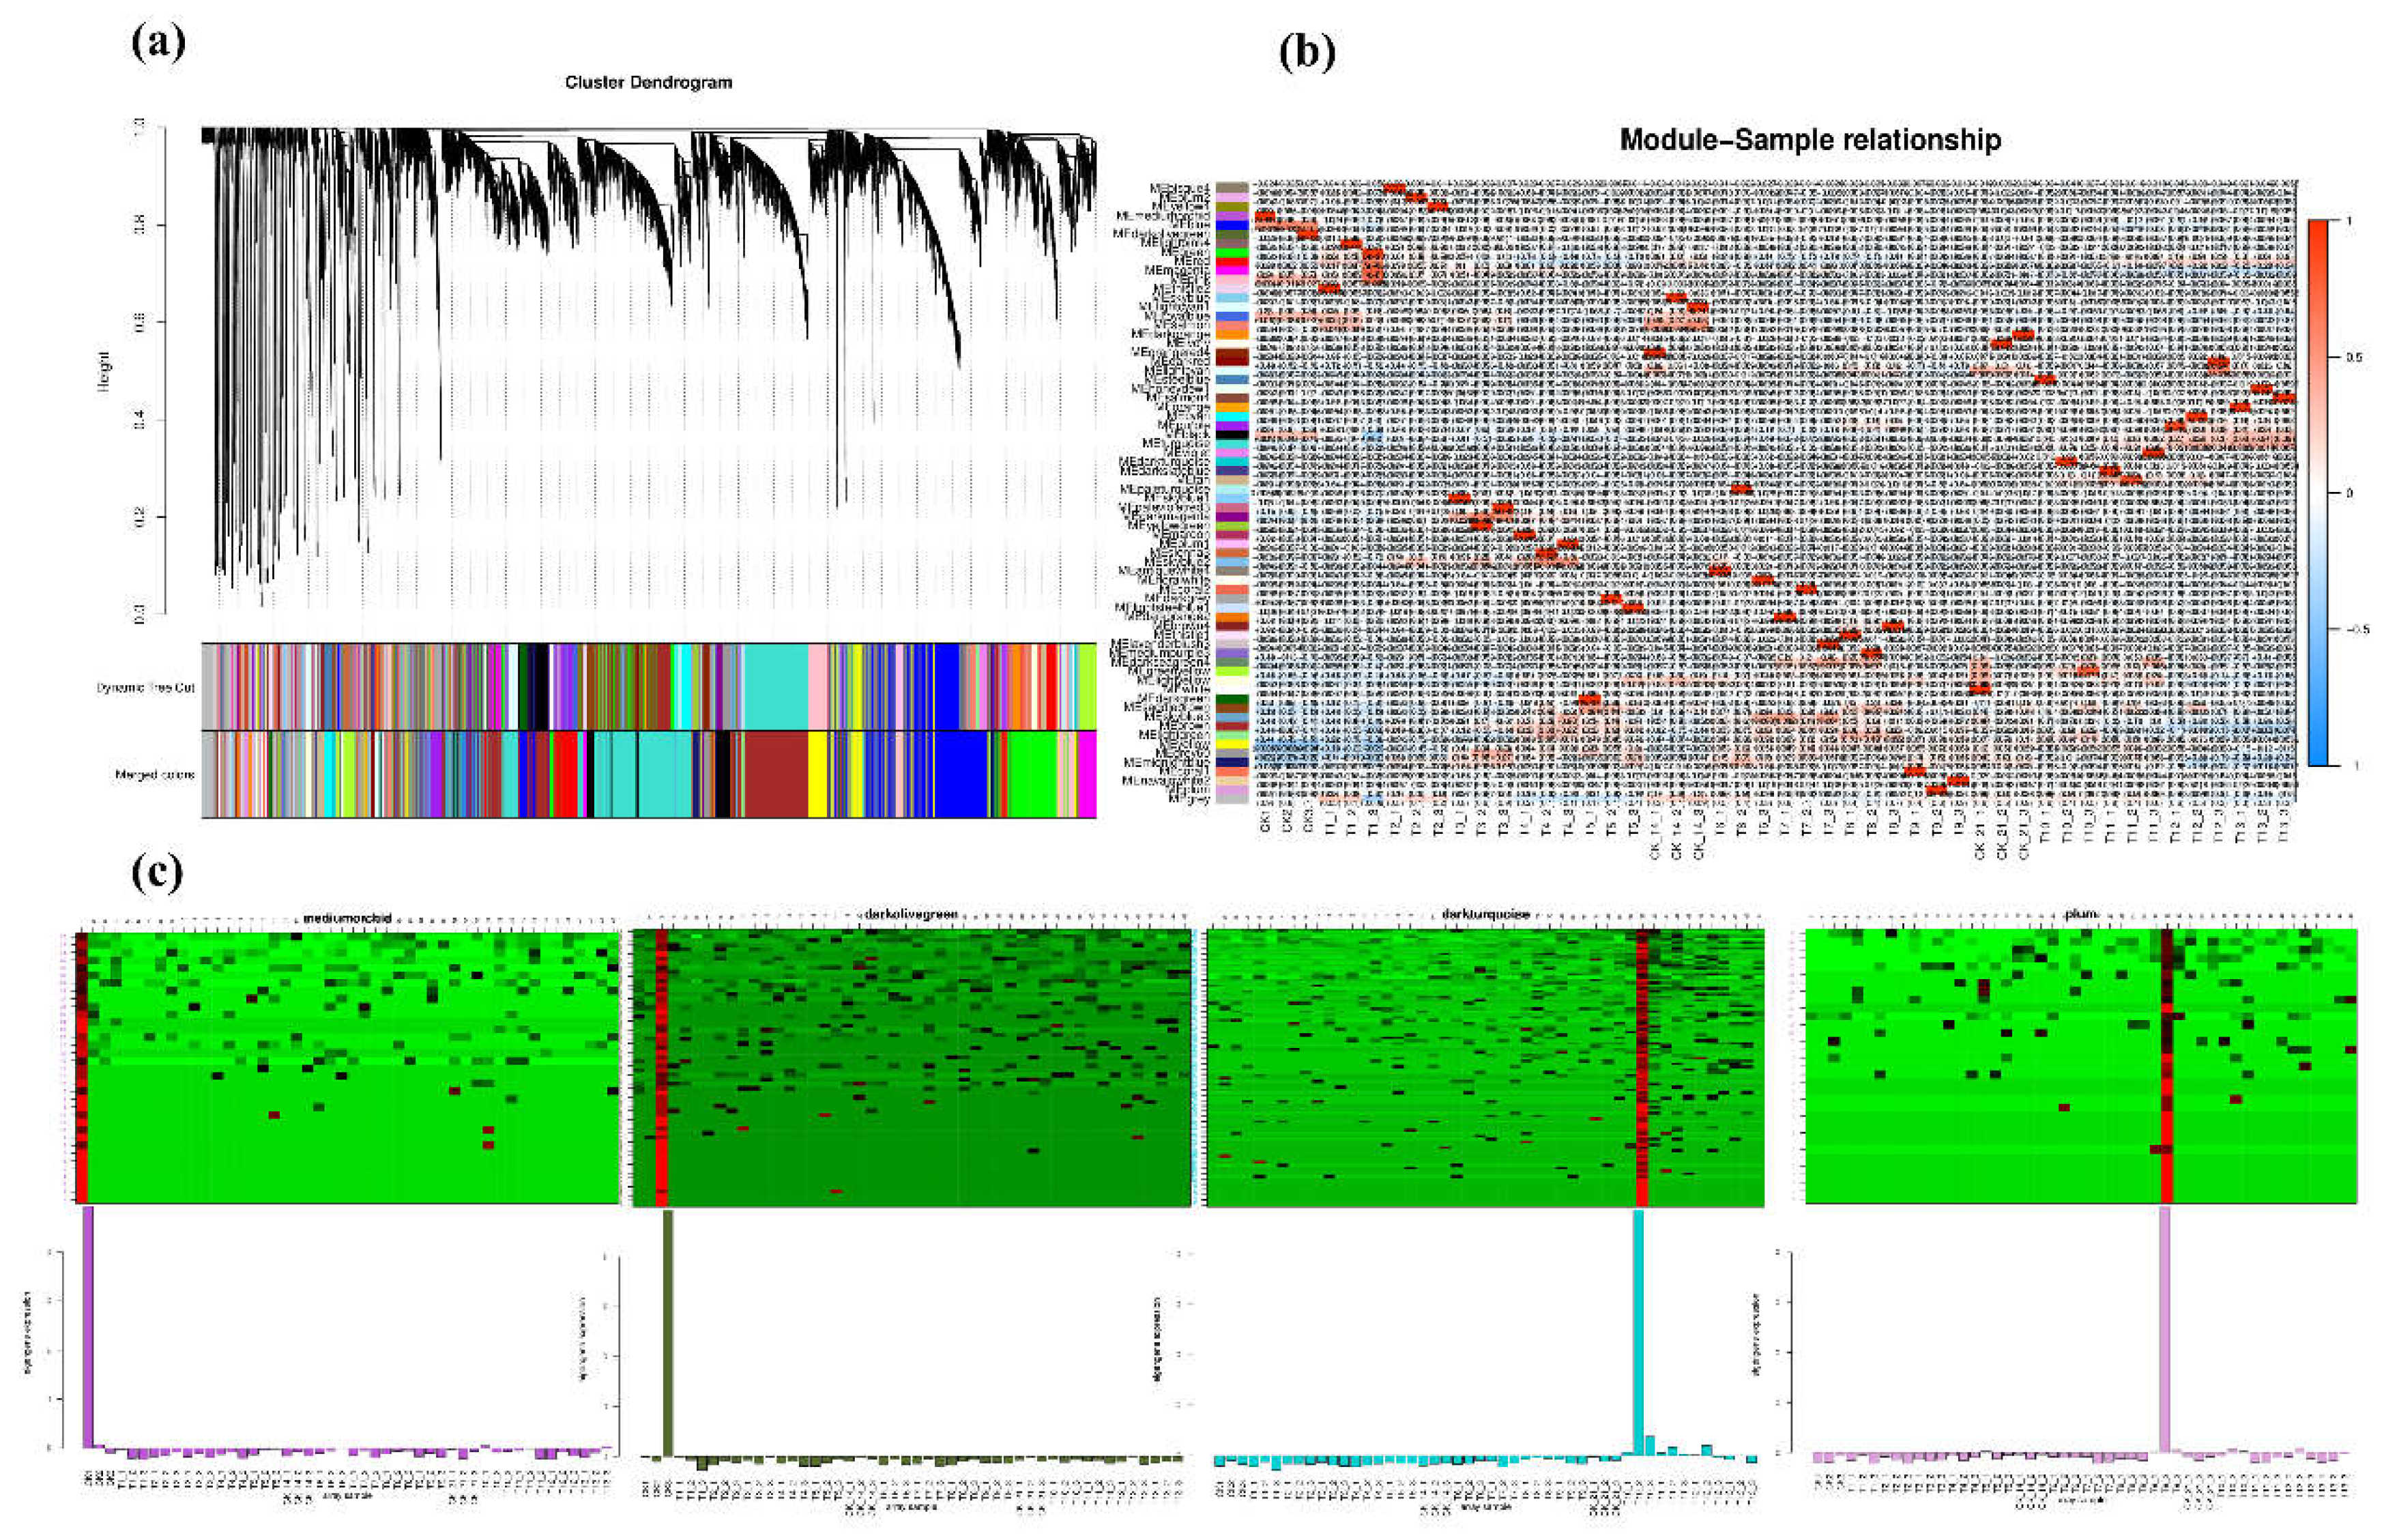

Table 1.
Summary of RNA sequencing data.
| sample | Total raw reads | Total clean reads | Mapped to genome | Q20 (%) | Q30 (%) |
| CK2 | 47896372 | 47054904 | 43367878(92.24%) | 98.71 | 96.03 |
| CK3 | 49075334 | 47491586 | 43524528(92.5%) | 98.7 | 96.03 |
| T1_1 | 46112880 | 45301060 | 43579725(91.76%) | 98.87 | 96.52 |
| T1_2 | 46513084 | 45726832 | 41701330(92.05%) | 98.32 | 94.97 |
| T1_3 | 48004348 | 46895460 | 41989079(91.83%) | 98.65 | 96.02 |
| T2_1 | 46008382 | 44923344 | 40816357(87.04%) | 98.72 | 96.07 |
| T2_2 | 41222534 | 40417280 | 41368746(92.09%) | 98.29 | 94.89 |
| T2_3 | 47780536 | 46894280 | 37188481(92.01%) | 98.64 | 95.84 |
| T3_1 | 49306966 | 48448074 | 43239306(92.21%) | 98.75 | 96.15 |
| T3_2 | 43377072 | 42720960 | 44320546(91.48%) | 98.59 | 95.71 |
| T3_3 | 47114448 | 46115510 | 39675545(92.87%) | 98.73 | 96.07 |
| T4_1 | 47472882 | 46615394 | 42722806(92.64%) | 98.59 | 95.7 |
| T4_2 | 41419734 | 40721474 | 42620563(91.43%) | 98.63 | 95.82 |
| T4_3 | 46931744 | 46132170 | 37493665(92.07%) | 98.58 | 95.7 |
| T5_1 | 42571156 | 41766276 | 42280235(91.65%) | 98.68 | 95.94 |
| T5_2 | 40391866 | 39734218 | 38366128(91.86%) | 98.51 | 95.45 |
| T5_3 | 47855332 | 46983982 | 36152071(90.98%) | 98.62 | 95.77 |
| CK_14_1 | 45846246 | 44855450 | 42885665(91.28%) | 98.64 | 95.84 |
| CK_14_2 | 44378214 | 43377076 | 40900606(91.18%) | 98.33 | 94.99 |
| CK_14_3 | 49966392 | 48015634 | 39447161(90.94%) | 98.84 | 96.46 |
| T6_1 | 44398656 | 43761882 | 43531783(90.66%) | 98.66 | 95.9 |
| T6_2 | 47909356 | 46768074 | 39847771(91.06%) | 98.67 | 95.93 |
| T6_3 | 45331290 | 43896236 | 42655348(91.21%) | 98.66 | 95.91 |
| T7_1 | 40947492 | 40247198 | 40036895(91.21%) | 98.6 | 95.75 |
| T7_2 | 40677260 | 39979808 | 36715915(91.23%) | 98.68 | 95.97 |
| T7_3 | 40433808 | 39794474 | 36710211(91.82%) | 98.57 | 95.6 |
| T8_1 | 47231542 | 46321786 | 36550697(91.85%) | 98.62 | 95.79 |
| T8_2 | 41345866 | 40678696 | 42117224(90.92%) | 98.62 | 95.79 |
| T8_3 | 44547176 | 43796224 | 37076433(91.14%) | 98.63 | 95.83 |
| T9_1 | 44651492 | 43904988 | 39825654(90.93%) | 98.68 | 95.96 |
| T9_2 | 43849526 | 43155586 | 40171431(91.5%) | 98.66 | 95.9 |
| T9_3 | 39875306 | 39036404 | 39536447(91.61%) | 98.55 | 95.59 |
| CK_21_1 | 46027828 | 45074462 | 35861001(91.87%) | 98.64 | 95.85 |
| CK_21_2 | 47123826 | 46200950 | 40851282(90.63%) | 98.59 | 95.7 |
| CK_21_3 | 40978358 | 39970156 | 42096191(91.12%) | 98.31 | 94.95 |
| T10_1 | 48580358 | 47360950 | 36344705(90.93%) | 98.67 | 95.93 |
| T10_2 | 47158522 | 46329548 | 43021908(90.84%) | 98.61 | 95.8 |
| T10_3 | 49484862 | 48556220 | 42013549(90.68%) | 98.56 | 95.62 |
| T11_1 | 48290834 | 47349840 | 44159009(90.94%) | 98.67 | 95.93 |
| T11_2 | 48314980 | 47500624 | 43256047(91.35%) | 98.49 | 95.38 |
| T11_3 | 46036442 | 45205652 | 42973556(90.47%) | 98.65 | 95.87 |
| T12_1 | 42609072 | 41682398 | 41274112(91.3%) | 98.65 | 95.88 |
| T12_2 | 48868252 | 47932620 | 36962679(88.68%) | 98.59 | 95.74 |
| T12_3 | 41867310 | 41154606 | 40140961(83.74%) | 98.51 | 95.46 |
| T13_1 | 47484014 | 46618360 | 37344121(90.74%) | 98.71 | 96.03 |
| T13_2 | 48005162 | 46647020 | 41306853(88.61%) | 98.66 | 95.9 |
| T13_3 | 46150870 | 44995606 | 41825243(89.66%) | 98.7 | 96 |
| Total | 2185,245,500 | 2141129916 |
Disclaimer/Publisher’s Note: The statements, opinions and data contained in all publications are solely those of the individual author(s) and contributor(s) and not of MDPI and/or the editor(s). MDPI and/or the editor(s) disclaim responsibility for any injury to people or property resulting from any ideas, methods, instructions or products referred to in the content. |
© 2025 by the authors. Licensee MDPI, Basel, Switzerland. This article is an open access article distributed under the terms and conditions of the Creative Commons Attribution (CC BY) license (http://creativecommons.org/licenses/by/4.0/).
Copyright: This open access article is published under a Creative Commons CC BY 4.0 license, which permit the free download, distribution, and reuse, provided that the author and preprint are cited in any reuse.


