Preprint
Article

This version is not peer-reviewed.

Evaluating Habitat Suitability for the Endangered Sinojackia xylocarpa (Styracaceae) in China Under Climate Change Based on Ensemble Modeling and Gap Analysis

A peer-reviewed article of this preprint also exists.

Submitted:

09 February 2025

Posted:

10 February 2025

You are already at the latest version

Abstract

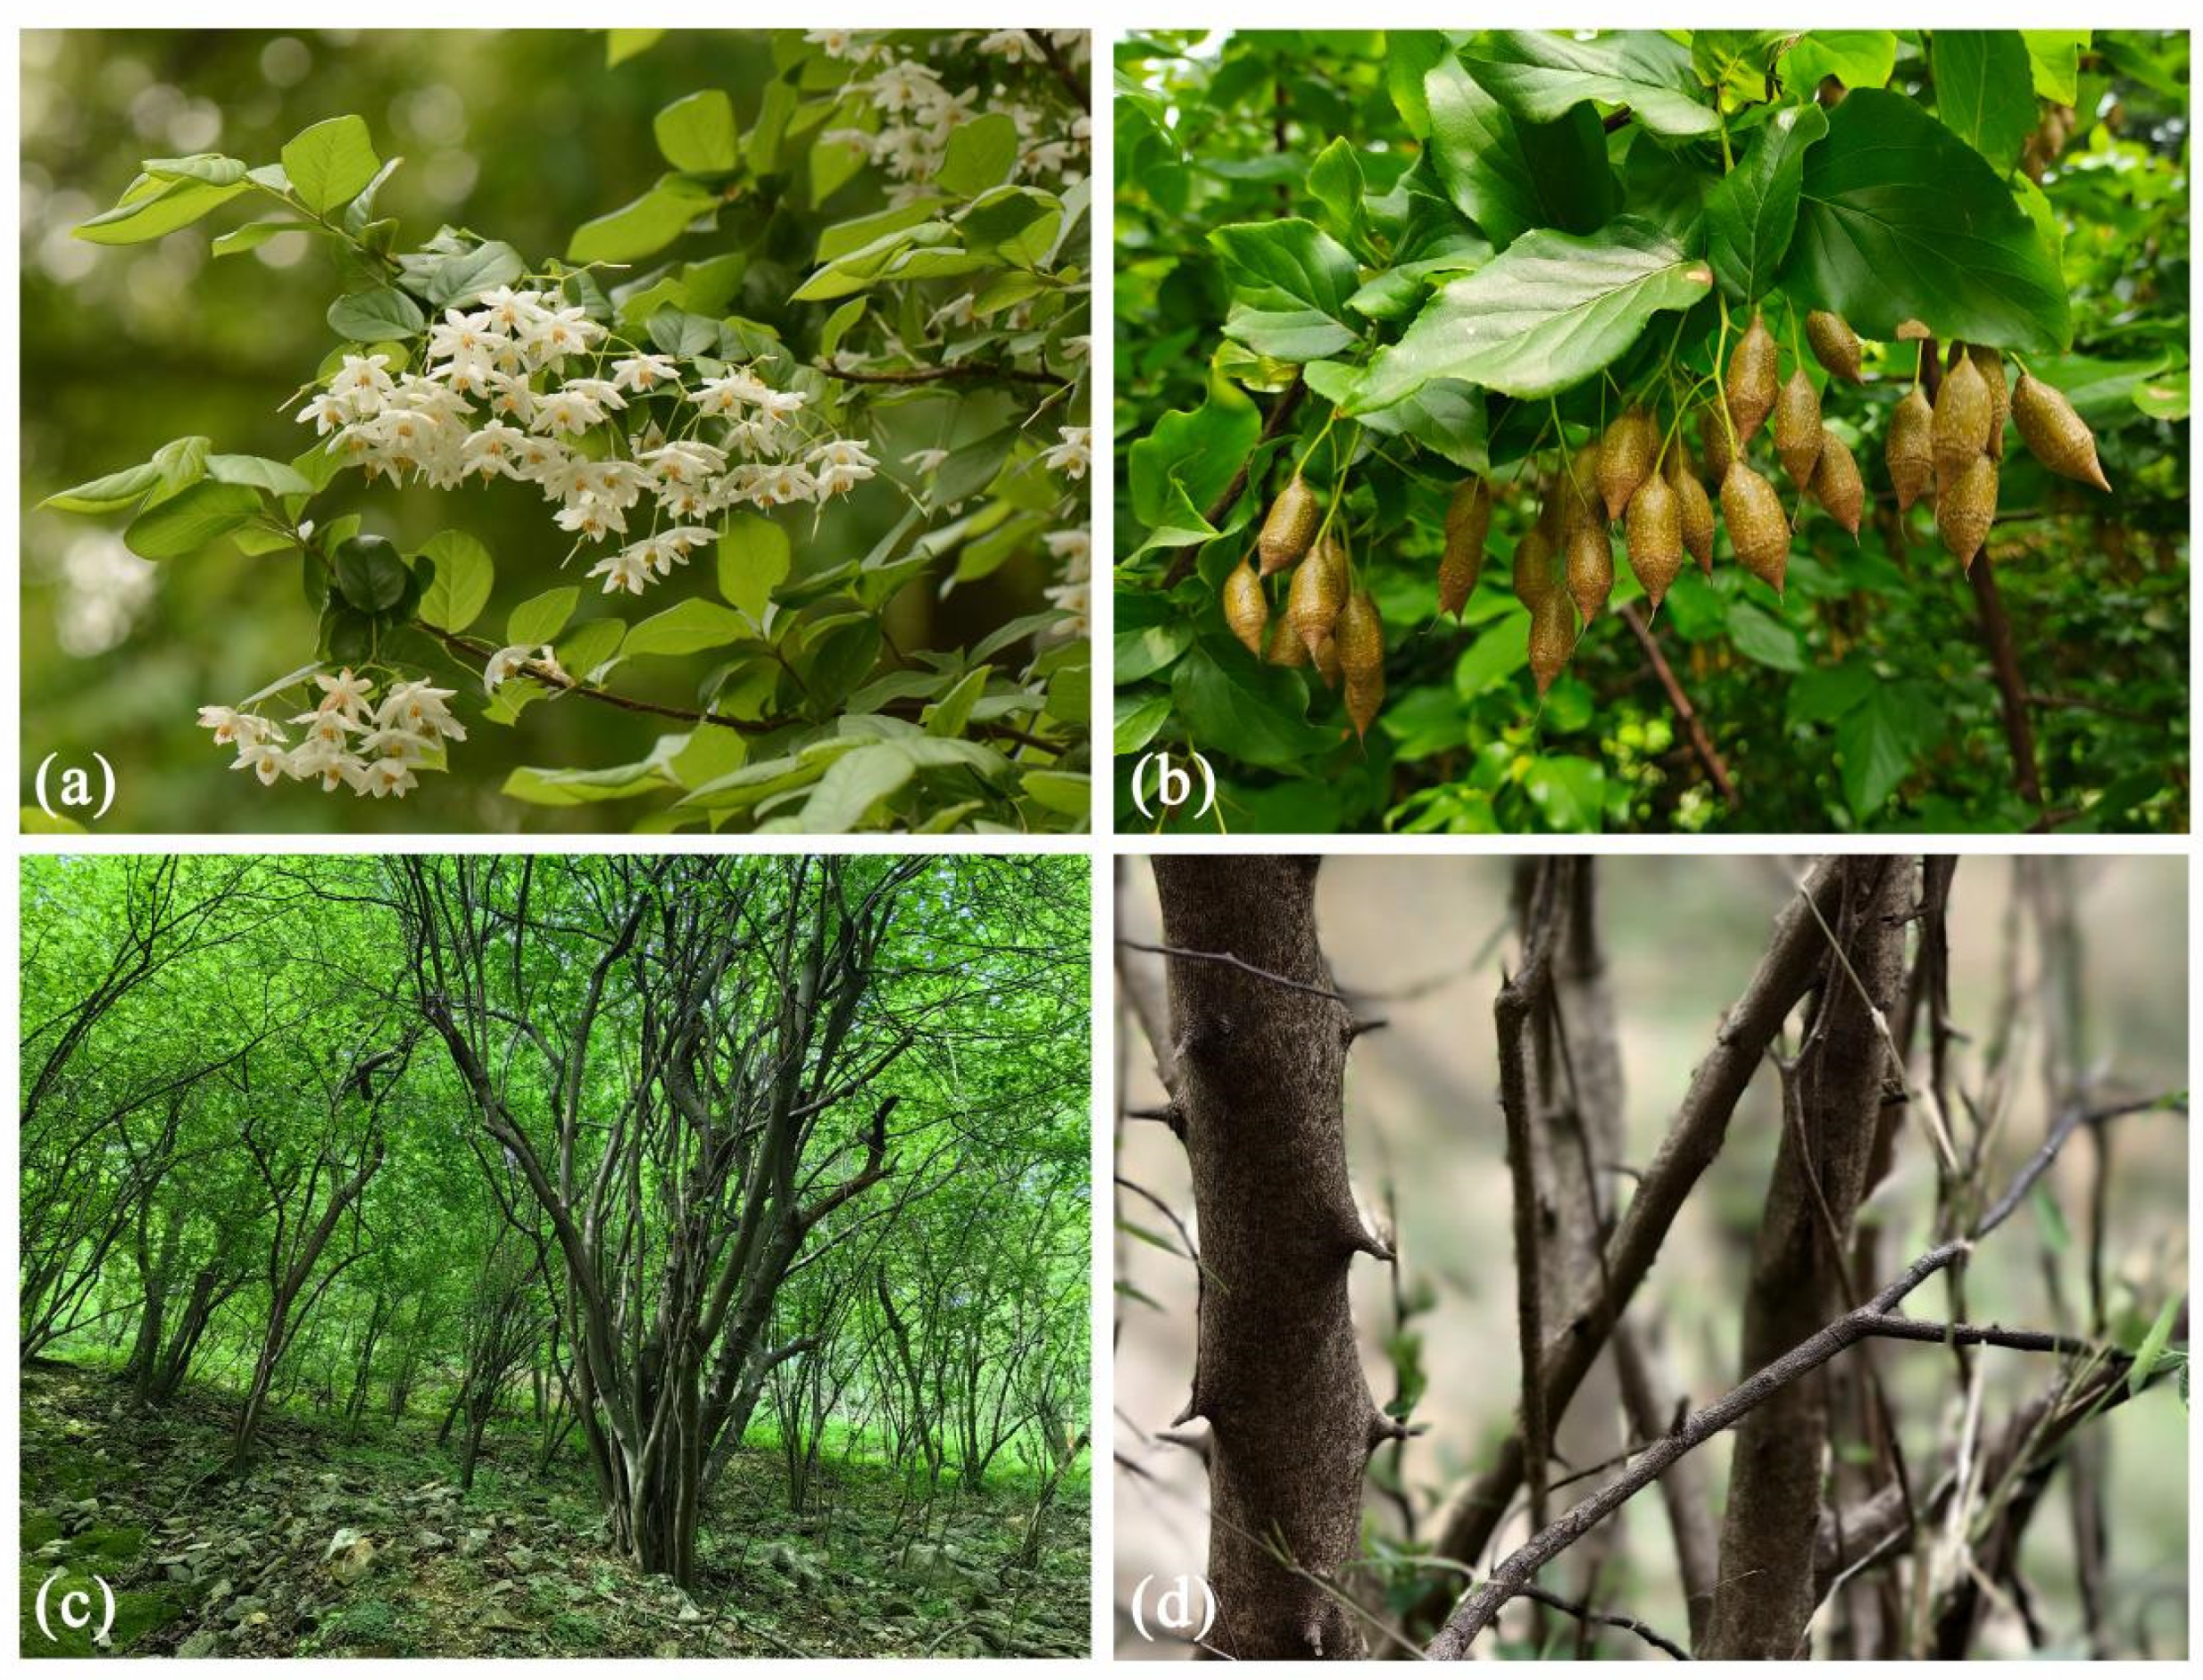
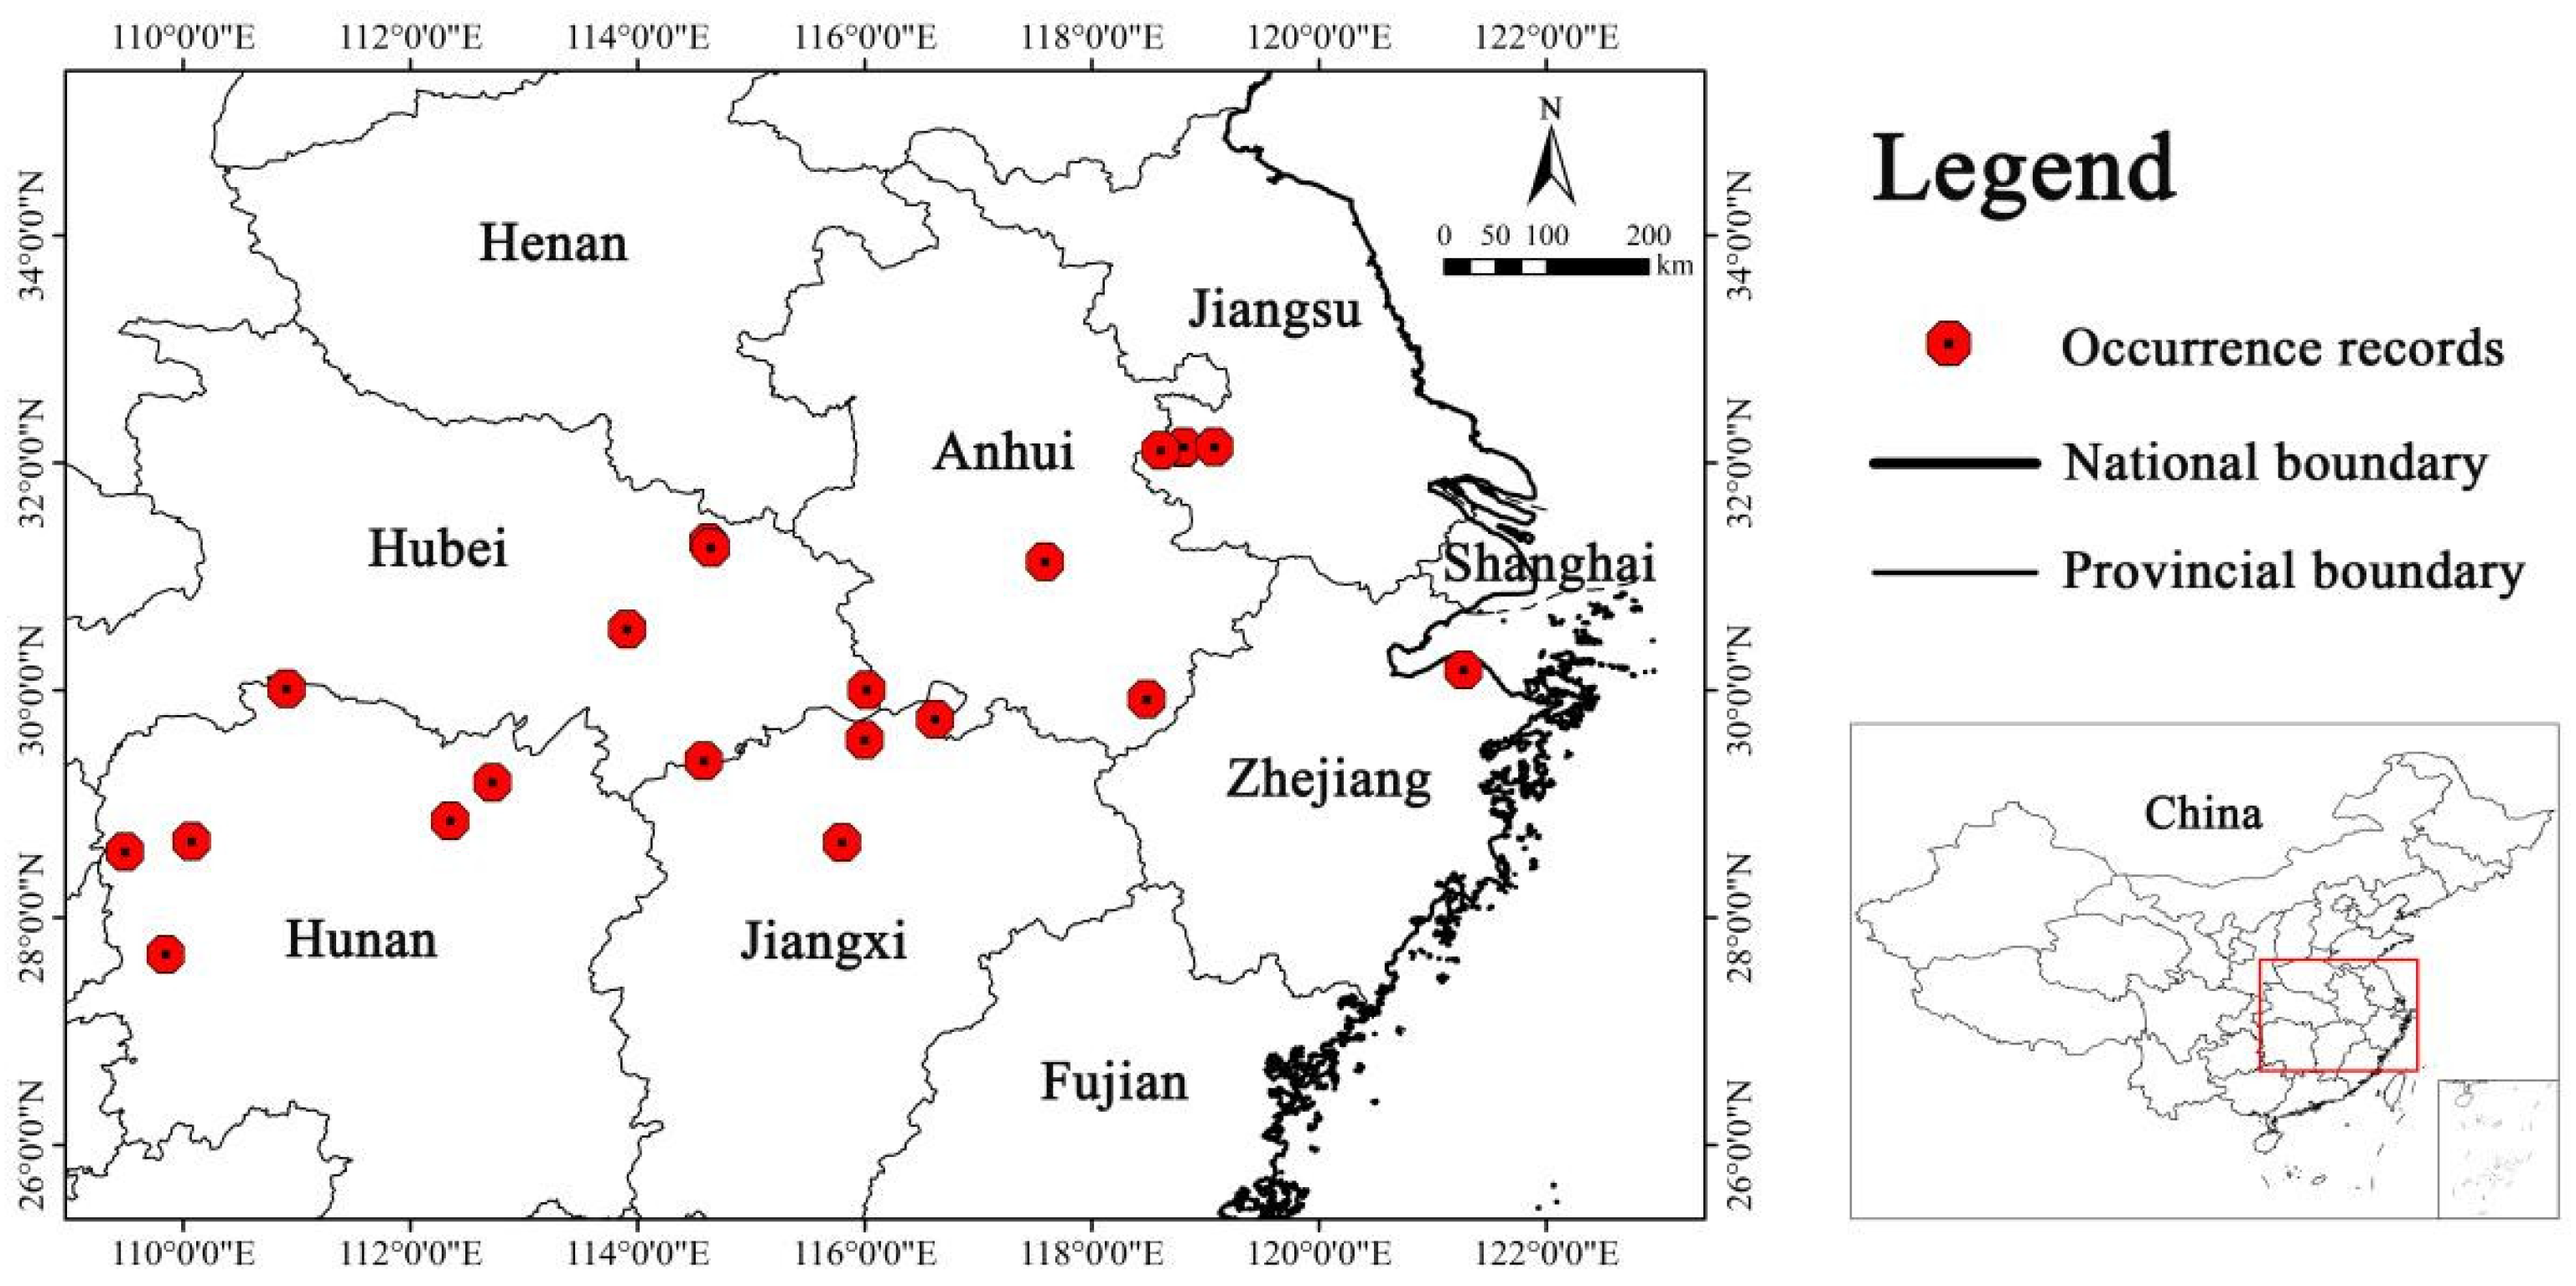
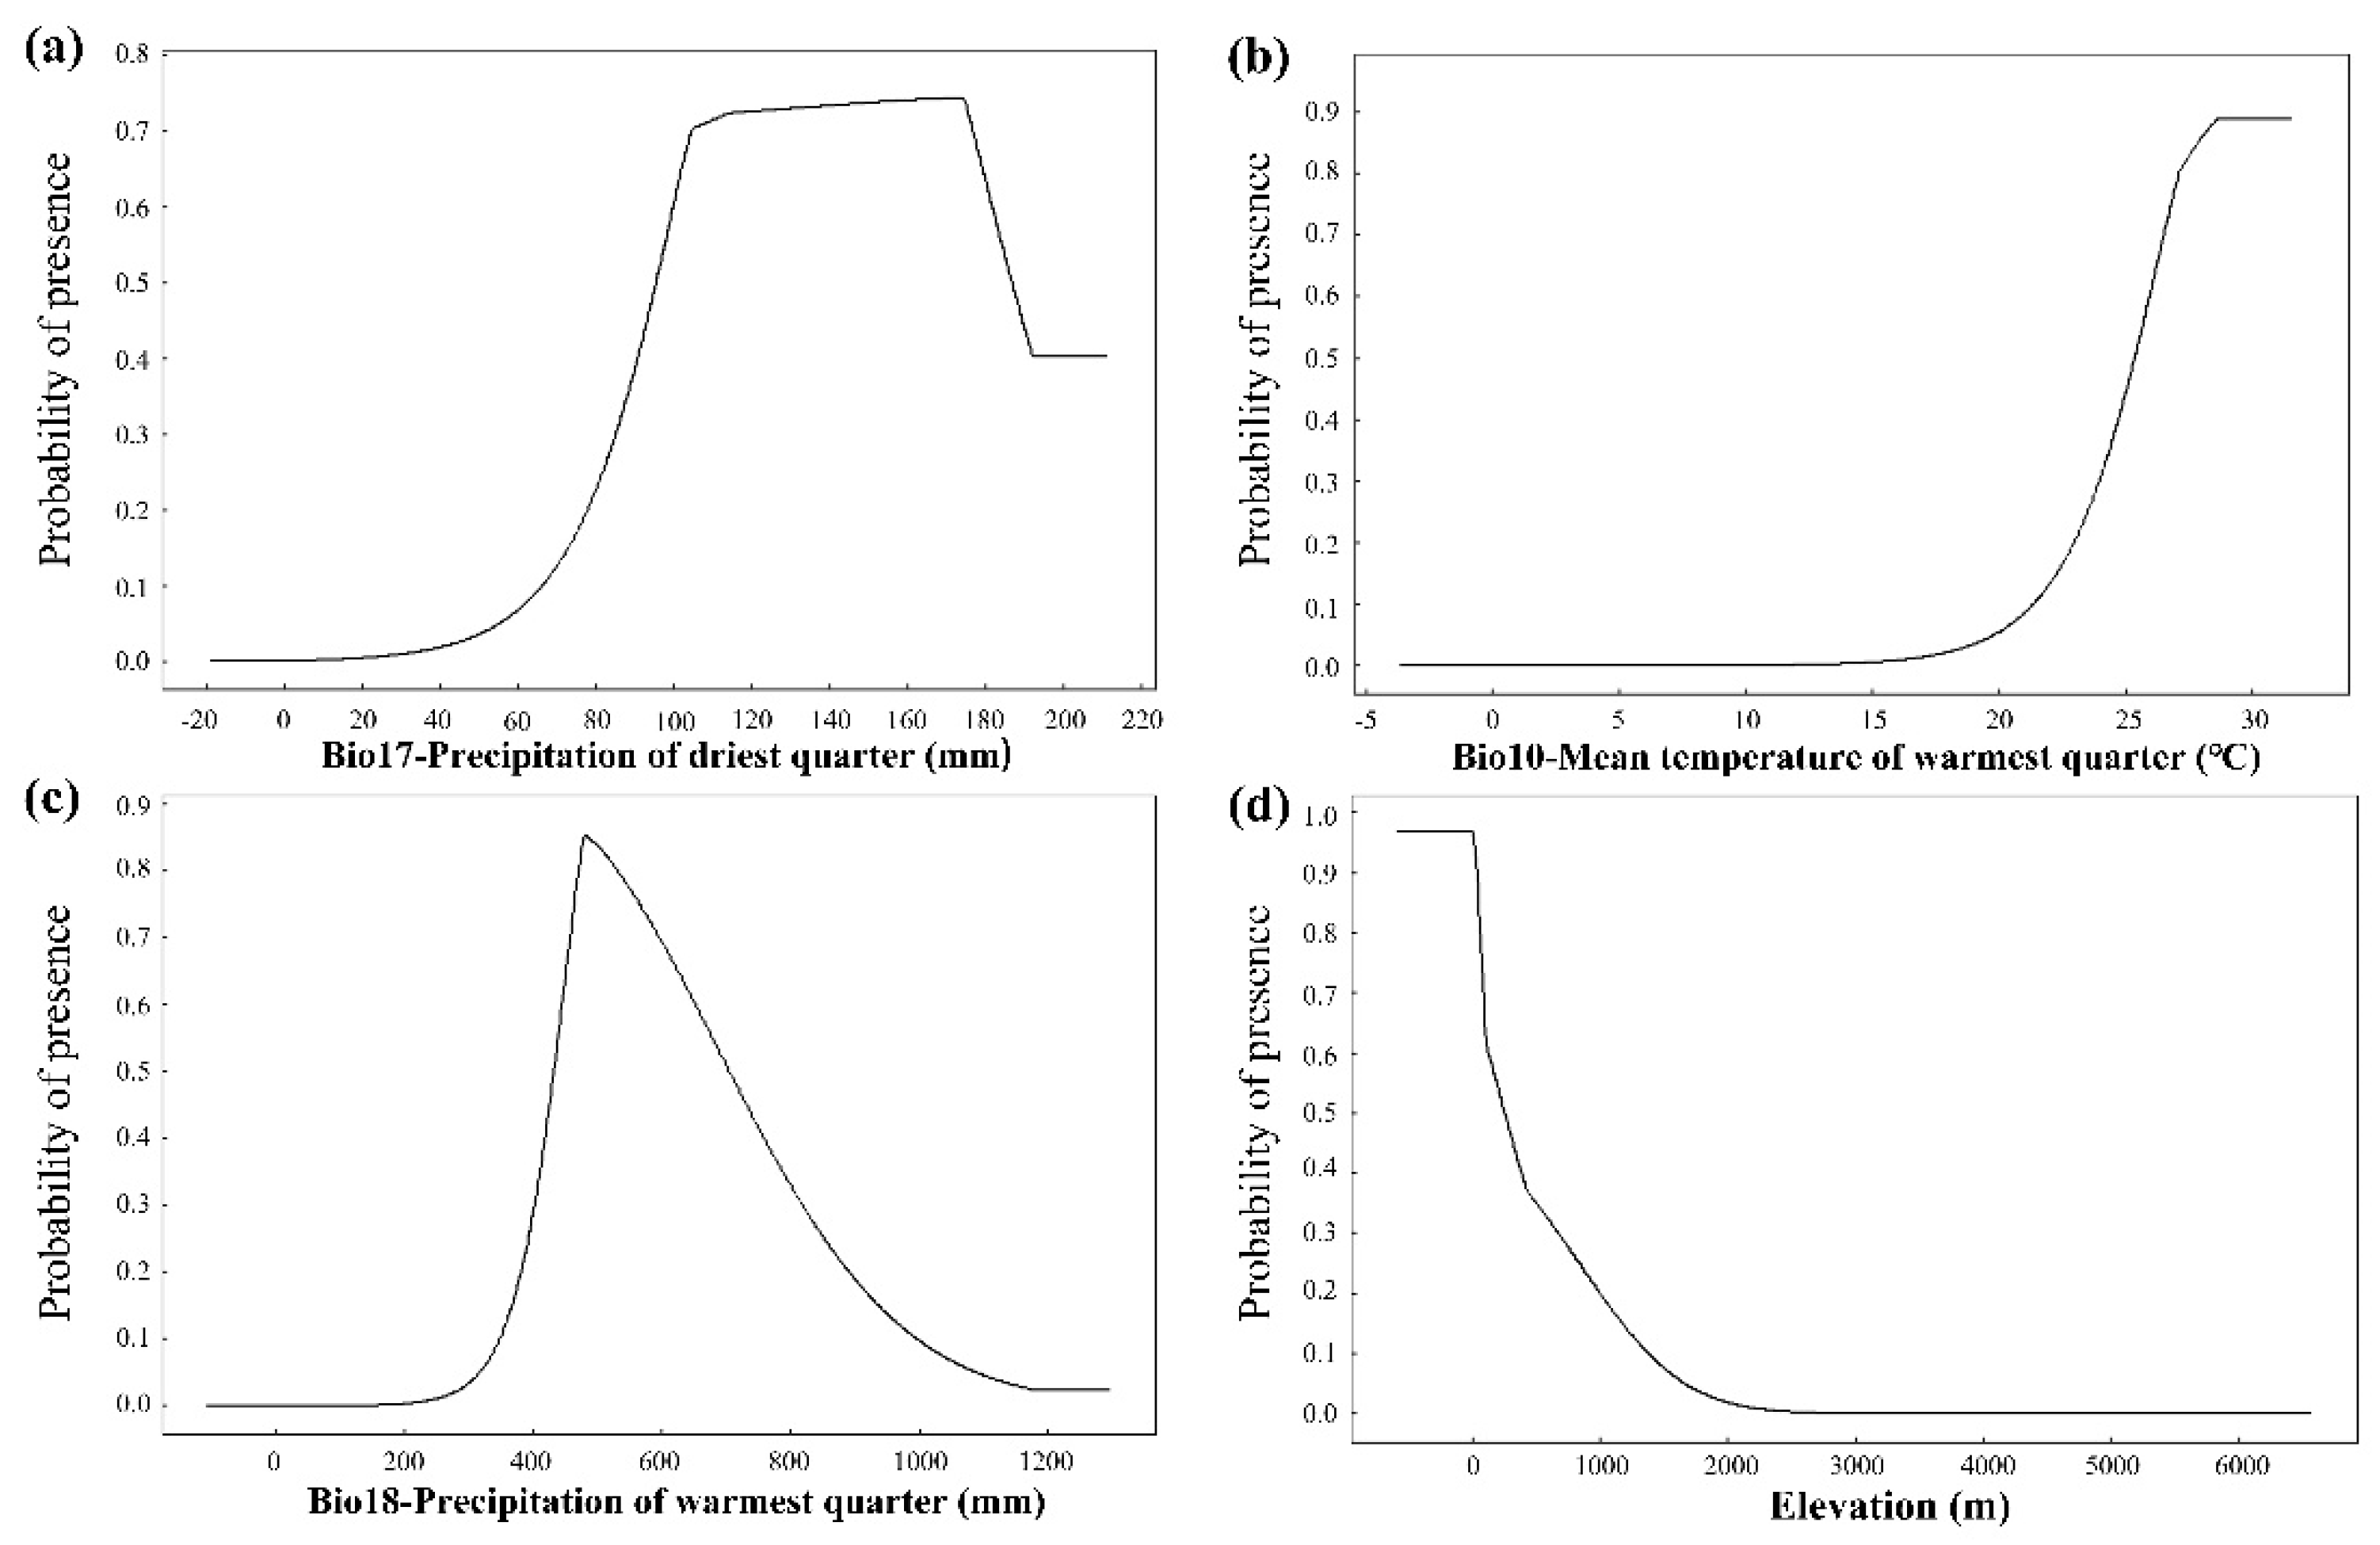
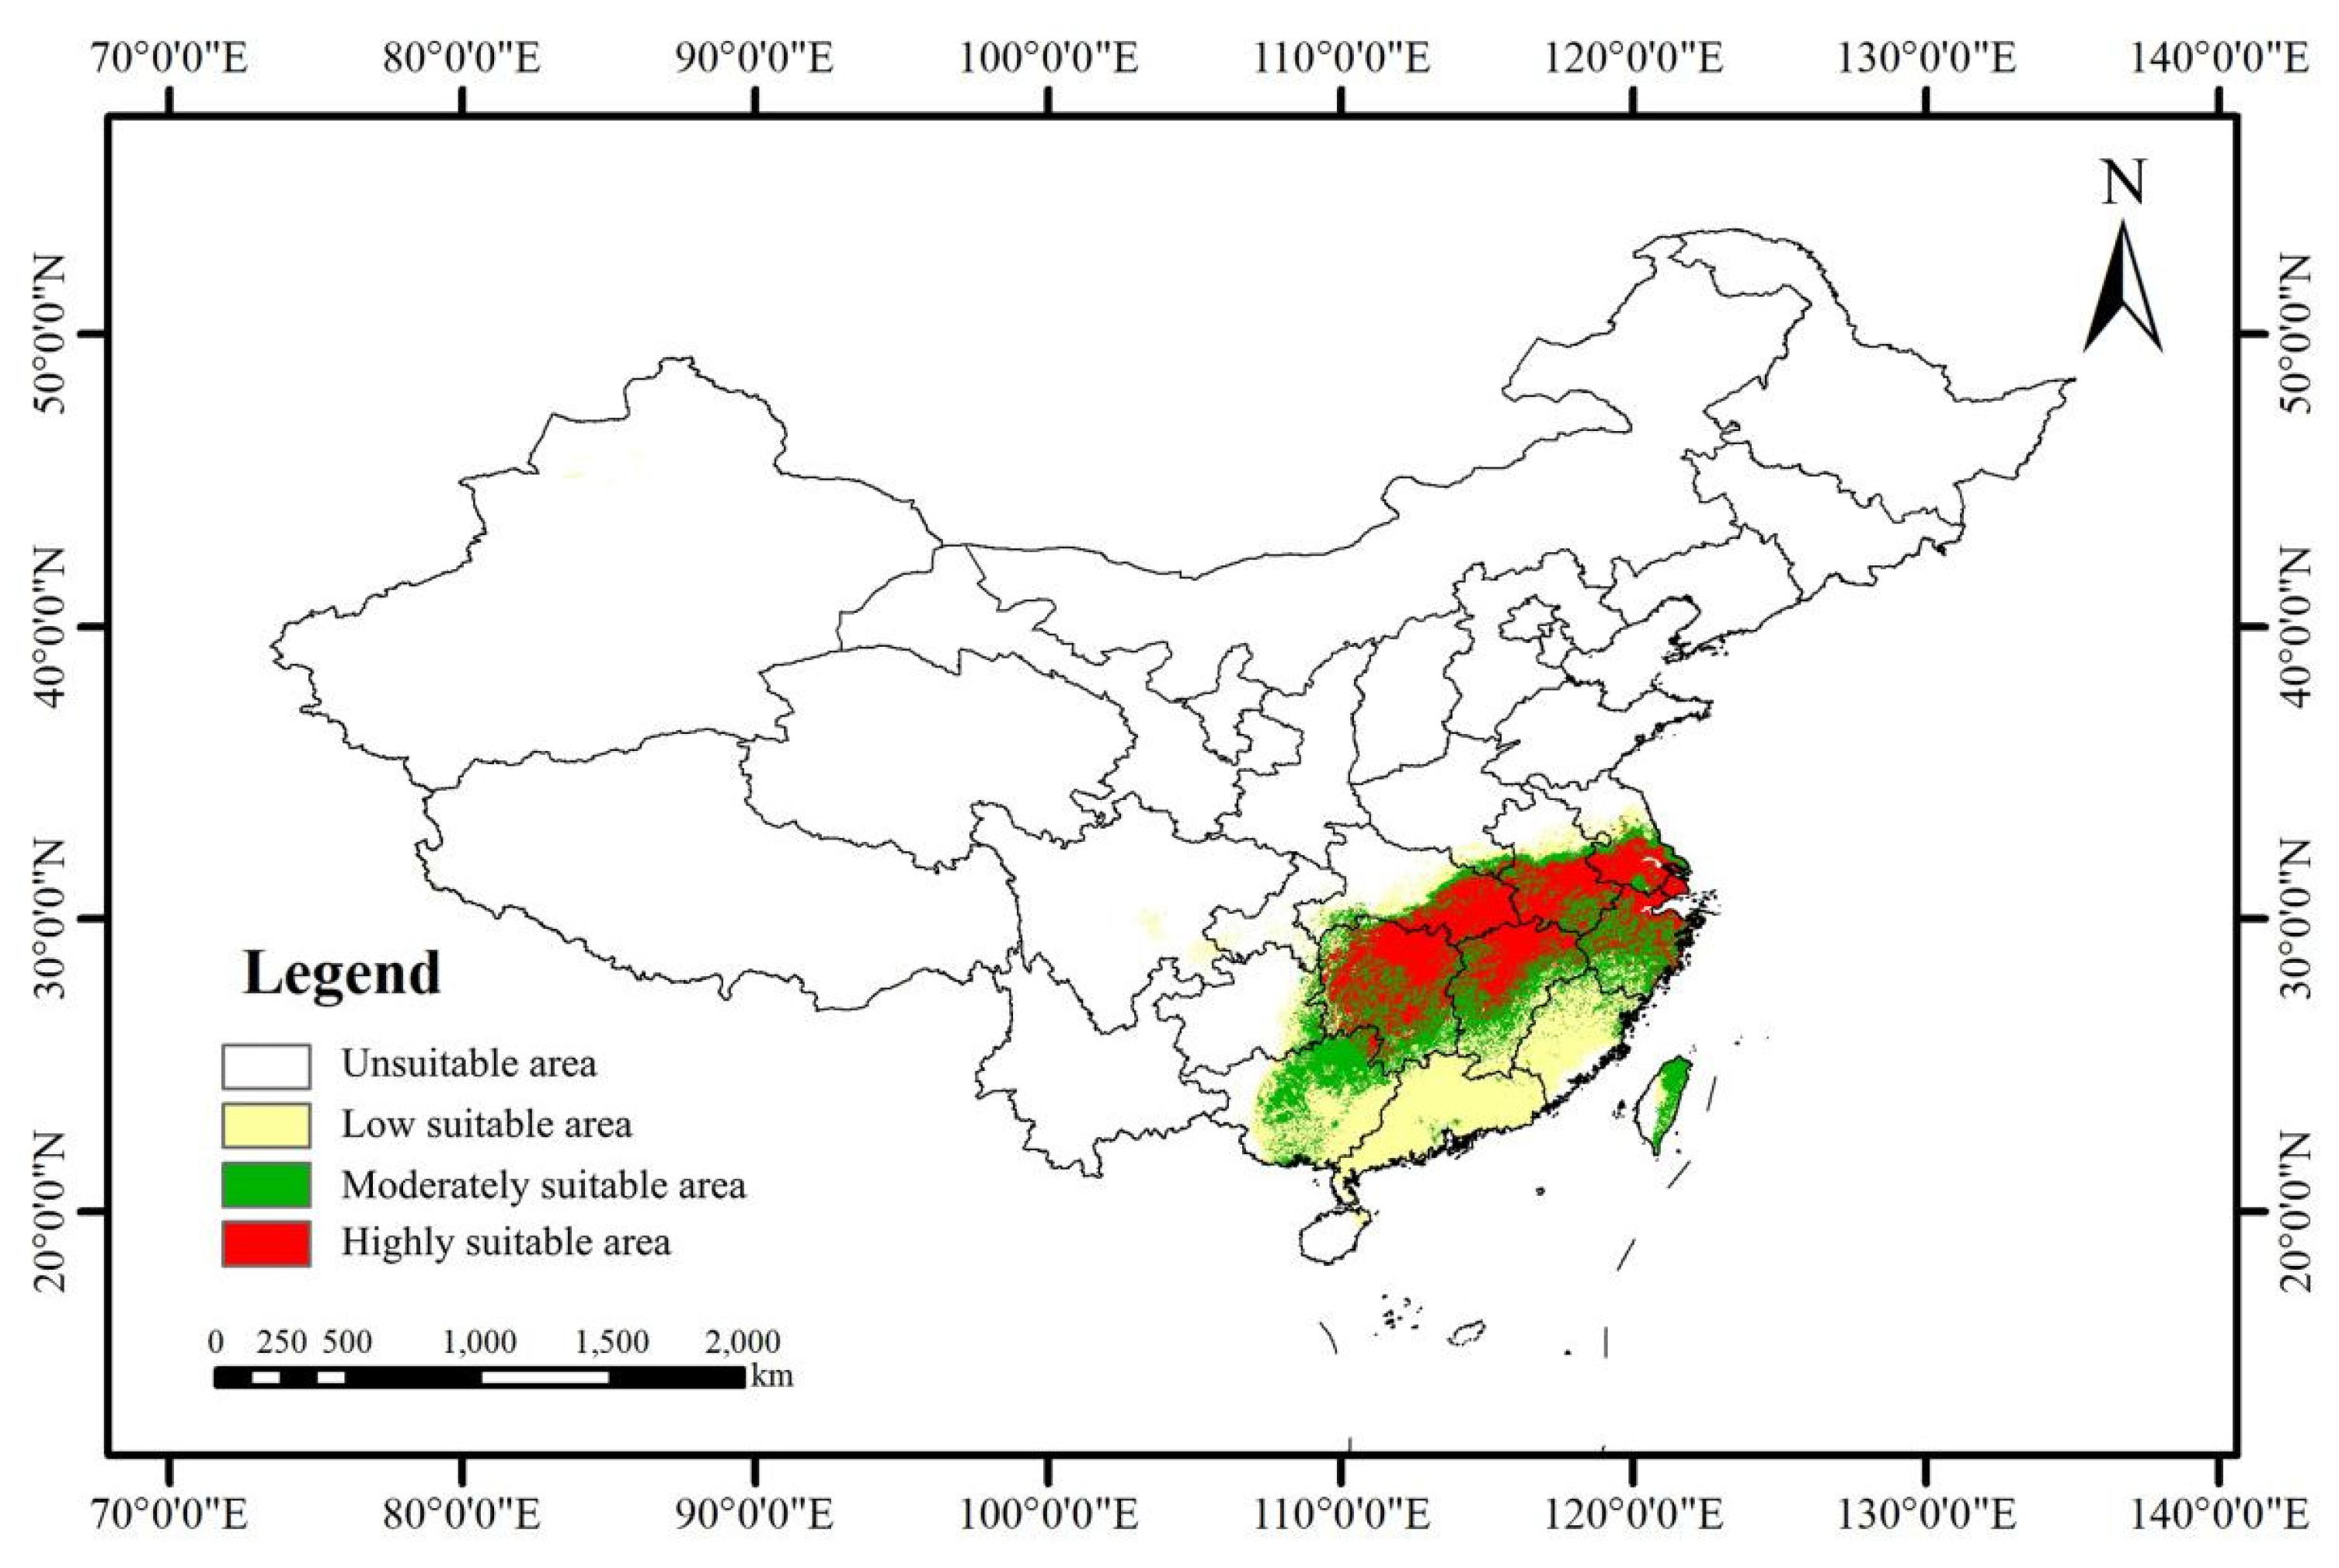
Sinojackia endemic to China, comprises five species, and each has restricted distribution but with high value in landscaping. However, how such species respond to climate change remains unclear. We selected S. xylocarpa as a representative, built an ensemble model in Biomod2 to forecast its potential distribution, identify its key influencing factors, and analyze its conservation gaps in China’s nature reserves. The four leading factors were precipitation of driest quarter, mean temperature of warmest quarter, precipitation of warmest quarter, and elevation. This species was mainly distributed in southeast China. Its suitable area was 69.72 × 10⁴ km2, accounting for 6.26% of China’s total territory. Nevertheless, only 3.91% was located within national or provincial nature reserves. Under future climates, its suitable areas would averagely decrease by 10.97% compared to the current, with intensifying habitat fragmentation. Collectively, its centroid is expected to shift northeastward in the future. Therefore, our findings first demonstrate that future climate change may have an adverse effect on its distribution. We recommend conducting a supplementary investigation within the projected suitable range, and establishing new conservation sites for S. xylocarpa in China. Moreover, this study can provide valuable reference for conserving other endangered Sinojackia species under global warming.

Keywords: 
;  ;  ;  ;  

1. Introduction

Climate change has a profound effect on plant growth and distribution on a global scale. Generally, global warming will increase ambient temperature, extend plants’ growing season, alter flowering time, and disrupt the correlation between plants and animals (Ding et al., 2020; Zhou et al., 2023). The Sixth Assessment Report (AR6) of the Intergovernmental Panel on Climate Change (IPCC) has clearly pointed out that human activities, mainly through greenhouse gas emissions, are the major cause of global warming. The global surface temperature from 2011 to 2020 was 1.1°C higher than that from 1850 to 1900. Moreover, it is estimated that, the global temperature may be kept at a rise of 1.5°C above pre-industrial revolution even under a low-concentration greenhouse gas emissions by 2100 compared to the present, and under a high-concentration emissions scenario, the corresponding increase in temperature may exceed 2°C (Gao et al., 2023). Therefore, under future climate change, various environmental factors, especially bioclimatic factors, may have an effect on the phenology, physiology and ecology of plants. This will cause plants to change in geographic range, thereby posing a serious threat to species diversity (Zhao et al., 2021).
The endangered trees are usually more susceptible to climate change in distribution relative to non-endangered ones. Take Glyptostrobus pensilis (Staunton ex D. Don) K. Kocha as an example, this endangered tree might shrink to varying degrees in suitable habitat under different future climate scenarios (Ye et al., 2022). Another example is Zelkova schneideriana Hand.-Mazz., which is an endangered tree of second-grade protection of China, and it is also expected to decrease in suitable area under future climate scenarios (Zhou et al., 2023). More importantly, for those endangered species with endemic distributions, they usually have restricted distribution ranges, small population sizes. Moreover, their habitats are probably separated, thereby leading to low genetic diversities in most cases. Therefore, future climate change may pose a severe challenge to such plants.
Sinojackia xylocarpa Hu, endemic to China, is a small deciduous tree from the Styracaceae family (Hu, 1928). The Sinojackia genus was established by a Chinese botanist Hu Xiansu in 1928. Due to morphological variation and spontaneous hybridization between different species, there is controversy about interspecific delimitation within this genus. According to Flora of China, it is thought that the Sinojackia genus comprises a total of five species and one variety (Huang and Grimes, 1996). In addition to S. xylocarpa, it also includes S. rehderiana Hu, S. henryi (Dümmer) Merr., S. sarcocarpa L. Q. Luo (Liu, 2017), S. microcarpa Tao Chen bis & G. Y. Li (Hu, 2018) and the variety of S. xylocarpaS. xylocarpa var. leshanensis L. Q. Luo (Luo, 2005). Later on the Sinojackia genus also included S. dolichocarpa C. J. Qi, S. huangmeiensis J. W. Ge & X. H. Yao, and S. oblongicarpa Tao Chen bis & T. R. Cao. Nowadays, based on key taxonomic traits and related molecular phylogenetic evidence, S. dolichocarpa has been assigned to a new genus - Changiostyrax Tao Chen (Yang et al., 1997; Yao et al., 2008), S. oblongicarpa has been identified as the synonym of S. sarcocarpa (Luo, 2005), and S. huangmeiensis as the synonym of S. xylocarpa (Luo and Luo, 2011).
As a native tree, S. xylocarpa has high ornamental value (Liu, 2017). In spring, it produces small white delicate flowers (Figure 1a), and in autumn it bears many conical fruits with long slender pedicels, like a balanced weight set (‘Chengtuo’ in Chinese) hanging in the tree (Figure 1b). Recent studies have shown that S. xylocarpa has low germination rate in the wild resulting from its physiological seed dormancy, hard seed coat, and high microspore abortion rate in floral organogenesis (Zhu et al., 2024). Coupled with external factors such as climate change and habitat destruction (Li, 2014; Huang et al., 1998; Liu, 2017), S. xylocarpa is on the brink of extinction in China. Therefore, this species was listed as a national secondary protected plant species in 1999. And it has been listed as one of the key protected wild plants of China since 2021 (https://www.forestry.gov.cn/, last accessed on 27 September 2024). In addition, it has been ranked as “Vulnerable” (VU) species in the IUCN Red List (https://www.iucnredlist.org/, last accessed on 27 September 2024).
Although S. xylocarpa is endemic to China, there are different views on its geographical distribution. According to Flora of China, S. xylocarpa is only found in Nanjing, Jiangsu Province, eastern China (Wu and Huang, 1987). According to Flora of Jiangsu, this species is endemic to Jiangsu Province, and is mainly distributed in Nanjing (Liu, 2015). The records of its specimen collection show that S. xylocarpa was once wildly distributed in Mufu Mountain and Laoshan Mountain of Nanjing, and Baohua Mountain of Zhenjiang within southern Jiangsu (Chen et al., 1995). However, because of the deterioration of the natural environment and the impact of anthropogenic activities such as quarrying and mining, there is no wild populations of S. xylocarpa at Mufu Mountain, Nanjing (Liu, 2017). This tree species is even considered extinct in the wild in China (Hao et al., 2000; Zhang et al., 2010). In recent years, with the extensive investigation of its natural populations, S. xylocarpa has been discovered in provinces of Anhui and Zhejiang, eastern China, and Hunan Province, central China (Luo and Luo, 2011; Xu et al., 2022). For example, a wild population of S. xylocarpa, having more than 200 individuals, was found in 2023 in Majiazui, Yiyang City, Hunan Province (https://lyj.huan.gov.cn/lyj/xxgk_71167/gzdt/xlkb/xsqxx/202304/t20230418_29316935.html, last accessed on 5 December 2024). In 2024, 11 bushes with S. xylocarpa saplings were found in Huangli Mountain, Chaohu City, Anhui Province (http://www.ahwang.cn/hefei/20241006/2754153.html, last accessed on 5 December 2024). Meanwhile, according to our field survey in the past two years, its wild populations were found in various sites such as Laoshan, Nanjing City, Jiangsu Province, and Wuwei, Wuhu City, Anhui Province (Figure 1c, d). Additionally, due to the taxonomic revision of S. xylocarpa, S. huangmeiensis has been merged into S. xylocarpa. Therefore, the area with S. huangmeiensis actually should be part of S. xylocarpa range. For instance, it is reported that S. huangmeiensis population is located in the Longgan Lake National Wetland Nature Reserve, Hubei Province, central China (Luo et al., 2016). In fact, it belongs to S. xylocarpa. In summary, we believe that the distribution of S. xylocarpa in China is geographically restricted and discontinuous, but its actual distribution range is still unclear.
Species distribution models (SDMs) link species presence, absence, or abundance information with environmental variables to predict its potential locations and quantities (Martı’nez-Minaya et al., 2018). At present it has been widely used in multiple fields such as conservation biology, ecological invasion, and habitat suitability assessment (Elith et al., 2011; Zurell et al., 2020). For example, SDMs were employed to predict the current and future potential distribution ranges of the endemic and endangered Parrotia subaequalis (H. T. Chang) R. M. Hao & H. T. Wei in China (Yan et al., 2022).
Several SDMs software packages for species prediction have recently been developed, including BIO-CLIM, GARP and MaxEnt (Shi et al., 2021). Due to its low sample demand and excellent prediction capabilities, MaxEnt has been widely used to forecast the potential distribution areas of species (Xu et al., 2024). More recently, it has been noted that an ensemble model comprised multiple individual models can improve the accuracy of model predictions relative to a single model (Cai and Zhang, 2024). Biomod2, a program package developed by Wilfried Thuiller et al. for SDMs applications, uses ten species distribution models including artificial neural networks (ANN), classification tree analysis (CTA), flexible discriminant analysis (FDA), generalized additive models (GAM), generalized boosted models (GBM), generalized linear models (GLM), multivariate adaptive regression splines (MARS), MaxEnt (Maximum entropy model), random forest (RF), and surface range envelope (SRE) (Thuiller,2003; Huang et al., 2023). Multiple models can be run independently, or several or even all of them can be integrated and run together. Hence, an ensemble model is widely applied in potential distribution prediction for endangered species (Zhao et al., 2021; Liu et al., 2024).
Currently, there are few studies on distribution prediction of S. xylocarpa. Yang et al. (2020) used MaxEnt to predict the current range of Sinojackia involving seven species in China. However, the occurrence records of those species were mixed together in the MaxEnt modeling as if they were a single species. More recently, Feng and Zhang (2024) applied MaxEnt modelling to project the suitable distribution area of Sinojackia involving eight species. Indeed, genus and species are two different taxonomic categories, therefore such studies cannot accurately reveal the actual potential distribution of S. xylocarpa. Moreover, newly records of S. xylocarpa are reported in several province of China. Additionally, taxonomic revision of the genus Sinojackia has been made recently. The species formerly assigned to S. huangmeiensis now belong to S. xylocarpa. S. dolichocarpar is changed into Changstyrax dolichocarpar (C. J. Qi) C. T. Chen, and S. oblongicarpa is reduced to S. xylocarpa (Chen, 1995; Luo and Luo, 2011). Therefore, the geographical distribution and conservation of S. xylocarpa in China remain unclear.
In this study, we first collected data on the distribution points of S. xylocarpa and related environmental variables, then used Biomod2 to screen suitable models to generate an ensemble model, and finally used the ensemble model to predict the potential distribution of S. xylocarpa in China. Specifically, we focused on the following issues. (1) We identified key environmental factors affecting the distribution of S. xylocarpa; (2) We projected the potential distribution areas of S. xylocarpa under different climate scenarios in the past, current, and future, and determined the centroid shift of S. xylocarpa; (3) In addition, we further assessed the conservation status of S. xylocarpa by overlaying the resulting suitable habitats with existing nature reserve layers in China. The purpose of this study is to provide a scientific basis for the protection of endangered S. xylocarpa, as well as a conservation reference for other endangered Sinojackia species in China.

2. Materials and Methods

2.1. Species Occurrence Data

The data regarding the wild distribution of S. xylocarpa were obtained through the following methods. (1) Investigating in the field: In recent years, we conducted a survey of the wild population of S. xylocarpa in Anhui, Jiangsu, Zhejiang, and other provinces in eastern China to determine its distribution. (2) Visiting related websites: We accessed relevant websites, including the Plant Photo Bank of China (PPBC, http://ppbc.iplant.cn/, last accessed on 5 December 2024), the Chinese Virtual Herbarium (CVH, https://www.cvh.ac.cn/, last accessed on 5 December 2024), and the National Specimen Information Infrastructure (NSII, http://nsii.org.cn/, last accessed on 5 December 2024). (3) Referring to published literature and related reports: We examined Flora of China, provincial floras, and related checklists that included the specific name and Latin name of S. xylocarpa. Additionally, we searched published literature and pertinent articles. Accordingly, we obtained a total of 22 distribution points for S. xylocarpa after removing error duplicate points.
After preliminary data collation, we then used Spatially Rarefy Occurrence Data for Species Distribution Models (SDMs) in the SDMs toolbox (version 2.6) to ensure that there was only one distribution point per 1 km × 1 km grid (Radosavljević et al., 2012). Such a filtering approach is particularly useful for species with limited occurrence points, as it maximizes the number of spatially independent localities (Brown et al., 2017). Finally, we obtained latitude and longitude data of 21 distribution points of S. xylocarpa (Figure 2; Table S1).

2.2. Environmental Variables

The environmental data selected for this study are categorized into three groups: climate, terrain, and soil (Coban et al., 2020; Khan et al., 2022; Su et al., 2024). These categories encompass the past periods (the Last Interglacial period, approximately 12,000–14,000 years ago, and the Middle Holocene, around 6000 years ago), the current, and the future periods (the 2050s and 2070s). Considering that the past period is significantly distant from the present and that the Earth’s environment has undergone substantial changes during this time, only bioclimatic variables from two paleoclimate periods are selected for prediction. In the current and future periods, topographic and soil variables will be used besides bioclimatic variables. We downloaded 19 bioclimatic factors for the three periods from Worldclim (https://www.worldclim.org/, last accessed on 5 December 2024). Then we standardized the resolution to 30s (1 km × 1 km) to ensure accuracy during modeling. Since a single climate model may not adequately represent future scenarios, we used a combination model that integrates multiple climate models. Future bioclimatic data were derived from three global climate models: BCC-CSM1-1, CCSM4, and MIROC-ESM (Fick et al., 2017). Additionally, three representative concentration pathways (RCPs) for CO2 emissions were selected: RCP2.6 (representing a moderate emission scenario), RCP4.5 (signifying a medium and stable emission scenario), and RCP8.5 (indicating a high emission scenario).
Topographic data includes elevation and slope. Since these variables remain essentially unchanged over time, they are added to the models as constant variables (Stanton et al., 2012). Elevation data was obtained from WorldClim, and slope data was downloaded from the National Earth System Science Data Center (https://www.geodata.cn/main/, last accessed on 5 December 2024). Soil characteristics can affect the physiological growth of plants. Species distribution models with soil data perform significantly better than those without soil information (Rota et al., 2024). The China soil dataset (version 1.2) was downloaded from the National Qinghai–Tibet Plateau Scientific Data Center (http://www.tpdc.ac.cn/zh-hans/, last accessed on 5 December 2024), and 16 types of surface soil data were selected from the website for subsequent research.
The three types of environmental data were standardized using the WGS1984 coordinate system, and the “Extract by Mask and Clip” tool in ArcGIS 10.8 was employed to ensure that the data were confined to China. The resolution of the data was subsequently adjusted to the 30s level using resampling tools. Concurrently, Pearson correlation analysis was conducted to mitigate collinearity among related environmental factors, ensuring that redundant information did not compromise the model’s predictions (Sillero et al., 2020). Environmental variables with a low contribution rate and | r | ≥ 0.8 were excluded from further analysis. Ultimately, we retained 10 bioclimatic variables for the Last Interglacial period, 11 bioclimatic variables for the Middle Holocene, and 22 environmental variables for the current and future periods for subsequent modeling (Table 1).

2.3. Modeling Process

We used the Biomod2 package to generate an ensemble model to simulate the distribution range of S. xylocarpa. Firstly, we combined 22 environmental factors and used 21 distribution sites of S. xylocarpa to evaluate the 10 models respectively in the Biomod2 package. Then we obtained the AUC (Area Under the Curve) and TSS (True Skill Statistic) values for each model. Since the AUC value usually ranges from 0 to 1, the closer the value is to 1, the higher the precision. It is classified as follows: failure (0.5-0.6), poor (0.6-0.7), fair (0.7-0.8), good (0.8-0.9), and excellent (0.9-1.0) (Wang et al., 2024)]. The TSS value varies between -1 and +1. The value close to 1 indicates good performance, while the value close to or below 0 indicates poor performance. It can be divided into five groups: excellent (TSS > 0.8), good (0.6-0.8), fair (0.4-0.6), poor (0.2 - 0.4), and fail (TSS < 0.2) (Liu et al., 2024).
Herein we selected the models with an AUC greater than 0.8 and a TSS greater than 0.7 from the 10 models to build an ensemble model (Cai and Zhang, 2024). As a result, the ensemble model was composed of six individual models: GBM, FDA, RF, MaxEnt, ANN, and CTA. During the modeling process, R randomly generated 1000 pseudo-absence points. Simultaneously, 75% of the occurrence records were randomly selected as the training set, and the remaining 25% as the testing set. To ensure the predictive accuracy of the model, the computation was repeated 10 times, and the average value was taken as the final modeling result.

2.4. Geospatial Data Analysis

The results generated by the ensemble model were imported into ArcGIS 10.8 for visualization. Most species modeling techniques produce continuous suitability predictions. However, many practical applications require secondary outputs which need the establishment of thresholds. We employed maximum specificity and sensitivity (maxSSS) to determine the threshold, which is a promising approach when only limited data are available (Liu et al., 2015). According to the threshold (0.1916) established by the sum of maximum specificity and sensitivity, the potential distribution of S. xylocarpa was categorized into unsuitable (0.0-0.19), low-suitable (0.19-0.46), moderately suitable (0.46-0.73), and highly suitable (0.73-1.00) areas. In this study, we considered both the moderately and highly suitable areas as the suitable habitat for S. xylocarpa (Wang et al., 2024). Subsequently, we calculated the suitable area for each category.
Centroid shift can illustrate the changes in species distribution under various climate scenarios. The SDMtoolbox in ArcGIS 10.8 was utilized to simulate the centroid shift of S. xylocarpa across different climate scenarios, including the direction and distance of moving over various periods.

3. Results

3.1. Model Performance

We used Biomod2 to establish 10 individual models for S. xylocarpa. We found that, except for SRE, GAM, GLM, and MARS, the AUC value for each of the other six models was all greater than 0.8 and simultaneously its TSS was greater than 0.7, respectively (Table 2).
Therefore, we selected the six models to establish an ensemble model. Except for ANN and CTA, the AUC values of the other four models were all greater than 0.9, indicating that these models reached an excellent level. Meanwhile, the TSS values of these six models were all greater than 0.7, indicating that they all had high credibility and accuracy. For example, the AUC value of MaxEnt was 0.9690, and the TSS value of CTA was 0.7864. In contrast, the AUC and TSS values of the ensemble model were 0.9960 and 0.9500 respectively, both of which were higher than those of the six individual models. Therefore, the ensemble model of S. xylocarpa performed much better than the individual models.

3.2. Main Environmental Factors

We used the ensemble model to determine the contribution rate of each environmental factor in different periods (Table 1). Among these environmental variables affecting the distribution of S. xylocarpa at present, Bio17 (precipitation of driest quarter) was the highest, followed by Bio10 (mean temperature of warmest quarter), Bio18 (precipitation of warmest quarter), then elevation. Their contribution rates were 61.0%, 9.6%, 8.9%, and 5.4% respectively, with a cumulative contribution rate reaching 84.9%. Therefore, the top four were identified as the key environmental factors. During the Last Interglacial period, the key environmental factors were Bio10 (mean temperature of warmest quarter) (21.7%), Bio17 (19.6%), and Bio4 (temperature seasonality) (19.1%). In the Middle Holocene period, the key environmental factors were Bio15 (precipitation seasonality) (27.5%), Bio17 (23.0%), and Bio11(mean temperature of coldest quarter) (15.5%), respectively.
In addition, Bio17 ranked first in terms of contribution rate in the current period while it ranked second both in the Last Interglacial period and the Middle Holocene period.
When the presence probability was greater than 0.46, the corresponding areas were considered to be moderately or highly suitable, and we thought that they were conducive to the growth of S. xylocarpa. The response curves represented the relationship between environmental variables and species presence probability, reflecting the species’ biological tolerance and habitat preferences. When the precipitation of driest quarter was greater than 90 mm, it was suitable for the survival of S. xylocarpa. As the precipitation of driest quarter increases, the probability of S. xylocarpa’s existence first increased obviously, then remained unchanged, then decreased sharply, and finally remained stable (Figure 3a). When the mean temperature of warmest quarter was greater than 24.6°C, it was suitable for the survival of S. xylocarpa. As the mean temperature of warmest quarter increased, the existence probability of S. xylocarpa first increased and then remained unchanged (Figure 3b). S. xylocarpa grew well when the precipitation of warmest quarter was between 417 mm and 763 mm. As the precipitation of warmest quarter increased, the existence probability of S. xylocarpa first increased considerably and then decreased sharply (Figure 3c). S. xylocarpa was suitable for growth when the elevation was less than 392 m. As the elevation increased, the existence probability of S. xylocarpa first remained unchanged and then decreased sharply (Figure 3d).

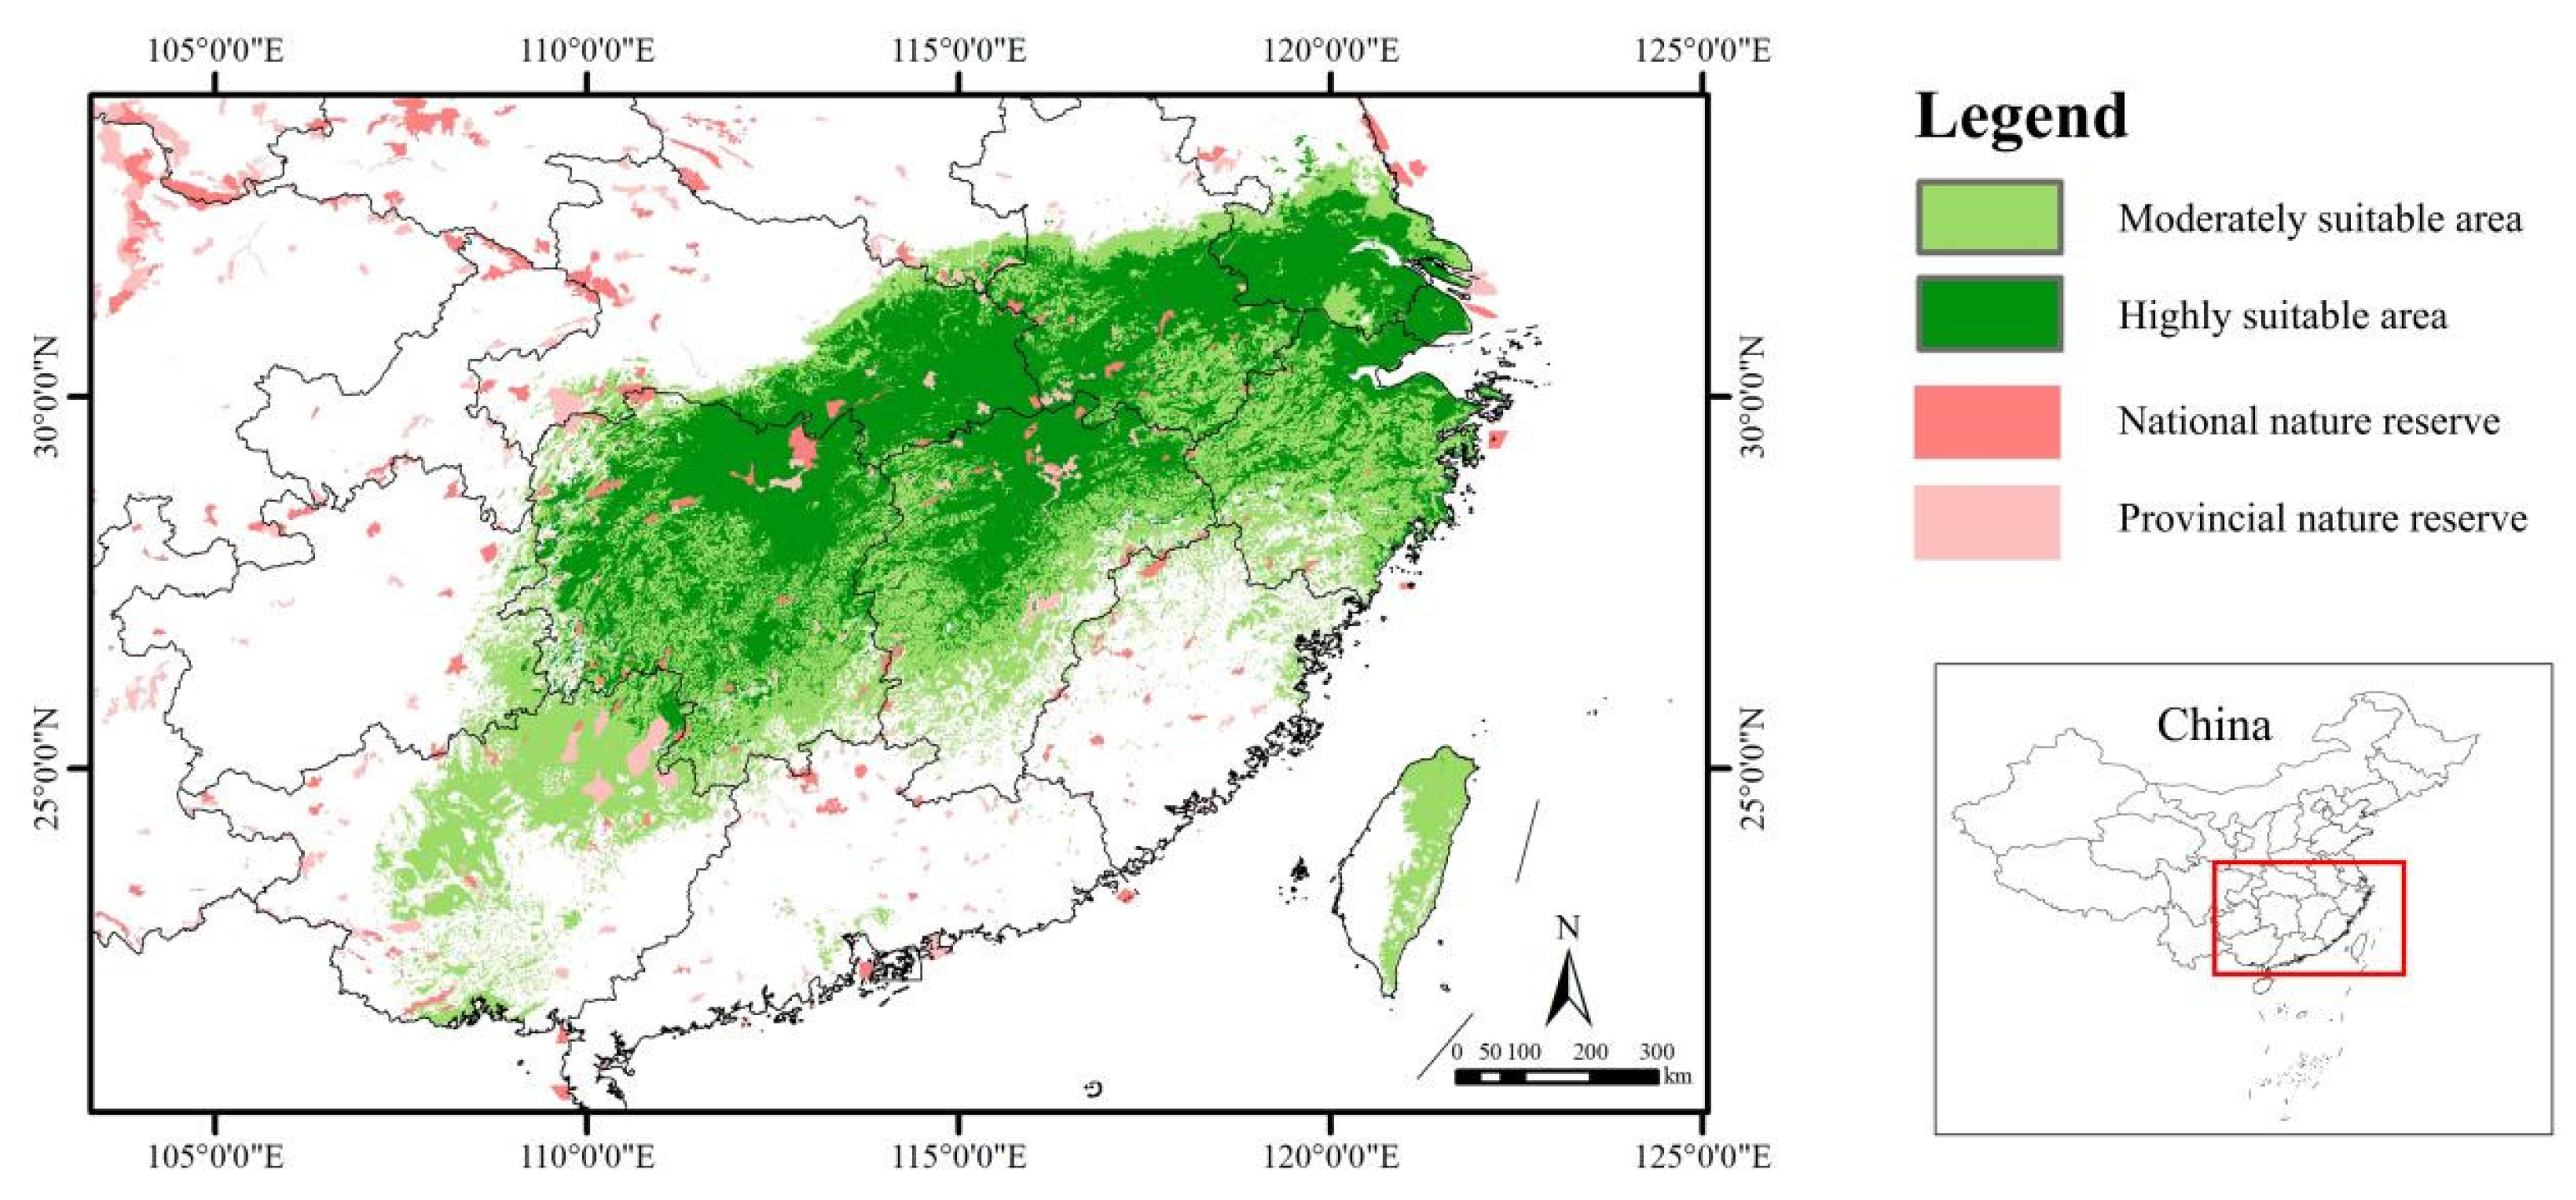
3.3. Current Potential Suitable Distribution

At present, the suitable areas for S. xylocarpa were mainly concentrated in southern Anhui, northern Guangxi, eastern Hubei, Hunan, southern Jiangsu, northern Jiangxi, eastern Taiwan and northern Zhejiang (Figure 4). Some suitable areas were also predicted to be scattered in northern Fujian, southern Guangdong, eastern Guizhou and other parts of China. Furthermore, its suitable areas were relatively more fragmented than its low ones in the current period (Figure 4). The total suitable area for S. xylocarpa was 69.72 × 10⁴ km², accounting for only 7.26% of China’s total land area, and the highly suitable area was 34.15 × 10⁴ km², accounting for 3.56% (Table 3). Collectively, this species was mainly distributed in the southeast of China, which is largely consistent with the surveyed distribution points.
Under the current climatic conditions, the suitable habitat of S. xylocarpa within the boundaries of national nature reserves was 1.28 × 10⁴ km², accounting for 1.84%. The suitable habitat of S. xylocarpa within the boundaries of provincial nature reserves was 1.50 × 10⁴ km², accounting for 2.15%. The coverage ratio of national and provincial nature reserves in the suitable area of S. xylocarpa was only 3.91%. Therefore, the vast majority of the suitable areas for S. xylocarpa were not effectively protected (Figure 5).

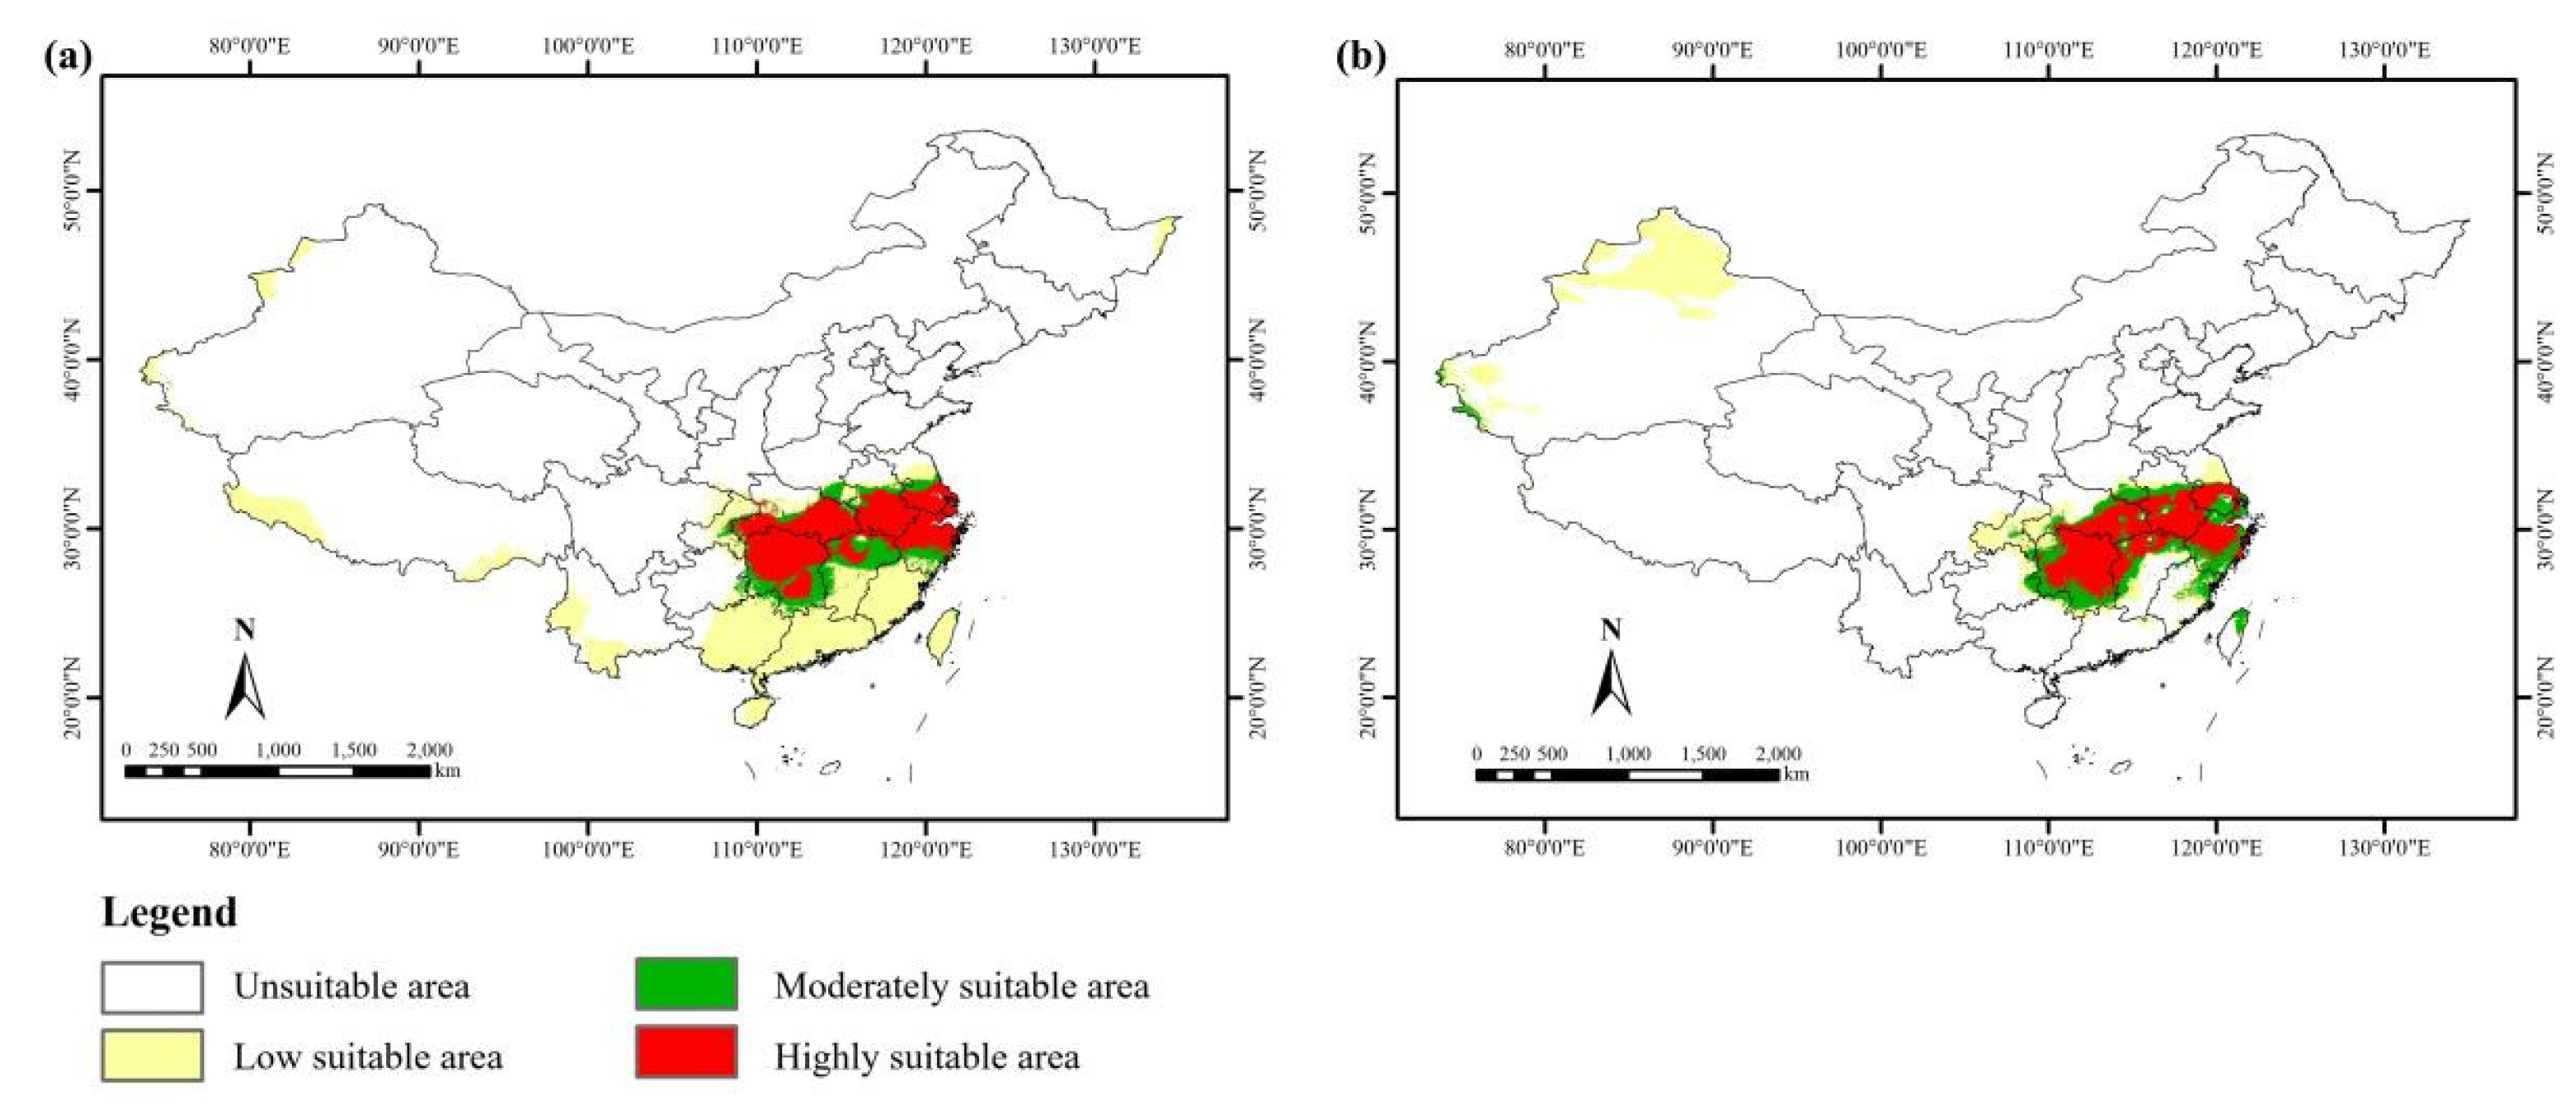
3.4. Potential Suitable Distribution in the Past

During the Last Interglacial period, the suitable habitat for S. xylocarpa in China was mainly concentrated in southern Anhui, southern Hubei, Hunan, southern Jiangsu, northern Jiangxi, and northern Zhejiang (Figure 6a), and it presented a continuous pattern relative to the current. The total suitable area was 63.84 × 10⁴ km², which had an decrease of 8.43% compared to the present (Table 3).
During the Middle Holocene period, the suitable habitat for S. xylocarpa in China was mainly concentrated in southern Anhui, northern Fujian, eastern Hubei, Hunan, southern Jiangsu, northern Jiangxi, northern Taiwan and Zhejiang (Figure 6b). Compared with the LIG period, the suitable habitat during the Middle Holocene period presented a more fragmented pattern. The total suitable area was 64.50 × 10⁴ km², with a decrease of 7.49% relative to the current (Table 3).
In a word, the suitable habitat for S. xylocarpa had been continuously shrinking from the past to the present, and its habitat fragmentation had intensified.

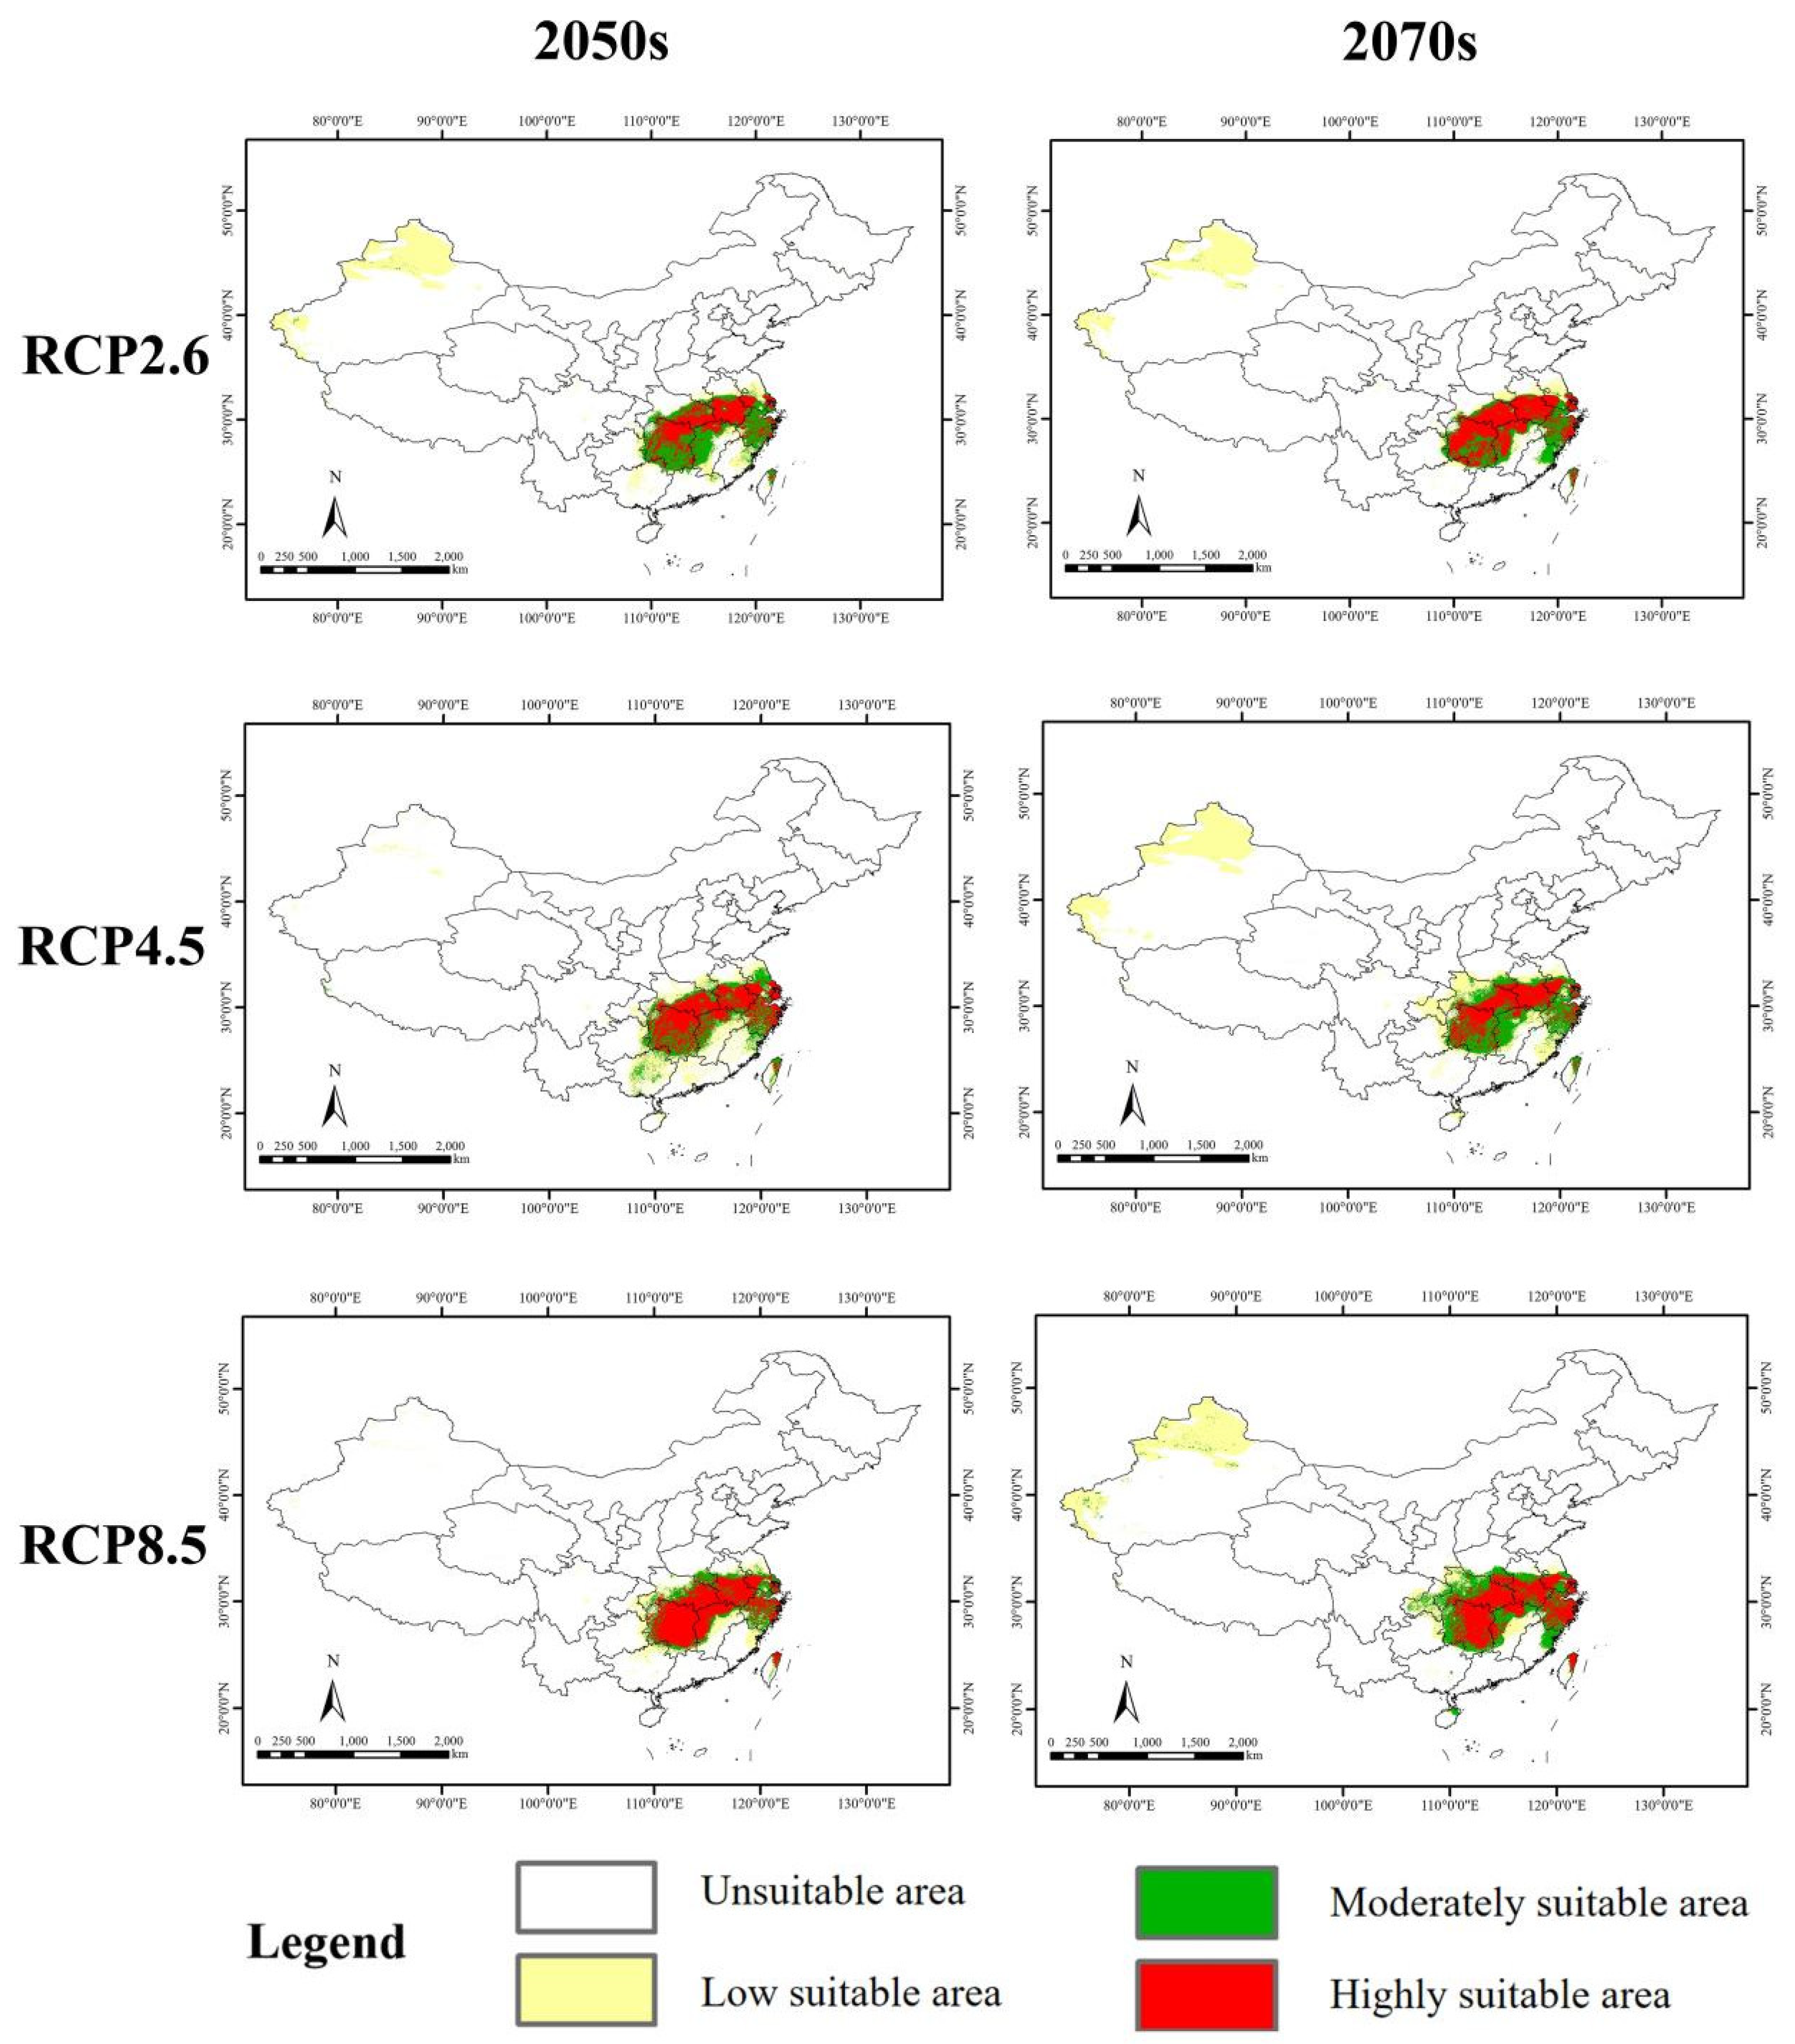
3.5. Potential Suitable Distribution in the Future

The suitable area in the future was mainly concentrated in southern Anhui, southern Hubei, Hunan, southern Jiangsu, northern Jiangxi, northern Taiwan and Zhejiang. However, it was expected to reduce its suitable areas in these provinces to varying degrees (Figure 7).
Under six future climate scenarios, the predicted suitable area was averagely 62.07 × 10⁴ km², which decreased by 10.97% compared to the current. In the six future scenarios, except for an increase under the RCP 8.5 in the 2070s, the suitable area decreased in the other five scenarios. It was expected that under the RCP 8.5 scenario in the 2050s, the suitable area would decrease the most, which reduced by 16.32% compared to the current. In contrast, under the RCP 4.5 scenario in the 2050s, the suitable area was expected to decrease the least, which decreased by 11.20% compared to the current situation. In addition, the highly suitable area was expected to increase in some scenarios and decrease in others. Overall, the average highly suitable area under the six future scenarios was expected to be 36.26 × 10⁴ km², which increased by 6.18% compared to the current condition. However, average moderately suitable area under the six future scenarios was expected to be 25.81 × 10⁴ km², which decreased by 27.44% compared to the current condition. In addition, it was expected that this species would decrease in suitable area much greater in the 2050s than in the 2070s (Table 3).
Overall, the suitable area for S. xylocarpa under future climate scenarios, with more habitat fragmentation, was mostly smaller than under the current condition. This indicated that future climate might be unfavorable for the survival of S. xylocarpa.

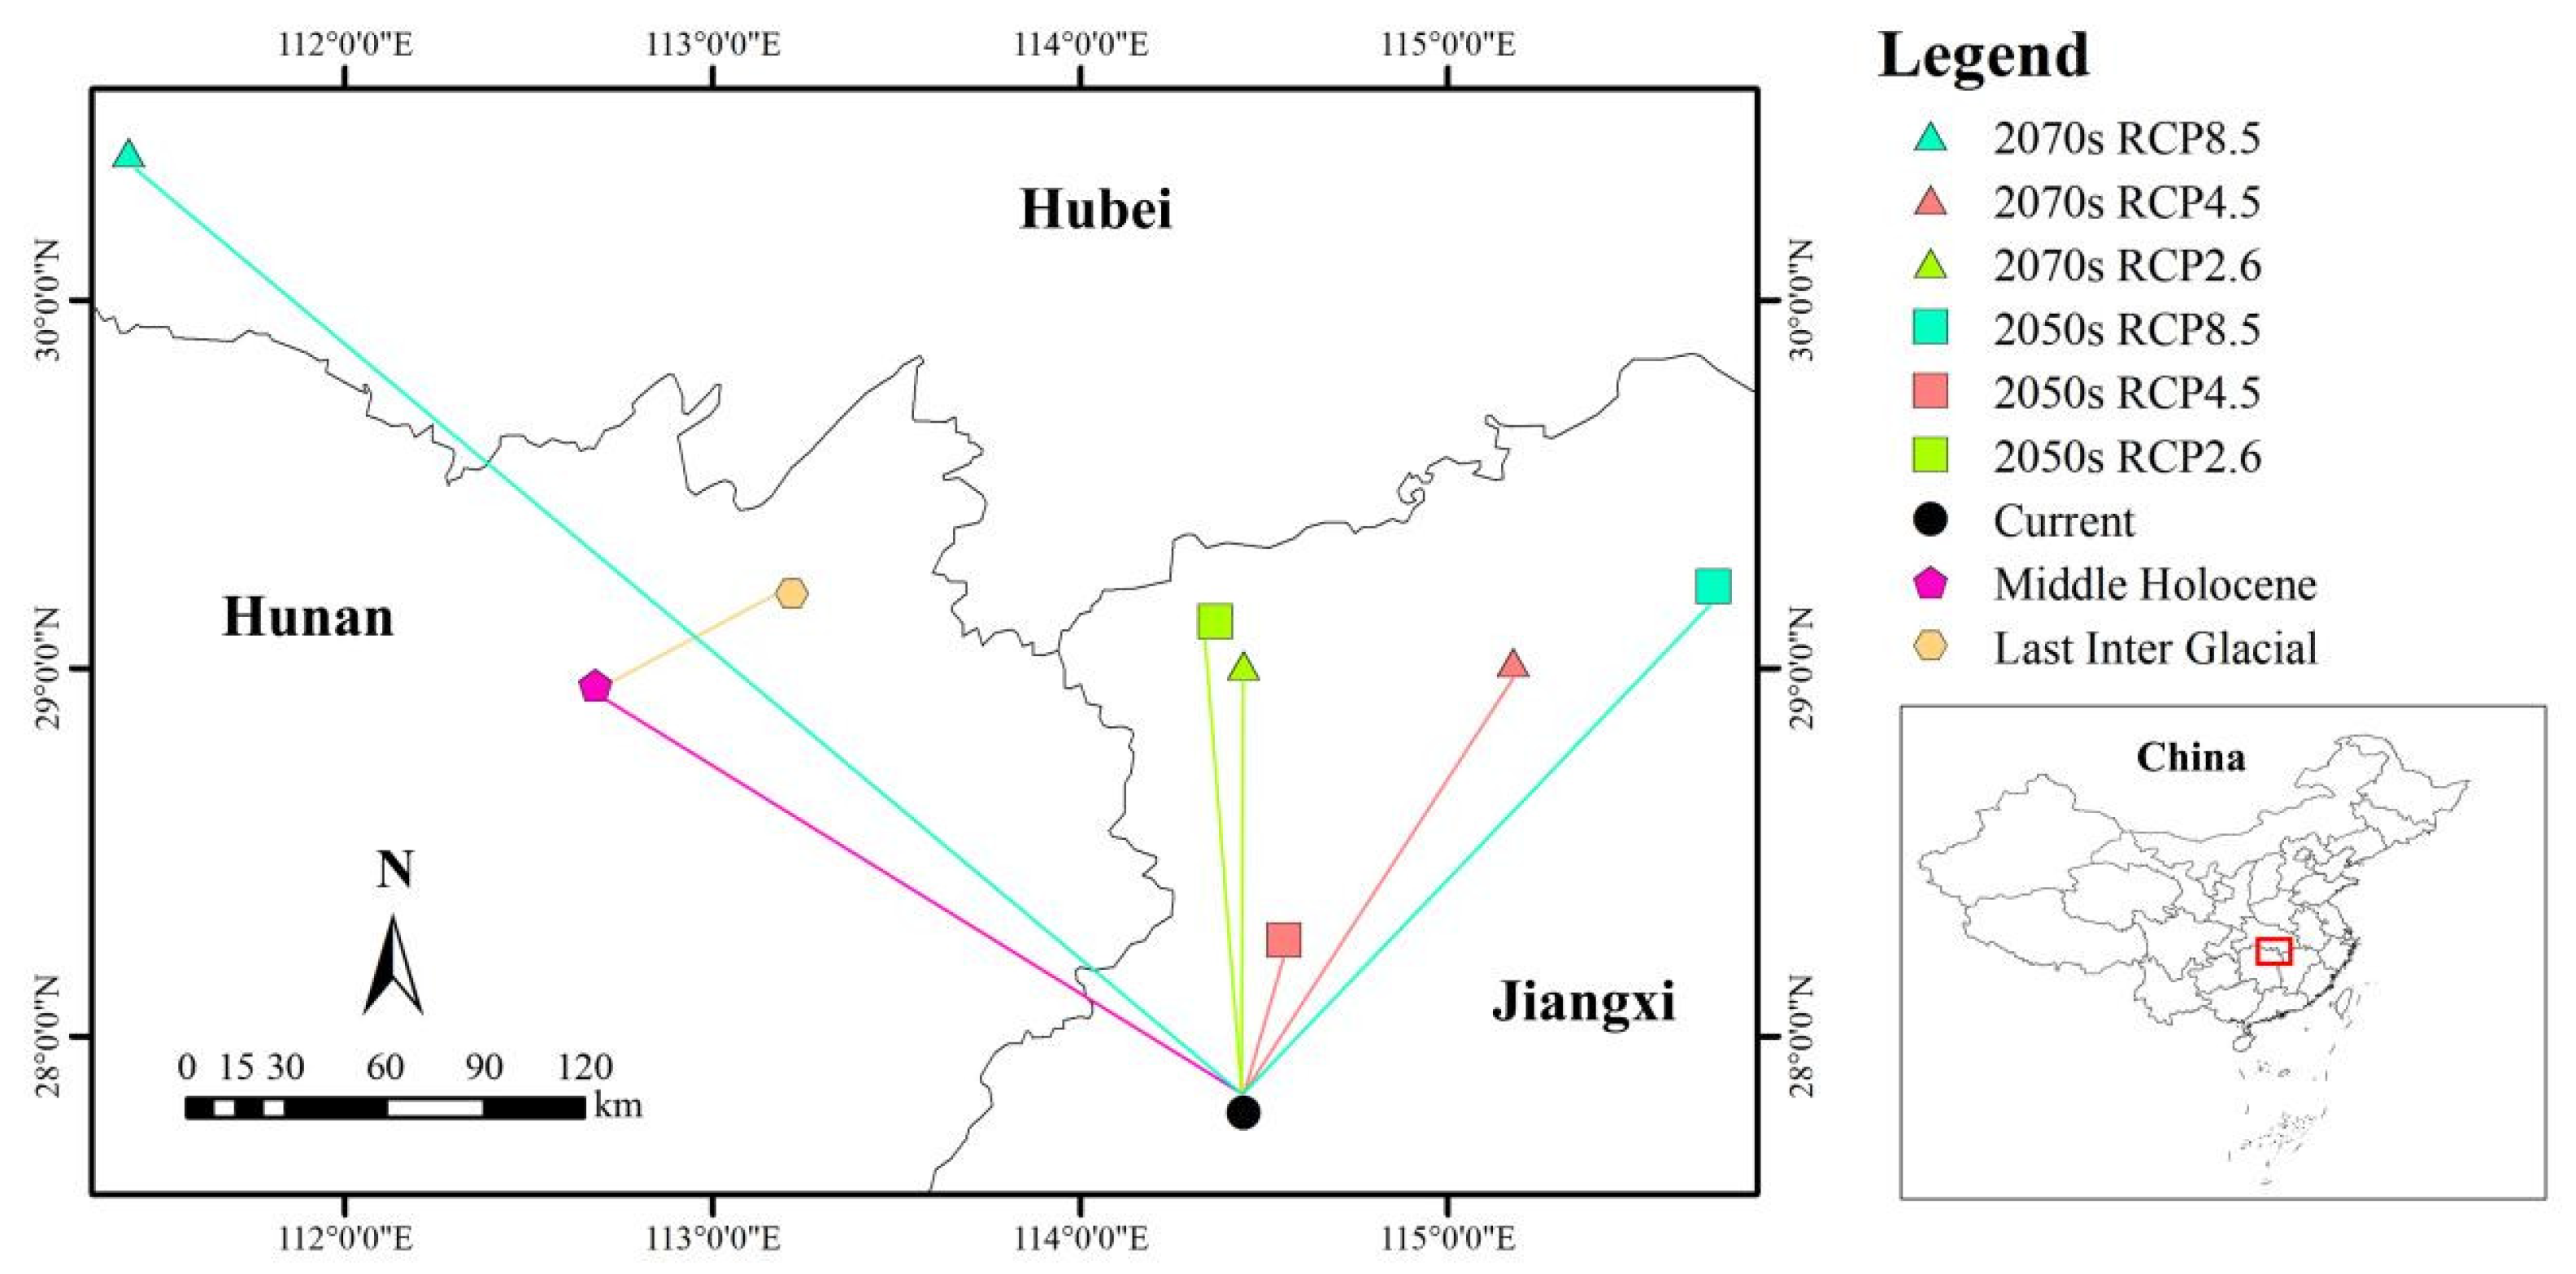
3.6. Centroid Shift under Different Scenarios

The current centroid coordinates of S. xylocarpa were located at 114.446°E, 27.793°N. From the Last Interglacial period (113.216°E, 29.201°N) to the Middle Holocene period (112.682°E, 28.955°N) and then to the present, the centroid first shifted 58.70 km in the southwest direction, and then 215.55 km in the southeast direction. Under the RCP 2.6 scenario, it was expected that in the 2050s, the centroid coordinates would shift 147.91 km in the northwest direction to 114.368°E, 29.126°N, and by the 2070s, it would shift 134.57 km in the north direction to 114.446°E, 29.007°N. Under the RCP 4.5 scenario, it was expected that in the 2050s, the centroid coordinates would migrate 52.96 km in the northeast direction to 114.555°E, 28.261°N, and by the 2070s, it would shift 153.22 km in the northeast direction to 115.178°E, 29.015°N. Under the RCP 8.5 scenario, it was expected that in the 2050s, the centroid coordinates would shift 201.67 km in the northeast direction to 115.722°E, 29.221°N, and by the 2070s, it would shift 413.29 km in the northwest direction to 111.412°E, 30.402°N (Figure 8).
Overall, the centroid exhibited a sinuous changing pattern. From the Last Interglacial period to the Middle Holocene period, the centroid first moved towards southwest and then southeast. From the current to the future, the centroid of S. xylocarpa is generally expected to shift in the northeast direction.

4. Discussion

4.1. Model Selection and Evaluation

It is generally believed that ensemble models make better predictions of species’ distribution than single models (Cai and Zhang,2024). The outcomes from our ensemble confirmed this. In this study, we forecast the potential distribution of the endangered tree species S. xylocarpa with each of the ten individual models in Biomod2 platform separately. The results showed that there were six models with the value of AUC > 0.8 and TSS >0.7. Next, we combined the six models into an ensemble model, whose AUC and TSS were all above 0.9 (Table 2). This indicated that such an ensemble model outperformed individual models. Subsequently, we used this ensemble model to predict the current distribution of S. xylocarpa, and the result displayed that the prediction is generally consistent with the known distribution points. This indicated that the ensemble model had demonstrated good predictive accuracy. Thus, we employed this model to project the suitable distribution of S. xylocarpa under different climate scenarios of past, present, and future.

4.2. Key Influencing Factors of S. xylocarpa

The ensemble model results show that the top three factors affecting the current potential distribution of S. xylocarpa are Bio17, Bio10 and Bio18. The sum of their contribution rates is nearly 80%, which suggests that the main factors limiting the distribution of S. xylocarpa are bioclimatic factors rather than topography or soil. Among these climatic factors, Bio17 has the largest contribution rate, exceeding 60%, which is much larger than of Bio10 (9.6%) and Bio18 (8.9%). This indicates that precipitation-related variables may play a greater role in limiting the distribution of S. xylocarpa than temperature-related variables. Zhu et al. (2024) conducted a comprehensive analysis of genome and population dynamics for S. xylocarpa and concluded that among the 19 bioclimatic factors, temperature-related variables had a greater influence on its distribution than precipitation-related variables. Such a difference is probably due to the fact that in the former only two sites are sampled (i.e., one in Nanjing, Jiangsu Province, and the other in Ningbo, Zhejiang Province), while in this study a total of twenty-one distribution points are used in the final model (Figure 2, Table S1). Evidently, the latter is more representative than the former.
In addition, our results also show that the contribution rate of elevation is 5.4% among 22 variables, which ranks the fourth. This indicates that besides climatic factors, elevation is also one of the important factors limiting the distribution of S. xylocarpa. Yang et al. (2018) used self-organizing map (SOM) to analyze the wild S. xylocarpa community in Laoshan mountain of Nanjing, Jiangsu Province, eastern China, and found that elevation was the main factor affecting the growth and distribution of S. xylocarpa in this area. This is somewhat consistent with the results from our ensemble modeling.
Therefore, our study suggests that S. xylocarpa prefers to grow in low-altitude areas with a warm and humid climate, which conforms with the phenomena that most of the known S. xylocarpa populations concentrate in the subtropical hilly areas of southeastern China (Field observation by corresponding author).

4.3. Current Suitable Area of S. xylocarpa

Our model prediction results show that the current suitable area for S. xylocarpa is 69.72×10⁴ km2, accounting for only 7.26% of China’s total land area. It is mainly distributed in Anhui, Guangxi, Hubei, Hunan, Jiangsu, Jiangxi, Taiwan, and Zhejiang in China (Figure 4). Given that the fruits of S. xylocarpa are drupes (Figure 1b) with hundred kernel weight of 98.4 g (Jia and Shen, 2007), it seems unlikely for its seeds to disperse from Chinese mainland to Taiwan because Taiwan Strait separates them with the minimum width of 130 km.
Actually, up to now there is no record of its wild populations in Taiwan Province (Yang et al., 2008). Therefore, we think that the suitable distribution area of S. xylocarpa covers seven provinces except Taiwan in China. However, according to Flora of China S. xylocarpa only occurs in one province, namely Jiangsu Province. According to the newly published monograph National Key Protected Wild Plants of China (Jin et al., 2023), this species is distributed in Nanjing of Jiangsu Province, Hangzhou of Zhejiang Province, Shanghai, and Wuhan of Hubei Province. In fact, as early as in 1987 Flora of China (in Chinese edition) recorded that S. xylocarpa occurred in Nanjing and was cultivated in cities such as Hangzhou, Shanghai, and Wuhan. Therefore, it is probably not true about its distribution description by Jin et al. (2023). More recently, a wild population has been found in Cixi mountain area of Ningbo, Zhejiang Province (Zhu et al., 2024). We also found its wild community in Wuwei hilly area of Wuhu, Anhui Province in 2024 (Figure 1d). Therefore, our results indicate that S. xylocarpa have much larger suitable habitats in China than its known.

4.4. Suitable Area Change in the Past and Future

According to modeling analysis, S. xylocarpa had a suitable area of 63.84 × 10⁴ km2 in the Last Interglacial (LIG), and moderately expanded to 64.50 × 10⁴ km2 in the Middle Holocene (MH). Compared with the current climate scenario, their suitable areas decreased by 8.43% and 7.49%, respectively. Furthermore, habitat fragmentation of S. xylocarpa was increasing from LIG to MH (Figure 5). Overall, there was an increasing trend in suitable habitat for S. xylocarpa from LIG to MH and then to the current. This is likely due to global warming since the Holocene, with higher temperatures and more precipitation (He et al., 2022), which favors the expansion of S. xylocarpa populations. Additionally, this may also be related to the bottleneck effect of S. xylocarpa populations after experiencing multiple Glacial periods (Zhu et al., 2024).
Under future climate scenarios, excluding the RCP 8.5 in the 2070s, the suitable areas for S. xylocarpa will decrease, ranging from 11.2% to 15.06%, in the five remaining scenarios. Overall, the suitable habitat for S. xylocarpa is expected to be reduced by an average of 10.97% under the future scenarios compared to the current (Table 3). Moreover, its habitat fragmentation will increase under the future scenarios compared to the current (Figure 6). This suggests that the future climate may be unfavorable for the growth and distribution of S. xylocarpa.
In addition, the shift direction of S. xylocarpa in the future is largely to the north, especially to the northeast (Figure 7), which is similar to these endangered tree species like Taxus wallichiana var. Mairei, T. wallichiana var. chinensis (Wu et al., 2022) and Emmenopterys henryi (Cai et al., 2024). This may be related to the tree traits. Just as stated above, the most important factor influencing the current distribution of S. xylocarpa is Bio17 (precipitation of driest quarter), followed by Bio10 (mean temperature of warmest quarter) (Table 2). Namely, S. xylocarpa prefers to grow in relatively warm and humid habitats in China.

4.5. Conservation Implications for S. xylocarpa

S. xylocarpa has a suitable area of 69.72 × 10⁴ km2, spanning seven provinces, and is mainly distributed in the low elevation areas of southeastern China. This is quite different from previous views. For example, it is usually assumed that its wild populations only occur in Jiangsu Province, eastern China (Liu, 2015; Zhu et al., 2021). That is, this species has long been believed to be endemic to Jiangsu. Given that S. xylocarpa usually forms patchy populations with small deme sizes, it is recommended that supplementary surveys be carried out in suitable areas for S. xylocarpa, especially in highly suitable areas (Figure 4), such as eastern Hunan, northern Jiangxi and northern Zhejiang in the future.
In addition, Zhu et al. (2024) pointed out that, like other endangered tree species, S. xylocarpa had a low genome-wide nucleotide diversity. However, their study only sampled two locations: Nanjing in Jiangsu Province and Ningbo in Zhejiang Province. Our results indicate that S. xylocarpa is distributed across multiple provinces, and its different populations are often isolated from each other (Figure 4). Therefore, it is advised that more samples should be collected from various locations to reveal the genetic diversity and genetic structure of S. xylocarpa.
In our analysis, by overlaying the suitable distribution of S. xylocarpa with national and provincial nature reserves, we have noted that for S. xylocarpa only 1.84% of the suitable area is located within national nature reserves and 2.15% within provincial nature reserves, respectively. This indicates that for S. xylocarpa more than 90% of its suitable habitat is in a zero-protection status. According to IUCN red list, this species is ranked as vulnerable. However, such an assessment is based on the data in 1998 (www.iucnredlist.org/species/32374/9701730, accessed on 3 February 2025). Indeed, it belonged to the “endangered” category in China (Qin, 2020) and “endangered” in Jiangsu Province (Zhang et al., 2022). Its endangerment can be ascribed to the following reasons. The species is generally distributed in low-altitude areas of southeastern China, in which there are usually intense human activities, such as logging, grazing road-building, and touring (Yao et al., 2005). This inevitably results in habitat fragmentation or habitat destruction. Recent research has confirmed that highly lignified and fibrotic pericarps inhibit the seed germination of S. xylocarpa (Zhu et al., 2024). Other researches hold that its compact endosperm is also a mechanical barrier to embryo germination (Jia and Shen, 2007). Additionally, it is noted that its seeds usually need to be treated with low temperatures in winter after seed maturation in the field. Afterward, its hard seed coat will be decayed and its seeds can germinate in the next spring (Jia and Shen, 2007). Our results also show that the current distribution areas of S. xylocarpa are isolated from each other, with severe habitat fragmentation. Therefore, we propose to expand nature reserve areas or establish new conservation sites for S. xylocarpa, especially in the projected concentrating distribution areas. Additionally, ex situ conservation could be carried out in its suitable habitats.
Furthermore, Sinojackia is a monophyletic genus, and currently consists of five species in China. The vast majority of Sinojackia species have small population sizes and narrow distribution areas, and all species are endemic to China. Now, they are all listed as national secondary protected wild plants. This study, taking S. xylocarpa as a representative species, for the first time employs an ensemble model to determine its suitable distribution, identifies the key factors influencing its distribution, and analyzes the impact of climate change on its geographical distribution across different periods. Such a study can provide a valuable reference for the conservation of other endangered Sinojackia species in the future. In addition, our study also highlights that for a taxon with restricted or endemic distribution at the local scale, it is more appropriate to forecast the habitat suitability at the level of species than at the level of genus.

5. Conclusions

In the present study, we developed an ensemble model consisting of six models to project the potential distribution of endangered tree S. xlylocarpa endemic to China across different climate scenarios. The outcomes indicate that climate change may have an adverse effect on its suitable area and habitat integrity. This study is one of the first to demonstrate that this species is mainly distributed in southeast China, with the suitable area of 69.72 × 10⁴ km2, which is larger than known. Nevertheless, more than 90% of the suitable areas are outside national or provincial nature reserves in China. Therefore, our study contributes to the conservation, management, and cultivation of S. xylocarpa, and can also provide useful information for other endangered Sinojackia species in China.

Supplementary Materials

The following supporting information can be downloaded at the website of this paper posted on Preprints.org, Table S1: Latitude and longitude coordinates of 21 occurrence records of the endangered Sinojackia xylocarpa in China.

Author Contributions

Conceptualization, G.Z.; methodology, C.H.; software, C.H.; validation, H.W., G.Z.; formal analysis, C.H., H.W., and G.Z.; investigation, G.Z.; resources, C.H., H.W., and G.Z.; data curation, C.H., H.W., and G.Z.; writing—original draft preparation, C.H., H.W.; writing—review and editing, G.Z.; visualization, C.H., H.W.; supervision, G.Z.; project administration, G.Z.; funding acquisition, G.Z. All authors have read and agreed to the published version of the manuscript.

Funding

This research was financially supported by investigation and assessment of key protected wild plants in Jiangsu Province from Jiangsu Forestry Bureau (No. 2023053SMnull0162).

Institutional Review Board Statement

Not applicable.

Informed Consent Statement

Not applicable.

Data Availability Statement

Data are contained within the article and supplementary materials.

Acknowledgments

We are very grateful to Hanwei Cai, Weiyi Hang, Yanrong Zhou, Ze Lan, and Yansong Chen for their assistance in field work. We thank Haoran Wang and Ting Liu for their help in data processing.

Conflicts of Interest

The authors declare no conflicts of interest.

References

  1. Brown, J.L.; Bennett, J.R.; French, C.M. SDMtoolbox 2.0: the next generation Python-based GIS toolkit for landscape genetic, biogeographic and species distribution model analyses. PeerJ 2017, 5, e4095. [Google Scholar] [CrossRef]
  2. Cai, H.W.; Zhang, G.F. Predicting the potential distribution of rare and endangered Emmenopterys henryi in China under climate change. Ecol. Evol. 2024, 14, e70403. [Google Scholar] [CrossRef]
  3. Chen, T.; Chen, Z.Y. The Geographical distribution of Styracaceae. Bull. Bot. Res. 1995, 16, 57–66. [Google Scholar]
  4. Coban, H.O.; Örücü, Ö.K.; Arslan, E.S. MaxEnt modeling for predicting the current and future potential geographical distribution of Quercus libani Olivier. Sustainability 2020, 12, 2671. [Google Scholar] [CrossRef]
  5. Ding, Y.L.; Shi, Y.T.; Yang, S.H. Molecular regulation of plant responses to environmental temperatures. Mol. Plant. 2020, 13, 544–564. [Google Scholar] [CrossRef]
  6. Elith, J.; Phillips, S.J.; Hastie, T.J.; Dudík, M.; Chee, Y.E.; Yates, C.J. A statistical explanation of MaxEnt for ecologists. Divers. Distrib. 2011, 17, 43–57. [Google Scholar] [CrossRef]
  7. Feng, M.; Zhang, J.S. Niche evolution and conservation of a Chinese endemic genus Sinojackia (Styracaceae). Biology 2024, 13, 1085. [Google Scholar] [CrossRef]
  8. Fick, S.E.; Hijmans, R.J. WorldClim 2: New 1-km spatial resolution climate surfaces for global land areas. Int. J. Climatol. 2017, 37, 4302–4315. [Google Scholar] [CrossRef]
  9. Gao, Q.H.; Qin, Y.Y.; Liang, M.C.; Gao, X. Interpretation of the main conclusions and suggestions of IPCC AR6 Synthesis Report. Env. Prot. 2023, 51, 82–84. [Google Scholar]
  10. Hao, R.M.; Huang, Z.Y.; Liu, X.J.; Wang, Z.L.; Xu, H.Q.; Yao, Z.G. The natural distribution and characteristics of the rare and endangered plants in Jiangsu, China. Biodivers. Sci. 2000, (2), 153–162. [Google Scholar]
  11. Hu, C.G. Preliminary survey report on Sinojackia microcarpa. Anhui For. Sci. Technol. 2018, 44, 54–55. [Google Scholar]
  12. Hu, H.H. Sinojackia, a new genus of Styracaceae from southeastern China. J. Arnold Arbor. 1928, 9, 130–131. [Google Scholar] [CrossRef]
  13. Huang, D.Y.; An, Q.J.; Huang, S.P.; Tan, G.D.; Quan, H.G.; Chen, Y.N.; Zhou, J.Y.; Liao, H. Biomod2 modeling for predicting the potential ecological distribution of three Fritillaria species under climate change. Sci. Rep. 2023, 13. [Google Scholar] [CrossRef]
  14. Huang, S.M.; Grimes, J. Styracaceae. In Wu Z Y., Raven P.H. Flora of China; Science Press: Beijing, China, 1996; Volume 15, pp. 253–271. [Google Scholar]
  15. Huang, Z.Y.; Zhu, X.Y. The study on eco-geographical distribution, biology characteristics and propagation techniques of Sinojackia xylocarpa. J. Jiangsu For. Sci. Technol. 1998, 25, 15–18. [Google Scholar]
  16. Jia, S.G.; Shen, Y.B. Research progress on Sinojackia xylocarpa Hu. J. Jiangsu For. Sci. Technol. 2007, 34, 41–45. [Google Scholar]
  17. Jin, X.H.; Zhou, Z.H.; Yuan, L.C. National Key Protected Wild Plants of China; Hubei Science and Technology Press: Wuhan, China, 2023; Volume 3, p. 362. [Google Scholar]
  18. Khan, A.M.; Li, Q.; Saqib, Z.; Khan, N.; Habib, T.; Khalid, N.; Majeed, M.; Tariq, A. MaxEnt modelling and impact of climate change on habitat suitability variations of economically important Chilgoza Pine (Pinus gerardiana Wall.) in South Asia. Forests 2022, 13, 715. [Google Scholar] [CrossRef]
  19. Li, J. Characteristics and cultivation techniques of Sinojackia. Anhui Agric. Sci. Bull. 2014, 20, 120–121. [Google Scholar]
  20. Liu, C.R.; Newell, G.; White, M. On the selection of thresholds for predicting species occurrence with presence-only data. Ecol. Evol. 2015, 6, 337–348. [Google Scholar] [CrossRef]
  21. Liu, Q.X. Flora of Jiangsu; Jiangsu Phoenix Science Press: Nanjing, China, 2015; Volume 4, p. 27. [Google Scholar]
  22. Liu, T.; Cai, H.W.; Zhang, G.F. Assessment of climate change impacts on the distribution of endangered and endemic Changnienia amoena (Orchidaceae) using ensemble modeling and gap analysis in China. Ecol. Evol. 2024, 14, e70636. [Google Scholar] [CrossRef]
  23. Liu, Z.H. Research progress of Sinojackia Hu. Jiangsu Agric. Sci. 2017, 45, 11–15. [Google Scholar]
  24. Luo, L.Q. A new synonym in the genus Sinojackia (Styracaceae). J. Syst. Evol. 2005, 43(6), 561–564. [Google Scholar] [CrossRef]
  25. Luo, L.Q. Sinojackia xylocarpa var. leshanensis (Styracaceae), a new variety from Sichuan, China. Bull. Bot. Res. 2005, 25, 260–261. [Google Scholar]
  26. Luo, L.Q.; Luo, C. Taxonomic circumscription of Sinojackia xylocarpa (Styracaceae). J. Syst. Evol. 2011, 49, 163–164. [Google Scholar] [CrossRef]
  27. Luo, M.C.; Shi, Q.Z.; Yang, J.J.; Guo, X.; Fang, Y.P. Study on natural population of Sinojackia huangmeiensis in Hubei Province. J. Anhui Agric. Sci. 2016, 44, 67–68. [Google Scholar]
  28. Martı’nez-Minaya, J.; Cameletti, M.; Conesa, D.; Pennino, M.G. Species distribution modeling: a statistical review with focus in spatio-temporal issues. Stoch. Environ. Res. Risk Assess. 2018, 32, 3227–3244. [Google Scholar] [CrossRef]
  29. Qin, H.N. Seed Plants of China: Checklist, Uses and Conservation Status; Hebei Science and Technology Press: Shijiazhuang, China, 2020; Volume 4, pp. 2277–2278. [Google Scholar]
  30. Radosavljević, A.; Anderson, R.P. Making better Maxent models of species distributions: complexity, overfitting and evaluation. J. Biogeogr. 2014, 41, 629–643. [Google Scholar] [CrossRef]
  31. Rota, F.; Scherrer, D.; Bergamini, A.; Price, B.; Walthert, L.; Baltensweiler, A. Unravelling the impact of soil data quality on species distribution models of temperate forest woody plants. Sci. Total Environ. 2024, 944, 173719. [Google Scholar] [CrossRef]
  32. Shi, X.D.; Yin, Q.; Sang, Z.Y.; Zhu, Z.L.; Jia, Z.K.; Ma, L.Y. Prediction of potentially suitable areas for the introduction of Magnolia wufengensis under climate change. Ecol. Indic. 2021, 127, 107762. [Google Scholar] [CrossRef]
  33. Sillero, N.; Barbosa, A. Common mistakes in ecological niche models. Int. J. Geogr. Inf. Sci. 2020, 35, 213–226. [Google Scholar] [CrossRef]
  34. Stanton, J.C.; Pearson, R.G.; Horning, N.; Ersts, P.; Reşit Akçakaya, H. Combining static and dynamic variables in species distribution models under climate change. Methods Ecol. Evol. 2012, 3, 349–357. [Google Scholar] [CrossRef]
  35. Su, Q.T.; Du, Z.X.; Luo, Y.; Zhou, B.; Xiao, Y.A.; Zou, Z.R. MaxEnt modeling for predicting the potential geographical distribution of Hydrocera triflora since the Last Interglacial and under future climate scenarios. Biology 2024, 13, 745. [Google Scholar] [CrossRef] [PubMed]
  36. Thuiller, W. BIOMOD–optimizing predictions of species distributions and projecting potential future shifts under global change[J]. Global Change Biol. 2003, 9(10), 1353–1362. [Google Scholar] [CrossRef]
  37. Wang, H.R.; Zhi, F.Y.; Zhang, G.F. Predicting impacts of climate change on suitable distribution of critically endangered tree species Yulania zenii (W. C. Cheng) D. L. Fu in China. Forests 2024, 15, 883. [Google Scholar] [CrossRef]
  38. Wu, R.F.; Huang, S.M. Styracaceae. In Flora of China; Wu, Z.Y., Ed.; Science Press: Beijing, China, 1987; Volume 60, p. 144. [Google Scholar]
  39. Wu, X.T.; Wang, M.Q.; Li, X.Y.; Yan, Y.D.; Dai, M.J.; Xie, W.Y.; Zhou, X.F.; Zhang, D.L.; Wen, Y.F. Response of distribution patterns of two closely related species in Taxus genus to climate change since Last Inter- Glacial. Ecol. Evol. 2022, 12, e9302. [Google Scholar] [CrossRef] [PubMed]
  40. Xin, H.; Ma, W.X.; Zhao, T.T.; Ma, Q.H.; Liang, L.S.; Wang, G.X.; Yang, Z. Prediction of potential distribution of endangered species Corylus chinensis Franch in climate change context. For. Res. 2022, 35, 104–114. [Google Scholar]
  41. Xu, S.Q.; Ma, D.D.; Zhang, F.Y.; Xu, L.Y.; Li, X.P.; Chen, Z.H. A new record species of Styracaceae from Zhejiang Province. J. Zhejiang For. Sci. Technol. 2022, 42, 61–64. [Google Scholar]
  42. Xu, Y.J.; Su, X.; Ren, Z.M. Prediction of historical, current and future potential distribution of Rhus chinensis (Anacardiaceae) based on the optimized MaxEnt model in China. Plant Ecol 2024, 225, 1109–1123. [Google Scholar] [CrossRef]
  43. Yan, G; Zhang, G.F. Predicting the potential distribution of endangered Parrotia subaequalis in China. Forests 2022, 13, 1595. [Google Scholar] [CrossRef]
  44. Yang, Q.F.; Cai, X.Z.; Chen, T. A study on the leaf venation of Changiostyrax C. T. Chen and Sinojackia Hu. Guihaia 1997, 17, 145–148. [Google Scholar]
  45. Yang, T.; Wang, S.T.; Wei, Z.X.; Jiang, M.X. Modeling potential distribution of an endangered genus (Sinojackia) endemic to China. Plant Sci. J. 2020, 38, 627–635. [Google Scholar]
  46. Yang, Y.B.; Liao, J.K.; Tang, M.S. Seed Plants of Taiwan; Forestry Bureau of the Agriculture Commission of the Executive: Taiwan, China, 2008; p. 124. [Google Scholar]
  47. Yao, X.H.; Ye, Q.G.; Fritsch, P.; Cruz, B.; Huang, H.W. Phylogeny of Sinojackia (Styracaceae) based on DNA sequence and microsatellite data: implications for taxonomy and conservation. Ann. Bot. 2008, 101, 651–662. [Google Scholar] [CrossRef] [PubMed]
  48. Yao, X.H.; Ye, Q.G.; Kang, M.; Huang, H.W. Geographic distribution and current status of the endangered genera Sinoiackia and Changiostyrax. Biodiv. Sci. 2005, 13, 339–346. [Google Scholar] [CrossRef]
  49. Ye, X.Z.; Zhang, M.Z.; Yang, Q.Y.; Ye, L.Q.; Liu, Y.P.; Zhang, G.F.; Chen, S.P.; Lai, W.F.; Wen, G.W.; Zheng, S.Q.; Ruan, S.N.; Zhang, T.Y.; Liu, B. Prediction of suitable distribution of a critically endangered plant Glyptostrobus pensilis. Forests 2022, 13, 257. [Google Scholar] [CrossRef]
  50. Zhang, G.F.; Xiong, T.S.; Sun, T.; Li, K.D.; Shao, L.Y. Diversity, distribution, and conservation of rare and endangered plant species in Jiangsu Province. Biodiv. Sci. 2022, 30, 31–40. [Google Scholar] [CrossRef]
  51. Zhang, J.J.; Ye, Q.G.; Yao, X.H.; Huang, H.W. Spontaneous interspecific hybridization and patterns of pollen dispersal in ex situ populations of a tree species (Sinojackia xylocarpa) that is extinct in the wild. Conserv. Biol. 2010, 24, 246–255. [Google Scholar] [CrossRef]
  52. Zhao, G.H.; Cui, X.Y.; Sun, J.J.; Li, T.T.; Wang, Q.; Ye, X.Z.; Fan, B.G. Analysis of the distribution pattern of Chinese Ziziphus jujuba under climate change based on optimized biomod2 and MaxEnt models. Ecol. Indic. 2021, 132, 108256. [Google Scholar] [CrossRef]
  53. Zhou, Y.R.; Lu, X.; Zhang, G.F. Potentially differential impacts on niche overlap between Chinese endangered Zelkova schneideriana and its associated tree species under climate change. Front. Ecol. Evol. 2023, 11, 1218149. [Google Scholar] [CrossRef]
  54. Zhu, D.M.; Zhu, M.; Liu, W.J. Jiangsu’s Key Protected Species Atlas; Nanjing Normal University Press: Nanjing, China, 2021; pp. 30–31. [Google Scholar]
  55. Zhu, S.; Wei, X.F.; Lu, Y.X.; Zhang, D.W.; Wang, Z.F.; Ge, J.; Li, S.L.; Song, Y.F.; Yi, X.G.; Zhang, M.; Xue, J.Y.; Duan, Y.F. The jacktree genome and population genomics provides insights for the mechanisms of the germination obstacle and the conservation of endangered ornamental plants. Hortic. Res. 2024, 11, uhae166. [Google Scholar] [CrossRef]
  56. Zurell, D.; Franklin, J.; König, C.; Bouchet, P.; Dormann, C.; Elith, J.; Fandos, G.; Feng, X.; Guillera-Arroita, G.; Guisan, A. A standard protocol for reporting species distribution models. Ecography 2020, 43, 1261–1277. [Google Scholar] [CrossRef]
Figure 1. Photos of Sinojackia xylocarpa in the field. (a) Individuals in Nanjing, Jiangsu Province; (b) Individuals in Wuwei, Anhui Province; (c) Blooming flowers; (d) Ovoid fruits (drupes). The photos were taken by Guangfu Zhang.
Preprints 148777 g001
Figure 2. Distribution of 21 occurrence records of S. xylocarpa in China.
Preprints 148777 g002
Figure 3. Response curves of S. xylocarpa to key environmental variables. (a) Precipitation of driest quarter (Bio17, mm); (b) Mean temperature of warmest quarter (Bio10, °C); (c) Precipitation of warmest quarter (Bio18, mm); (d) Elevation (m).
Preprints 148777 g003
Figure 4. Potential suitable distribution of S. xylocarpa under current climate in China.
Preprints 148777 g004
Figure 5. The overlap of the current suitable habitat of S. xylocarpa with national and provincial nature reserves in China.
Preprints 148777 g005
Figure 6. Potential suitable distribution of S. xylocarpa in two past periods in China. (a) Last Inter glacial (LIG); (b) Middle Holocene (MH).
Preprints 148777 g006
Figure 7. Potential suitable distribution of S. xylocarpa in China under different future climatic scenarios (RCP 2.6, RCP 4.5, and RCP 8.5) in the 2050s and 2070s.
Preprints 148777 g007
Figure 8. Shifting of the core distribution in suitable areas of S. xylocarpa in China under different climate scenarios.
Preprints 148777 g008
Table 1. Description of 37 environmental variables and percent contribution of variables (in bold font) used in the final ensemble model under different climate scenarios. Note: LIG and MH mean the last interglacial and the middle Holocene, respectively.
Category Variable Description Unit Percent Contribution (%)
LIG MH Current
Bioclimate Bio1 Annual mean temperature °C
Bio2 Mean diurnal range (mean of monthly (max temp–min temp)) °C 5.1 0.5
Bio3 Isothermality((Bio2/Bio7) × 100) % 0.4 2.8 2.2
Bio4 Temperature seasonality(standard deviation × 100) - 19.1 1.5
Bio5 Max temperature of warmest month °C 1.2
Bio6 Min temperature of coldest month °C 0.6
Bio7 Temperature annual range (Bio5–Bio6) °C 2.1
Bio8 Mean temperature of wettest quarter °C 3.1 7.3
Bio9 Mean temperature of driest quarter °C 1.9 2.7
Bio10 Mean temperature of warmest quarter °C 21.7 9.6
Bio11 Mean temperature of coldest quarter °C 16.6 15.5
Bio12 Annual precipitation mm 4.4
Bio13 Precipitation of wettest month mm 3.7 8.7
Bio14 Precipitation of driest month mm
Bio15 Precipitation seasonality (coefficient of variation) - 6.5 27.5 0.9
Bio16 Precipitation of wettest quarter mm
Bio17 Precipitation of driest quarter mm 19.6 23.0 61.0
Bio18 Precipitation of warmest quarter mm 4.2 9.5 8.9
Bio19 Precipitation of coldest quarter mm
Topography Elevation - m 5.4
Slope - ° 0.2
Soil T-BS Topsoil Base Saturation % 0.5
T-CaCO3 Topsoil Calcium Carbonate % 0.1
T-CEC-CLAY Topsoil CEC (clay) - 0.7
T-CEC-SOIL Topsoil CEC (soil) - 0.1
T-CLAY Topsoil Clay Fraction %
T-ECE Topsoil Salinity (Elco) S/m
T-ESP Topsoil Sodicity (ESP) - 0.1
T-GRAVEL Topsoil Gravel Content % 0.6
T-OC Topsoil Organic Carbon % 0.1
T-PH-H2O Topsoil pH (H2O) -
T-REF-BULK Topsoil Reference Bulk Density kg/m3 0.1
T-SAND Topsoil Sand Fraction %
T-SILT Topsoil Silt Fraction % 0.1
T-TEB Topsoil TEB -
T-TEXTURE Topsoil TEXTURE -
T-USDA-TEX Topsoil USDA Texture Classification - 0.2
Table 2. The mean value (±SD) of the area under curve (AUC) and true skill statistic (TSS) of different model algorithms.
Model name Model code AUC TSS
Artificial neural networks model ANN 0.8632 ± 0.1719 0.7324 ± 0.1882
Classification tree analysis model CTA 0.8930 ± 0.0722 0.7864 ± 0.1436
Flexible discriminant analysis model FDA 0.9274 ± 0.0429 0.7376 ± 0.0938
Generalized additive model GAM 0.7692 ± 0.1709 0.6320 ± 0.2128
Generalized boosting model GBM 0.9376 ± 0.0390 0.7089 ± 0.0548
Generalized linear model GLM 0.8468 ± 0.0817 0.6936 ± 0.1635
Maximum entropy model MaxEnt 0.9690 ± 0.0209 0.8918 ± 0.0398
Multivariate adaptive regression splines model MARS 0.8342 ± 0.1135 0.6704 ± 0.2276
Random forest model RF 0.9499 ± 0.0297 0.7130 ± 0.0867
Surface range envelope model SRE 0.5352 ± 0.0498 0.1920 ± 0.0056
Ensemble model 0.9960 ±0.0641 0.9500 ±0.0610
Table 3. Potential suitable areas of S. xylocarpa under different climate scenarios. Up arrow (↑) means increase compared to the current scenario; down arrow (↓) means decrease compared to the current scenario.
Scenarios Low
Suitable Area
Moderately
Suitable Area
Highly
Suitable Area
Suitable Area
(Moderately and Highly)
Area
(×104 km2)
Trend (%) Area
(×104 km2)
Trend (%) Area
(×104 km2)
Trend (%) Area
(×104 km2)
Trend (%)
Last Interglacial 97.56 ↑97.81 20.38 ↓42.70 43.46 ↑27.26 63.84 ↓8.43
Middle Holocene 59.24 ↑20.11 26.30 ↓26.06 38.20 ↑11.86 64.50 ↓7.49
Current 49.32 - 35.57 - 34.15 - 69.72 -
2050s RCP2.6 57.36 ↑16.30 30.98 ↓12.90 28.83 ↓15.58 59.81 ↓14.21
RCP4.5 38.31 ↓22.32 24.66 ↓30.67 37.25 ↑9.08 61.91 ↓11.20
RCP8.5 22.59 ↓54.20 16.24 ↓54.34 42.10 ↑23.28 58.34 ↓16.32
2070s RCP2.6 47.90 ↓2.88 21.48 ↓39.61 38.86 ↑13.79 60.34 ↓13.45
RCP4.5 75.56 ↑53.20 30.06 ↓15.49 29.16 ↓14.61 59.22 ↓15.06
RCP8.5 64.34 ↑30.45 31.44 ↓11.61 41.33 ↑21.02 72.77 ↑4.37
The mean value of six future climate scenarios 51.01 ↑3.43 25.81 ↓27.44 36.26 ↑6.18 62.07 ↓10.97
Disclaimer/Publisher’s Note: The statements, opinions and data contained in all publications are solely those of the individual author(s) and contributor(s) and not of MDPI and/or the editor(s). MDPI and/or the editor(s) disclaim responsibility for any injury to people or property resulting from any ideas, methods, instructions or products referred to in the content.
Copyright: This open access article is published under a Creative Commons CC BY 4.0 license, which permit the free download, distribution, and reuse, provided that the author and preprint are cited in any reuse.
Prerpints.org logo

Preprints.org is a free preprint server supported by MDPI in Basel, Switzerland.

Subscribe

Disclaimer

Terms of Use

Privacy Policy

Privacy Settings

© 2025 MDPI (Basel, Switzerland) unless otherwise stated