Preprint
Article

This version is not peer-reviewed.

Impacts of Human Activity and Climate Change on the Suitable Habitats for Xanthium spinosum in China

A peer-reviewed article of this preprint also exists.

Submitted:

23 December 2024

Posted:

26 December 2024

You are already at the latest version

Abstract

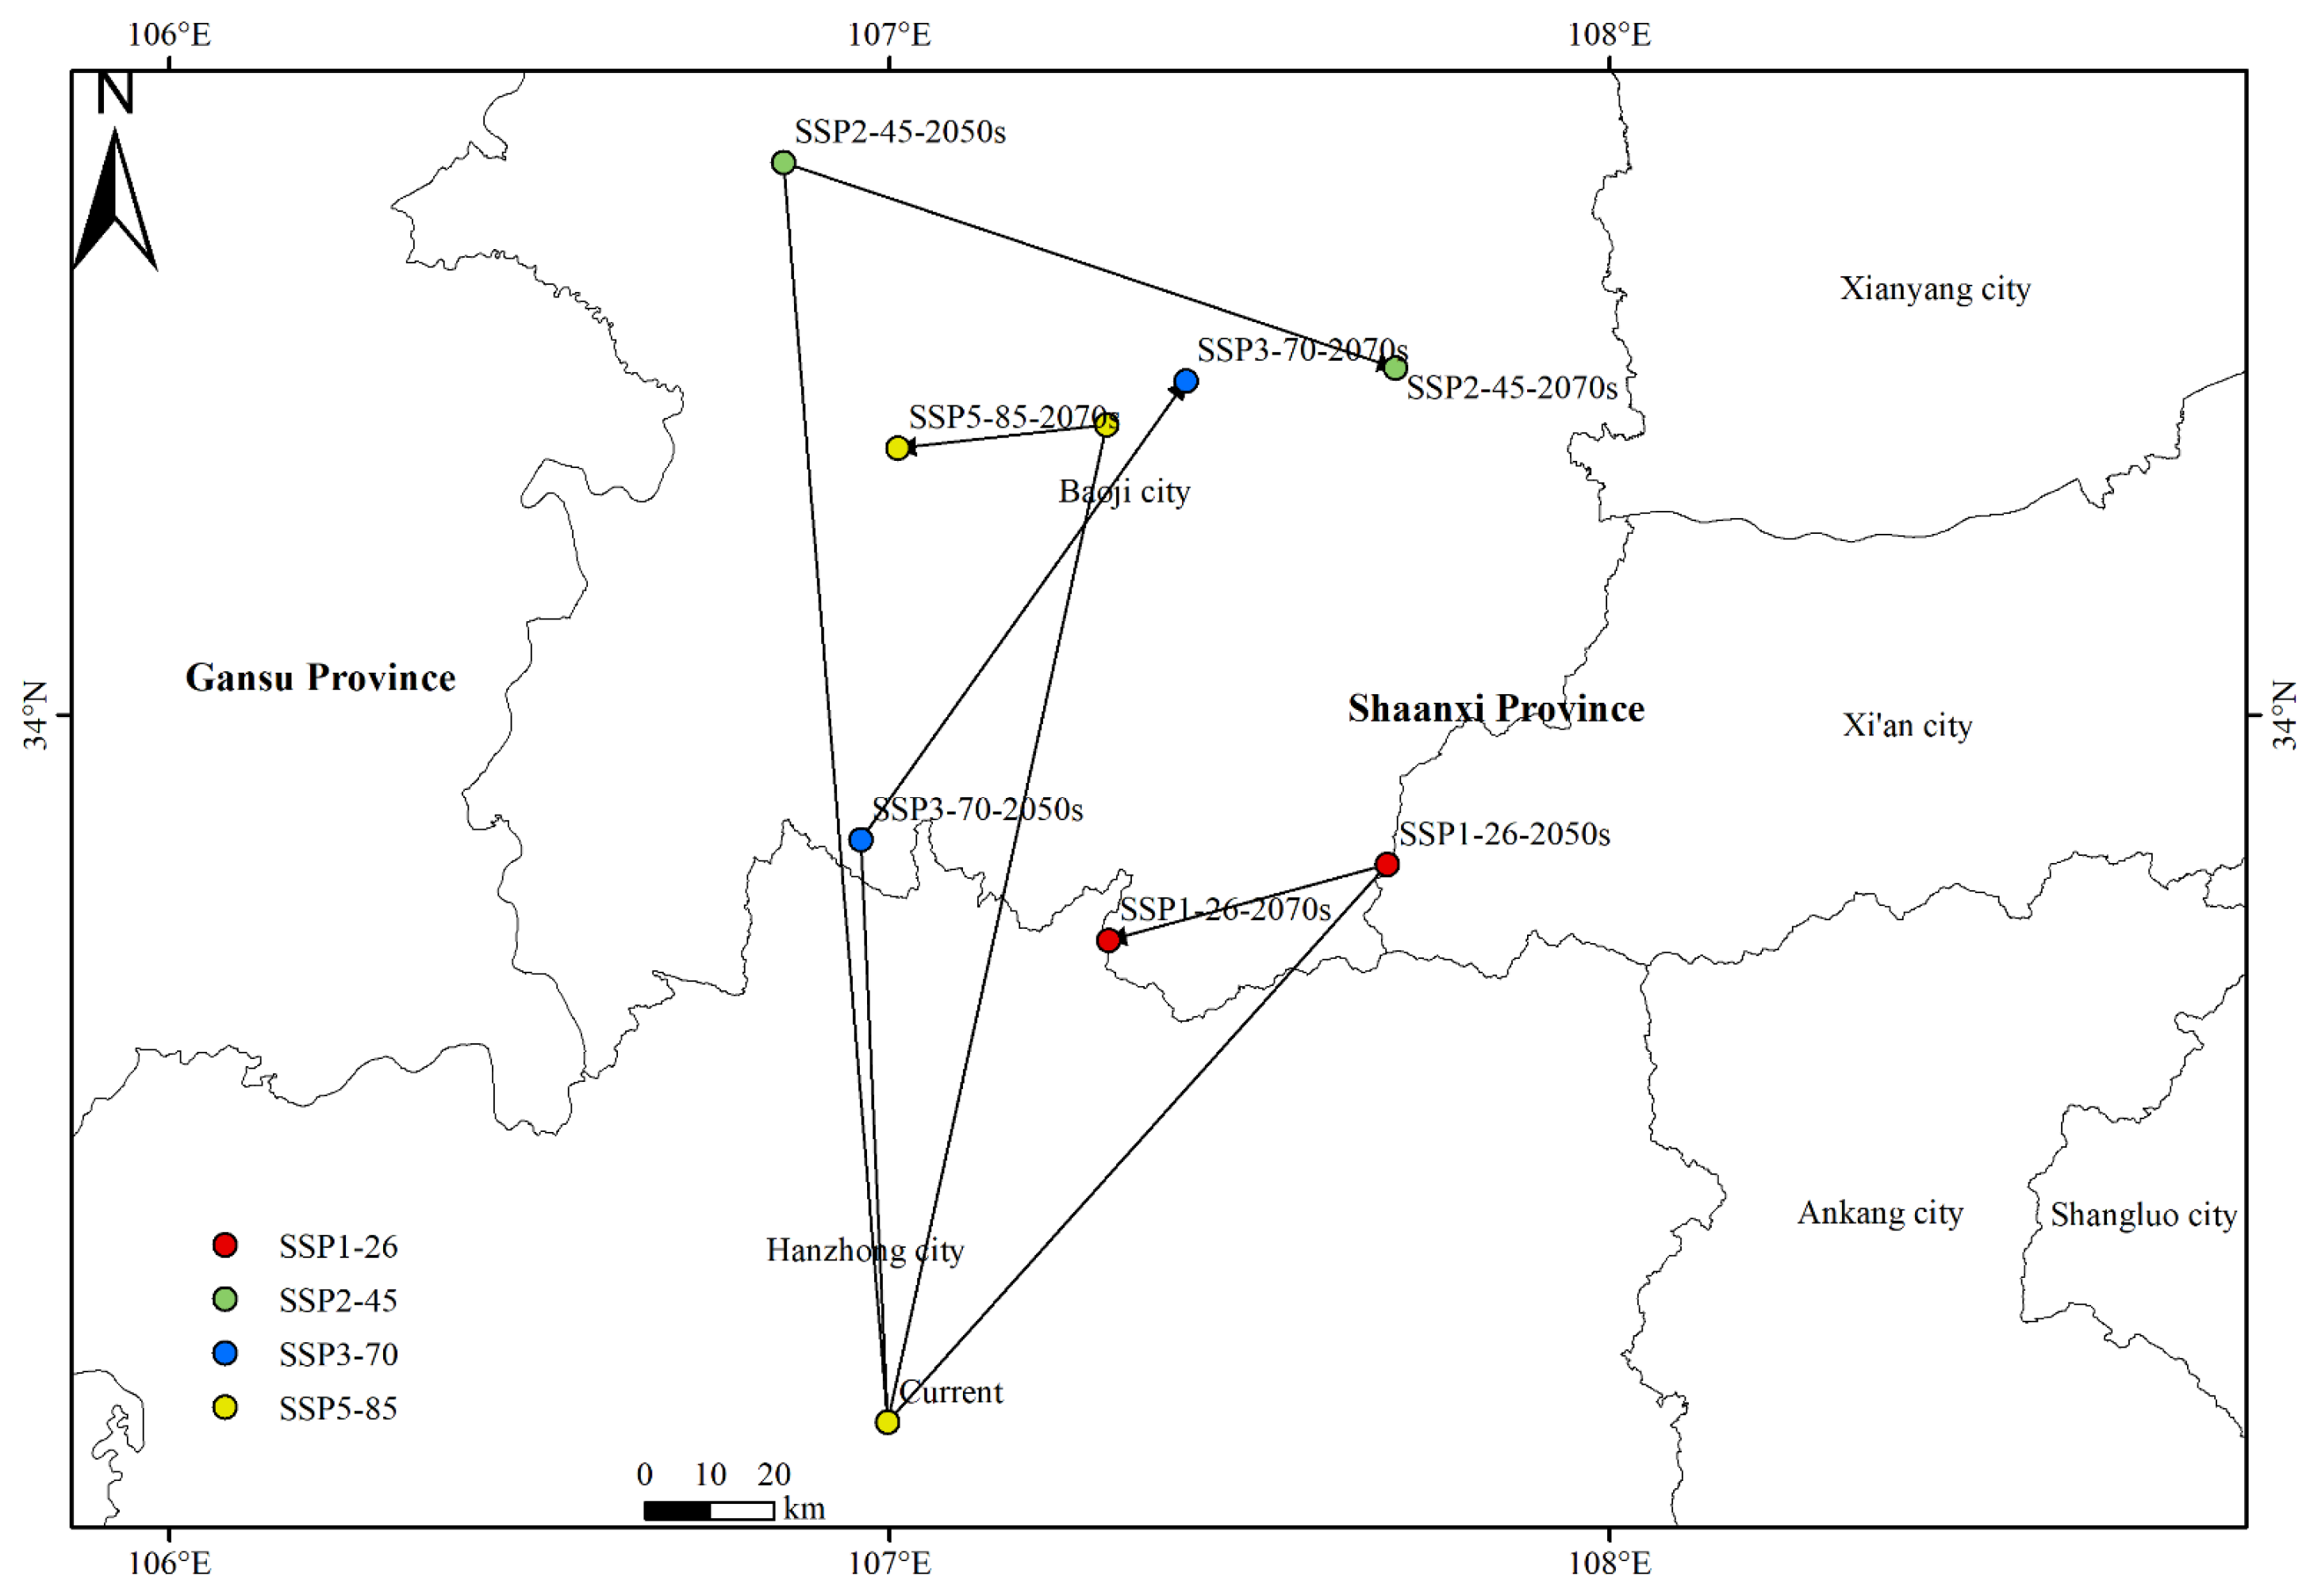
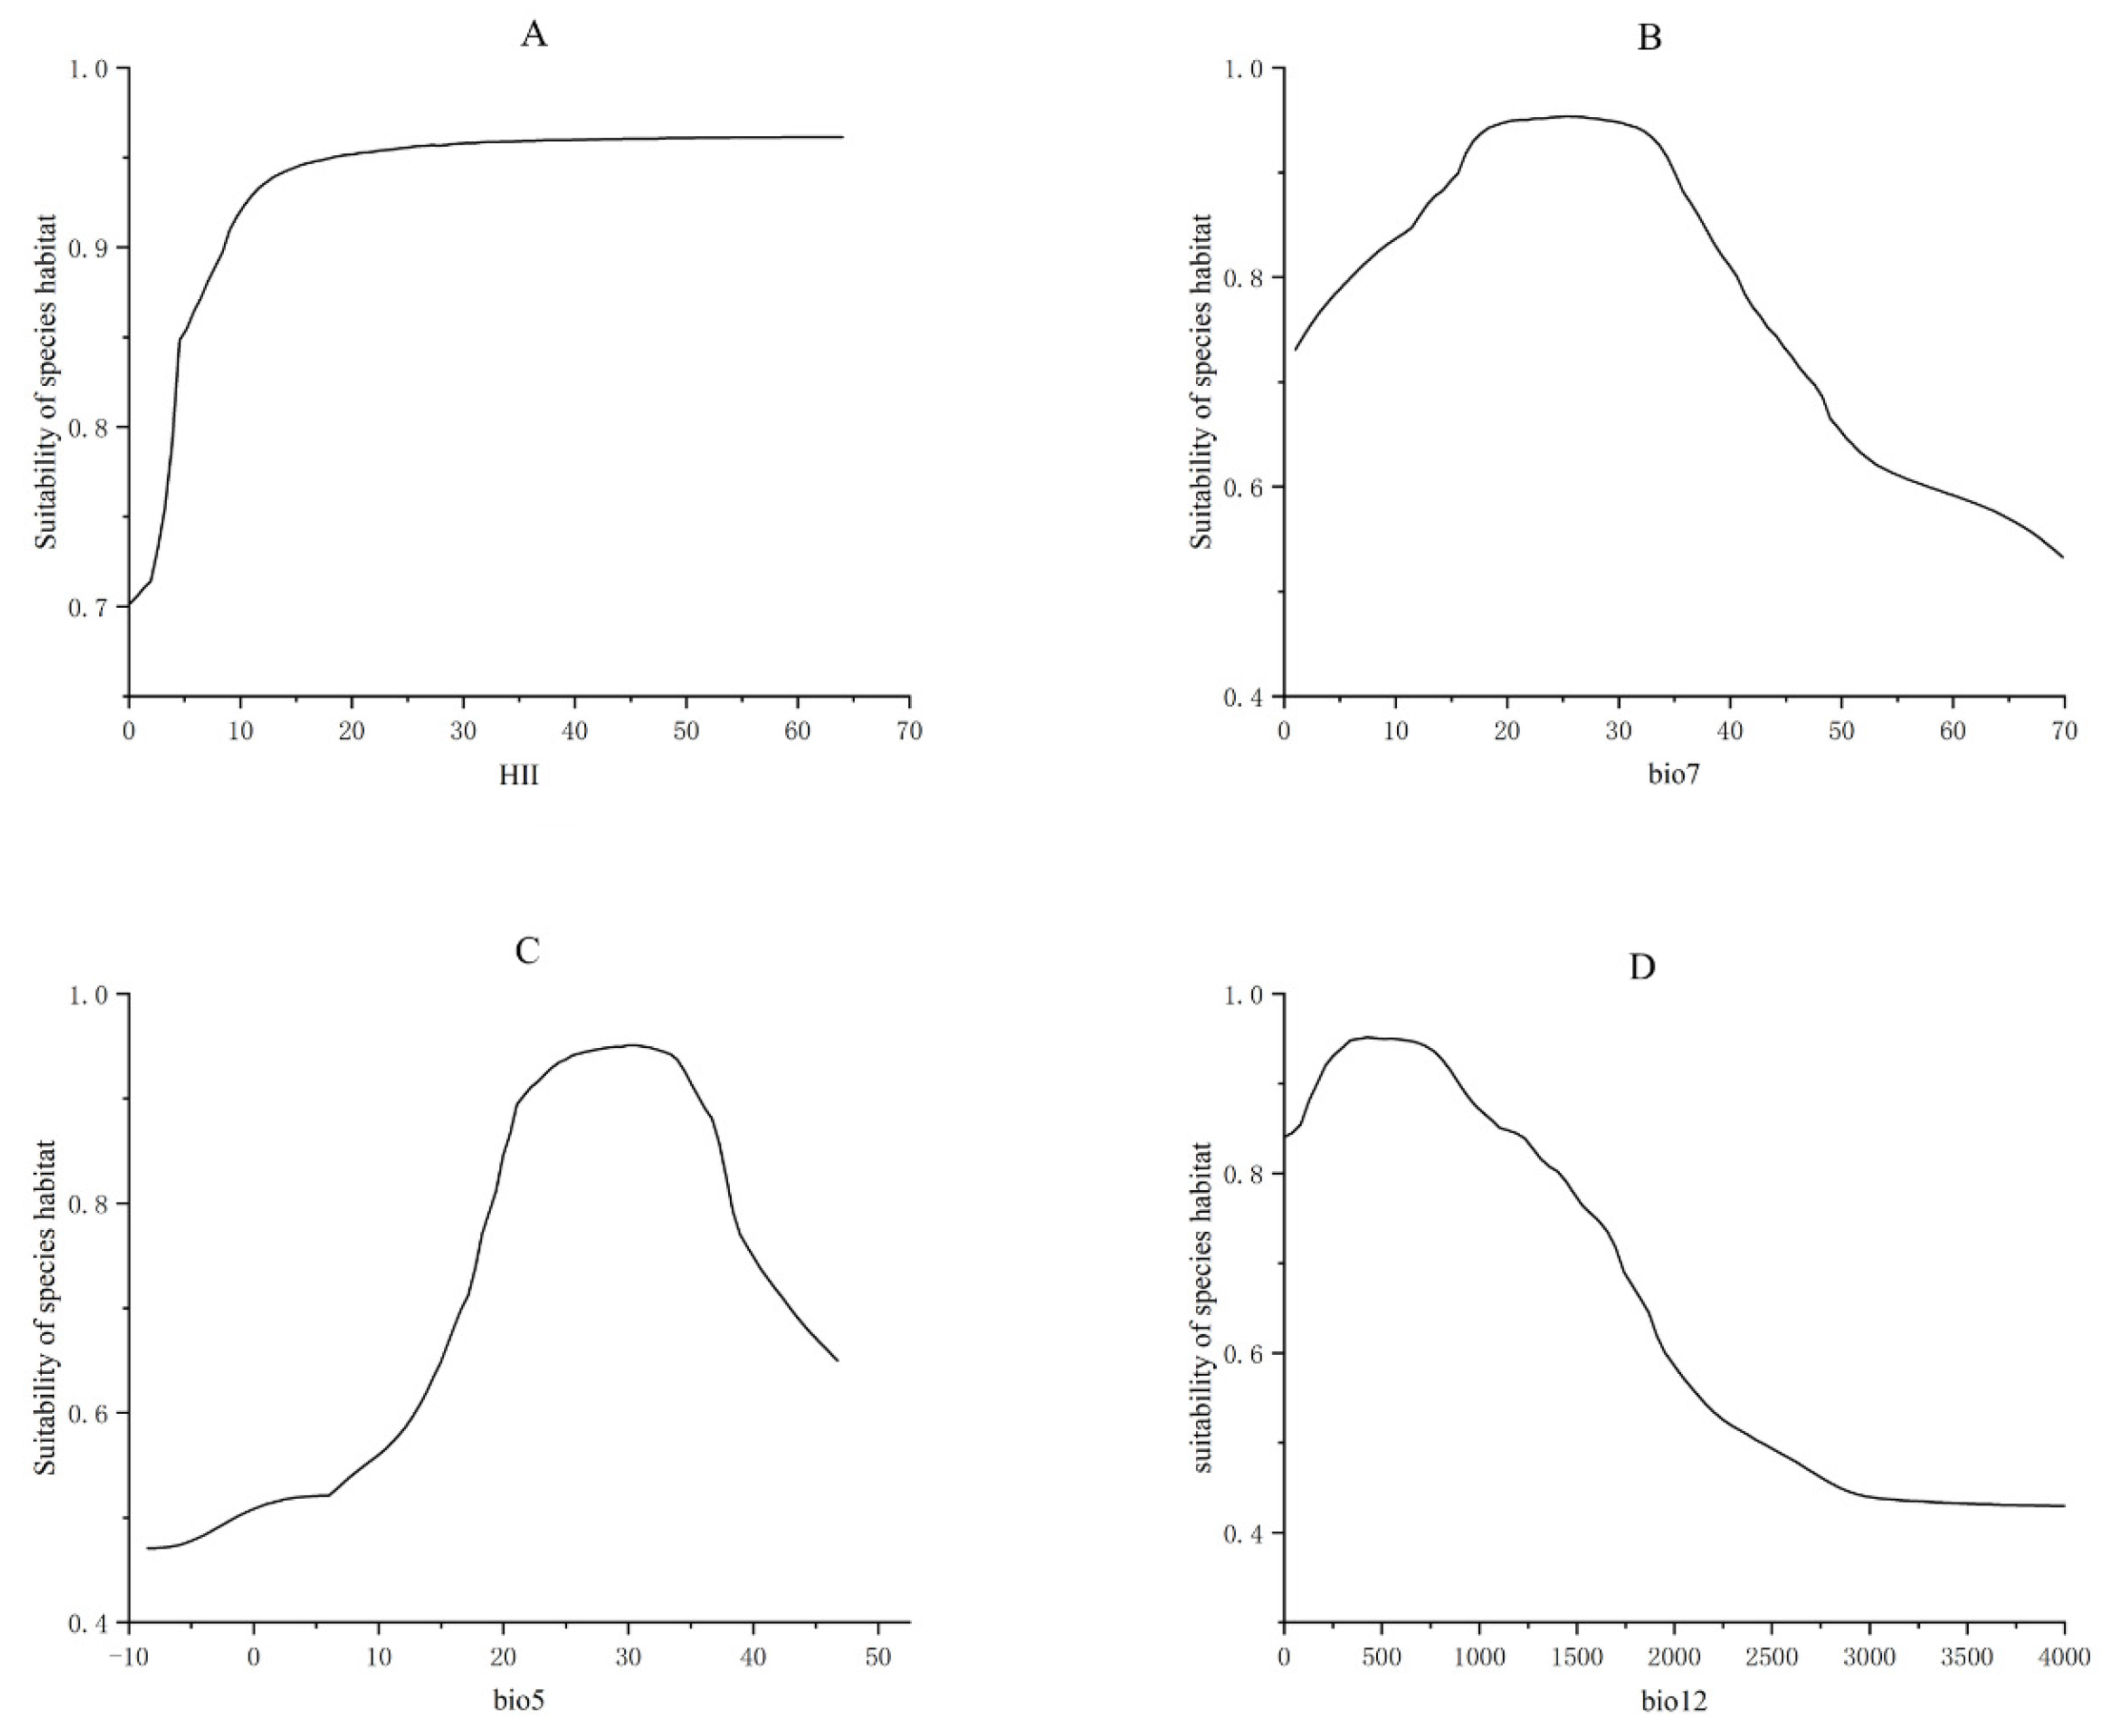
Xanthium spinosum (X. spinosum) is a highly invasive weed native to South America and distributed in 17 provinces (municipalities) of China. It has severe negative influences on ecosystems, agriculture, and husbandry. However, few studies have reported on the impact of human activity and climate change on the future distribution and centroid shift of X. spinosum. This study aimed to investigate the potential geological distribution of X. spinosum in China, as well as the distribution pattern, centroid shift, and key environmental factors influencing its distribution, under four future climate scenarios (SSP1-26, SSP2-45, SSP3-70, and SSP5-85) based on the biomod2 integrated model. The results indicated that the suitable habitats for X. spinosum would expand in the future, mainly in Inner Mongolia, Northeast China, and the plateau regions (e.g., Xinjiang and Xizang). Under future climate scenarios, the centroid would shift toward the northwest or northeast part of China, with the SSP2-45-2050s scenario showing the maximum shift distance (161.990 km). Additionally, the key environmental variables influencing the distribution of X. spinosum, including human impact index, bio5, bio7, and bio12, were determined, revealing that most of them were related to human activities, temperature, and precipitation. This study enhanced the understanding of the influence of human activity and climate change on the geographic range of X. spinosum. It provided references for early warning and management in the control of X. spinosum.

Keywords: 
;  ;  ;  ;  

1. Introduction

Biological invasion refers to the process by which species that originally do not belong to a certain ecological or geographic region are spread to this new region through different channels and colonize, establish, expand and spread in the new habitat, while bringing certain negative impacts on the economy and ecology of the place of introduction [1], has attracted attention globally because it threatens biodiversity, ecosystem functions, and services and significantly impacts the environment and economy of invaded regions [2]. When an alien species arrives in a new region, it is subjected to heterogeneous environmental conditions. Its population grows and expands rapidly in an optimized habitat but slowly under adverse climatic conditions; however, it can rapidly expand when the climatic conditions become favorable. Therefore, the successful invasion of alien species is closely related to the local climate environment and human activities. The global average surface temperature has increased over the past 100 years by approximately 0.6°C [3]. Climate change, by raising temperatures, altering precipitation patterns, and increasing the frequency of extreme weather events, has forced invasive species to undergo adaptive evolution. In addition to climate change, human activities such as global trade, transportation, and agricultural practices have introduced many species into non-native regions. For instance, bamboo, as an economically important plant, has been widely used for construction, food, and ornamental purposes, resulting in its introduction to numerous new environments. However, these introduced species can sometimes become invasive in their new habitats, disrupting native ecosystems [4]. Moreover, the interaction between human-induced habitat disturbances and climate change has amplified the ecological impacts of biological invasions [5]. Thus, predicting the potential distribution of invasion by alien species based on the information on human activities and future climate change is critical for the early monitoring and warning of biological invasions.
Xanthium spinosum L. [6] is native to the subtropical regions of South America [7] and later appeared as wild naturalized species in central and southern Europe, Asia, and North America [8]. In 1932, it was first discovered in Dancheng County, Henan Province [9]. Recent studies have demonstrated that X. spinosum L. is distributed in 17 provinces in China, including Beijing, Inner Mongolia, Hebei, Henan, and Anhui [10,11,12]. It has a long flowering phase, strong reproductive capacity with high seed production, and considerable cold tolerance [13,14]. Its involucres have hooked spines, facilitating its spread through vectors such as cattle, sheep, and goods and reducing the value of livestock hairs and hides [15]. X. spinosum can exert allelopathic effects on native plants [16,17] and negative impacts on various crops such as beet (Beta vulgaris), soybean (Glycine max), cotton (Gossypium), sunflower (Helianthus annuus), wheat (Triticum aestivum), and maize (Zea mays) [18]. Once it successfully invades and establishes populations, it can severely affect the species diversity, agriculture, and animal husbandry of the invaded region.
Previous studies on X. spinosum focused on its bio-ecological characteristics [14,19], invasion mechanisms, and diffusion modes [17,20,21]. However, these studies rarely predicted the distribution of suitable habitats for X. spinosum under climate change based on the species distribution model (SDM). Thus, clarifying the potential geological distribution of X. spinosum and its response to climate change is of great significance to its monitoring, early warning, and control.
The SDM can be used to associate species distribution with environmental information, enabling the analysis of suitable distribution ranges and potential invasion risk regions [22,23]. Since its inception, SDM has been widely used to predict species distribution across terrestrial, riverine, and marine domains [22,24,25,26]. Commonly used single models in this field include the regression-based generalized linear model (GLM) [27], the machine learning–based random forest (RF) model [28], and the maximum entropy [29] (MAXENT) model are commonly used. The selection of different models with varying strengths and weaknesses may lead to variations in prediction results for the same species data, negatively affecting policy decision-making. Therefore, an “ensemble forecasting” was proposed, wherein multiple models were constructed using different modeling methods and then integrated for prediction [30,31].
Biomod2, developed in the R language environment, is a predictive platform integrating multiple species distribution models [32,33]. Recently, suitable habitats for invasive alien plants based on an integrated model have gained the attention of researchers. Recent studies on the potential geological distribution of more than 10 invasive alien plants, including Solidago canadensis, Avena fatua, and Centaurea solstitialis, showed that the ensemble model performed excellently, whose mean true skill statistics (TSS) and the area under the curve (AUC) both were greater than 0.95 [34,35]. The results demonstrated the reliability of integrated models. Meanwhile, whether some environmental factors are considered during prediction significantly affects the results, mainly reflected in the ecological interpretation of species distribution. For instance, Xu [36] investigated the key environmental variables influencing Aconitum leucostomum and found that excluding environmental factors affecting species distributions during mode building caused deviations in prediction results. In this study, the impacts of climate, terrain, soil, and human activities on the distribution of X. spinosum L. were comprehensively considered, and an ensemble model was used based on 5602 distribution data and 16 selected environmental factors. This study aimed to (1) predict and assess the potential geological distribution of X. spinosum under future climate scenarios, (2) determine the spread direction of X. spinosum, and (3) identify the dominant environmental factors affecting the distribution of X. spinosum. The results of this study provide scientific references for the monitoring, early warning, and control of X. spinosum in China.

2. Results

2.1. Evaluation of Model Accuracy

The evaluated performances of individual models are presented in Table 1. Among them, ANN, CTA, FDA, GLM, MARS, and RF demonstrated good performance and stability, each with aTSS >0.75 and AUC >0.9, indicating; SRE had the lowest TSS and AUC, indicating the worst performance. Additionally, GAM had AUC >0.8 but TSS <0.7, indicating slightly better performance than SRE. Additionally, the integrated model had a TSS of 0.826 and an AUC of 0.982, demonstrating high accuracy in predicting the potential species distribution.

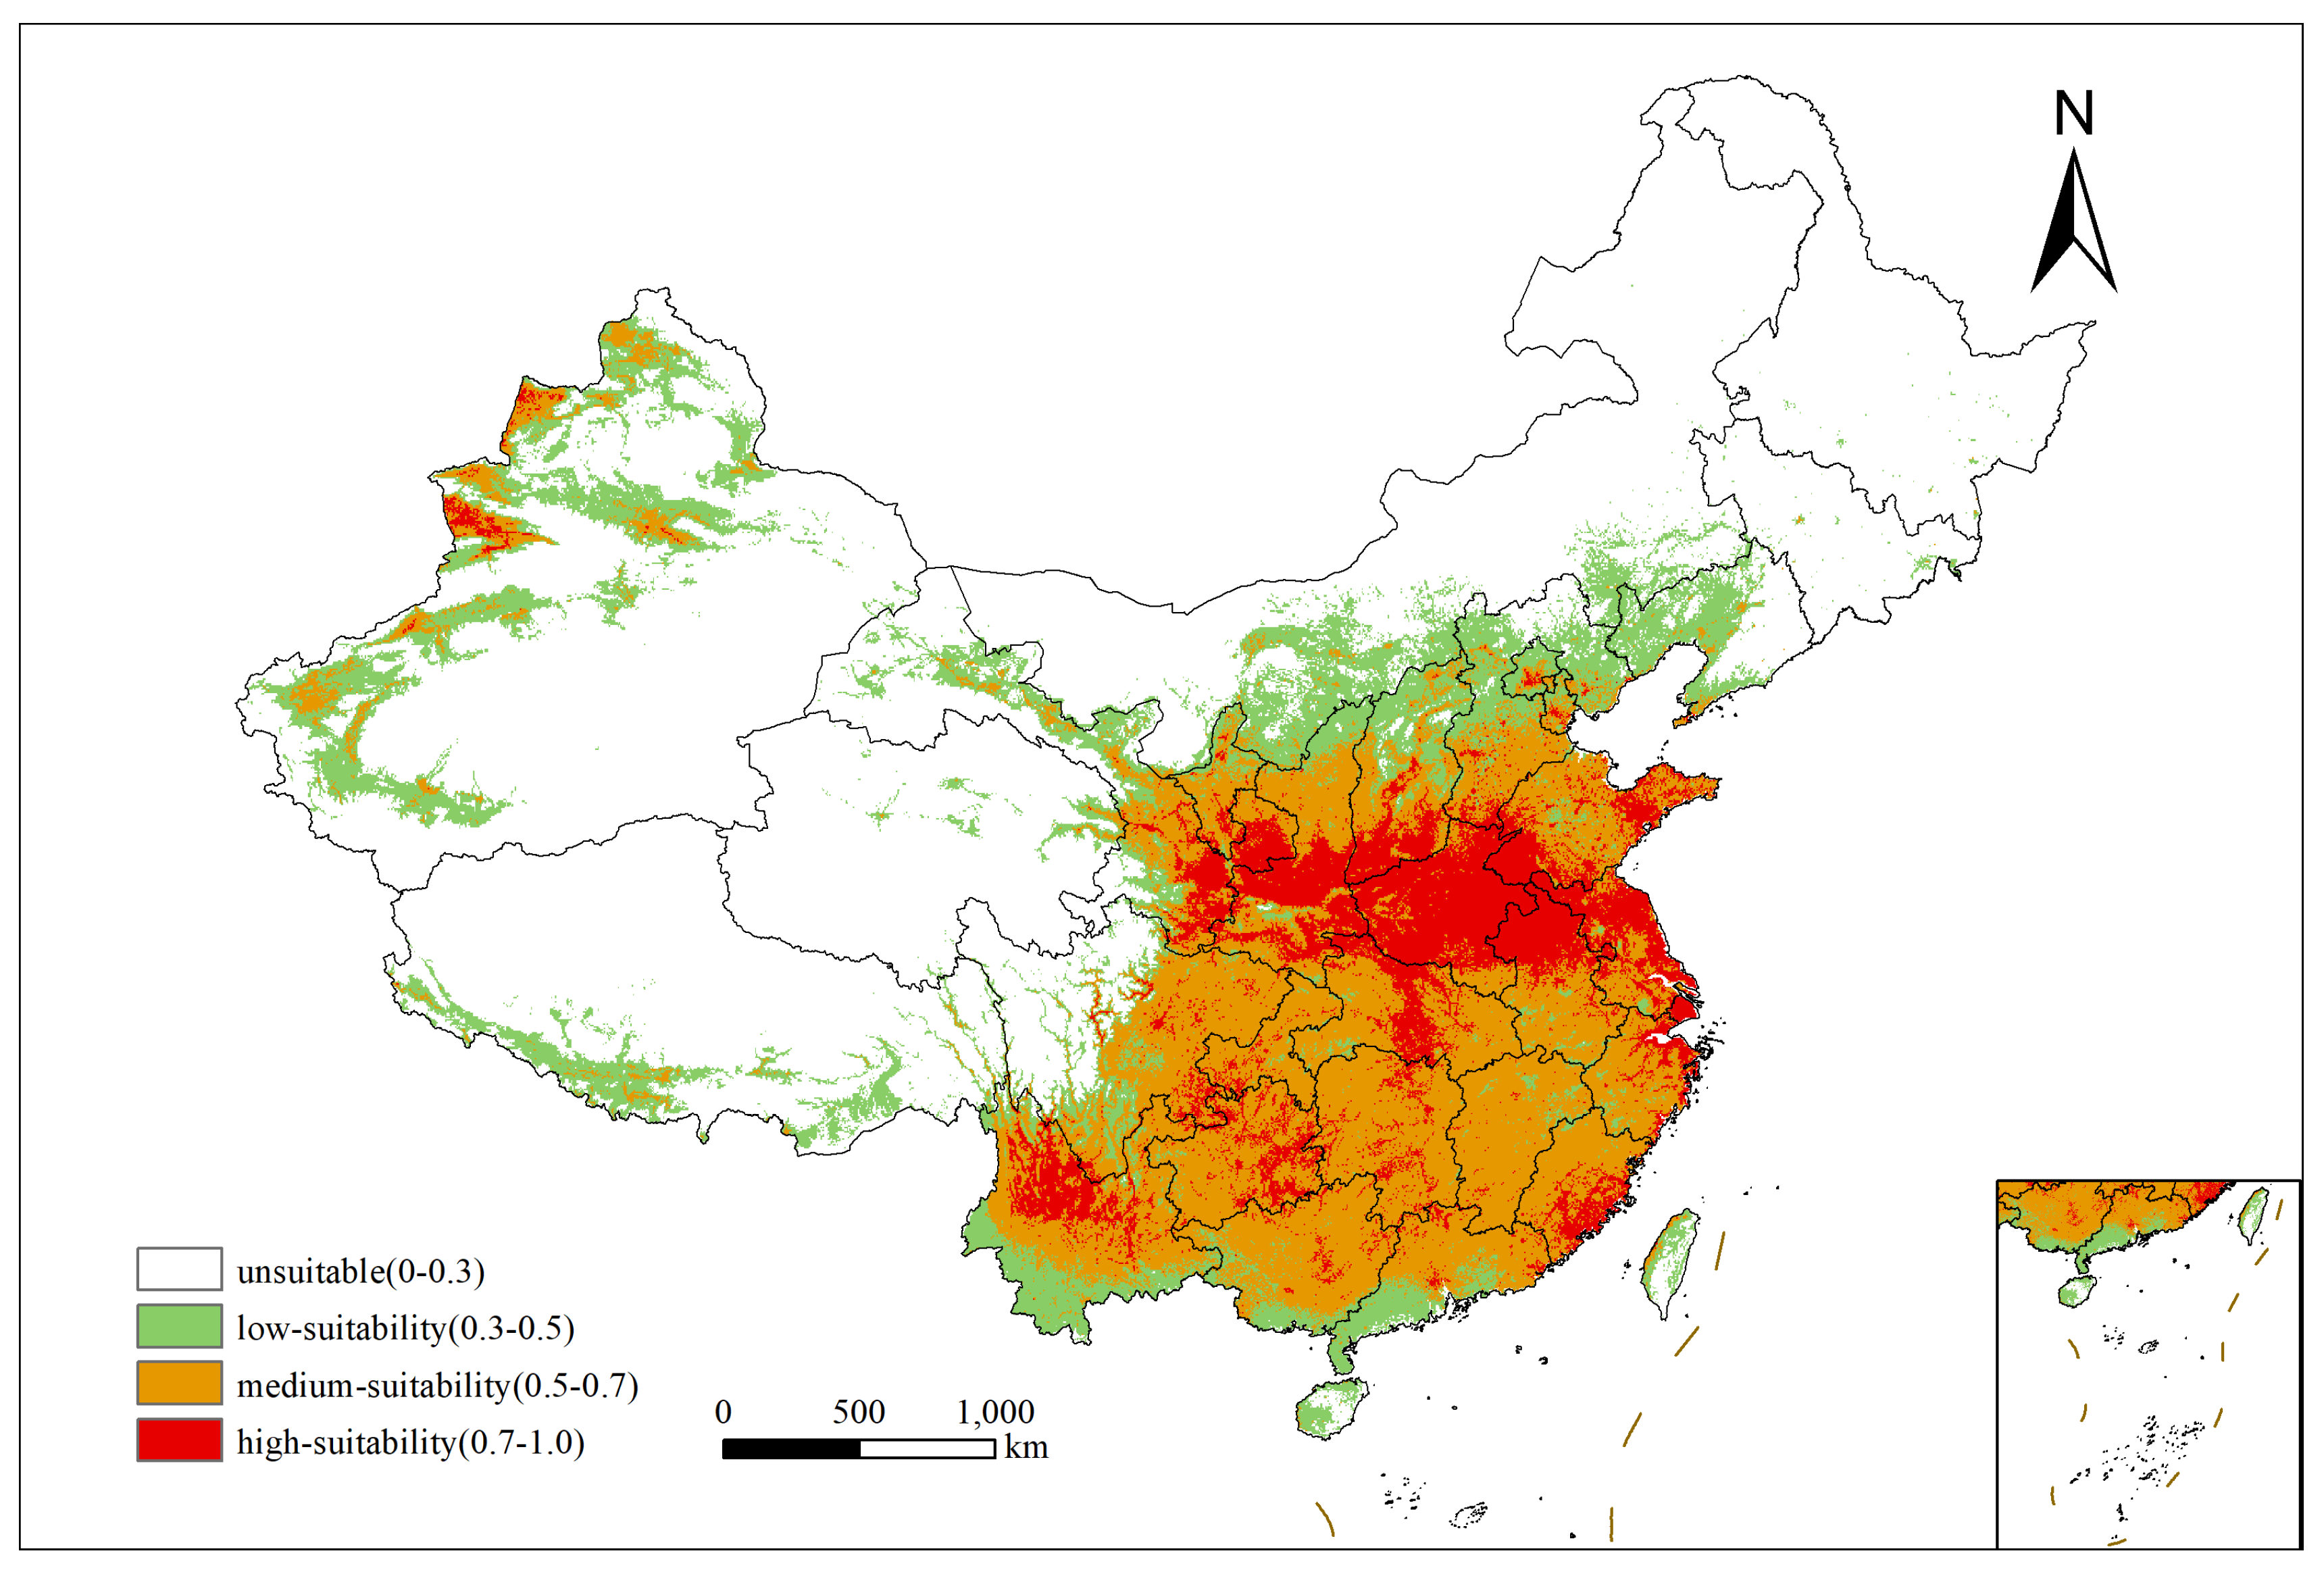
2.2. Current Distribution of the Suitable Habitats for Xanthium spinosum L. in China

The suitable habitats for X. spinosum in China are widely distributed under current climatic conditions (Figure 1). Except for Heilongjiang and Jilin provinces with sporadic distributions, all other provinces and regions exhibit varying degrees of presence of X. spinosum. The high-suitability habitats are mainly distributed in southeastern Gansu, Shaanxi, southern Shanxi, most of Henan, Shandong, Jiangsu, northern Anhui, and Hubei. Additionally, some regions with higher altitudes, such as parts of Xinjiang, northern Yunnan, and eastern Guizhou, also have high-suitability habitats. The present study calculated that the current total area of suitable habitats was 414.7396 × 10⁴ km2, where the area of medium-suitability habitats was the largest (50.31%), amounting to 208.6410 × 10⁴ km2, and areas of high- and low-suitability habitats were 70.8056 × 10⁴ and 128.2930 × 10⁴ km2, respectively.

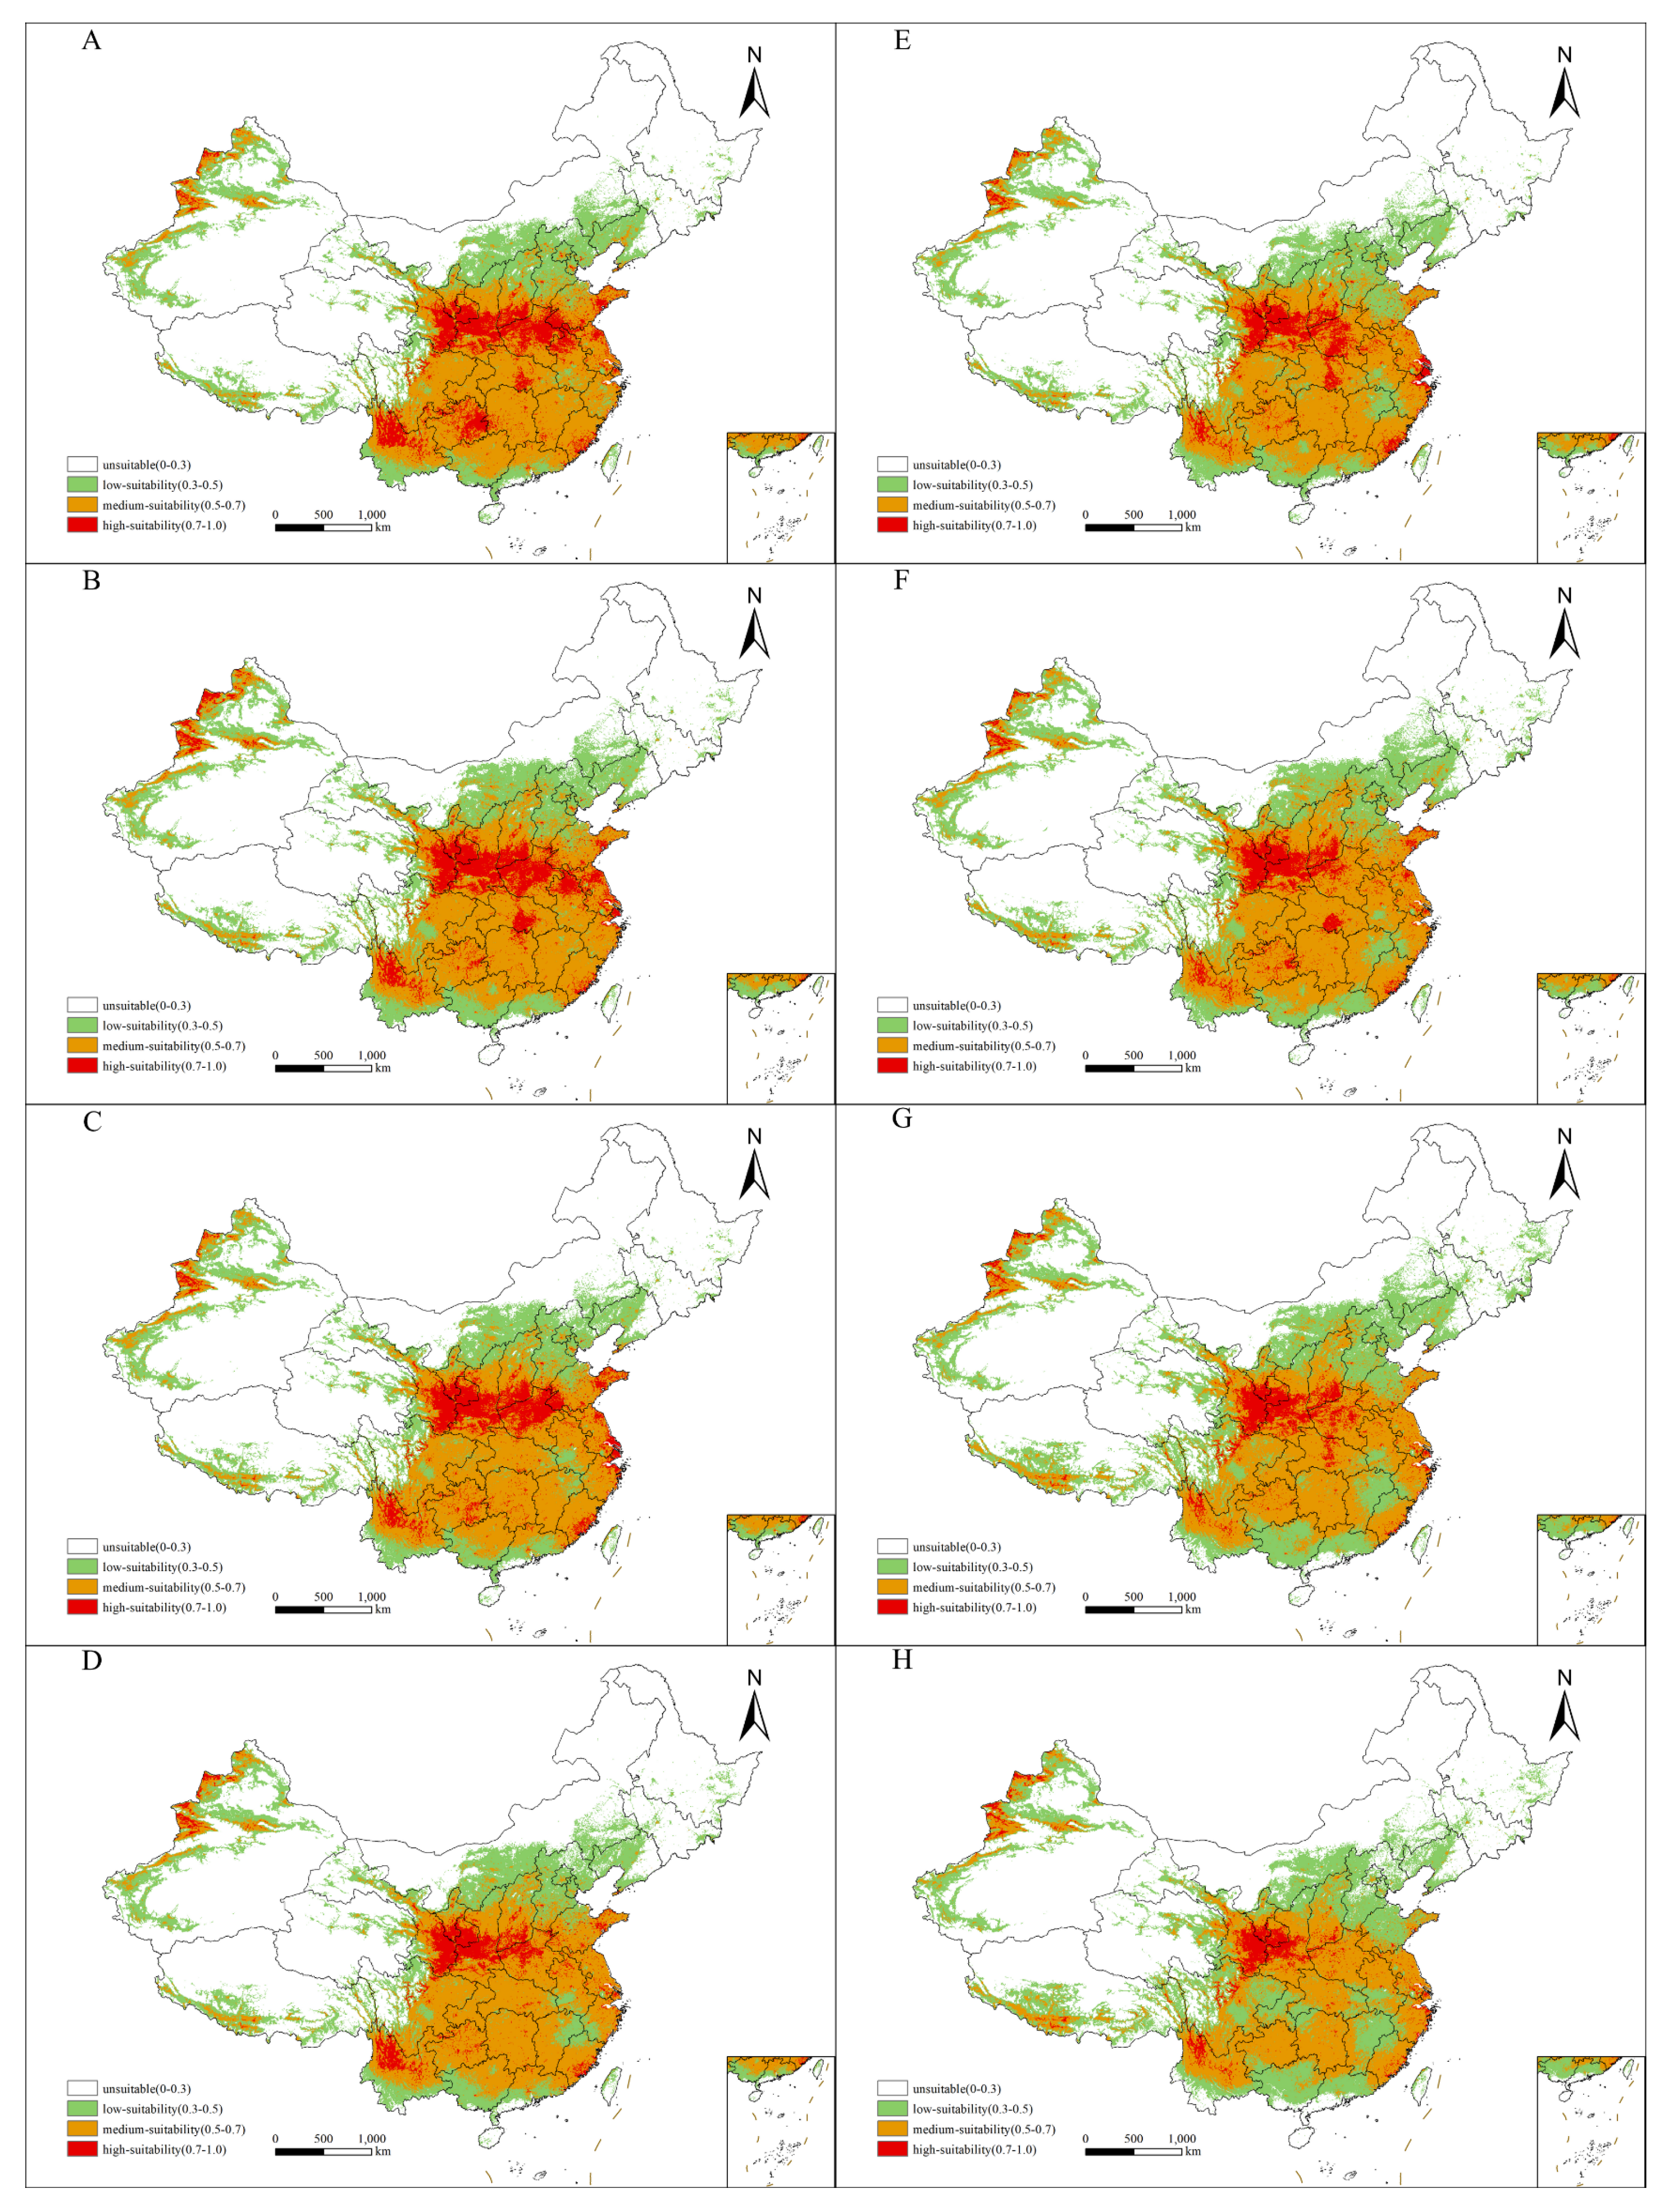
2.3. Future Distribution of Suitable Habitats for Xanthium spinosum L. in China

The area of suitable habitats for X. spinosum L. increased under four future climate scenarios (SSP1-26, SSP2-45, SSP3-70, and SSP5-85) compared with current climatic conditions (Figure 2 and Table 2). Specifically, the area increased, and the increment was maximized (67.9827 × 10⁴ km2) under SSP3-70 during the current-2070s. The area of high-suitability habitats decreased, and the decrement was maximized (51.2066 × 10⁴ km2) under SSP5-85 during the current-2070s. Meanwhile, the area of high-suitability habitats decreased under the four climate scenarios compared with current climatic conditions, except under the SSP2-45 scenario, where the area of medium-suitability habitats showed a slight increase, followed by a slight decrease over time. The area of low-suitability habitats gradually increased over time under the four future climate scenarios. Overall, the areas more suitable for X. spinosum growth shrank with climate and environmental changes. However, to avoid extinction, X. spinosum populations migrated to areas more conducive to their growth while adapting to the environment.

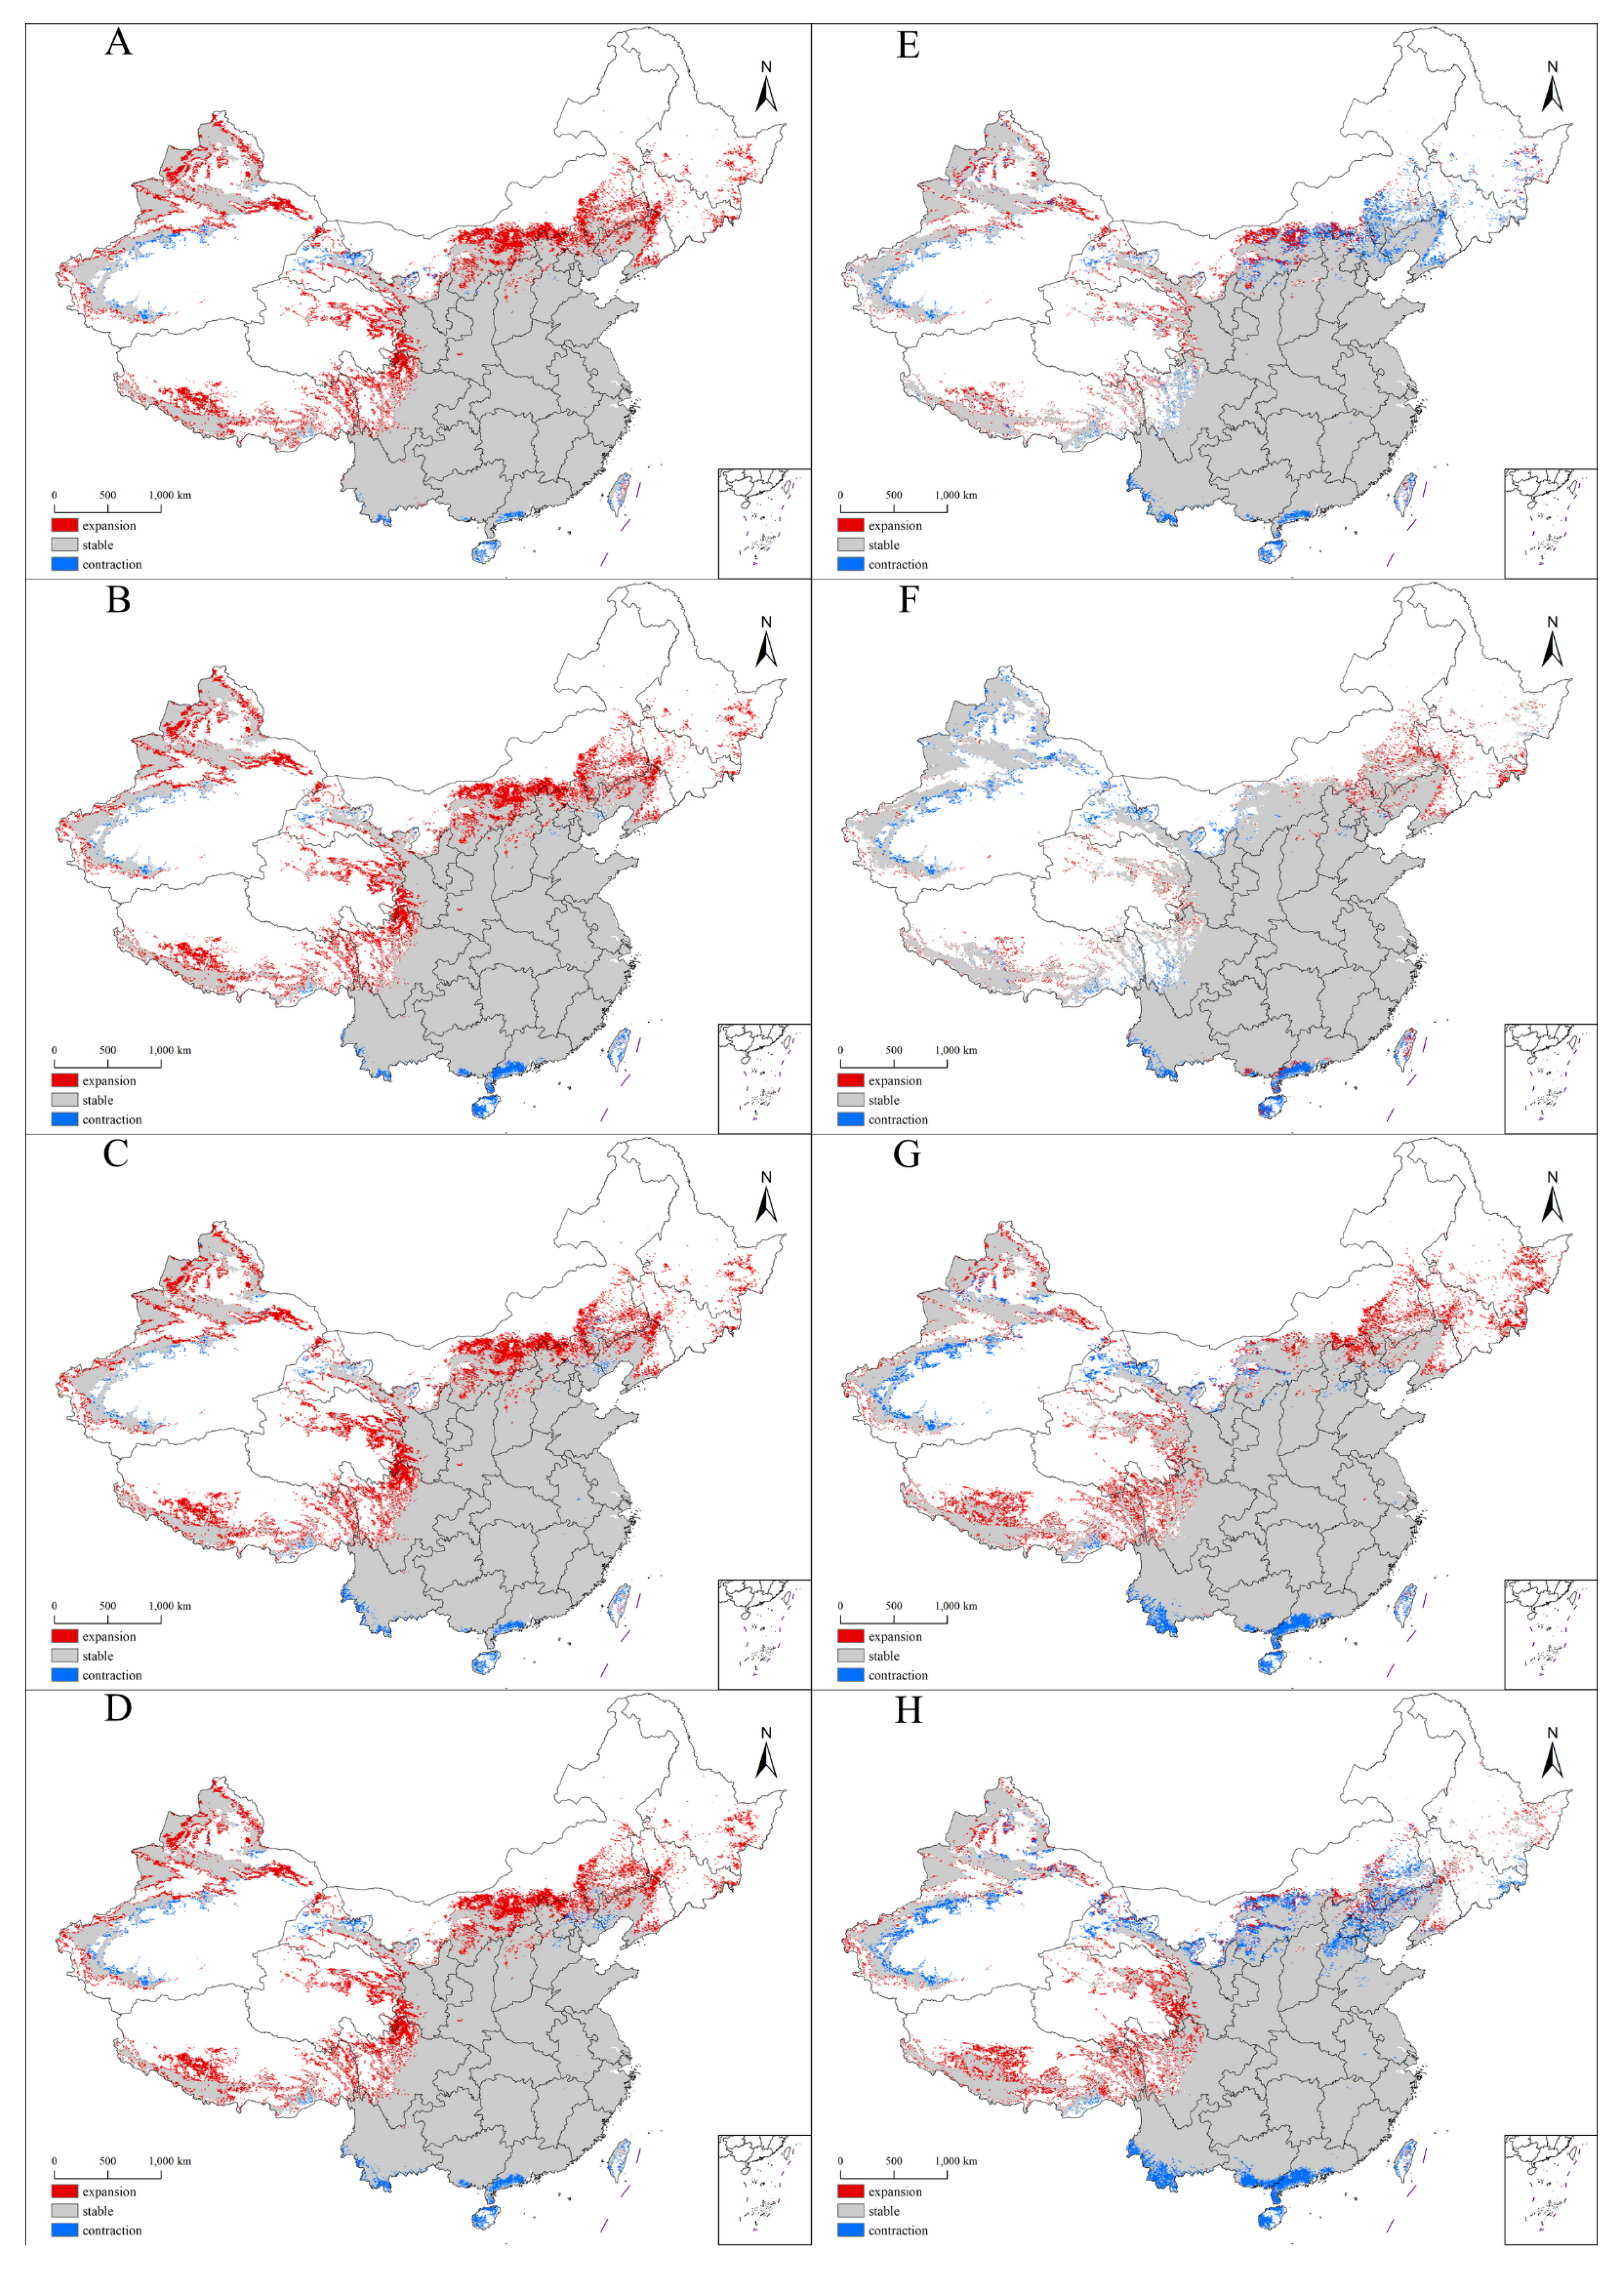
2.4. Future Distribution Patterns of the Suitable Habitats for Xanthium spinosum L. in China

The suitable habitats for X. spinosum expanded under the four future climate scenarios during current-2050s. The expansion areas were mainly concentrated in Mongolia, Northeast China, and the plateau regions (e.g., Xinjiang and Xizang), whereas the contraction areas were concentrated in the southeast coastal area of China (Table 3 and Figure 3). During the 2050s–2070s, the suitable habitats for X. spinosum exhibited varying trends under different climate scenarios. Under SSP1-26, the suitable habitats in the previously expanding areas of Northeast China and Inner Mongolia began to contract, with contraction outpacing expansion. Under SSP2-45, these areas continued to expand, whereas the suitable habitats in Xinjiang and Gansu began to contract. Under SSP3-70, X. spinosum continuously expanded toward plateau regions including Northeast China, Inner Mongolia, and Qinghai, Sichuan, and Xizang, whereas the suitable habitats in Guangxi, Guangdong, and Yunnan contracted. Finally, under SSP5-85, the suitable habitats in Jilin, Liaoning, Inner Mongolia, Hebei, and southeast coastal area of China contracted, whereas the expansion mainly concentrated in the plateau regions (e.g., Qinghai and Xizang).
Under the current climatic conditions, the centroid of X. spinosum is located in Hanzhong, Shaanxi (106°59′ 50.72″E, 33°10′ 52.93″N). Projections based on under future climate scenarios indicate that the centroid will shift either northwestward or northeastward (Figure 4). Under SSP1-26, the centroid of X. spinosum shifts northeastward by 96.439 km to Taibai County, Baoji City (107°41′ 28.91″E, 33°49′ 38.73″N) during the current-2050s period, then southwestward by 37.090 km to Liuba County, Hanzhong City (107°18′ 14.62″E, 33°44′ 24.13″N) during the 2050s–2070s. Under SSP2-45, itshifts by 161.990 km to Chencang District (106°51′ 8.29″E, 34° 37′ 59.59″N) during the current-2050s, then southeastward by 82.136 km to Qishan County, Baoji City (107°42′ 7.46″E, 34°23′ 52.46″N) during the 2050s–2070s. Under SSP3-70, the centroid of X. spinosum shifts northwestward by 75.088 km to Feng County, Baoji City (106°57′ 36.30″E, 33°51′ 21.37″N) during the current-2050s, then northeastward by 71.897 to Chencang District, Baoji City (107°24′ 41.52″E, 34°23′ 0.86″N) during the 2050s–2070s. Under SSP5-85, it shifts northeastward by 131.123 km to Weibin District, Baoji City (107°18′ 5.39″E, 34°19′ 59.42″N) during the current-2050s, then southwestward by 26.81 km (107°0′ 40.92″E, 34°18′ 22.99″N) during the 2050s–2070s.

2.5. Analysis of the Environmental Factors Influencing the Distribution of Xanthium spinosum L.

The results obtained using the biomod2 model, after performing importance ranking, showed that the five environmental factors with the greatest impact on the distribution of Xanthium spinosum and their importance values were HII (0.04686), temperature annual range (bio7, 0.04685), maximum temperature of the warmest month (bio5, 0.03813), annual precipitation (bio12, 0.03329), and mean temperature of the driest quarter (bio9, 0.03108). In this study, HII, bio7, bio5, and bio12 collectively accounted for 61.3% of the total importance, suggesting that HII, bio7, bio5, and bio12 were the key environmental factors influencing the distribution of X. spinosum.
According to the response curves of the key environmental factors (Figure 5), the habitat suitability for X. spinosum gradually improved with an increase in HII, and eventually stabilized at a certain level. The habitat suitability for X. spinosum showed a significant declining trend when the temperature annual range (bio7) was around 30°C, the maximum temperature of the warmest month (bio5) was approximately 35°C, and the annual precipitation (bio12) exceeded 700 mm. This suggested that, besides areas affected by human activities, X. spinosum was more suited to regions with an annual temperature below 30°C, maximum temperature in the warmest month less than 35°C, and annual precipitation between 0 and 700 mm.

3. Discussion

3.1. Assessment of Biomod2 Model Prediction Performance

The strengths and weaknesses of different modeling algorithms in species distribution modeling have been extensively discussed in the literature. However, no single model or class of models has emerged as the optimal solution capable of achieving the highest statistical accuracy across all species distribution studies [37]. While a single model may not always provide the best results in every case, the valuable information derived from individual models should still be taken into account. Ensemble models offer unique advantages in model selection methodologies, effectively mitigating issues related to ecological prediction variability inherent in various statistical approaches [38]. Furthermore, studies on species such as Panax ginseng and Magnolia officinalis have shown that ensemble modeling approaches can improve model accuracy and reduce uncertainty to a certain extent [39,40].This study was novel in using an integrated model to predict the potential geological distribution of X. spinosum in China and analyze its future distribution patterns and the key environmental variables affecting its distribution. The ensemble model (TSS: 0.826, AUC: 0.982) was compared favorably against eight individual models using the evaluation metrics TSS and AUC. As indicated, the TSS average of the model was slightly lower than its CTA (TSS: 0.8455) and RF (TSS: 0.9861); its AUC average was only slightly inferior to RF (AUC: 0.9999), However, the RF might have extreme values. Overall, the predictive accuracy of the model was superior to that of most single models, making it suitable for guiding the early monitoring and warning measures for X. spinosum in China.

3.2. Change Pattern and Shift Direction of the Suitable Habitats for Xanthium spinosum L. under Future Climate Change

Biological invasion and climate change are considered two major driving factors for global biodiversity loss and ecosystem service changes [41,42,43]. Abnormal temperatures and precipitation resulting from climate change may affect ecosystem stability, thus offering more opportunities for invasion by alien species [44]. Hamit [45] et al. used MAXENT to predict the distribution and diffusion of X. spinosum in Xinjiang. They found that the area of suitable habitats for X. spinosum gradually expanded, which was consistent with the results of the present study. However, this study predicted a broader distribution area of X. spinosum in Xinjiang during different periods, which was possibly due to the inclusion of HII besides climate, terrain, and soil factors. Human activities are quite significant for invasive alien species. Shana et al. further explained the association between human activities and the Allee effect in the emerald ash borer (Agrilus planipennis Fairmaire) populations, confirming the importance of human activities in the reproductive success of this species [46,47,48]. Another study on Poa annua L. found that the inhabited Marion Island with P. annua L. had higher genetic diversity and gene flow with congeneric plants on the island compared with the uninhabited Prince Edward Island [49]. The area of high-suitability habitats of X. spinosum continuously decreased over time under future climate scenarios compared with the current climate scenario. However, its distribution also became more dispersed and fragmented, especially under the SSP5-8.5 scenario. This might be attributed to drastic climate changes under global warming, resulting in reduced species diversity, exacerbated ecosystem fragmentation, and increased extinction risks for endangered species [50,51] (Anderson, 2013; Marzloff et al., 2018). Meanwhile, climate change creates favorable conditions for invasive alien plants to expand their range into higher latitudes [52], as demonstrated by the centroid shift direction of X. spinosum. Similar migratory trends have also been noted in species distribution studies of Luculia pinceana Hook and Phyllostachys edulis [53,54].
Additionally, the expansion areas of X. spinosum are concentrated in high-altitude regions such as Qinghai and Xinjiang. This may be because climate change alters the mountain ecosystem and intensifies invasion pressure [55]. Under the framework of niche conservatism, invasive species often retain the fundamental characteristics of their native ecological niches in new environments. This trait enables them to rapidly adapt to ecosystem shifts driven by climate change [56]. In alpine regions, the warming climate increases the availability of suitable niches, offering more opportunities for species expansion. As observed from the centroid shift center, the centroid of X. spinosum generally shifts northward, though varying degrees of reverse shifts occur under all climate scenarios except SSP3-7.0. The regions experiencing shifts are located within Baoji City, which is surrounded by mountains on three sides and is a typical fold mountain region [57]. Generally, invasive alien plants shifting from low-altitude regions to mountainous regions are restricted by low temperatures [58], and microtopography (slope and aspect) can provide footholds or shelters for non-native species under above-ideal climatic conditions [59]. However, the impact of geographical barriers cannot be entirely eliminated, which still restricts the shift and distribution of X. spinosum, thus explaining the backward shift of the centroid.

3.3. Human Activities and Climatic Factors Influencing the Distribution of Xanthium spinosum L.

Among various environmental factors, HII, bio7 (temperature annual range), bio5 (maximum temperature of the warmest month), and bio12 (annual precipitation) were the key environmental factors influencing the distribution of X. spinosum. The significant role of temperature in influencing species distribution was evident [60]. However, species invasion is a complex process that involves not only environmental factors such as temperature but also other key drivers. Among these, propagule pressure and introduction pathways play particularly important roles in determining the success of invasion [61]. High propagule pressure, characterized by the input of a large quantity of seeds or reproductive materials, can significantly increase the probability of species establishment in new regions. For some invasive species, a single introduction with sufficient quantity can establish a self-sustaining population [62]. Moreover, diverse introduction pathways can further impact the dispersal distances of species. These pathways include natural dispersal (e.g., wind, water) and human activities (e.g., agricultural transport, traffic). It is noteworthy that human activities mediated transportation, migration, and commercial activities promote introductions into new remote areas and accelerating the spatial expansion of species after their introduction into new areas [63,64],therefore, the prickly seeds of X. spinosum is easy to carry around by human activities and spread far away. In addition, according to the response curves of bio5 and bio7, especially bio5, the habitat suitability of the species displayed an inverted U-shape, and the response ranged from –10°C to 40°C, suggesting that X. spinosum could tolerate a wide temperature range, which was consistent with its biological characteristics of good cold resistance and heat tolerance [13]. Precipitation can control the aboveground biomass of plants by affecting nitrogen deposition levels and is an essential factor influencing plant community growth and composition [65]. Soil and terrain factors were the least important among the environmental factors selected in this study. In contrast, climatic factors such as temperature and precipitation contributed to the distribution patterns of X. spinosum under different climate scenarios [36]. Human activities further promote the migration and diffusion of X. spinosum.
X.spinosum exhibits strong adaptability and reproductive capacity, posing significant challenges for management once it successfully invades a new area. The plant’s tall stature and thorny characteristics hinder mechanical removal, while manual removal, although thorough, is time-consuming, labor-intensive, and costly [12]. Moreover, the lack of targeted chemical control agents for cocklebur further complicates management efforts [66].Therefore, it is critical to prioritize monitoring and early-warning systems based on habitat suitability predictions when addressing X.spinosum invasions. Habitat suitability modeling can identify high-risk regions, such as Inner Mongolia, Northeast China, and the Qinghai-Tibet Plateau. By establishing monitoring networks in these areas in advance, the goals of “early detection and early management” can be achieved, effectively mitigating the ecological and economic risks posed by X.spinosum invasion.Rather than incurring substantial post-invasion management costs, it is more effective to prevent invasions at the source through ecological risk assessments and control of dispersal pathways. Against the backdrop of global climate warming, the potential distribution range of X.spinosum may further expand, underscoring the need for strengthened monitoring and preventive measures to mitigate risks proactively.

4. Materials and Methods

4.1. Data Collection and Processing for the Distribution of Xanthium spinosum L.

15,321 records,10 records and 422 records about geological distributions were retrieved from the Global Biodiversity Information Facility (GBIF, http://www.gbif.org/), the Chinese Virtual Herbarium (http://www.cvh.ac.cn), and the Southwest Environmental Information Network (http://swbiodiversity.org). Combined with 196 field survey records in China, 15,949 records of the global distribution of X. spinosum were obtained(Supplementary Table S1). The data from GBIF were processed using R 4.3.3 CoordinateCleaner [67]. Also, in order to avoid spatial autocorrelation leading to model overfitting using the spThin package to retain only one distribution site within a 10 km range, and the obtained distribution sites were filtered. Finally, 5602 records were obtained for model construction(Supplementary Table S1).

4.2. Preprocessing of Environmental Data

The environmental variables include climatic factors, terrain factors, soil factors, and the human impact index (HII) (Table 4). In this study, current and future climatic factors, as well as terrain factors, were retrieved from the global climate database (http://www.worldclim.org/). The future climate data (2050s and 2070s) adopted four shared socioeconomic pathways (SSPs) (SSP1-26, SSP2-45, SSP3-70, and SSP5-85) under the Beijing Climate Center Climate System Model version 2 (BCC-CSM2-MR) for model prediction.
Soil factors (0–20 cm) were sourced from the Food and Agriculture Organization of the United Nations (https://www.fao.org/soils-portal/data-hub/soil-maps-and-databases/harmonized-world-soil-database-v20/en/). HII data were sourced from the Socioeconomic Data and Applications Center (SEDAC,https://sedac.ciesin.columbia.edu/data/set/wildareas-v2-human-influence-index-geographic/) of National Aeronautics and Space Administration(NASA).
A total of 34 environmental and climatic factors were obtained, and Arcgis 10.2 was used to standardize the resolution to 2.5 arcmin. Then, the obtained 34 environmental and climatic factors, along with the filtered distribution sites, were imported into R software. The Raster package was used to extract the corresponding climate data from these distribution sites. Pearson correlation coefficients of the variables were calculated to avoid excessively strong correlations among the environmental variables [68]. Meanwhile, considering the contribution of each variable, 16 environmental variables(Table 4) with |r| < 0.7 were retained for subsequent modeling [69].

4.3. Model Prediction and Evaluation for the Suitable Habitats for Xanthium spinosum L.

The SDM integration platform biomod2 in the R environment has been widely used for predicting species distribution [62,70,71,72]. Eight models built into biomod2 (ANN: Artificial Neural Network;CTA: Classification Tree Analysis; FDA: Flexible Discriminant Analysis; GAM: Generalized Additive Model; GLM: Generalized Linear Model; MARS: Multiple Adaptive Regression Splines; RF: Random Forest; and SRE: Surface Range Envelop or usually called BIOCLIM) were selected to model the suitable habitats for X. spinosum. First, biomod2 was used to generate three sets of pseudo-absence points, with each containing 1000 points [35,73,74]. For each single model, 75% of the data were randomly selected as the training dataset and 25% as the testing dataset; the process was repeated three times. TSS and AUC of the receiver operating characteristic (ROC) curve were used to evaluate the accuracy of the single models. TSS >0.7 and ROC >0.8 indicated good model performance [75,76]. The generated model results (e.g., RF, ANN, GLM, FDA, and MARS) used the weighted average method with TSS as the weight (EMwmByTSS) to construct an integrated model and then predict suitable habitats.

4.4. Distribution and Area of The suitable Habitats for Xanthium spinosum L.

The suitable habitat prediction results generated using the integrated model under current and different future climate scenarios were imported into Arcgis 10.2 for normalization. A map of China was used for clipping. The natural breaks method was used to classify the species suitability levels into four categories: unsuitable habitats (0–0.3), low-suitability habitats (0.3–0.5), medium-suitability habitats (0.5–0.7), and high-suitability habitats (0.7–1.0) (Supplementary Table S2). Additionally, Raster reclassification was used to calculate the national territory area corresponding to each category.

4.5. Changes in the Spatial Patterns of the Suitable Habitats for Xanthium spinosum L.

Areas with species presence probability >0.3 were classified as potential distribution areas. SDMtoolbox2.5 was used to classify the shift patterns of the suitable habitats for X. spinosum into expansion, unchanged, and contraction. The centroid position of X. spinosum in the future (2050s and 2070s) under different climate backgrounds was calculated, and the corresponding centroid shift trajectories were plotted.

5. Conclusions

This study constructed an integrated model based on eight single models in biomod2. The integrated model exhibited good prediction performance. According to the prediction results, the potential geological distribution area of X. spinosum in China under current climatic conditions reached up to 414.7396 × 10⁴ km, which was mainly concentrated in the south of the Yellow River and east of Sichuan and Yunnan. Compared with the current period, the total area of suitable habitats for X. spinosum will increase in the future. From the perspective of spatial pattern change, the suitable habitat for X. spinosum is expected to expand in the future, primarily concentrating in Inner Mongolia, the three northeastern provinces of China, and some high-altitude regions such as Xinjiang and Tibet. Regarding centroid migration, the suitable habitat for X. spinosum is progressively shifting toward higher latitudes. Among these shifts, the SSP2-45-2050s scenario shows the furthest migration distance at 161.990 km. Temperature (bio5, bio7), precipitation (bio12), and human activities (HII) were identified as the dominant environmental factors affecting X. spinosum. This study offers valuable insights for monitoring, early warning, and scientific prevention and control of X. spinosum.

Supplementary Materials

The following supporting information can be downloaded at the website of this paper posted on Preprints.org.

Author Contributions

Conceptualisation: all authors. Methodology and investigation: all authors. Software, validation, formal analysis, and data curation: Yabin Liu, Yuyu Li, Lizhu Guo, Yu Ji, Yihao Chen. Writing—original draft preparation: Yabin Liu. Writing—review and editing: Lifen Hao, Kejian Lin. Visualization and supervision: Yabin Liu, Yu Ji. Yuyu Li, Lizhu Guo, Yihao Chen provided scientific support such as data processing, ecological niche modeling. All authors contributed to the article and approved the submitted version.

Funding

This work was supported by the Earmarked Fund for National Key Research and Development Program of China(2021YFD1400300),China Forage and Grass Research System CARS (CARS-34), Inner Mongolia Natural Science Foundation(2022LHQN03002) and China Postdoctoral Science Foundation under Grant Number (2024MD753998).

Data Availability Statement

Not applicable.

Conflicts of Interest

The authors declare no conflicts of interest.

References

  1. Cheng, X.; Xu, R. Overview of exotic animal invasions in China. Bulletin of Biology 2007, 1–4, 64. [Google Scholar] [CrossRef]
  2. Jones, B.A.; McDermott, S.M. Health Impacts of Invasive Species through an Altered Natural Environment: Assessing Air Pollution Sinks as a Causal Pathway. Environmental and Resource Economics 2018, 71, 23–43. [Google Scholar] [CrossRef]
  3. Alley, R.B.; Berntsen, T.; Bindoff, N.L.; Chidthaisong, A.; Friedlingstein, P.; Gregory, J.M.; Hegerl, G.C.; Heimann, M.; Hewitson, B.; Hoskins, B.J. Summary for Policymakers. In Climate Change 2007: The Physical Science Basis. Contribution of Working Group I to the Fourth Assessment Report of the Intergovernmental Panel on Climate Change; Solomon, S., Qin, D., Manning, M., Chen, Z., Marquis, M., Averyt, K.B., Tignor, M., Miller, H.L., Eds.; 2007. [Google Scholar]
  4. Canavan, S.; Richardson, D.M.; Visser, V.; Le Roux, J.J.; Vorontsova, M.S.; Wilson, J.R. The Global Distribution of Bamboos: Assessing Correlates of Introduction and Invasion. AoB Plants 2017, 9, plw078. [Google Scholar] [CrossRef]
  5. Clements, D.R.; Jones, V.L. Rapid Evolution of Invasive Weeds Under Climate Change: Present Evidence and Future Research Needs. Front. Agron. 2021, 3. [Google Scholar] [CrossRef]
  6. Jarvis, C. Order Out of Chaos. Linnaean Plant Types and Their Types; Linnaean Society of London in association with the Natural History Museum; 2017. [Google Scholar]
  7. Löve, D.; Dansereau, P. Biosystematic Studies on Xanthium: Taxonomic Appraisal and Ecological Status. Canadian Journal of Botany 1959, 37, 173–208. [Google Scholar] [CrossRef]
  8. Holm, L.G.; Plucknett, D.L.; Pancho, J.V.; Herberger, J.P. The World’s Worst Weeds. Distribution and Biology; 1977; ISBN 0-8248-0295-0. [Google Scholar]
  9. Chen, Y.; Chen, S. A new synonym of Xanthium sibiricum Patrin ex Widder. Journal of Systematics and Evolution 2004, 42, 191. [Google Scholar]
  10. Zhao, L.; Zang, C.; Yang, J. Distribution of a Invasive Species-Xanthium spinosum L. in Inner Mongolia and Ning Xia. Journal of Inner Mongolia University (Natural Science Edition) 2006, 308–310. [Google Scholar]
  11. Du, Z.; Xu, W.; Yan, P.; Wang, S.; Guo, Y. Three Newly Recorded Alien Invasive Plants of Xanthium in Xinjiang. Xinjiang Agricultural Sciences 2012, 49, 879–886. [Google Scholar]
  12. Song, X.; He, J. Status and Prospect of Research on Alien Invasive Plant Xanthium spinosum L. Journal of Weed Science 2023, 41, 1–7. [Google Scholar] [CrossRef]
  13. Li, J.; Ma, M. Seed overwinter performance of two invasive plants: Xanthium italicum Moretti and X. spinosum Linnaeus in Xinjiang. Acta Ecologica Sinica 2017, 37, 7181–7186. [Google Scholar] [CrossRef]
  14. Gu, W.; Ma, M. Study on reproductive biology characteristics of invasive plant Xanthium spinosum L. Journal of Shihezi University(Natural Science) 2019, 37, 332–338. [Google Scholar] [CrossRef]
  15. Liang, Q.; Liu, Z.; Lu, P.; Chen, W. Distribution and Growth Characteristics of Xanthium spinosum in Yili River Valley of Xinjiang. Journal of Weed Science 2017, 35, 25–29. [Google Scholar] [CrossRef]
  16. Dong, F.; Leng, J.; Liu, Y.; Yu, W.; Zhao, Y. Allelopathic Effects of Aqueous Extracts from Xanthium Spinosum on Seed Germination and Seedling Growth of Lactuca Sativa Var. Longifolia. Acta Prataculturae Sinica 2017, 26, 146–160. [Google Scholar]
  17. Yuan, Z.N.; Liu, Y.; Shao, H.; Zhao, Y.; Hu, Y. Allelopathy of Each Part of Invasive Plant Xanthium spinosum L. Journal of Henan Agricultural Sciences 2017, 46, 73–77. [Google Scholar] [CrossRef]
  18. Xanthium Spinosum (Bathurst Burr). CABI Compendium 2022.
  19. Lang, Q. Population Distribution and Ecological Characteristics of Xanthium spinosum L. in Yili Region. Rural Practical Science & Technology 2020, 78–79. [Google Scholar]
  20. Tao, Y.; Zhao, Y.; Hu, Y.; Shang, T.; Zhang, Z.; Lang, Q.; Liu, Y. Effects of simulated nitrogen deposition on the growth of Xanthium spinosum. Chinese Journal of Ecology 2020, 39, 3971–3978. [Google Scholar] [CrossRef]
  21. Xiao, Y.; He, J.; Aishan, T.; Sui, X.; Zhou, Y.; Yimingniyazi, A. Effects of Different Degrees of Xanthium Spinosum Invasion on the Invasibility of Plant Communities in the Yili Grassland of Northwest China. Biology 2023, 13, 14. [Google Scholar] [CrossRef]
  22. Elith, J.; Leathwick, J.R. Species Distribution Models: Ecological Explanation and Prediction across Space and Time. Annual review of ecology, evolution, and systematics 2009, 40, 677–697. [Google Scholar] [CrossRef]
  23. Beery, S.; Cole, E.; Parker, J.; Perona, P.; Winner, K. Species Distribution Modeling for Machine Learning Practitioners: A Review. In Proceedings of the Proceedings of the 4th ACM SIGCAS Conference on Computing and Sustainable Societies; Association for Computing Machinery: Virtual Event, Australia, 2021; pp. 329–348. [Google Scholar]
  24. Brambilla, M.; Ficetola, G.F. Species Distribution Models as a Tool to Estimate Reproductive Parameters: A Case Study with a Passerine Bird Species. Journal of Animal Ecology 2012, 81, 781–787. [Google Scholar] [CrossRef] [PubMed]
  25. Moraitis, M.L.; Valavanis, V.D.; Karakassis, I. Modelling the Effects of Climate Change on the Distribution of Benthic Indicator Species in the Eastern Mediterranean Sea. Science of The Total Environment 2019, 667, 16–24. [Google Scholar] [CrossRef] [PubMed]
  26. Zhao, Z.; Xiao, N.; Shen, M.; Li, J. Comparison between Optimized MaxEnt and Random Forest Modeling in Predicting Potential Distribution: A Case Study with Quasipaa Boulengeri in China. Science of The Total Environment 2022, 842, 156867. [Google Scholar] [CrossRef]
  27. Nelder, J.A.; Wedderburn, R.W. Generalized Linear Models. Journal of the Royal Statistical Society Series A: Statistics in Society 1972, 135, 370–384. [Google Scholar] [CrossRef]
  28. Ho, T.K. Random Decision Forests. In Proceedings of the Proceedings of 3rd International Conference on Document Analysis and Recognition; IEEE, 1995; Volume 1, pp. 278–282. [Google Scholar]
  29. Bajkova, A.T. The Generalization of Maximum Entropy Method for Reconstruction of Complex Functions. Astronomical and Astrophysical Transactions 1992, 1, 313–320. [Google Scholar] [CrossRef]
  30. Segurado, P.; Araujo, M.B. An Evaluation of Methods for Modelling Species Distributions. Journal of biogeography 2004, 31, 1555–1568. [Google Scholar] [CrossRef]
  31. Araújo, M.B.; New, M. Ensemble Forecasting of Species Distributions. Trends in ecology & evolution 2007, 22, 42–47. [Google Scholar] [CrossRef]
  32. Thuiller, W. BIOMOD–Optimizing Predictions of Species Distributions and Projecting Potential Future Shifts under Global Change. Global change biology 2003, 9, 1353–1362. [Google Scholar] [CrossRef]
  33. Thuiller, W.; Lafourcade, B.; Engler, R.; Araújo, M.B. BIOMOD–a Platform for Ensemble Forecasting of Species Distributions. Ecography 2009, 32, 369–373. [Google Scholar] [CrossRef]
  34. Guan, B.; Guo, H.; Chen, S.; Li, D.; Liu, X.; Gong, X.I.; Ge, G. Shifting Ranges of Eleven Invasive Alien Plants in China in the Face of Climate Change. Ecological Informatics 2020, 55, 101024. [Google Scholar] [CrossRef]
  35. Jia, T.; Qi, Y.; Zhao, H.; Xian, X.; Li, J.; Huang, H.; Yu, W.; Liu, W. Estimation of Climate-Induced Increased Risk of Centaurea Solstitialis L. Invasion in China: An Integrated Study Based on Biomod2. Frontiers in Ecology and Evolution 2023, 11, 1113474. [Google Scholar] [CrossRef]
  36. Xu, L.; Fan, Y.; Zheng, J.; Guan, J.; Lin, J.; Wu, J.; Liu, L.; Wu, R.; Liu, Y. Impacts of Climate Change and Human Activity on the Potential Distribution of Aconitum Leucostomum in China. Science of The Total Environment 2024, 912, 168829. [Google Scholar] [CrossRef] [PubMed]
  37. Qiao, H.; Hu, J.; Huang, J. Theoretical Basis, Future Directions, and Challenges for Ecological Niche Models. Scientia Sinica(Vitae) 2013, 43, 915–927. [Google Scholar] [CrossRef]
  38. Tanaka, K.R.; Torre, M.P.; Saba, V.S.; Stock, C.A.; Chen, Y. An Ensemble High-resolution Projection of Changes in the Future Habitat of American Lobster and Sea Scallop in the Northeast US Continental Shelf. Diversity and Distributions 2020, 26, 987–1001. [Google Scholar] [CrossRef]
  39. Zhao, Z.; Wei, H.; Guo, Y.; Gu, W. Potential distribution of Panax ginseng and its predicted responses to climate change. Chinese Journal of Applied Ecology 2016, 27, 3607–3615. [Google Scholar] [CrossRef] [PubMed]
  40. Zhu, N. Modelling the Suitable Habitat Distribution of Magnolia Officinalis Using Ensemble Model. Journal of Sichuan Agricultural University 2019, 37, 481–489. [Google Scholar] [CrossRef]
  41. McGeoch, M.A.; Butchart, S.H.; Spear, D.; Marais, E.; Kleynhans, E.J.; Symes, A.; Chanson, J.; Hoffmann, M. Global Indicators of Biological Invasion: Species Numbers, Biodiversity Impact and Policy Responses. Diversity and Distributions 2010, 16, 95–108. [Google Scholar] [CrossRef]
  42. Bellard, C.; Bertelsmeier, C.; Leadley, P.; Thuiller, W.; Courchamp, F. Impacts of Climate Change on the Future of Biodiversity. Ecology letters 2012, 15, 365–377. [Google Scholar] [CrossRef] [PubMed]
  43. Díaz, S.M.; Settele, J.; Brondízio, E.; Ngo, H.; Guèze, M.; Agard, J.; Arneth, A.; Balvanera, P.; Brauman, K.; Butchart, S. The Global Assessment Report on Biodiversity and Ecosystem Services: Summary for Policy Makers. 2019. [Google Scholar]
  44. Bellard, C.; Thuiller, W.; Leroy, B.; Genovesi, P.; Bakkenes, M.; Courchamp, F. Will Climate Change Promote Future Invasions? Global change biology 2013, 19, 3740–3748. [Google Scholar] [CrossRef]
  45. Hamit, S.; Abdushalih, N.; Xu, Z.; Arman, J.; Shao, H.; Yilihar, V. Simulation of potential distribution patterns of the invasive plant species Xanthium spinosum L. (Bathurst burr) in Xinjiang under climate change. Acta Ecologica Sinica 2019, 39, 1551–1559. [Google Scholar] [CrossRef]
  46. BenDor, T.K.; Metcalf, S.S. The Spatial Dynamics of Invasive Species Spread. System Dynamics Review: The Journal of the System Dynamics Society 2006, 22, 27–50. [Google Scholar] [CrossRef]
  47. BenDor, T.K.; Metcalf, S.S.; Fontenot, L.E.; Sangunett, B.; Hannon, B. Modeling the Spread of the Emerald Ash Borer. Ecological modelling 2006, 197, 221–236. [Google Scholar] [CrossRef]
  48. McDermott, S.M.; Finnoff, D.C. Impact of Repeated Human Introductions and the Allee Effect on Invasive Species Spread. Ecological Modelling 2016, 329, 100–111. [Google Scholar] [CrossRef]
  49. Mairal, M.; Chown, S.L.; Shaw, J.; Chala, D.; Chau, J.H.; Hui, C.; Kalwij, J.M.; Münzbergová, Z.; Jansen van Vuuren, B.; Le Roux, J.J. Human Activity Strongly Influences Genetic Dynamics of the Most Widespread Invasive Plant in the sub-Antarctic. Molecular Ecology 2022, 31, 1649–1665. [Google Scholar] [CrossRef] [PubMed]
  50. Anderson, R.P. A Framework for Using Niche Models to Estimate Impacts of Climate Change on Species Distributions. Annals of the New York Academy of Sciences 2013, 1297, 8–28. [Google Scholar] [CrossRef]
  51. Marzloff, M.P.; Oliver, E.C.; Barrett, N.S.; Holbrook, N.J.; James, L.; Wotherspoon, S.J.; Johnson, C.R. Differential Vulnerability to Climate Change Yields Novel Deep-Reef Communities. Nature Climate Change 2018, 8, 873–878. [Google Scholar] [CrossRef]
  52. Lu, X.; Siemann, E.; Shao, X.; Wei, H.; Ding, J. Climate Warming Affects Biological Invasions by Shifting Interactions of Plants and Herbivores. Global change biology 2013, 19, 2339–2347. [Google Scholar] [CrossRef]
  53. Gao, C.; Guo, S.; Ma, C.; Yang, J.; Kang, X.; Li, R. Impact of Climate Change on the Potential Geographical Distribution Patterns of Luculia Pinceana Hook. f. since the Last Glacial Maximum. Forests 2024, 15, 253. [Google Scholar] [CrossRef]
  54. Gu, R.; Wei, S.; Li, J.; Zheng, S.; Li, Z.; Liu, G.; Fan, S. Predicting the Impacts of Climate Change on the Geographic Distribution of Moso Bamboo in China Based on Biomod2 Model. Eur J Forest Res 2024, 143, 1499–1512. [Google Scholar] [CrossRef]
  55. Larson, C.D.; Pollnac, F.W.; Schmitz, K.; Rew, L.J. Climate Change and Micro-Topography Are Facilitating the Mountain Invasion by a Non-Native Perennial Plant Species. NeoBiota 2021, 65, 23–45. [Google Scholar] [CrossRef]
  56. Wiens, J.J.; Graham, C.H. Niche Conservatism: Integrating Evolution, Ecology, and Conservation Biology. Annu. Rev. Ecol. Evol. Syst. 2005, 36, 519–539. [Google Scholar] [CrossRef]
  57. Li, K.; Liu, Z.; Yan, B.; Guo, J. A multi-factor comprehensive analysis of the distribution and development potentiality of geothermal resource in Baoji region. Journalof Baoji University of Arts and Sciences (Natural Science Edition) 2022, 42, 86–92. [Google Scholar] [CrossRef]
  58. Pecl, G.T.; Araújo, M.B.; Bell, J.D.; Blanchard, J.; Bonebrake, T.C.; Chen, I.-C.; Clark, T.D.; Colwell, R.K.; Danielsen, F.; Evengård, B. Biodiversity Redistribution under Climate Change: Impacts on Ecosystems and Human Well-Being. Science 2017, 355, eaai9214. [Google Scholar] [CrossRef] [PubMed]
  59. Lembrechts, J.J.; Lenoir, J.; Nuñez, M.A.; Pauchard, A.; Geron, C.; Bussé, G.; Milbau, A.; Nijs, I. Microclimate Variability in Alpine Ecosystems as Stepping Stones for Non-native Plant Establishment above Their Current Elevational Limit. Ecography 2018, 41, 900–909. [Google Scholar] [CrossRef]
  60. Sun, H.; Wang, X.; Fan, Y.; Liu, C.; Wu, P.; Li, Q.; Yin, W. Effects of Biophysical Constraints, Climate and Phylogeny on Forest Shrub Allometries along an Altitudinal Gradient in Northeast China. Scientific Reports 2017, 7, 43769. [Google Scholar] [CrossRef] [PubMed]
  61. Yu, W.; Li, S. Modern Coexistence Theory as a Framework for Invasion Ecology. Biodiversity Science 2020, 28, 1362. [Google Scholar] [CrossRef]
  62. Zhao, G.; Cui, X.; Sun, J.; Li, T.; Wang, Q.I.; Ye, X.; Fan, B. Analysis of the Distribution Pattern of Chinese Ziziphus Jujuba under Climate Change Based on Optimized Biomod2 and MaxEnt Models. Ecological Indicators 2021, 132, 108256. [Google Scholar] [CrossRef]
  63. Essl, F.; Biró, K.; Brandes, D.; Broennimann, O.; Bullock, J.M.; Chapman, D.S.; Chauvel, B.; Dullinger, S.; Fumanal, B.; Guisan, A. Biological Flora of the British Isles: Ambrosia Artemisiifolia. Journal of Ecology 2015, 103, 1069–1098. [Google Scholar] [CrossRef]
  64. Kueffer, C. Plant Invasions in the Anthropocene. Science 2017, 358, 724–725. [Google Scholar] [CrossRef] [PubMed]
  65. Yang, H.; Li, Y.; Wu, M.; Zhang, Z.H.E.; Li, L.; Wan, S. Plant Community Responses to Nitrogen Addition and Increased Precipitation: The Importance of Water Availability and Species Traits. Global Change Biology 2011, 17, 2936–2944. [Google Scholar] [CrossRef]
  66. Lu, Z.; Yang, H.; Du, W.; Li, Z.; Sun, F.; Yang, J.; Chen, C.; Gao, Y.; Wang, S.; Wu, P. Preliminary Study on Control Effects of Five Herbicides on Invasive Species of Xanthium sibiricum in Ningxia. Chinese Agricultural Science Bulletin 2024, 40, 129–132. [Google Scholar] [CrossRef]
  67. Feijó, A.; Ge, D.Y.; Wen, Z.X.; Cheng, J.L.; Xia, L.; Yang, Q.S. Exploring GBIF Database and Extracting Climate Data from Georeferenced Localities with R Software. Bio-101 2021, e1010609. [Google Scholar] [CrossRef]
  68. Qin, Y.; Wang, C.; Zhao, Z.; Pan, X.; Li, Z. Climate Change Impacts on the Global Potential Geographical Distribution of the Agricultural Invasive Pest, Bactrocera Dorsalis (Hendel)(Diptera: Tephritidae). Climatic Change 2019, 155, 145–156. [Google Scholar] [CrossRef]
  69. Jiang, Y.; Wang, T.; Wu, Y.; Hu, R.; Huang, K.; Shao, X. Past Distribution of Epiphyllous Liverworts in China: The Usability of Historical Data. Ecology and Evolution 2018, 8, 7436–7450. [Google Scholar] [CrossRef]
  70. Sharma, R.; Khan, S.; Kaul, V. Predicting the Potential Habitat Suitability and Distribution of “Weed-Onion”(Asphodelus Tenuifolius Cavan.) in India under Predicted Climate Change Scenarios. Journal of Agriculture and Food Research 2023, 14, 100697. [Google Scholar] [CrossRef]
  71. Qin, Z.; Yang, J.H.; Gan, T.; Zhang, J.E.; Liu, Y.M.; Liu, J.M.; Yao, F.C.; Zhao, B.L. Prediction of the Breeding and Wintering Ranges of Pomacea Canaliculata in China Using Ensemble Models. Journal of Environmental Informatics 2024, 44. [Google Scholar] [CrossRef]
  72. Zhang, Y.; Na, X.; Li, W. Impacts of Climate Changes on the Potential Habitat Suitability of Grus Japonensis on Migration Routes. Ecological Indicators 2024, 166, 112462. [Google Scholar] [CrossRef]
  73. Barbet-Massin, M.; Jiguet, F.; Albert, C.H.; Thuiller, W. Selecting Pseudo-absences for Species Distribution Models: How, Where and How Many? Methods in ecology and evolution 2012, 3, 327–338. [Google Scholar] [CrossRef]
  74. Xian, X.; Zhao, H.; Wang, R.; Huang, H.; Chen, B.; Zhang, G.; Liu, W.; Wan, F. Climate Change Has Increased the Global Threats Posed by Three Ragweeds (Ambrosia L.) in the Anthropocene. Science of The Total Environment 2023, 859, 160252. [Google Scholar] [CrossRef]
  75. Fielding, A.H.; Bell, J.F. A Review of Methods for the Assessment of Prediction Errors in Conservation Presence/Absence Models. Environmental conservation 1997, 24, 38–49. [Google Scholar] [CrossRef]
  76. Allouche, O.; Tsoar, A.; Kadmon, R. Assessing the Accuracy of Species Distribution Models: Prevalence, Kappa and the True Skill Statistic (TSS). Journal of applied ecology 2006, 43, 1223–1232. [Google Scholar] [CrossRef]
Figure 1. Current suitable distribution area of Xanthium spinosum in China. White indicates an unsuitable growth area, and red indicates a high-suitability area.
Preprints 143838 g001
Figure 2. Potential distribution of Xanthium spinosum during different periods in China.(A)(B)(C)(D):SSP1-26,SSP2-45,SSP3-70,SSP5-85 in 2050s; (E)(F)(G)(H):SSP1-26,SSP2-45,SSP3-70,SSP5-85 in 2070s.
Preprints 143838 g002
Figure 3. Trends of the spatial distribution pattern of Xanthium spinosum under different climate scenarios.(A)(B)(C)(D):current vs 2050s, SSP1-26,SSP2-45,SSP3-70,SSP5-85; (E)(F)(G)(H):2050s vs 2070s, SSP1-26,SSP2-45,SSP3-70,SSP5-85.
Preprints 143838 g003
Figure 4. Centroid shifts under different climate scenarios for Xanthium spinosum.
Preprints 143838 g004
Figure 5. Response curve for the main environmental variables.(A)Human influence index;(B) Temperature annual range;(C) Maximum temperature of the warmest month;(D) Annual precipitation.
Preprints 143838 g005
Table 1. Accuracy evaluations of single models.
Models TSS AUC
Mean SD CV Mean SD CV
ANN 0.7798 0.0132 0.0170 0.9471 0.0057 0.0060
CTA 0.8455 0.0301 0.0356 0.9528 0.0105 0.0110
FDA 0.7812 0.0079 0.0102 0.9516 0.0035 0.0037
GAM 0.6821 0.0092 0.0135 0.9200 0.0039 0.0043
GLM 0.7858 0.0075 0.0096 0.9571 0.0016 0.0017
MARS 0.7930 0.0070 0.0089 0.9574 0.0023 0.0024
RF 0.9861 0.0044 0.0044 0.9999 0.0003 0.0003
SRE 0.5680 0.0052 0.0092 0.7841 0.0028 0.0035
Table 2. Potential suitable habitats for Xanthium spinosum under different climate scenarios (×104 km2).
Climate Scenario Period High-Suitability Habitat Medium-Suitability Habitat Low-Suitability Habitat Total Suitable Habitat
Current 1970–2000 77.8056 208.6410 128.2930 414.7396
SSP-1-26 2050s 60.3160 227.5660 161.5590 449.4410
2070s 41.0694 220.1440 174.2380 435.4514
SSP-2-45 2050s 61.2865 230.8140 174.4440 466.5445
2070s 42.5226 243.8400 185.0760 471.4386
SSP-3-70 2050s 53.9792 231.4700 171.8660 457.3152
2070s 37.2483 226.3350 219.1390 482.7223
SSP-5-85 2050s 40.1059 238.7590 179.2450 458.1099
2070s 26.5990 207.4980 224.1910 458.2880
Table 3. Spatial changes in the suitable areas for X. spinosum in different climate scenarios.
Climate Scenario Area (×104 km2) Change (%)
Expansion Unchanged Contraction Expansion Unchanged Contraction
Current vs 2050s SSP1-26 41.24 408.20 6.54 9.94 98.42 1.58
SSP2-45 59.93 406.62 8.12 14.45 98.04 1.96
SSP3-70 50.12 407.20 7.54 12.08 98.18 1.82
SSP5-85 54.12 403.99 10.75 13.05 97.41 2.59
2050s vs 2070s SSP1-26 2.43 433.02 16.42 0.54 96.35 3.65
SSP2-45 13.05 458.39 8.15 2.80 98.25 1.75
SSP3-70 39.81 442.91 14.41 8.71 96.85 3.15
SSP5-85 29.19 429.10 29.01 6.37 93.67 6.33
Disclaimer/Publisher’s Note: The statements, opinions and data contained in all publications are solely those of the individual author(s) and contributor(s) and not of MDPI and/or the editor(s). MDPI and/or the editor(s) disclaim responsibility for any injury to people or property resulting from any ideas, methods, instructions or products referred to in the content.
Copyright: This open access article is published under a Creative Commons CC BY 4.0 license, which permit the free download, distribution, and reuse, provided that the author and preprint are cited in any reuse.
Prerpints.org logo

Preprints.org is a free preprint server supported by MDPI in Basel, Switzerland.

Subscribe

Disclaimer

Terms of Use

Privacy Policy

Privacy Settings

© 2025 MDPI (Basel, Switzerland) unless otherwise stated