
Submitted:
05 February 2025
Posted:
06 February 2025
You are already at the latest version
Abstract
Kinetic parameters that describe phase transformation and precipitation rates include the activation energy. In Al based alloys, volume fractions of precipitates, the melting temperature of specific phases and the activation energy of reactions can, in most cases, be determined by the differential scanning calorimetry (DSC) technique. In this investigation, DSC measurments were performed on a SETARAM SETSYS Evolution-1200 thermal analyzer on recycled aluminium alloy 2017A in the range of temperature from room ~25 to 700°C and different scan rates of heating at 5,10,15, 20 and 25°C min-1. The peak temperatures of the clusters, GP zones and hardening phases ’"and Q from each heating rate were collected to calculate the activation energy associated with precipitation reactions in aluminium alloy 2017A using various mathematical models: the Kissinger, Ozawa and Boswell. The results (XRD, LM, TEM, DSC) show that both the θ and Q phases are strengthening phases, but the strengthening effect of the ", phases is dominant. The strengthening phases, mainly ", ' increase the hardness during natural aging. The maximum hardness value 128HB was obtained after ~25h of natural ageing. The activation energy of precipitation of strengthening phase θ” in 2017A aluminum alloy determined by Kissinger, Ozawa and Boswell models are: 89.94 kJ· mol−1, 98.7 kJ· mol−1 and 94.33 kJ· mol−1 respectively and for θ’: 72.5 kJ· mol−1, 81.9 kJ· mol−1 and 77.2 kJ· mol−1 .
Keywords:
Aluminium alloys
; Precipitacion kinetics
; Activation energy
; DSC
; Recycling
1. Introduction
Aluminum alloys are widely used as the primary material for highly loaded components of aircraft structures, automotive vehicles, rolling stock, and in construction due to their high stiffness-to-weight and strength-to-weight ratios; their high damage tolerance capabilities and resistance to corrosion offer additional advantages when compared to other competitive materials [1,2,3,4,5,6]. Among aluminum alloys, 2xxx group alloys occupy a special place due to their good mechanical and technological properties, low density, and high relative strength (Rm/δ). They contain, besides Cu as their main alloying element (3.5 to 6 % wt.) also Mg, Si, and Mn (up to 1,2 %) as well as small amounts of Fe, Ni, Ti, Zr, and Li [1,3,5,7,8,9,10,11,12,13,14,15,16,17,18,19,20,21,22]. They are characterized by high yield strength, good fracture toughness, and excellent fatigue properties, and they also have the properties of heat-resistant materials, owing to the formation of phases rich in Fe, Mn, and Ti [1,2,3,4,5,6,23]. It is not only the good mechanical properties of 2xxx-series aluminum alloys that make these alloys attractive, but the fact that aluminum can be recycled indefinitely without any loss of its properties. Recycling aluminum alloys saves approximately 95% of the energy required to produce the same amount from raw materials. In addition to the environmental benefits, recycling 2017A aluminum alloy, and other aluminum alloys, is economically beneficial. The cost of recycling is much less than producing aluminum from raw materials, leading to cost savings for manufacturers and consumers. Almost 75% of the aluminum ever produced is still in use today as it can be recycled infinitely without compromising any of its exceptional properties or quality [1,4,5,7,23,24,25,26,27,28,29,30,31].
The 2xxx-series aluminium alloys can be heat-treated to achieve desired properties. However, during recycling, this heat treatment history is lost. The recycled material will need to be reheat-treated to achieve the desired properties. The mechanism responsible for these excellent material properties is the precipitation hardening process [5,7,8,9,10,11,12,13,14,15,16,17,18,19,20]. Secondary intermetallic phases are formed in the solution heat-treated alloy during aging, which form the basis of precipitation hardening, and they have the greatest impact on increasing the mechanical properties of 2xxx-series aluminium alloys. Many investigations have been devoted to examining the details of the precipitation sequence in Al-Cu alloy [13,14,15,16,17,18,19,20], using both theoretical models and several newly developed techniques [10,14,15,16,17,20]. The results of many studies indicate that the type of strengthening phases and their volume fraction depend mainly on the chemical composition of the alloy and the percentage content of the elements forming these phases (Cu, Mg, and Si). The sequence of precipitation of strengthening phases in solution heat-treated alloys and the type of phases present in the 2xxx-series Al-Cu-Mg-(Si) alloys have been studied, characterized by various research techniques, such as TEM, SEM, XRD, and DSC, and presented in many scientific papers [17,20]. An analysis of the research results presented in the literature shows that depending on the Cu, Mg, and Si content and the value of the Cu/Mg and Mg/Si ratio, 2xxx-series aluminium alloys can be strengthened through five phases, such as θ (Al2Cu), β (Mg2Si), S (Al2CuMg), Q (Cu2Mg8Si6Al4, Al5Cu2Mg9Si7, or Al4Cu2Mg8Si7), and precipitation of Si [14,15,16,17,18]. If the value of the Cu/Mg ratio is between 4 and 8, the strengthening takes place due to the precipitation of the θ (Al2Cu) and S (Al2CuMg) phases from the solution heat-treated alloy. However, the addition of Si to the alloy changes and greatly influences the precipitation sequence. The addition of Si in 2xxx-series alloys promotes the precipitation of β (Mg2Si) and Q (Cu2Mg8Si6Al4) phases, in addition to the θ (Al2Cu) phase. With a high content of Cu and and an Mg/Si ratio greater than 1, phase β may also form in addition to the θ phase. At an Mg/Si ratio lest than 1, Q or S phases may be formed depending on the amount of Si. A very low Si content promotes the formation of the S phase, and a higher Si content promotes the formation of the Q phase [15,16,22,31].
The use of differential scanning calorimetry (DSC) and the determination of the activation energy of strengthening phase precipitation in aluminum alloys obtained from recycled scrap are of key importance for several reasons. The recycling process can introduce variations in the chemical composition of alloys due to factors such as contamination or oxidation. DSC analysis allows for the assessment of how these factors influence the kinetics of precipitation and the formation of both metastable and stable strengthening phases from the supersaturated alloy. During recycling, impurity elements such as Fe and Si may also accumulate in the alloy, affecting the precipitation of strengthening phases and potentially leading to the formation of brittle, undesirable intermetallic phases. DSC provides valuable insights into how these elements influence the precipitation sequence, enabling the adjustment of processing conditions to minimize their negative impact on the mechanical properties of the alloys.
Aluminum alloys obtained from recycled scrap often require adjustments in heat treatment parameters, such as solution treatment and aging, to achieve mechanical properties comparable to those of primary alloys. Determining the activation energy of the strengthening phase precipitation process allows for the optimization of time-temperature conditions, ensuring the desired strength parameters.
Therefore, in this work, DSC methods have been used to study the kinetics of precipitation and dissolution of metastable and stable phases in recycled aluminium 2017A alloy. Also, the activation energies associated with the precipitation of GP zones and the metastable θ”, θ’ and stable θ(Al2Cu) and Q (Cu2Mg8Si6Al4) precipitates in the 2017A alloy have been determined from the peak temperature corresponding to exothermic reactions.
2. Materials and Methods
The testing material was an aluminum alloy 2017A obtained from recycled materials. The ingot casting process was carried out on a multi-strand continuous casting machine, equipped with four oil-lubricated crystallizers. The raw material consisted of large pieces of scrap and production waste in the form of chips from the 2017A alloy. Approximately 265 kg of scrap was melted in a crucible resistance furnace. The continuous casting of the EN AW-2017 alloy was conducted under specific process conditions. The metal temperature in the furnace was maintained at 730°C, while in the crystallizer, it ranged from 680 to 700°C. Cooling was provided by a water flow rate of 25 liters per minute, with a casting speed set at3.5 to 4.0 mm per second. The total cooling water consumption for the four crystallizers was 120 liters per minute [23].
Just before casting the ingots, a sample was taken from the molten bath for chemical composition analysis, which was performed using an ARL-XTRa 3460 spectrometer. Based on the analysis results, necessary adjustments were made to the alloy composition by adding the appropriate amount of the missing elements to ensure compliance with the PN-EN 573-1 standard [32].
2.1. Heat Treatment
Heat treatment of the 2017A alloy under study included of precipitation strengthening process. Samples were heated in an electric resistance furnace up to the temperature 510°C, at which a homogenous solid α-Al solution exists. They were then annealed for 6 hours, and for supersaturation, the alloy was rapidly cooled in water to ~15–20°C. Natural aging of the alloy was carried out in air at ~25°C for 155 h to obtain the T4 state, while artificial aging was carried out at 120°C and 175°C for 155 h, resulting in the T6 state of the alloy. After artificial aging, the samples were cooled in water.
2.2. Hardness Test
The hardness of the 2017A alloy was measured immediately after supersaturation and during natural ageing at 25°C, as well as during artificial ageing at different temperatures (120°C and 175°C). Hardness measurements were carried out using an Instron Wolpert hardness tester with the Brinell method, using a 62.5 kg load and a 2.5 mm diameter indentation ball. Three measurements were taken for each condition, and the average hardness was calculated. HBW 2.5/62.5 hardness measurements of supersaturated and aged samples at different temperatures and aging times were carried out continuously. From the results, the average hardness was calculated and plotted as a function of aging time.
2.3. Microstructural Analysis
The microscopic examination of the alloy after casting, solution heat treatment and ageing was performed using a Leica DMI 3000M light microscope and a Jeol-2100 transmission electron microscope. The specimens were cut using a precision cutting machine Discotom–6 and mounted in a bakelite. They were ground with SiC papers of 250, 500, 800, 1000 and 1200 grit, and polished using 3 µm and 1 µm diamond polycrystalline suspensions. The final polishing was performed using an alumina (Al2O3) suspension. Microstructure observation were carried out on polished samples which were then etched in Keller’s reagent: 2cm3 HF + 3cm3 HCl + 20cm3 HNO3 + 175cm3 H2O. The thin foils were prepared by electrochemical polishing in a reagent mixture of 260 ml CH3OH + 35 ml glycerol + 5 ml HClO4 using a Tenupol-3 polisher and Cresington 108 automatic sputter coater.
The qualitative analysis of the phase components of the 2017A alloy microstructure after casting, solution heat treatment and natural ageing was performed using on solid samples with a ground and polished surface. The phase composition of the 2017A alloy microstructure was identified using an X-ray diffractometer ARL XTRa from Thermo Fisher company. A filtered copper lamp (CuKα,λ = 0,1542 nm) was used, with a voltage of 40 kV, a current of 30mA, a range of 2θ = 20-80° and a step size 0,02°/6s. The phase composition was determined using the Powder Diffraction File (PDF), developed and issued by the ICDD (The International Center for Diffraction Data).
2.4. Thermal Analysis
In order to determine the thermal effects related to the processes of precipitation/dissolution of strengthening phases in the heat treated alloy, DSC tests were performed immediately after the samples were quenched from the solutionizing temperature. The DSC measurements for cast and solution heat treated samples were performed with the SETARAM SETSYS Evolution-1200 thermal analyzer. The samples were prepared in a disk shape with 3 mm diameter, 1.5 mm thickness and a mass of approximately 25-28 mg. A protective argon atmosphere was used to prevent sample oxidation during different DSC analyses. To determine the sequence of precipitation of strengthening phases from the supersaturated alloy, one of the solution-treated specimen was heated at a rate of 10°C/min from room temperature to 700°C using DSC analyzer. However, to determine the activation energy, the remaining samples were heated from 25°C to 550°C with different heating rates of 5, 10, 15, 20 and 25°C/min. The peak temperatures (Tp) of the hardening phases from each heating rate were measured and collected to determine the kinetic parameters of the 2017A aluminium alloy. Three mathematical models (Kissinger, Ozawa and Boswell) were used to determine the activation energy [33,34,35,36,37,38,39,40,41,42,43,44,45]. Investigation of kinetics transformation (precipitation/dissolution of the precipitates) is always related to the concept of activation energy. Studies of precipitation processes are associated with nucleation and growth processes, which dominate in supersaturated alloys. In general, separate activation energies must be identified for individual nucleation and growth steps during a transformation, although they are usually combined into a single activation energy representing the overall precipitation process [40]. In the present study, a non-isothermal method was applied, in which the samples were heated at a constant rate q, and the heat evolved was recorded as a function of temperature or time.
The study of discontinuous precipitation kinetics of the hardening phases under non-isothermal conditions is based on the Johnson–Mehl–Avrami (JMA) [34,35,36,37,38,39,40,41,42,43,44,45] equation (1) of isothermal transformation kinetics:
where: y(t) is the volume fraction of the initial material transformed at time t, n is the Avrami exponent (which reflects the nucleation rate and the growth morphology) and k is the reaction rate constant, which can usually be derived from an Arrhenius equation in equation (2):
where: is the activation energy for the crystallization reaction, which describes the overall precipitation process, is the universal gas constant (8.314 J mol-1 K-1), is the isothermal temperature and is the frequency factor.
The theoretical basis for interpreting the DSC results at different heating rates involved three mathematical models - Kissinger, Ozawa and Boswell – which were used to analyze and determine the activation energy of the hardening phases in the AA 2017A aluminium alloy, as shown in equations (3)–(5) respectively:
where: , and are constants, is temperature at the maximum peak of the hardening phases, is the heating rate and is activation energy. is an assessment of thermal analysis for each mathematical model.
3. Results
The spectrometric analysis of the chemical composition of the ingots obtained from recycled scrap confirmed that the content of alloying elements met the specifications set for the 2017A alloy. The chemical composition of the investigated alloy is presented in Table 1.
Figure 1 shows the microstructure (LM) and phase composition (XRD) of recycled 2017A aluminum alloy in the as-cast state (Figure 1a,b), supersaturated solid solution state (Figure 1c,d) and supersaturated plus naturally aged state at ~25°C for 155 h (Figure 1e,f). Based on previous examinations and results [23] from microscopic observations as well as XRD studies, it was demonstrated that the as-cast microstructure of the 2017A alloy obtained from recycling consists of the following phases: binary—θ-Al2Cu and β-Mg2Si phases, a ternary Al7Cu2Fe phase, quaternary Q-Al4Cu2Mg8Si7 phase, and quinary α-Al15(FeMn)3(SiCu)2 phase. Analysis of these results shows that the largest relative volume is occupied by precipitates of the binary θ-Al2Cu phase (Figure 1a,b). The XRD spectrum (Figure 1b) exhibited the highest number of high-intensity reflections originating from this phase. Microscopic observations (Figure 1c) and XRD analysis (Figure 1d) of the solution heat treated samples at 510°C showed that during annealing for 6 hours, most of the primary precipitates of Al2Cu, β-Mg2Si and Q-Al4Cu2Mg8Si7 intermetallic phases observed after casting (Figure 1) were dissolved in the solid α-Al solution (Figure 1c and d). However, the morphology of the remaining undissolved intermetallic precipitates, mainly those containing Fe, also changed. It was found that during annealing to supersaturation, the edges of the α-Al15(FeMn)3(SiCu)2 phase particles, which appeared in the cast state in the form of Chinese script, became rounded. Additionally, during annealing at 510°C for six hours, the lamellar and needle-like particles of the Al7Cu2Fe phase transformed into spheroidal-like particles of the α -Al15(FeMn)3(SiCu)2 phase (Figure 1c). The microstructure of the 2017A alloy after artificially aging for 55 hours at 175°C exhibited very fine, dispersive precipitates homogeneously distributed throughout the alloy volume (Figure 1e). A prolonged aging time leads to the precipitation of stable equilibrium phases, their growth and coagulation. Based on XRD diffractometric results (Figure 1f), previous studies [23] and literature data [5,15,33] it can be concluded that the main strengthening phases in the 2017A alloy are the θ-Al2Cu and Q-Al4Cu2Mg8Si7 precipitates.
Solid solution-treated specimens were natural aged at 25°C and artificial aged at 120°C and 175°C for 155 hours. During ageing, hardness values were monitored and plotted in Figure 2. From an initial hardness value of approximately 91 HB in the solution treated condition, the material hardness increased with ageing time. The first small hardness peak (118.2HB) appears on the curve after approximately 8 hours of natural aging. Continued aging causes a slight decrease in hardness, followed by a continuous increase with further aging duration until reaching a maximum value of 128.0 HB after 42 hours. The investigated alloy, after reaching maximum hardness during natural ageing, does not become overaged, which would typically be characterized by a reduction in hardness. The aging curve shows a plateau - a range of stabilized hardness. Hardness values close to the maximum remain at a similar level throughout 155 hours of natural ageing. Ageing at 120°C results in hardness very similar to that obtained during natural ageing. Samples aged at the highest temperature (175°C) exhibit the highest hardness values (150.5HB) which are achieved after approximately 22 hours of artificial aging (Figure 2).
The microstructure of the 2017A alloy, naturally aged at the hardness peak, shows only undissolved particles of primary intermetallic phases. However, no secondary strengthening phase particles are observed (Figure 3a). Increasing the temperature to 175℃ and aging time to 65 hours resulted in the formation of very fine secondary strengthening phases - θ-Al2Cu and Q-Al4Cu2Mg8Si7 – which are dispersed and evenly distributed throughout the entire volume of the alloy (Figure 3b).
To observe the precipitation of the θ-Al2Cu and Q-Al4Cu2Mg8Si7 phases in the specimen with the maximum hardness value after artificial ageing at 175°C for 5 and 22 hours, TEM analysis was performed, as shown in Figure 4. After 5 hours ageing, very fine needle-like metastable transition phases - θ” and θ’ as well as Q’ – were observed, embedded within the aluminium matrix, with an average length of approximately 50 nm. Increasing the aging time to 22 hours resulted in an increase in the length of needle-like precipitates to approximately 100-150 nm (Figure 4b,c).
DSC analysis
Figure 5 shows the DSC curves obtained during heating at = 10°C min-1 in the calorimeter for the as-quenched specimen of 2017A alloy. Six exothermic and six endothermic peaks were identified from the DSC thermogram. The characteristic temperature values of the exothermic and endothermic peaks recorded on the DSC curve are presented in Table 2.
Exothermic peaks are marked with capital letters A–G, while endothermic peaks are denoted by capital letters with a prime symbol (A’–G’). The section of the DSC curve in the temperature range of 50°C to 475°C, where the strengthening phase precipitation process was recorded during continuous heating, was enlarged (Figure 5). Based on the DSC, XRD, and hardness test results, an attempt was made to identify the precipitation sequence and provide an explanation for the origin of the main peaks. The results (Figure 1, Figure 2, Figure 3, Figure 4 and Figure 5) indicate that during continuous heating in the calorimeter of the supersaturated 2017A aluminium alloy, strengthening phases – primarily θ-Al2Cu, and to a lesser extent Q-Al4Cu2Mg8Si7 - are precipitated. The precipitation sequence of the strengthening phases θ-Al2Cu and Q-Al4Cu2Mg8Si7 was recorded on the DSC curve (Figure 5).
Based on the DSC curve (Figure 5), it can be assumed that the precipitation process begins with the formation of Cu and Mg atom co-clusters, corresponding to exothermic peak A between 61 and 95°C (Table 2) [8]. As the temperature increases, GP zones (exothermic peaks B and C) form coherent with the matrix, followed by their dissolution (endothermic peaks A’ and B’). The highest-intensity exothermic peaks - D (between 239 and 265°C) - result from the precipitation of the θ” phase, while E (between 273 and 311°C) corresponds to the formation of the θ’/Q’ phases, which are partially coherent with the matrix. The precipitation of these phases is responsible for achieving the maximum mechanical properties of the alloy [8,13,14,15,16,17,18,23]. Continued heating leads to the dissolution (endothermic peak C’ and D’) of the metastable θ’ and Q’ phases. Finally, the last exothermic peaks - F and G, in the temperature ranges of 329–367°C and 401–444°C, respectively – indicate the formation of stable θ-Al2Cu and Q-Al4Cu2Mg8Si7 precipitates, which are incoherent with the matrix. Upon further heating of the supersaturated sample, a sharp endothermic peak F’ is observed between 508 and 522°C on the DSC curve. This effect (F’) corresponds to the dissolution of all intermetallic phases. Continued heating of the alloy ultimately leads to the dissolution of the α-Al phase, as indicated by endothermic peak G’.
To determine the activation energy (Ea) of the precipitation-hardening phases in the supersaturated recycled 2017A alloy, the DSC results were analyzed. Figure 6 presents the DSC curves obtained at various heating rates (q) from 5 to 25°C/min, starting from room temperature up to 550°C. The heat effects associated with the transformation (precipitation/dissolution) reactions were recorded (Figure 6).
The analysis of the obtained DSC results indicates that an increase in the heating rate (q) affects the kinetics of the precipitation of strengthening phases in the supersaturated 2017A alloy. As shown in Figs. 6 and 7, an increase in the heating rate () reduces the time required for the occurrence of peaks – precipitation of clusters, GP zones (Figure 7a), and metastable transition phases (θ”, θ’) as well as the stable θ-Al2Cu phase on the DSC curves (Figure 7b).
The heating rate (q) also influences the peak temperatures associated with the precipitation of strengthening phases in the supersaturated 2017A alloy (Table 3).
It can be observed that the values of the exothermic/endothermic peaks recorded in the DSC thermograms shift to higher temperature as the heating rate q increases (Figure 6, Figure 7 and Figure 8, Table 3). The high correlation coefficients (R2= 0.95÷0.98) indicate a strong dependence of the temperature at which strengthening phases are released on the heating rate (Figure 8a-b). The observed dependence of exothermic peak temperatures in reactions A - F on the scanning rates indicates that these processes are thermally activated. The effect of the heating rate can be explained by the decrease in the amount of precipitated Cu atoms, due to their increased solid solubility at higher precipitation temperatures when using a higher heating rate [21,22,23]. This effect can also be attributed to the diffusive nature of the precipitation reactions.
The activation energy of the clusters, GP zones and hardening phases (θ and Q) in the 2017A aluminium alloy was determined by analyzing the shift in the temperature of the maximum exothermic peaks as a function of the heating rate . Using equations (3)–(5), diagrams of versus were plotted, as illustrated in Figure 9, Figure 10 and Figure 11:
- Kissinger method vs. (Figure 9),
- Boswell method vs. (Figure 10),
- Ozawa method vs. (Figure 11).
Figure 12 compares the Y versus 1000 R/T curves for θ” (peak D) and of θ’ (peak E), obtained using the three mathematical models: Kissinger, Ozawa and Boswell. The activation energy values, derived from the slopes of the curves, are very similar (e.g. for the θ” phase: Kissinger 89.94 kJ mol-1; Ozawa 98.7 kJ mol-1; Boswell 94.33 kJ mol-1) as shown in Table 4 and Figure 13.
Based on these results (Table 4 and Figure 13), it can be concluded that the activation energies obtained from the three mathematical models differ insignificantly, including for clusters, GP zones and stable precipitates (θ and Q phases). The Ozawa equation yield the highest activation energy value (Table 4 and Figure 13).
5. Conclusions
- The results of the conducted studies shown that the aluminum 2017A alloy obtained from recycled scrap exhibits a precipitation sequence consistent with that observed in the primary alloy. DSC analysis confirmed that despite the presence of trace elements such as Fe and Si, the kinetics of precipitation of metastable and stable strengthening phases did not undergo significant changes. Properly selected heat treatment parameters enabled the formation of a microstructure comparable to that of the primary alloy, indicating the potential for effectively utilizing recycled aluminum in applications requiring high mechanical properties.
- Microscopic observations (LM) and XRD studies showed that the microstructure of the recycled as-cast 2017A alloy consists of precipitates of intermetallic phases - θ-Al2Cu, β-Mg2Si, Al7Cu2Fe, Q-Al4Cu2Mg8Si7 and α-Al15(FeMn)3(SiCu)2 – which crystalize mainly in the form of eutectics in the interdendritic regions of the solid α-Al solution. During solution heat treatment, the primary precipitates of the θ and Q phases were almost completely dissolved in α-Al. XRD and TEM studies of the aged specimens showed that the precipitation of the θ phase, and to a lesser degree, the Q phase, was responsible for the strengthening of the recycled 2017A alloy.
- Based on calorimetric and diffractometric studies, it was established that the precipitation of strengthening phases in a solution heat treated alloy follows the sequence: α-ss→GP/GPB zones→ θ"→ θ'/Q’→ θ-Al2Cu/Q-Al4Cu2Mg8Si7. The maximum strengthening of the alloy results from the precipitation of metastable transition phases - θ’’, θ’ and Q’.
- The precipitation kinetics of the alloy was characterized by DSC method under non-isothermal conditions. It was found that the heating rate reduces the time to peak occurrence and affects the peak temperatures of precipitation of strengthening phases in supersaturated 2017A alloy. The values of the exothermic/endothermic peaks in the DSC thermograms shift to a higher temperatures as the heating rate increases.
- The activation energy values associated with the discontinuous precipitation of strengthening phases in the supersaturated 2017A alloy, determined by DSC methods using the Kissinger, Ozawa and Boswell models, were found to be similar. For example, the activation energy for the precipitation of θ” transition phase was 89.94, 98.7 and 94.33 KJ mol-1, respectively.
- During natural and artificial aging of supersaturated 2017A alloys, an increase in Brinell hardness (HB) was observed with increasing aging time. The artificially aged alloy (175°C) exhibited the highest hardness value (150.5HB). When aged at 120°C, the hardness remained close to the value obtained during natural aging (approximately 128 HB).
Author Contributions
Conceptualization, M-N. G.; methodology, M-N. G., G.B. and D.N.; investigation, M-N. G., G.B. and D.N.; writing—original draft preparation, M-N. G.; writing—review and editing, M-N. G. All authors have read and agreed to the published version of the manuscript.
Funding
This research was funded by Financed by the Minister of Science and Higher Education Republic of Poland within the program "Regional Excellence Initiative"
References
- Polmear I.J. Light alloys. Metallurgy of light metals. Arnold, London-New York-Sydney-Auckland 1995.
- MacKenzie S. D.; Totten G.E. Analytical characterization of aluminium, steel, and superalloys. Taylor & Francis Group, Boca Raton, 2006. [CrossRef]
- King F. Aluminium and its alloys. John Willey and Sons, New York, Chichester, Brisbane, Toronto 1987.
- Aluminium Handbook. vol.1 Fundamentals and Materials. Aluminium-Verlag Marketing & Kommunikation GmbH, Düsseldorf 1999.
- Hatch J.E. Aluminium. Properties and physical metallurgy. ASM Metals Park, Ohio 1984.
- Mondolfo L.F. Aluminium Alloys: Structure and Properties. Butterworths, London-Boston, 1976.
- Polmear, I. J. Aluminium alloys - A century of age hardening. Materials Forum 2004, 28, 1-14.
- Wang S.C.; Starink M.J. Two types of S phase precipitates in Al–Cu–Mg alloys. Acta Materialia 2007, 55, 933-941. [CrossRef]
- Zeren M. Effect of copper and silicon content on mechanical properties in Al–Cu–Si–Mg alloys. Journal of Materials Processing Technology 2005, 169, 292–298. [CrossRef]
- Smith G.W. Precipitation kinetics in solutionized aluminum alloy 2124: Determination by scanning and isothermal calorimetry. Thermochim. Act. 1998, 317, 1, 7-23. [CrossRef]
- Abis S.; Massazza M.; Mengucci P.; Riontino G. Early ageing mechanisms in a high-copper AlCuMg alloy. Scrip. Matter. 2001, 45, 685-691. [CrossRef]
- Wu Y., Ye L.; Jia Y.; Liu L.; Zhang X. Precipitation kinetics of 2519A aluminum alloy based on aging curves and DSC analysis. Trans. Nonferrous Met. Soc. China 2014, 24, 3076-3083. [CrossRef]
- Bassani P.; Gariboldi E.; Ripamonti D. Thermal analysis of Al–Cu–Mg–Si alloy with Ag/Zr additions. J. Therm. Anal. Calorim. 2008, 91,1, 29–35. [CrossRef]
- Kent D.; Schaffer G.B.; Drennan J. Age hardening of a sintered Al–Cu–Mg–Si–(Sn) alloy. Materials Science and Engineering A 2005, 405, 65–73. [CrossRef]
- Eskin D.G. Decomposition of supersaturated solid solutions in Al–Cu–Mg–Si Alloys. Journal of Materials Science 2003, 38, 2, 279–90. [CrossRef]
- Hutchuinson C.R.; Ringer S.P. Precipitation process in Al–Cu–Mg alloys microalloyed with Si. Metallurgical and Materials Transactions A 2000, 31, 2721–2733. [CrossRef]
- Ringer S.P; Hono K.; Sakurai T.; Polmear I.J.: Cluster hardening in an aged Al–Cu–Mg alloy. Scripta Materialia 1997, 36, 5, 517–21.
- Starink M.J; Wang S.C. The thermodynamics of and strengthening due to co-clusters: general theory and application to the case of Al–Cu–Mg alloys. Acta Materialia 2009, 57, 8, 2376–89. [CrossRef]
- Wang J.; Xie J.; Mao Z.;Liang T.; Wang A.; Wang W.; Hao S. Microstructure evolution and mechanical properties of the Al-Cu-Mg-Ag alloy during non-isothermal aging. Journal of Alloys and Compounds 2023, 942, 169031. [CrossRef]
- Kozieł J.; Błaż L.; Włoch G.; Sobota J.; Lobry P. Precipitation Processes during Non-Isothermal Ageing of Fine-Grained 2024 Alloy. Arch Metall and Mat. 2016, 61, 169-176. [CrossRef]
- Fatmi M.; Ghebouli B.; Ghebouli M.A.; Chihi T.; Abdul Hafiz M. The kinetics of precipitation in Al-2.4 wt% Cu alloy by Kissinger, Ozawa, Bosswel and Matusita methods. Physica B 2011, 406, 2277-2280. [CrossRef]
- Gao, X.; Nie, J.F.; Muddle, B.C. Effect on Si additions on precipitation hardening response in Al-Cu-Mg-(Ag) alloys. Mater. Sci. Forum 1996, 217, 1251–1256. [CrossRef]
- Mrówka-Nowotnik G.; Gancarczyk K.; Nowotnik A.; Dychtoń K.; Boczkal G. Microstructure and Properties of As-Cast and Heat-Treated 2017A Aluminium Alloy Obtained from Scrap Recycling. Materials 2021, 14, 89. [CrossRef]
- Nur K.Y.; Mohd A.L.; Azlan A. Hot Press as a Sustainable Direct Recycling Technique of Aluminium: Mechanical Properties and Surface Integrity. Materials 2017, 10, 902. [CrossRef]
- Tenorio J.A.S.; Espinosa D.C. Encyclopedia of Aluminum and Its Alloys. Recycling of Aluminium; Taylor & Francis Group: Boca Raton, FL, USA; London, UK; New York, NY, USA, 2019; 2, 2341–2360.
- Gronostajski J.; Marciniak H.; Matuszak A. New methods of aluminium and aluminium-alloy chips recycling. J. Mater. Process.Technol. 2000, 106, 34–39. [CrossRef]
- Rahim A.S.N.; Laji M.A.; Ariffin S. Review on Recycling Aluminum Chips by Hot Extrusion Process. Procedia CIRP 2015, 26, 761–766. [CrossRef]
- Samuel M. A new technique for recycling aluminium scrap. J. Mater. Process. Technol. 2003, 135, 117–124. [CrossRef]
- Jirang C.; Roven H.J. Recycling of automotive aluminium. Trans. Nonferrous Met. Soc. China 2010, 20, 2057–2063. [CrossRef]
- Fogagnolo J.B.; Ruiz N.E.M.; Simón M.A.; Martinez M.A. Recycling of aluminium alloy and aluminium matrix composite chips by pressing and hot extrusion. J. Mater. Process. Technol. 2003, 143, 792–795. [CrossRef]
- Brunet M.; Malard B.; Ratel-Ramonda N.; Deshayes C.; Joulié S.; Warot-Fonrose B.; Sciaua P.; Douina J.; De Geuser F.; Deschamps A. Precipitation in original Duralumin A-U4G versus modern 2017A alloy. Materialia 2019, 8, 100429. [CrossRef]
- PN EN 573–581. Aluminium i Stopy Aluminium-Skład Chemiczny i Rodzaje Wyrobów Przerobionych Plastycznie-Część 1: System Oznaczeń Numerycznych; Polski Komitet Normalizacyjny: Warsaw, Poland, 2006.
- Vyazovkin S. Kissinger Method in Kinetics of Materials: Things to Beware and Be Aware of. Molecules 2020, 25, 2813. [CrossRef]
- Zamani M.; Toschi S.; Morri A.; Ceschini L.; Seifeddine S. Optimisation of heat treatment of Al–Cu–(Mg–Ag) cast alloys. J. Therm. Anal. Calorim. 2020, 139, 3427–3440. [CrossRef]
- Bassani P.; Gariboldi E.; Vimercati G. Calorimetric analysis on aged Al-4.4Cu-0.5 Mg-0.9Si-0.8Mn alloy (AA2014 grade). J. Therm. Anal. Calorim. 2007, 87, 247–253. [CrossRef]
- Boswell P.G. On the calculation of activation energies using modified Kissinger method. J. Therm. Anal. Calorim 1980, 18, 353-358. [CrossRef]
- Heireche L.; Belhadji M. The methods Matusita, Kissinger and Ozawa in the study of the crystallization of glasses. The case of Ge-Sb-Te alloys. Chalcogenide Lett. 2007, 4, 2, 23-33.
- Smith G.W. Precipitation kinetics in air-cooled aluminium alloy: A comparison of scanning and isothermal calorimetry measurement methods. Therm. Act. 1998, 313, 27-36. [CrossRef]
- Ovono Ovono D.; Guillot I.; Massinon D. Determination of the activation energy in a cast aluminium alloy by TEM and DSC. J. Alloys Compd. 2007, 432, 241–246. [CrossRef]
- Afify N.; Gaber A.B.; Saad Mostafa S.; Anooz S.B. Phase transformation kinetics during the heating of an Al-8 at% Li alloy. High Temperatures - High Pressures 2002,34, 535-548. [CrossRef]
- Varschavsky A.; Donoso E. A differential scanning calorimetric study of precipitation in Cu-2Be. Thermochim. Acta 1995, 266, 257-275. [CrossRef]
- Donoso E.; A. Varschavsky A. Microcalorimetric evaluation of precipitation in Cu-2 Be-0.2 Mg. J. Therm. Anal. Calorim. 2001, 63, 249-266. [CrossRef]
- Hayoune A.; Hamana D. Structural evolution during non-isothermal ageing of a dilute Al–Cu alloy by dilatometric analysis. J. Alloys Compd. 2009, 474, 1–2, 118-123. [CrossRef]
- Doan L. C.; Ohmori Y.; Nakai K. Precipitation and Dissolution Reactions in a 6061 Aluminum Alloy. Metallurgical and Materials Transactions A. 2000, 41, 2, 300-305. [CrossRef]
- Fatmi M.; Ghebouli B. Influence of plastic deformation on occurrence of discontinuous precipitation reaction in Ni-3 at% In alloy. Physica B 2010, 405, 4111-4115. [CrossRef]
Figure 1.
Microstructures and X-ray diffraction pattern of the 2017A alloy in as-cast state: a) LM and b) XRD; after solution heat treatment at 510°C/6h : c) LM and d) XRD; and alloy after artificially aging for 55 hours at 175°C: e) LM and f) XRD.
Figure 1.
Microstructures and X-ray diffraction pattern of the 2017A alloy in as-cast state: a) LM and b) XRD; after solution heat treatment at 510°C/6h : c) LM and d) XRD; and alloy after artificially aging for 55 hours at 175°C: e) LM and f) XRD.
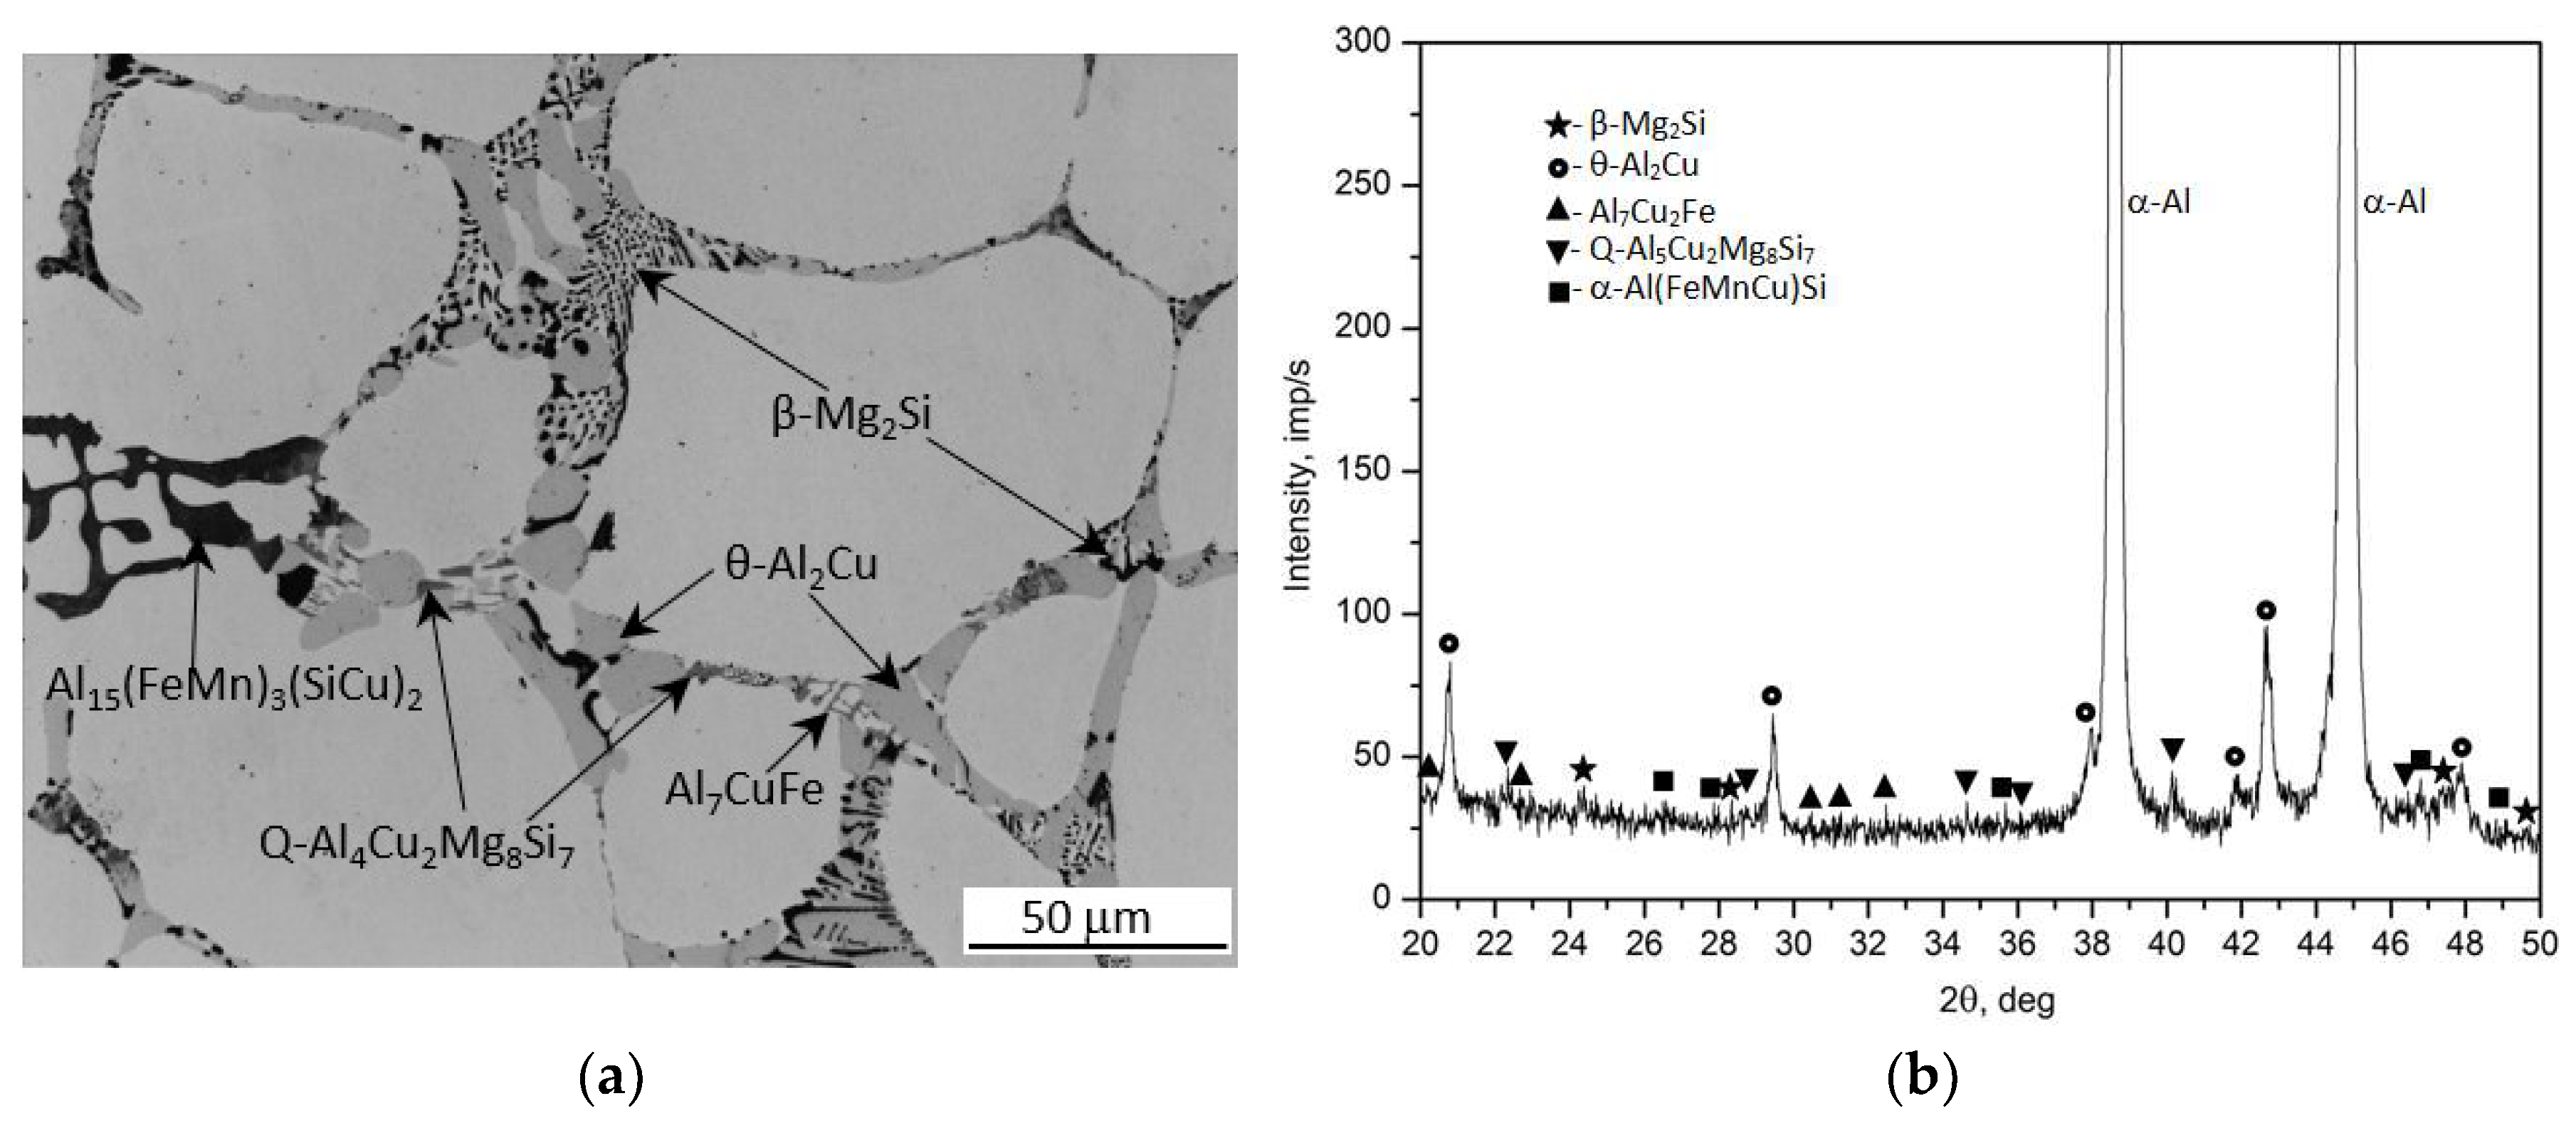
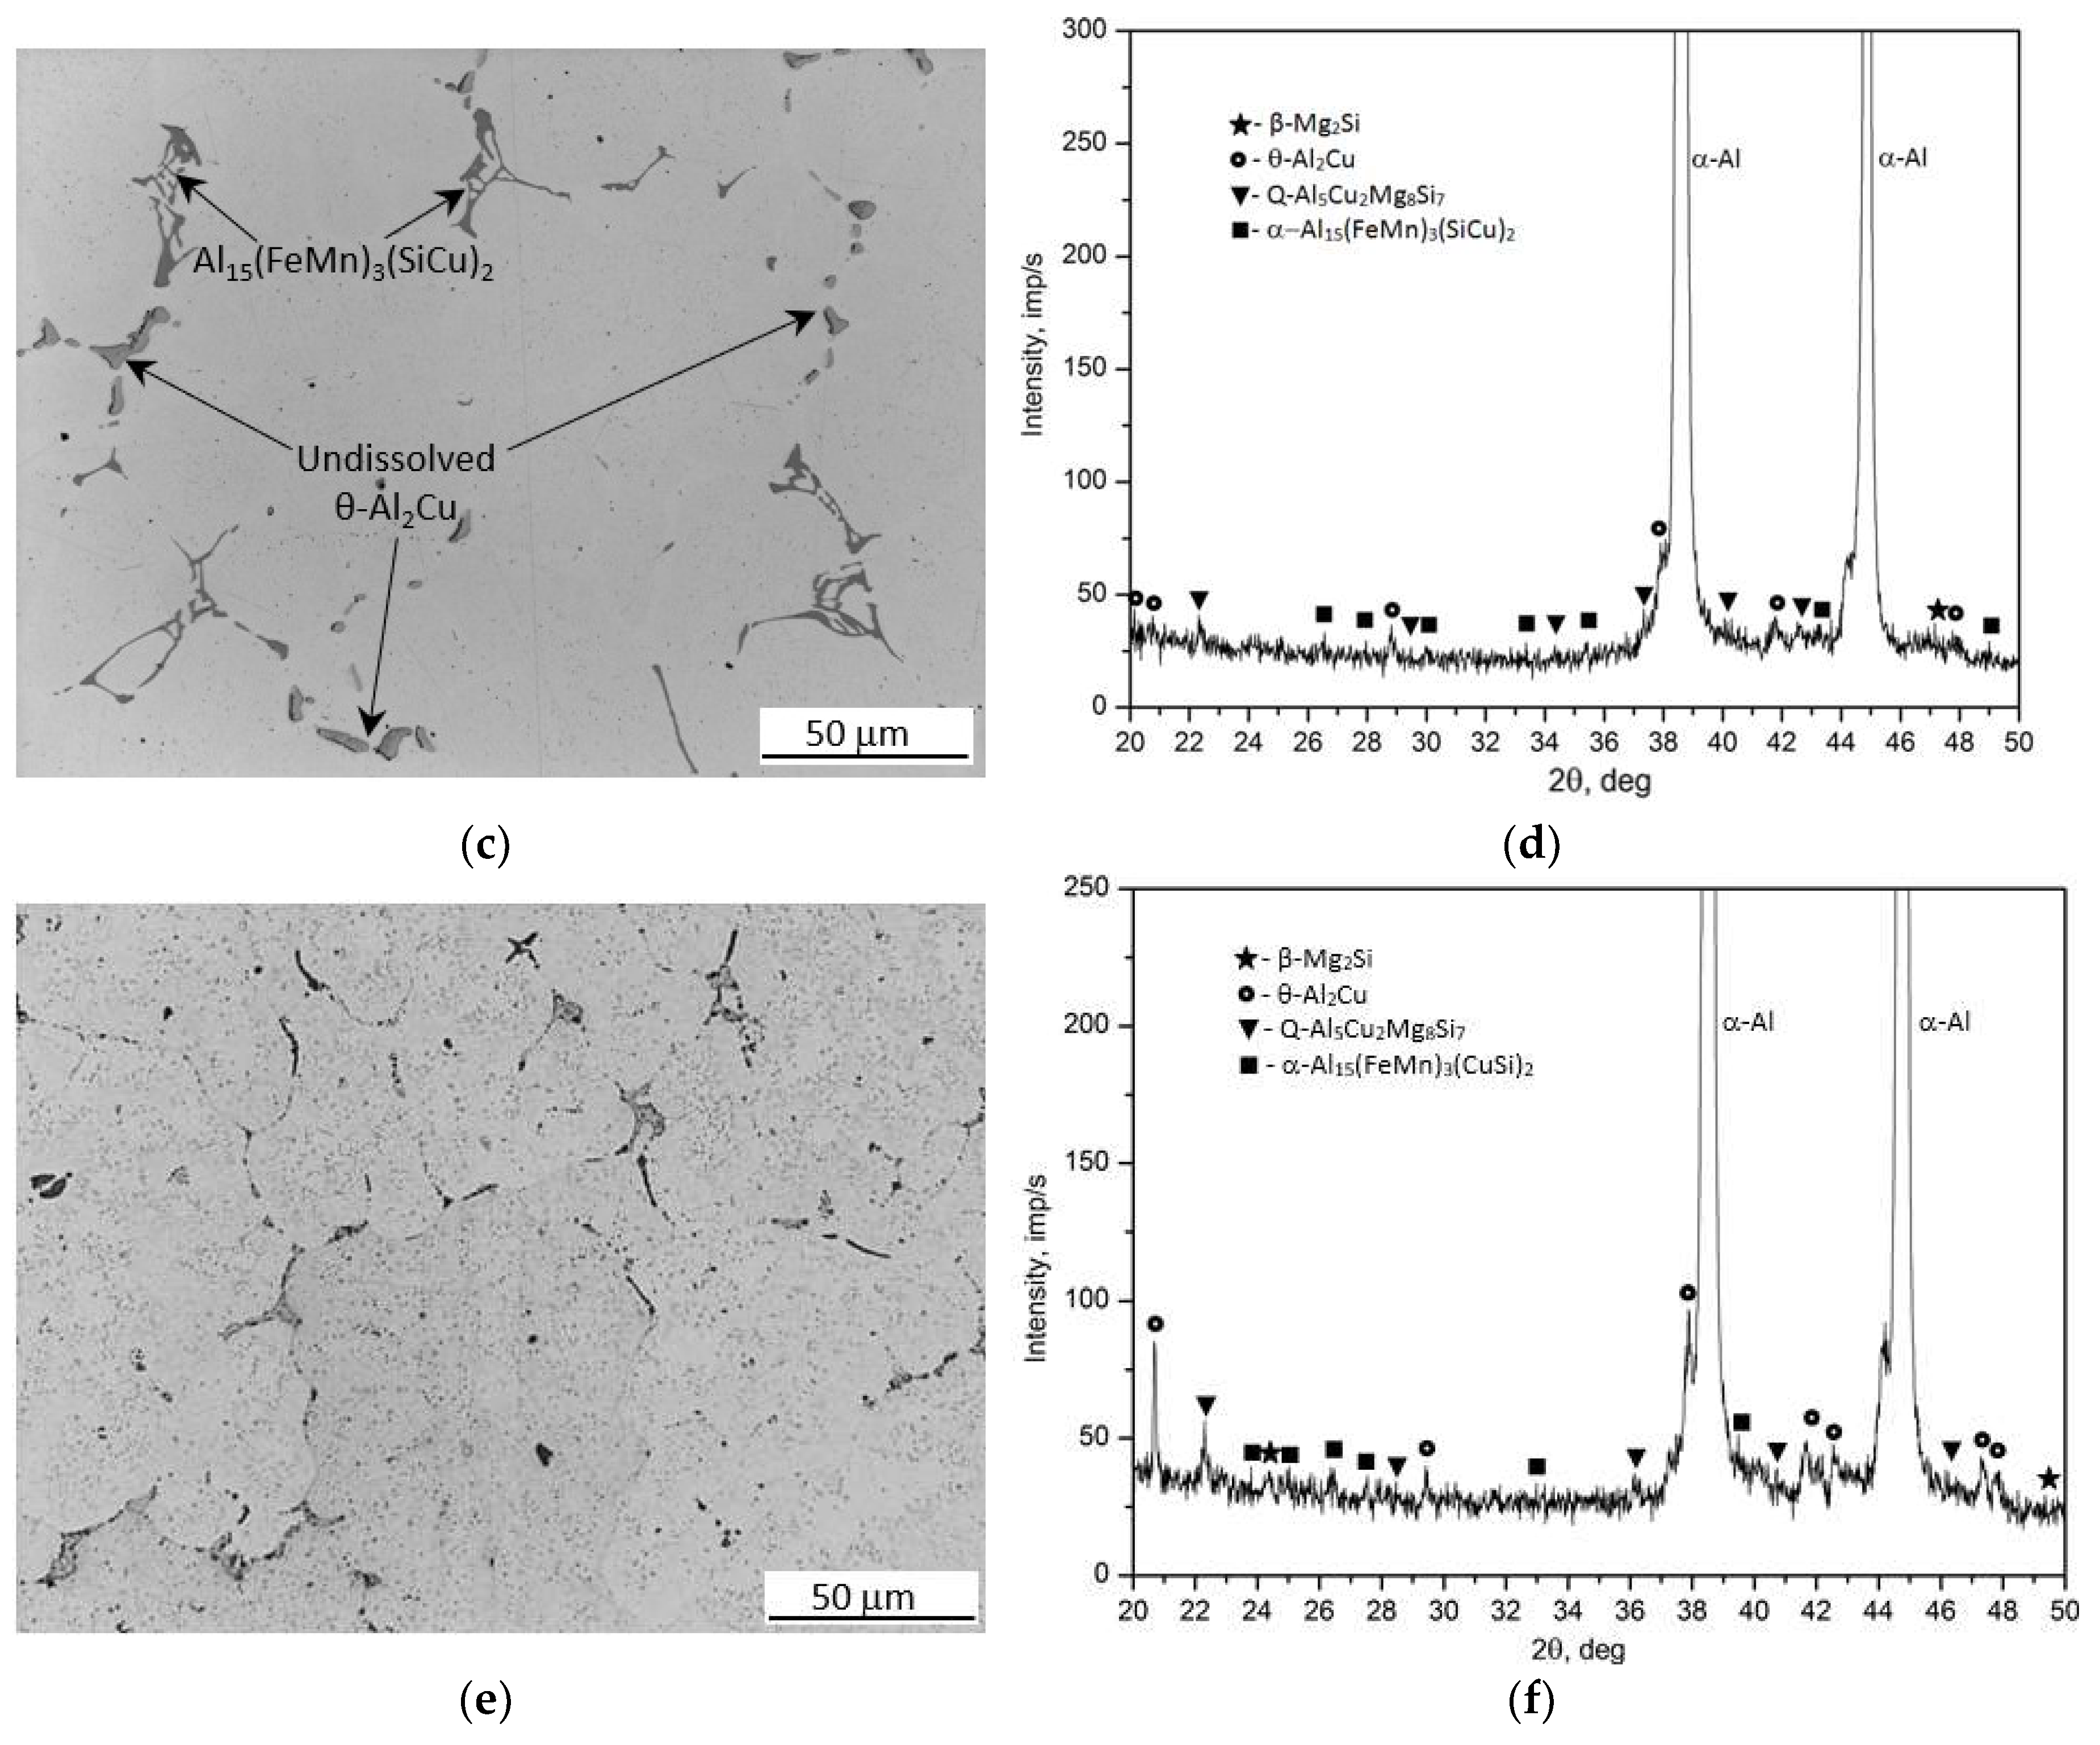
Figure 2.
Effect of ageing temperature and time on the change in the hardness of an alloy solution heat treated from 510°C and aged naturally and artificially.
Figure 2.
Effect of ageing temperature and time on the change in the hardness of an alloy solution heat treated from 510°C and aged naturally and artificially.
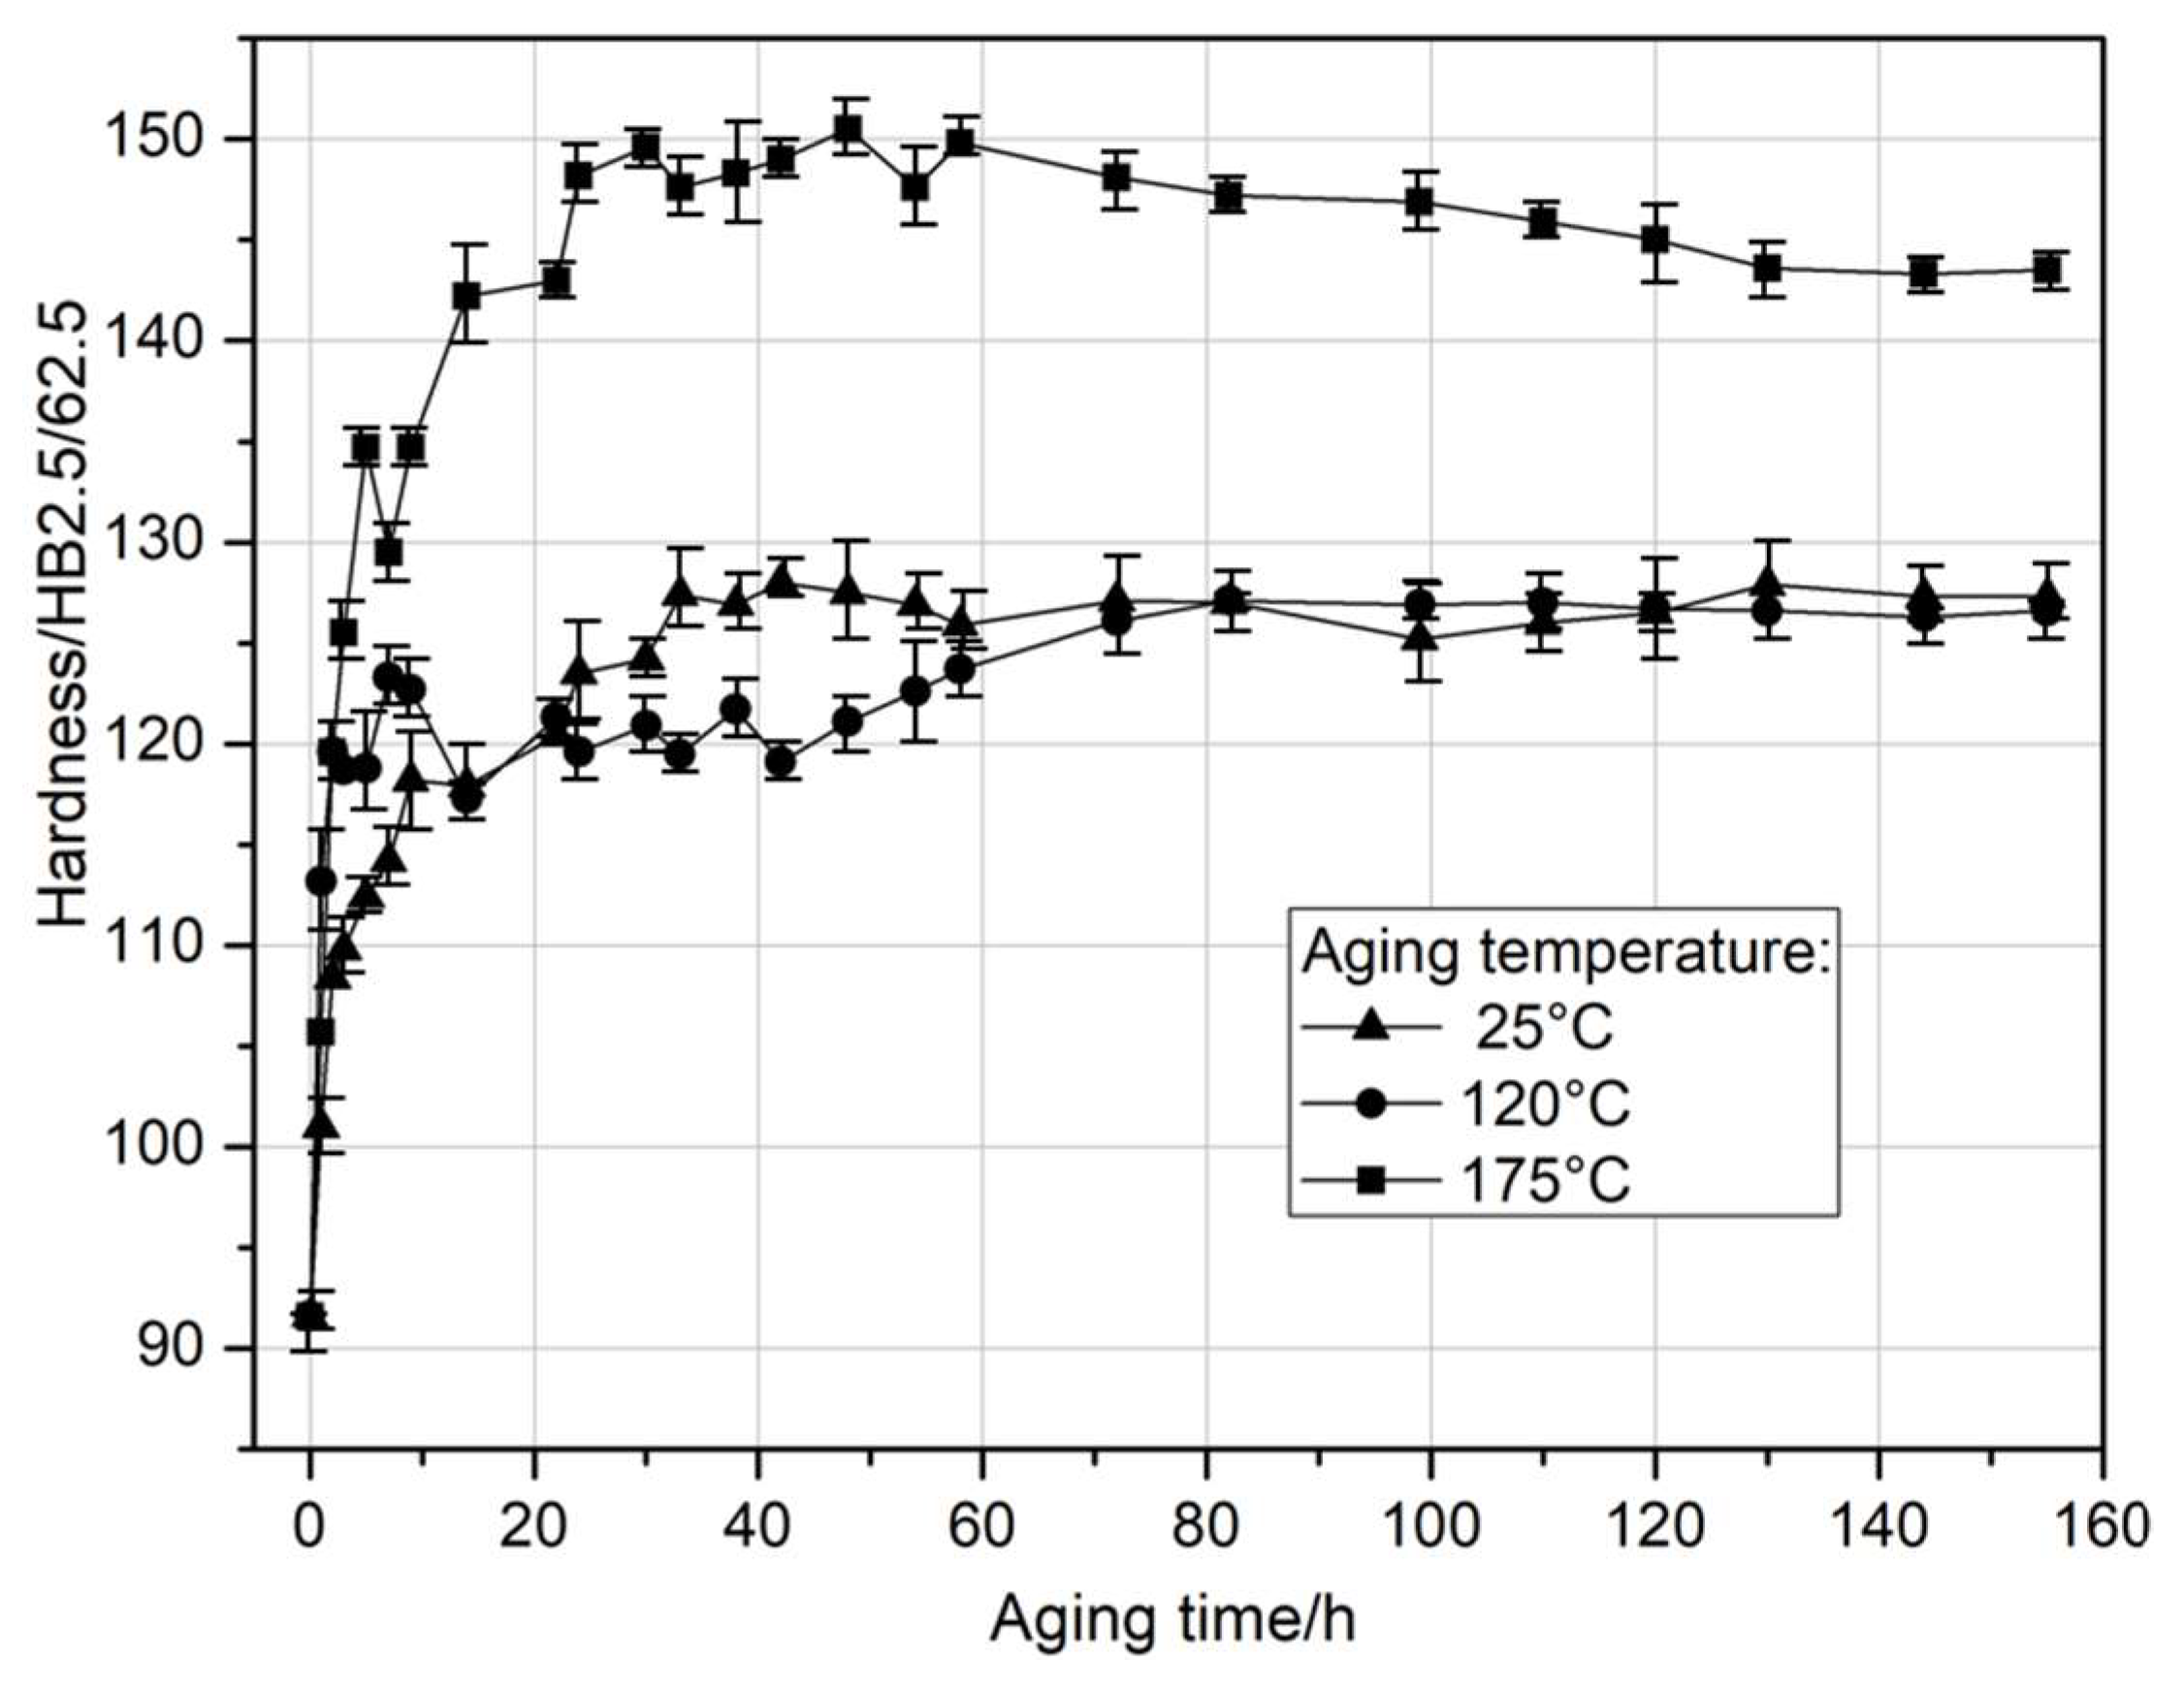
Figure 3.
Microstructure of aluminium alloy 2017A after aging: a) at temperature of 25°C for 40h and b) 175°C for 65h.
Figure 3.
Microstructure of aluminium alloy 2017A after aging: a) at temperature of 25°C for 40h and b) 175°C for 65h.
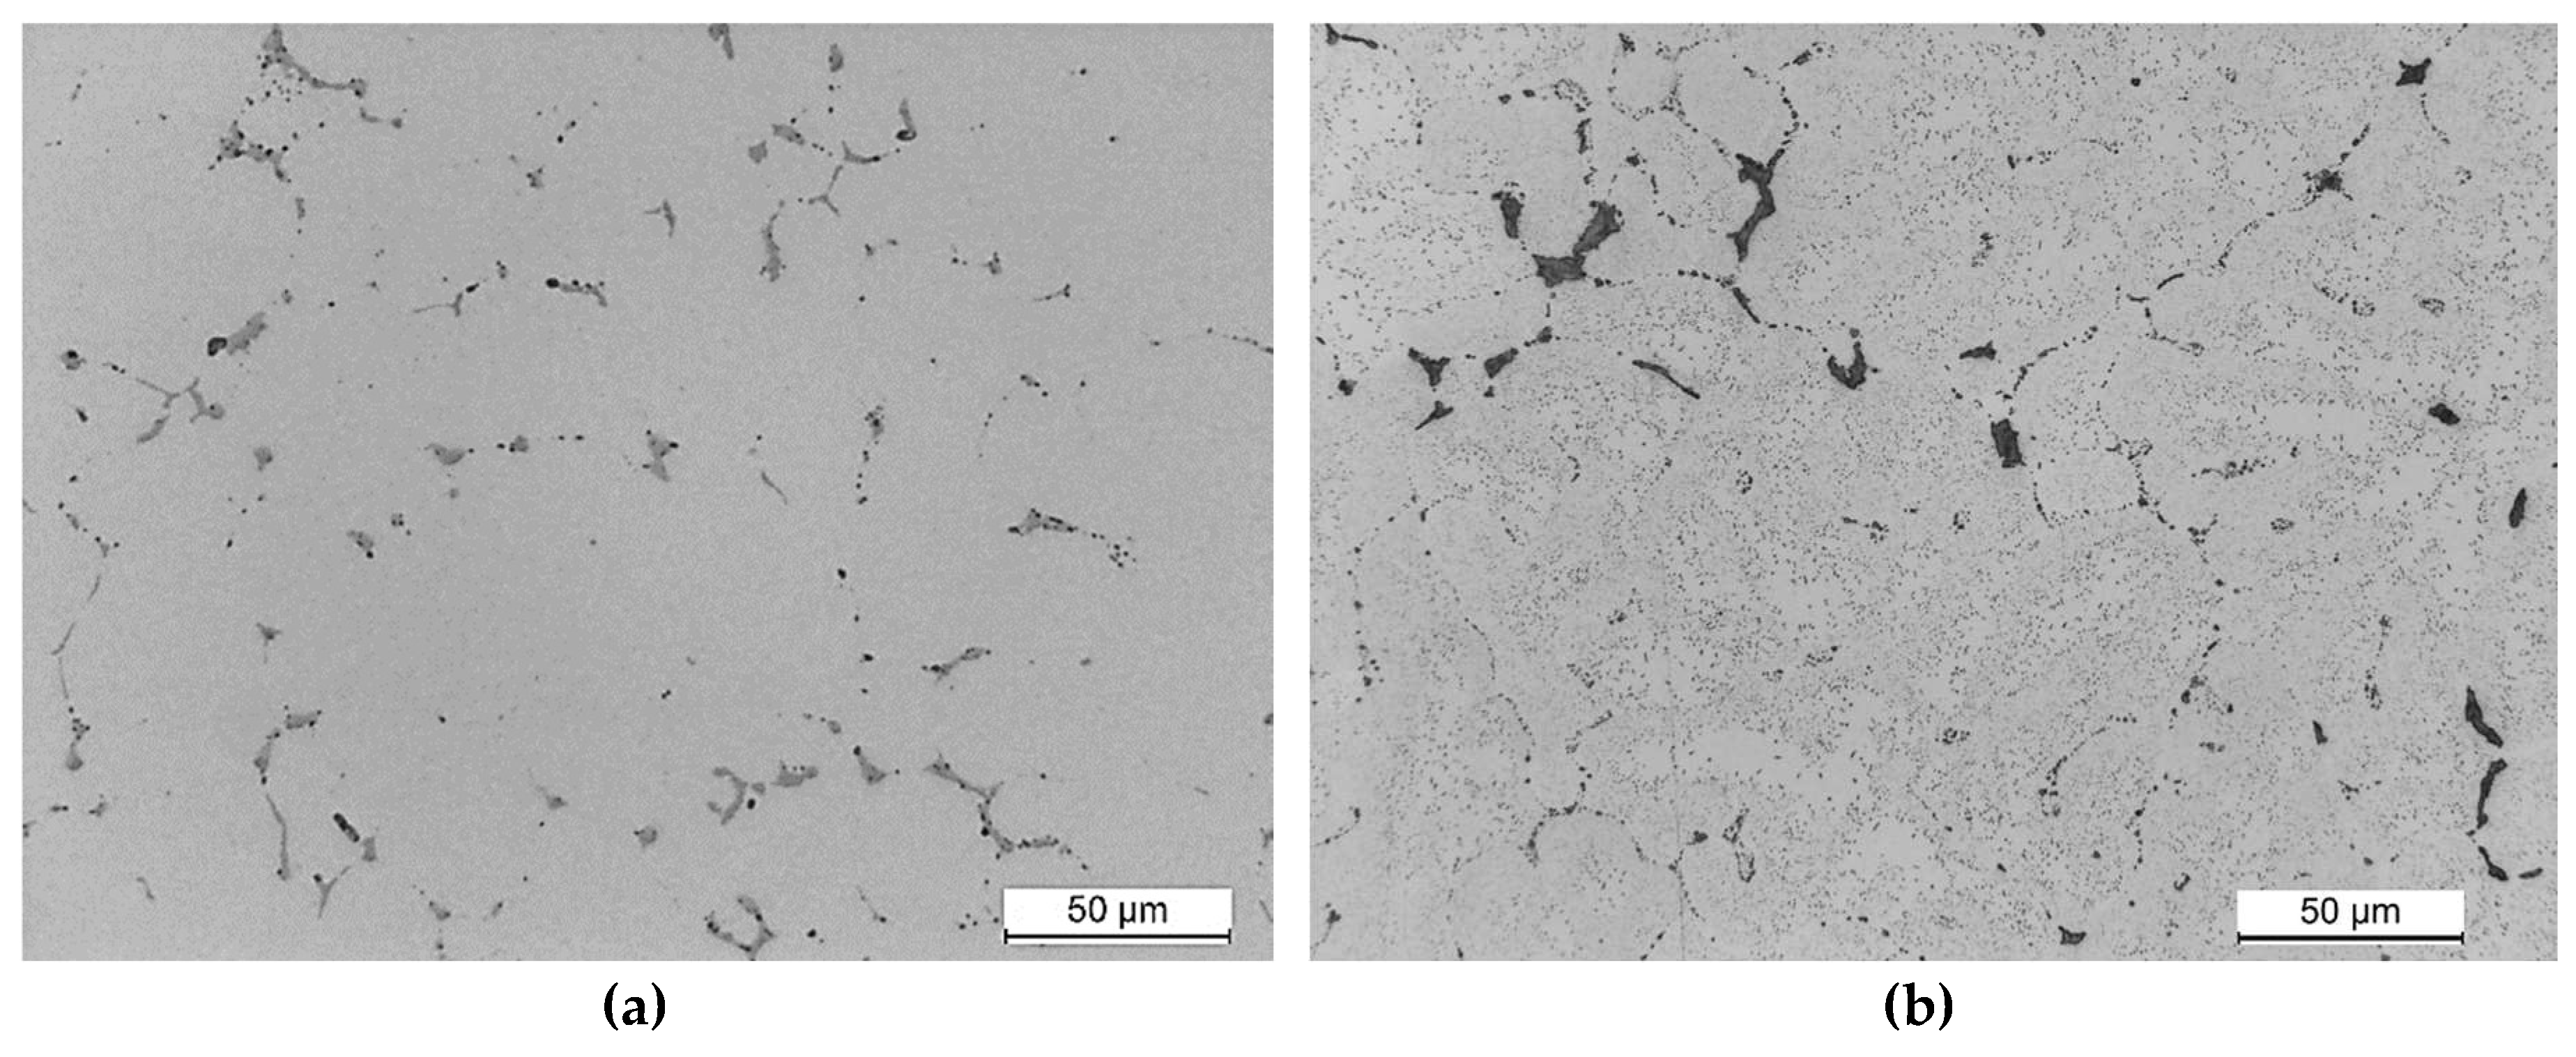
Figure 4.
Microstructure of 2017A alloy after ageing at temperature 175°C for a) 5h and b,c) 22h shows precipitates of strengthening phases θ’, θ’ and Q’.
Figure 4.
Microstructure of 2017A alloy after ageing at temperature 175°C for a) 5h and b,c) 22h shows precipitates of strengthening phases θ’, θ’ and Q’.
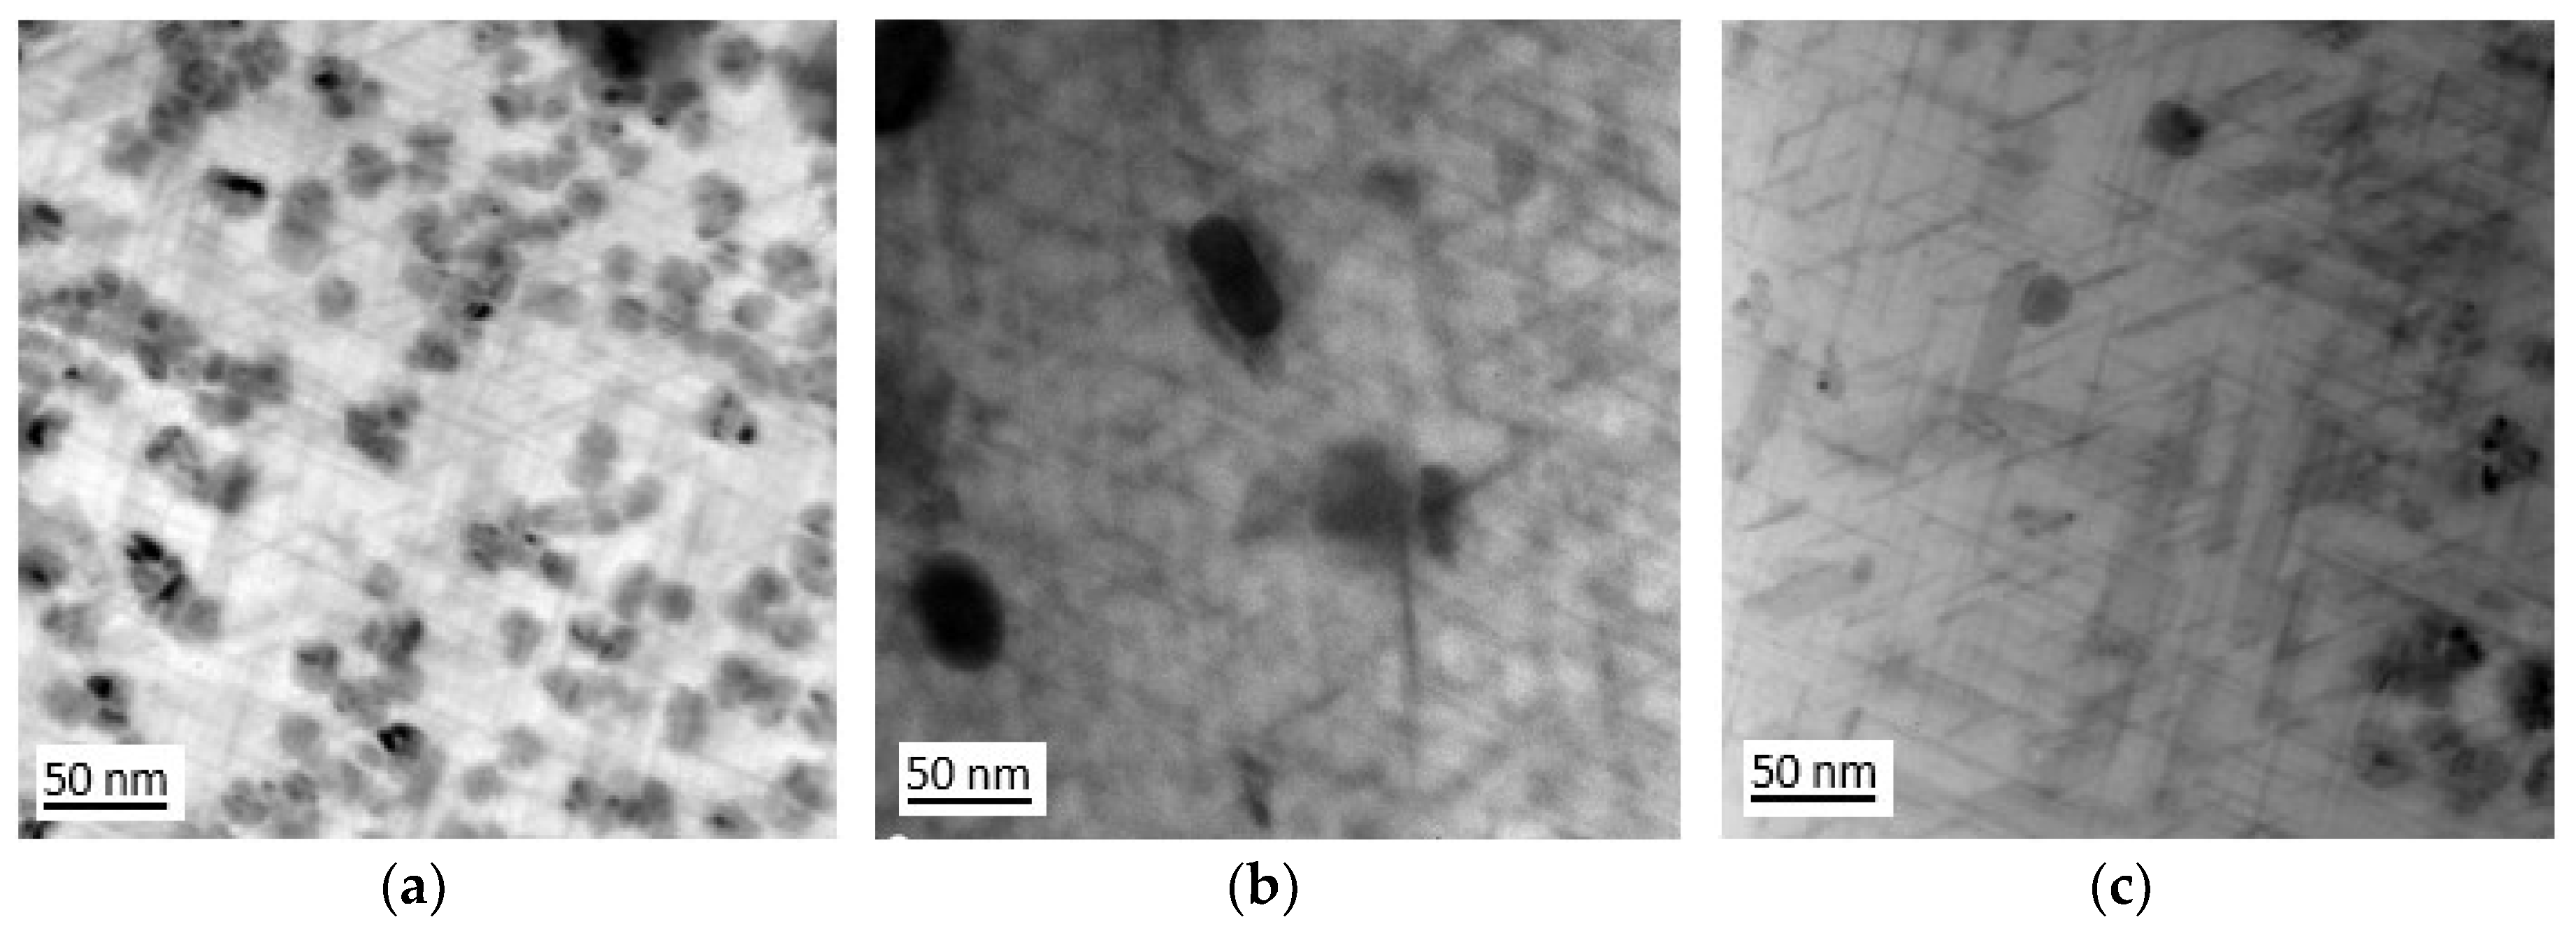
Figure 5.
DSC curve of as-quenched specimen of 2017A alloy solution heat treated 2017A alloy, heated up to 700°C with a heating rate of 10°C min-1.
Figure 5.
DSC curve of as-quenched specimen of 2017A alloy solution heat treated 2017A alloy, heated up to 700°C with a heating rate of 10°C min-1.
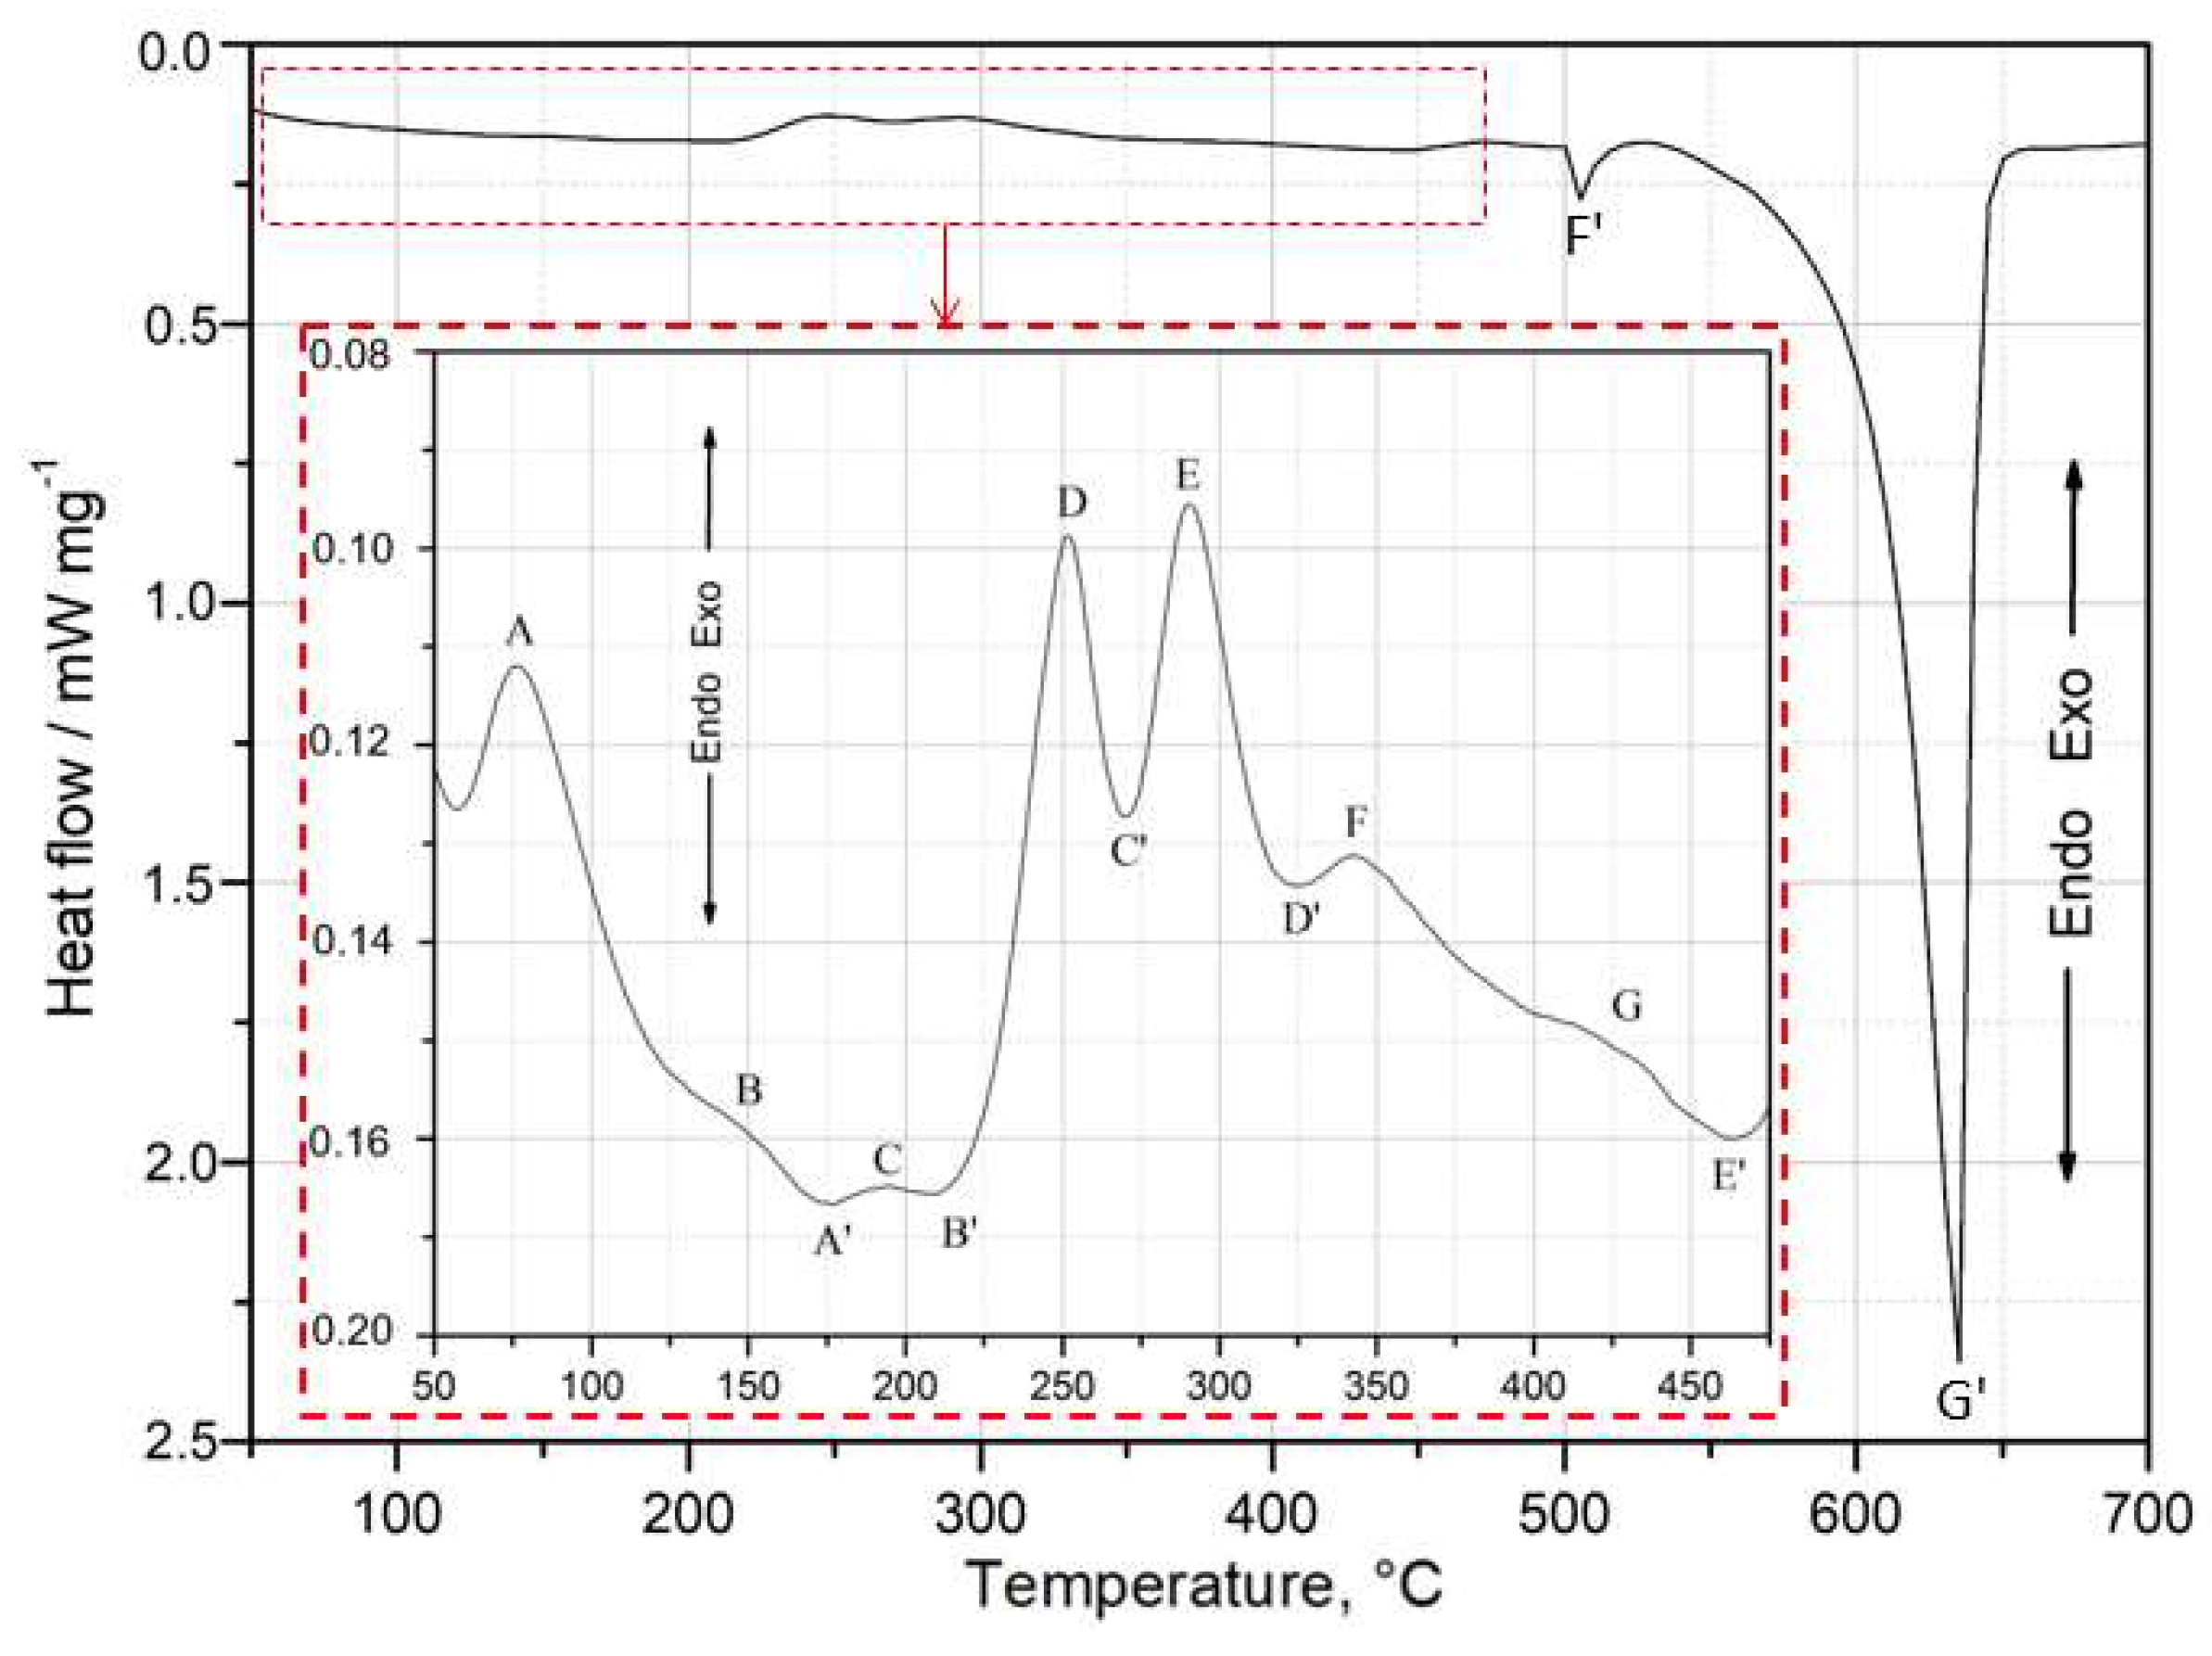
Figure 6.
DSC curve showing the change of heat flow vs. temperature during heating of solution treated samples at different heating rates
Figure 6.
DSC curve showing the change of heat flow vs. temperature during heating of solution treated samples at different heating rates
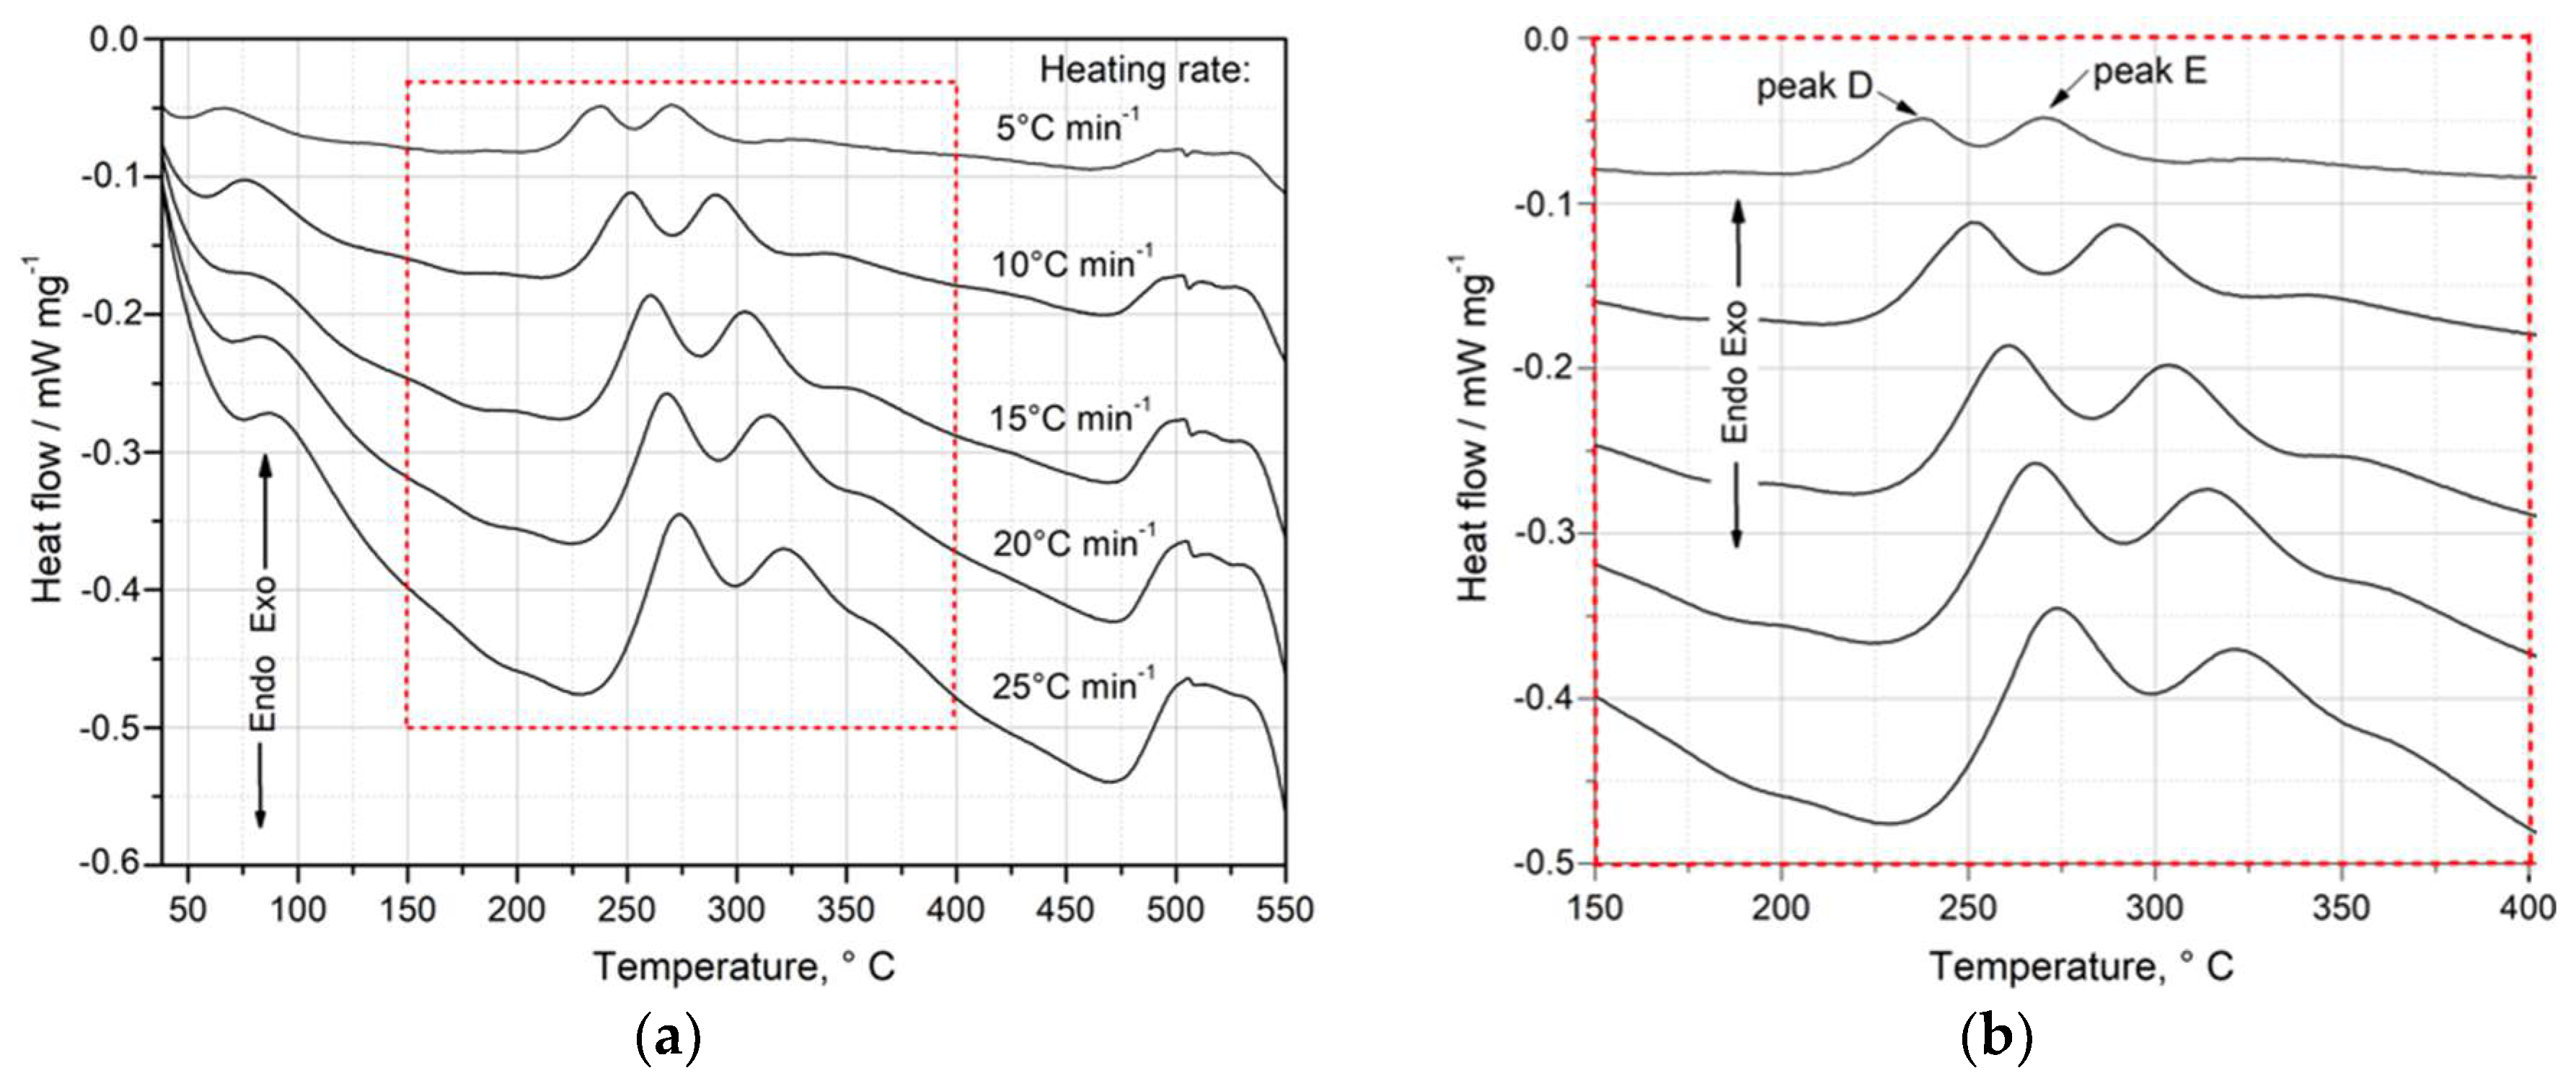
Figure 7.
Effect of heating rate on the time to appearance of exothermic peaks associated with precipitation of metastable: a) clusters, GP1, GP2 zones and b) transition phases θ”, θ’, Q’ and stable phase θ-Al2Cu.
Figure 7.
Effect of heating rate on the time to appearance of exothermic peaks associated with precipitation of metastable: a) clusters, GP1, GP2 zones and b) transition phases θ”, θ’, Q’ and stable phase θ-Al2Cu.
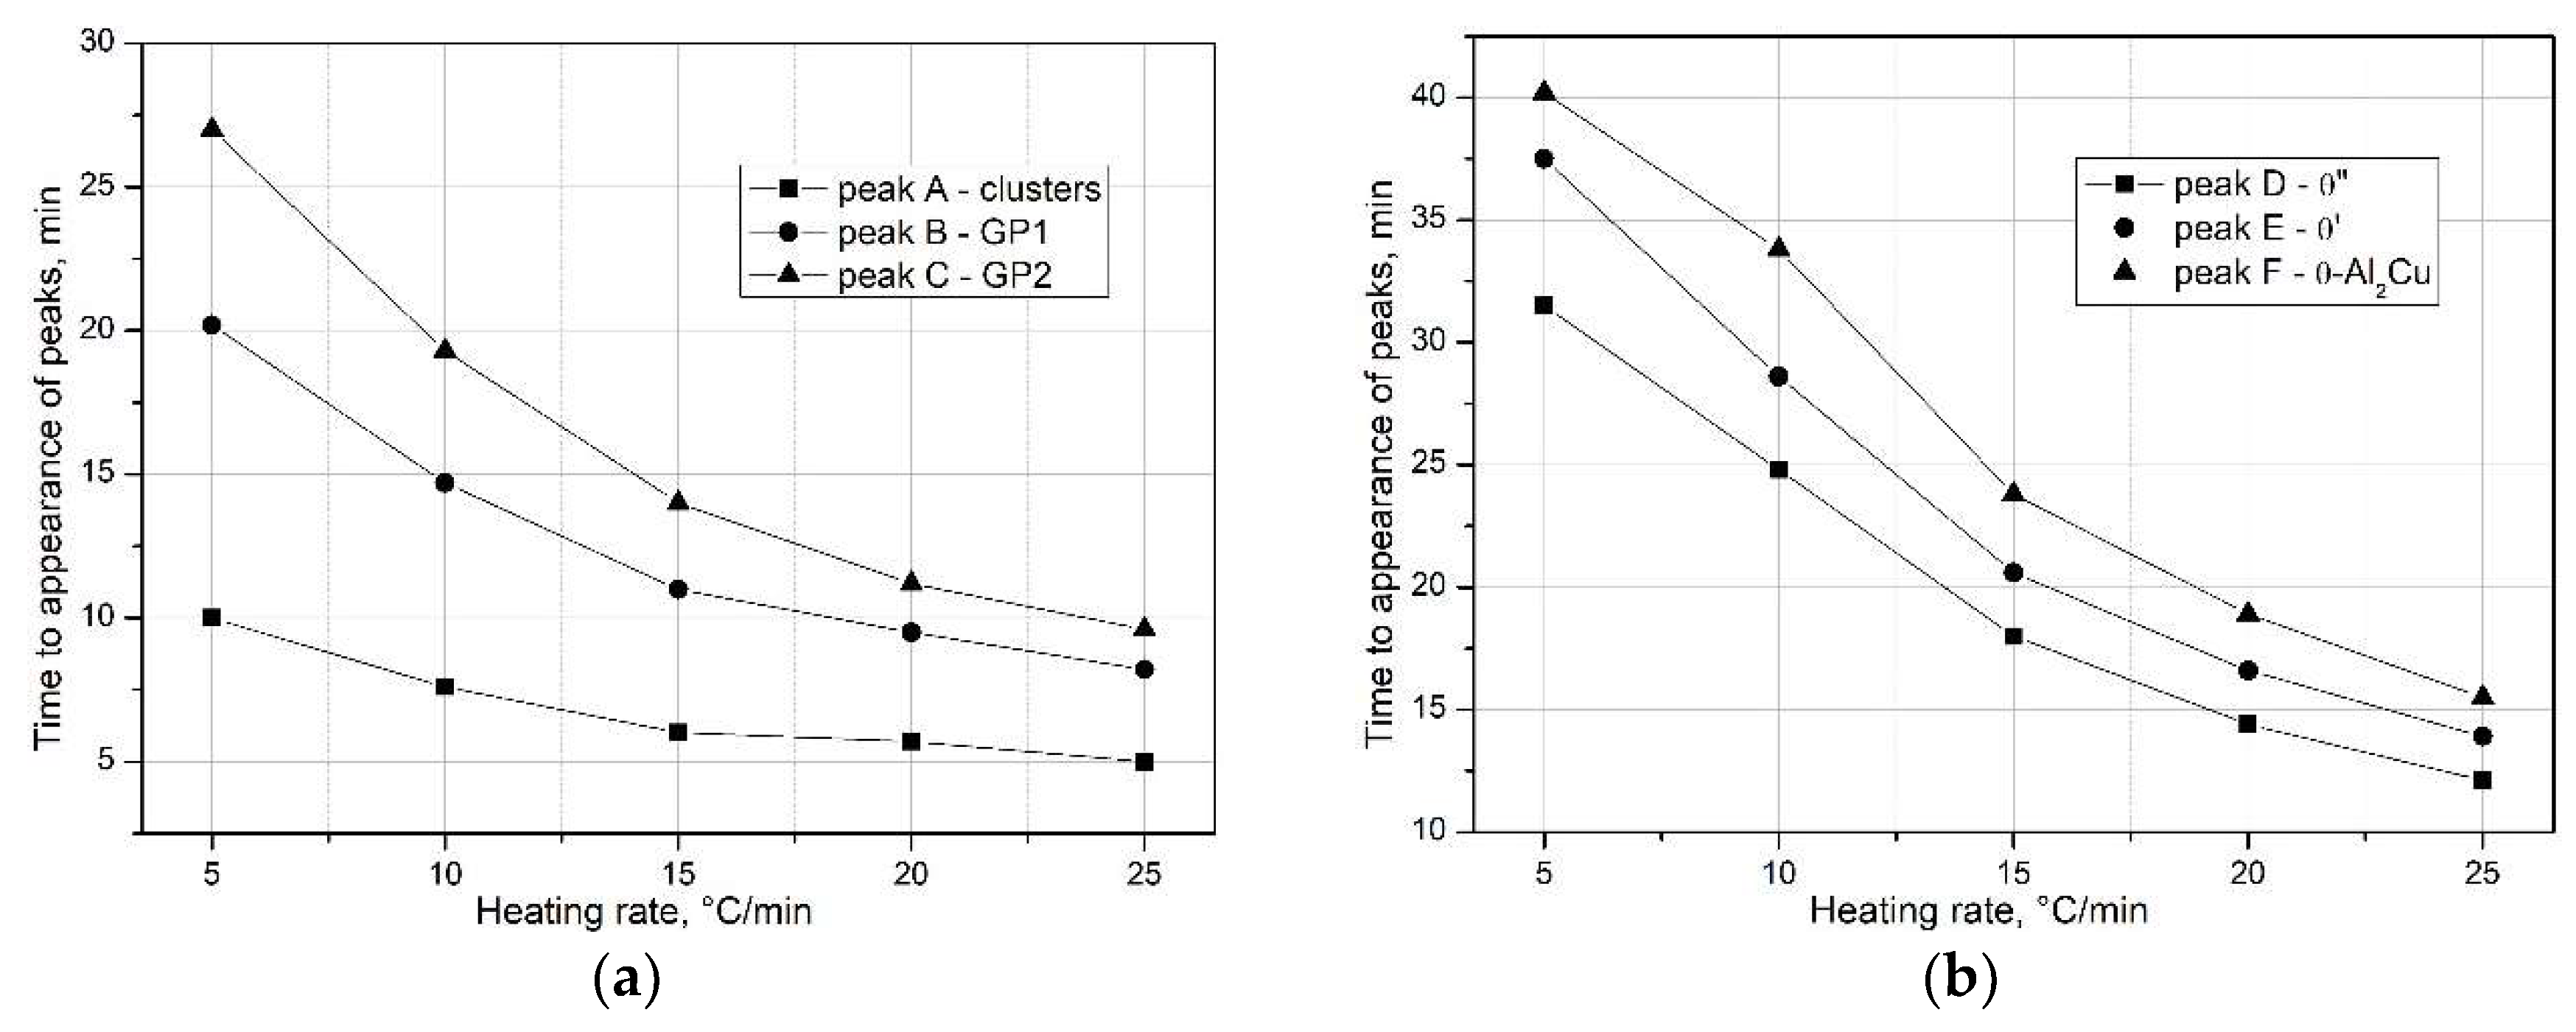
Figure 8.
Effect of heating rate on the temperature to precipitation of: a) clusters, GP1, GP2 metastable transition phases θ”, θ’, Q’ and stable θ-Al2Cu phase.
Figure 8.
Effect of heating rate on the temperature to precipitation of: a) clusters, GP1, GP2 metastable transition phases θ”, θ’, Q’ and stable θ-Al2Cu phase.
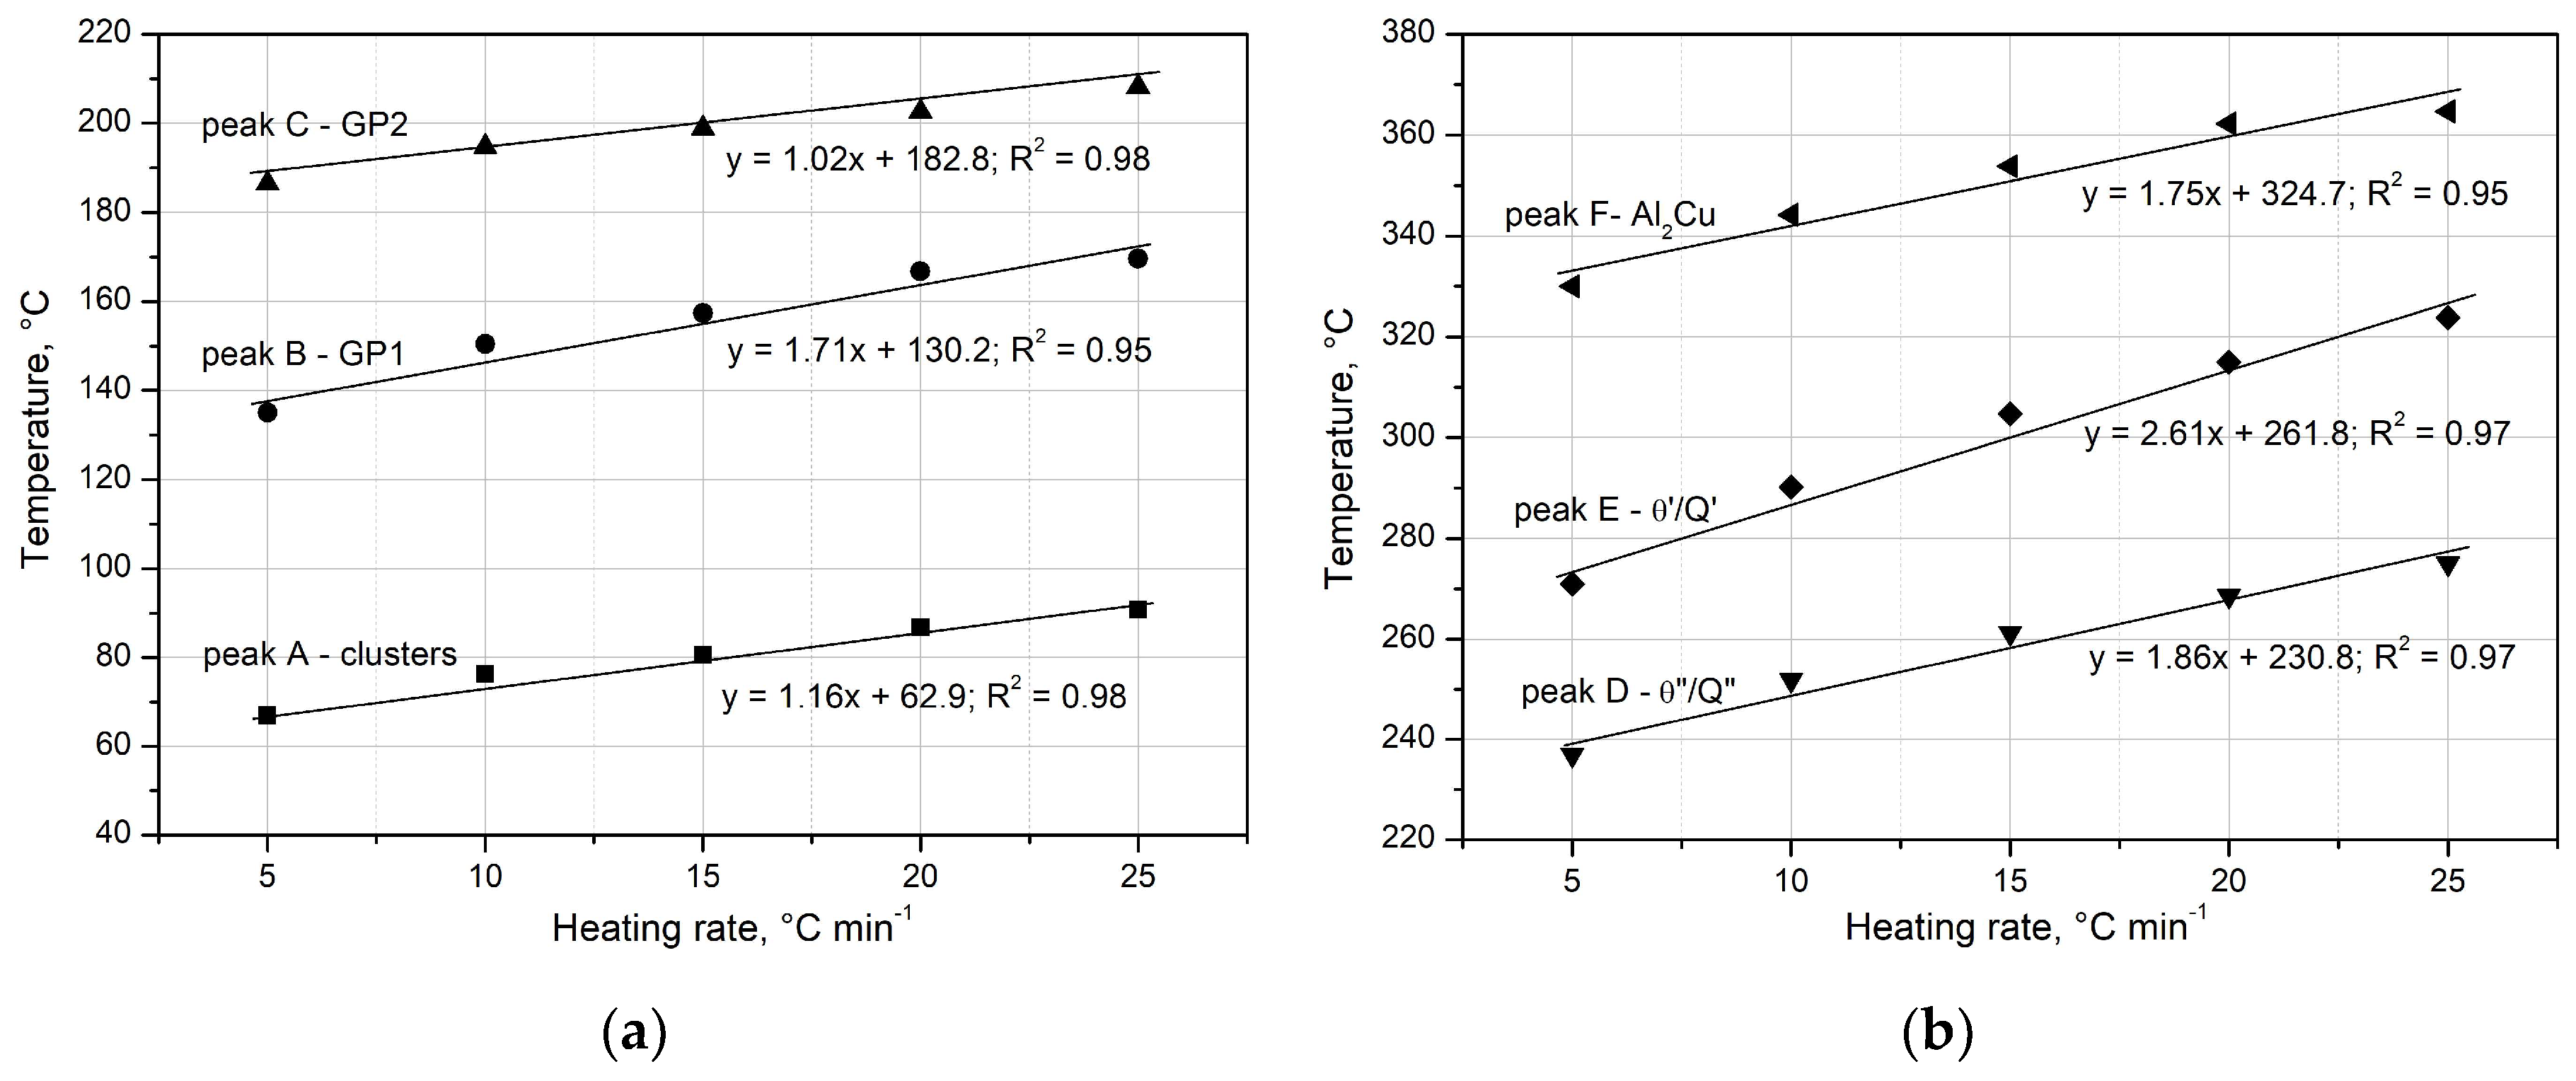
Figure 9.
Kissinger’s graphs for the relationship of ln(q/T2) vs 1000/RT related to the observed heat effects associated with the precipitation processes in the 2017A aluminium alloy.
Figure 9.
Kissinger’s graphs for the relationship of ln(q/T2) vs 1000/RT related to the observed heat effects associated with the precipitation processes in the 2017A aluminium alloy.
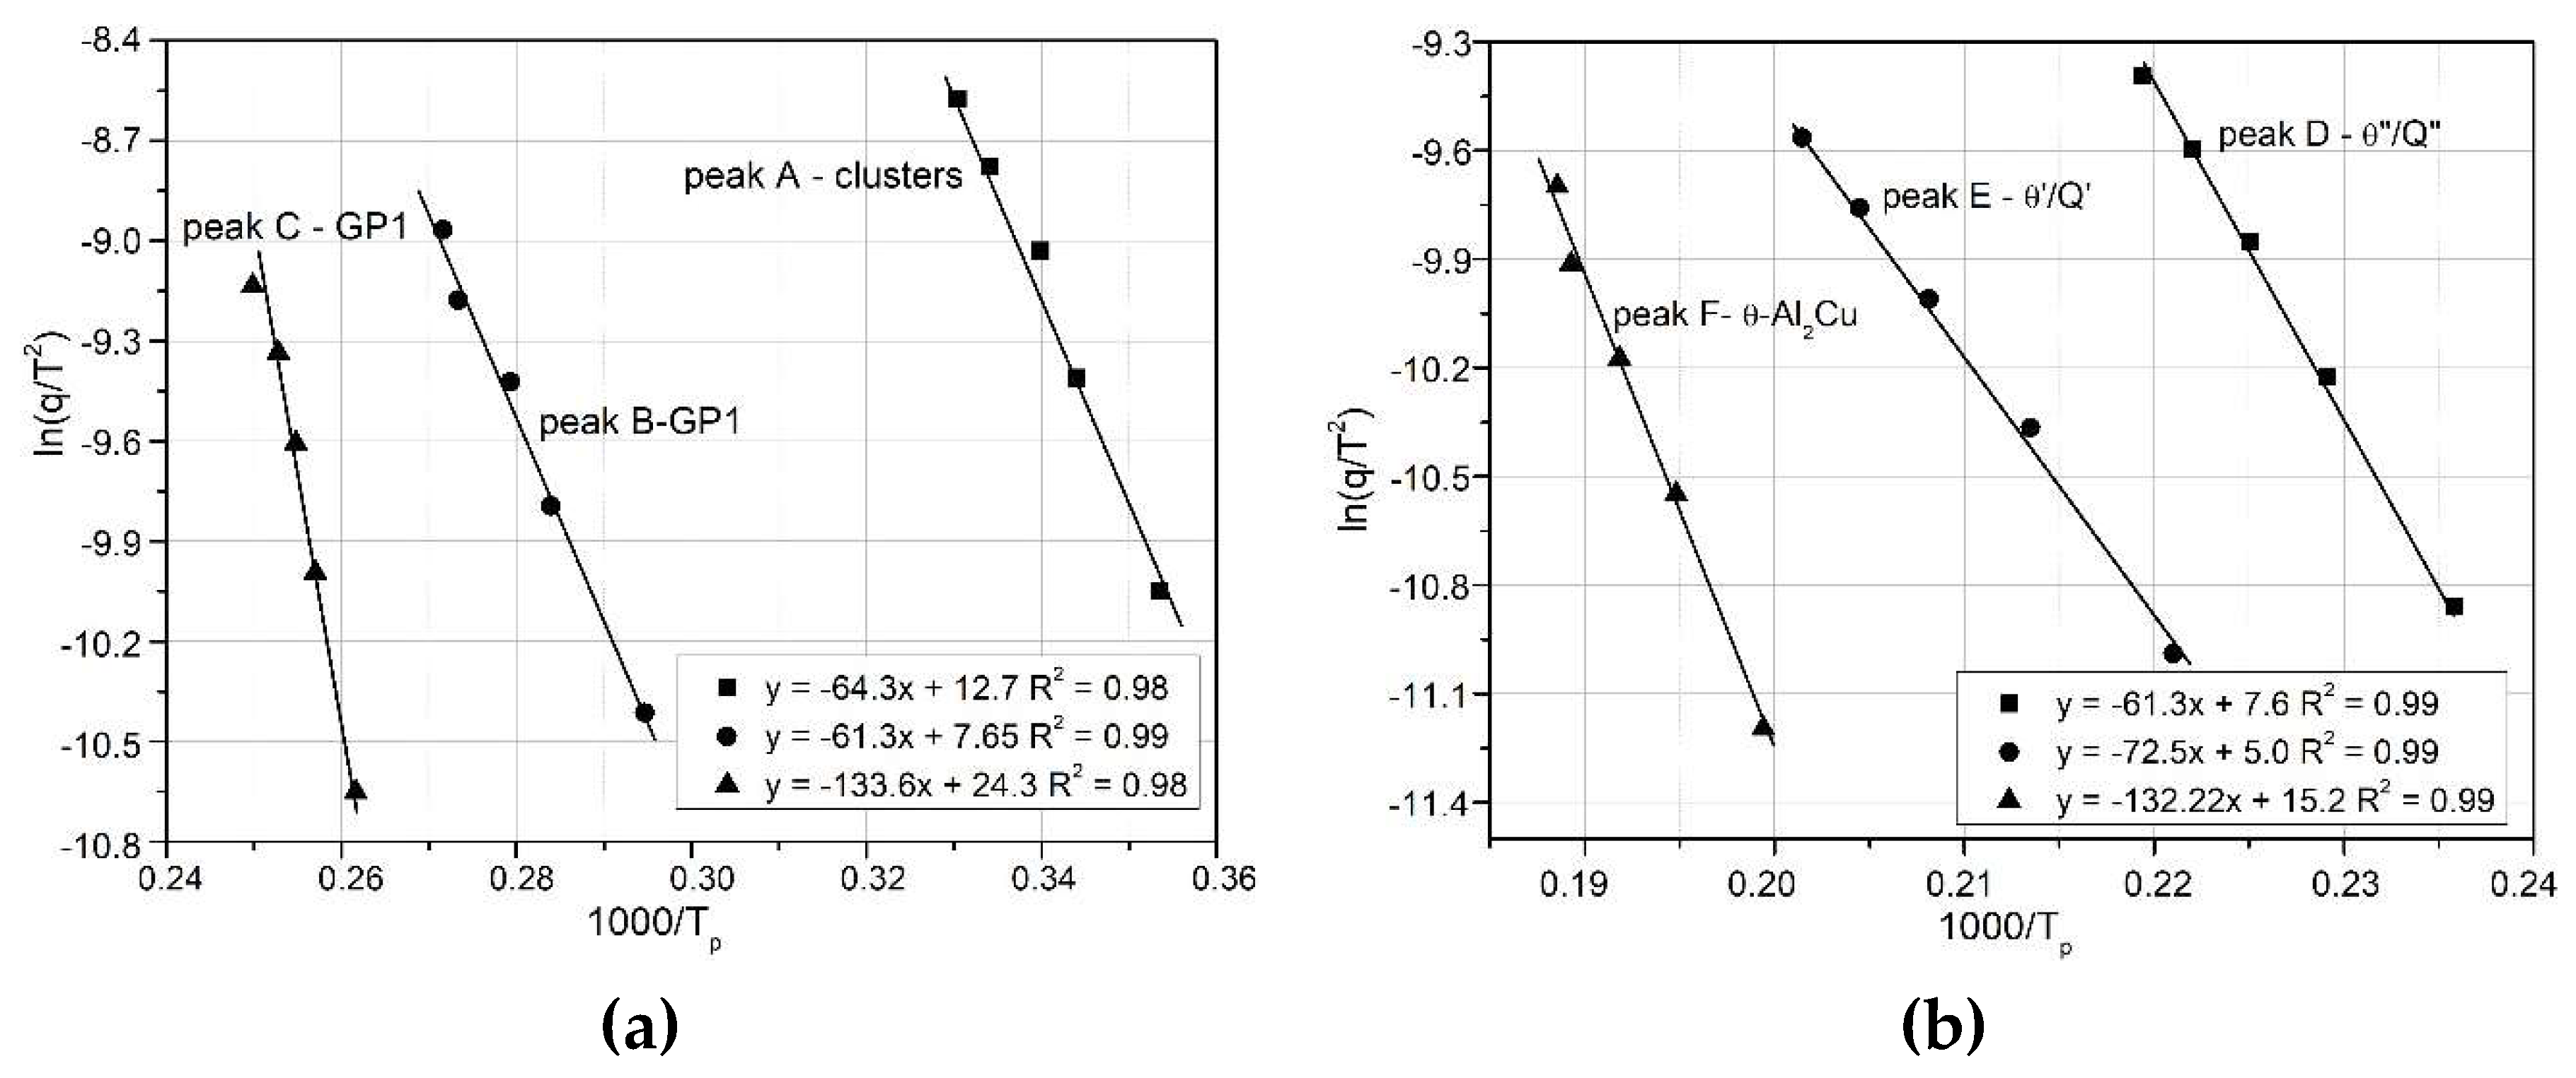
Figure 10.
Boswell’s graphs for the relationship of ln(q/T) vs 1000/RT related to the observed heat effects associated with the precipitation processes phases in the 2017A aluminium alloy.
Figure 10.
Boswell’s graphs for the relationship of ln(q/T) vs 1000/RT related to the observed heat effects associated with the precipitation processes phases in the 2017A aluminium alloy.
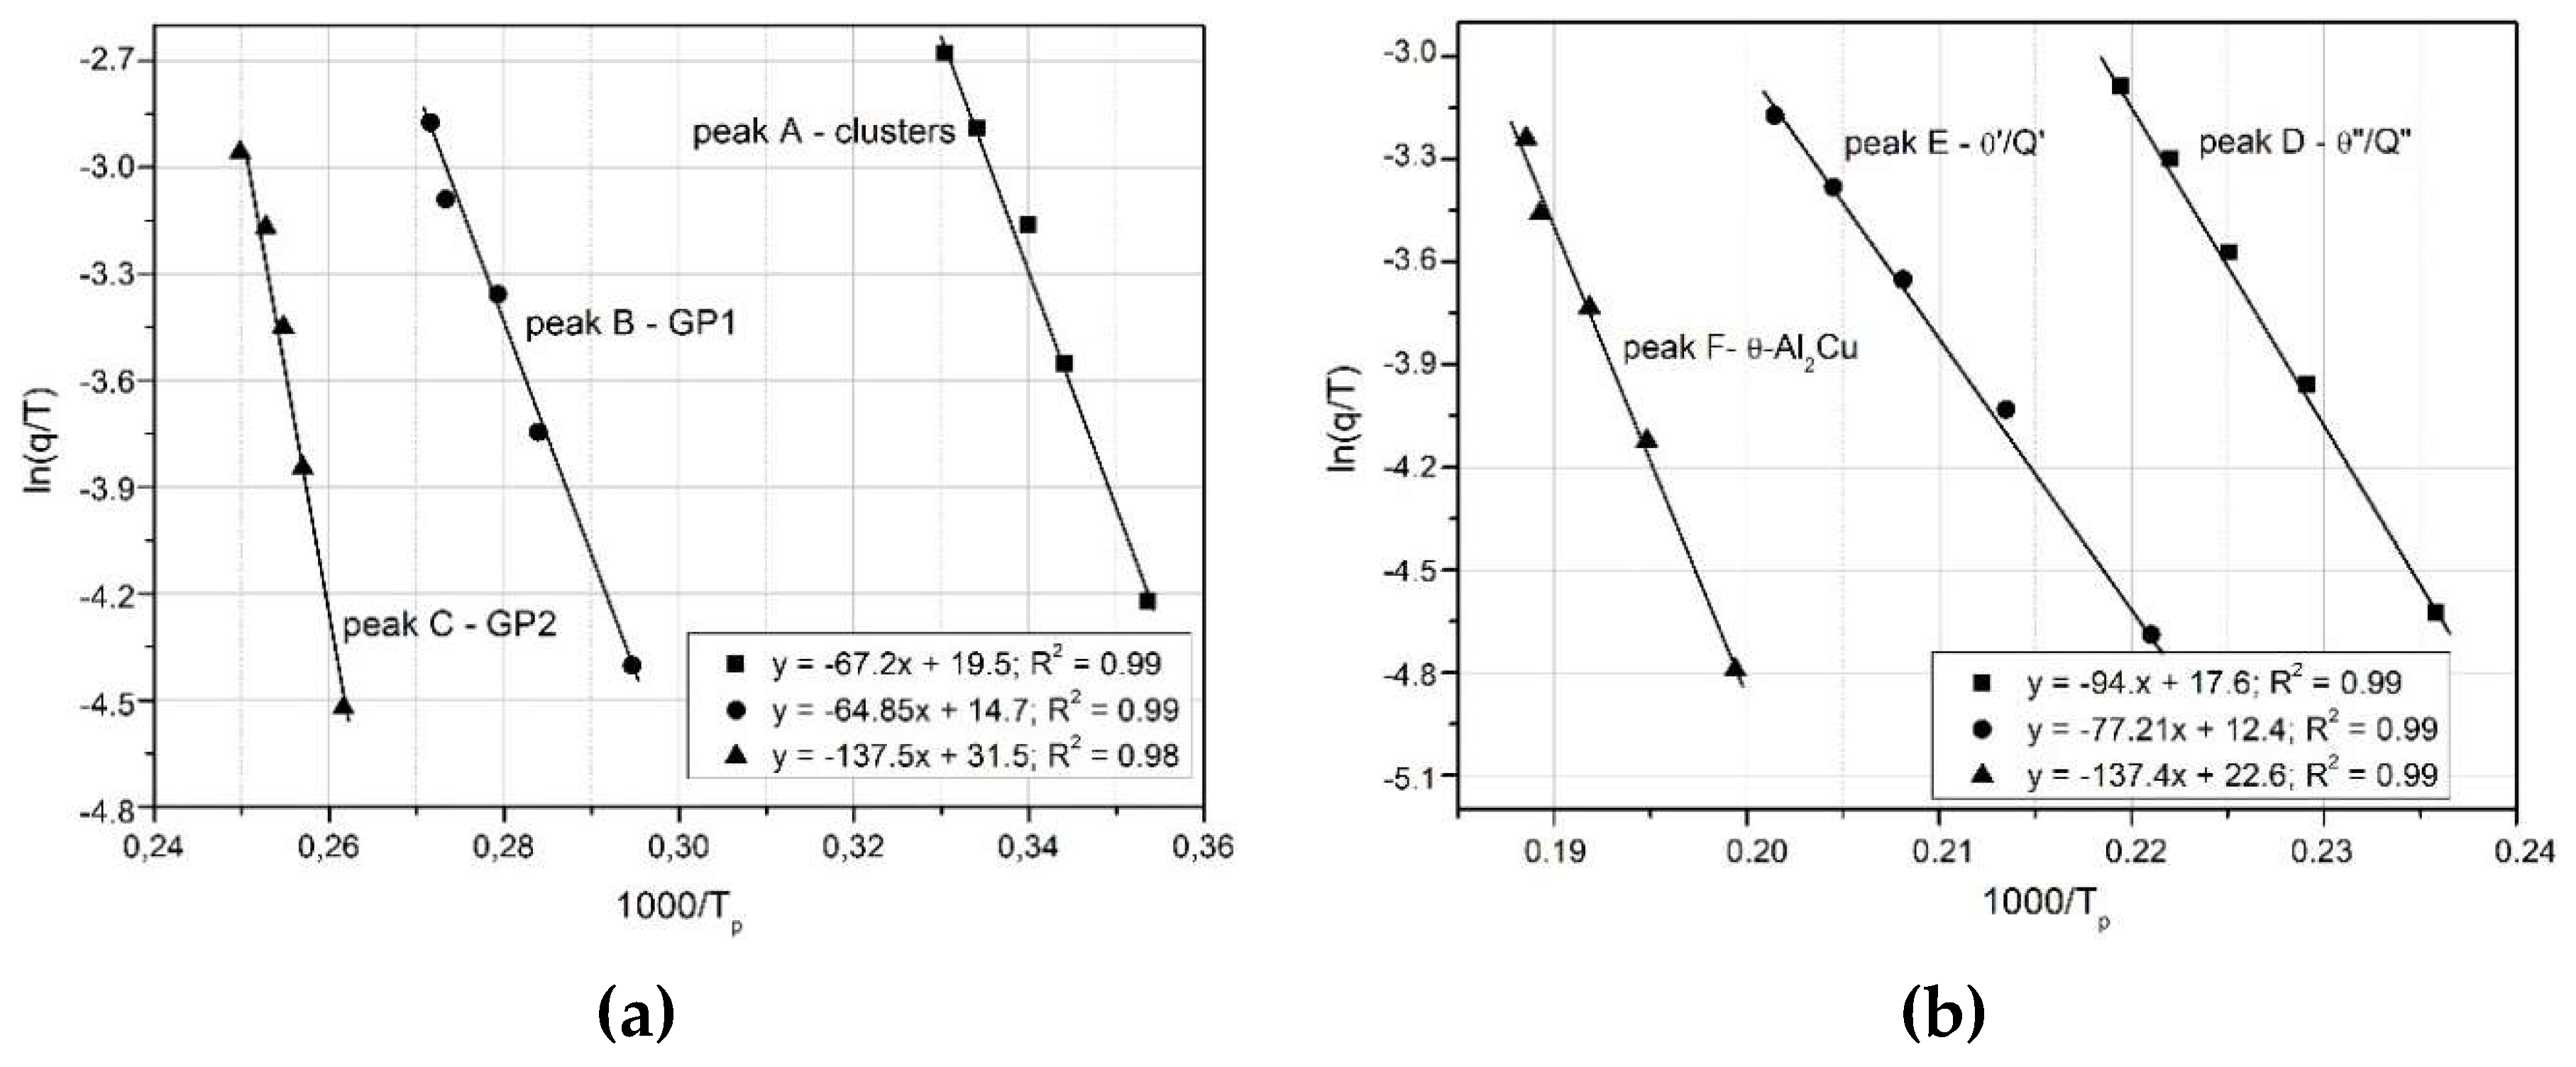
Figure 11.
Ozawa’s graphs for the relationship of ln(q) vs 1000/RT related to the observed heat effects associated with the precipitation processes of phases in the 2017A aluminium alloy.
Figure 11.
Ozawa’s graphs for the relationship of ln(q) vs 1000/RT related to the observed heat effects associated with the precipitation processes of phases in the 2017A aluminium alloy.
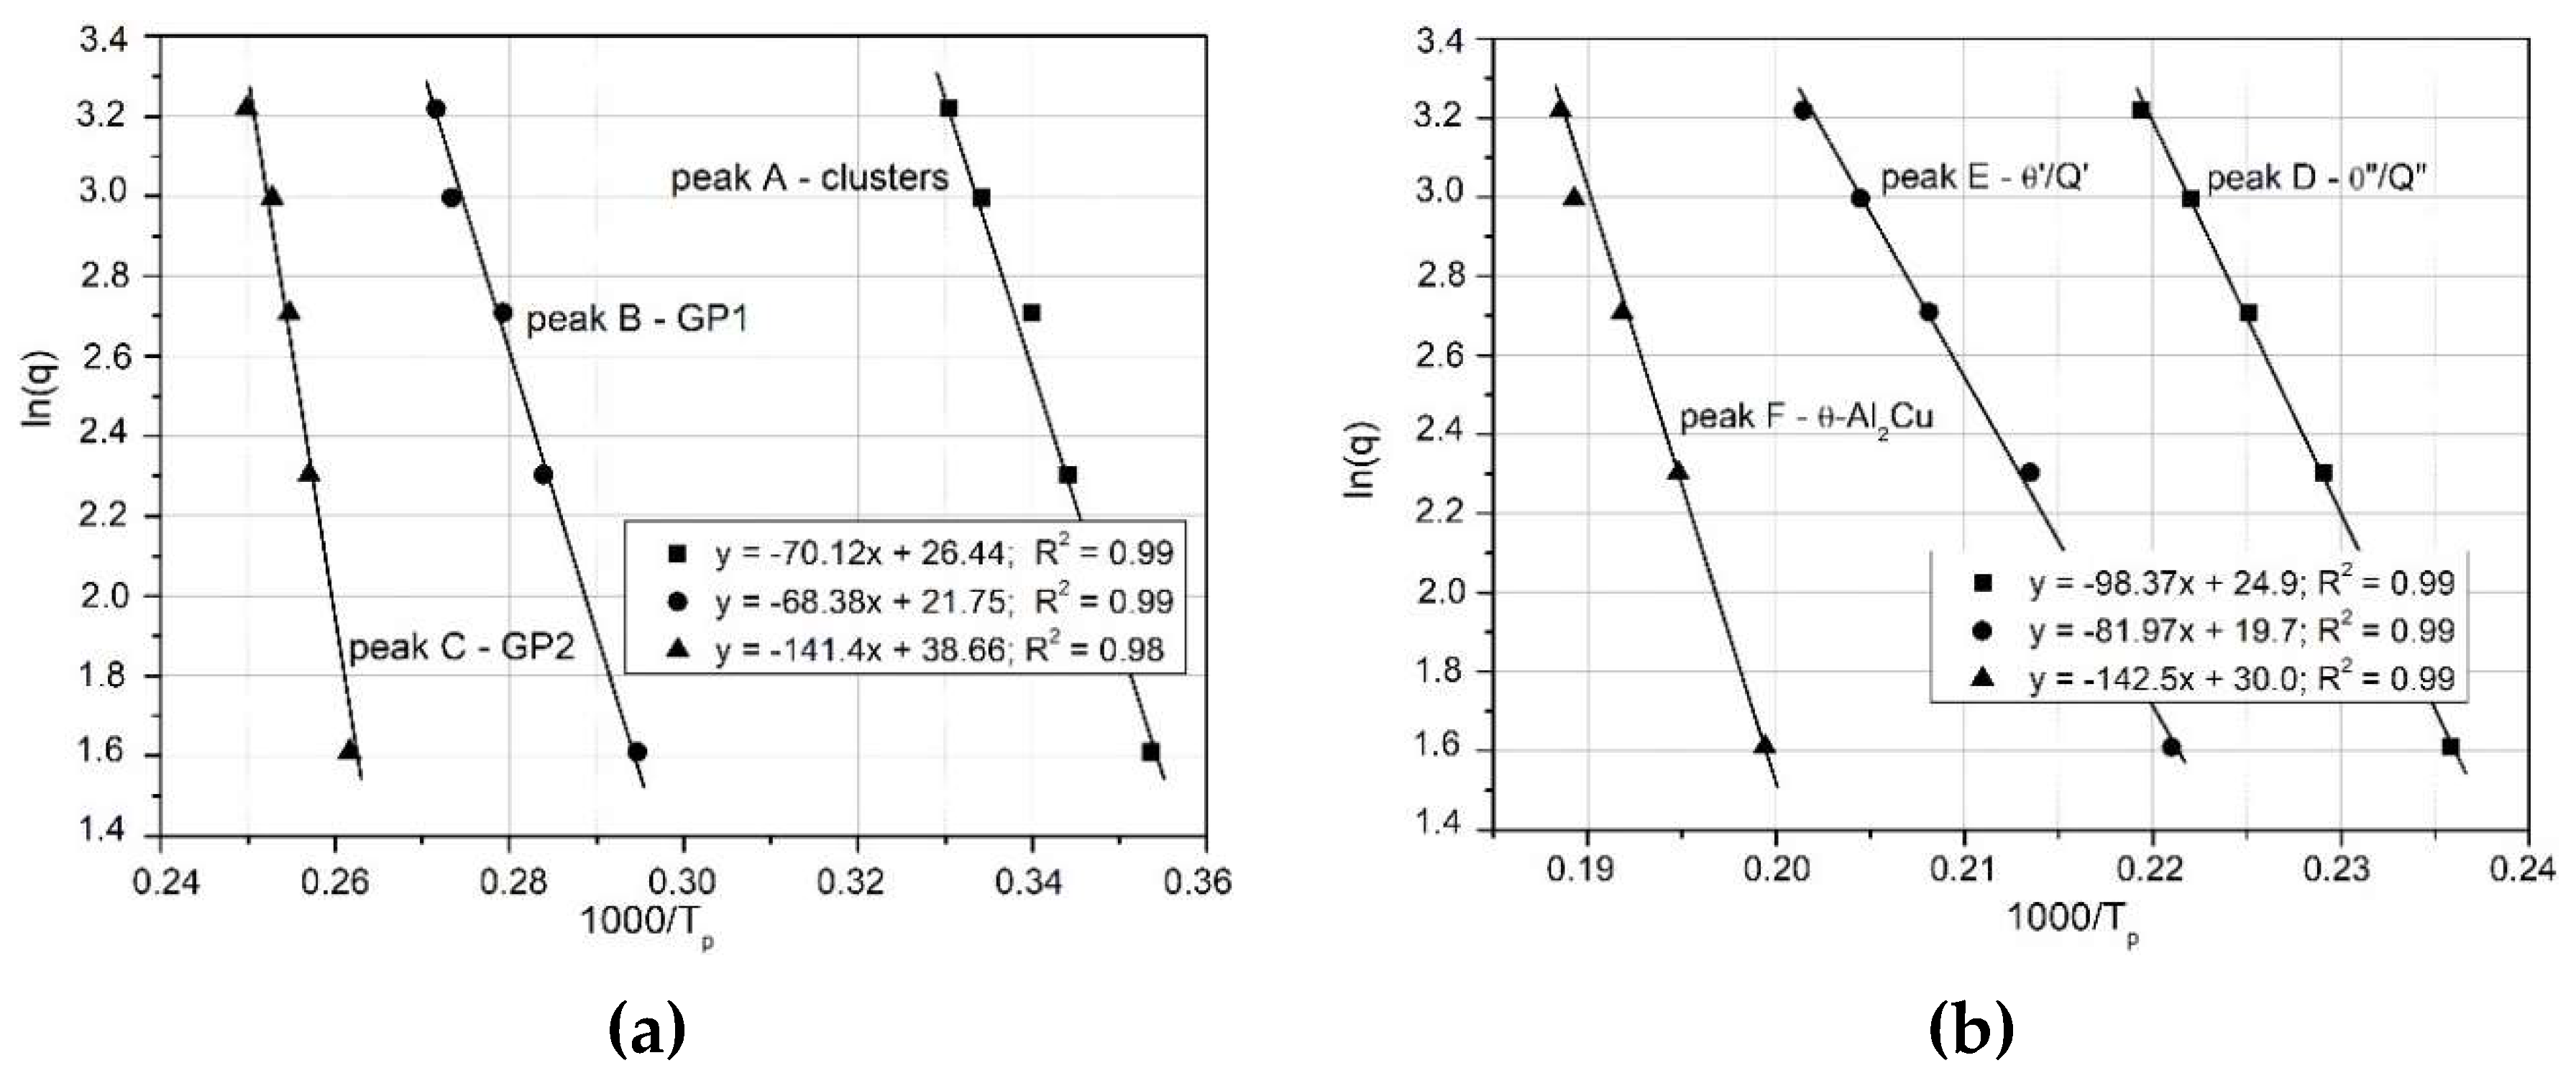
Figure 12.
Plot of Y versus 1000 R/T for three mathematical models: a) precipitation of θ” - peak D; and b) precipitation of θ’/Q’- peak E.
Figure 12.
Plot of Y versus 1000 R/T for three mathematical models: a) precipitation of θ” - peak D; and b) precipitation of θ’/Q’- peak E.
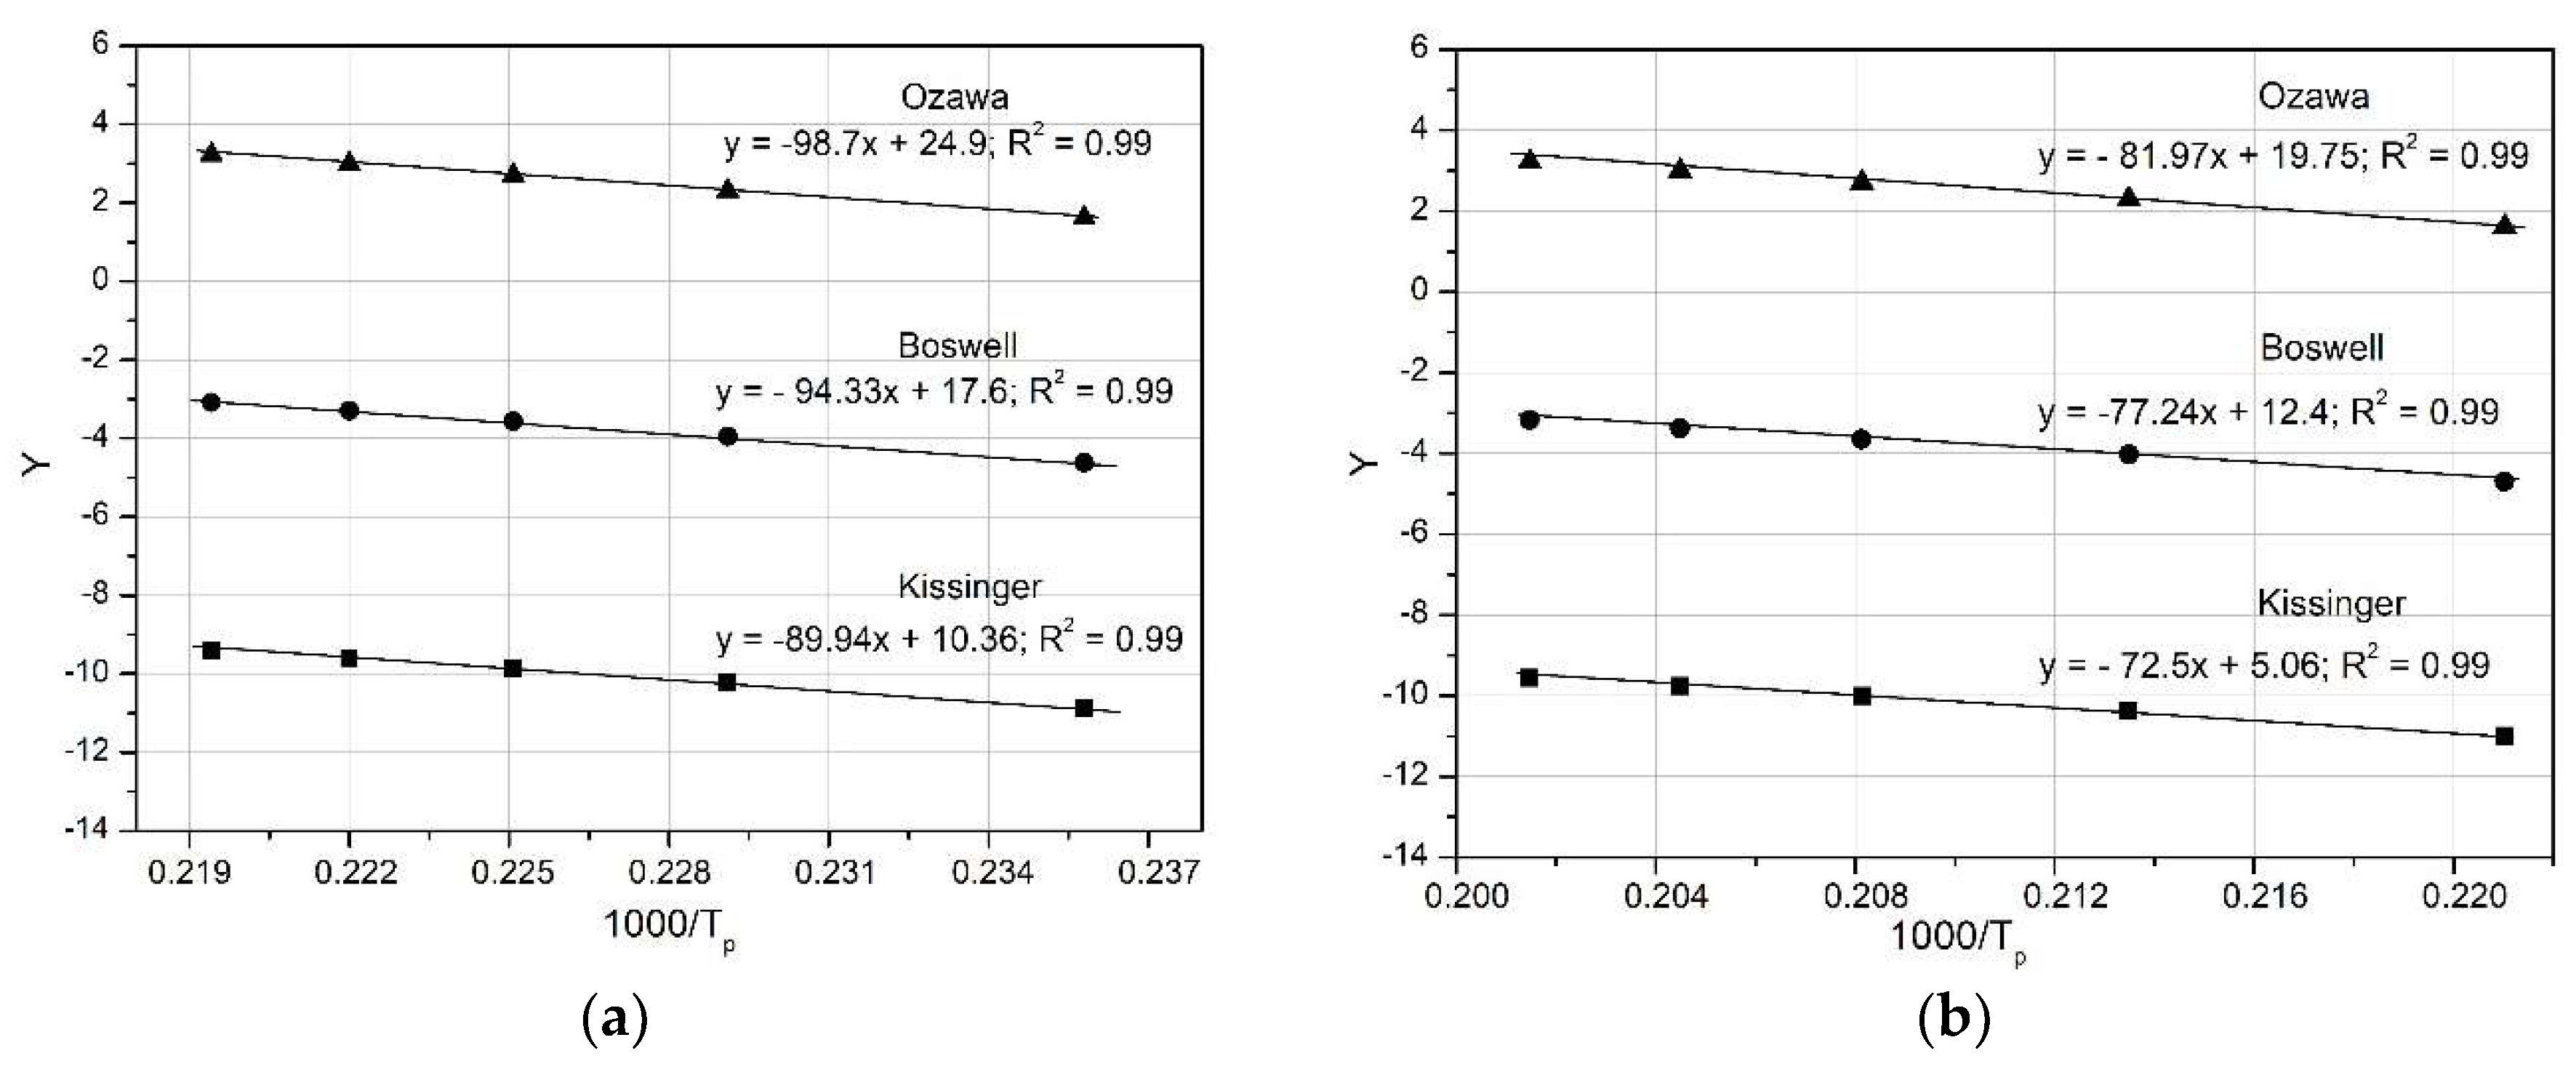
Figure 13.
Activation energy determined by Kissinger, Ozawa and Boswell methods.
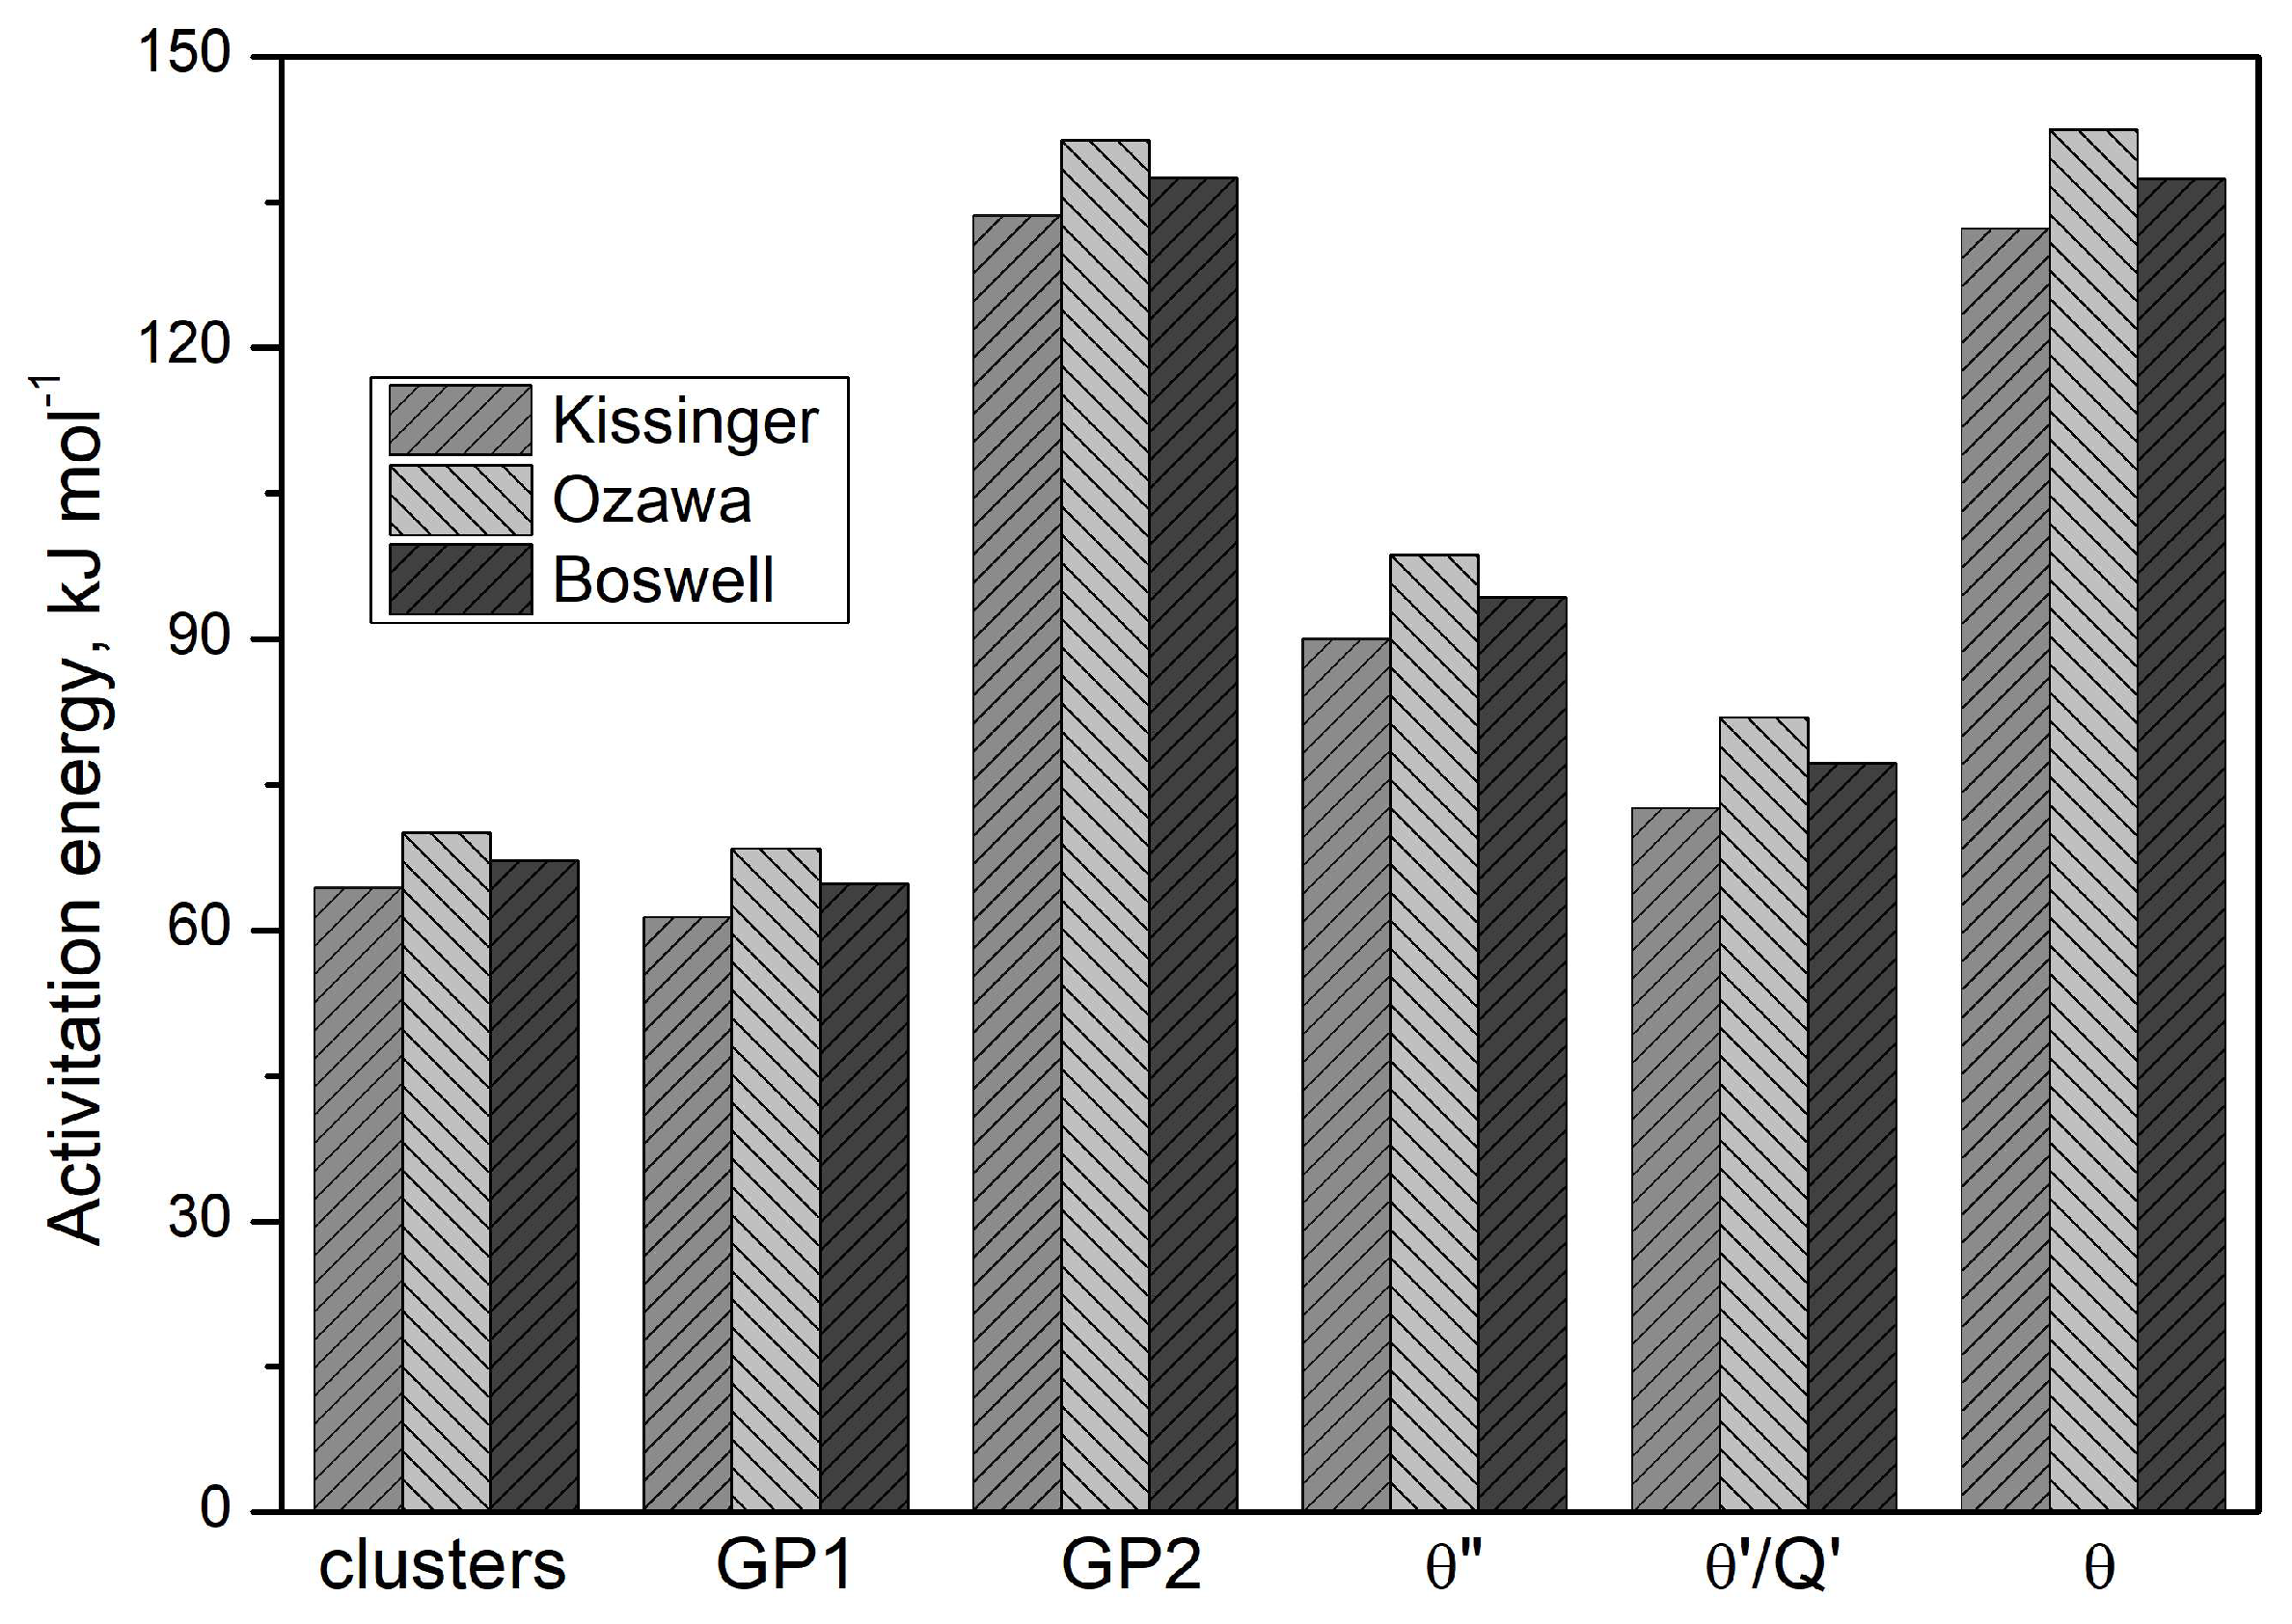

Table 1.
Chemical composition of the 2017A aluminium alloy, weight %.
| Alloy | Elements Content, wt % | |||||||||
|---|---|---|---|---|---|---|---|---|---|---|
| Si | Fe | Cu | Mn | Mg | Cr | Zn | Zr | Ti | Al | |
| 2017A | 0.49 | 0.22 | 4.01 | 0.56 | 0.72 | 0.063 | 0.20 | 0.17 | 0.077 | balance |
Table 2.
The values of onset, offset, and peak temperatures of the main peaks recorded in the DSC curve of the 2017A alloy and their associated reactions.
Table 2.
The values of onset, offset, and peak temperatures of the main peaks recorded in the DSC curve of the 2017A alloy and their associated reactions.
| Peak | Reaction | Temperature, °C | ||
|---|---|---|---|---|
| Onset | Offset | ) | ||
| A - exo | Formation of clusters | 61.0 | 95.3 | 76.8 |
| B - exo | GP1 zones formation | 137.9 | 158.9 | 148.2 |
| C - exo | GP2 zones formation | 178.1 | 204.2 | 194.1 |
| B’- exo | Dissolution of GP | - | 214.8 | - |
| D- exo | Formation of θ’’ | 239.6 | 265.1 | 252.0 |
| E- exo | Formation of θ’/Q’ | 273.2 | 311.1 | 290.6 |
| C’- endo | Dissolution of θ’’ and θ’ | 313.0 | 323.4 | 317.0 |
| F- exo | Formation of θ | 329.4 | 367.1 | 344.2 |
| G- exo | Formation of Q | 401.2 | 444.0 | 430.0 |
| E’ - endo | Dissolution of θ and Q | |||
| F’ - endo | Dissolution of all phases | 508.2 | 522.7 | 515.0 |
| G’ – endo | Dissolution of α-Al | 619.0 | 659.3 | 648.6 |
Table 3.
Variation of DSC top peaks temperature (°C) with heating rate (°C min-1).
| , °C | , °C min-1 | ||||
|---|---|---|---|---|---|
| 5 | 10 | 15 | 20 | 25 | |
| Vacancy cluster formation | 67.0 | 76.4 | 80.7 | 86.8 | 90.8 |
| GP1 zones | 135.0 | 150.4 | 157.4 | 166.8 | 169.6 |
| GP2 zones | 186.5 | 194.8 | 198.9 | 202.6 | 208.2 |
| Precipitation of θ’’ | 236.9 | 251.8 | 261.2 | 268.6 | 275.0 |
| Precipitation of θ’/ Q’ | 271.0 | 290.2 | 304.7 | 315.0 | 323.8 |
| Precipitation of θ | 330.0 | 344.2 | 353.8 | 362.3 | 364.7 |
Table 4.
Values of activation energy precipitation of strengthening phase in 2017A aluminum alloy determined by Kissinger, Ozawa and Boswell methods.
Table 4.
Values of activation energy precipitation of strengthening phase in 2017A aluminum alloy determined by Kissinger, Ozawa and Boswell methods.
| Mathematical models used to determine Ea | Activation Energy Ea/kJ mol-1 | |||||
|---|---|---|---|---|---|---|
| clusters | GPZ 1 | GPZ 2 | θ’’ | θ’/Q’ | θ | |
| Kissinger | 64.3 | 61.3 | 133.6 | 89.94 | 72.5 | 132.2 |
| Ozawa | 70.1 | 68.4 | 141.4 | 98.7 | 81.9 | 142.5 |
| Boswell | 67.2 | 64.8 | 137.5 | 94.33 | 77.2 | 137.4 |
Disclaimer/Publisher’s Note: The statements, opinions and data contained in all publications are solely those of the individual author(s) and contributor(s) and not of MDPI and/or the editor(s). MDPI and/or the editor(s) disclaim responsibility for any injury to people or property resulting from any ideas, methods, instructions or products referred to in the content. |
© 2025 by the authors. Licensee MDPI, Basel, Switzerland. This article is an open access article distributed under the terms and conditions of the Creative Commons Attribution (CC BY) license (http://creativecommons.org/licenses/by/4.0/).
Copyright: This open access article is published under a Creative Commons CC BY 4.0 license, which permit the free download, distribution, and reuse, provided that the author and preprint are cited in any reuse.


