
Submitted:
05 February 2025
Posted:
05 February 2025
You are already at the latest version
Abstract
Herein we report a comprehensive investigation on thermal transitions of thin films of poly[2,5-bis(2-octyldodecyl)-pyrrolo[3,4-c]pyrrole-1,4(2H,5H)-dione-3,6-diyl)-alt-(2,2′;5′,2″;5″,2′′′-qu-arterthiophen-5,5′′′-diyl)]—PDPP4T, poly[2,6-(4,4-bis-(2-ethylhexyl)-4H-cyclopenta[2,1-b;3,4-b′]dithi-oph-e-ne)-alt-4,7(2,1,3-benzothiadiazole)] - PCPDTBT, 1:1 blend of PDPP4T and PCPDTBT and their composites with gold nanoparticles - AuNPs. The thermal transition of these materials was studied using variable temperature spectroscopic ellipsometry (VTSE), with differential scanning calorimetry (DSC) serving as the reference method. Based on obtained VTSE results, first time, we have determined the phase diagrams of PDPP4T/PCPDTBT and their AuNPs composites. The VTSE measurements revealed distinct thermal transitions in the thin films, including characteristic temperatures corresponding to the pure phases of PDPP4T and PCPDTBT within their blends. These transitions were markedly different in the AuNP composites compared to the neat materials, highlighting the unique interactions between the polymer matrix and AuNPs. Additionally, we explored the optical properties, surface morphology, and crystallinity of the materials. We hypothesize that the observed variations in thermal transitions, as well as the improvement in optical properties and crystallinity, are likely influenced by localized surface plasmon resonance (LSPR) phenomena induced by the AuNPs in the composite films. These findings could have important implications for the design and optimization of materials for optoelectronic applications.
Keywords:
variable-temperature ellipsometry
; thermal transitions
; polymer/nanoparticles composites
; thin films
1. Introduction
The widespread integration of semiconducting organic polymers into the organic electronics industry has yet to be fully realized. However, their low cost and high efficiency, these materials proven as a promising candidate for future renewable energy sources (RES). One of the most critical challenges currently being addressed by numerous scientific research groups is the thermal stability of these materials. The study of thermal transitions in organic semiconductor materials is one of the essential factor for optimizing the performance and stability of organic electronic devices. Addressing this issue requires comprehensive studies of their morphology (both surface and internal), structural properties, and the impact of fabrication parameters [1,2], which influence the chemical and physical structure of active layers in devices such as organic light-emitting diodes (OLEDs) [3,4] and organic field-effect transistors (OFETs) [5,6]. These studies typically focus on factors such as polymer molecular weight, thin-film deposition conditions, solvent selection, and variations in the composition of donor-acceptor polymer blends, all of which significantly affect charge transport and the overall performance of electronic devices [7,8,9,10,11]. A major research direction involves exploring polymer-with inorganic metal oxides and metal nanoparticle (NP) composites for enhancing the electronic and optical properties of polymers [12,13], are widely utilized across multiple industries [14,15,16,17,18].In the field of organic electronics, the most commonly used inorganic metal nanoparticles is gold and silver nanoparticle [19,20]. These metal nanoparticles enhance light absorption primarily through the effect of their surface plasmon resonance (SPR). When exposed to light, the nanoparticles support collective oscillations of conduction electrons at specific frequencies that resonate with the incident light. This phenomenon significantly amplifies the light absorption, with the degree of enhancement depending on the size and morphology of the nanoparticles. For instance, Pillai et al. demonstrated a 33% increase in photocurrent for silicon solar cells based on thin films by incorporating metallic nanoparticles. This improvement results from the enhanced absorption or scattering of light, driven by the size-dependent properties of the particles, which enable more efficient light harvesting [21]. Gold nanoparticles (AuNPs), in particular, are a highly effective tool in manipulating light-matter interactions within organic solar cell (OSC) architectures. AuNPs can be used in both single and mixed morphologies, providing plasmonic enhancement and light-trapping properties. The unique SPR characteristics of AuNPs allow for the manipulation and control of light at the nanoscale, optimizing the interaction between light and the material [22].
To improve the thermal and electrical characteristics of organic electronics, one potential research area in the accounts is the study of composite films that combine semiconducting organic polymers with inorganic nanoparticles, namely gold nanoparticles (AuNPs). One such promising composite system is based on two semiconducting polymers, PDPP4T and PCPDTBT, which are known for their small optical band gaps and high charge-carrier mobility, making them ideal candidates for organic solar cells(reference). Incorporating gold nanoparticles (AuNPs) into blends of these polymers offers a unique opportunity to study how nanoparticles influence thermal transitions in these materials, ultimately affecting the material properties and device performance.
In this study, we utilize variable-temperature ellipsometry to investigate the thermal transitions in PDPP4T/PCPDTBT/AuNPs composite films. This powerful technique enables precise measurement of the film's optical properties as a function of temperature, providing valuable insights into the behaviour of the composite films. Key thermal transitions, such as the glass transition temperature (Tg), cold crystallization temperature (Tcc), and melting temperature (Tm), are critical for understanding the stability and operational limits of organic materials in electronic applications [23,24,25,26,27] . By studying these transitions, we aim to uncover how the incorporation of AuNPs affects the thermal properties of the polymers and polymer composites and explore potential pathways for improving the performance and longevity of organic electronic devices like organic solar cells and light-emitting diodes.
A significant innovation of this work is the development of a phase diagram for the PDPP4T/PCPDTBT blend, created for the first time using variable-temperature spectroscopic ellipsometry, with differential scanning calorimetry (DSC) serving as the reference technique. This approach builds upon previous studies where thermal transitions were determined using raw ellipsometric data (temperature-induced changes in ellipsometric angles Ψ and Δ at a selected wavelength). Along the thermal transition we also studied the optical properties and surface morphology. Our results indicate that incorporating AuNPs significantly impacts the thermal stability and crystallization behavior of the material, which is crucial for applications in organic field-effect transistors (OFETs). This work presents a novel contribution to the field, shedding light on the detail investigation on thermal transition of PDPP4T/PCPDTBT/AuNPs composites and their potential for use in organic electronics.
2. Experimental
2.1. Materials
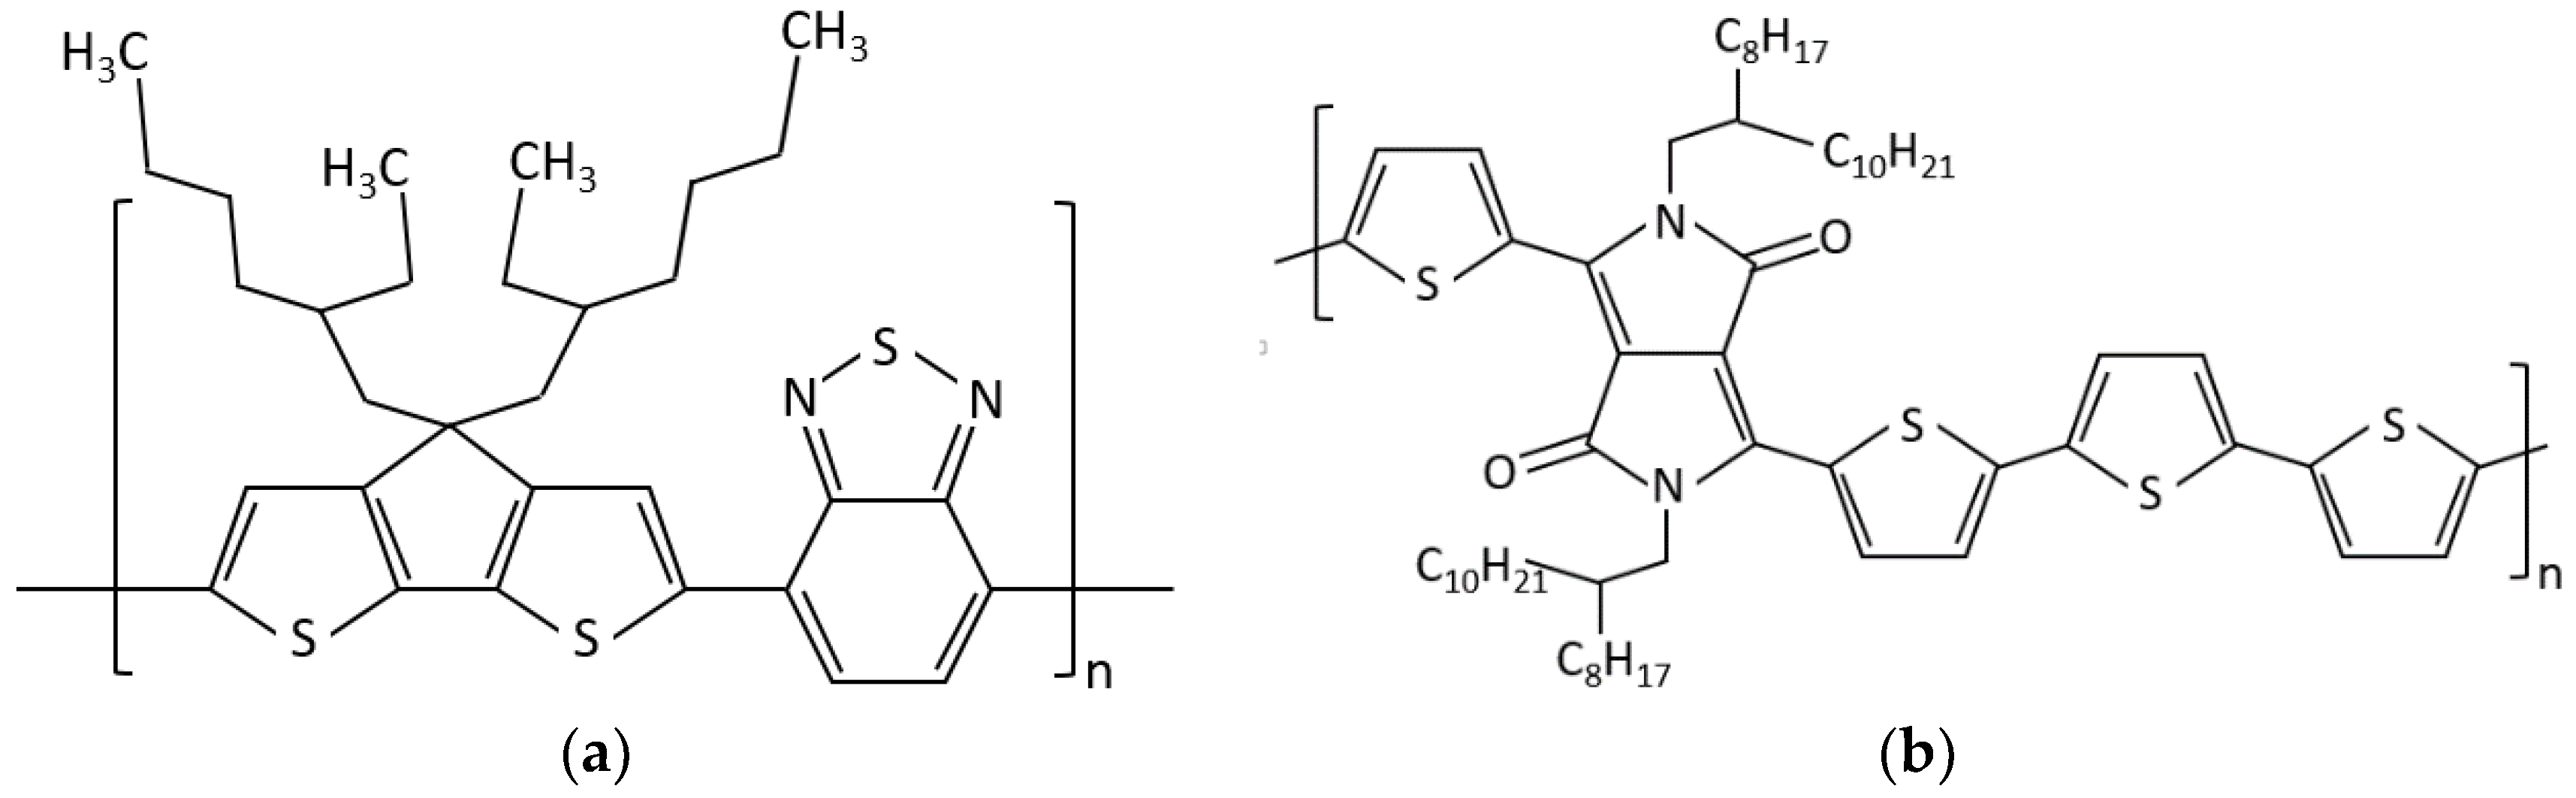
We have used two commercial, semiconducting polymers: poly[2,6-(4,4-bis-(2-ethylhexyl)-4H-cyclopenta [2,1-b;3,4-b′]dithiophene)-alt-4,7(2,1,3-benzothiadiazole)] — M2096A3 - PCPDTBT (molar mass Mw = 66.499 kDa) [28,29,30] and poly[2,5-bis(2-octyldodecyl)pyrrolo[3,4-c]pyrrole-1,4(2H,5H)-dione-3,6-diyl)-alt-(2,2′;5′,2″;5″,2′′′-quaterthiophen-5,5′′′-diyl)]—M333-PDPP4T (molar mass Mw = 84 kDa) [31,32,33], which were supplied by Ossila. The chemical structures of these polymers are presented in Figure 1a,b). The gold nanoparticles - AuNPs with a 20 nm diameter were supplied by Sigma -Aldrich.
2.2. Samples Preparation
The polymers PCPDTBT and PDPP4T were dissolved in chloroform at a concentration of 10 mg/ml. Solutions containing AuNPs were prepared with a 10% weight concentration of nanoparticles, while maintaining a constant overall concentration of 10 mg/ml. The specific weight concentrations are provided in Table 1.
All solutions were placed in an ultrasonic bath at 40°C for approximately 30 minutes. The films were prepared using spin-coating and casting techniques onto silicon substrates (covered with 90 nm of SiO2) and microscope slides (0.1 mm thick). The substrates were cleaned following a standard procedure, which included rinsing with deionized water, ultrasonic cleaning with organic solvents (acetone and methanol), and drying in a centrifuge. The prepared films were annealed on a hot plate for 10 minutes at 120°C to remove any residual solvent, then stored at room temperature in a dry laboratory box. The films were kept in a rubber-sealed storage container, partially filled with a hygroscopic gel, and stored in a nitrogen glove box.
2.3. Methods
Ellipsometric measurements were conducted using a SENTECH SE 850E ellipsometer, operated with SpectraRay3 software, covering a spectral range of 240–2500 nm. Temperature control during measurements was achieved using a temperature chamber under low vacuum conditions (10−1 Tr). The temperature was regulated by an INSTEC mK 1000 controller, utilizing an electrical heater and a liquid nitrogen circuit. The optical windows of the vacuum chamber allowed for measurements at a 70° incidence angle. A standard temperature protocol was applied, where each sample was heated to 300°C for 2 minutes and then rapidly cooled to -100°C. Temperature curves were recorded during the heating cycles at a rate of 2°C/min.
Differential scanning calorimetry (DSC) measurements were performed using a DSC Q2000 (TA Instruments, Newcastle, DE, USA) with aluminum sample pans. Thermal characteristics were assessed under a nitrogen atmosphere with a gas flow rate of 50 mL/min. The instrument was calibrated using high-purity indium standards, and the heating and cooling rates were set to 20°C/min. DSC measurements were taken for the pure powders of PDPP4T and PCPDTBT, as well as for their 50% blend, which was scratched from the glass substrate.
X-ray diffraction (XRD) scans were carried out on polymer films deposited on Si/SiO2 substrates using a D8 Advance diffractometer (Bruker, Karlsruhe, Germany) with a Cu-Kα cathode (λ = 1.54 Å) in coupled Two-Theta/Theta mode. The scan rate was 1.2°/min with a step size of 0.02° in the 2θ range of 2° to 60° (dwell time 1 s). Background subtraction, accounting for air scattering, was performed using the DIFFRAC.EVA software.
The surface morphology of the prepared thin films, including pure materials, their blends, and composites, was analyzed using an Atomic Force Microscope (AFM) TopoMetrix Explorer, operating in contact mode in air with a constant force regime.
3. Results and Discussion
3.1. Optical Analysis
Spectroscopic ellipsometry is a reflection optical technique that examines the change in polarization parameters of light reflected from the surface of a sample. Light incident on the sample is linearly polarized, while after reflection it is elliptically polarized. The two main parameters measured by the ellipsometer are called ellipsometric angles - Ψ and Δ. The first parameter - Ψ is the change of the polarization amplitude, while Δ is the phase shift between the electrical vectors −p and −s of the electromagnetic beam before and after reflection from the sample. The relation that connects these parameters is called the main equation of ellipsometry, describing the complex reflectance coefficient ρ.
Measurements of ellipsometric angles Ψ and Δ were performed in the variable-angle mode (VASE) of the ellipsometer, in the range of angles 40-70°, every 10°, at room temperature, in the wavelength range 240-930 nm. The absorption spectra were derived using an ellipsometric model consisting of four layers, as depicted in Scheme 1. The layers representing air, polymer, SiO2 and silicon were treated as film-type layers, where the modulation was achieved by fitting the refractive index (n) and extinction coefficient (k) at each wavelength (λ). It is important to note that these parameters were fitted as pairs, with each value of n and k corresponding to the same λ. The silicon oxide layer was modelled using a Cauchy layer, with the corresponding relationship detailed in our previous works [23,24]. The mean square error (MSE) for the fitting results was approximately MSE ≈ 0.7.
Figure 2a,b displays the optical absorption spectra and energy band gaps for pure PCPDTBT, PDPP4T, their 1:1 blend, and the corresponding AuNPs (10%) composites for clarity. The remaining absorption spectra are provided in the Supporting Materials, as shown in Figure S1.
The spectra of pure materials are denoted in dark blue, while the spectra of their composites are shown in dark yellow. In all cases, the first strong absorption band, occurring between 1.25 and 2.25 eV, is associated with π-π* electronic transitions, while the absorption band in the range of 2.25 to 3.5 eV corresponds to n-π* transitions. In the subsequent step, we calculated the absorption coefficient to determine the energy gaps. The absorption coefficient α was obtained using following relation:
Next, using the relationship (αE)^(1/2) as a function of energy, the energy gap values for each layer were determined through a graphical method by fitting a tangent to the edge of the first absorption band. The results for all samples are presented in Table 3. The increased absorption in the PCPDTBT/Au composite compared to the PCPDTBT spectrum suggests the presence of a plasmonic effect in the material. This is consistent with the observed decrease in the energy gap value. It is well known that the plasmonic effect can simultaneously lead to both a shift in the absorption band and an increase in absorption intensity. This effect arises from changes in the local oscillations of electrons within gold nanoparticles, which influence electronic transition processes in the polymer. AuNPs enhance absorption within specific wavelength ranges, contributing to the overall increase in absorption. In the case of the PDPP4T/Au composite, we observed a slightly lower absorption intensity compared to pure PCPDTBT, along with a narrowing of the absorption band. Additionally, a slight decrease in the energy gap (Eg) value was noted. We attribute this effect to the local passivation of gold nanoparticles, where AuNPs act as passivators, stabilizing the polymer structure and preventing the formation of additional energy states within the HOMO and LUMO levels.
The minimal changes in the UV-Vis spectrum of the PCPDTBT/PDPP4T/AuNPs composite, compared to the spectrum of the blend, suggest that both the plasmonic effect and passivation occur locally within the prepared samples.
3.2. Thermal Analysis
Thermal transition analysis was performed using two methods: variable-temperature spectroscopic ellipsometry (VTSE) and differential scanning calorimetry (DSC). In previous studies [23,24], we presented ellipsometric angles (Ψ or Δ) as a function of temperature for a selected wavelength (λ). For this study, we used λ = 930 nm, which exhibited the lowest dispersion of points. Ellipsometric scans were conducted during heating cycles, with measurements taken every 10 seconds. The VTSE temperature scans for pure PCPDTBT, PDPP4T, their 1:1 blend, and their AuNPs composites (with a nanoparticle concentration of 10%) are shown in Figure 3a–f). Corresponding DSC curves (Figure 4a–c) were obtained for pure materials and their 1:1 blend. Notably, DSC measurements were not conducted for the AuNPs composites, primarily due to potential nanoparticle aggregation and their size. The small sample volume used for the measurements may not ensure uniform nanoparticle distribution, and the nanoparticles could induce localized temperature variations, disrupting the uniform heat flow within the sample.
Based on the obtained results, it can be concluded that the primary thermal transitions detectable in both the individual materials and their mixtures are characteristic of this type of polymer. These transitions include the glass transition temperature (Tg), cold crystallization temperature (Tcc), and melting temperature (Tm). For pure materials, the temperatures detected by the DSC and VTSE methods are generally consistent, with any observed differences attributed to several factors. These include the state of the material being tested—where DSC analyzes the powder, while the ellipsometric method examines the prepared film—and differences in the heating rates. In the VTSE method, the heating rate during the temperature cycle is 2°C/min, while in DSC it ranges from 10-20°C/min. This manuscript presents results for the most significant materials: pure polymers, their 1:1 blends, and their composites. Additional thermal data can be found in the supporting information, specifically in Figure S4a–j). The thermal transitions measured using the VTSE method for pure PCPDTBT and PDPP4T are presented in Figure 3a,c, respectively. Based on the DSC results, we identified several glass transitions in both materials.
For PCPDTBT, the glass transitions were observed around 30°C, 61°C, and 172°C. The corresponding DSC curve revealed Tg values at approximately 72°C, 167°C, and 197°C. Additionally, the cold crystallization temperature (Tcc) observed during the heating cycle at around 250°C was not detected by DSC. This finding aligns with the literature, which suggests that polymers with a similar chemical structure typically exhibit multiple glass transitions [34]. The first glass transition, occurring around 30°C, is likely attributed to the DPP group, which is commonly observed around 23°C in DSC measurements. The two remaining Tg values are likely related to the collective motion of the aromatic rings within the π-conjugated fragments in the polymer's main chain and the aliphatic side chains. The glass transition at approximately 61°C is consistent with our earlier findings. [23,24,34].
For pure PDPP4T, the glass transition temperatures (Tg) were detected around 28°C, 71°C, and 137°C, with two cold crystallization temperatures (Tcc) observed at approximately 241°C and 276°C. The corresponding DSC results showed Tg at around 65°C and 290°C. Additionally, the melting point (Tm) was observed around 330°C. These results are consistent with those from our previous work [34] where we presented the phase diagram for PDPP4T:PDBPyBT for the first time, confirming that the temperatures for pure PDPP4T match those in the phase diagram.
In the 1:1 PCPDTBT:PDPP4T blend, the glass transition was detected around 112°C, with cold crystallization occurring at around 240°C and 281°C. The DSC results revealed additional glass transitions at approximately 75°C, 105°C, 172°C, and 197°C. This suggests that the internal morphology of the blend film is more uniform compared to the sample prepared for DSC measurement. Notably, the glass transitions observed in the pure materials are not present in the VTSE graph of the mixture.
In case of PCPDTBT with gold nanoparticles the glass transitions have been appeared at about 16, 59, 126, 178°C. One additional temperature (126°C) probably originates from local interaction of Au nanoparticles with polymer. As we noted earlier, the presence of gold nanoparticles influences the thermal properties of material. Figure 5 represents the phase diagram which was constructed using data from DSC and temperature ellipsometry. Thermal transitions are indicated as follows: light green circles for VTSE measurements, dark green open circles for DSC transitions in pure materials and their blends, and red open circles for VTSE transitions in material/AuNPs composites (10%). The colored regions represent specific thermal characteristics: glass transition temperature (Tg) in pink, cold crystallization temperature (Tcc) in blue, and melting temperature ™ in orange.
The phase diagram clearly illustrates that thermal transitions differ between pure materials, their blends, and their composites. As previously noted, some transition temperatures are either elevated or reduced. Notably, in the polymer blends, glass transitions occur at approximately 98, 110, and 113 °C for 25%, 50%, and 75% PDPP4T content, respectively. However, these transitions are absent in the composites, suggesting strong interactions between AuNPs and polymer chains.
The most plausible explanation for this phenomenon is a combination of the local plasmonic effect—localized surface plasmon resonance (LSPR)—and the passivation of AuNPs. In the case of the plasmonic effect, nanoparticles influence the glass transition process, rendering the polymer matrix in the composite more fluid over a wider temperature range, thereby diminishing the visibility of the blend’s Tg. Conversely, if passivation dominates, gold nanoparticles stabilize the polymer structure, preventing the distinct glass transition observed in the blends. These findings align well with the optical results, further supporting the proposed mechanisms.
3.3. XRD Analysis
The XRD patterns of pure PCPDTBT, PDPP4T, their 1:1 blend and corresponding AuNPs composites are presented in Figure 6a–c), the remained XRD patterns has been added in supporting information in Figure S3. In the case of pure PDPP4T (Figure 6a), a broad amorphous background is observed along with several low-intensity peaks. While the peaks at approximately (100), (400), and (020) exhibit weak intensity in the pure material, their intensity increases in the composite, with additional peaks appearing around (001) and (200). These results indicate that pure PDPP4T consists of a mixed amorphous and crystalline structure. However, in the composite pattern, the presence of additional peaks at (001), (200), and (400), alongside those originating from the pure polymer, suggests that the nanoparticles significantly influence the crystallization process. Moreover, the nanoparticles may form their own crystalline structures, contributing to the diffraction pattern. This suggests the formation of new crystalline domains or strong interactions between the nanoparticles and the polymer matrix. From (Figure 6b), In the spectrum of pure PCPDTBT, two peaks corresponding to crystallization planes appear at approximately (100) and (300). In the PCPDTBT/AuNPs composite spectrum, an additional peak emerges around (200), while the amorphous background is notably reduced. The amorphous background in the pure PCPDTBT pattern suggests that its structure is not highly crystalline. The presence of (100) and (300) peaks indicate a mixed-phase structure, comprising both amorphous and crystalline regions. Comparing this to the composite, the increased intensity and the appearance of the (200) peak suggest a higher degree of crystallinity, likely due to AuNPs acting as nucleation sites around which polymer chains become more ordered.
This type of pattern indicates an edge-on crystalline orientation, where the crystallization planes are arranged parallel to each other, with each plane positioned perpendicularly to the sample surface.
The XRD patterns of the 1:1 PCPDTBT/PDPP4T blend and its corresponding AuNPs composite are compared in Figure 6c. Both spectra exhibit a broad amorphous background. In the pure blend, weak intensity peaks appear at approximately (100), (200), (400), and (020). However, in the composite, the (100) peak becomes more intense, the (200) peak disappears, the (300) peak emerges, and the intensity of the (400) and (020) peaks remain unchanged. These results indicate that both polymers retain a certain degree of crystallinity. The low-intensity peaks and broad background suggest a predominantly amorphous structure with small regions of ordered crystallization. In the composite, the appearance of the (300) peak suggests the formation of new crystalline structures and interactions between AuNPs and the polymer matrix.
Using Scherrer’s law for the (100) peak, the crystallite sizes were calculated (Table 4). The results show that the crystallite size in PCPDTBT with gold nanoparticles is three times larger than in the pure polymer. In contrast, the crystallization of pure PDPP4T is less affected by the introduction of AuNPs compared to PCPDTBT. For the PCPDTBT/PDPP4T blend, the increase in crystallite size after AuNPs incorporation follows a trend similar to that of pure PCPDTBT, with the crystallite size being three times larger.
3.4. Microscopic Analysis:
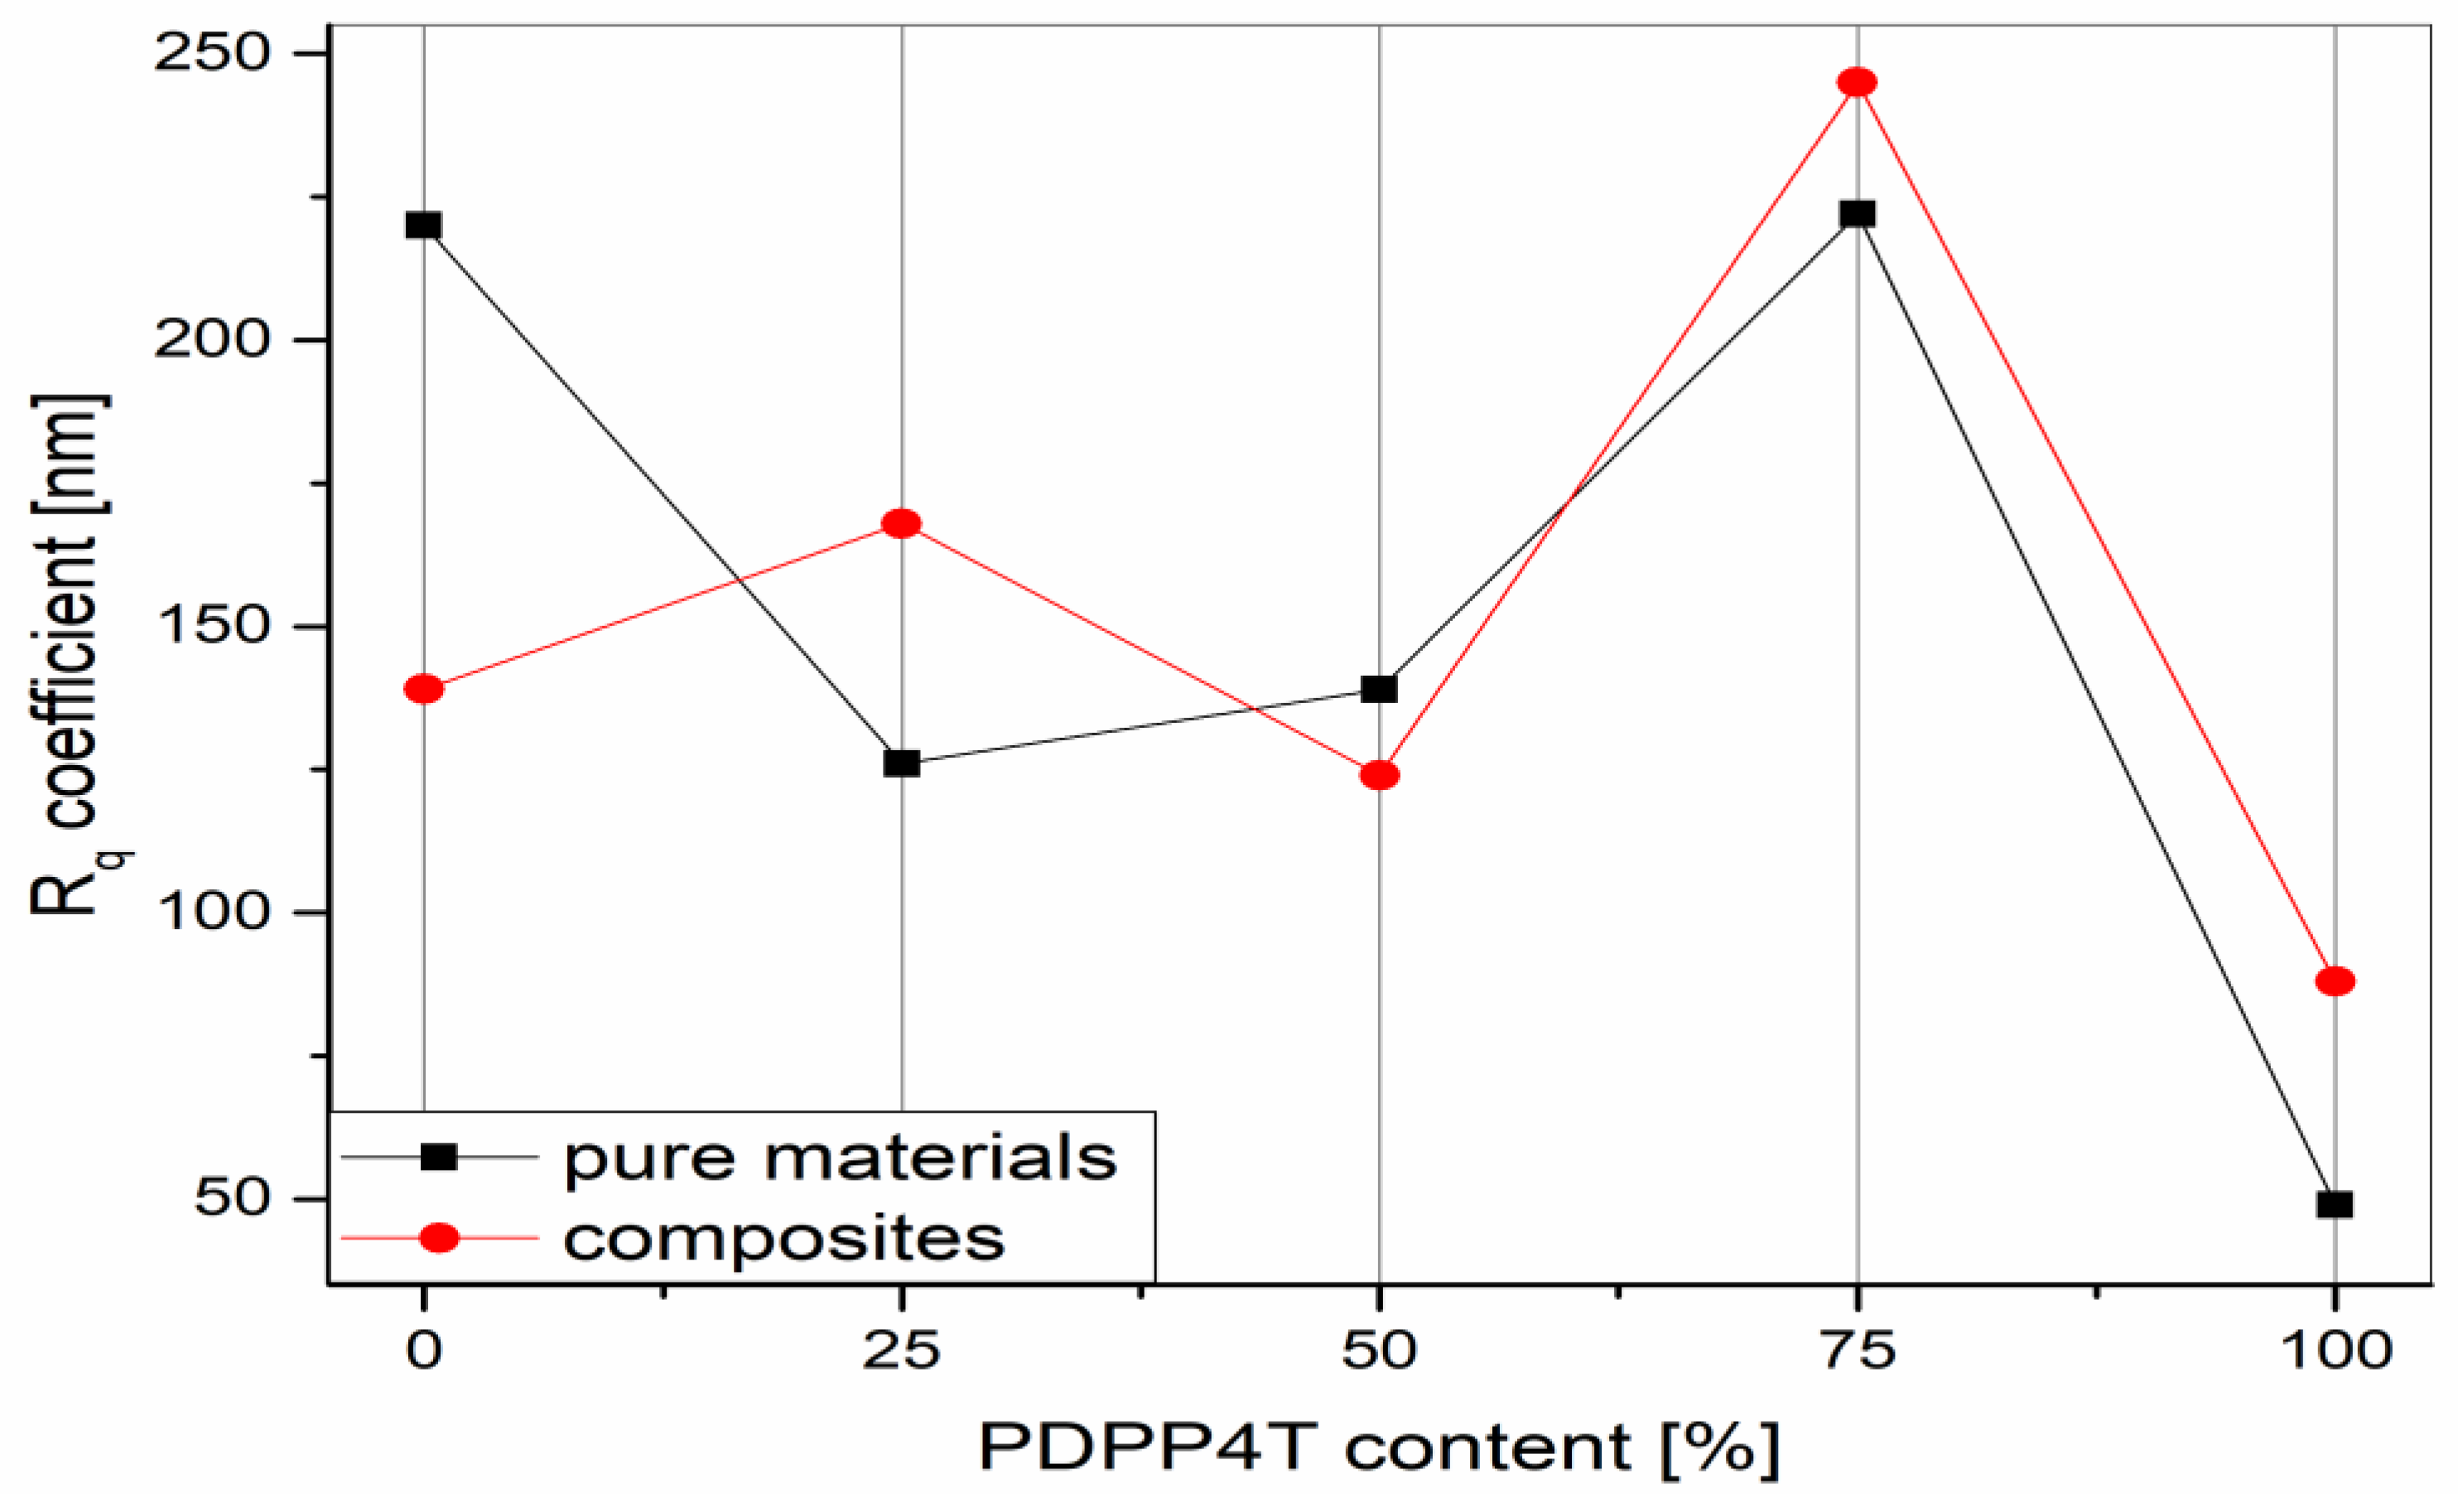
Topographic analysis was conducted on layers of pure polymer materials, their blends, and nanocomposite materials containing Au NPs additives. The resulting topographic images are presented in Figure 7. The root mean square roughness (Rq) was used to characterize the surface of all the tested samples.
It is defined as [35]:
where m is the number of sampled points, Zi is the height of each point and is the mean height value [35]. Rq was determined for three surface sizes: 1 × 1, 2 × 2 and 10 × 10 μm, and is shown in Figure 8.
For the clarity of this manuscript, here we present the morphology of PCPDTBT, PDPP4T, their 1:1 blend PCPDTBT/PDPP4T and their corresponding composites. The rest of AFM morphology pictures are presented in supporting information in Figure S2a–d).
The results of the study suggest that the pure PCPDTBT polymer thin film (Figure 7a) has a relatively homogeneous surface, with clearly visible loss and agglomeration. However, water defects on the surface of the thin film are most likely caused by the agglomeration of the polymer material caused by the volatility of solvent and interactions of polymer solvent pair [36]. The remaining surface of the thin film remains smooth, which is characteristic of PCPDTBT layers resulting from solid state ordering induced by racemic side chains [37]. The addition of Au NPs caused the development of the film surface, which, however, remained continuous and relatively smooth. The results shown in (Figure 7b) indicate that the addition of Au nanoparticles induced microstructural changes, likely due to agglomeration occurring during the mixing of different components in the film [38].
Thin films of blended materials (Figure 7c) exhibit a homogeneous surface with distinct crystalline structures. Small agglomerated polymer formations are visible; however, the absence of larger agglomerates (above 2 µm) suggests that blending promotes the ordering of polymer chains. However, considering the findings of other researchers, such as Wang et al. [39], it is expected that pure polymer semiconductor layers generally have lower surface roughness compared to blended films. For the blended film (Figure 7d), the addition of gold nanoparticles led to a reduction in surface roughness. This effect may be attributed to the influence of the nanoadditive on the ordering of polymer chains or a phenomenon observed by Nathanael et al. [40]. In their study, an increase in TiO₂ nanoparticle concentration enhanced the uniformity of the HAp/TiO₂ film while reducing its roughness. Similarly, research by Predoi et al. [41] demonstrated that decreased composite layer roughness resulted from the formation of uniformly distributed nanoconglomerates on the surface.
The pure PDPP4T films (Figure 7e) exhibit a more homogeneous surface compared to the pure PCPDTBT layers, with no material agglomerates larger than 2 µm. Crystalline fractions are visible on the film's surface, a characteristic feature of this polymer due to the crystallization tendency of its alkyl chains attached to the DPP unit. These chains act as high-solubilizing groups, promoting tight molecular packing in the film [42]. Similar to PCPDTBT and blend thin films, the incorporation of Au NPs results in a smoother surface. In the case of PDPP4T/Au NP layers (Figure 7f), this smoothing effect may be attributed to the formation of Au nanoclusters within the layers or the development of crystalline or semi-crystalline structures.
The surface topography of the produced layers was quantitatively analyzed by determining the surface roughness coefficient (Rq). The addition of Au nanoadditives to both pure PCPDTBT and its blend resulted in a reduction of surface roughness. This effect was more pronounced in pure PCPDTBT, likely due to the presence of larger agglomerates in the pristine material. Interestingly, for PDPP4T films, the Rq coefficient increased after incorporating the nanoadditive, despite the qualitatively smoother surface observed in microscopic analysis. However, given that the initial roughness of pure PDPP4T is significantly lower than that of PCPDTBT, it can be inferred that the formation of Au nanoclusters contributed to the increase in roughness. Furthermore, the results suggest that the Rq coefficient of the blended film indicates effective mixing of the materials, supporting the hypothesis of improved uniformity in the blend structure.
The results obtained for pure materials and their composites indicate that multiple phenomena occur simultaneously in the tested samples. These include the plasmonic effect, passivation of gold nanoparticles, and the role of AuNPs as nucleation centers influencing polymer crystallization. The plasmonic effect is most pronounced in the PCPDTBT/Au composite. A comparison of its optical absorption spectrum with that of the pure material reveals that the gold nanoparticles significantly alter the electronic structure. This corresponds to a localized plasmonic effect, where surface plasmons are excited directly on zero-dimensional AuNPs. These plasmons resonate around the nanoparticles, as illustrated in Scheme 2. It is important to note that the plasmonic effect is primarily associated with AuNPs that are well-isolated within the polymer matrix [C1–C2].
We noticed that the plasmonic effect also indirectly influences the thermal transitions of the polymer. The most evident example is the lower cold crystallization temperature (Tcc) in the PCPDTBT/Au composite, where Tcc decreases to 214°C compared to 256°C in pure PCPDTBT. These changes in thermal transitions arise from the ability of AuNPs to absorb light, generating localized heating through localized surface plasmon resonance (LSPR). This phenomenon enhances polymer chain mobility, accelerating the crystallization process. This effect is clearly reflected in the XRD spectra, where an increase in crystalline peak intensity is observed.
For PDPP4T, the addition of gold nanoparticles leads to a noticeable reconstruction of the polymer’s crystal structure and improved structural stability. The results suggest that AuNPs promote the formation of lamellae, which align in parallel planes perpendicular to the sample substrate. As previously mentioned, this corresponds to an edge-on structure, which facilitates charge transport via π-stacking interactions. The presence of this crystalline arrangement indicates the potential application of PDPP4T/Au composites as active materials in organic field-effect transistors (OFETs). In the case of the PCPDTBT/PDPP4T blend, the internal structure remains predominantly amorphous, with localized crystalline phases. X-ray diffraction results confirm this, showing a strong amorphous background alongside weak peaks corresponding to crystalline planes. Additionally, thermal and microscopic analyses indicate a high degree of miscibility between the two polymers. The characteristic thermal transitions of pure PCPDTBT and PDPP4T phases are nearly absent in the 1:1 blend, suggesting effective mixing at the molecular level. For the corresponding PCPDTBT/PDPP4T/Au composite, the emergence of additional crystalline peaks in the XRD pattern suggests the formation of new crystalline domains or strong interactions between the nanoparticles and the polymer matrix. This indicates that both plasmonic and passivation effects are present in the composite, although to a lesser extent than in the Au nanocomposites of the individual polymers.
4. Conclusions
In this study, we investigated the thermal and physical properties of a novel polymer blend—PCPDTBT and PDPP4T—as well as their composites with gold nanoparticles (AuNPs). Our findings indicate that the local plasmonic effect was not uniformly present in all samples but was most pronounced in the PCPDTBT/Au composite. This was evidenced by a significant reconstruction of the electronic band structure observed in the UV-Vis spectra.
AuNPs had a pronounced influence on the thermal transitions within the polymer matrix. Notable effects included a significant decrease in the cold crystallization temperature (Tcc) of PCPDTBT and the disappearance of the glass transition temperature associated with the PCPDTBT/PDPP4T blend phase at different PDPP4T concentrations in the composites. Furthermore, the incorporation of AuNPs had a notable impact on the internal structure of the tested layers, particularly their crystallinity. The most significant structural changes were observed in the PDPP4T/Au composite, where gold nanoparticles acted as nucleation centers. Through interactions with the polymer chains, the AuNPs promoted a higher degree of molecular ordering compared to the pure polymer, leading to the formation of an edge-on crystalline orientation. For the PCPDTBT/PDPP4T composite, we identified the simultaneous occurrence of two key phenomena: a plasmonic effect—though weaker than that observed in the PCPDTBT/Au composite—and enhanced structural ordering. This was confirmed by the presence of additional peaks in the XRD spectra, indicating the formation of new crystalline domains.
In conclusion, the observed surface plasmon resonance effect induced by the presence of AuNPs in these materials presents exciting prospects for future research. Further investigations should focus on determining whether this phenomenon can enhance the quantum efficiency of the materials, opening up new possibilities for their application in optoelectronic devices.
Supplementary Materials
The following supporting information can be downloaded at the website of this paper posted on Preprints.org.
Author Contributions
Conceptualization, B.H. and P.J.; methodology, B.H. and P.J ; validation, B.H and P.J .; formal analysis, B.H and P.J.; investigation, B.H., P.J., P.K., M. G and Y. T..; data curation, B.H. and P.J.; writing—original draft preparation, B.H., P. J.; writing—review & editing, B.H., P. J and P.K .; visualization, B.H., P.J. and P.K.; supervision, B.H. and T.T
Funding
The research was co-financed by the Silesian University of Technology under the Initiative program Excellence – Research University.
References
- A.K. Sulaiman, C.C. Yap, F. Touati, Binary blend based dye sensitized photo sensor using PCPDTBT and MEH-PPV composite as a light sensitizer, Synth. Met. 210 (2015) 392-397; 10.1016/j.synthmet.2015.11.005.
- Y. Li, Y. Wei, K. Feng, Y. Hao, J. Pei, Y. Zhang, B. Sun, Introduction of PCPDTBT in P3HT:Spiro-OMeTAD blending system for solid-state hybrid solar cells with dendritic TiO2/Sb2S3 nanorods composite film, J. Sol. St. Chem., 276 (2019) 278-284; 10.1016/j.jssc.2019.05.020.
- S. Banerjee, P. Singh, P. Purkayastha, S. Kumar Ghosh, Evolution of Organic Light Emitting Diode (OLED) Materials and their Impact on Display Technology, Chem. Asian J. 2024, e202401291. [CrossRef]
- Debashish Nayak, Ram Bilash Choudhary, A survey of the structure, fabrication, and characterization of advanced organic light emitting diodes, Microelectronics Reliability,144, 2023, 114959. [CrossRef]
- L. Luo, Z. Liu. Recent progress in organic field-effect transistor-based chem/bio-sensors , VIEW. 2022, 3, 20200115. [CrossRef]
- Yujie Zhao, Wei Wang, Zihan He, Boyu Peng, Chong-An Di, Hanying Li, High-performance and multifunctional organic field-effect transistors, Chinese Chemical Letters,34/9, 2023,108094. [CrossRef]
- Kim, O. et al. Efect of PVP-capped ZnO nanoparticles with enhanced charge transport on the performance of P3HT/PCBM polymer solar cells. Polymers 11, 1818, (2019). [CrossRef]
- Liu, C. et al. Decreased charge transport barrier and recombination of organic solar cells by constructing interfacial nanojunction with annealing-free ZnO and Al flms. ACS Appl. Mater. Interfaces 9, 22068–22075. (2017). [CrossRef]
- Mohtaram, F. et al. Electrospun ZnO nanofber interlayers for enhanced performance of organic photovoltaic devices. Sol. Energy 197, 311–316. (2020). [CrossRef]
- Swart, H. C. et al. P3HT: PCBM based solar cells: A short review focusing on ZnO nanoparticles bufer layer, post-fabrication annealing and an inverted geometry. J. Mater. Sci. Eng. B 5, 12–35. (2015). [CrossRef]
- Wanninayake, A. P., Church, B. C. & Abu-Zahra, N. Efect of ZnO nanoparticles on the power conversion efciency of organic photovoltaic devices synthesized with CuO nanoparticles. AIMS Mater. Sci. 3(3), 927–937. (2016). [CrossRef]
- Jiaqi Dong, Chuxuan Yan, Yingzhi Chen, Wenjie Zhou, Yu Peng, Yue Zhang, Lu-Ning Wang, Zheng-Hong Huang, Organic semiconductor nanostructures: optoelectronic properties, modification strategies, and photocatalytic applications, Journal of Materials Science & Technology, 113, 2022, 175-198. [CrossRef]
- Zhongkai Cheng, Nasir Javed, and Deirdre M. O’Carroll, Optical and Electrical Properties of Organic Semiconductor Thin Films on Aperiodic Plasmonic Metasurfaces, ACS Applied Materials & Interfaces 2020 12 (31), 35579-35587. [CrossRef]
- Balakrishnan T. S., Sultan M. T. H., Shahar F. S., Basri A. A., Shah A. U. M., Sebaey T. A., Łukaszewicz A., Józwik J., Grzejda R.: Fatigue and impact properties of kenaf/glass-reinforced hybrid pultruded composites for structural applications, Materials, 17, 2 (2024) 302. [CrossRef]
- Hajduk, B., Bednarski, H., Jarka, P. et al. Thermal and optical properties of PMMA films reinforced with Nb2O5 nanoparticles. Sci Rep 11, 22531 (2021). [CrossRef]
- Huang Y., Sultan M. T. H., Shahar F. S., Grzejda R., Łukaszewicz A.: Hybrid fiber-reinforced biocomposites for marine applications: A review, Journal of Composites Science, 8, 10 (2024) 430. [CrossRef]
- Shahar F. S., Sultan M. T. H., Grzejda R., Łukaszewicz A., Oksiuta Z., Krishnamoorthy R. R.: Harnessing the potential of natural composites in biomedical 3D printing, Materials, 17, 24 (2024) 6045. [CrossRef]
- Ibrahim N. I., Sultan M. T. H., Łukaszewicz A., Shah A. U. M., Shahar F. S., Józwik J., Najeeb M. I., Grzejda R.: Characterization and isolation method of Gigantochloa scortechinii (Buluh Semantan) cellulose nanocrystals, International Journal of Biological Macromolecules, 272, Part 1 (2024) 132847. [CrossRef]
- T-C. Wang, Y-H. Su, Y-K.Hung, C-S. Yeh, L-W. Huang, W. Gomulya, L-H. Lai, M.A. Loi, J-S. Yang, JJ. Wu, Charge collection enhancement by incorporation of gold–silica core–shell nanoparticles into P3HT:PCBM/ZnO nanorod array hybrid solar cells, Phys. Chem. Chem. Phys. 17 (2015) 19854-19861; 10.1039/c5cp03081a.
- H. Gao, J. Meng, J. Sun, J. Deng, Enhanced performance of polymer solar cells based on P3HT:PCBM via incorporating Au nanoparticles prepared by the micellar method, Journal of Materials Science: Mat. in Electr. 31(2020) 10760–10767; 10.1007/s10854-020-03626-x.
- S. Pillai, K. R. Catchpole, T. Trupke, M. A. Green, Surface plasmon enhanced silicon solar cells, Journal of Applied Physics 101, 093105, 2007. [CrossRef]
- Majid Sharifi, Farnoosh Attar, Ali Akbar Saboury, Keivan Akhtari, Nasrin Hooshmand, Anwarul Hasan, Mostafa A. El-Sayed, Mojtaba Falahati, Plasmonic gold nanoparticles: Optical manipulation, imaging, drug delivery and therapy, Journal of Controlled Release, 311–312, 2019, 170-189. [CrossRef]
- Hajduk, B.; Jarka, P.; Bednarski, H.; Janeczek, H.; Kumari, P.; Farcas, A. Thermal Transitions and Structural Characteristics of Poly(3,4-ethylenedioxythiophene/cucurbit[7]uril) Polypseudorotaxane and Polyrotaxane Thin Films. Materials 2024, 17, 1318. [CrossRef]
- Hajduk, B.; Bednarski, H.; Jarząbek, B.; Nitschke, P.; Janeczek, H. Phase diagram of P3HT:PC70BM thin films based on variable-temperature spectroscopic ellipsometry. Polym. Test. 2020, 84, 106383. [CrossRef]
- Wang, T.; Pearson, A.J.; Dunbar, A.D.F.; Staniec, P.A.; Watters, D.C.; Coles, D.; Yi, H.; Iraqi, A.; Lidzey, D.G.; Jones, R.A.L. Competition between substrate-mediated π-π stacking and surface-mediated Tg depression in ultrathin conjugated polymer films. Eur. Phys. J. E 2012, 35, 12. [CrossRef]
- Kim, J.H.; Jang, J.; Zin, W.-C. Estimation of the thickness dependence of the glass transition temperature in various thin polymer films. Langmuir 2000, 16, 4064–4067. [CrossRef]
- Keddie, J.L.; Jones, R.A.; Cory, R.A. Size-dependent depression of the glass transition temperature in polymer films, Europhys. Eur. Lett. 1994, 27, 59–64, 10.1209/0295-5075/27/1/011.
- T. Pratyusha, G. Sivakumar, A. Yella, D. Gupta, Novel Ternary Blend of PCDTBT, PCPDTBT and PC70BM for the Fabrication of Bulk Heterojunction Organic Solar Cells, Mater. Today: Proceedings 4 (2017) 5067–5073; 10.1016/j.matpr.2017.04.115.
- F.S.U. Fischer, D. Trefz, J. Back, N. Kayunkid, B. Tornow, S. Albrecht, K.G Yager, G. Singh, A. Karim, D. Neher, M. Brinkmann, S. Ludwigs, Highly Crystalline Films of PCPDTBT with Branched Side Chains by Solvent Vapor Crystallization: Influence on Opto-Electronic Properties, Adv. Mater., 27 (2015) 1223–1228; 10.1002/adma.201403475.
- Z. Ahmad, F. Touati, F.F. Muhammad, M. Ani Najeeb, R. A. Shakoor Effect of ambient temperature on the efficiency of the PCPDTBT:PC71BM BHJ solar cells, Z. Ahmad et al., Appl. Phys. A 123 (2017) 486; 10.1007/s00339-017-1098-8.
- Y. Liu, F. Liu, H.W. Wang, D. Nordlund, Z. Sun, S. Ferdous Thomas P. Russell, Sequential Deposition: Optimization of Solvent Swelling for High-Performance Polymer Solar Cells, ACS Appl. Mater. Interfaces, 7 (2015) 653-661; 10.1021/am506868g.
- J.C. Bijleveld, R. A. Melanie Verstrijden, M.M. Wienka, R.A.J. Janssen, Copolymers of diketopyrrolopyrrole and thienothiophene for photovoltaic cells, J. Mater. Chem., 21 (2011) 9224-9231; 10.1039/C1JM10961H.
- Z. Yi, X. Sun, Y. Zhao, Z. Li, Diketopyrrolopyrrole-Based π-Conjugated Copolymer Containing β-Unsubstituted Quintetthiophene Unit: A Promising Material Exhibiting High Hole-Mobility for Organic Thin-Film Transistors, Z. Yi et al., Chem. Mater., 24 (2012) 4350-4356; 10.1021/cm302341m.
- Hajduk, B.; Jarka, P.; Tański, T.; Bednarski, H.; Janeczek, H.; Gnida, P.; Fijalkowski, M. An Investigation of the Thermal Transitions and Physical Properties of Semiconducting PDPP4T:PDBPyBT Blend Films. Materials 2022, 15, 8392. [CrossRef]
- Borgesi, A.; Tallarida, G.; Amore, G.; Cazzaniga, F.; Queirolo, F.; Alessandri, M.; Sassela, A. Influence ofroughness and grain dimension on the optical functions of polycrystalline silicon films. Thin Solid Film. 1998, 313–314, 243–247. [CrossRef]
- Lora L. Spangler, John M. Torkelson, J. Scot Royal, Influence of solvent and molecular weight on thickness and surface topography of spin-coated polymer films, Polymer Engineering and Science 30/11 (1990) 644-653.
- Stephanie L. Fronk, Ming Wang, Michael Ford, Jessica Coughlin, Cheng-Kang Mai, Effect of chiral 2-ethylhexyl side chains on chiroptical properties of the narrow bandgap conjugated polymers PCPDTBT and PCDTPT, Chemical Science, 7/ 8 (2016) 5313-5321.
- Yongqiang Wang, Tao An, Jiawei Xue, Realizing high detectivity organic photodetectors in visible wavelength by doping highly ordered polymer PCPDTBT, Organic Electronics, 82 (2020) 105700.
- Lei Wang, Ming Hu, Youdi Zhang, Zhongyi Yuan, Yu Hu, Xiaohong Zhao, Yiwang Chen, High molecular weight polymeric acceptors based on semi-perfluoroalkylated perylene diimides for pseudo-planar heterojunction all-polymer organic solar cells, Polymer 255 (2022) 125114.
- Joseph Nathanael, D. Mangalaraj, N. Ponpandian, Controlled growth and investigations on the morphology and mechanical properties of hydroxyapatite/titania nanocomposite thin films, Composites Science and Technology 70 (2010) 1645–1651.
- Daniela Predoi, Stefan Talu , Stelut Carmen Ciobanu, Simona Liliana Iconaru, Robert Saraiva Matos, Henrique Duarte da Fonseca Filho, Exploring the physicochemical traits, antifungal capabilities, and 3D spatial complexity of hydroxyapatite with Ag+–Mg2+ substitution in the biocomposite thin films, Micron 184 (2024) 103661.
- Jae Seung Ha, Kyung Hwan Kim, Dong Hoon Choi. ,5-Bis(2-octyldodecyl)pyrrolo[3,4-c]pyrrole-1,4-(2H,5H)-dione-Based DonorAcceptor Alternating Copolymer Bearing 5,5’-Di (thiophen-2-yl)-2,20 -biselenophene Exhibiting 1.5 cm2V-1s-1Hole Mobility in Thin-Film Transistors, J. S. Ha et al., J. Am. Chem. Soc. 133 (2011) 10364–10367.
Figure 1.
Chemical structures of PCPDTBT (a) and PDPP4T (b).
Scheme 1.
The ellipsometric model used for the measurement fittings.
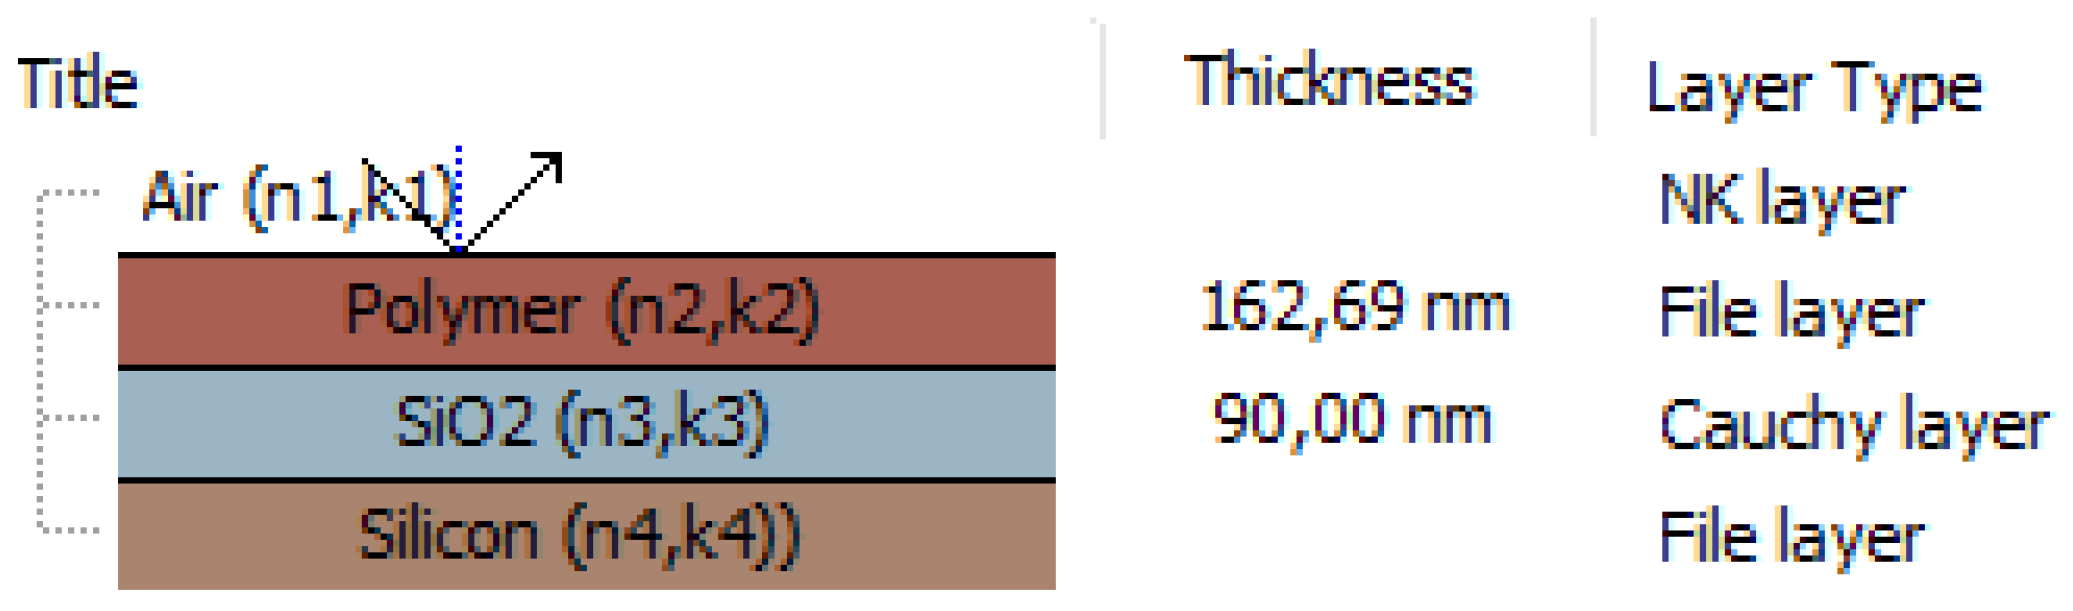
Figure 2.
Absorption spectra, determined using Spectra Ray 3(a) and the energy gaps, determined with Tauc graphical method (b).
Figure 2.
Absorption spectra, determined using Spectra Ray 3(a) and the energy gaps, determined with Tauc graphical method (b).
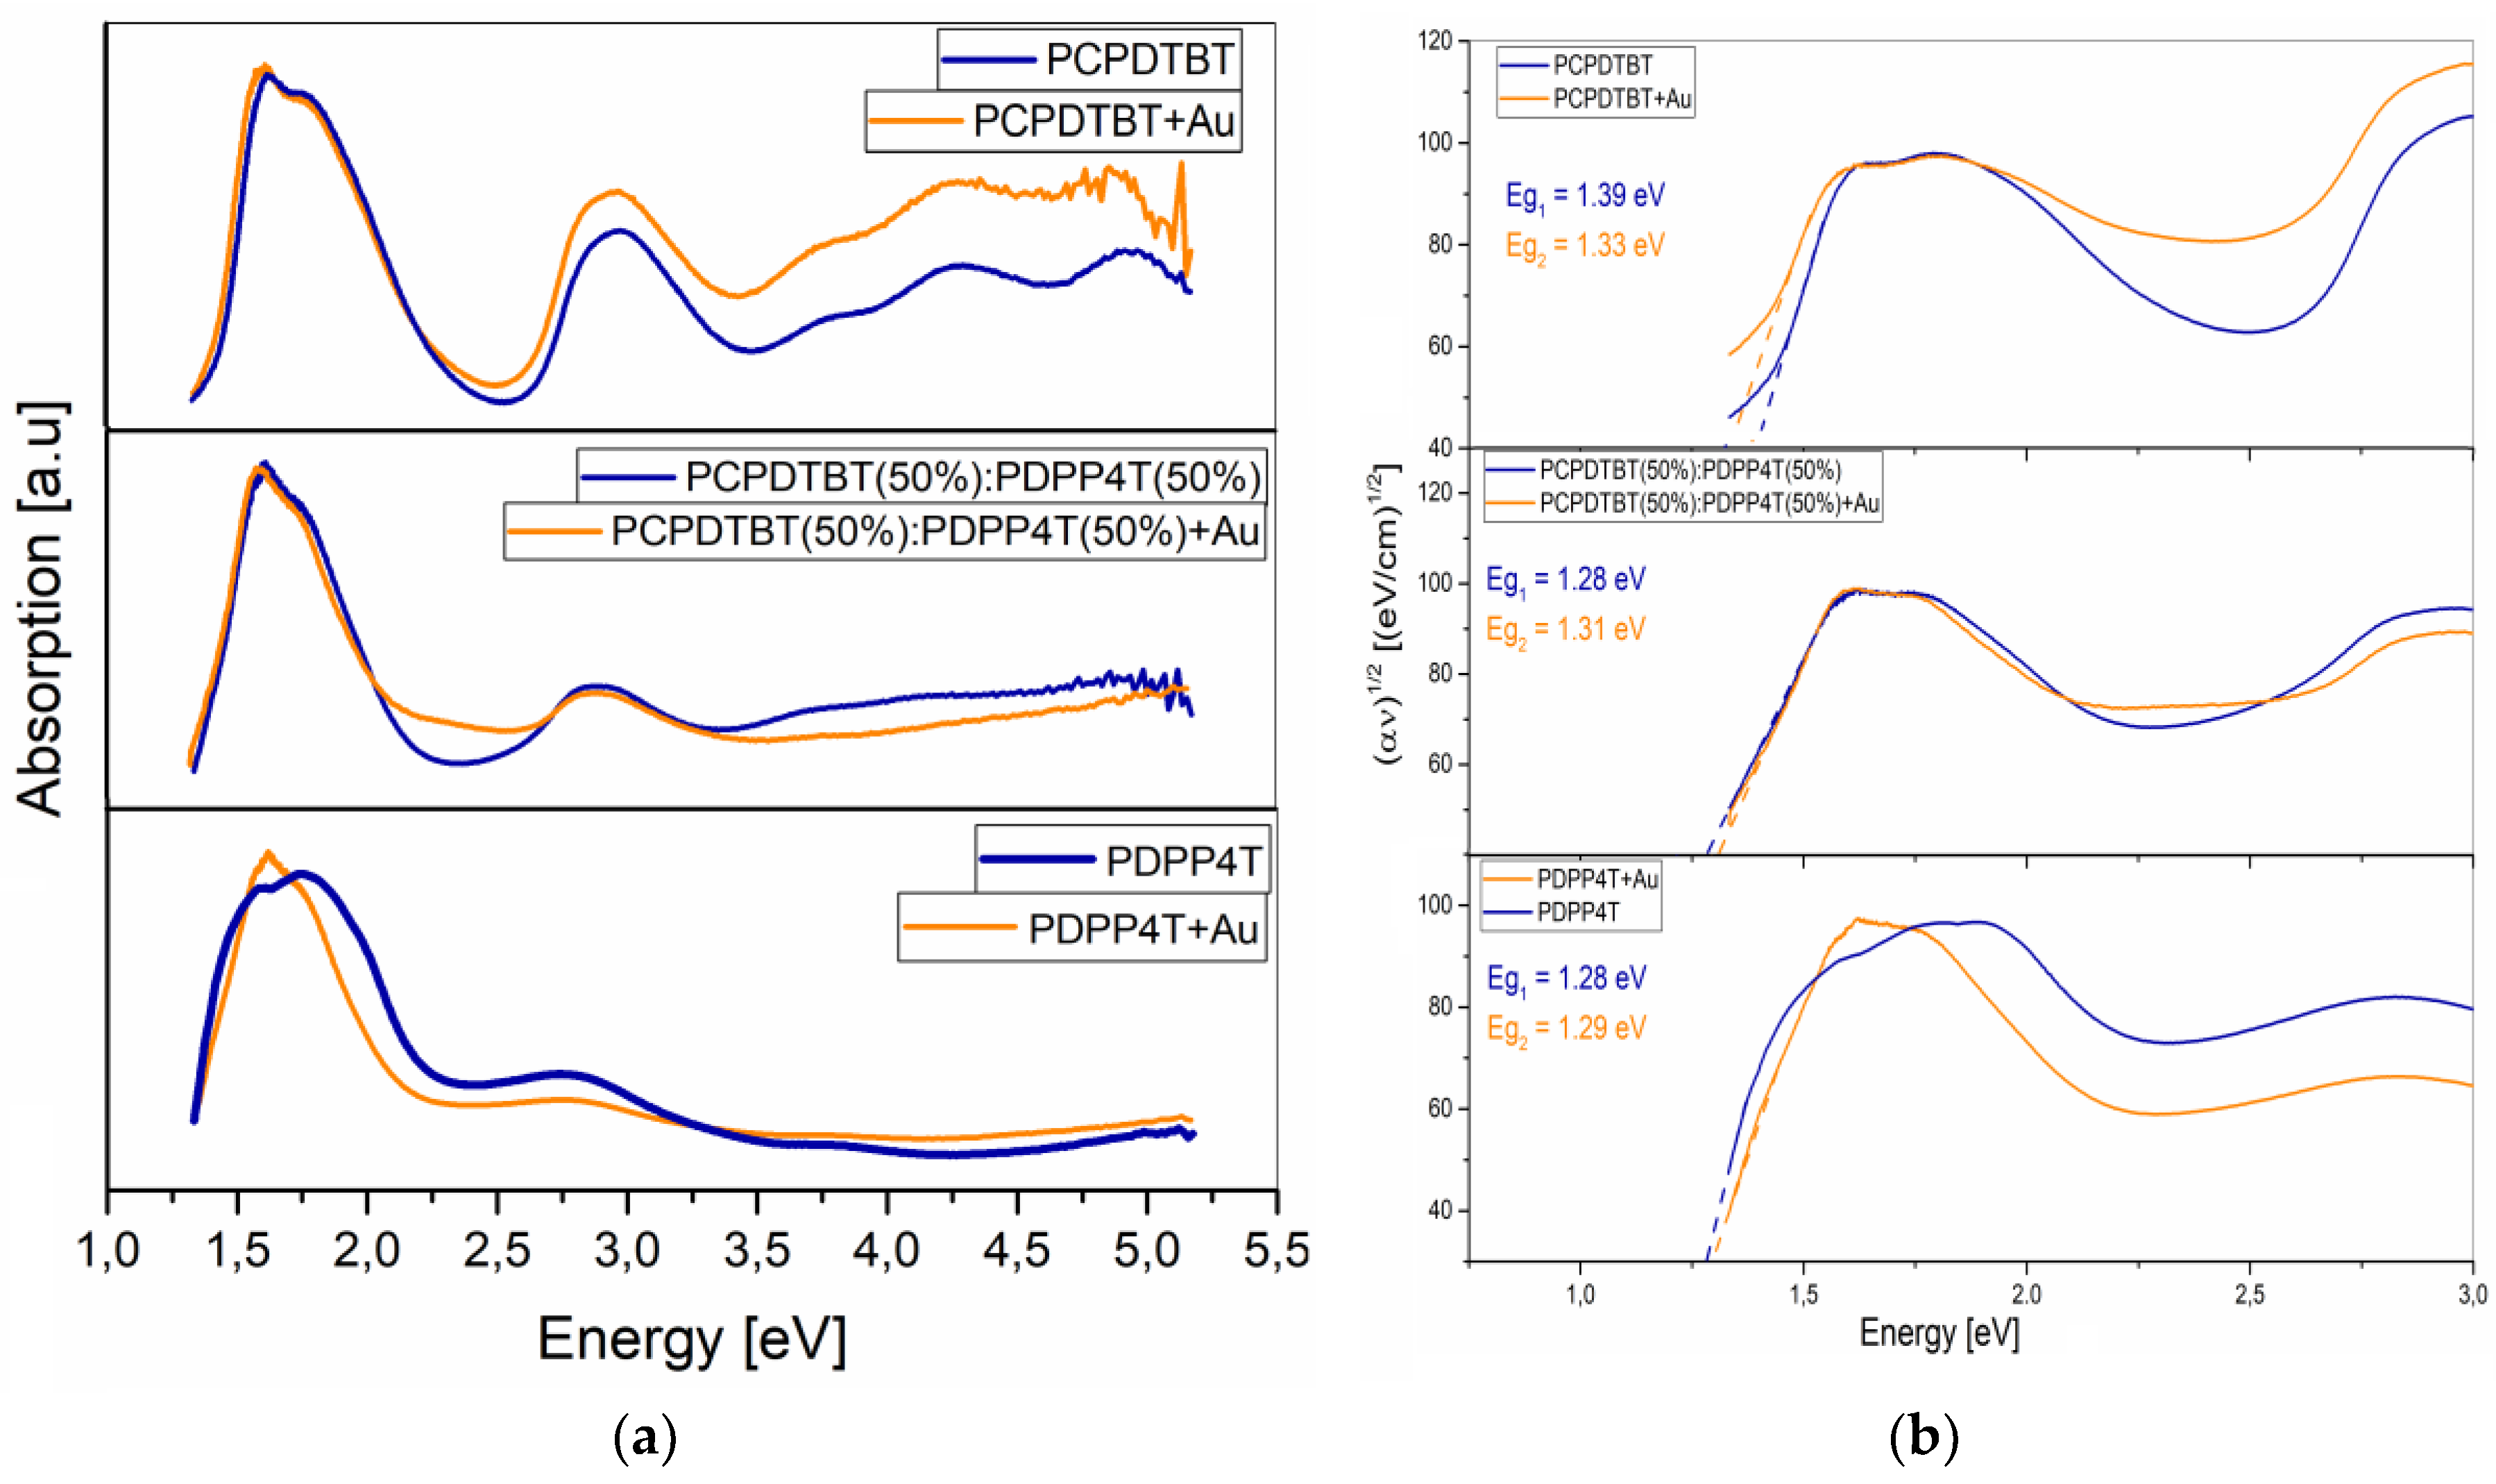
Figure 3.
Δ at 930 nm as a function of temperature for PCPDTBT (a), PDPP4T (c), their 50% blend (e) and their AnNPs composites with 10% Au (b,d,f).
Figure 3.
Δ at 930 nm as a function of temperature for PCPDTBT (a), PDPP4T (c), their 50% blend (e) and their AnNPs composites with 10% Au (b,d,f).
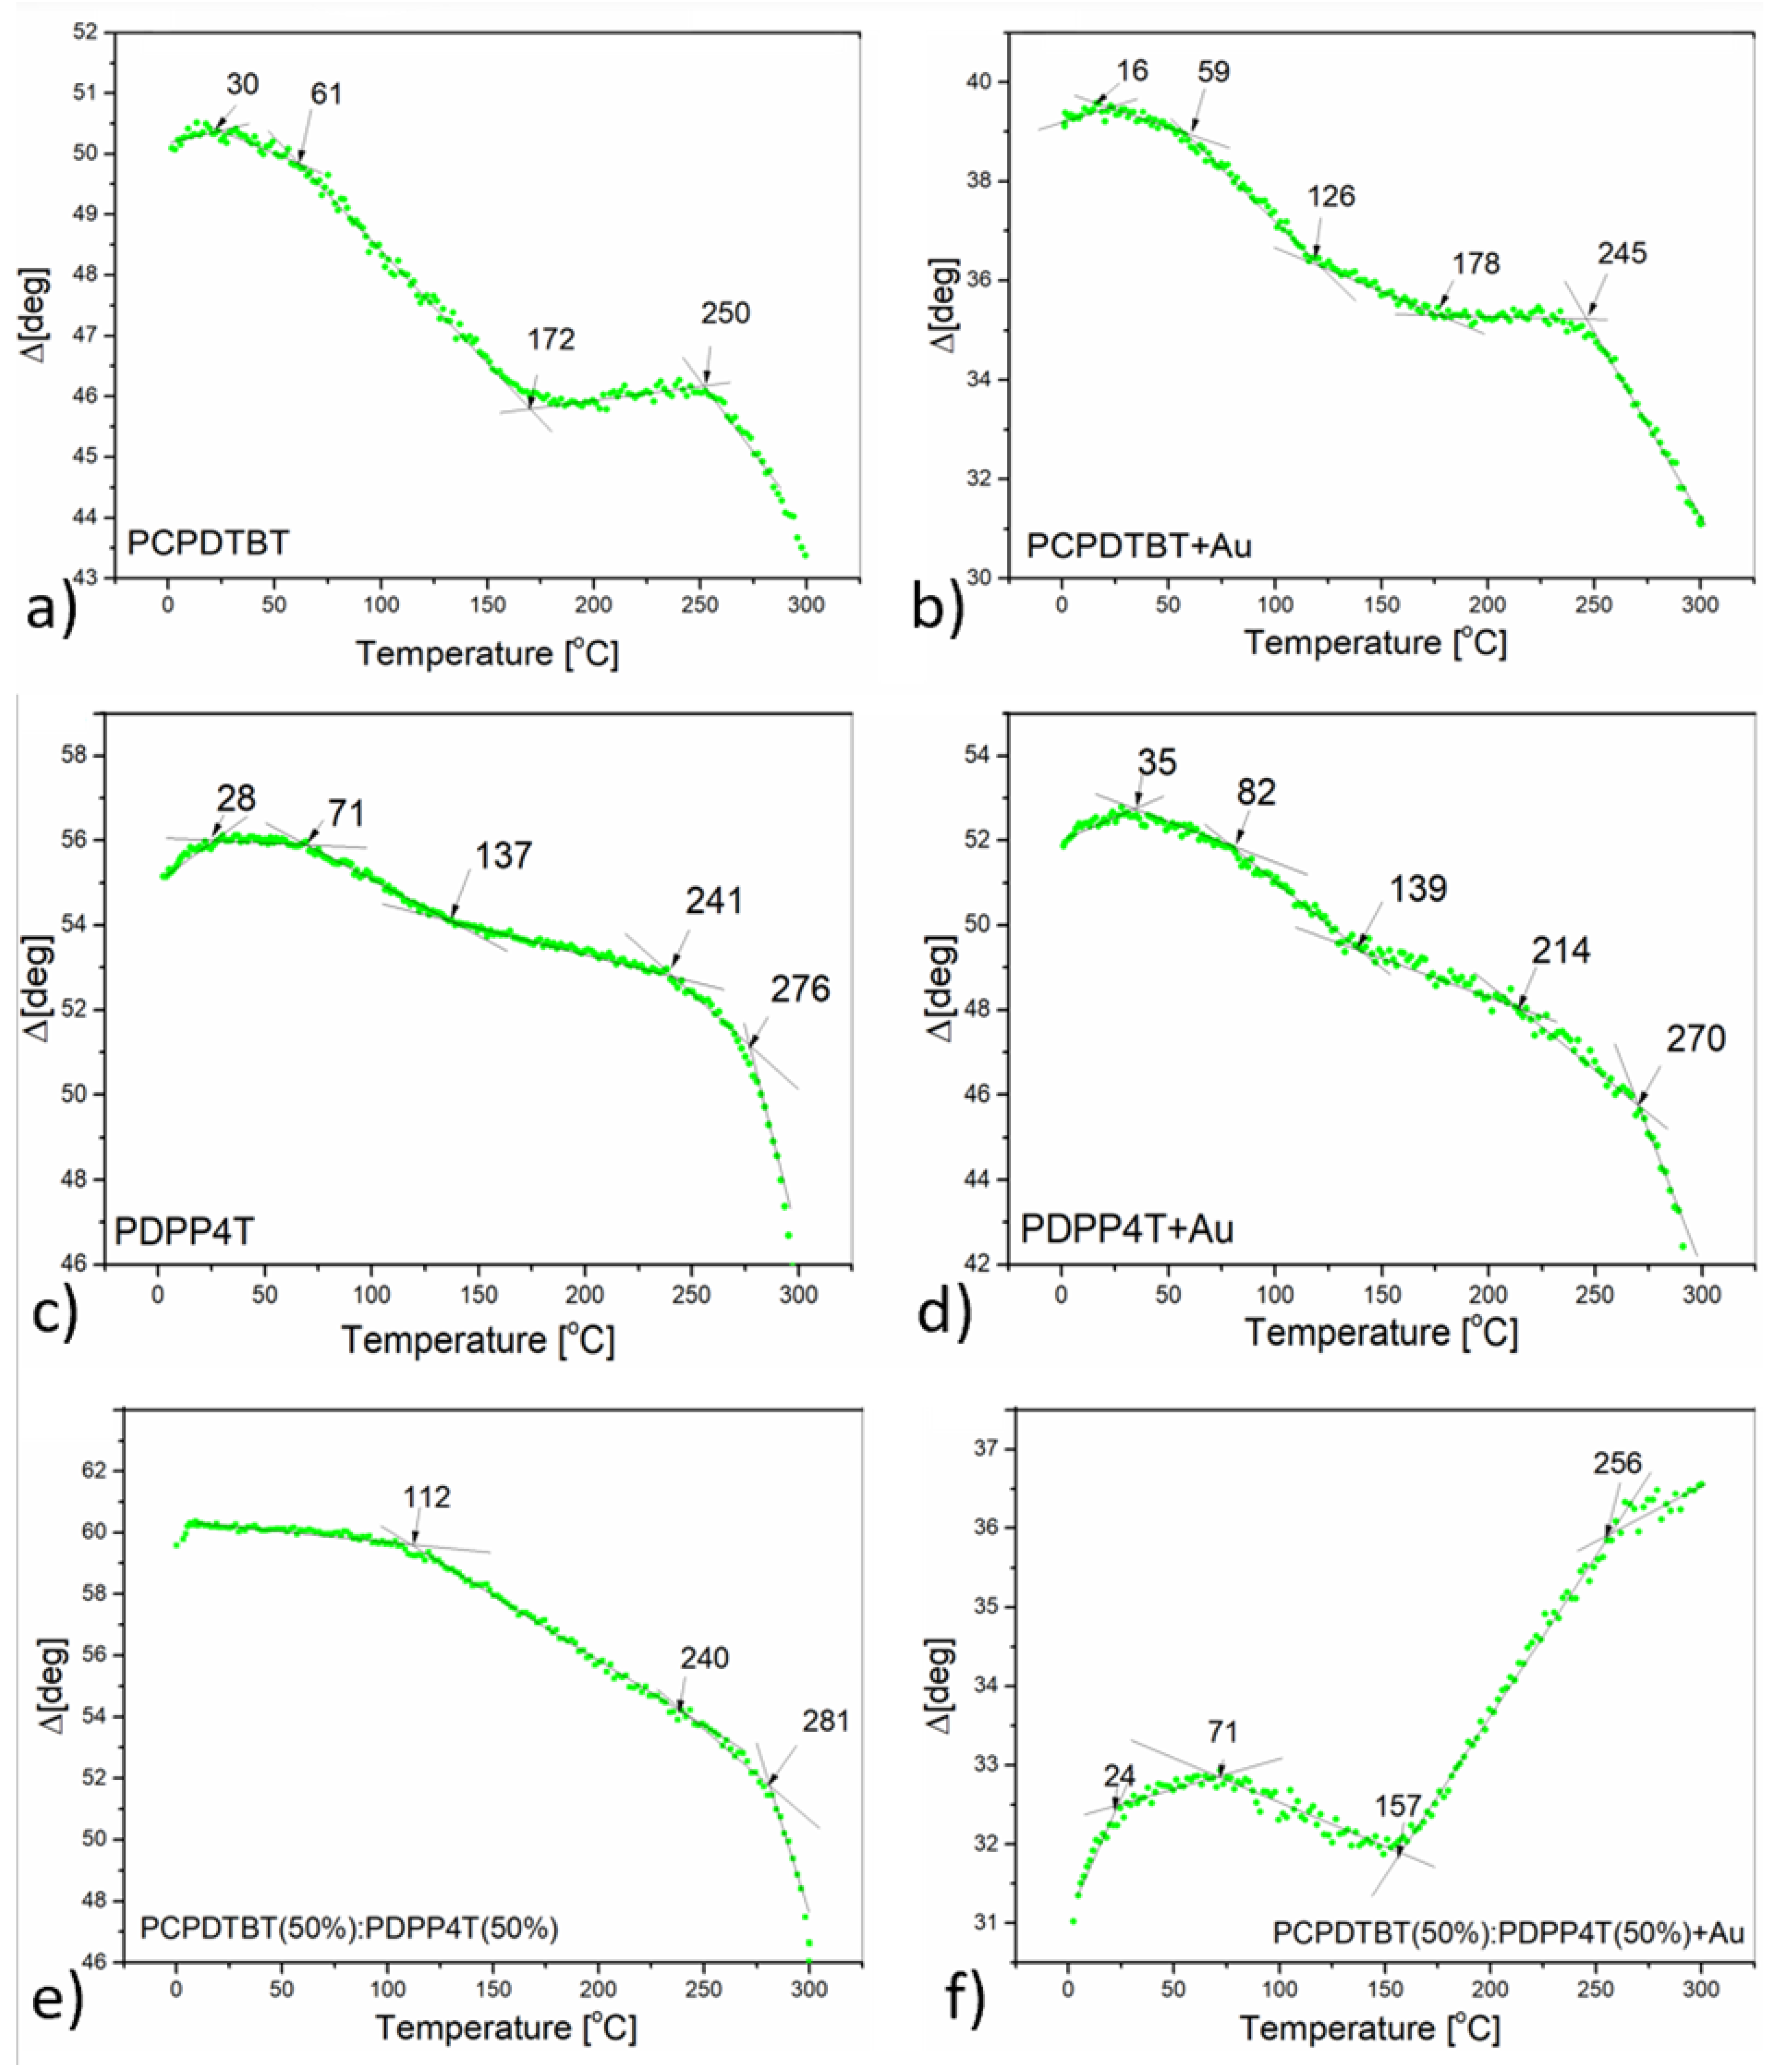
Figure 4.
DSC plots, with a heating rate of 20°C/min, for pure PCPDTBT, PDPP4T and for PCPDTBT:PDPP4T (1:1) blend.
Figure 4.
DSC plots, with a heating rate of 20°C/min, for pure PCPDTBT, PDPP4T and for PCPDTBT:PDPP4T (1:1) blend.
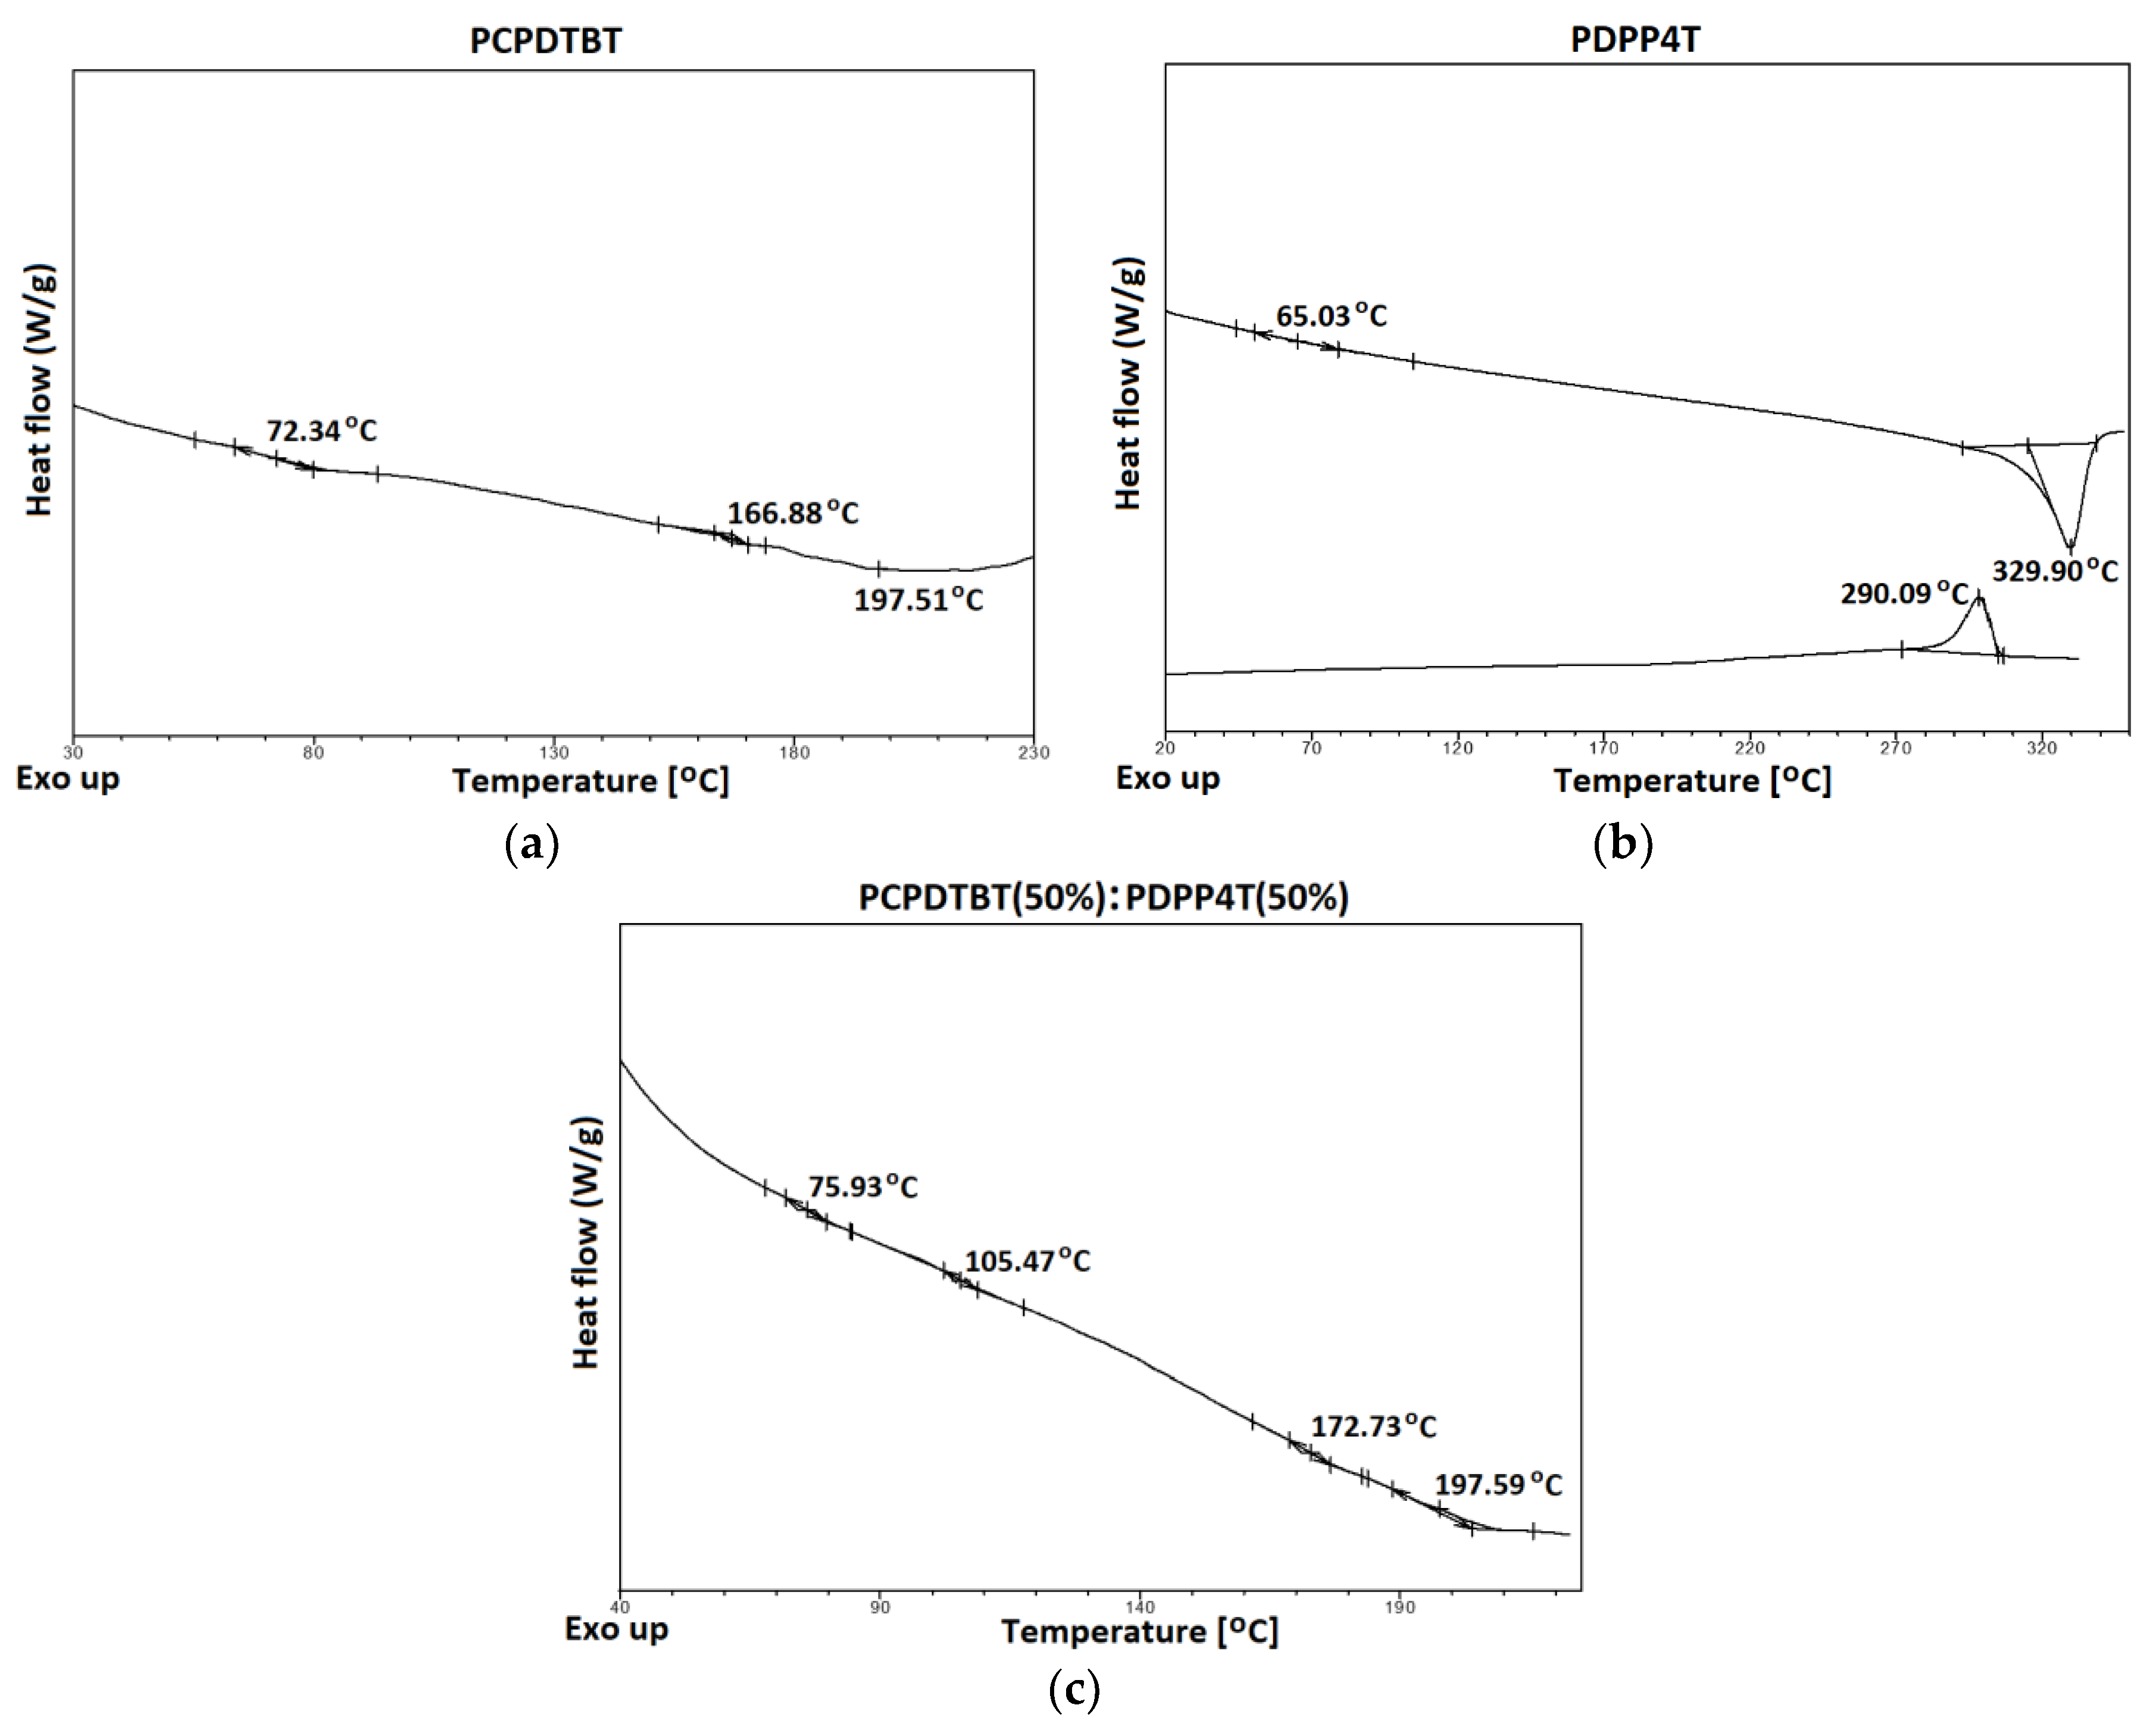
Figure 5.
Phase diagram of PCPDTBT:PDPP4T blend films and their AuNPs composites.
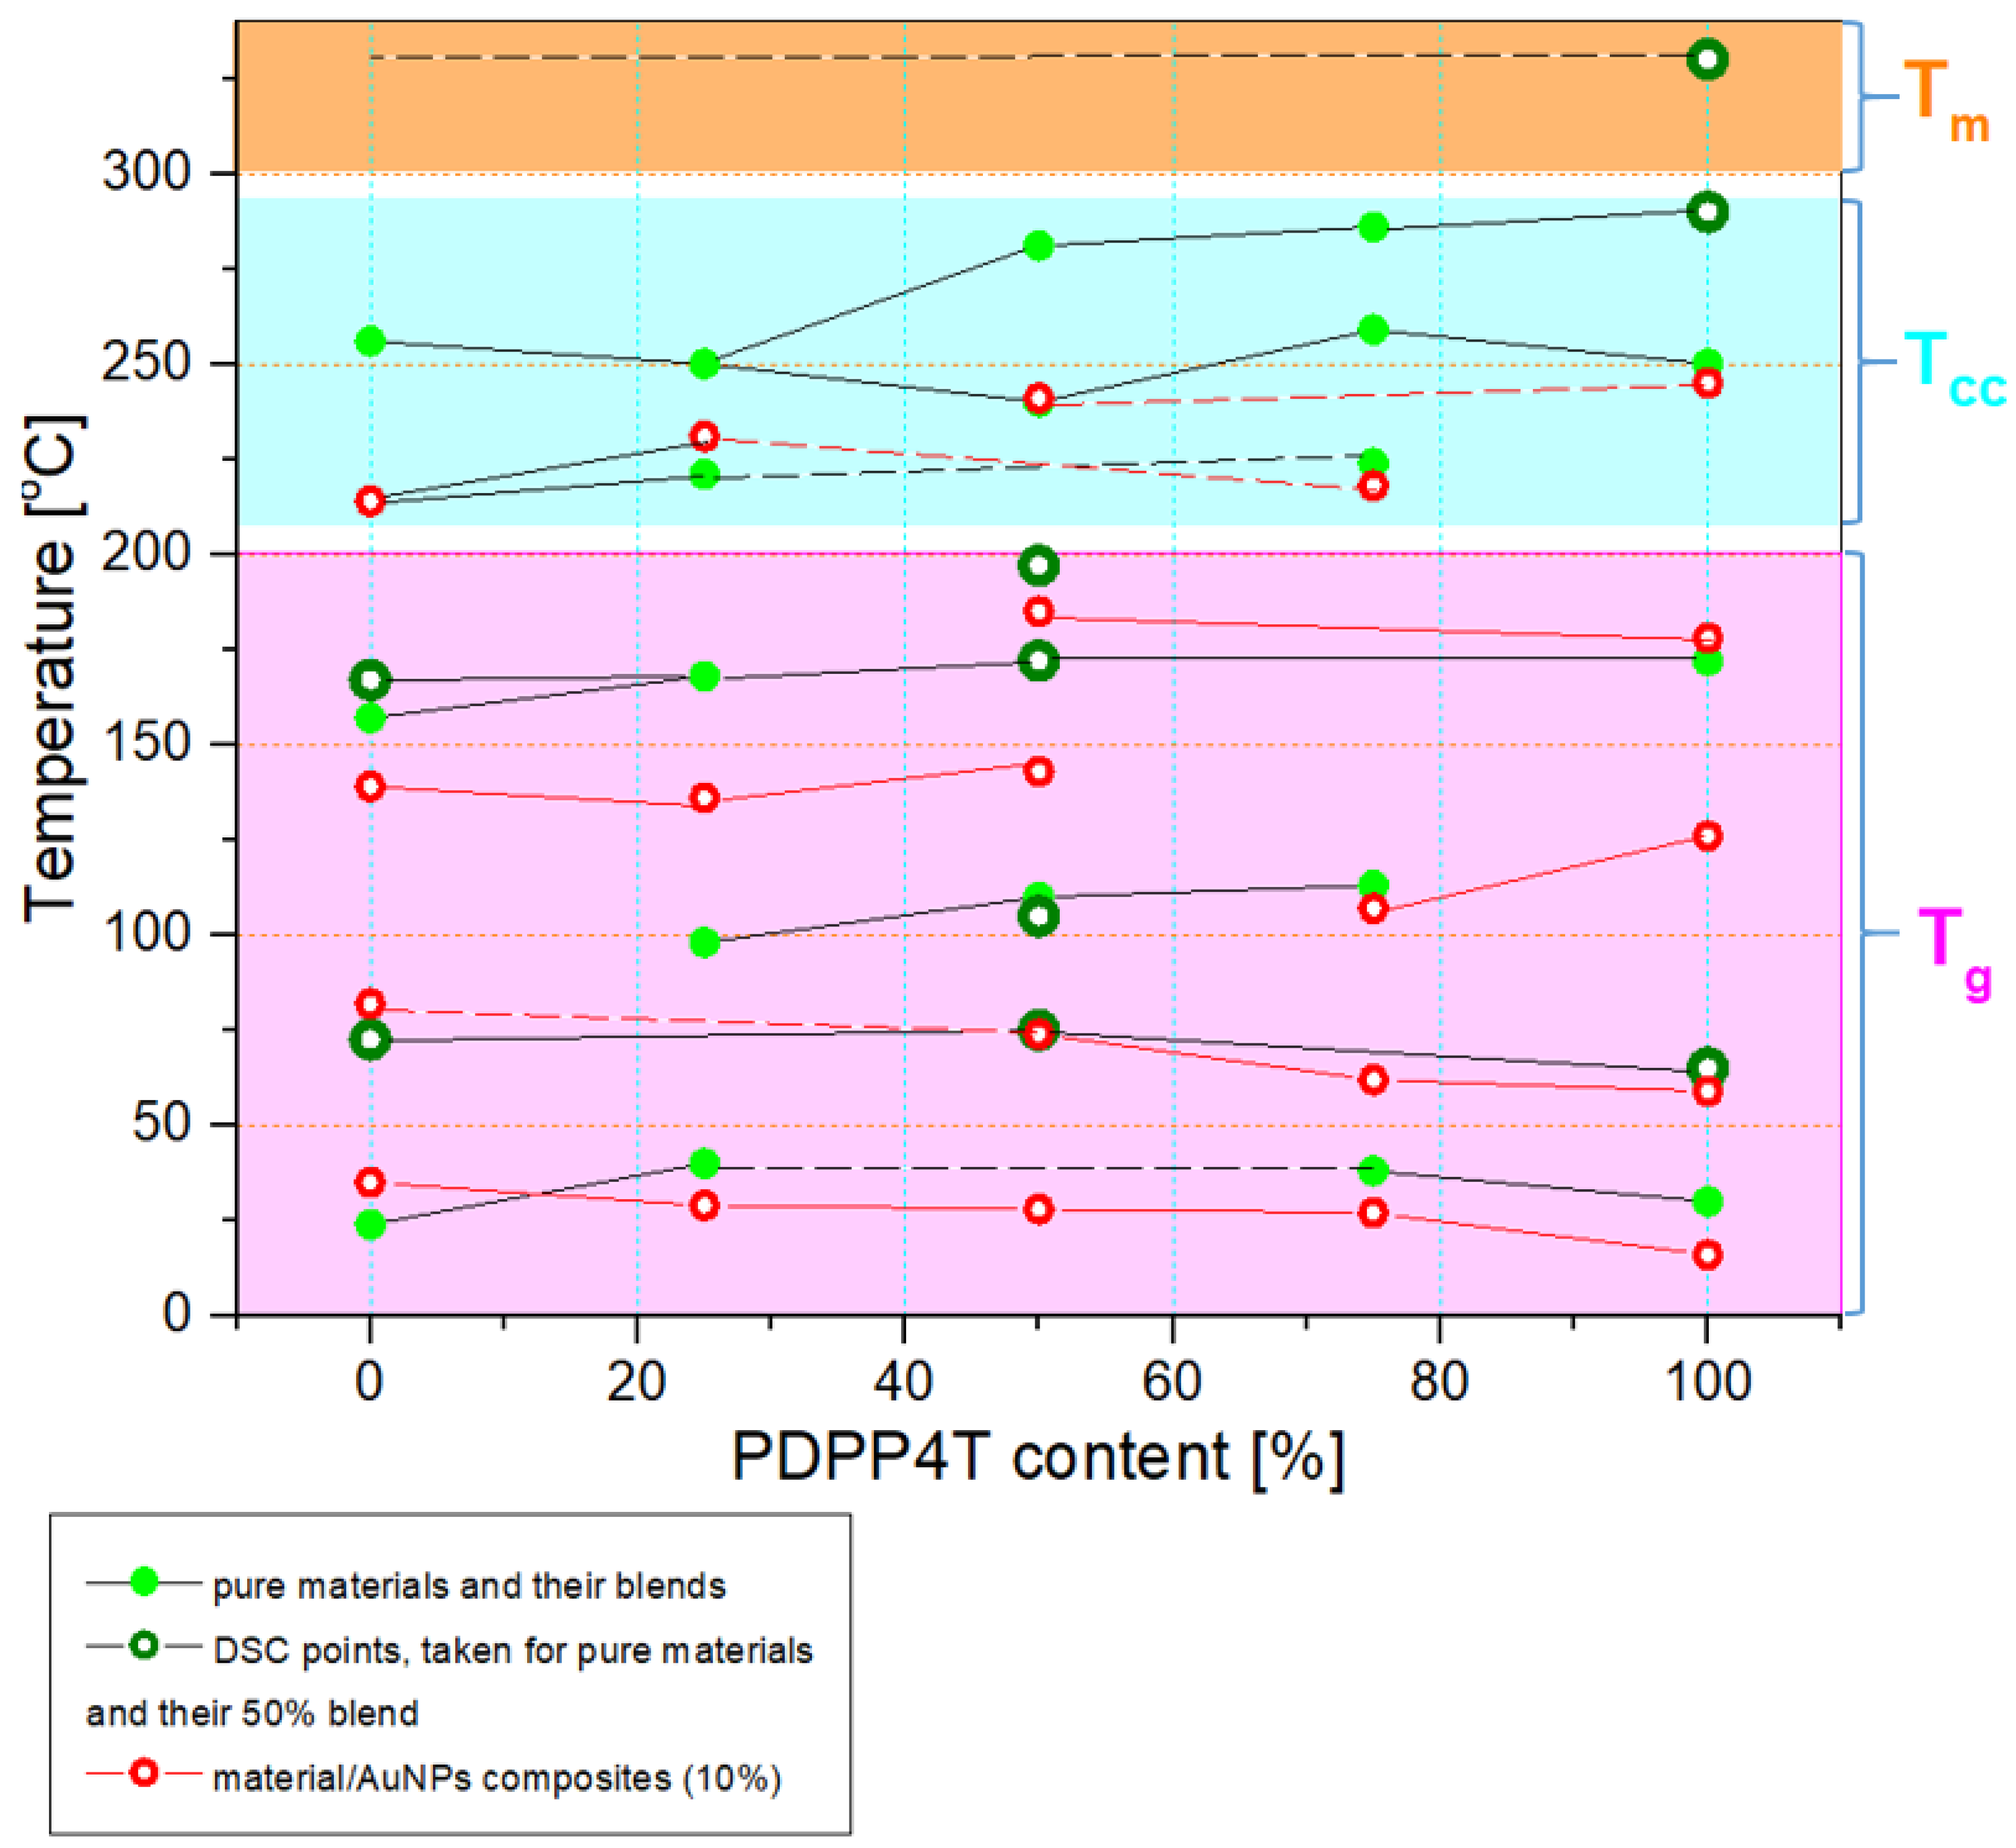
Figure 6.
The XRD patterns of PCPDTBT (a), PDPP4T (b), 1:1 blend (c) and their AuNPs composites.
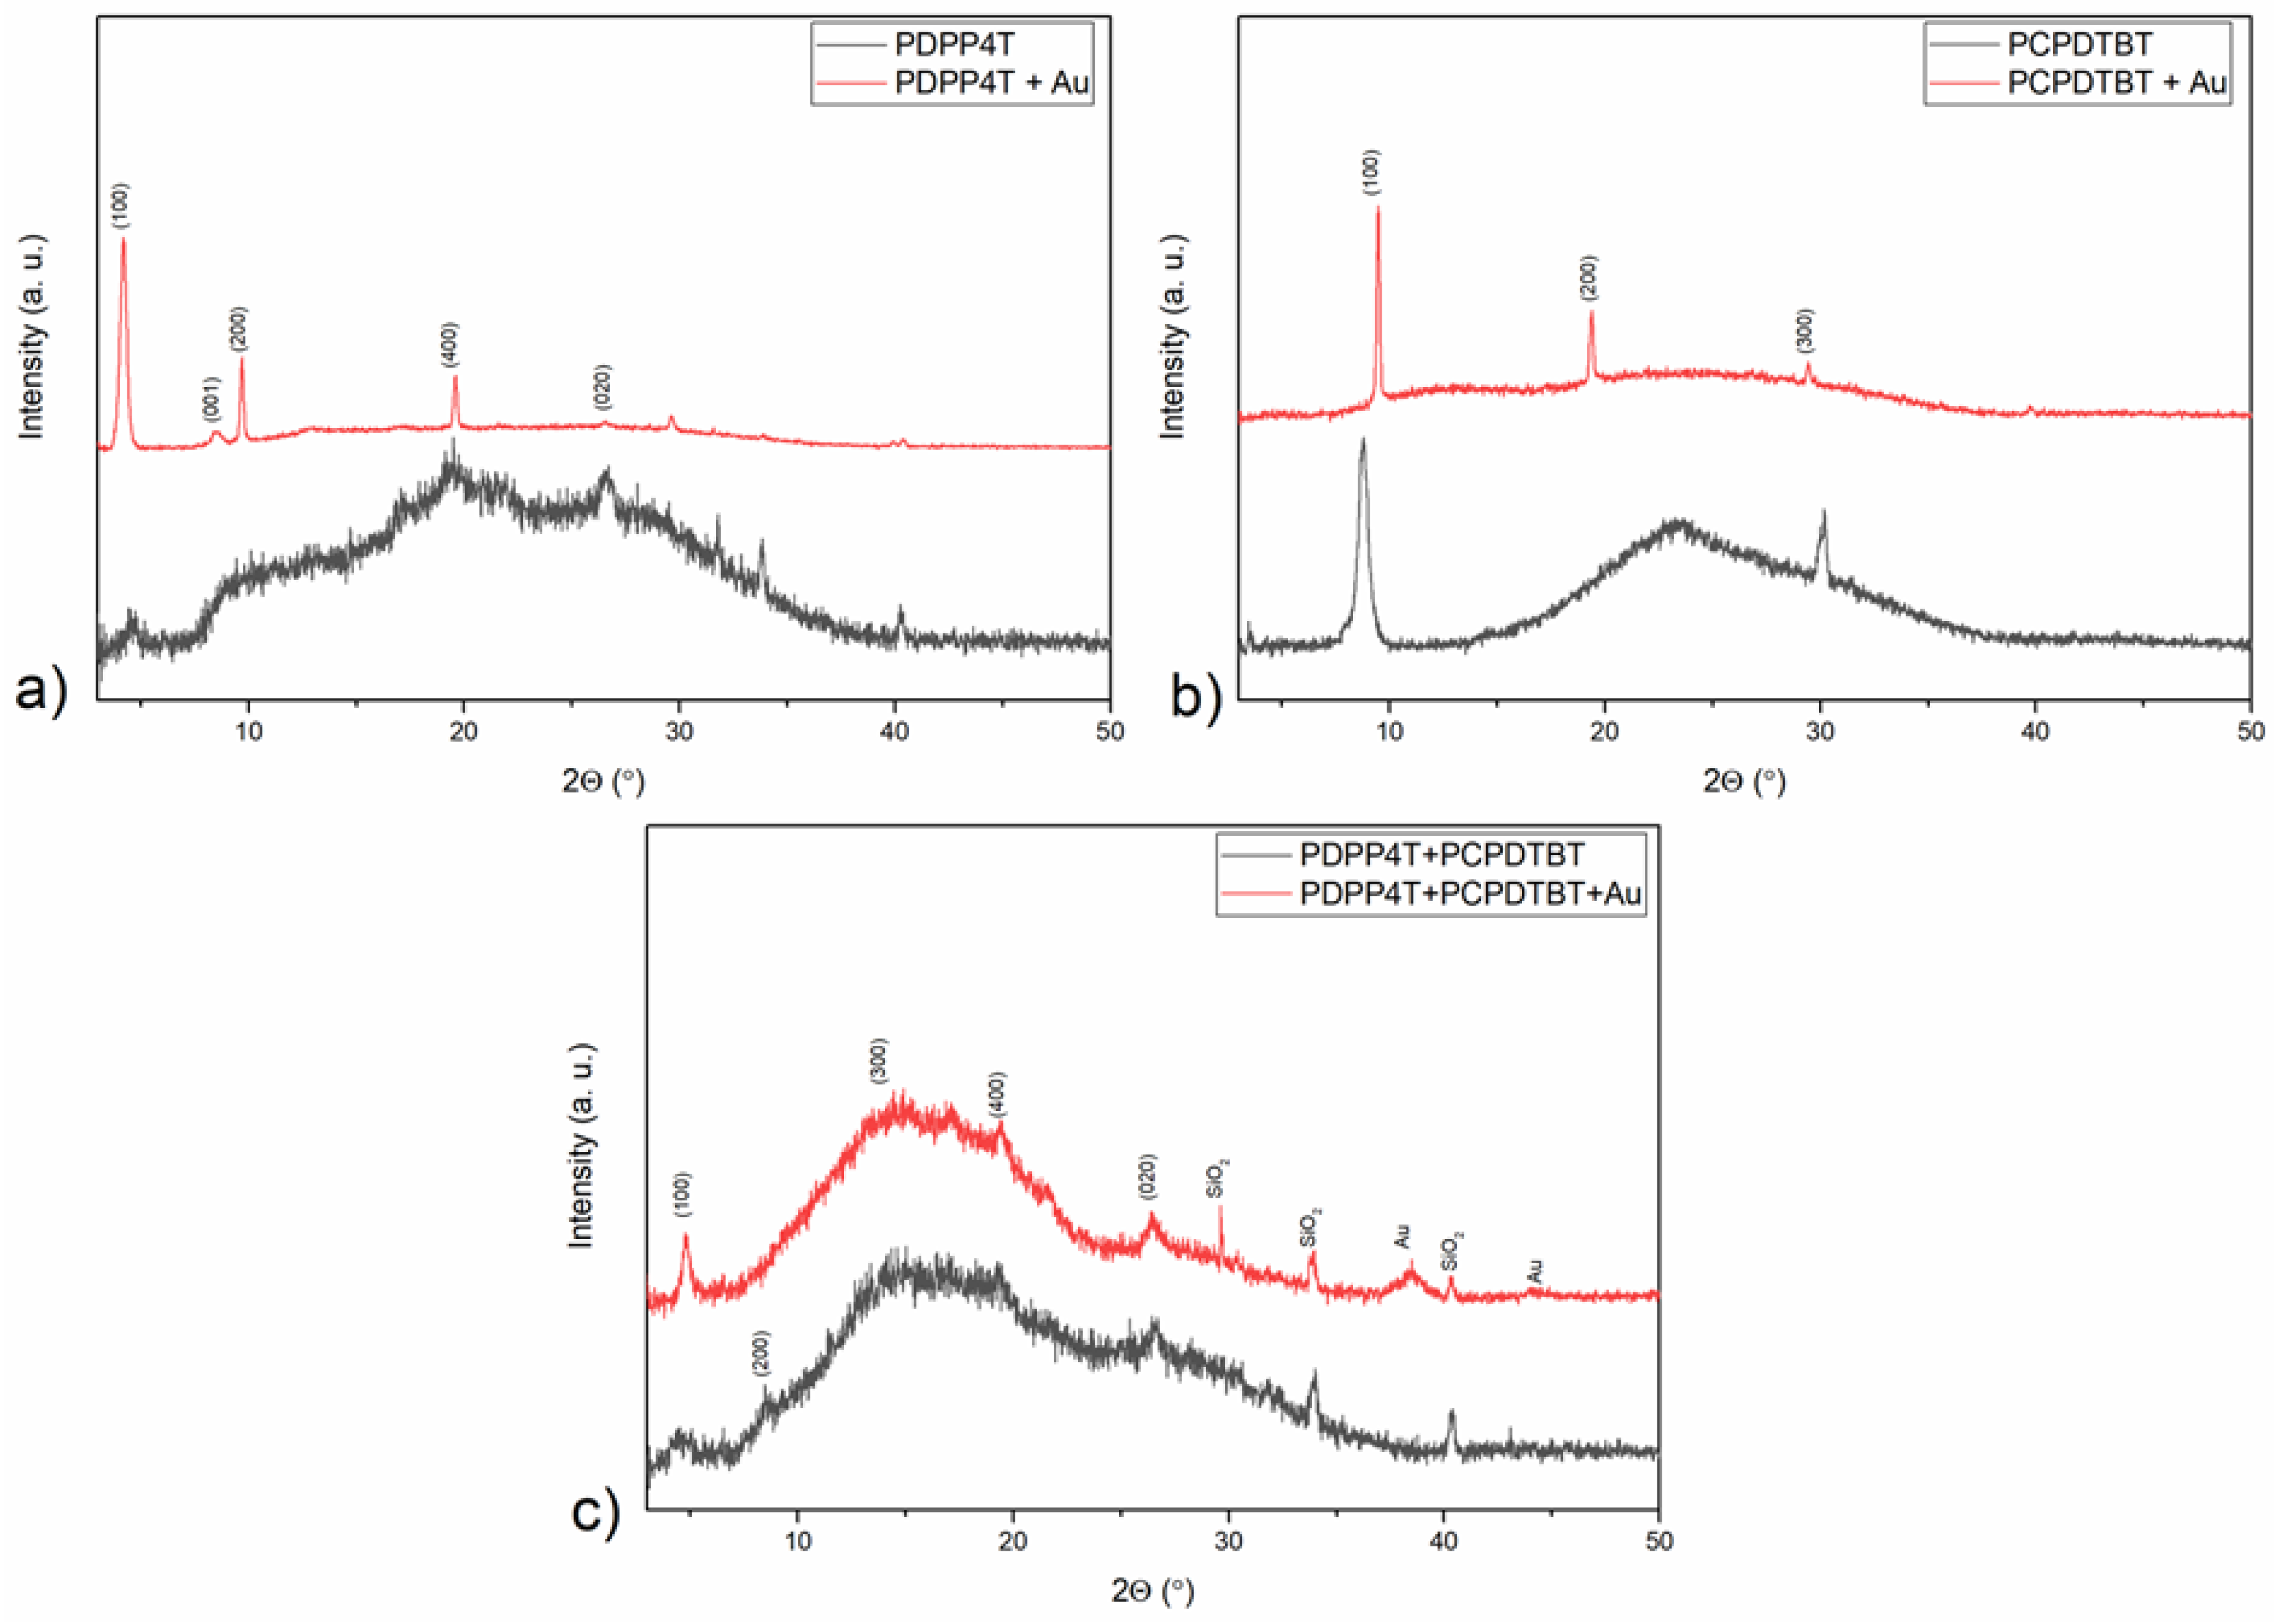
Figure 7.
Surface topography of the PCPDTBT (a), PDPP4T (c), 1:1 blend (e) and their corresponding AuNPs composites (b, d, f) obtained using AFM microscope.
Figure 7.
Surface topography of the PCPDTBT (a), PDPP4T (c), 1:1 blend (e) and their corresponding AuNPs composites (b, d, f) obtained using AFM microscope.
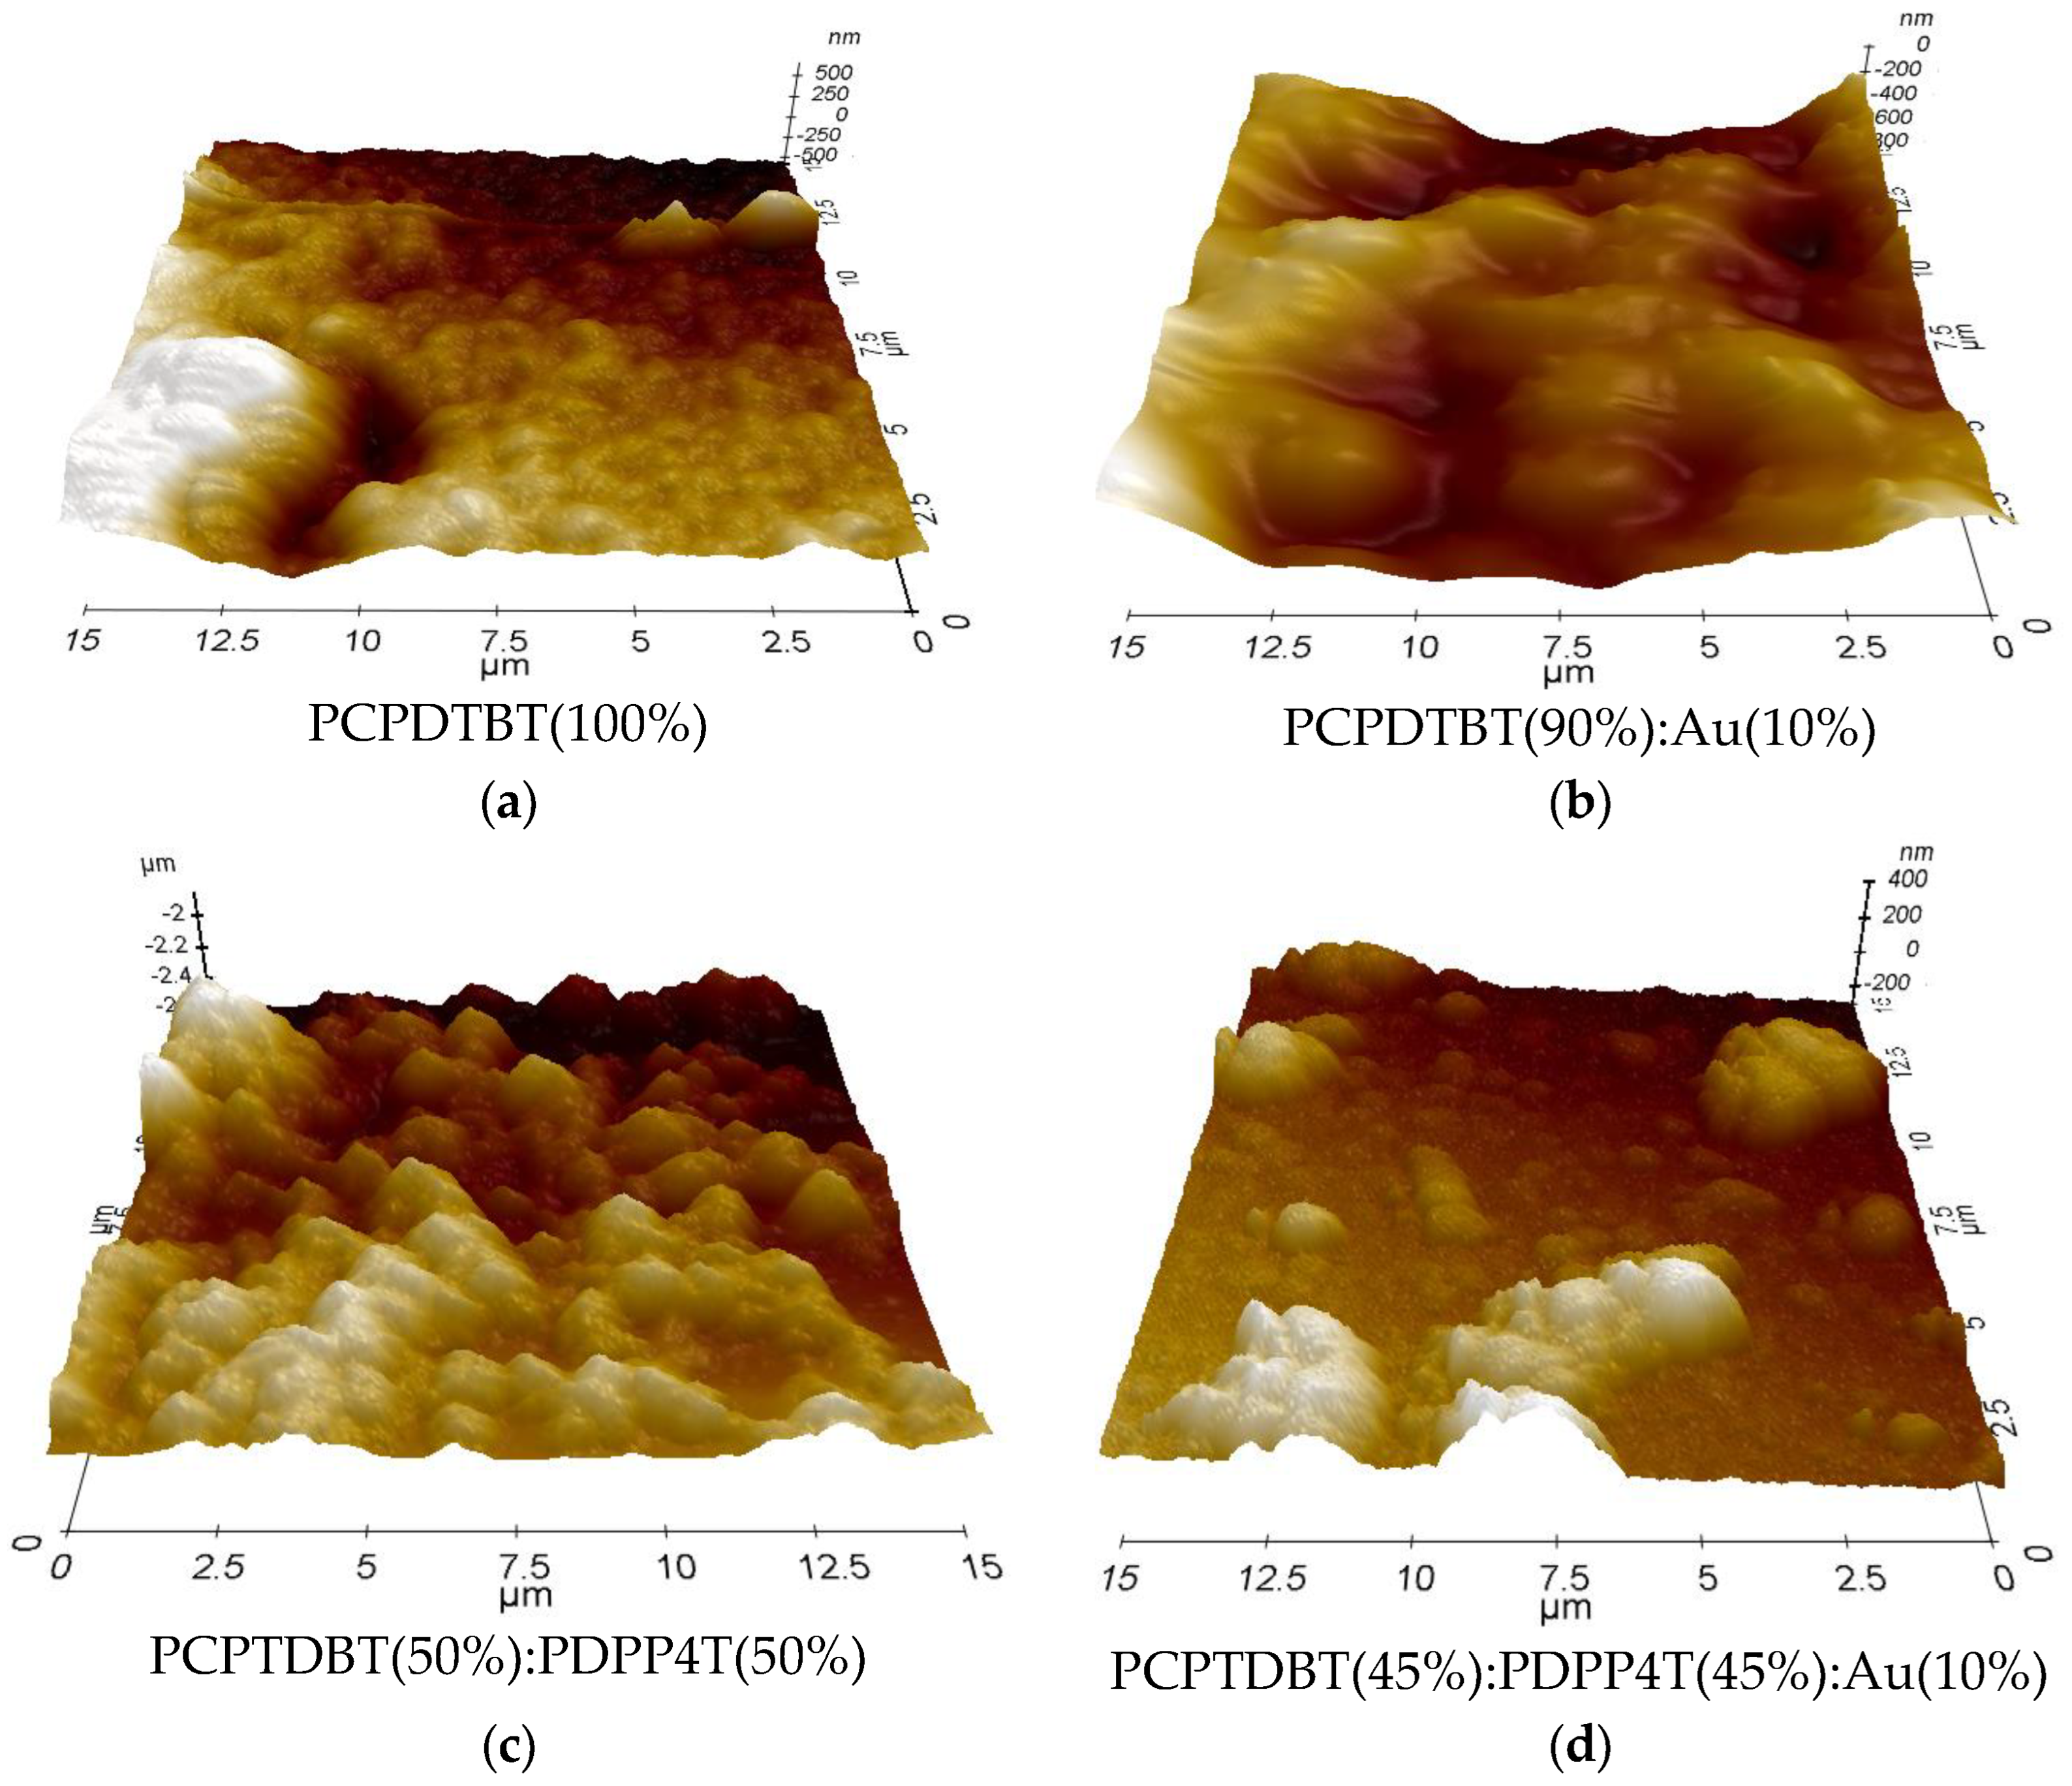
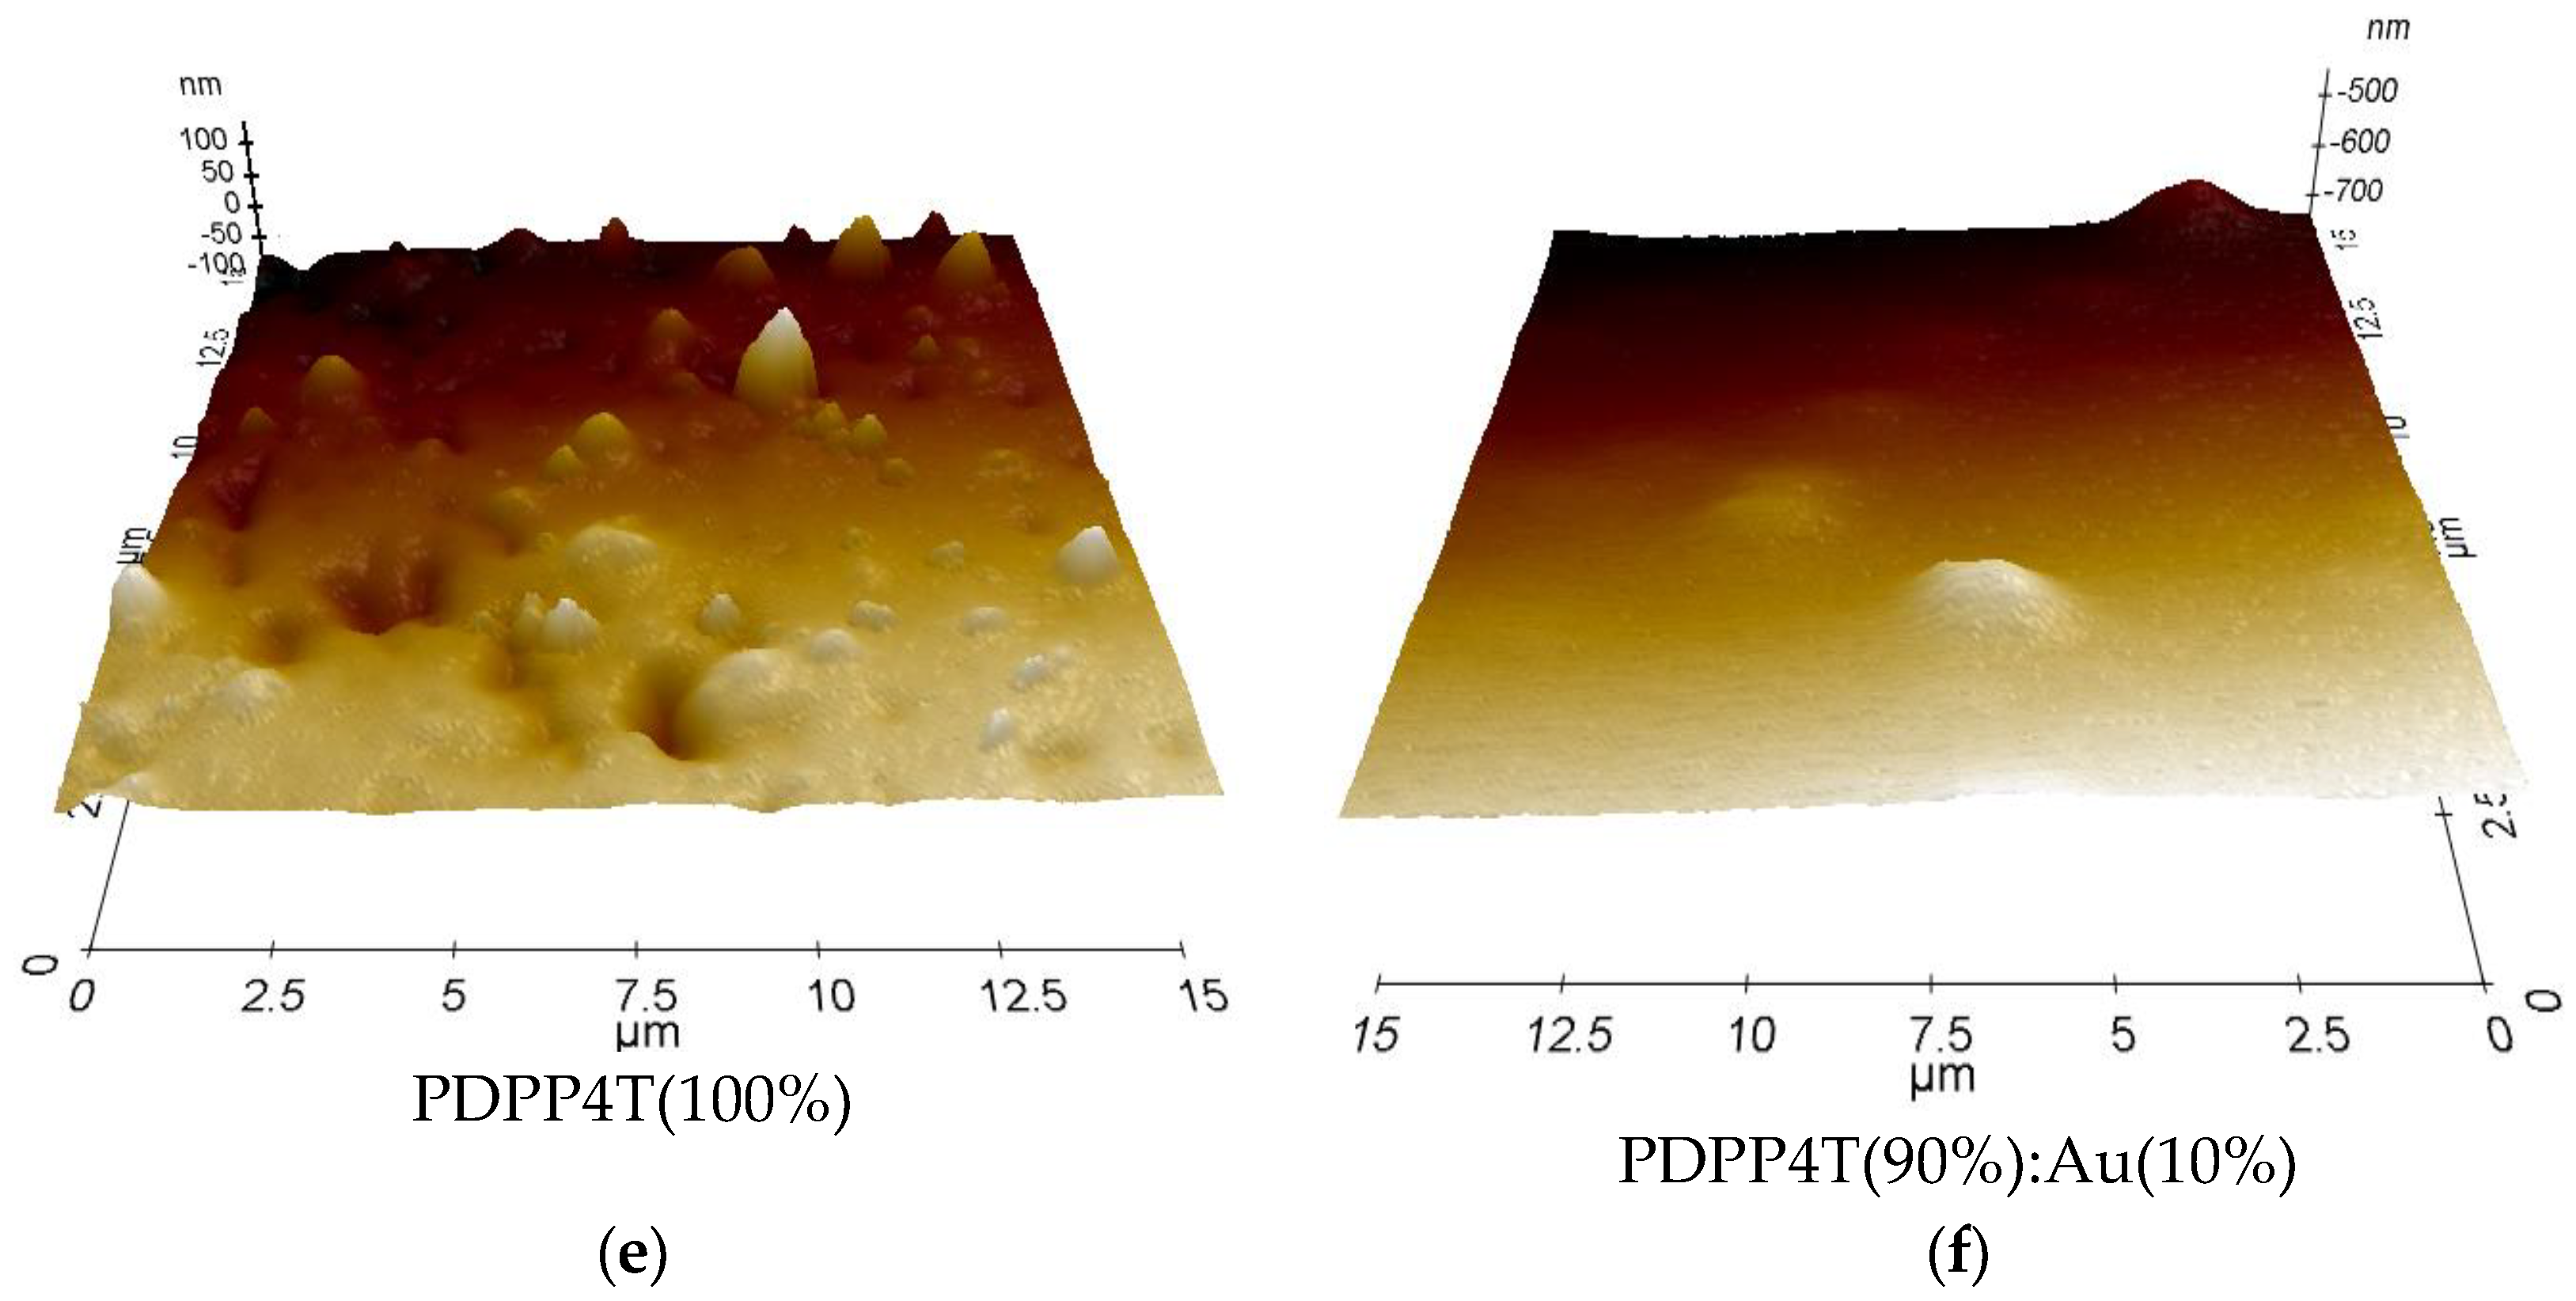
Figure 8.
The mean square root of the roughness of the tested layers.
Scheme 2.
Representation of the localized surface plasmonic effect in the polymer/AuNPs composite.
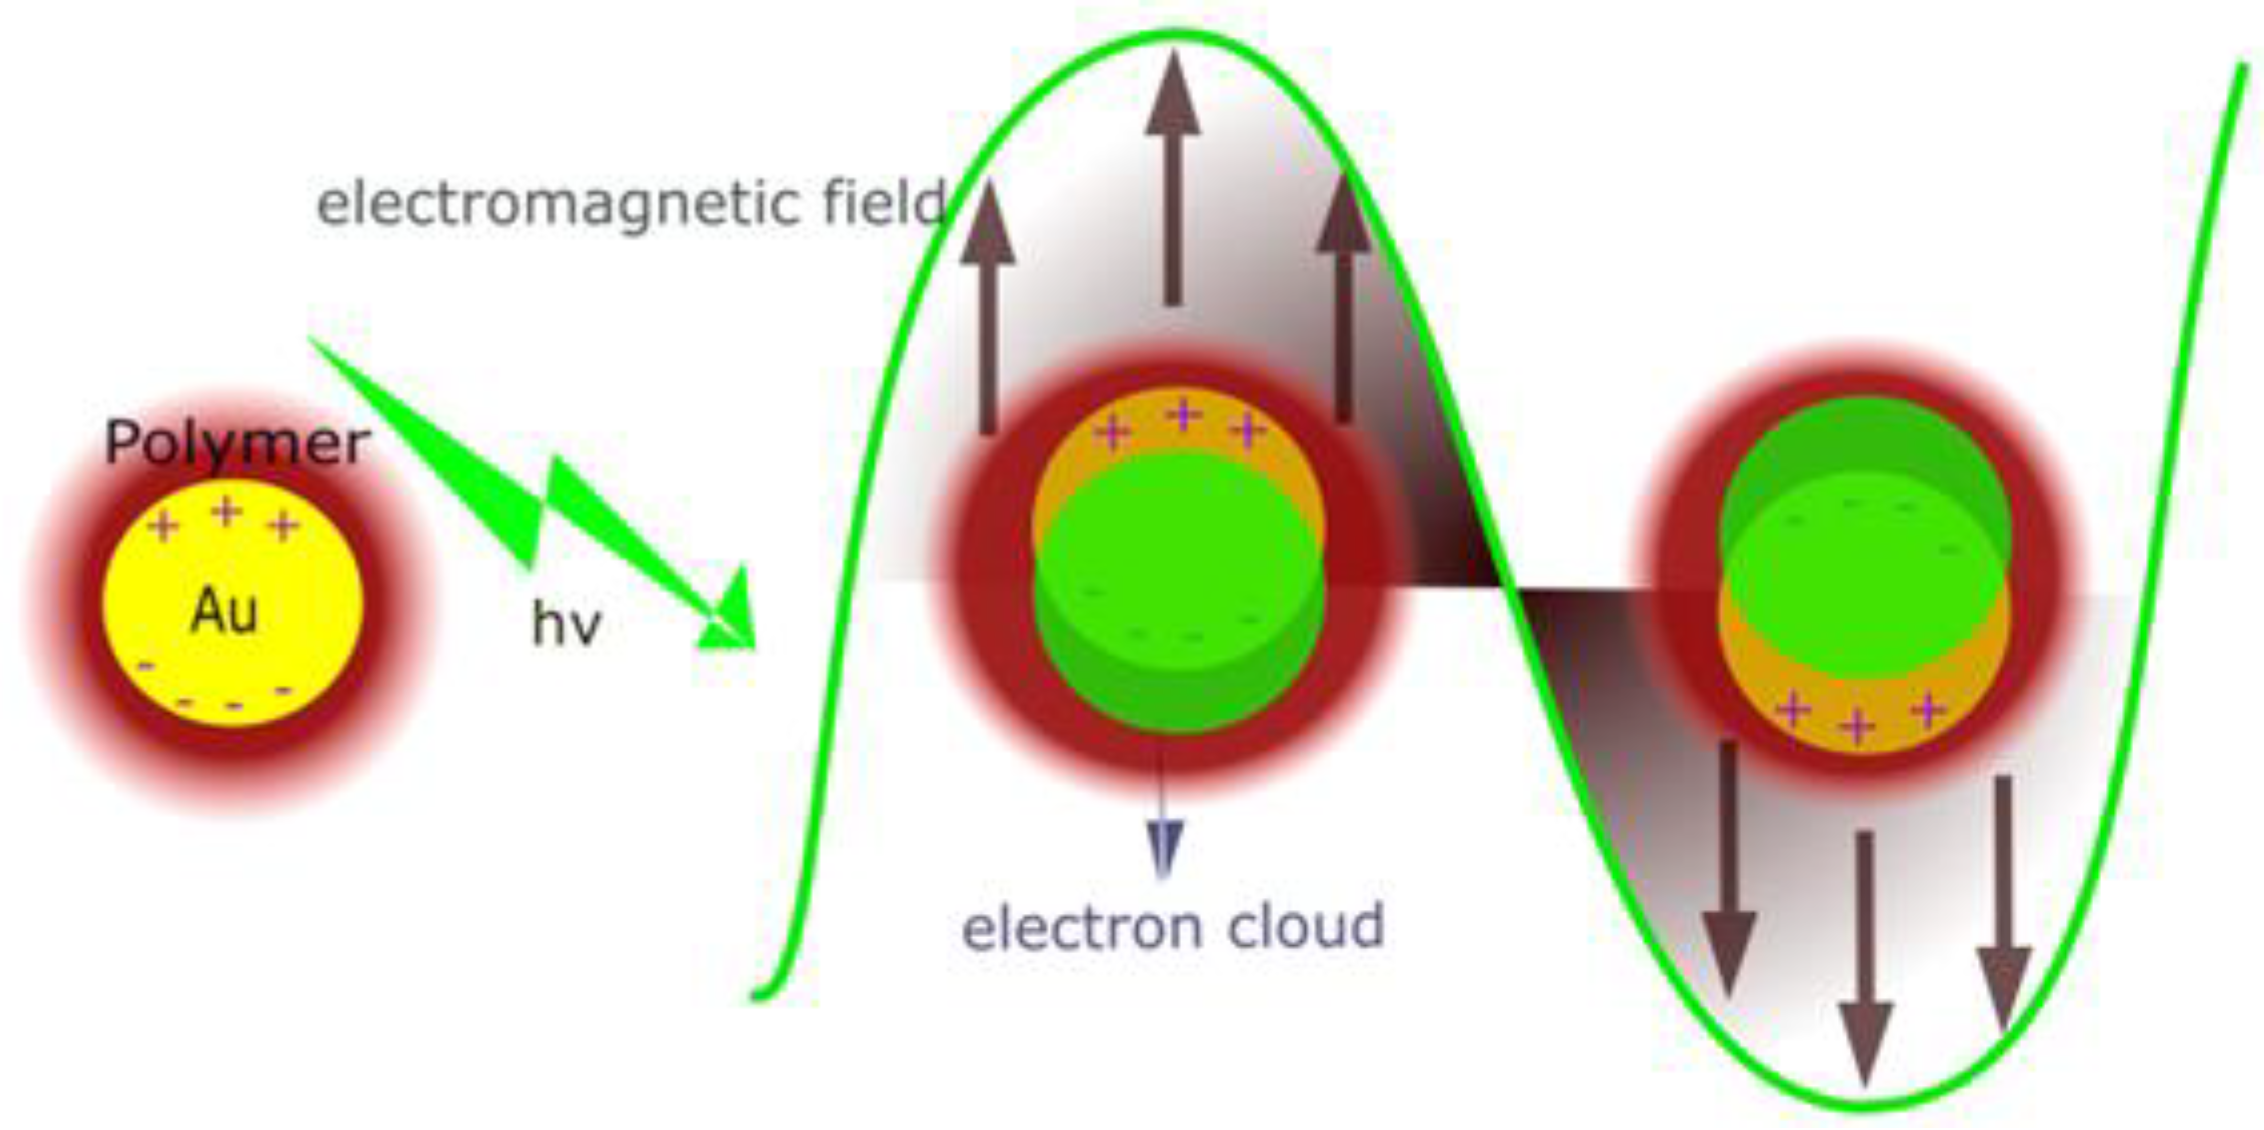

Table 1.
The individual concentrations of pure materials and their blends.
| Sample No | 1 | 2 | 3 | 4 | 5 |
|---|---|---|---|---|---|
| PCPDTBT [%] | 100 | 75 | 50 | 25 | 0 |
| PDPP4T [%] | 0 | 25 | 50 | 75 | 100 |
Table 2.
The individual concentrations of the composites of polymers and their blends.
| Sample No | 6 | 7 | 8 | 9 | 10 |
|---|---|---|---|---|---|
| PCPDTBT [%] | 100 | 70 | 45 | 20 | 0 |
| PDPP4T [%] | 0 | 45 | 50 | 70 | 100 |
| Au [%] | 10 | 10 | 10 | 10 | 10 |
Table 3.
Band gap values for PCPDTBT, PDPP4T, their blends, and nanocomposites with Au nanoparticles.
Table 3.
Band gap values for PCPDTBT, PDPP4T, their blends, and nanocomposites with Au nanoparticles.
| PCPDTBT [%] |
PDPP4T [%] |
Eg [eV] | Eg [eV] (+Au) |
|---|---|---|---|
| 100 |
0 | 1,39 | 1,33 |
| 75 |
25 | 1,32 | 1,38 |
| 50 |
50 | 1,28 | 1,31 |
| 25 |
75 | 1,22 | 1,29 |
| 0 |
100 | 1,28 | 1,29 |
Table 4.
The size of crystallites calculated for pure materials and their composites.
| Sample | Crystal size (nm) |
|---|---|
| PCPDTBT | 16.1 |
| +Au | 47.3 |
| PDPP4T | 18.0 |
| +Au | 31.6 |
| BLENDA | 21.5 |
| +Au | 60.3 |
Disclaimer/Publisher’s Note: The statements, opinions and data contained in all publications are solely those of the individual author(s) and contributor(s) and not of MDPI and/or the editor(s). MDPI and/or the editor(s) disclaim responsibility for any injury to people or property resulting from any ideas, methods, instructions or products referred to in the content. |
© 2025 by the authors. Licensee MDPI, Basel, Switzerland. This article is an open access article distributed under the terms and conditions of the Creative Commons Attribution (CC BY) license (http://creativecommons.org/licenses/by/4.0/).
Copyright: This open access article is published under a Creative Commons CC BY 4.0 license, which permit the free download, distribution, and reuse, provided that the author and preprint are cited in any reuse.


