Submitted:
04 February 2025
Posted:
04 February 2025
You are already at the latest version
Abstract
As energy efficiency measures have reduced the operational carbon footprint of buildings, the significance of embodied carbon has increased. Effort by all construction players, including material and component manufacturers, is needed to avoid burden shifting towards embodied impacts. Environmental Product Declarations (EPDs) can represent useful instruments to push the decarbonization of construction materials. This study examines EPDs to assess the embodied GWP of insulation materials, bricks, concrete, cement, steel and natural stones. The variance structure of the GWP was studied for each material, the main variation parameters were detected, and statistically significant categories were identified. For each category reference values were calculated (i.e. mean or median values, lower and upper interquartile ranges, box plot whiskers) which can be useful for manufacturers to reduce the impact of their products, for EPDs verifiers to detect outliers, and for designers to determine safety coefficients for using EPDs data in the early design stage. Consolidated results were achieved for materials produced through standardized processes whose GWP variability was mainly structured upon universal physical properties or production techniques. More localized or artisanal products require further segmentation and additional GWP data. The limited number of EPDs for building components precluded statistically significant analysis.
Keywords:
building materials
; building components
; Environmental Product Declarations (EPDs)
; Life Cycle Assessment (LCA)
; embodied carbon
; embodied energy
; decarbonization
1. Introduction
The most recent United Nations report, dedicated to greenhouse gas emissions from the building and construction sector [1], highlights that, in 2022, the energy demand from buildings (for heating, cooling, hot water, lighting, cooking, and other uses) accounted for approximately 30% of global energy demand. If the embodied energy used to produce building materials is included, this percentage rises to 34%.
In the last decade, there has been an average annual growth of about 1% in energy demand from buildings. The share of electricity usage in building energy consumption has increased from 30% in 2010 to 35% in 2022, driven in part by the spread of renewable energy production systems (especially photovoltaic). Despite this, the use of fossil fuels in buildings has increased over the last ten years at an average rate of 0.5% per year, primarily due to developing countries. To meet the enormous demand for buildings in these countries, the United Nations [2] estimate that construction materials will dominate resource consumption: emissions linked to the production of construction materials will increase from 3.5 to 4.6 Gt CO2eq per year by 2060.
To address the challenges of climate change, the building sector has primarily focused on reducing emissions from energy consumption during the operational phase of buildings [3]. Even at the regulatory level, various energy standards introduced over the years in industrialized countries have aimed to reduce consumption and related emissions during building operation, by minimizing heat losses, improving system efficiency, and finally integrating renewable energy production systems [4]. And it is precisely because buildings are becoming increasingly energy-efficient and electricity production (European national mixes) has significantly decarbonized that the operational energy and related carbon dioxide emissions of new buildings have decreased significantly [5].
The run-up toward low-energy buildings, however, is shifting the environmental impact of the construction sector from operational energy consumption to the embodied components [6]. For instance, Life Cycle Assessment (LCA) applications in nearly Zero Energy Buildings showed a significant trade-off onto embodied impacts that, when the operational energy consumption is reduced towards a very low value, can account for a very significant percentage of the total life cycle environmental load [7,8,9,10]. To provide some reference values, while in standard buildings the average share of embodied greenhouse gas emissions represents about 20-25% of the total greenhouse gas emissions over the entire life cycle, this figure rises to 45-50% for high-energy-efficiency buildings and exceeds 90% in extreme cases of buildings with cutting-edge, experimental performance [11].
The reduction of embodied impacts needs the adoption of new design paradigms, including the incorporation of renewable energy into construction materials and the shift from linear to circular models [12]. This is particularly critical given that the production of certain building materials, such as bricks and cement, is highly energy-intensive and, when reliant on fossil fuel-based production chains, significantly contributes to greenhouse gas emissions. Low-impact materials play a pivotal role in containing the shifting of impacts onto embodied components and reducing the impacts generated by the building industry.
To facilitate the decarbonization of construction materials, the European guidelines related to Green Public Procurement (EU directives 2014/23/EU, 2014/24/EU, and 2014/25/EU) are strengthening the adoption of Environmental Product Declarations (EPDs). EPDs are instruments developed to enable the comparison of the environmental impacts of construction materials, products, and components that share the same functional purpose. The EPDs published in Europe adhere to the European Standard EN 15804 to guarantee that the information is presented according to standardized LCA methodologies, employing uniform environmental indicators to disclose environmental impacts.
We are undergoing a critical transition in the building and construction sector, which demands substantial and collaborative efforts by all stakeholders, including material and component manufacturers, designers, construction companies, real estate developers, and end users. For an effective decarbonization of the sector, the LCA approach should be more widely adopted, both through its application at the building level and the use of EPDs to quantify the embodied carbon of building components and materials.
This work aims at reviewing the current state of the art regarding the proliferation of EPDs for building materials and components, with a focus on discussing their role in the decarbonization of the construction industry.
2. Materials and Methods
2.1. Materials
This study reviews EPDs data about the “cradle to gate” fossil Global Warming Potential (GWP) of construction materials and components. The modules covered are thus A1-A3. The certifications considered are all realized in compliance with the EN 15804 standard. The GWP was selected due to the robustness and consolidation of this indicator [13,14] and to the possibility of considering EPDs based on different versions of the EN 15804 standard (e.g., EN 15804+A1-2013 [15], EN 15804+A2-2019 [16]). In fact, both amendments of EN 15804 provide equivalent results, rendering the selection of a specific versions unnecessary.
EPDs were searched consulting the online databases of different programme operators (PO). In particular, the following sources were considered:
- The International EPD systems (INT) - a global program for EPDs managed by the Environmental Product Declaration International AB.
- IBU programme (IBU) - a certification and verification process for EPDs managed by the Institut Bauen und Umwelt e.V., a German organization.
- EPD-norge (NOR) - a Norwegian platform for EPDs.
- INIES programme (INI) - a French database that includes EN 15804 certifications voluntarily submitted by manufacturers and trade associations.
- BRE EPD programme (BRE) - an EPD certification system managed by Building Research Establishment (BRE) in the UK.
- EPD Danmark (DAN) - a national platform for EPDs in Denmark managed by Miljømærkning Danmark.
- EPD Italy (ITA) - a national program for EPDs in Italy managed by the organization Federazione Anima.
- EPD Ireland (IRE) - a national platform for EPDs in Ireland.
- Stichting MRPI (MRPI) - a Dutch initiative aimed at providing reliable EPDs in the Netherlands; it is managed by the Milieu Centraal organization.
- Bau-EPD (BAU) - an Austrian platform that provides EPDs for the construction sector.
- DAPconstrucción (DAPc) - the “Declaración Ambiental de Producto para la Construcción” is a Spanish program for EPDs specifically related to the construction sector; it is managed by the Asociación Española de Normalización (AEN).
- DAPhabitat (DAPh) - a Portuguese national initiative for the management of EPDs specifically tailored for the construction and building sector; it is managed by the Associação para a Sustentabilidade da Construção.
- EPD Hub (HUB) - a global platform that provides EPDs for various industries, including construction, manufacturing, and other sectors.
- ZAG EPD (ZAG) - it refers to the platform managed by the Zagreb Institute of Construction, which is a Croatian organization that manages the issuance of EPDs for products in the construction industry.
- RTS EPD (RTS) - a Finnish EPD programme primarily focused on the construction and building materials sector.
- Technical and Test Institute for Construction Prague (TZUS) - a Czech company operating as a certification and testing body for construction materials and related products.
- ITB EPD Program (ITB) - voluntary program for construction products in Poland.
- Kiwa EPDs (KIW) - a database developed and verified by Kiwa, an international certification body.
- SCS Global Services (SCS) - an international organization active in environmental certification and sustainability verification.
- Tata steel EPDs (TAT) - an international company developing EPD for some of its products.
- ASTM International (ASTM) – an American organization developing voluntary technical international standards for a wide range of materials.
- UL Solution (UL) – an American independent company that certificates environmental product declaration for different type of products.
- EPD Australasia (AUS) – an independent organization active in Australia and New Zeland that provides EPDs for the businesses sector.
- Belgian EPD Program (B-EPD) - voluntary program for construction products in Belgium.
EPDs from ECO Platform [17] were prioritized in this study: the platform serves as an umbrella for various EPD programs, ensuring a consistent quality through verification criteria, regular audits, harmonization, mutual recognition, and dispute resolution.
The materials considered are thermal insulating materials (e.g. EPS, stone wool), bricks, cement, concrete, stones, structural steel (i.e. profiles and rebars), windows, wood, photovoltaic panels and heat pumps.
2.1.1. Insulation Materials
The dataset created consisted of 97 EPDs certifying expanded polystyrene (EPS) and 41 of stone wool (SW) panels. These materials are currently among the market leaders in relation to mineral and fossil based insulating panels [18].
To compare different insulation materials, we used as a functional unit 1 m2 of an insulation panel with a thickness that gives a thermal resistance R = 1 m2K/W, and with a design life span of 50 years. This choice is increasingly recommended by literature works [19,20,21,22] because it indirectly allows to consider quite uniform operational thermal performances as well as eventual substitution requirements for different insulation materials. In this way modules B1-B4 are indirectly accounted in a “cradle to gate” evaluation. Even with a variable reference value for the thermal resistance of the panel, more EPDs are adopting this type of functional unit. However, other functional units, such as kilograms or cubic meters of material, are still in use, thus making the declaration of the density and of the thermal conductivity of the panel necessary for conversion purposes.
The information collected consists of the fossil GWP (modules A1-A3), the typology of panel (e.g., EPS, SW, etc.), the density of the material, the energy mix used in the production process, the percentage of secondary material in the total mass of the panel, the production country, the PO and the background LCA database used. The energy mix was considered “fossil based” if the total use of non-renewable primary energy resources, including secondary fuels, exceeded the 90% of the total embodied energy; “green” energy mix were instead characterized by a use of renewable primary energy resources, including secondary fuels, exceeding 50%. Table 1 describes the sample considered.
2.1.2. Bricks
The dataset consists of 60 EPDs prepared by European PO in accordance with EN 15804+A1 or EN 15804+A2. The FU chosen is 1 ton. The information collected consists of the fossil GWP (modules A1-A3), the typology of product (e.g., full bricks, hollow bricks, adobe bricks), its density, the energy mix used in the production process, the PO and the production country. Only a small number of the EPDs examined reported the average compression resistance or thermal conductivity of the material, primarily for hollow blocks. Because of the incompleteness of these kinds of information, these parameters were not considered.
Of the 60 EPDs in the dataset, 12 are for hollow bricks, 48 are for full clay bricks, and 1 is for an adobe brick (see Table 2). The production sites are unequally distributed in 18 countries.
2.1.3. Concrete
The dataset considered in the following assessment is composed of 79 data of embodied GWP (modules A1-A3) of ready-mixed concretes with a different mechanical resistance reported in EPDs. The main features of the sample are reported in Table 3. The information extracted from the EPDs consists of: PO, production country, production company, density, background LCA database (Ecoinvent, GaBi), resistance class (based on EN 1992-1-1:2004, Eurocode 2 [23]). Quite all the EPDs reviewed used the m3 as a functional unit.
2.1.4. Cement
The analysis of cement EPDs yielded sixty-four values for embodied GWP. Additionally, the information collected regarded the cement type (based on EN 197-1), the production country, the producer, the PO, the compression strength class (based on EN 197-1), the clinker content, the background database used for the LCA (e.g. GaBi, Ecoinvent or both), and the energy mix declared for the production processes (e.g. PERT, PENRT, RSF, NRSF). The cements were produced in thirteen European countries by twenty different companies. The functional unit adopted, as reported by all the EPDs consulted, is equal to 1 ton. Table 4 describes the main characteristics of the sample.
2.1.5. Stones
An online search for EPDs of natural stones yielded 58 certifications. Fifty-seven were product-specific, while one was a generic certification representing the average production of ten European companies. The specific products, which are certified by 9 European PO, are produced in Europe by 23 companies. All the natural stone products considered are locally manufactured with manufacturing sites which are located close to the quarry where the raw material is extracted.
Most of the certifications found adopted 1 ton as a FU; 1 m3 or 1 m2 of paved surface is seldom adopted in EPDs of slabs. However, it was possible to convert all other FU into tons using the density of the material. For slabs, all other FUs could be converted to 1 m² using thickness.
The information collected regarded: the embodied fossil GWP, stone typology (i.e., granite, marble, limestone, quartzite, sandstone, porphyry), final product typology (i.e., quarry blocks, walling blocks, setts, slabs with or without surface finishing), density, thickness (in the case of slabs), production country, producer, PO, LCA background database (i.e., Ecoinvent, GaBi), electricity mix considered in the LCA modelling, and mechanical performances (i.e., compression and flexural resistance). The information related to mechanical properties was quite uncommon in the EPDs consulted, not allowing any correlation with the environmental profile of the material.
An overview of the EPD reviewed for natural stones is provided in Table 5.
2.1.6. Structural Steel
The dataset considered consists of 59 EPDs based on EN 15804: 39 are for low-alloyed structural steel sections, 20 are related to reinforcing bars. The EPDs were randomly searched online.
The information collected consists of the fossil GWP attributable to modules A1-A3, the typology of product (i.e., structural profiles, steel reinforcing bars), the manufacturing process (e.g. electric arc furnace - EAF, blast oxygen furnace - BOF, a combination of both), the recycled scrap content, the mechanical properties, the energy mix used in the production process (e.g., PERT, PENRT, certified green electricity, national mix, residual national mix, local mix), the emission factor for electricity consumption, the PO, the producer, the production country, the background database used for the LCA (e.g., Ecoinvent or GaBi), the benefits linked to scrap recycling (module D). In relation to the manufacturing process, structural steel is currently produced using two main production methods: blast oxygen furnace (BOF) and electric arc furnace (EAF). BOF continues to dominate the global steel production while EAF is gradually acquiring market positions, particularly in North America, EU27 and Middle East countries [24]. According to the European Steel Technology Platform, EAF accounts for nearly 46% of total steel production in Europe. The FU considered was 1 metric ton, consistent with quite all consulted EPDs.
For all the steel sections considered the EPDs reported a Young modulus of 210000 MPa, a Shear modulus of 8100 MPa, and a density of 7850 kg/m3. In relation to reinforcing bars, the steel mechanical grade was B450 or B500.
Table 6 describes the dataset. It basically covers the steel production of 25 fabrication companies with manufacturing sites located in 17 European countries including UK, Turkey and Switzerland.
2.1.7. Windows
The analysis of EPDs reveals a diverse range of PO actively engaged in global certification initiatives within the window systems market. Figure 1 presents the dataset created for this study: 70 valid EPDs in 2024 were derived from POs websites or archives. The assessment covers the EPDs of the window systems, excluding patio doors. A total of 178 values of GWP were derived from the EPDs collected.
The International EPD system leads the ranking, listing 50 EPDs, while DAPc and IRE follow with 35 and 24 EPDs respectively. Small contributors in the windows scene are BAU and ITB, which contributed for less than 5 EPDs each. This distribution provides evidence on the gap in the involvement and capacity of PO due to the factors related to regional market maturity and regulatory environments.
Following the classification already provided by literature works [25,26], Figure 1b and Figure 1c display respectively the EPDs values based on the type of material used for the frame (metals, wood, wood-metal mixtures, or PVC) and the glazing configuration (single, double, or triple pane).
Metals dominate the distribution of frame materials with almost half of the total share. This is not surprising, as the trend probably just reflects the general use of metallic materials in window frames. Wood and combined wood-metal frames represent 37% of the distribution.
Interestingly, the data reveals a clear upward trend in certifying triple-glazed windows by the building industry. This might be justified by the substantial benefits related to energy efficiency and comfort of living linked to triple-glazed windows [27]. These windows have superior thermal and acoustic insulation compared to either double- or single-glazed windows, which is vital for decreasing energy consumption and increasing the standard of living.
The functional unit used in this study was the square meter of windowing, which allowed a common base for comparison among the various window systems being analyzed.
2.1.8. Wood
Wood has experienced a surge in popularity as a construction material in recent times due to its lightweight and structural efficiency, especially in self-weight resistant structures [28], and its potential to reduce greenhouse gas emissions compared to traditional building materials like concrete and steel [29]. Starting from the findings of previous studies [30,31], this work describes the EPDs relating to a review of 197 structural wood products embracing cross-laminated timber (CLT), glued laminated timber (Glulam), laminated veneer lumber (LVL), and sawn timber.
In addition to the typology of the product, the data extracted from the EPDs regarded the density of the material, the PO, the background database used for LCA modelling, the embodied GWP (modules A1-A3), the biogenic carbon and the EoL GWP (modules C3–C4). The inclusion of the EoL was crucial for wood products to counterbalance CO2 sequestration during tree growth in module A1. The C3–C4 values, thus, refer to the biogenic CO2 release at EoL modules. When biogenic carbon was not declared it was determined following the methodology described by the EN 16449 [32].
To enable comparison, all impact results from the EPDs were normalized considering as FU the kilogram of product or its volumetric unit (conversions were possible through density normalization). Table 7 shows the distribution of EPDs across the PO.
PO data show big disparities in the distribution of EPD. The highest number of declarations is made by INT, BU and NOR, totaling around 60%. Timber and Glulam have the highest number of EPDs representatives, while LVL remains significantly under documented. This concentration may create bias in the global representativeness. MRPI, RTS, UL Environment have a limited impact with few EPD.
2.1.9. Photovoltaic Panels
The database considered contained 24 EPDs with 31 types of photovoltaic panels distributed among three PO: INT (25), DAN (4), NOR (2). This distribution highlights that the diversity among analyzed programs is low, which may affect the general variability of the data. All analyzed panels are of the same type: monocrystalline silicon. The panels analyzed have the ability to harness reflected light, i.e., light that bounces off surfaces and reaches the rear of the solar module; 30% of the panels analyzed are indeed bifacial.
In this study, the square meter was the functional unit, enabling comparisons of GWP with respect to a surface unit of panel, as opposed to its peak power per squared meter.
2.1.10. Heat Pumps
Only a few EPDs concerning heat pumps have been publicly registered so far and only 7 EPDs were scrutinized.
In addition to the GWP (modules A1-A3), the information reported in Table 8 was derived from the EPDs. The functional units given in the examined EPDs relate to the ability of the products to supply heating or cooling during the declared life span.
2.2. Methods
Statistical tests were conducted to assess the reliability of the groupings established based on the data derived from the consulted EPDs.
A t-test can be used to determine whether there is a significant difference between the means of two groups. To apply a t-test, however, the data should be approximately normally distributed and have equal variances across groups. A bootstrapped t-test was considered when normality and equal variance assumptions were not met.
The Analysis of Variance (ANOVA) is an extension of the t-test for more than two groups created by means of qualitative features. ANOVA can be applied when meeting certain assumptions: independence of samples, normality in the data distribution, and homoscedasticity (i.e., equal variances among groups). As the data collected hardly met these assumptions -particularly data normality and variance uniformity- the nonparametric Kruskal-Wallis test served as an alternative for comparing mean values across groups.
MANOVA (Multivariate Analysis of Variance) was employed to investigate the simultaneous effects of one or more independent variables on multiple dependent variables.
All the tests conducted generate a p-value that indicates the statistical significance of the results: generally, they are considered significant if the p-value < 0.05.
Finally, the strength of the correlation between two quantitative variables was assessed by performing linear regression and evaluating the coefficient of determination (R²).
This approach was adopted for all the considered building materials (thermal insulation materials, cement, concrete, stones, woods, windows, structural steel) and also for windows, while, due to the limited number of EPDs, it was not possible to carry out a statistical analysis for photovoltaic panels and heat pumps.
3. Results
3.1. Insulation Materials
The application of statistical methods already described showed an unsignificant grouping based on the background LCA database, renewable secondary content, PO and production country for both insulation materials considered. As confirmed by Grazieschi et al. [20], a significant statistical relationship with GWP was found based on material density.
In relation to the EPS panels, the energy mixes found were predominantly fossil-based, with a limited utilization of renewable or secondary energy sources in some certifications. Three EPDs claimed the use of green certified electricity and only one claimed the use of biomethane in the production process; neither of these made a big difference to the climate change performance of the panel. The percentage of secondary material used as input in the production process was not found to have a significant statistical relationship with the GWP. It ranges 0-12% with few cases at 33%. Considering the linear correlation between material density and GWP (as depicted in Figure 2), a density-class based aggregation proved to be the most statistically significant (ANOVA p-value: 4.26e-22, Kruskal-Wallis p-value: 3.08e-13).
For stone wool panels, the most significant grouping was achieved considering four density classes: low (11-39 kg/m3), medium (48-70 kg/m3), high (90-110 kg/m3) and very high (122-150 kg/m3) density: ANOVA p-value: 1.934e-12, Kruskal-Wallis p-value: 1.645e-06. A good grouping inside the low-density group was obtained when considering the energy mix (i.e., fossil and “green”): bootstrapped t-test p-value = 0.016. Nordic countries claimed benefits from utilizing renewable energy mixes, primarily sourced from hydroelectric and wind power generation, as well as high-temperature geothermal heat. Figure 3 shows that these products are mostly positioned in the lower interquartile range.
Considering a confidence level of 90%, the main statistics and margins of error reported in Table 9 and Table 10 were obtained. As it can be noted, wider density class intervals tend to be associated with larger marginal errors or interquartile ranges.
In conclusion, the principal structure of the variance in the embodied GWP of the two insulation panels considered can be attributed to the volumetric density of their constituent materials [20].
3.2. Bricks
As regards bricks the typology clusters basically overlap with the density clusters, with hollow bricks having a density range 575-756 kg/m3 and full bricks being characterized by a density ranging 1520-2120 kg/m3. Hollow bricks are characterized by lower embodied carbon due to a more efficient and shorter baking process [33]: depending on the size and moisture content, it takes around 8 to 12 hours in a kiln for hollow bricks and around 24 to 36 hours for full bricks with often higher temperatures to ensure a proper hardening. For the same reason, full bricks that have undergone a second firing process are expected to have a higher GWP content. On the other side, non-fired bricks, including adobe and reused bricks, demonstrated a markedly lower embodied carbon footprint. Literature studies confirmed that by eliminating or reducing the need for firing, the climate change impacts of brick production could be drastically reduced (e.g., adobe block [34], sun-dried clay bricks [35]).
A bootstrapping t-test was also conducted to assess the statistical representativeness of full and hollow bricks, single fired: the results confirmed a satisfactory level of representativeness (p-value=0.0002). No other statistically significant difference among groups was obtained based on production country, PO or LCA database.
When considering the role of energy mix inside the categories already defined, a significant statistical grouping (bootstrapping t-test, p-value = 0.008) was found only for full bricks produced with 'green' energy mixes, defined as those utilizing over 50% renewable primary or secondary energy sources. The incorporation of this supplementary categorization brought to the most robust statistical results (Kruskal-Wallis’s p-value= 9.53e-07).
Figure 4a shows a box plot of the fossil GWP of hollow and full bricks. The bricks within the upper interquartile of the box plot are largely being characterized by an energy mix during the baking process which is reliant on natural gas, gas combined with wood or coal. Conversely, the lower interquartile reveals a significant number of EPDs for bricks that claim to use biofuels, biogas or a high share of renewable secondary fuels in their production process. The full bricks outliers are second fired, adobe and reused ones.
Reverse figures were obtained when considering the embodied energy of bricks. As shown in Figure 4b, in fact, “green” bricks, whose mean renewable energy content was 85%, were characterized by a significant higher embodied energy if compared with fossil based. This suggests a lower efficiency in the utilization of renewable resources compared to the use of fossil fuels, as confirmed by Anderson et al. [36].
Table 11 resume the main statistics found.
3.3. Concrete and Cement
Regarding ready mixed concretes, statistical analysis revealed no significant groups based on the databases used in the LCA modelling (i.e. Ecoinvent or GaBi). No significant relationship was also found between the GWP and the density. A significant classification was obtained when grouping for the PO (F=6.84, p-value=0.0002) or the production country (F=4.42, p-value=0.0008). This substantial equivalence is connected to the high overlap between the PO and their geographic areas of operation, with only few POs operating at the international level. Anderson and Moncaster [39] have already found a meaningful geographical distribution for the embodied GWP of concrete with countries like France, the UK, Norway and Germany showing a relatively low impact.
The most significant partitioning found was based on compression resistance (F=15.03, p-value= 3.57e-15; Kruskal statistic=60.27, p-value=1.19e-9). The compression resistance of concrete strongly depends on the cement content and on the mix design employed. Generally, more resistant concretes show a higher cement content, which is recognized as the most climate change impactful component of concrete [40,41].
Figure 5 shows the GWP of ready mixed concrete against its characteristic cubic compression resistance at 28 days.
Applying the statistical tests already described to cement data, no significant partition was found based on the production country, the PO or the database used for the LCA. Significant aggregations were instead obtained considering the compression resistance class (F=8.4, p-value= 0.0006; Kruskal statistic=14.8, p-value=0.0006), the cement category class (F=25.1, p-value= 1.2e-10; Kruskal statistic=31.3, p-value=7.2e-07), and combining cement category and resistance classes (F=19.6, p-value= 7.62e-11; Kruskal statistic=36.6, p-value=7.2e-07). A MANOVA model, with clinker content and standard cement resistance as dependent variables and GWP as the independent variable, confirmed a highly significant relationship between embodied carbon and these cement properties (p < 0.00001).
Since emissions at the kiln are preponderant, accounting for more than 80% of the total [42], the fuel mix used was expected to play a pivotal role in structuring the variance of the sample. However, considering two partitions based on the energy mix (alternative “green”, with PERT+ RSF>35%, and fossil predominant), no significant grouping was foiund. Only when grouping inside the cement category groups, significant statistics were observed for CEM I (bootstrapped test=4.89, p-value=6.95e-05). Thus, excluding the CEM I category where the clinker content is high and within a narrow range, the role of alternative fuels in structuring the embodied GWP of cement in EPDs remains quite weak in comparison with the clinker content.
Figure 6 illustrates the GWP data, classified according to the most prominent categories identified. Following the methodology recommended by Lasvaux et al. [43], the average values obtained in this study were compared with Ecoinvent data and with the GWP values reported by the generic EPDs found [44]. A good alignment was achieved for CEM I and CEM II categories, which are characterized by a relatively fixed and standardized mix design (see Table 12).
In conclusion, the embodied GWP of cement, as reported in EPDs, is primarily determined by its composition category and resistance class, both of which reflect the clinker content. As substantiated by existing research, the main strategy for mitigating the carbon footprint of cement production is the replacement of ordinary clinker-rich Portland cement with alternative materials, i.e., geo-polymers, blast furnace slag, calcium sulphate, coal fly ash, and natural pozzolanic materials [45,46,47,48].
3.4. Natural Stones
Concerning natural stones, statistically insignificant GWP groups were identified if partitioning for the production country, PO, LCA database or producer. A weak significance was found when grouping green (<0.1 kgCO2/kWh) and non-green electricity mixes (bootstrapped t-test results: t=-2.76; p=0.0077).
A statistically significant partitioning was found when grouping for the final product typology. Considering quarry blocks and all other final products, for instance, the bootstrapped t-test provided a p-value=2.05e-06. The average GWP for cut products is 136 kgCO2/t, significantly lower than the value of 255 kgCO2/t reported by the generic EPD found. Quarry blocks have an embodied GWP of 45 kgCO2/t, meaning that about two thirds of the emissions are generated during the manufacturing phase. Considering final products, a significant partitioning was also obtained when grouping for the stone and final product typology (Kruskal-Wallis test results: test statistic H=26.1, p-value=0.002).
Based on the data collected, Figure 7 shows the results obtained in the present study. The marble slabs worth a specific focus due to the pronounced variability in their embodied GWP: generally, slabs undergoing multiple finishing processes using a residual electricity mix have the highest impact.
The result highlights the importance of the stone manufacturing process which is different for each stone typology and related mechanical characteristics [49]. Beyond cutting, in fact, different additional working processes can be performed to enhance stones surface finishing and aesthetical appearance (polishing, honing, leathering, resins addition, flaming, bush-hammering, waterjet, sand blasting). From a certification perspective, however, the absence of a standardized production process makes the comparison of stones environmental profile quite complicated, since consolidate reference values are hard to be determined considering the low number of certifications found and the variegated offer of products with different technical, finishing and aesthetical features. To determine more reliable benchmarks, further certifications are required, which are currently difficult to find.
The difficulty in defining reference values reduces the potential of EPDs to drive the decarbonization efforts in the stone manufacturing sector. The electricity mix used in manufacturing, and its associated carbon intensity, emerges as a paramount factor in decarbonization efforts, thereby externalizing decarbonization leadership to the energy sector.
3.5. Structural Steel
A bootstrapping t-test was employed to ascertain whether a significant difference existed between GWP of steel sections and rebars produced through EAF. The results were not statistically significant (p-value = 0.27). A Kruskal-Wallis test was then implemented considering three groups based only on the production method: BOF steel sections, EAF steel sections and rebars, generic BOF/EAF steel section EPDs. The test confirmed the statistical representativeness of the groups created (p-value= 2.73e-08) which represented the most robust segmentation found. Insignificant statistics were, in fact, obtained if aggregating for the producer, the PO or the background life cycle database used. Moreover, it was not possible to evaluate the influence of the production country or the mechanical properties of the material on its embodied carbon: different manufactures declared more than one production site with mechanical properties that have a wide range of variation (e.g., from S235 to S355 in most of the cases, or from S235 to S500 in two cases).
A significant grouping (bootstrapping t-test p-value = 0.015) was observed also when considering two groups based on the energy mix used in the EAF production process: “green" energy mixes were defined as those utilizing over 30% PERT and declaring a purchase of 100% green electricity.
Figure 8 displays a box plot of the GWP of the sample selected, categorized by the identified representative groups. When contrasted with the BOF process, EAF products showed better climate change performances and renewable integration (18.3% against 6.7% on average), attributable to the current characterization factors for electricity consumption in European countries. Moreover, EAF steel showed approximately 39% of the embodied primary energy compared with BOF steel (10375 MJ/t vs. 26525 MJ/t).
Recycled content is also aligned with the production technologies with BOF showing lower scarp shares (12-36%, avg. 21%) in comparison with EAF (76-100%, avg. 92%), as confirmed by Spooner et al. [50].
Table 13 shows the main descriptive statistics for the GWP of the steel product categories considered.
Literature confirmed that the production methodology and the energy vector used have a significant influence on the environmental profile of the structural steel industry, particularly in relation to the climate change impacts [51].
3.6. Windows
Application of the statistical methodologies Kruskal-Wallis Test confirmed that segmentations based on the frame material and on the number of panes characterizing the window system were significant. Grouping according to the number of panes glazed gave: H = 10.27, with the p-value of 0.006 while with grouping based on frame material resulted in H = 9.63 with the p-value 0.022; these point out a statistical significant difference among groups using either classification method The average results obtained are shown in Table 14 for GWP.
Considering frames, the following interesting trend can be observed: generally, as shown in Figure 9, window types made of wood or a mix of wood-metals have lower GWP compared with their metal peers [26,52]. Moreover, they have lower average thermal transmittance compared to the PVC or metal windows (see Table 14).
Concerning the number of panes, triple-glazed windows have GWP rather higher compared to the double-glazed one but a lower thermal transmittance (see Figure 9 and Table 14). This suggests that even though triple-glazed windows have a slightly higher embodied impact, they provide better thermal insulation and, consequently, may contribute to the reduction of overall energy consumption in buildings over time.
The results obtained for single glazed windows cannot be generalized because of their specific application: the single-glazed windows found are mainly applied as roof hatches or skylights in attics or lofts, opening and closing electrically. The reported GWP value of single-glazed windows also includes all the components necessary for such a movement mechanism, such as motors, electrical wiring, and controls, which are not included in any of the other analyzed window systems. This inflates the GWP associated with single-glazed windows.
Resuming, the main variation parameters found for the embodied GWP of windows are the frame materials and the glazing configuration (single, double or triple).
3.7. Wood
A Kruskal-Wallis test was conducted to compare the product categories already defined. The results showed the highest statistical significance (p-value = 0.053). As such, it would not be justifiable to draw meaningful differences between the distributions of the four groups being analysed. Figure 10 presents box plots illustrating the GWP for each life cycle module considered, and the overall GWP. The average for all GWP could be around 1.67 kg CO2e/kg for CLT and 1.36 kg CO2e/kg for Glulam. LVL has an average in GWP of about 1.72 kg CO2e/kg, while for Timber, which includes both hardwood and softwood, the average GWP is about 1.64 kg CO2e/kg.
Figure 11 shows the GWP normalized by density (FU = 1 kg). Values greater than 3 kgCO₂e/kg were excluded from the table to enhance the visibility of central values and reduce the impact of extreme variance.
The results obtained confirmed that the biogenic carbon is the main driver of variability of the embodied carbon of wooden materials. The actual climate change profile cannot exclude the consideration of the carbon emissions counterbalanced during the EoL stage, as recommended by the EN 15804 +A2:2019. Significant differences were detected when comparing sawn wood with engineered wood (i.e. glulam, CLT or LVL).
3.8. Photovoltaic Panels
Figure 11 gives the trend for PV panels' embodied GWP impact as a function of peak power (WP). The GWP per square meter versus WP per square meter presents a correlation coefficient of r=0.21, which happens to be a weak relationship between environmental impact and nominal power generation. Such findings indicate that the two parameters are not linked to one another, as expected [53,54,55]. A weak statistical significance was also found when grouping for the PO, but the low number of data makes the assessment not reliable.
The EPD scene for PV panels appears to be still not very consolidated. Given the low number of certifications found, the statistical analysis could not provide any meaningful result. Neither it was possible to analyze the effect of electricity mixes used in the manufacturing process, with related carbon intensities.
3.9. Heat Pumps
Given the limited availability of EPDs, the statistical analysis for heat pumps was also not applicable.
A critical analysis of the GWP data for the products shows a considerable difference in the GWP values. Heat pumps using R290 as a refrigerant have much lower GWP values compared to those containing R32. However, the embodied GWP is dependent on other variables besides the type of refrigerant, such as energy efficiency, life expectancy, and overall weight of materials used. The Total Primary Energy Requirement (PET) represents the toal energy required for a product during its life cyce, including both renewable and non-renwable energy. Table 15 reports the main outcome found.
4. Discussion
After the individuation of the main variation parameters for embodied GWP and classified the construction products accordingly, the data retrieved from EPDs can be used to:
- Determine reference mean or median values for different product categories,
- Define reference threshold for lower and upper interquartile ranges representing over-under performant construction products from and environmental perspective,
- Individuate possible outliers (e.g. minimum or maximum thresholds, values that fall above or below box plot whiskers).
These values could prove valuable in several ways: by aiding building technicians in defining safety factors when utilizing EPDs during preliminary design phases [39,56], by motivating manufacturers to enhance the climate change performance of high-impact products, and by assisting EPD verifiers in identifying outliers.
The certification of construction products, however, assumed varying levels of relevance and played different roles across the different industrial sectors considered.
For internationalized and standardized product processes, in which the role played by fuel mixes resulted less important in determining the GWP, the climate change profile of construction products was mainly driven by material's inherent physical properties, chemical composition or manufacturing techniques. For example, in the case of insulation panels, density and thermal conductivity emerged as significant factors contributing to the variance in their embodied GWP, while the fuel mix was mainly dependent on fossil fuels, with low utilization of secondary materials and fuels. For structural steel, the EPDs promote the choice of EAF products due to their higher secondary material utilization, renewable energy use and lower climate change impact. The alignment of production and evaluation methodologies results in narrowed confidence intervals for the "cradle to gate" GWP values, leading to more consolidated reference values (i.e., mean or median values, lower and upper interquartile bounds, outliers).
In the case of more artisanal production methods, localized sourcing of raw materials and energy, or a more regional sales scope, the EPDs results showed more complex variance structure and a wider range of GWP results. The impact declared, in fact, could be affected by local peculiarities which are not only related to the craftsmanship know-how but also to the availability of secondary materials or energy resources. The case study of natural stones is pertinent with large confidence intervals as the material surface treatment is further processed. In these situations, it was quite difficult to assess the impact of material properties, production techniques, and the energy mix used in shaping the embodied GWP of the material. A high segmentation of the products is necessary to establish reliable reference values, which in turn implies a large number of certifications.
Furthermore, the global relevance of climate change necessitates a significant international effort to align evaluation methodologies, production processes, and energy mixes on more sustainable pathways. Particularly for low embodied carbon materials with high embodied energy (e.g. “green” bricks), the adoption of a consequential approach could be valuable to assess the effects of local energy resource utilization on the international scale.
Finally, the PO and the background database used in the LCA didn’t play a very relevant role in determining embodied climate change impacts of all products considered, confirming a consolidated trend in Europe towards the alignment of evaluation methodologies, data harmonization, verification of the results and coordination [57].
5. Conclusions
The role of the industry is becoming increasingly pivotal as the building sector seeks to reduce operational energy consumption, thereby increasing the importance of embodied components. Within this framework, the EPDs can play an important role in driving the decarbonization of the construction industry, aligning production methods and energy mixes on more sustainable standardized pathways.
The results of the EPDs analysis conducted showed that comparability and reference values definition are enhanced in the case of standardized and internationalized production chains, low dependence on local energy mixes and high number of certifications. In these cases, it resulted easier to link the GWP variation to material inherent physical properties or manufacturing techniques. On the contrary, the high dependence of the climate change impact on specific energy mixes or artisanal craftsmanship, gives to the EPDs results a higher variability which translates in less consolidated product categories and reference values.
The production of additional certifications by building materials enterprises would help in the creation of a more diverse and varied data sample, ultimately contributing to the improvement of the reliability reference values (e.g., mean and median values, lower or higher interquartile ranges) and helping the professionals in the choice of low carbon materials and components. For some construction materials, particularly for those produced through a not standardized production process, the definition of reference values results still challenging and requires an additional number of certifications and data.
A consolidated effort was instead observed on the reduction of the number of published PCRs, their mutual recognition by different PO, and the adoption of a specific background life cycle database or impact assessment methods for LCA modelling.
Author Contributions
Conceptualization, F.A. and G.G.; methodology, G.G. and F.A.; software, G.G. and D.M.G.; validation, F.A.; formal analysis, G.G. and D.M.G.; investigation, G.G. and D.M.G.; data curation, G.G. and D.M.G.; writing—original draft preparation, G.G. and D.M.G.; writing—review and editing, G.G.; supervision, F.A. All authors have read and agreed to the published version of the manuscript.
Funding
This study was possible thanks to the Project “Choisis - Characterisation of Innovative and Sustainable Insulating Solutions”, funded within the Italian National Recovery and Resilience Plan (PNRR), Mission 4 - Education and Research - Measure M4C2 - Investment 1.1 PRIN - Research programs of national interest - project code 2022372TM9, CUP F53D23001540006. The authors also gratefully acknowledge the support from the H2020 EU-funded project Climate Positive Circular Communities (grant agreement ID: 101036723), which aims at creating climate positive circular communities in Europe and increasing the building renovation rate in the continent.
Data Availability Statement
Dataset available on request from the authors.
Conflicts of Interest
The authors declare no conflicts of interest.
Abbreviations
The following abbreviations are used in this manuscript:
| EPDs | Environmental Product Declarations |
| EoL | End-of-Life |
| FU | Functional Unit |
| GWP | Global Warming Potential (100 years) |
| LCA | Life Cycle Analysis or Assessment |
| PERT | Total Renewable Primary Energy |
| PENRT | Total Non-Renewable Primary Energy |
| PET | Total Primary Energy Requirement (PERT+PENRT+RSF+NRSF) |
| PO | Programme Operator(s) |
| RSF | Renewable Secondary Fuels |
| NRSF | Non-Renewable Secondary Fuels |
| WP | Peak Power |
| SW | Stone wool |
| EPS | Expanded polystyrene |
| PV | Photovoltaic panels |
| PCR | Product Category Rules |
| EAF | Electric arc furnace |
| BOF | Blast oxygen furnace |
| CLT | Cross-laminated timber |
| Glulam | Glued laminated timber |
| LVL | Laminated veneer lumber |
References
- United Nations Environment Programme 2023 Global Status Report for Buildings and Construction: Beyond Foundations - Mainstreaming Sustainable Solutions to Cut Emissions from the Buildings Sector. Available online: www.unep.org (accessed on 13 January 2025).
- United Nations Environment Programme 2022 Global Status Report for Buildings and Construction: Towards a Zero-Emission, Efficient and Resilient Buildings and Construction Sector. Available online: www.unep.org (accessed on 13 January 2025).
- Economidou, M.; Todeschi, V.; Bertoldi, P.; D’Agostino, D.; Zangheri, P.; Castellazzi, L. Review of 50 years of EU Energy Efficiency Policies for Buildings. Energy Build 2020, 225, 110322. [Google Scholar] [CrossRef]
- European Parliament and Council Directive 2010/31/EU of the European Parliament and of the Council of 19 May 2010 on the Energy Performance of Buildings. Available online: https://eur-lex.europa.eu/eli/dir/2010/31/oj/eng (accessed on 16 January 2025).
- Norouzi, M.; Haddad, A.N.; Jiménez, L.; Hoseinzadeh, S.; Boer, D. Carbon Footprint of Low-Energy Buildings in the United Kingdom: Effects of Mitigating Technological Pathways and Decarbonization Strategies. Science of The Total Environment 2023, 882, 163490. [Google Scholar] [CrossRef] [PubMed]
- Asdrubali, F.; Ballarini, I.; Corrado, V.; Evangelisti, L.; Grazieschi, G.; Guattari, C. Energy and Environmental Payback Times for an NZEB Retrofit. Build Environ 2019, 147, 461–472. [Google Scholar] [CrossRef]
- Asdrubali, F.; Grazieschi, G. Life Cycle Assessment of Energy Efficient Buildings. Energy Reports 2020, 6, 270–285. [Google Scholar] [CrossRef]
- Cusenza, M.A.; Guarino, F.; Longo, S.; Cellura, M. An Integrated Energy Simulation and Life Cycle Assessment to Measure the Operational and Embodied Energy of a Mediterranean Net Zero Energy Building. Energy Build 2022, 254, 111558. [Google Scholar] [CrossRef]
- Asdrubali, F.; Baggio, P.; Prada, A.; Grazieschi, G.; Guattari, C. Dynamic Life Cycle Assessment Modelling of a NZEB Building. Energy 2020, 191, 116489. [Google Scholar] [CrossRef]
- Asdrubali, F.; Fronzetti Colladon, A.; Segneri, L.; Gandola, D.M. LCA and Energy Efficiency in Buildings: Mapping More than Twenty Years of Research. Energy Build 2024, 321, 114684. [Google Scholar] [CrossRef]
- Röck, M.; Saade, M.R.M.; Balouktsi, M.; Rasmussen, F.N.; Birgisdottir, H.; Frischknecht, R.; Habert, G.; Lützkendorf, T.; Passer, A. Embodied GHG Emissions of Buildings – The Hidden Challenge for Effective Climate Change Mitigation. Appl Energy 2020, 258, 114107. [Google Scholar] [CrossRef]
- Papadaki, D.; Nikolaou, D.A.; Assimakopoulos, M.N. Circular Environmental Impact of Recycled Building Materials and Residential Renewable Energy. Sustainability 2022, 14, 4039. [Google Scholar] [CrossRef]
- IPCC Climate Change 2021: The Physical Science Basis. Contribution of Working Group I to the Sixth Assessment Report of the Intergovernmental Panel on Climate Change; Cambridge University Press: Cambridge, United Kingdom; New York, NY, USA, 2021. [Google Scholar]
- Otero, M.S.; Garnica, T.; Montilla, S.; Conde, M.; Tenorio, J.A. Analysis of Sectoral Environmental Product Declarations as a Data Source for Life Cycle Assessment. Buildings 2023, 13, 3032. [Google Scholar] [CrossRef]
- European Committee for Standardization (CEN). EN 15804:2012+A1:2013 Sustainability of Construction Works - Environmental Product Declarations - Core Rules for the Product Category of Construction Products; CEN: Brussels, Belgium, 2013. [Google Scholar]
- European Committee for Standardization (CEN). EN 15804+A2:2019 Sustainability of Construction Works - Environmental Product Declarations - Core Rules for the Product Category of Construction Products; CEN: Brussels, Belgium, 2019. [Google Scholar]
- ECO Platform AISBL ECO Platform. Available online: www.eco-platform.org (accessed on 15 January 2025).
- Blagoeva, D.; Pavel, C. Competitive Landscape of the EU’s Insulation Materials Industry for Energy-Efficient Buildings; Publications Office of the European Union: Luxembourg, 2018; ISBN 978-92-79-96383-4. [Google Scholar]
- Füchsl, S.; Rheude, F.; Röder, H. Life Cycle Assessment (LCA) of Thermal Insulation Materials: A Critical Review. Cleaner Materials 2022, 5, 100119. [Google Scholar] [CrossRef]
- Grazieschi, G.; Asdrubali, F.; Thomas, G. Embodied Energy and Carbon of Building Insulating Materials: A Critical Review. Cleaner Environmental Systems 2021, 2, 100032. [Google Scholar] [CrossRef]
- Hill, C.; Norton, A.; Dibdiakova, J. A Comparison of the Environmental Impacts of Different Categories of Insulation Materials. Energy Build 2018, 162, 12–20. [Google Scholar] [CrossRef]
- Pargana, N.; Pinheiro, M.D.; Silvestre, J.D.; de Brito, J. Comparative Environmental Life Cycle Assessment of Thermal Insulation Materials of Buildings. Energy Build 2014, 82, 466–481. [Google Scholar] [CrossRef]
- European Committee for Standardization (CEN). EN 1992-1-1:2004 Eurocode 2: Design of Concrete Structures - Part 1-1: General Rules and Rules for Buildings; CEN: Brussels, Belgium, 2004. [Google Scholar]
- World Steel Association Steel Statistical Yearbook 2024. Available online: https://worldsteel.org/ (accessed on 13 January 2025).
- Souviron, J.; van Moeseke, G.; Khan, A.Z. Analysing the Environmental Impact of Windows: A Review. Build Environ 2019, 161, 106268. [Google Scholar] [CrossRef]
- Asdrubali, F.; Roncone, M.; Grazieschi, G. Embodied Energy and Embodied GWP of Windows: A Critical Review. Energies (Basel) 2021, 14, 3788. [Google Scholar] [CrossRef]
- Menzies, G.; Wherrett, J. Multiglazed Windows: Potential for Savings in Energy, Emissions and Cost. Building Services Engineering Research and Technology 2005, 26, 249–258. [Google Scholar] [CrossRef]
- Ramage, M.H.; Burridge, H.; Busse-Wicher, M.; Fereday, G.; Reynolds, T.; Shah, D.U.; Wu, G.; Yu, L.; Fleming, P.; Densley-Tingley, D.; et al. The Wood from the Trees: The Use of Timber in Construction. Renewable and Sustainable Energy Reviews 2017, 68, 333–359. [Google Scholar] [CrossRef]
- D’Amico, B.; Pomponi, F.; Hart, J. Global Potential for Material Substitution in Building Construction: The Case of Cross Laminated Timber. J Clean Prod 2021, 279, 123487. [Google Scholar] [CrossRef]
- Rasmussen, F.; Andersen, C.; Wittchen, A.; Hansen, R.; Birgisdóttir, H. Environmental Product Declarations of Structural Wood: A Review of Impacts and Potential Pitfalls for Practice. Buildings 2021, 11, 362. [Google Scholar] [CrossRef]
- Asdrubali, F.; Ferracuti, B.; Lombardi, L.; Guattari, C.; Evangelisti, L.; Grazieschi, G. A Review of Structural, Thermo-Physical, Acoustical, and Environmental Properties of Wooden Materials for Building Applications. Build Environ 2017, 114, 307–332. [Google Scholar] [CrossRef]
- European Committee for Standardization (CEN). EN 16449:2014: Wood and Wood-Based Products – Calculation of the Biogenic Carbon Content of Wood and Conversion to Carbon Dioxide; CEN: Brussels, Belgium, 2014. [Google Scholar]
- Asdrubali, F.; Grazieschi, G.; Roncone, M.; Thiebat, F.; Carbonaro, C. Sustainability of Building Materials: Embodied Energy and Embodied Carbon of Masonry. Energies (Basel) 2023, 16, 1846. [Google Scholar] [CrossRef]
- Christoforou, E.; Kylili, A.; Fokaides, P.A.; Ioannou, I. Cradle to Site Life Cycle Assessment (LCA) of Adobe Bricks. J Clean Prod 2016, 112, 443–452. [Google Scholar] [CrossRef]
- Dabaieh, M.; Heinonen, J.; El-Mahdy, D.; Hassan, D.M. A Comparative Study of Life Cycle Carbon Emissions and Embodied Energy between Sun-Dried Bricks and Fired Clay Bricks. J Clean Prod 2020, 275, 122998. [Google Scholar] [CrossRef]
- Anderson, J.; Moncaster, A. Embodied Carbon, Embodied Energy and Renewable Energy: A Review of Environmental Product Declarations. Proceedings of the Institution of Civil Engineers - Structures and Buildings 2023, 176, 986–997. [Google Scholar] [CrossRef]
- Tibrewal, K.; Venkataraman, C.; Phuleria, H.; Joshi, V.; Maithel, S.; Damle, A.; Gupta, A.; Lokhande, P.; Rabha, S.; Saikia, B.K.; et al. Reconciliation of Energy Use Disparities in Brick Production in India. Nat Sustain 2023, 6, 1248–1257. [Google Scholar] [CrossRef]
- Soussi, N.; Kriaa, W.; Mhiri, H.; Bournot, P. Reduction of the Energy Consumption of a Tunnel Kiln by Optimization of the Recovered Air Mass Flow from the Cooling Zone to the Firing Zone. Appl Therm Eng 2017, 124, 1382–1391. [Google Scholar] [CrossRef]
- Anderson, J.; Moncaster, A. Embodied Carbon of Concrete in Buildings, Part 1: Analysis of Published EPD. Buildings and Cities 2020, 1, 198–217. [Google Scholar] [CrossRef]
- Witte, A.; Garg, N. Quantifying the Global Warming Potential of Low Carbon Concrete Mixes: Comparison of Existing Life Cycle Analysis Tools. Case Studies in Construction Materials 2024, 20, e02832. [Google Scholar] [CrossRef]
- Barbhuiya, S.; Kanavaris, F.; Das, B.B.; Idrees, M. Decarbonising Cement and Concrete Production: Strategies, Challenges and Pathways for Sustainable Development. Journal of Building Engineering 2024, 86, 108861. [Google Scholar] [CrossRef]
- Benhelal, E.; Zahedi, G.; Shamsaei, E.; Bahadori, A. Global Strategies and Potentials to Curb CO2 Emissions in Cement Industry. J Clean Prod 2013, 51, 142–161. [Google Scholar] [CrossRef]
- Lasvaux, S.; Habert, G.; Peuportier, B.; Chevalier, J. Comparison of Generic and Product-Specific Life Cycle Assessment Databases: Application to Construction Materials Used in Building LCA Studies. Int J Life Cycle Assess 2015, 20, 1473–1490. [Google Scholar] [CrossRef]
- CEMBUREAU The European Cement Association EPD for Cement. Available online: https://cembureau.eu/ (accessed on 14 January 2025).
- Amran, Y.H.M.; Alyousef, R.; Alabduljabbar, H.; El-Zeadani, M. Clean Production and Properties of Geopolymer Concrete; A Review. J Clean Prod 2020, 251, 119679. [Google Scholar] [CrossRef]
- Verma, M.; Dev, N.; Rahman, I.; Nigam, M.; Ahmed, Mohd.; Mallick, J. Geopolymer Concrete: A Material for Sustainable Development in Indian Construction Industries. Crystals (Basel) 2022, 12, 514. [CrossRef]
- Amran, Y.H.M.; Alyousef, R.; Alabduljabbar, H.; El-Zeadani, M. Clean Production and Properties of Geopolymer Concrete; A Review. J Clean Prod 2020, 251, 119679. [Google Scholar] [CrossRef]
- Scrivener, K.L.; John, V.M.; Gartner, E.M. Eco-Efficient Cements: Potential Economically Viable Solutions for a Low-CO2 Cement-Based Materials Industry. Cem Concr Res 2018, 114, 2–26. [Google Scholar] [CrossRef]
- Bianco, I.; Blengini, G.A. Life Cycle Inventory of Technologies for Stone Quarrying, Cutting and Finishing: Contribution to Fill Data Gaps. J Clean Prod 2019, 231, 419–427. [Google Scholar] [CrossRef]
- Spooner, S.; Davis, C.; Li, Z. Modelling the Cumulative Effect of Scrap Usage within a Circular UK Steel Industry – Residual Element Aggregation. Ironmaking & Steelmaking 2020, 47, 1100–1113. [Google Scholar] [CrossRef]
- Nurdiawati, A.; Zaini, I.N.; Wei, W.; Gyllenram, R.; Yang, W.; Samuelsson, P. Towards Fossil-Free Steel: Life Cycle Assessment of Biosyngas-Based Direct Reduced Iron (DRI) Production Process. J Clean Prod 2023, 393, 136262. [Google Scholar] [CrossRef]
- Citherlet, S.; Di Guglielmo, F.; Gay, J.-B. Window and Advanced Glazing Systems Life Cycle Assessment. Energy Build 2000, 32, 225–234. [Google Scholar] [CrossRef]
- Akinyele, D.O.; Rayudu, R.K.; Nair, N.K.C. Life Cycle Impact Assessment of Photovoltaic Power Generation from Crystalline Silicon-Based Solar Modules in Nigeria. Renew Energy 2017, 101, 537–549. [Google Scholar] [CrossRef]
- Galimshina, A.; Hollberg, A.; McCarty, J.; Waibel, C.; Schlueter, A. High-Resolution and Localized Parametric Embodied Impact Calculator of PV Systems. IOP Conf Ser Earth Environ Sci 2023, 1196, 012014. [Google Scholar] [CrossRef]
- Khan, A.A.; Reichel, C.; Molina, P.; Friedrich, L.; Subasi, D.M.; Neuhaus, H.; Nold, S. Global Warming Potential of Photovoltaics with State-of-the Art Silicon Solar Cells: Influence of Electricity Mix, Installation Location and Lifetime. Solar Energy Materials and Solar Cells 2024, 269, 112724. [Google Scholar] [CrossRef]
- Palumbo, E.; Soust-Verdaguer, B.; Llatas, C.; Traverso, M. How to Obtain Accurate Environmental Impacts at Early Design Stages in BIM When Using Environmental Product Declaration. A Method to Support Decision-Making. Sustainability 2020, 12, 6927. [Google Scholar] [CrossRef]
- Passer, A.; Lasvaux, S.; Allacker, K.; De Lathauwer, D.; Spirinckx, C.; Wittstock, B.; Kellenberger, D.; Gschösser, F.; Wall, J.; Wallbaum, H. Environmental Product Declarations Entering the Building Sector: Critical Reflections Based on 5 to 10 Years Experience in Different European Countries. Int J Life Cycle Assess 2015, 20, 1199–1212. [Google Scholar] [CrossRef]
Figure 1.
Overview of the dataset considered for windows: (a) per PO, (b) based on the frame material, (c) based on glazing type.
Figure 1.
Overview of the dataset considered for windows: (a) per PO, (b) based on the frame material, (c) based on glazing type.
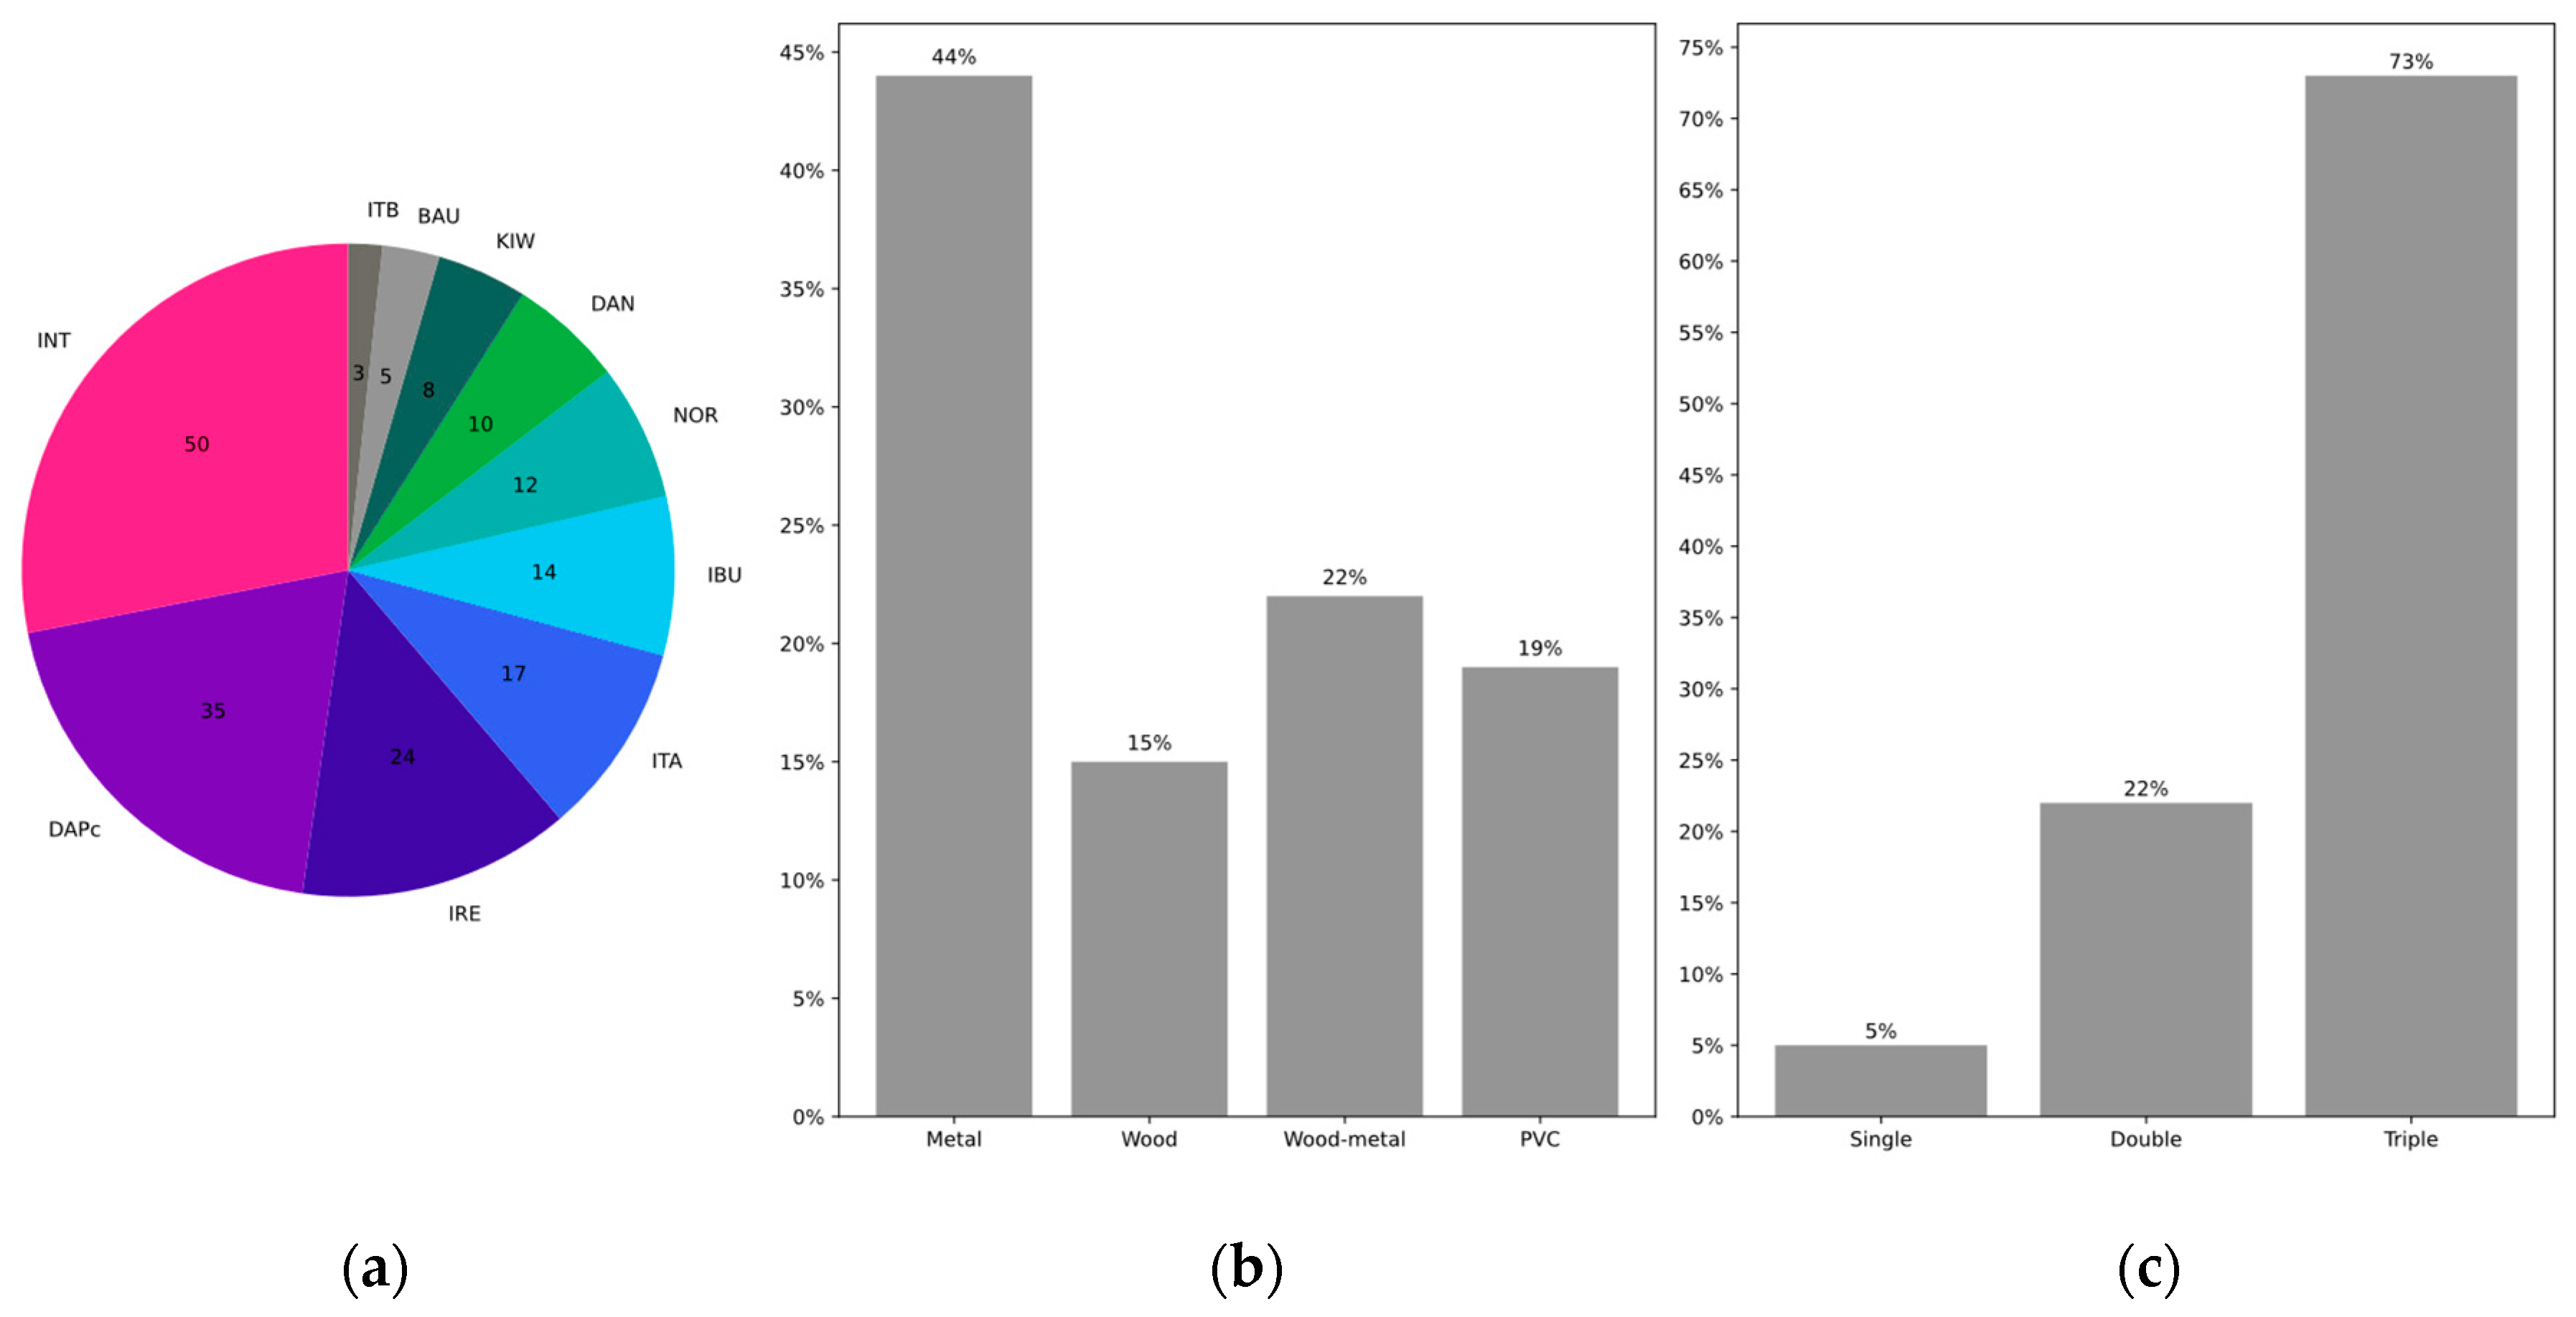
Figure 2.
GWP of different EPS panels versus density (a) and density classes (b).
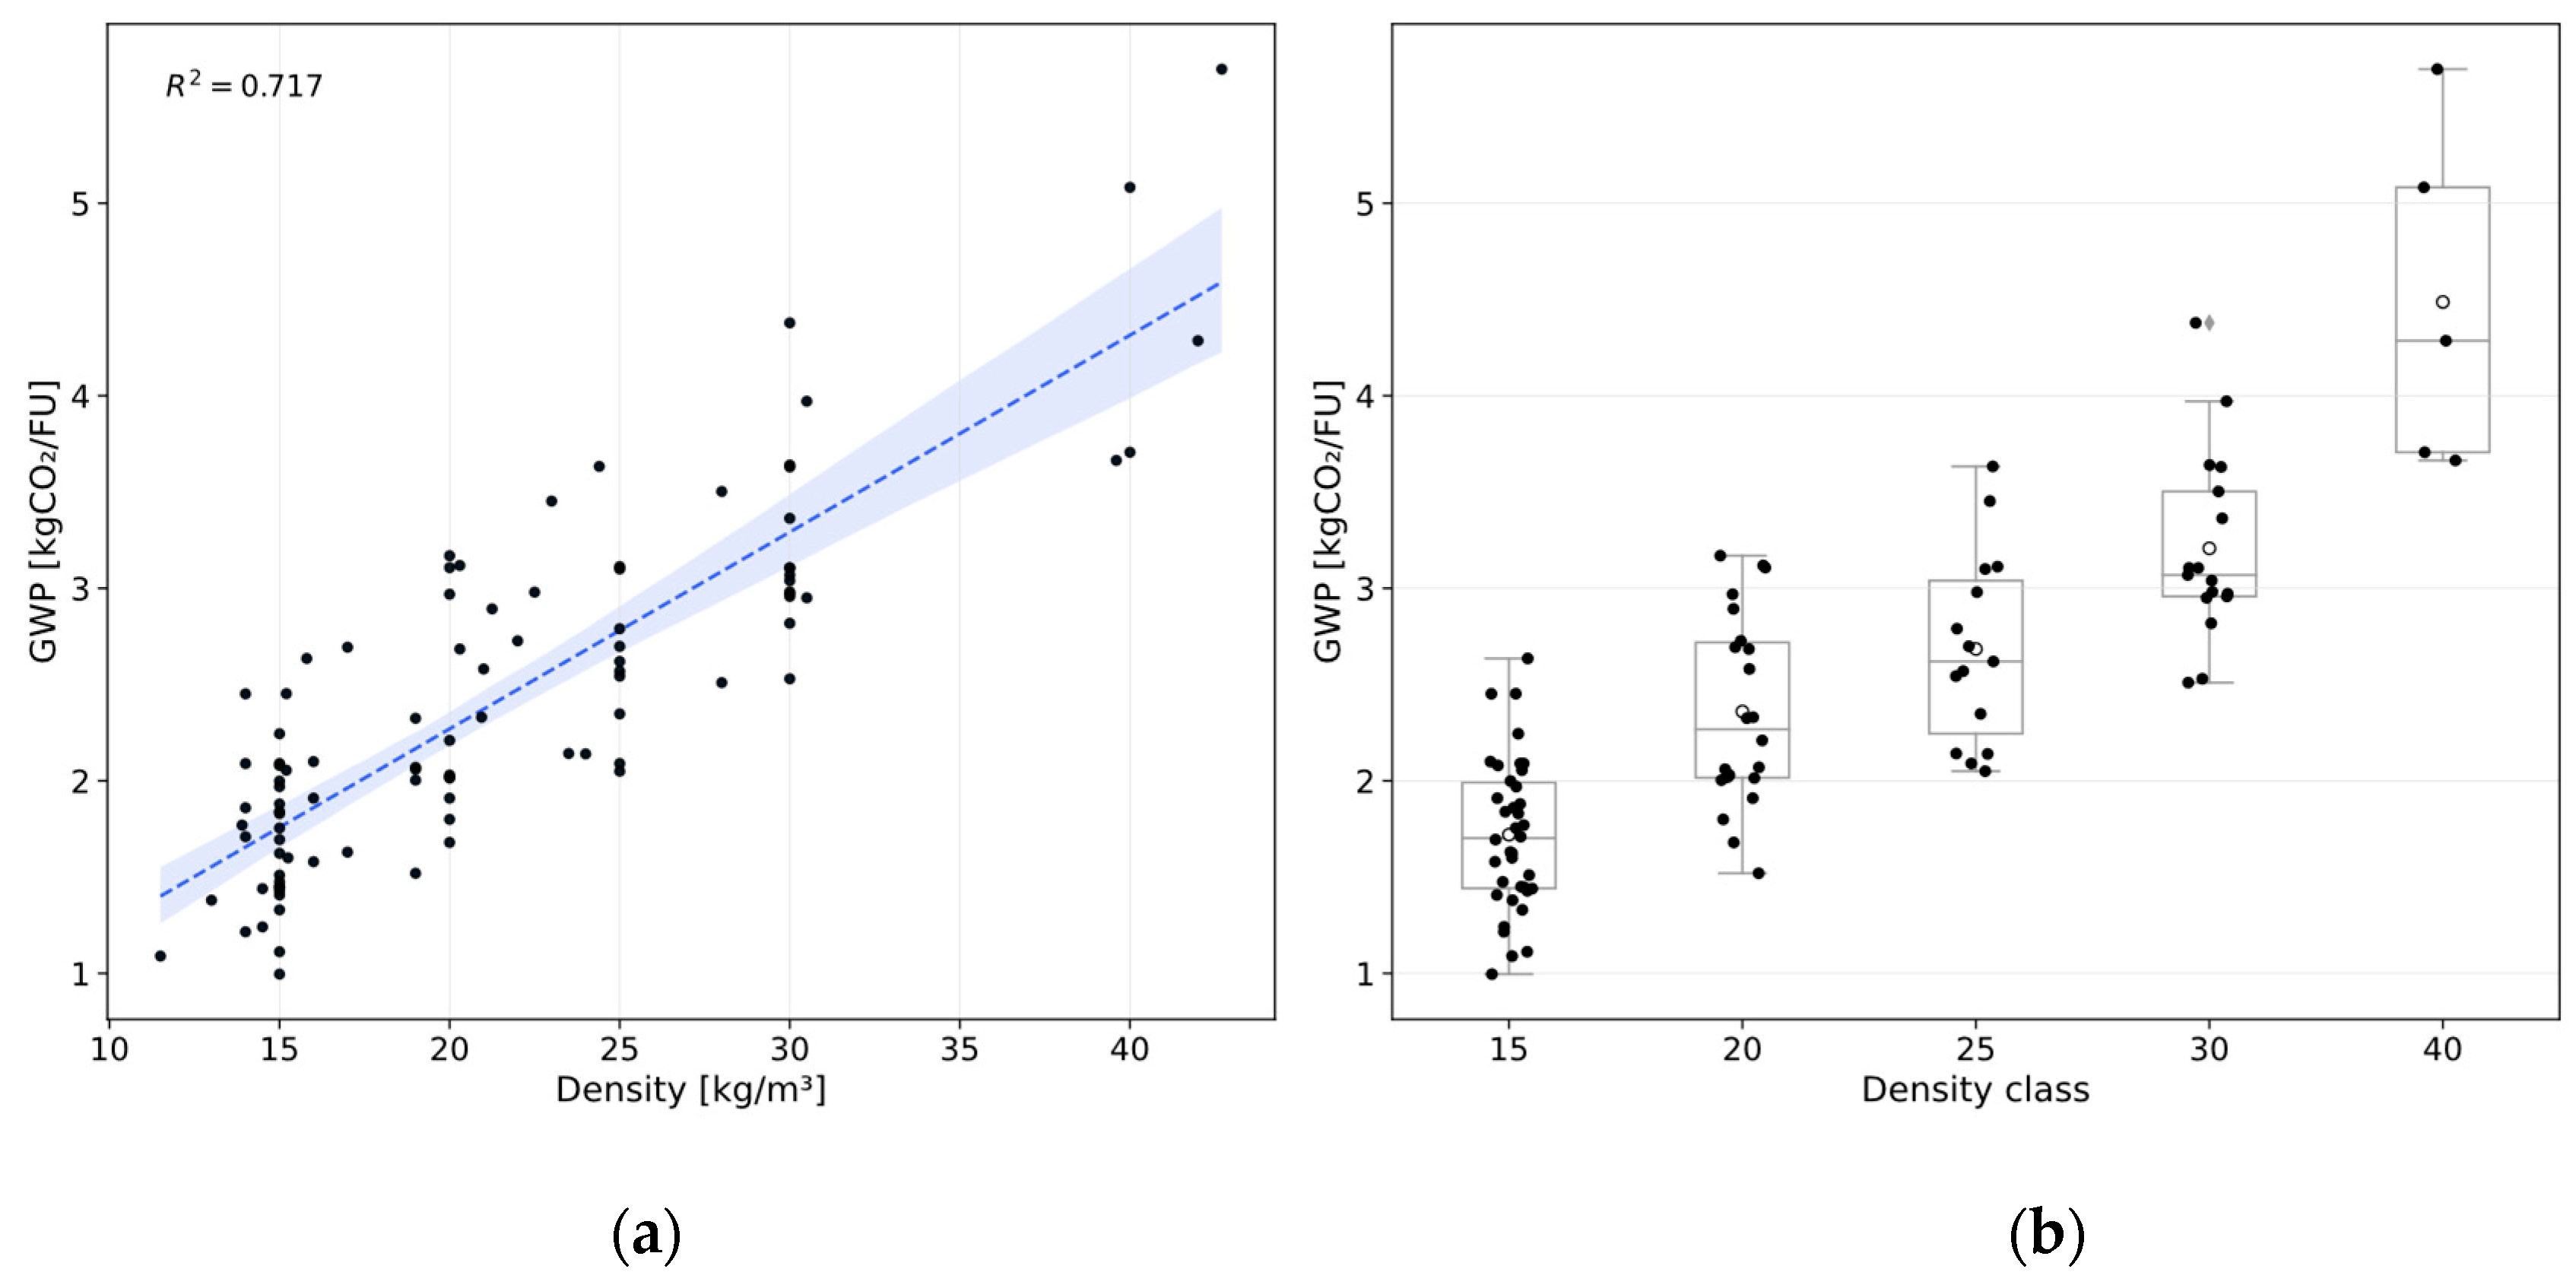
Figure 3.
GWP of different SW panels versus density (a), density classes and fuel mix (b).
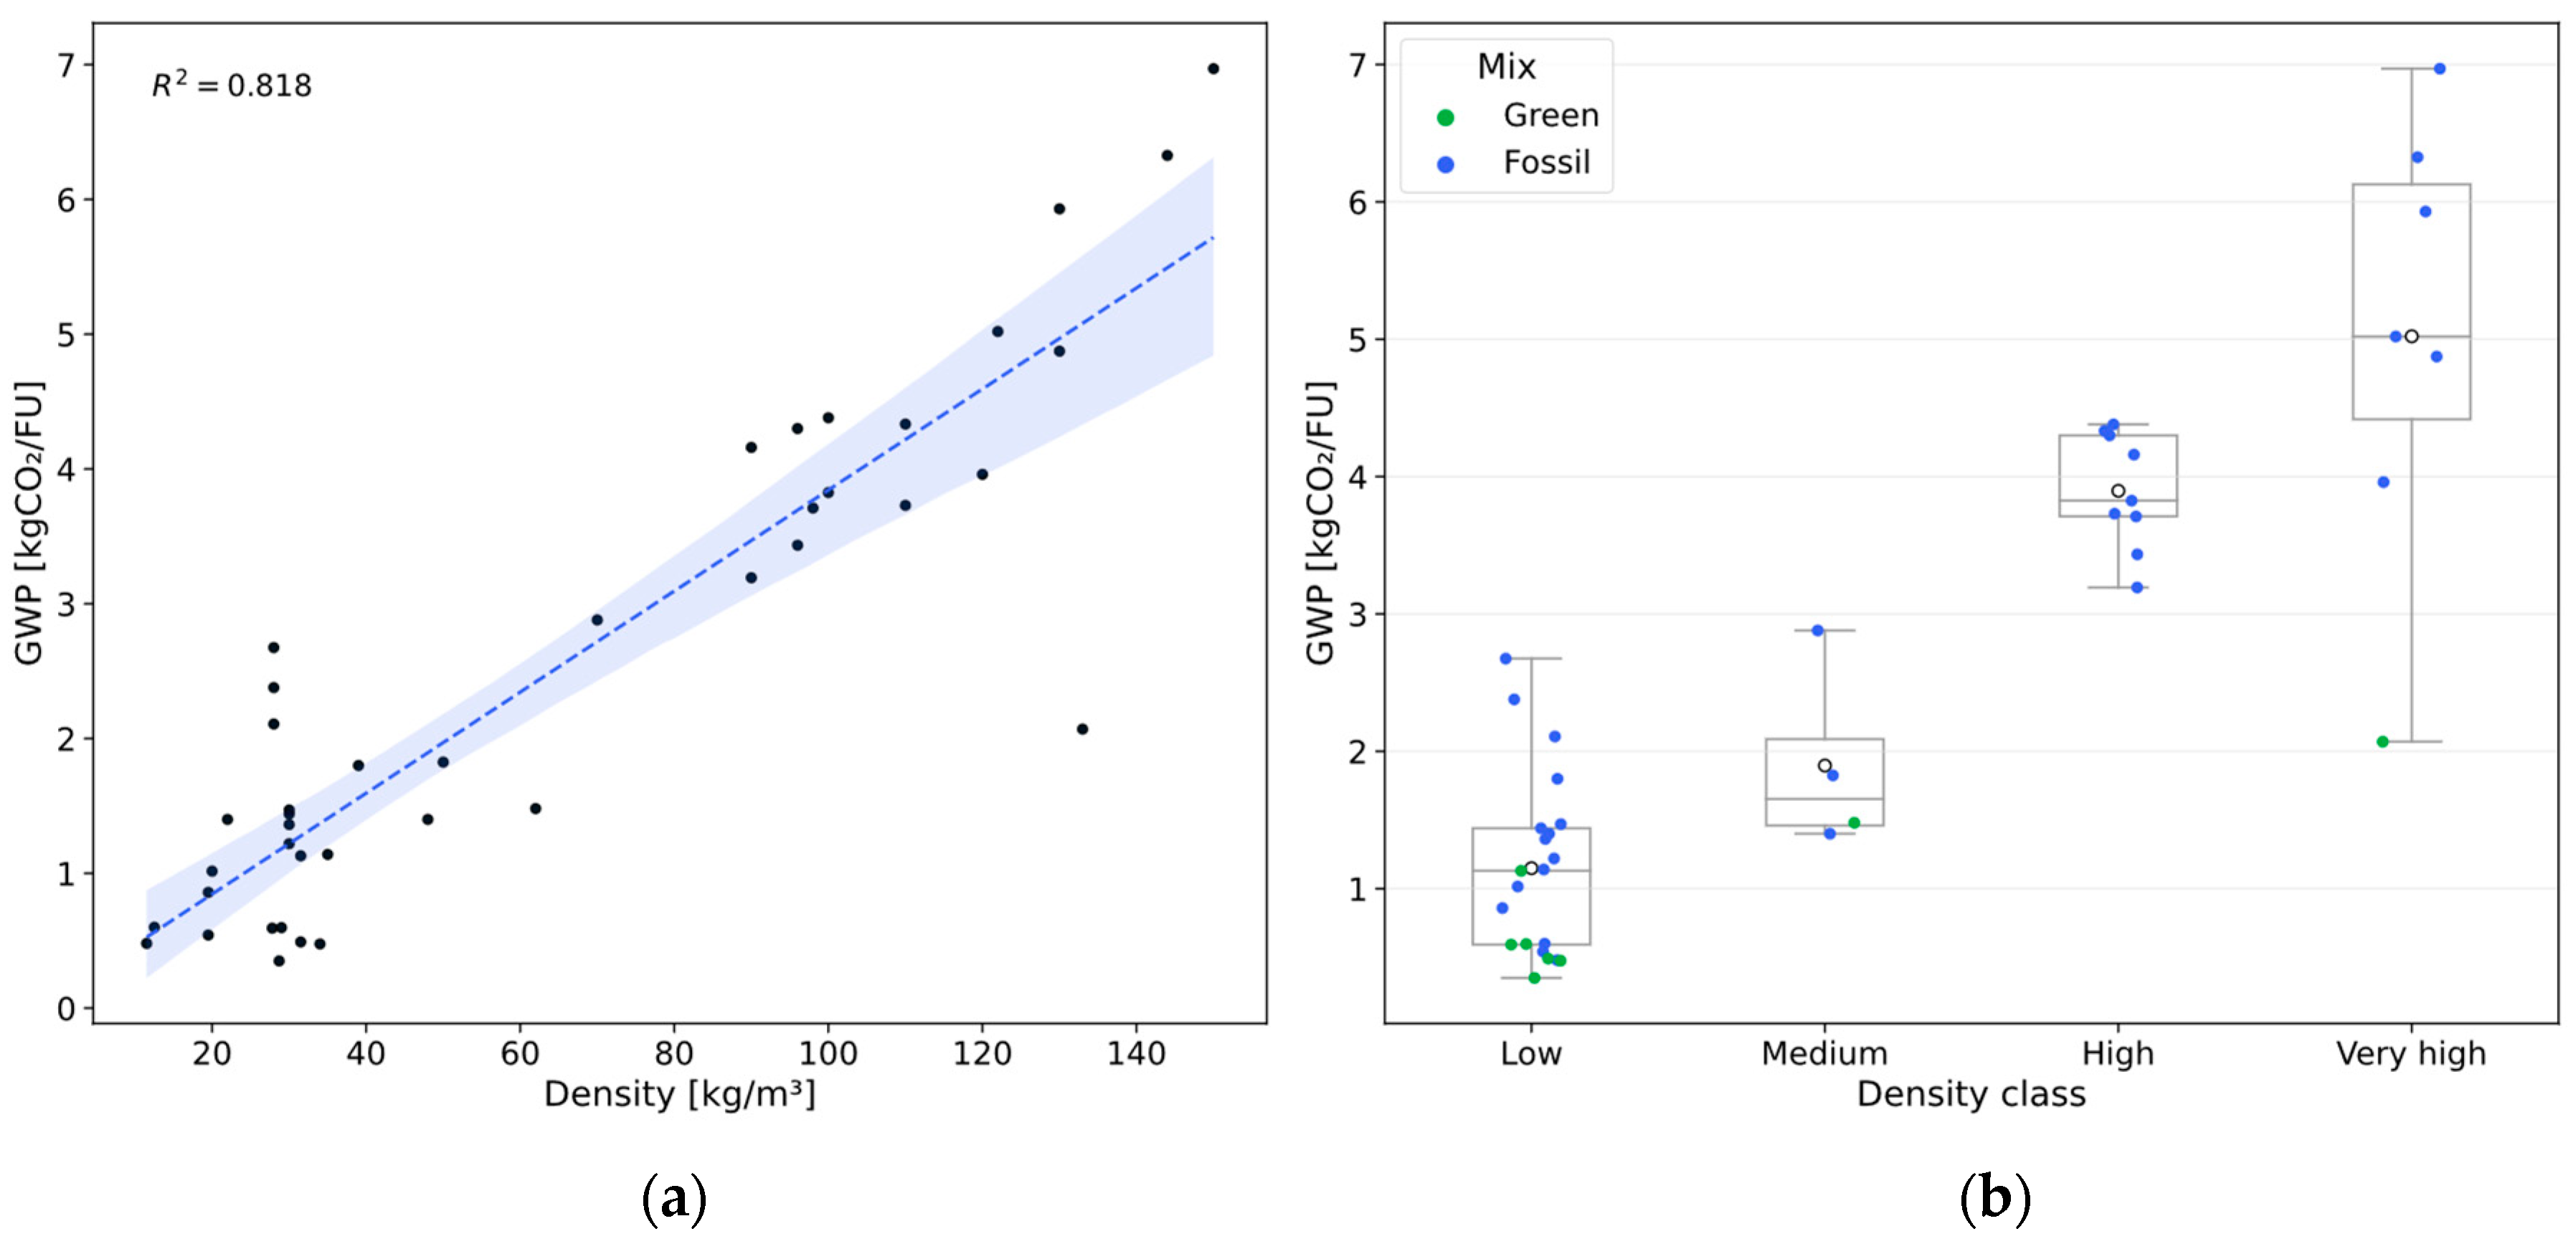
Figure 4.
Box plot of fossil GWP (a) and total primary energy (b) for hollow bricks vs. full bricks.
Figure 4.
Box plot of fossil GWP (a) and total primary energy (b) for hollow bricks vs. full bricks.
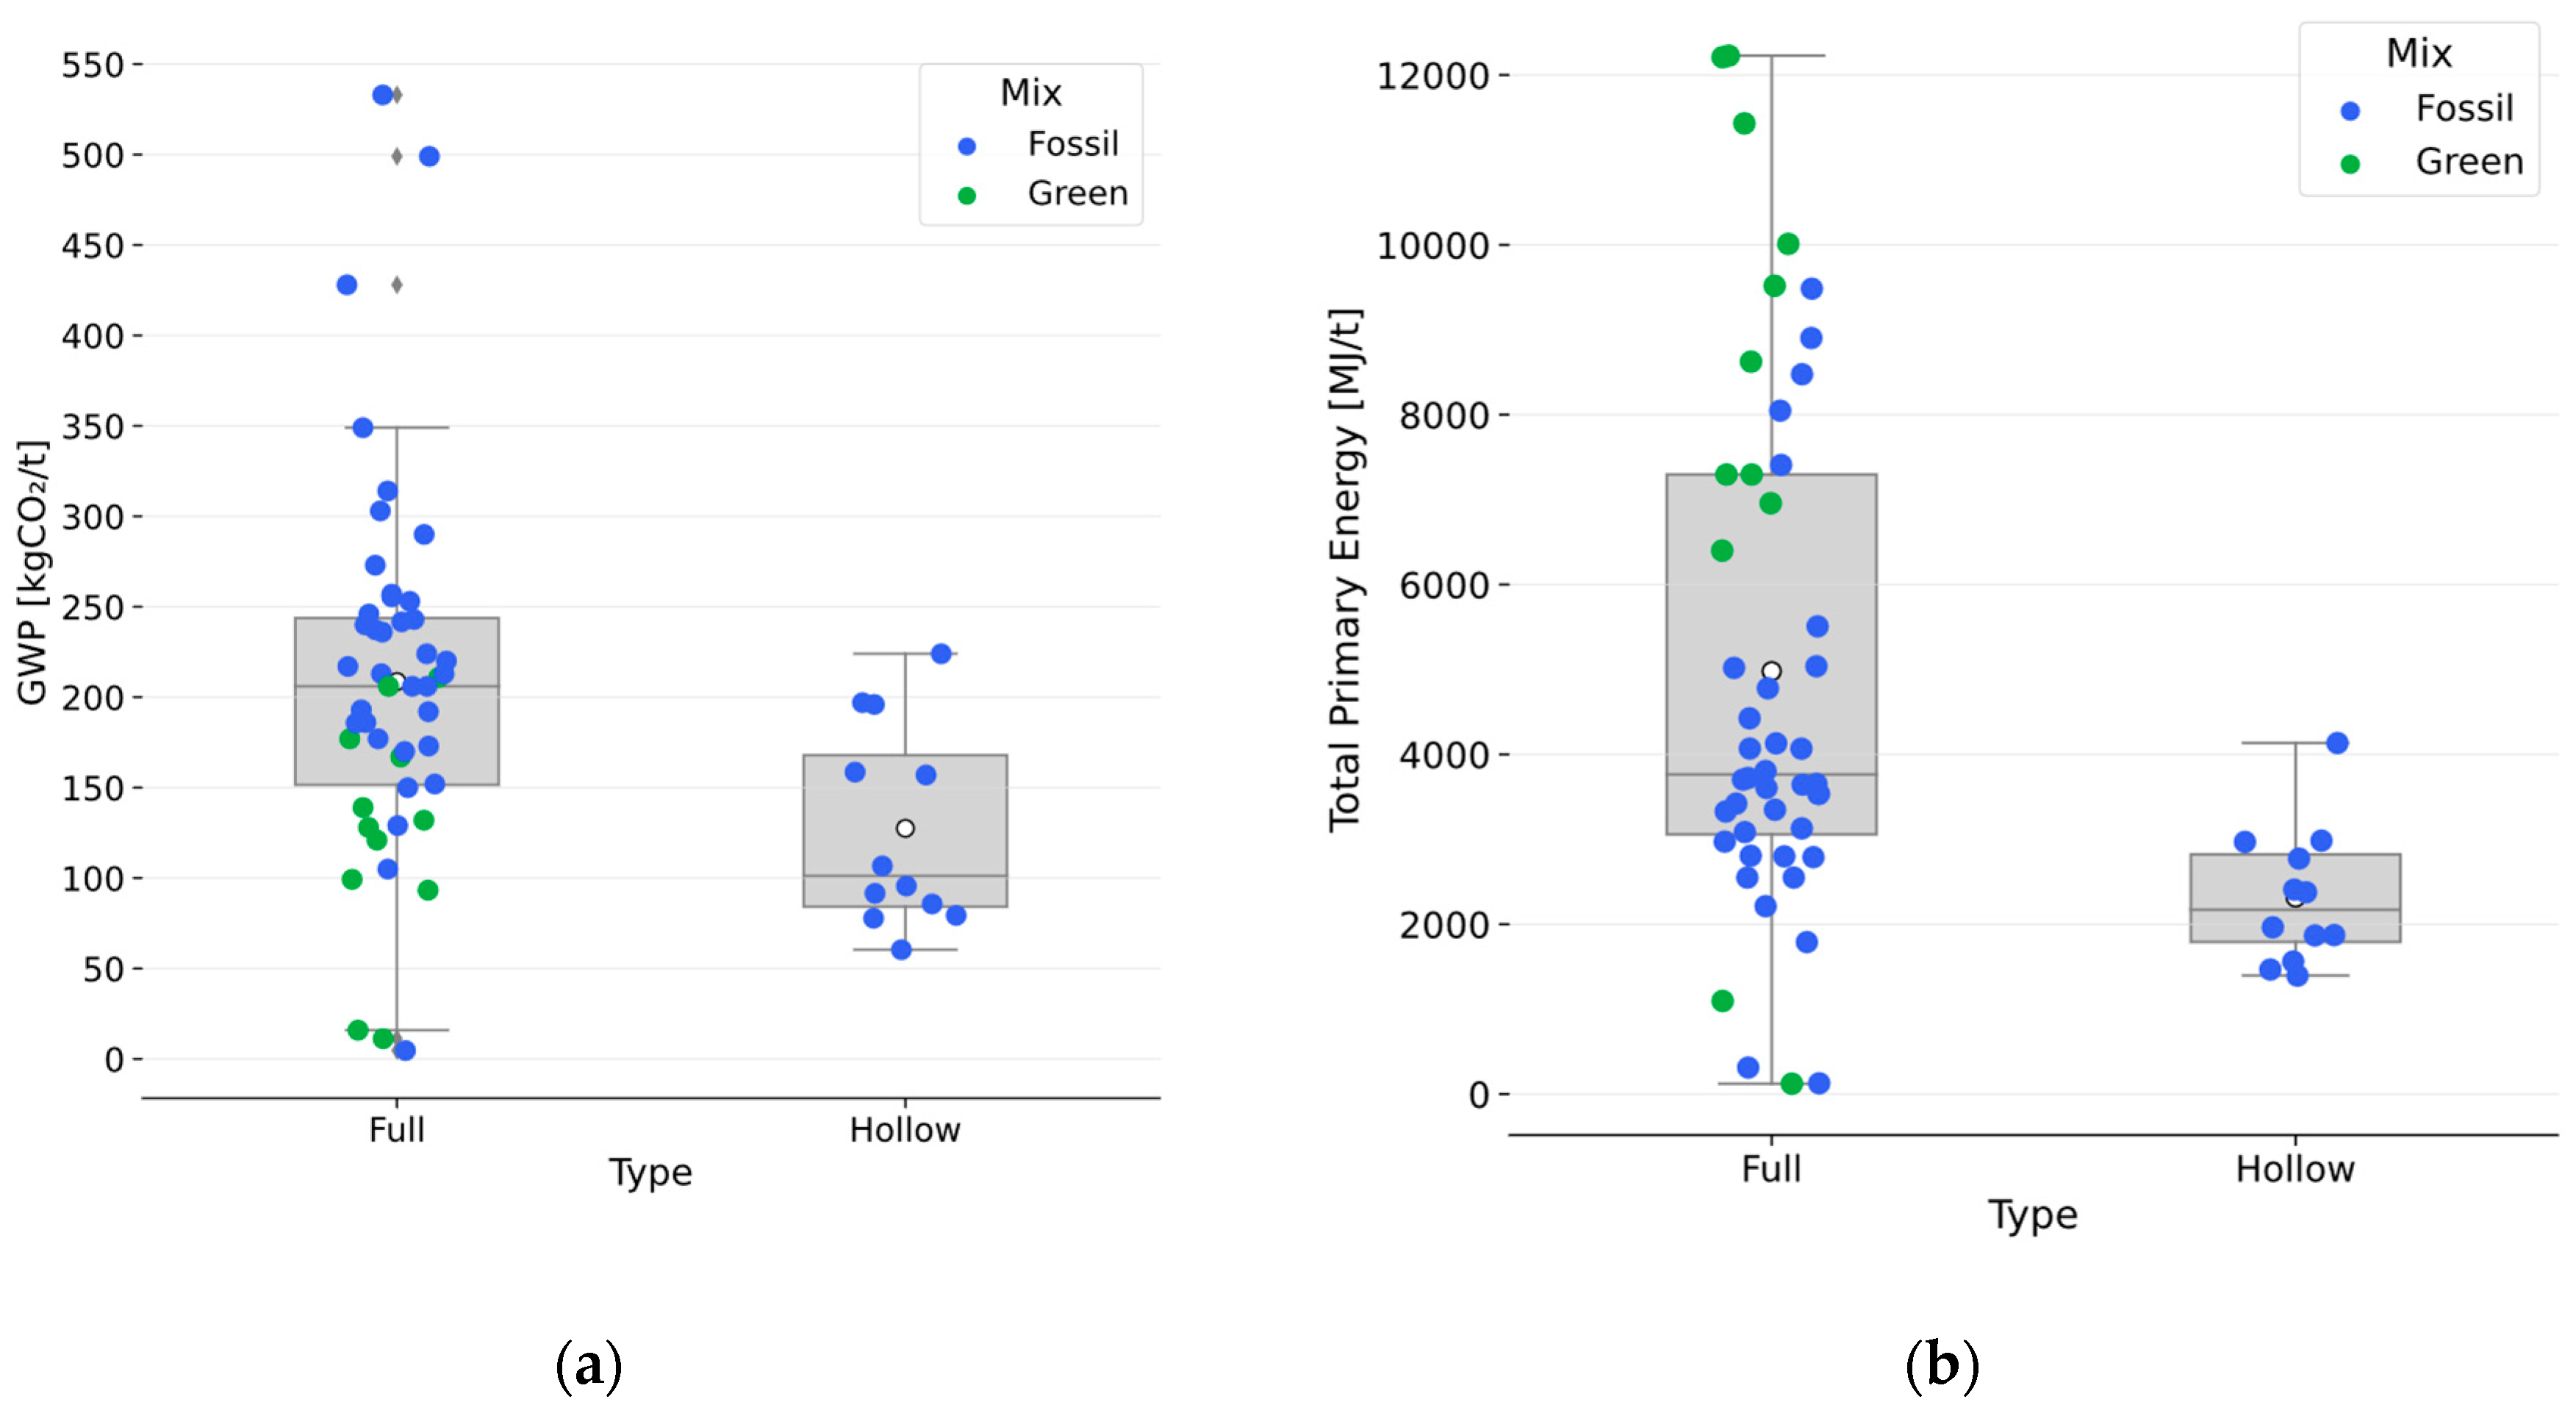
Figure 5.
Box plot of fossil GWP for ready mixed concretes against their cubic compression resistance.
Figure 5.
Box plot of fossil GWP for ready mixed concretes against their cubic compression resistance.
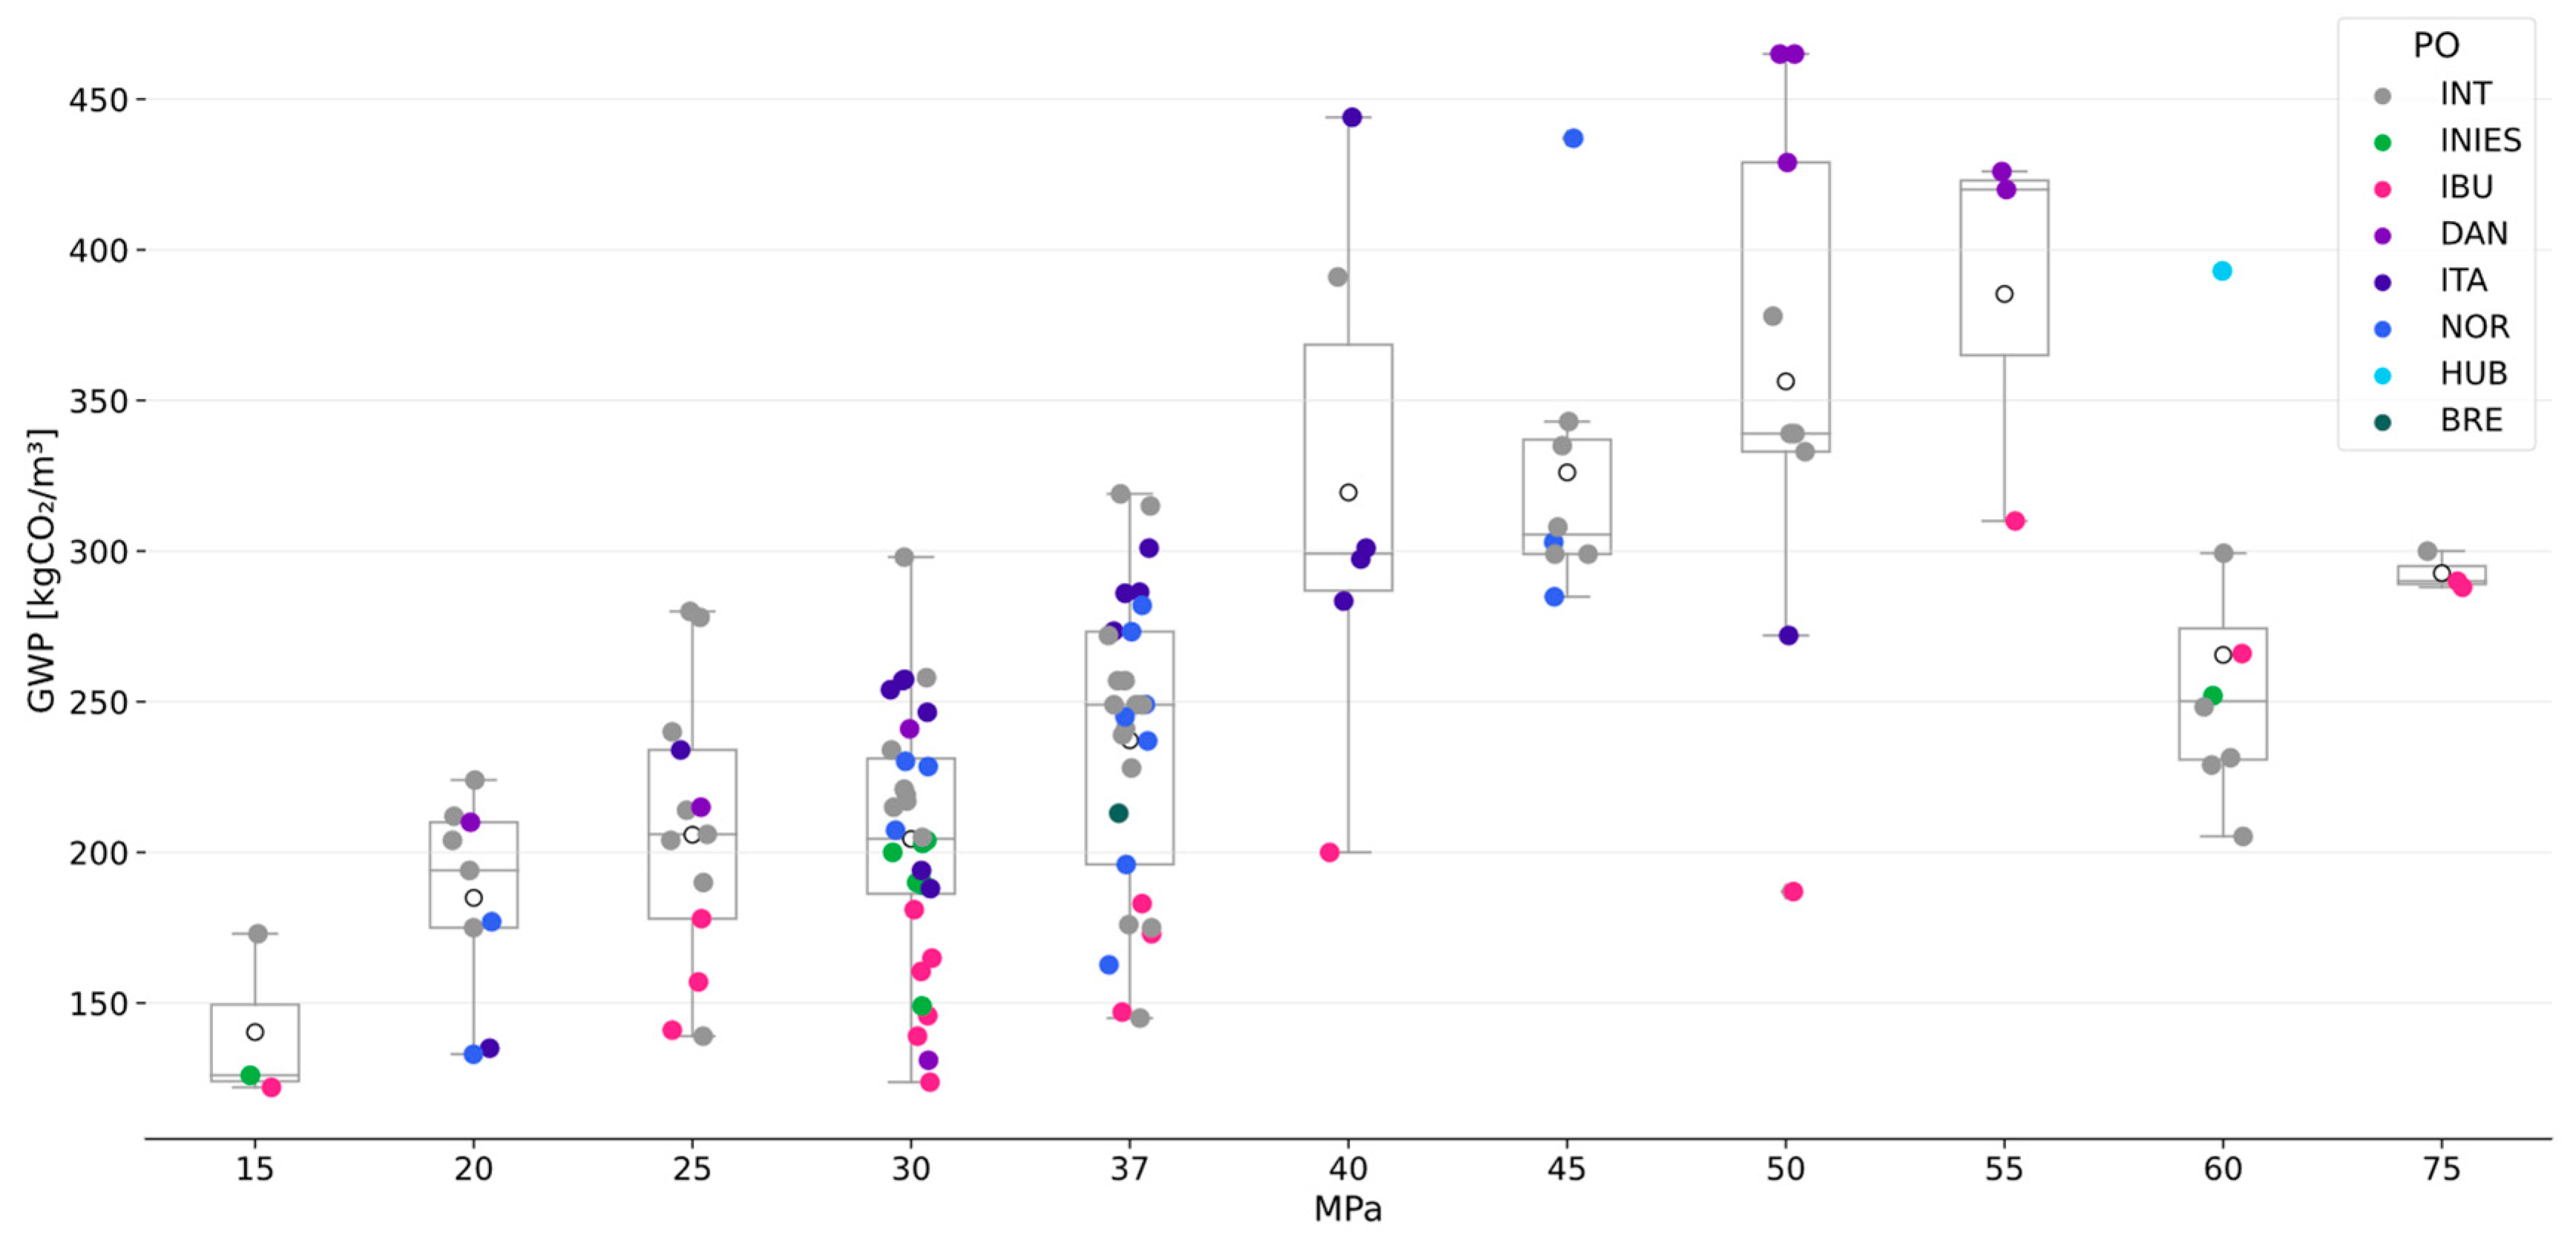
Figure 6.
Box plot of fossil GWP for the cements categories identified (“green” mix has PERT+ RSF>35% PET).
Figure 6.
Box plot of fossil GWP for the cements categories identified (“green” mix has PERT+ RSF>35% PET).
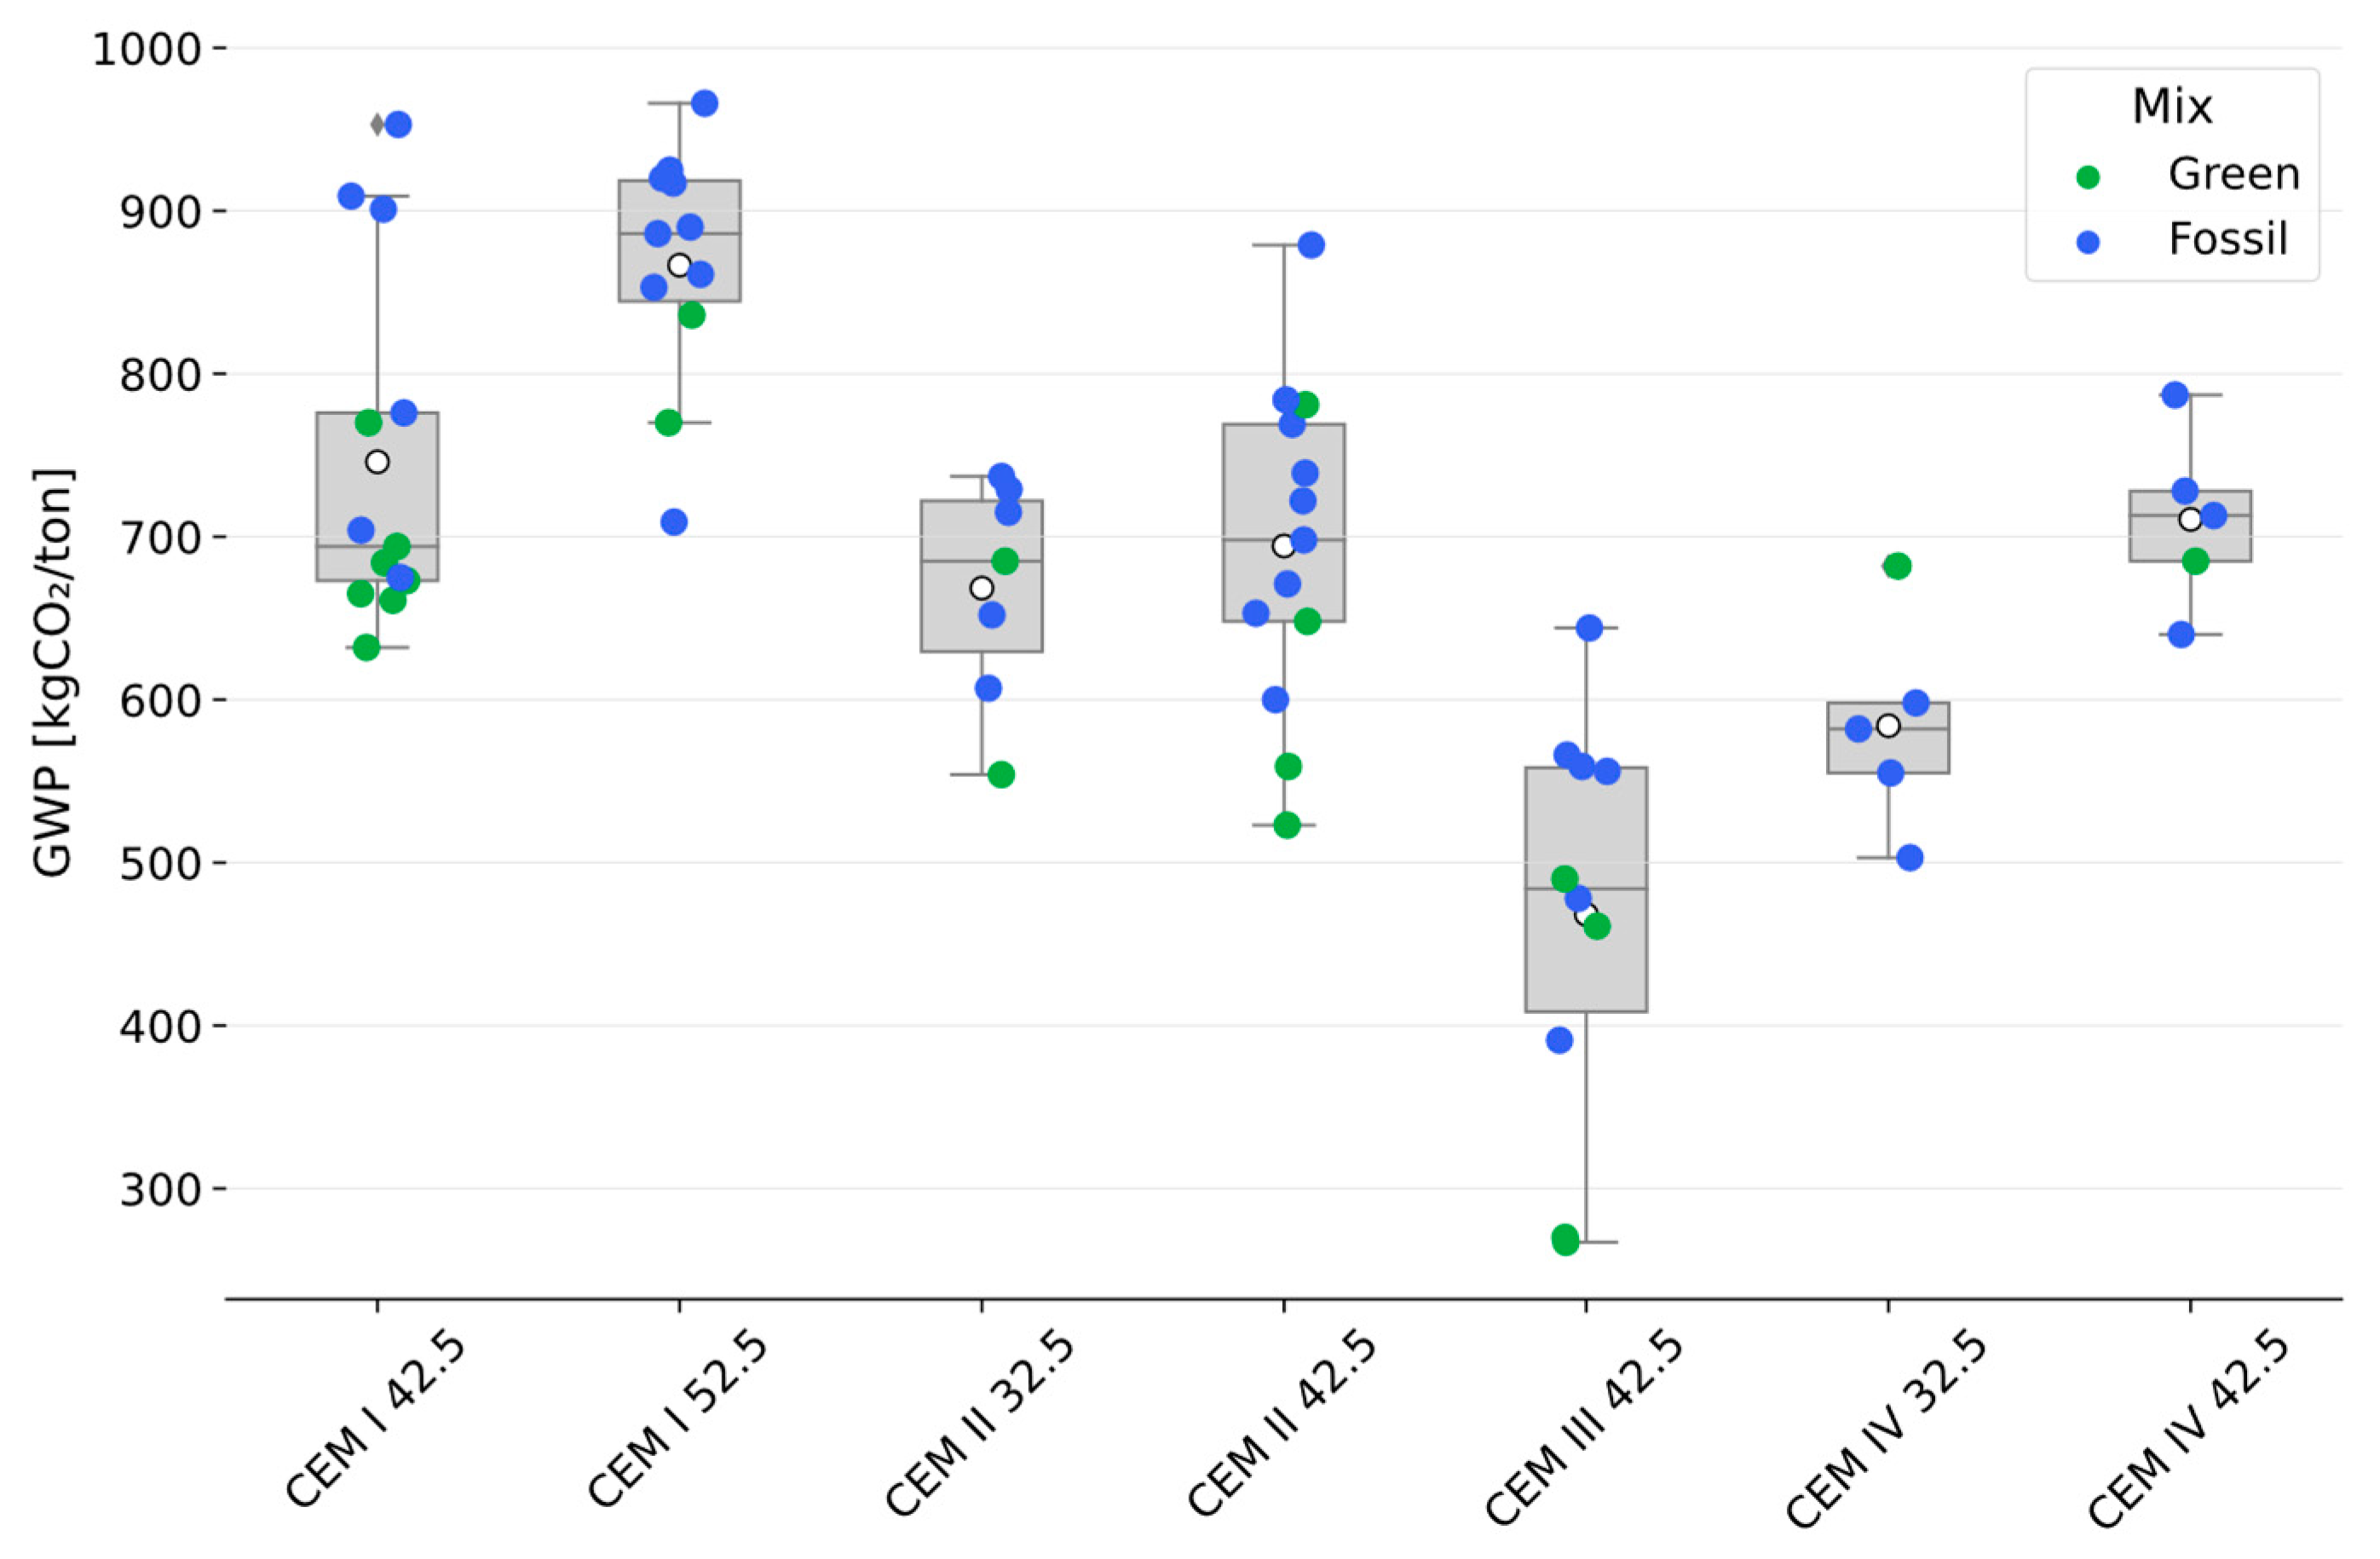
Figure 7.
Strip plot for the fossil GWP of different natural stones products (b: quarry blocks; c: cut stones; c+f: cuts with surface finishing). Green electricity mixes are composed by 100% renewable sources while national green mixes are the ones with a carbon intensity lower than 0.1 kgCO2/kWh; national residual mixes represent not certified electricity; N.D. stands for not declared.
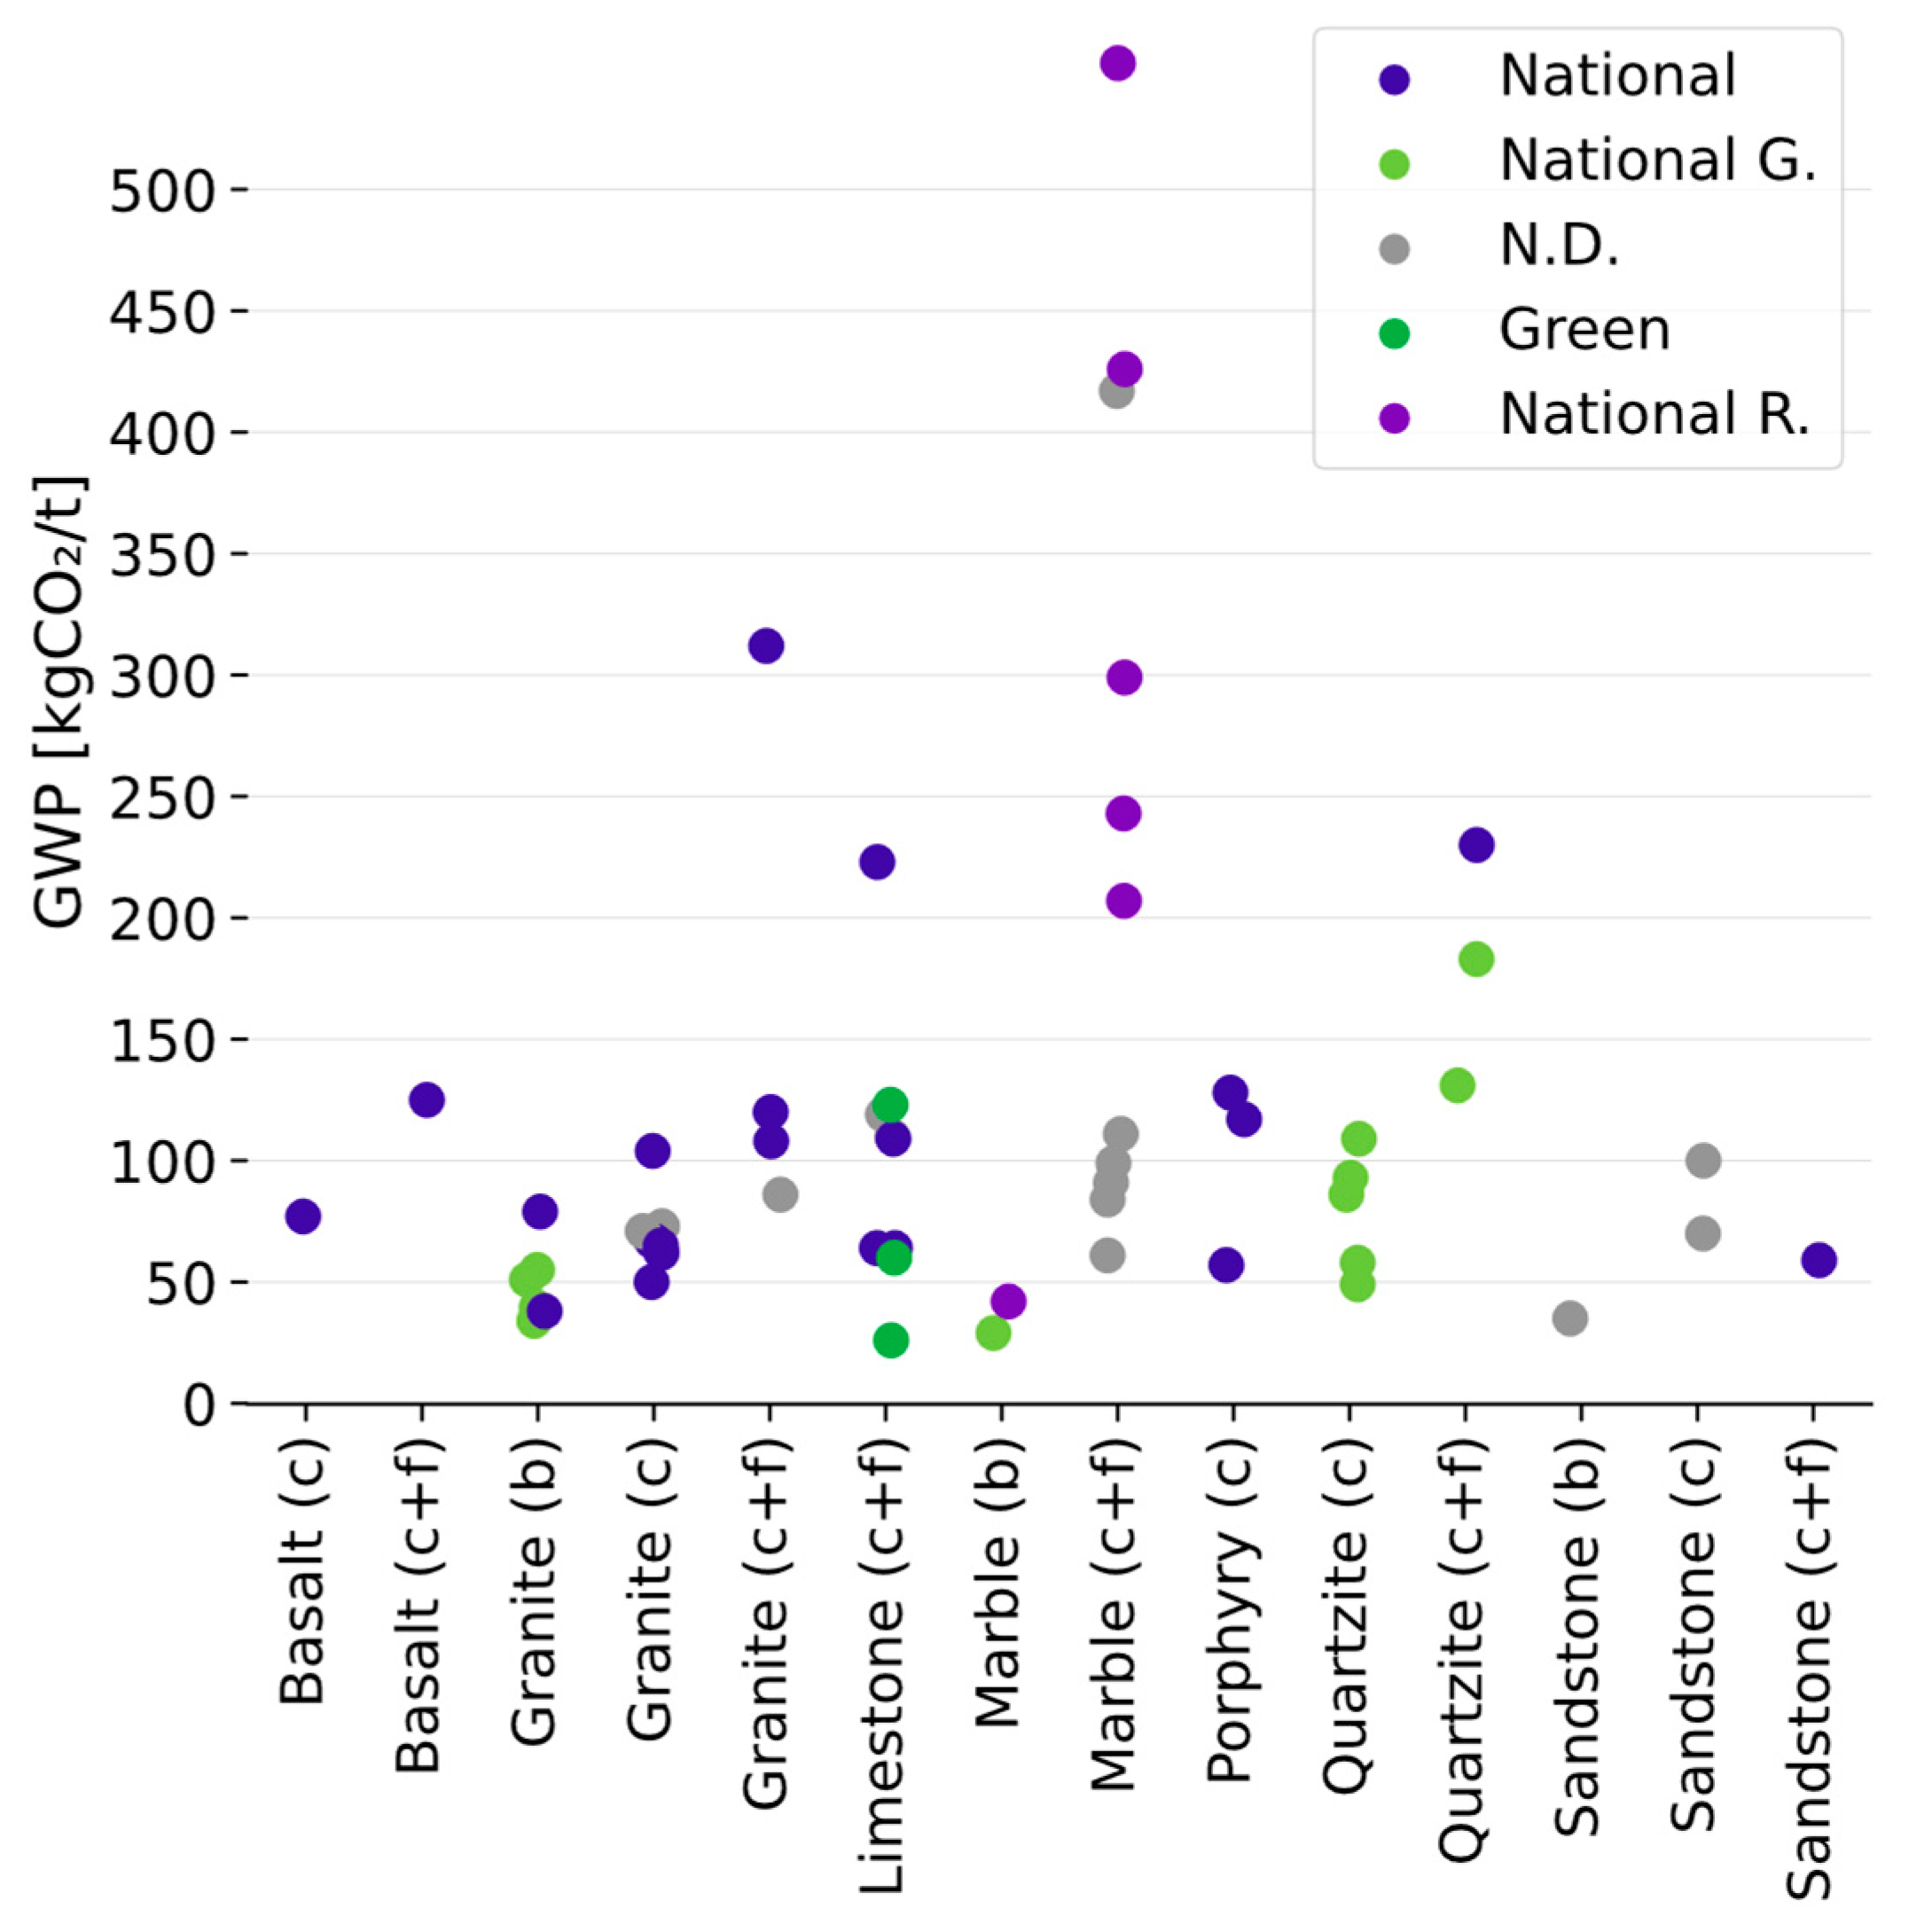
Figure 8.
Box plot of fossil GWP for the steel categories obtained, considering energy mix.
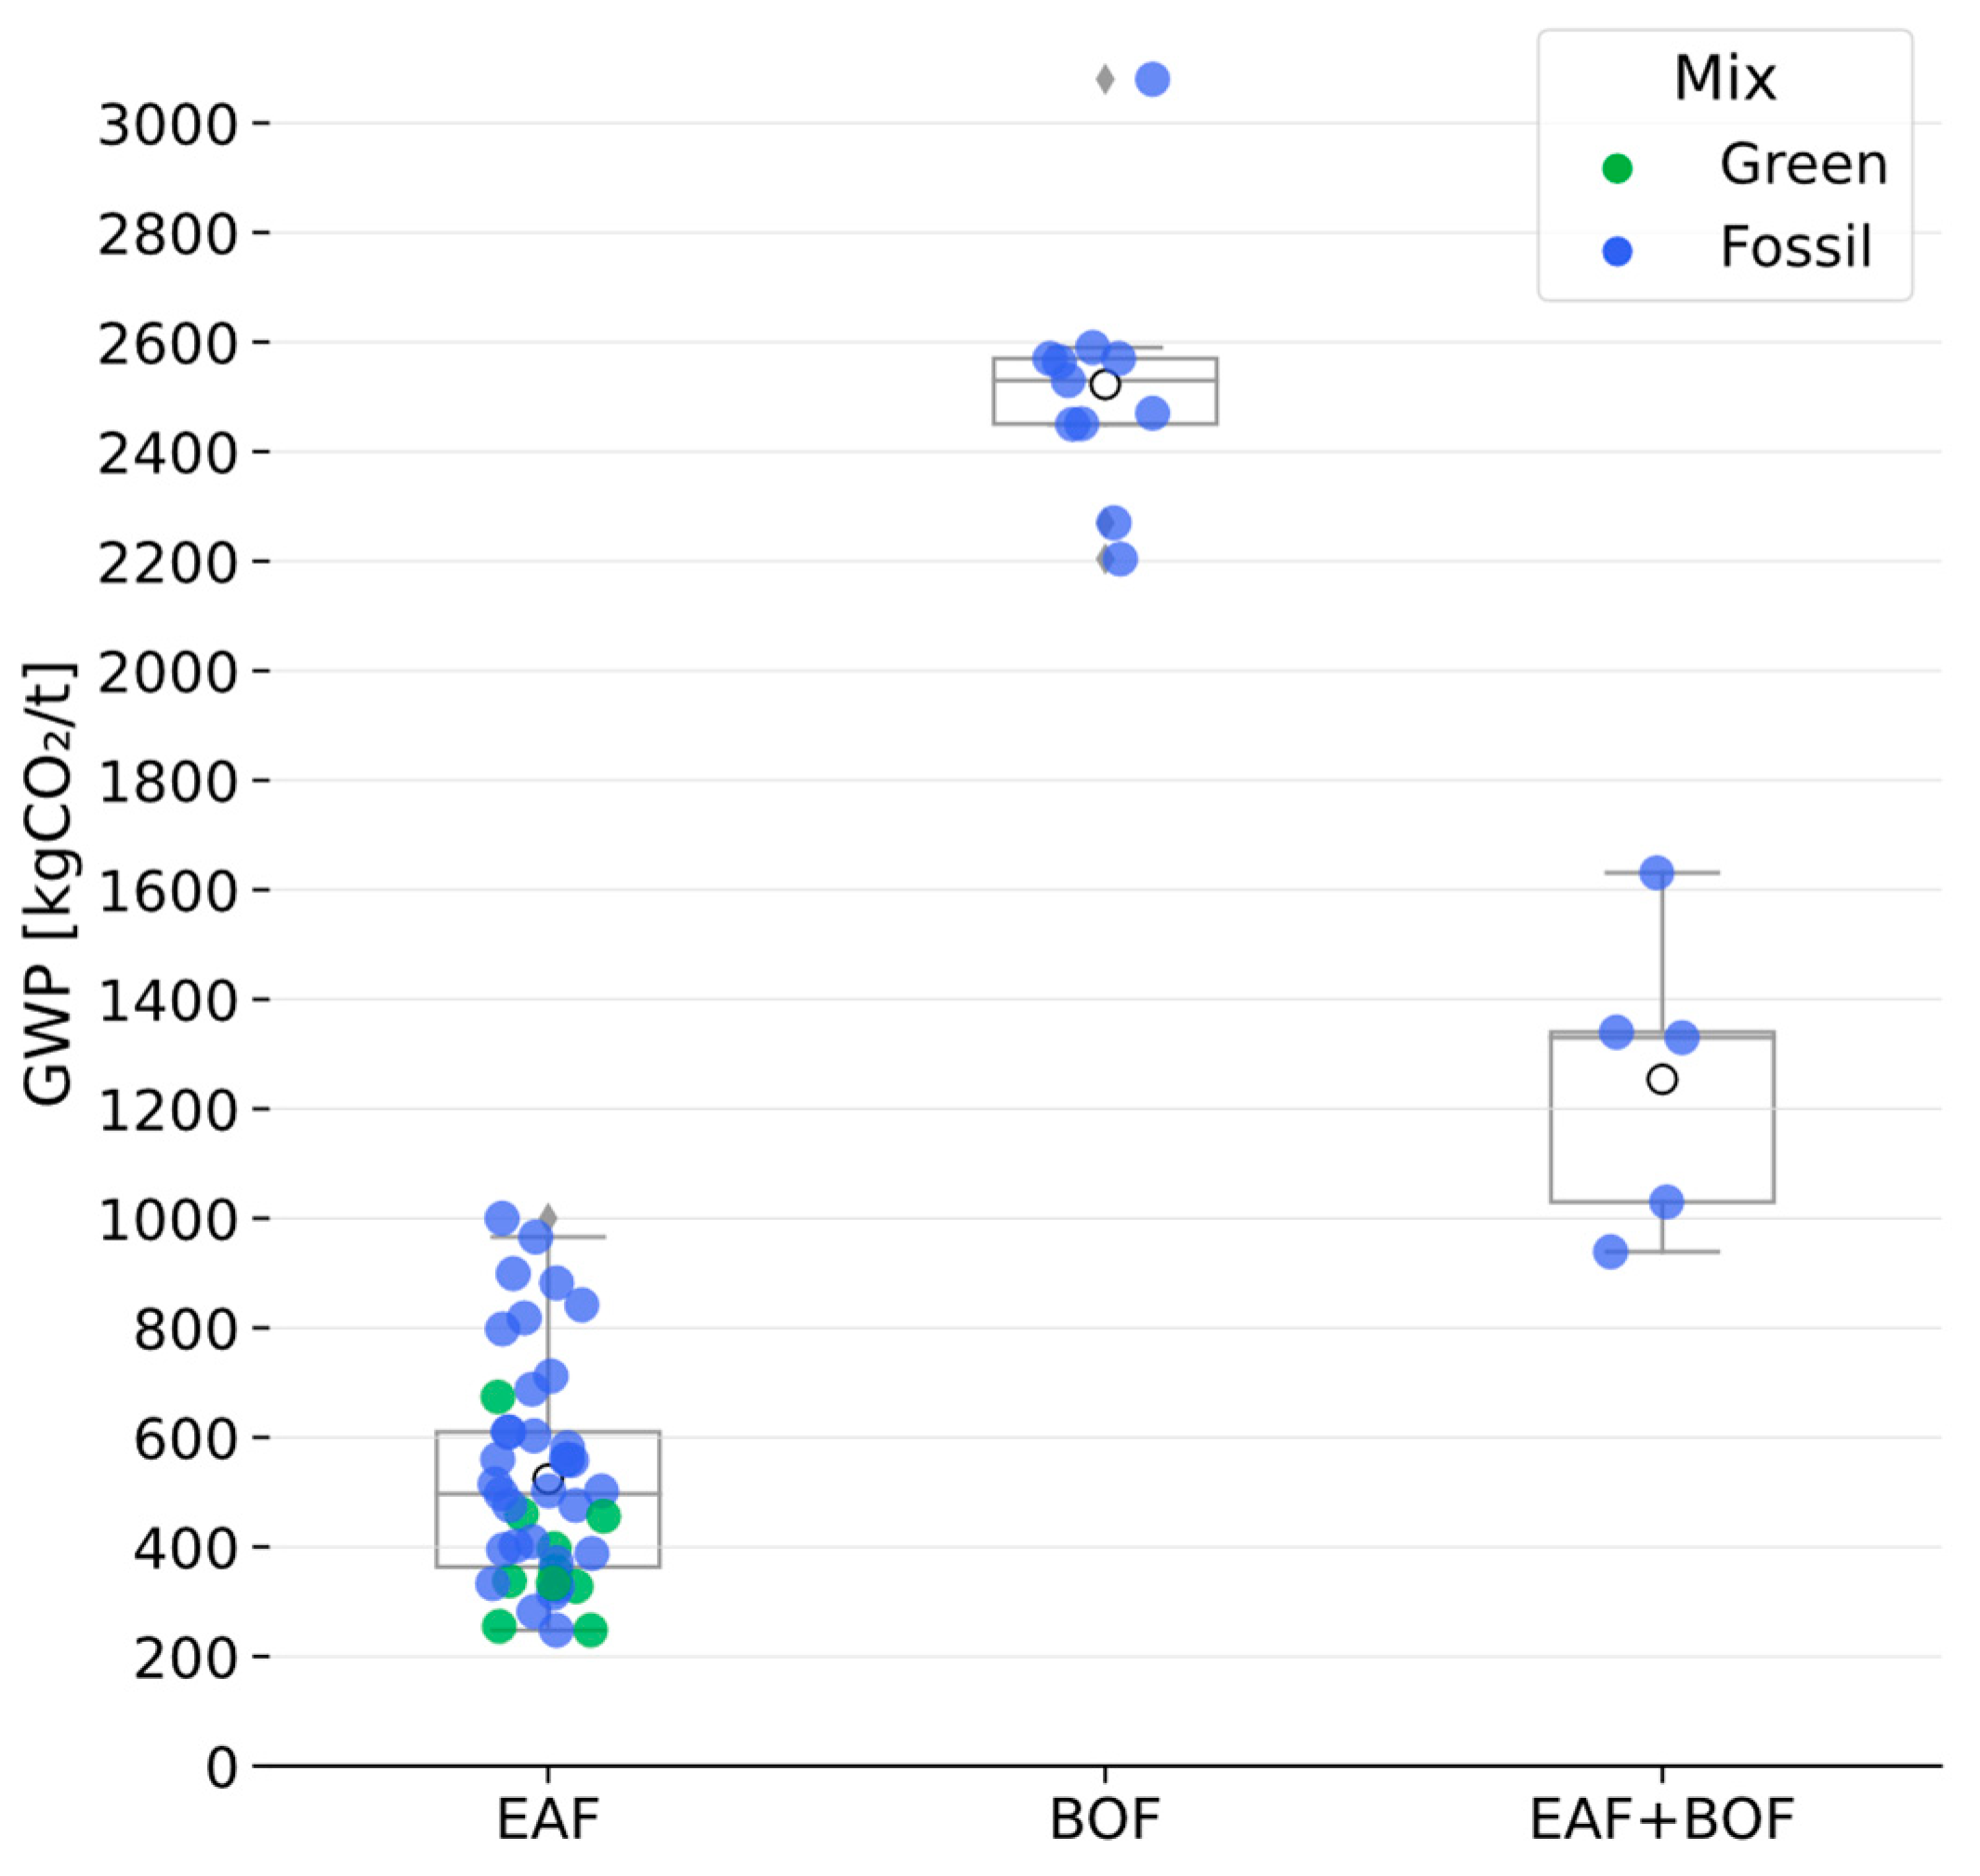
Figure 9.
Box plot of fossil GWP/m2 for different glazing (left) and frame material (right).
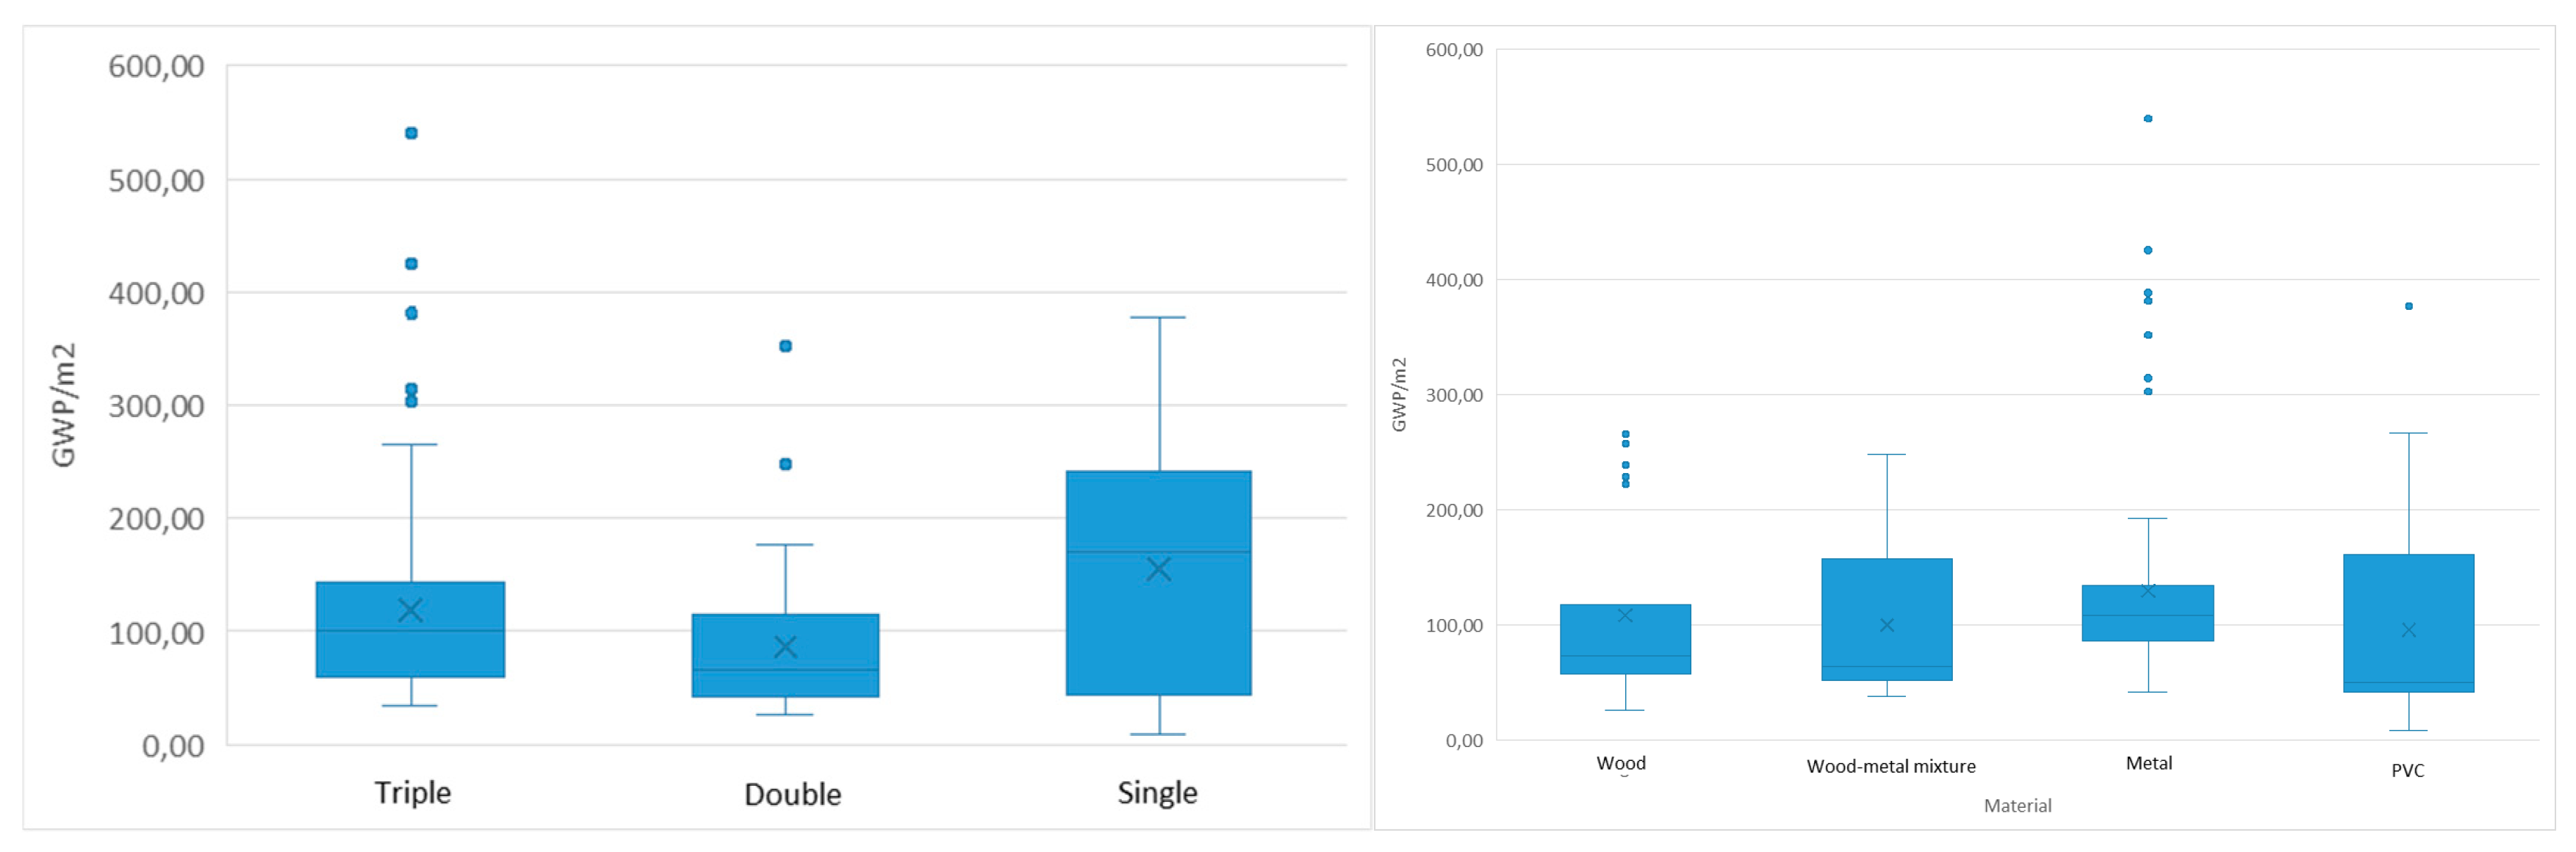
Figure 10.
Box plot of the GWP of structural wood products (FU = 1 kg), considering embodied and end-of-life carbon release.
Figure 10.
Box plot of the GWP of structural wood products (FU = 1 kg), considering embodied and end-of-life carbon release.
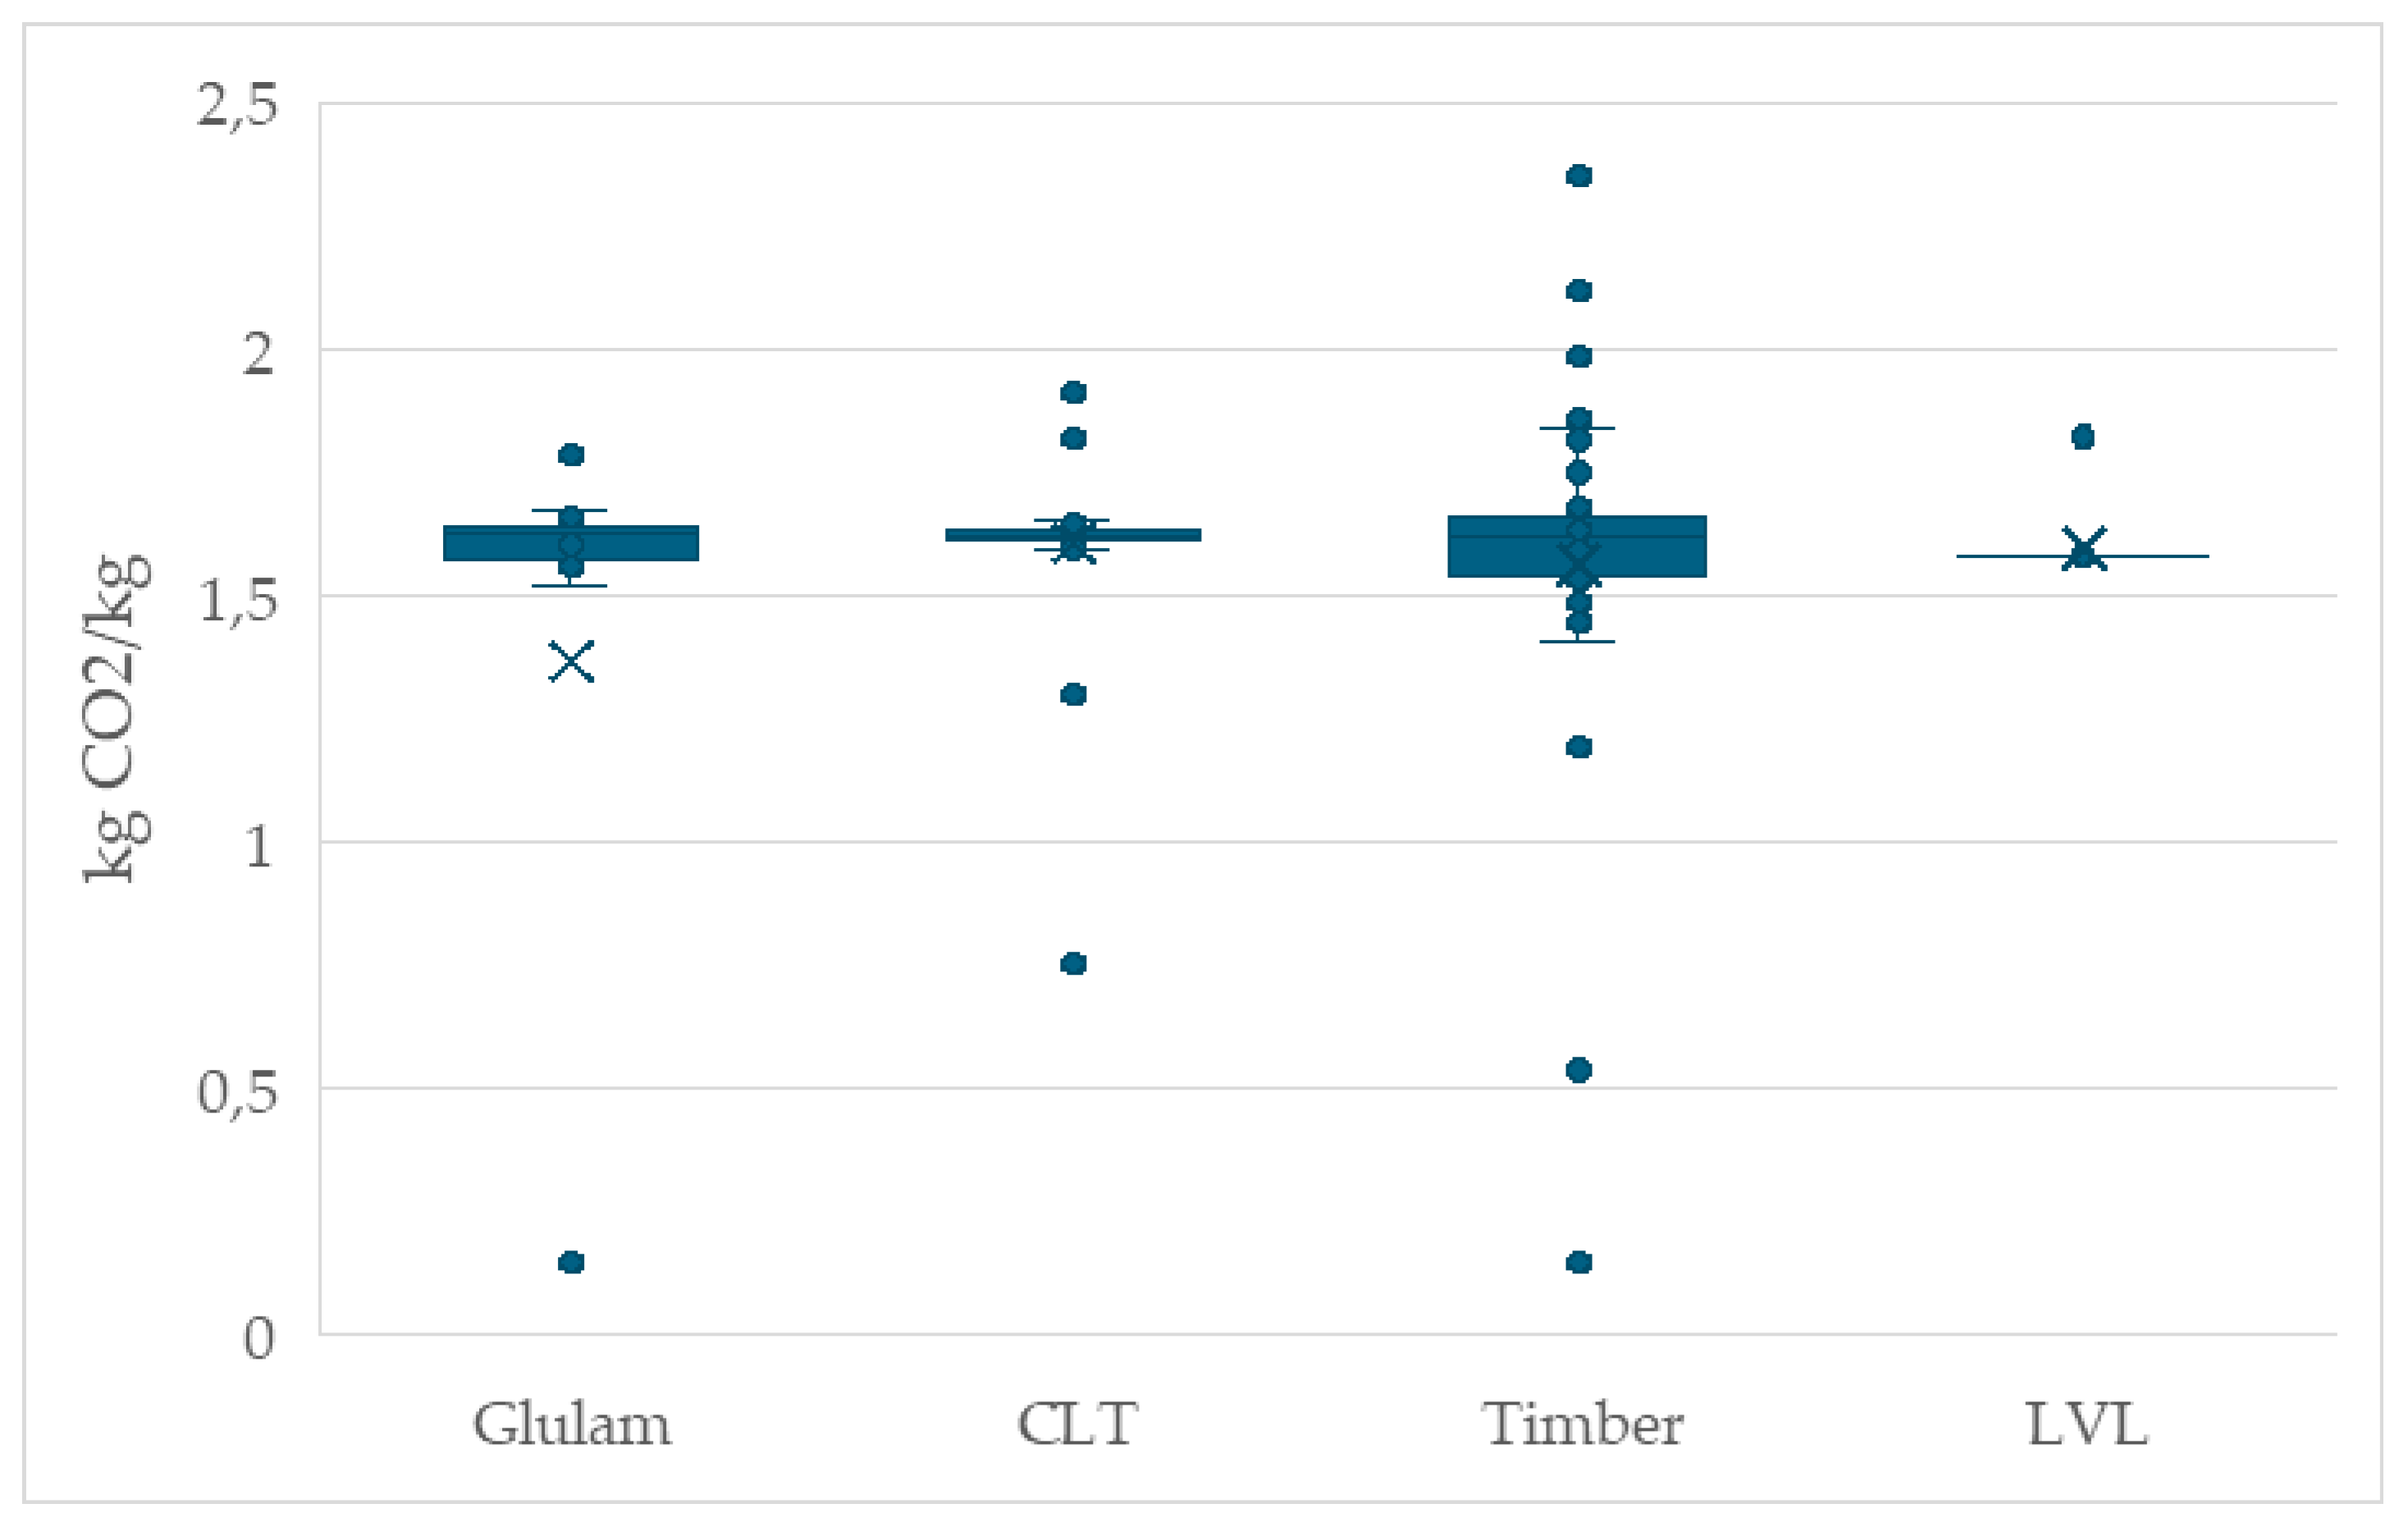
Figure 11.
Trend of GWP versus peak power as a function of a m2 of a photovoltaic panel.


Table 1.
Overview of the dataset considered for insulation materials.
| Program Operator | GWP values * | Production country * |
|---|---|---|
| INT | EPS (28), SW (19) | EPS: Italy (10), Greece (10), Sweden (7), Turkey (1) SW: Belgium (3), Croatia (2), Czechia (3), France (1), Germany (1), Italy (2), Serbia (1), Slovakia (2), Slovenia (1), Turkey (2), UK (1) |
| IBU |
EPS (28), SW (8) | EPS: Germany (24), Italy (3), Norway (1) SW: Germany (6), Belgium (2) |
| INI | EPS (16), SW (1) | France |
| NOR | EPS (4), SW (8) | Norway |
| BAU | EPS (5), SW (3) | Austria |
| ITA | EPS (6) | Italy |
| IRE | EPS (2), SW (1) | Ireland |
| DAN | EPS (3) | Denmark |
| BRE | EPS (3) | United Kingdom |
| DAPh | SW (1) | Portugal |
| TZUS | EPS (1) | Czech Republic |
| ZAG | EPS (1) | Bosnia Herzegovina |
* The associated GWP values collected are enclosed in brackets.
Table 2.
Overview of the dataset considered for bricks.
| PO | N. of EPDs | Production country | Typology * |
|---|---|---|---|
| DAN | 24 | Denmark | Full bricks |
| IBU | 10 | Germany | Full bricks (8), hollow bricks (1), abobe full brick (1) |
| BRE | 7 | United Kingdom | Full bricks (6), hollow bricks (1) |
| INT | 6 | Czech Republic, Greece, Latvia, Poland, Sweden, Turkey |
Full bricks (4), hollow bricks (2) |
| INIES | 3 | France | Hollow bricks |
| ITA | 2 | Italy | Hollow bricks |
| RTS | 2 | Finland | Full bricks |
| ZAG | 2 | Croatia, Slovenia | Hollow bricks |
| MRPI | 1 | The Netherlands | Full bricks |
| IRE | 1 | Ireland | Full bricks |
| BAU | 1 | Austria | Hollow bricks |
| NOR | 1 | Norway | Full Bricks |
* The associated GWP values collected are enclosed in brackets.
Table 3.
Overview of the dataset considered for ready mixed concretes.
| PO | GWP values | Production country * | Cubic compression resistance (MPa) * |
|---|---|---|---|
| INT | 52 | Greece (30), Australia (7), Dubai (5), UK (5), Sweden (3), Turkey (1), Denmark (1) | 15 (1), 20 (5), 25 (8), 30 (8), 37 (14), 40 (1), 45 (5), 50 (4), 60 (5), 75 (1) |
| IBU | 19 | Germany (14), UK (5) | 15 (1), 25 (3), 30 (6), 37 (3), 40 (1), 50 (1), 55 (1), 60 (1), 75 (2) |
| ITA | 17 | Italy (17) | 20 (1), 25 (1), 30 (6), 37 (4), 40 (4), 50 (1) |
| NOR | 15 | Norway (11), Denmark (2), Sweden (1), UK (1) | 20 (2), 30 (3), 37 (7), 45 (3) |
| INI | 9 | France (9) | 15 (1), 30 (7), 60 (1) |
| DAN | 9 | Denmark (9) | 20 (1), 25 (1), 30 (2), 50 (3), 55 (2) |
| BRE | 1 | UK | 37 |
| HUB | 1 | UK | 60 |
* The associated GWP values collected are enclosed in brackets.
Table 4.
Overview of the dataset considered for cements products.
| PO | GWP values | Production country * | EN 197-1 type + strength class * |
|---|---|---|---|
| ITA | 32 | Italy (32) | CEM I 52.5 (6), CEM I 42.5 (2), CEM II 42.5 (7), CEM II 32.5 (6), CEM III 42.5 (3), CEM IV 42.5 (4), CEM IV 32.5 (4) |
| INT | 16 | Italy (8), Spain (3), Greece (3), Denmark (1), Bulgaria (1) | CEM I 52.5 (3), CEM I 42.5 (4), CEM II 42.5 (2), CEM II 32.5 (1), CEM III 42.5 (4), CEM IV 42.5 (1), CEM IV 32.5 (1) |
| ITB | 5 | Poland | CEM I 42.5 |
| NOR | 4 | Norway (2), Latvia, Lithuania | CEM I 52.5, CEM I 42.5, CEM II 42.5 (2) |
| IRE | 3 | Ireland (3) | CEM I 42.5, CEM I 52.5, CEM II 42.5 |
| MRPI | 2 | The Netherlands | CEM III 42.5 |
| IBU | 1 | Germany | CEM III 42.5 |
| DAPh | 1 | Portugal | CEM II 42.5 |
* The associated GWP values collected are enclosed in brackets.
Table 5.
Overview of the dataset considered for natural stones products.
| PO | GWP values | Production country * | Type * |
|---|---|---|---|
| INT | 18 | Italy (9), Sweden (5), Portugal (3), Turkey (1) | Marble (9), granite (7), limestone (2) |
| NOR | 15 | Norway (14), Portugal (1) | Quartzite (8), granite (6), marble (1), |
| RTS | 6 | Finland | Granite (6), basalt (1), |
| BRE | 4 | Portugal (2), UK (2) | Limestone (2), basalt (1), sandstone (1) |
| ITA | 4 | Italy | Porphyry (3), sandstone (1) |
| AEN | 3 | Spain | Marble |
| DAPh | 3 | Portugal | Limestone |
| LOO | 2 | UK | Sandstone |
| IBU | 2 | Germany | Limestone |
* The associated GWP values collected are enclosed in brackets.
Table 6.
Overview of the dataset considered for structural steel products.
| PO | GWP values | Production country | Typology * |
|---|---|---|---|
| INT | 25 | Sweden, Italy, Turkey, Poland, Finland, Poland, Latvia, UK, Spain, Greece, Switzerland | Sections (15), rebars (10) |
| IBU | 12 | Luxemburg, Romania, Germany, Spain, Poland, Denmark | Sections (11), rebars (1) |
| NOR | 5 | Norway, Poland | Sections (2), rebars (3) |
| BRE | 3 | United Kingdom | Sections (1), rebars (3) |
| ITA | 2 | Italy | Rebars (2) |
| KIW | 2 | France | Sections (1), rebars (1) |
| SCS | 2 | Spain, Luxemburg | Sections (1) |
| AEN | 1 | Spain | Sections (1) |
| DAN | 1 | Denmark | Sections (1) |
* The associated GWP values collected are enclosed in brackets.
Table 7.
Overview of the dataset considered for wood products.
| PO | N. of structural wood prducts | Typology * | Production Country |
|---|---|---|---|
| INT | 126 | Timber (79), LVL (14), Glulam (15), CLT (18) | Australia (38), Finland (29), New Zeland (16), United Kingdom (10), Sweden (7), Spain (6), Denmark (4), Brazil (3), Italy (3), Indonesia (2), Sweden (2), Latvia (2), Germany (1), Lithuania (1), Turkey (1), Ukraine (1) |
| IBU | 15 | Timber (4), LVL (1), Glulam (6), CLT (4) | Germany (6), Austria (5), Italy (2), Poland (1), Switzerland (1) |
| NOR | 14 | Timber (4), Glulam (6), CLT (4) | Norway (8), Swden (5), Latvia (1) |
| DAN | 12 | Timber (8), Glulam (2), CLT (2) | Denmark |
| INI | 11 | Timber (5), Glulam (6) | France (10), Canada (1) |
| RTS | 3 | Timber (2), CLT (1) | Finland |
| B-EPD + | 3 | Glulam (1), CLT (2) | Belgium |
| ASTM + | 3 | Glulam (2), CLT (1) | Canada |
| UL + | 3 | Timber (1), LVL (1), Glulam (1) | North America |
| AUS | 3 | Timber (3) | Australia |
| MRPI | 2 | CLT (2) | Netherlands |
| BRE | 2 | Timber (2) | United Kingdom |
* The associated number of EPDs is enclosed in brackets. + For these PO only EPDs published under EN 15804 were considered.
Table 8.
Review of EPDs found for heat pumps.
| Product Type | Power (kW) |
SCOP | Refrigerant | Weight (kg) |
Lifespan (years) |
|---|---|---|---|---|---|
| Air-to-water monobloc heat pump | 5-14 | 3.24-4.84 | R32 | 165-226 | 17 |
| Air-to-air heat recovery system | 33.5 | 4.49 | R32 | 224 | 22 |
| Air-to-water monobloc heat pump | 5 | 4.65 | R290 | 124.9 | 15 |
| Air-to-water monobloc heat pump with hydraulic unit | 7 | 4.65 | R290 | 160.7 | 15 |
| Air-to-air heat recovery system | 33.5 | 4.49 | R32 | 213 | 22 |
| Heat pump-based heater | 2.85 | - | - | 22.08 | - |
| Chiller and heat pump | 160-315 | 4.13-4.68 | R454B | 1047-2188 | 22 |
| Air-to-water monobloc heat pump | 5-14 | 3.24-4.84 | R32 | 165-226 | 17 |
| Air-to-air heat recovery system | 33.5 | 4.49 | R32 | 224 | 22 |
Table 9.
Main descriptive statistics for the GWP (kg CO2/FU) of the EPS classes considered.
| Statistics/Classes | EPS 15 | EPS 20 | EPS 25 | EPS 30 | EPS 40 |
|---|---|---|---|---|---|
| Mean ± Marginal error | 1.72 ±6.25% | 2.35 ±7.71% | 2.68 ±8.34% | 3.21 ±6.46% | 4.48 ±18.84% |
| Median ± Marginal error | 1.70 ±10.56% | 2.26 ±14.37% | 2.62 ±14.35% | 3.07 ±8.88% | 4.28 ±23.71% |
Table 10.
Main descriptive statistics for the GWP (kg CO2/FU) of the SW classes considered.
| Statistics/Classes | Low (11-39 kg/m3) |
Medium (48-70 kg/m3) |
High (90-110 kg/m3) |
Very high (122-150 kg/m3) |
|---|---|---|---|---|
| Mean ± Marginal error | 1.15 ±21.78% | 1.89 ±42.27% | 3.89 ±6.73% | 5.02±24.02% |
| Median ± Marginal error | 1.13 ±35.53% | 1.65 ±44.78% | 3.83 ±11.75% | 5.02±23.57% |
Table 11.
Main descriptive statistics for the brick categories obtained.
| Classes/Statistics | Mean GWP (kg CO2/t) |
Median GWP (kg CO2/t) |
Mean PET (MJ/t) |
Median PET (MJ/t) |
|---|---|---|---|---|
| Hollow | 127±22.76% | 101±36.04% | 2314±17.95% | 2170±23.30% |
| Full (fossil based) | 203±7.59% | 206±7.96% | 3804±13.66% | 3571±5.61% |
| Full (fossil + second firing) | 487±18.56% | 499±10.52% | 7978±11.36% | 8048±6.64% |
| Full (renewable based) | 147±16.25% | 136±20.66% | 9197 ±22.79% | 9072 ±14.00% |
| No baking (adobe, reused) | 10.6±89.78% | 11.2±50.13% | 449±210.71% | 127±383.46% |
Table 12.
Comparison of GWP average values of cement from different sources.
| Class | This study * | Ecoinvent (RER) * | General EPD * |
|---|---|---|---|
| CEM I | 801 (97.5%) | 856 (95-100%) | 803 (92%) |
| CEM II/A | 747 (82%) | 786 (80-94%) | 683 (77%) |
| CEM II/B | 650 (74%) | 658 (65-79%) | |
| CEM III/A | 536 (55%) | 533 (45-64%) | 526 (44%) |
| CEM III/B | 347 (37%) | 370 (20-44%) | |
| CEM III/C | Not significant | 260 (5-19%) |
* The average clinker content for each class is enclosed in brackets.
Table 13.
Main descriptive statistics for the steel product categories considered.
| Classes/Statistics | Mean GWP ± marginal error (90%) |
Median GWP ± marginal error (90%) |
|---|---|---|
| EAF - Sections | 556 ± 14.50% | 558 ± 18.46% |
| BOF - Sections | 2522 ± 4.84% | 2530 ± 2.35% |
| EAF - Rebars | 487 ± 13.61% | 458 ± 15.72% |
| EAF - Green | 384±18.72% | 347±14.48% |
| EAF - Fossil | 566±10.62% | 558±11.38% |
Table 14.
Results of EPDs of windows: average U-value and GWP as a function of a m2.
| Frame material Glazing |
Average GWP/m2 |
Dev. standard GWP/m2 | U-value W/(m2K) |
|---|---|---|---|
| Metals | 129.4 | 89,91 | 1.5 |
| Double | 113.4 | 87,91 | 1.9 |
| Triple | 131.8 | 90,58 | 1.5 |
| Wood | 108.2 | 77,65 | 1.0 |
| Double | 70.5 | 34,63 | 1.2 |
| Triple | 118.9 | 83,62 | 0.9 |
| Wood-metals | 94.4 | 70,53 | 1.0 |
| Double | 92.4 | 65,43 | 1.2 |
| Triple | 95.2 | 73,57 | 1.0 |
| PVC | 95.8 | 83,52 | 1.1 |
| Single | 154.9 | 122,04 | 0.8 |
| Double | 66.6 | 49,41 | 1.4 |
| Triple | 80.6 | 54,65 | 1.0 |
Table 15.
GWP and PET for the various heat pump models.
| EPD Title (heat pump model) |
FU | GWP/FU (kg CO2 eq) |
Mean PET (MJ/FU) |
|---|---|---|---|
| PUZ-WM Series | 1 combined unit | 41362 | 914900 |
| VRV 5 Heat Recovery Outdoor Unit | Production of 1 kW of heating/cooling | 2940 | 87800 |
| aroTHERM plus (5 kW) | 1 unit of heat pump system | 730 | 5345 |
| aroTHERM plus (7 kW) | 1 unit of heat pump system | 921 | 10693 |
| FJ4 Fan Coil Indoor Unit & 38MURA Heat Pump Outdoor | 1 kWh of thermal energy | 6210 | 127000 |
| PowerKon LT - size 3 | 1 unit of heat pump system | 132 | 1833 |
| VLS 160 - 315 KW | Cooling 250 kW over 22 years with standard conditions. | 289617 | 1620903 |
Disclaimer/Publisher’s Note: The statements, opinions and data contained in all publications are solely those of the individual author(s) and contributor(s) and not of MDPI and/or the editor(s). MDPI and/or the editor(s) disclaim responsibility for any injury to people or property resulting from any ideas, methods, instructions or products referred to in the content. |
© 2025 by the authors. Licensee MDPI, Basel, Switzerland. This article is an open access article distributed under the terms and conditions of the Creative Commons Attribution (CC BY) license (http://creativecommons.org/licenses/by/4.0/).
Copyright: This open access article is published under a Creative Commons CC BY 4.0 license, which permit the free download, distribution, and reuse, provided that the author and preprint are cited in any reuse.


