
Submitted:
31 October 2023
Posted:
01 November 2023
You are already at the latest version
Abstract
Life Cycle Assessment (LCA) methodology is increasingly prevalent in the quantification of environmental status in the building sector, following new legislative frameworks. Countries need to quantify and assess their environmental impacts as a previous base for regulation and decision making. In this context, standardised national data sets are being developed, based on consensus with manufacturers: sectoral Environmental Product Declarations. This study focuses on assessing these EPDs with the aim of providing relevant information for global decision-making, focusing on consistency and pointing out shortcomings. An assessment has been carried out both at national level, considering all sectoral EPDs and declared products, and at international level, with three common building materials (brick, steel and concrete). The results highlight the lack of traceability in the development and assessment of uncertainty, resulting in substantial discrepancies in reported impacts, especially in the later stages of the life cycle (up to 90% difference). Meanwhile, impacts such as Global Warming Potential or total renewable and non-renewable primary energy use show homogeneous values in the cradle-to-gate stages with differences generally less than 10%. The analysis of sectoral EPDs should be a design guide with environmental sustainability criteria, as the last section of this study attempts to focus on.
Keywords:
Environmental Product Declaration
; Life Cycle Assessment
; Generic databases
; Environmental impacts
; Uncertainty
; Product category rules (PCR)
1. Introduction
The construction sector is responsible for almost 40% of the carbon emissions into the atmosphere related to energy consumption and 50% of all materials extracted from nature and there are forecasts that, by 2060, the global building stock will double and almost 70% of the world's population will live in urban areas [1], so the environmental impact of the construction sector will be strongly increased unless more sustainable materials, products and technologies are developed than the current ones.
The Life Cycle Assessment (LCA) methodology is a tool for quantifying the environmental impacts of a material, product or process and, therefore, the sustainability of its use. The standard UNE-EN ISO 14040:2006/A1 "Environmental management. Life cycle assessment. Principles and framework" [2] defines LCA as "the collection and evaluation of inputs, outputs and potential environmental impacts of a product system throughout its life cycle", as shown in Figure 1.The LCA calculation is a complex task that requires technical knowledge and experience in the application of its methodology, as well as in the interpretation of the data and results. It can be applied for the environmental assessment of building materials and products, as well as on the constructed building, although in general it is not used to optimize the design or help to make decisions in the early stages of the project [3]. It is known that its use would have a great influence on improving its environmental, social and economic sustainability.
In Europe, the standard UNE-EN 15978:2012 "Sustainability of Construction Works. Assessment of Environmental Performance of Buildings. Calculation Method" [4], define las directrices básicas para calcular el ACV del edificio, que depende de muchos factores susceptibles de interpretación lo que puede originar desviaciones y divergencias en los resultados finales. Rasmussen at al. [5] has shown variations of 50-70% in the outcome of some of the environmental impacts for a given product. The parameters influencing this variation in results are analysed in Anand et al. [6] by reviewing the articles published in the last five years on building LCA, identifying as some of the most important: the sensitivity of the input data, the type of database, the limits of the system and the lifetime considered.
According to Häfliger et al. [7], the design of a construction project under sustainability criteria requires the consideration of numerous aspects related to the elements that compose it, such as the structure, the enclosures, the finishes and other elements that make it up. In this phase of the project, the specific products that will be used during the execution of the project are defined [3], which means having not only precise information on their performance but also environmental information to be able to make a selection that implies a reduction of environmental impacts. However, in the early stages of the project, the products that will be used during its execution are not specifically defined, so it requires generic environmental and performance information that is agile and user-friendly, and helps the designer to make a correct selection of these materials and products based on sustainability criteria. This can be done by means of a known software that generates interpretable data and even by having data values and predetermined impacts both for products and for construction solutions and even spaces.
Obtaining the data for the application of the LCA is a decisive handicap in its development, with the collection of information being one of its most delicate phases. The UNE-CEN/TR 15941:2011 IN standard "Sustainability in construction. Environmental product declarations. Methodology for the selection and use of generic data" [8] establishes the sources of data and their quality criteria, as well as the hierarchy of their use according to their quality. This standard establishes the preferential use (as it is considered of higher quality) of data from environmental product declarations (EPD), whether they are specific or sectoral. Secondly, the use of data from life cycle inventory (LCI) databases and, lastly, bibliographic information with referenced traceability is established. Depending on the type of data they store, databases (DBs) are classified into the following types: DBs based on DAP (ÖKOBAUDAT or INIES), life cycle inventory databases (LCI DBs, e.g. GaBi or Ecoinvent) and others, with a strong national character and which try to transmit the industry's technologies and geographical conditioning factors (Climate database from Boverket in Sweden or Klimagassregnskap in Norway).
In the case of EPDs for construction products, these are defined on the basis of the requirements of UNE-EN 15804:2012+A2:2020 "Sustainability in construction. Environmental product declarations. Basic product category rules for construction products" [9], which allows the non-consideration of all life cycle (LC) stages, which can lead to reductions of 27-42% in the results obtained [10].
The accurate choice of input data stands out as one of the critical initial points in the Life Cycle Assessment (LCA) of a building [11]. The collection and understanding of this data represents a highly sensitive step. Comparisons between data included in inventory databases, such as Ecoinvent, and EPD databases, such as INIES, have revealed remarkable disparities in their starting values [12]. Using data from multiple databases in the LCA calculation of the same product, material or process is considered inappropriate. This is due to the fact that these databases may incorporate highly specific processes used by manufacturers, which complicates their adaptation to the geographical and technological context and, consequently, their integration into LCA calculations [13]. The same author states that the additional impact categories, present in the new standard [9], require a substantial volume of input data, with difficult control and the potential to skew the results away from reality.
At the European level, government initiatives have faced these issues from various perspectives. The initiatives of the global entities Eco Platform [14] and InData [15] should be highlighted. ECO Platform is the European Association of EPD Verification Programme Managers and other stakeholders involved in sustainable development. InData, however, is an informal working group, whose main objective is to generate a European LCA data structure for construction products (called ILCD+EPD format), with the possibility of use in the early stages of the project, in line with current standards.
Among the InData member countries, the policies and actions in the field of environmental assessment of the construction sector in France, Germany, Denmark, Norway, Sweden, the Netherlands, Italy and Spain, whose main characteristics are detailed in Table 1, are worth mentioning. The Nordic action plan for the sustainability and competitiveness of the construction sector (Finland, Sweden, Norway, Iceland and Denmark) should be highlighted.
In addition to the LCA, another tool for quantifying the sustainability of buildings are the so-called sustainable building certification systems. These systems generate voluntary accreditations based on criteria specific to each certification system, on the basis of which they evaluate and confirm the sustainability of buildings by referring to environmental parameters and establishing a hierarchy and their own score to show the level of sustainability achieved by the building. Among the best known internationally are LEED (Leadership in Energy and Environmental Design), BREEAM (Building Research Establishment Environmental Assessment Method), and the most widely used in Spain is VERDE. There are great differences between the requirements demanded by some systems and others, which means a high level of subjectivity in the validation of results and important differences depending on the system used.
The aim of this study is to carry out a detailed analysis of the available EPDs for use as input data for the calculation of LCAs of construction products.
2. Materials and Methods
This study focuses on a detailed analysis of sectoral EPDs at two scales. On a Spanish scale, all the sectoral EPDs for construction products of Spanish associations published to date are analysed in order to determine the degree of homogeneity and representativeness of the information they contain. On an international scale, the analysis is limited to the study of sectoral EPDs for three specific construction products: ceramic clinker bricks, rebar and mass concrete in a number of European countries where advanced environmental approaches have been developed within their respective policy commitments (Figure 2). In particular, the cases of France, Germany, Denmark, Norway, Sweden, the Netherlands, Italy and Spain have been studied.
To do so, first of all, it is necessary to categorise EPDs according to their owner and the information they include, according to the conceptualisation included in the standards [8], [4] y [9]. As shown in Figure 3, EPDs from a manufacturer (manufacturer specific EPD) can be based on the provision of data from a single product (product specific), the average of several products (average product) or data from a representative product (representative product). EPDs owned by more than one manufacturer (collective EPDs) are classified in the same three categories as for EPDs owned by one manufacturer and, in addition, in the so-called "worst case" category. According to this classification, sectoral EPDs represent a high share of production in the market, which gives them a more expansive and consensual character among the subscribing partners. At the same time, their heterogeneous component of multiplicity of data sources makes them a perfect element of analysis and verification for this study.
2.1. Sectoral EPD analysis in the context of construction products in Spain
The analysis at Spanish level focuses, as indicated above, on the sectoral EPDs for construction products published to date with a Spanish geographical location, analysing the type of product or groups of products declared and the number of EPDs declared for each of them. This comparative analysis has been carried out paying special attention to aspects related to the definition of the declared product, either under the figure of functional unit or declared unit, which allows the objective and scope of the EPD to be expressed and justifies how the products it represents are grouped and declared; current regulations applicable to the development of EPDs for construction products, including standard UNE-EN 15804: 2020+A2, which has recently undergone an update, with a period of coexistence of both standards until the end of October 2022; the declared life cycle stages which, although already pre-established by the current mandatory standard, are affected by its recent update; and finally, the CPRs, specific guidelines designed for each category or family of products, with the purpose of providing detailed guidance for the specific development of their EPD. These parameters have already been highlighted and proven as critical variable points in studies such as the one carried out using the NativeLCA method [16] by Portuguese researchers, where they tried to generate national data for cases in which the WTP of a product was lacking, the so-called "Reference Value, REVA".
To this end, all the sectoral EPDs existing in Spain to date, which amount to 30 EPDs, have been reviewed. The traceability of the four elements of interest described above has been studied, also taking into account the decisions taken by each manufacturers' association to check whether there are regulatory aspects susceptible to subjective interpretation. This may therefore lead to different calculation procedures being applied and different results being obtained, even if the regulations are complied with in all cases. The review of the Spanish sectoral EPDs has made it possible to identify cases of products with high variability between the results of their sectoral EPD and those of the manufacturers of their associates.
The sectoral EPDs under study are published in the Global EPD Programme Managers [17] and The International EPD System [18]. Among the holders of these EPDs, there are associations that declare, in the same document, several types of products generally differentiated by their technical characteristics and others that develop different declarations for the different products they represent. Although the Institut Bauen und Umwelt e. V. (IBU) [19] and DAPcons [20] have also developed several national product EPDs, these are not sectoral and have therefore not been considered in this study. The Spanish sectoral EPDs analysed are listed in Table A1, while Table A2 shows a summary of the information analysed.
The case of the ceramic product called "Ceramic tiles, porcelain stoneware (Bla classification according to UNE-EN 14411:2016)" should be highlighted, as its sectoral EPD offers a value that has been called "matrix value". However, 10 of the manufacturers participating in this sectoral EPD were also found to have their own manufacturer EPD, including 6 cases with identical values (called "type value") except for the abiotic resource depletion potential for non-fossil resources (ADPE). The other four specific EPDs report values with larger discrepancies between them and are shaded in Table A2, which shows a comparison between the sectoral EPD and the 10 manufacturer EPDs at the level of development and traceability, as can be seen in the data sources and definition of the product system boundaries.
2.2. Sectoral EPD analysis in the international context of brick veneer, rebar and mass concrete production
The identification of sectoral EPDs with significantly different data from those of the manufacturers' EPDs of their partners was the starting point to try to find out about similar cases occurring in other countries and how they are resolved. Obviously, it is not possible to analyse all construction products across 8 countries in a single study, both because of the diversity of products and industries and because of the difficulty of data handling and processing. Therefore, the scope of the study was limited to the 3 most used building materials according to [21,22]: cladding bricks, corrugated steel and mass concrete (defined as shown in Table 2) in 8 European countries (France, Germany, Denmark, Norway, Sweden, the Netherlands, Italy and Spain), so that a total of 21 sectoral DAPs were analysed. The selection of these products covers a high percentage of the share of materials used in traditional construction [23] and assumes the increase in global warming potential and energy demands incorporated in these materials and their associated construction typology, prioritising the current building reality over new technologies. In the case of concrete, specific EPDs of large multinational production companies were also included in the study, due to the large number of such declarations identified and the market share they represent.
Table A3, Table A4 and Table A5 in appendix A show the international sectoral EPDs studied for each of the three selected products and detail the parameters that condition their comparability and influence the final results.
Table A3 shows the sectoral EPDs identified for facing bricks for Spain, Germany and Great Britain. Although the German EPD has two published versions, one according to the 15804+A1 standard and another, more current version, according to 15804+A2, only the first one has been analysed, as it coincides with the standard used by the Spanish and British EPDs. The differences in the useful life of each sectoral EPD must be taken into account in the analysis since, although the reasons are not specified, the British EPD establishes a useful life of 60 years while in the other two the useful life is set at 150 years.
For corrugated steel bars to use in reinforced concrete, the selection process has been more complex. Except in Spain, where the Asociación Sostenibilidad Siderúrgica, which represents 100% of the national market, has declared its sectoral EPD, in the rest of the European countries it has not been possible to locate any, so the manufacturer EPDs of large companies with international expansion and large market shares have been analysed, as shown in Table A4. One of these is ArcelorMittal Europe; another is Outokumpu Oyj, based in Helsinki, whose data represent the UK, US and Swedish plants; and finally, CCL Scandinavia A/S in Denmark, the Scandinavian sector leaders.
In the case of mass concrete (Table A5), 13 EPDs are selected, extending the study to sectoral and company-specific EPDs, due to the large number of localised declarations. Five EPDs are sector-specific and conform to 15804+A2, while eight others are manufacturer-specific and conform to 15804+A1. Due to the recent update of the standard, it was considered essential to take this aspect into account.
In all cases the declared unit, the compliance standard and the matching stages (for which the study is conducted) have been maintained. However, the CPRs, the inventory databases, the calculation software used, the year of data collection and the lifetime are different, which does not allow for a fully comparable comparison.
The international sectoral EPDs were located through the search engine of EcoPlatform, which is the umbrella organisation for the various national EPD Managers and other sectoral actors involved in sustainable development, and inData member countries.
The analysis criteria used were the same as for the Spanish sectoral EPDs (declared product, regulations, CPR and declared stages), to which information was added on the databases used, calculation software, year of the data provided and useful life considered. The analysis of these three groups of materials and their corresponding WTPs is carried out by means of tables showing the countries selected in the coinciding stages, as well as the average value per stage and environmental indicator. To quantify the deviation of each environmental indicator considered with respect to the average of that indicator for all the countries, equation (1) has been used to obtain the percentage deviation of the value of the indicator for the country with respect to the average of that indicator for all the countries (m).
where
Indicador Xi = [(EPDi / EPDm)] – 1] * 100
EPDm is the average of indicator X for all countries and for the stage under consideration.
EPD1 the value of the impact on the stage(s) declared for country i
The results thus obtained have been classified into 5 categories defined by the values shown in Table 3. The representation of the results is reinforced by shading on a chromatic scale for each cell, depending on the category to which the impact value it represents belongs. The intervals of the categories respond to a grouping of the results obtained in the comparison of the three materials, not being heterogeneous. Applying greater sensitivity and subgroups for the area below 50% and less for the higher percentages.
Finally, in order to assess the environmental impact of each material and its influence on the percentage of material used on site, a comparison of the three materials studied has been made for the indicators global warming potential (GWP), total renewable primary energy use (PERT) and total non-renewable primary energy use (PENRT), considering the A1-3 stages of the WTPs carried out according to the 15804+A1 standard.
3. Results
3.1. Results of sectoral EPD analysis in the context of construction products in Spain
Table 4 shows the result of comparing the ratio of this manufacturer's value to the typical value and, in Table 5, the comparative impact results of the group of 4 manufacturer EPDs with the largest discrepancies, the typical value and the average of 10 EPDs in terms of their ratio to the matrix value. For this purpose, the ratio between their respective values and the matrix value for their overlapping life cycle stages (A1-3) has been considered. Values that deviate considerably from unity, both by excess and default, are shaded in grey.
3.2. Results of sectoral EPD analysis in the international context of brick veneer, rebar and mass concrete production
The results obtained for each of the three products analysed are shown in Table 6, Table 7, Table 8, Table 9, Table 10, Table 11 and Table 12. For brick, two tables are presented. In the first one, the coinciding stages are A1-A5 and in the second one, stages C2-C4 and module D. In the case of steel bars, there is a single table with the coinciding stages A1-3, C3 and module D. Finally, in the case of ready-mixed concrete, two tables are shown, differentiating the standard according to which they are declared (UNE-E 15804:A1 or UNE-EN 15804:A2). The stages analysed are modules A1-3 as they are the stages that coincide in all the EPDs studied and are those that confer greater reliability and certainty to the analysis as they come from the data of the EPD holders themselves. This eliminates the influence of data from inventory databases. Furthermore, it has been necessary to limit this analysis to the number of PDOs analysed, which in the end amounted to 21.
These tables show the average value for the set of countries studied (shaded grey column) and, as a percentage, the difference of each country with respect to the average. A chromatic gradient has been added, detailed in the legend of the tables, with five chromatic intervals that provide a first visual analysis. In this way, the highest percentages are represented by the colour maroon and reflect the most substantial differences between the average of all countries and the country in question. On the other hand, countries reporting a value more similar to the average have the lowest percentages and are represented in pale yellow.
Table 13 presents a comparison of the values of the impact indicators GWP, PERT and PENRT for the three materials studied.
4. Discussion
When interpreting the obtained results, it is necessary to keep in mind that environmental product declarations are a document used to provide environmental information to potential customers, for business-to-business (B2B) and/or business-to-consumer (B2C) communication. Their comparability is defined in the environmental performance in the building and for the whole life cycle, as they are not tools to compare building products or services outside this framework. In any case, the diversity of criteria in their development, despite complying with current regulations, even affects the results at building level [25].
An initial assessment of the results obtained shows that, despite strict compliance with the regulations in force, the sectoral EPDs have shortcomings in terms of the traceability of the information they include and the context in which they are developed. This, consequently, affects the homogeneity and comparability of the impact values they declare.
Sectoral EPD, given its prevalence as a source of environmental information and its application in the calculation of Life Cycle Assessment (LCA) of buildings, should reflect a consistency in the representation of consensus within each sector and serve as a majority representation of the national market. Research such as that carried out in Portugal by [26], which develops the Native method to generate generic data at national level, emphasises the importance of prioritising the use of sectoral EPDs when a manufacturer EPD is not available for a particular product. However, a more detailed review and analysis of the Spanish sectoral EPDs studied shows that the homogeneity of the data presented and their traceability is conditioned by important aspects such as the definition of the system limits, the calculation scenarios and various aspects of the use of the data and calculation of the impacts with importance in the values of the results obtained (Table A1.). It is worth noting the stability of certain indicators such as GWP, PERT and PENRT which, as shown in the Table 6, Table 7, Table 8, Table 9, Table 10, Table 11 and Table 12, suffer smaller deviations because they are related to public policies [13]. According to Lasvaux et al. [13], indicators involving fossil fuel consumption are less variable (more comparable, with variations of approx. 25%) in building materials. Meanwhile, developing policies continue to focus their actions on certain indicators, towards decarbonisation and energy efficiency. This will imminently tip the balance towards other impacts. For example, launches of new technologically advanced materials that reduce operational energies are already shifting their impacts to their manufacturing processes. This action, studied globally in the building, will decrease certain environmental burdens at the use stages, which will be increased at the manufacturing stages of the materials. A recent global review of environmental sustainability certifications and regulations identified 156 schemes in 26 countries, of which 105 include direct measures for embodied carbon [27], identifying the trend of actions towards decarbonisation.
These three indicators therefore allow for greater comparability and can be used to assess, in a general way, the contributions of the use of different materials to the total computation of building impacts.
The analysis of the Spanish sectoral EPDs shows a lack of uniformity in the definition of the products declared, in the formulas and criteria for grouping, as shown in table A.1. The standard does not require information on the uncertainty criteria adopted in the EPDs, so the developer of the standard resolves them in a subjective manner, with the consequent repercussions on the results. This same table shows how there are sectoral EPDs where each manufacturer declares its EPD in an identical way to the EPD of the association to which it belongs, with the only difference being the ownership of the association (such as the Spanish Iron and Steel Association). On the other hand, others group several of their products in a single EPD that includes the impact values of each of them (such as AISBL-EWA). It can also be seen that some sectoral EPDs have a high representation of the market for the product(s) they represent (OFICEMEN+IECA), while others do not (ASCER), without any connotation being reflected in their results. In fact, even sectoral EPDs of associations with a large number of members and high representativeness only incorporate data from a small number of them (FdA), thus conditioning their representativeness of the sector. The weighting of EPDs according to the sample representativeness (market share, represented manufacturers, etc.) could be a solution, combined with individual EPDs which provide an average set [28]. Table A2 shows a specific case, that of ceramic tile products, in which the sectoral EPD (called matrix value) calculates values based on the data provided by some of its partners. These values are subsequently assumed by some of them (called type value) to make their own manufacturer EPD (modifying the ownership), while other partners calculate their own EPD with higher impact values (called different values) lower than those of the sectoral EPD and identified in the table by means of grey shading of the cells. Table 5 sets out these ratios in numerical values. The accuracy of the specific EPDs data at the cradle-to-gate stages (A1-3) should provide lower impacts as they are direct from the manufacturer compared to the EPD of the association [29].
Extending the analysis to the international context and taking into account the three criteria identified as key to the development of an EPD, such as the version of the standard, the CPR and the declared stages and CPR, it can be concluded that there is a lack of uniformity in the results, as shown in tables 6 to 12. As explained above, two versions of the UNE-EN 15804 standard have coexisted until the end of October 2022. When the results are analysed taking into account the version of the standard applied, it can be seen that there have been marked variations that further increase the inequalities described so far. Currently, EPDs can no longer be developed in accordance with version 15804+A1, but EPDs developed until now under this standard are valid until their expiry date (normally five years after their issue).
For the brick-specific results, Table 6 shows closer values for stages A1-3 (product stages) than for stage C3 (waste treatment), shown in table 7. This is because these stages correspond to those for which more information is available from the factories themselves, and to those with more predictable future scenarios, respectively. However, stage A5, commissioning, shown in Table 6, presents greater differences. With regard to the impact indicators, it is worth noting similar values between the countries in GWP and in those relating to the total use of renewable and non-renewable primary energy (PERM and PENRM). This can be seen in the values presented in the same table for Spain, UK and Germany in stages A1-3, declaring GWP values of 236 kg CO2-eq, 213 kg CO2-eq and 196.51 kg CO2-eq, respectively.
In the case of corrugated steel bar, tables 8 and 9 show a high number of values with differences of more than 50 %, with maroon and red tones predominating. The lowest percentages are concentrated in the uses of renewable and non-renewable primary energy for the C3 waste treatment stage, while module D contains the highest discrepancies together with the set of waste indicators. As an example, we can point out that in the GWP-total indicator, the Asociación Sostenibilidad Siderúrgica in Spain declares -49.91 Kg CO2-eq, ArcelorMittal Europa declares +411 Kg CO2-eq and the multinational Outokumpu Oyj, -953 Kg CO2-eq.
Table 10 shows the selected WTPs of mass concrete in accordance with UNE-EN 15804+A1, with GWP being the most homogeneous indicator in all WTPs, with differences not exceeding 20%. Strazza et al. in their study on Italian cements [30] already confirmed the uniform global warming profile (GWP). In tables 11 and 12, where the statements according to UNE-EN 15804+A2 are presented, the GWP is subdivided into four indicators (GWP-total, GWP-fossil, GWP-biogenic and GWP-luluc), with all of them presenting similar values except for GWP-biogenic, where the difference in values exceeds 90%.
Additionally, it must be taken into account that product category rules are another source of variability in results. Those CPR that have not yet been standardized by the UNE are, normally, developed independently by the corresponding program administrator, leaving the definition of such important aspects as the type of functional unit, useful life, declared scenarios at their discretion, etc. that are established in the CPR. In this way, it is possible that sectoral EPDs with different criteria coexist, such as, for example, in the case of brick, the definition of the useful life that is established at 60 years for Great Britain, while in Spain and Germany 150 years were considered. Another example is the definition of the functional unit that, in the sectoral DAP of Germany, is defined as 1 m³ of brick, while the rest are declared for 1000 Kg of brick. And although they are not evidently stated in the statements, decisions as fundamental as the limits of the system, cut-off criteria, etc., they are criteria set by the CPR and variables according to their compliance.
No less important in the development of a DAP is the human factor and its capacity for interference in the different sources of uncertainty due to the parameters, the scenarios and the calculation model. First of all, in relation to the uncertainty of the parameters, the quality and variability of the data must be taken into account. Studies such as that of Martínez-Rocamora et al. [31] show such marked differences between Ecoinvent and GaBi, as values for the GWP impact of aluminum of 8.54CO2-eq/kg and 0,726-0,891 CO2-eq/kg, respectively. Or the comparison made by Loli et al. [32], where it states that EPD Norge, in the carbon footprint to produce 1 Kg of reinforcing steel in Norway, is 0.3 CO2-eq, while in Ecoinvent, the production of steel in the European market (RER) has an environmental cost of 2,1-0,3 CO2-eq. They are determining factors that vary the scale of the results. In general, the preselected DAPs of the three materials maintain few parameters in common, knowing the interference and importance they obtain in the results [29]. Regarding the methodological uncertainty for the definition of LCA scenarios, it must be taken into account that the selection of the UF, the geographical area and the date, among others, as well as the selection of the impact evaluation method [33].
The effect of the human factor on the uncertainty of results is not unique to building products. Scrucca et al. [33] analyzes the LCA of a bottle of wine performed by six different developers and shows the divergences even when many of those uncertainties are fixed. Similarly, Pomponi et al. [34], in their analysis of five building projects in the United Kingdom by three independent environmental consultants, shows the inequalities due to the subjective choices of the evaluators throughout the project. These uncertainties could be represented in the EPD with approaches as simple as the one reflected in the work of Waldman [35] although, as has been proven, it has not been implemented.
Finally, Table 13 shows a comparison of the three impact indicators studied for the three materials analyzed. Regarding the GWP-total, 1 m3 ready-mixed concrete has a value of 200-300 Kg CO2-eq, 1000 kg of brick around 200 Kg CO2-eq and 1000 Kg of corrugated steel of 400-800-2800 Kg CO2-eq., which shows clear trends.
Consequently, in the execution of a reinforced concrete structure, which will require a large amount of concrete and steel, the carbon footprint of steel will be very high compared to that of concrete. As if the envelope is designed in brick, although its impact is low, the amount of material is very high [31]. In terms of energy consumption, corrugated steel remains the material with the highest impacts. In general, concrete is the material that requires the least energy although, in all three cases, the consumption of non-renewable primary energy is considerably higher than that of renewable energy. This trend indicates the need for a change in government policies in countries to promote more sustainable energy sources.
In view of the results obtained, and taking into account everything considered in the previous paragraphs, it can be stated that the analysis of the sectoral EPD of the three products selected on an international scale shows the lack of parity of criteria in their calculation. In 2017, Gelowitz et al. [29], in a study of more than 50 DAPs, already confirmed that more than 38% lack information required by standard and 8% contained contradictory information. Even within the DAPs developed under the same RCP, 61% were not comparable. Along the same lines, Moré et al. in 2022 [36] from the study of 436 EPDs, stated that of all potential comparisons, 8.06% of the documents could not be compared in any aspect, 89.15% were considered incomparable, 2.75% could be compared with caution and only 0.04% was comparable. Based on the results presented in Table 13, which shows fifteen values per indicator for three materials, the number of these materials could be increased as a guide for the preselection of materials during the design phase of buildings with environmental sustainability criteria.
5. Conclusions
The environmental measurement of the building should be through the LCA and for this, one of the first steps is the proper selection of materials and input data.
The results reported in the selected EPDs have shown the lack of uniformity in the criteria for calculating their LCA. The few similarities have only been found in the first stages of the life cycle, so that a better control of the technological processes in the factory and a contribution of own data will result in values that can be analyzed in a common context, the building.
The new version of the 15804+A2 standard has increased the number of environmental indicators, which will require a greater number of input data and, above all, a greater standardization of the calculation criteria that will allow the homogenization of the results.
It is necessary to generate close, friendly and reliable databases that are accessible to the consultant and that reduce the level of uncertainty that currently exists in the results of the EPDs based on sectoral EPDs that are correctly contextualized geographically, technologically and temporally.
Following the results obtained in this study, a line of research is opened to narrow down the differences shown by the EPDs, allowing progress in their homogenization through consensus and adaptation of the regulations.
Author Contributions
Conceptualization, S. Otero, M. Conde, J.A. Tenorio; methodology, S. Otero, J.A. Tenorio; validation, S. Otero, S. Montilla, T. Garnica; formal analysis, S. Otero, J.A. Tenorio; investigation, S. Otero, T. Garnica, S. Montilla, M. Conde, J.A. Tenorio; resources, J.A. Tenorio; data curation, S. Otero, T. Garnica; writing—original draft preparation, S. Otero, T. Garnica, S. Montilla; writing—review and editing, S. Otero, M. Conde, J.A. Tenorio; visualization, S. Montilla; supervision, M. Conde, J.A. Tenorio; project administration, J.A. Tenorio. All authors have read and agreed to the published version of the manuscript.
Acknowledgments
Previous developments by Ecoplatform and Data working group are gratefully acknowledged.
Conflicts of Interest
The authors declare no conflict of interest.
Appendix A

Table A1.
Summary of the sectoral EPDs analysed in the context of construction products in Spain.
| Owner | Participation | Nº of EPDs | Product definition1 | PCR | UNE-EN 15804 | Lifecycle stages | |
| Nº | (units) | ||||||
| ANEFHOP | 300 | companies | 1 | Several (2) | UNE-EN 16757:2018 | A1 | Partial |
| HISPALYT | +150 | associates | 6 | Single | Global EPD - RCP-008 | A1 | Partial |
| FdA | 700 | companies | 3 | Single | Not stated | A2 | Partial |
| AEA | 89 64 |
Associates % market share |
2 | Several (6) | PCR 2019:14 v1.0 EPD System | A2 | Partial |
| AISBL-EWA | 43 95 |
Factories % market share |
1 | Several (8) | PCR 2019:14. EPD System | A2 | Partial |
| ASE | 80-100 | % market share | 1 | Several (3) | PCR 2019:14 v1.0 EPD System | A1 | Partial |
| ANFAPA | 10 | companies | 2 | Single | Global EPD -RCP-006 & 007 | A1 | Full |
| OFICEMEN + IECA | 100 | % market share | 1 | Several (7) | Global EPD -RCP-003 | A1 / A2 | Partial / Full |
| ATEDY | 9 | factories | 2 | Single | Global EPD - RCP-004 | A1 | Partial |
| ASCER | 40 | % market share | 1 | Single | Global EPD -RCP-002 | A1 | Full |
1 number of different products included in the EPD indicated in brackets.
Table A2.
ASCER sectoral EPD and 10 specific EPDs of associated manufacturers.
| Owner | Standard | Declared Stages |
Value type | Database | Software | Date of Data |
|---|---|---|---|---|---|---|
| ASCER | 15804+A1 | All | Matrix value | Company PD1,2 GaBi SD3, compilation 8.7.0.18. |
GaBi 8.7.0.18. | 2017 |
| PAMESA CERÁMICA, S.L. | 15804+A1 | All except A4-A5, B2, C2-C4 | Type value | Company PD GaBi SD, compilation 8007 |
GaBi 9.1.053. | 2018 |
| GEOLÓFICA TILE, S.L.U. | 15804+A1 | All except A4-A5, B2, C2-C4 | Type value | Company PD GaBi SD, compilation 8007 |
GaBi 9.1.053. | 2018 |
| CERAMIC TILE INTERNATIONAL, S.L.U. | 15804+A1 | All except A4, A5, B2, C2, C3 & C4. | Type value | Company PD GaBi SD, compilation 8007 |
GaBi 9.1.053. | 2018 |
| AZULEJOS FOSET, S.L.U. | 15804+A1 | All except A4, A5, B2, C2, C3 & C4. | Type value | Company PD GaBi SD, compilation 8007 |
GaBi 9.1.053. | 2018 |
| NAVARTI CERÁMICA, S.L.U. | 15804+A1 | All except A4, A5, B2, C2, C3 & C4. | Type value | Company PD GaBi SD, compilation 8007 |
GaBi 9.1.053. | 2018 |
| TAU CERÁMICA SOLUTIONS, S.L.U. | 15804+A1 | All except A4, A5, B2, C2, C3 & C4. | Type value | Company PD GaBi SD, compilation 8007 |
GaBi 9.1.053. | 2018 |
| PERONDA GROUP, S.A. | 15804+A1 | All | Different values | Company PD GaBi SD, compilation 8007 |
GaBi 8.0.7.18 | 2017 |
| GRESPANIA, S.A. | 15804+A1 | All | Different values | Company PD GaBi SD, compilation 8007 |
GaBi 8.0.7.18 | 2017 |
| EQUIPE CERÁMICA, S.L. | 15804+A1 | All except A4, A5, B2, C2, C3 & C4. | Different values | Company PD GaBi SD, compilation 8007 |
GaBi 9.1.053. | 2018 |
| MANUFACTURA INDUSTRIAL AZULEJERA S.L. | 15804+A1 | All | Different values | Company PD GaBi SD, compilation 8007 |
GaBi 9.1.053. | May 2019-May 2020 |
1 Primary data; 2 Representing 40% of Spanish production; 3 Secondary data.
Table A3.
Parameters of selected facing brick EPDs.
| Owner Association |
Declared Product |
Standard | PCR | Declared Stage | Database | Software | Year Data | Service Life (years) |
|---|---|---|---|---|---|---|---|---|
| Federal Association of the German Brick and Roof Tile Industry | 1 m³ of unfilled brick (density: 575 Kg/m3) | 15804+A1 | RCP bricks 1.2017 (IBU) | All except B1, B2, B6 and B7 (module not relevant B3-4-5) | BBDD GaBi SP39 2019 | GaBi 9 | 2019 | 150 |
| Brick development association | 1 Tm of average UK brick BDA | 15804+A1 | BRE Environmental Profiles | All (MNR B1 a B7 & C1) | Ecoinvent 3.2 | SimaPro v8 | 2017 | 60 |
| Spanish Association of Manufacturers of Baked Clay Bricks and Tiles (HISPALYT) | 1000 kg of ceramic facing bricks and their special parts | 15804+A1 | GlobalEPD-RCP-008 | All except module D(MNR B1-7, C1 & D) | No specified | No specified | 2015 | 150 |
Table A4.
Parameters of the selected corrugated steel EPDs.
| Owner | Declared product |
Standard | PCR | Declared stages | Database | Software | Year Data | Service Life (years) |
|---|---|---|---|---|---|---|---|---|
| CCL Scandinavia A/S | 1 kg of corrugated conduit used in precast and post-tensioned concrete | 15804+A1 | BRE PCR PN514 | A1, A2, A3 & A1-3 | ecoinvent v3.2 (2015) | Pat Hermon BRE LINA v2 | 2020 | No specified |
| Arcelor Mittal Europe | 1 Tm of reinforcing steel | 15804+A1 | Reinforcing Steel, 11.2017 (IBU) | A1-3, C3, C4 & D | GaBi (2021) | GaBi v. 2021.2 | 2022 | No specified |
| Outokumpu | 1 Tm of long stainless steel | 15804+A1 | Structural steels, 07.2014 (IBU) | A1-3, C3 & D | GaBi DataBase SP36 | GaBi | 2017-18 | No specified |
| Association for Steel Sustainability | 1000 kg of rebar production | 15804+A1 | UNE 36904-1:2018 | A1, A2, A3, A4 & D | Ecoinvent 3.5 (2018) | SimaPro 9.0.0.30 | 2016-17 | No specified |
Table A5.
Parameters of the selected mass concrete EPDs.
| Owner | Declared Product | UNE-EN 15804 | PCR | Declared Stages |
Database | Software | Year Data | Service Life (years) |
|---|---|---|---|---|---|---|---|---|
| ANEFHOP | 1 m3 of ready-mixed concrete | +A1 | UNE-EN 16757:2018 | Partial | Ecoinvent 3.6 database 2020 | Sectoral calculator based on Simapro 9.1.1 (2020) | 2017 | 50-100 |
| British Ready-mixed Concrete Association | 1 m3 generic ready-mixed concrete | +A1 | IBU | Partial | GaBi & data of associates | Precast Envision EPD Tool | 2014 | 100 |
| Concrete GmbH | 1 m3 unreinforced structural concrete (C30/37) | +A1 | IBU | Partial | GaBi v 8.7.0.18, SP 34 | GaBi v. 8.7.0.18, SP 34 | 2016 | < 50 |
| Thinkstep | 1 m3 unreinforced structural concrete (C30/37) | +A1 | No specified | Partial | GaBi v. 2020, SP40 | GaBi | 2018 | Not specified |
| Danish Concrete Manufacturers Association | 1m3 of factory concrete (exposure class XC2, XC3, XC4, XF1 y XA1) | +A1 | DS/EN 16757:2017 | Partial | BBDD GaBi 2019 | Not specified | 2018 | 100 |
| DK Beton | 1 m3 of factory concrete (exposure class XC2, XC3, XC4, XF1 y XA1) | +A1 | DS/EN 16757:2017 | Partial | GaBi 8.7 | GaBi | 2020 | 100 |
| BM Valla | 1 m3 exterior ready-mixed concrete C30/37 | +A1 | EPD norge | Partial | Ecoinvent | Not specified | 2020 | 60 |
| CEMEX Poland | 1 m3 ready-mixed concrete | +A1 | ETB-EPD | Partial | Ecoinvent v.3.9. | Not specified | 2020 | Not specified |
| Holcim GmbH | 1 m3 of unreinforced concrete C30/37 XC4 XF1 XA1 F3 16 M ECOPact | +A2 | IBU | Partial | GaBi SP40, 2020 | GaBi v. 10.6.1.35 | 2020 | 50 |
| ISTON | 1 m3 of ready-mixed concreteC 30/37 Ready-mixed concrete | +A2 | EPD System | Partial | Ecoinvent 3.8 | SimaPro 9.3 | 2021 | Not specified |
| Aggelos B. Peppass S.A | 1 m3 of ready-mixed concrete | +A2 | EPD System & UNE-EN 16757 | Partial | Ecoinvent database (3.8) | OpenLCA 1.11.0 | 2021 | Not specified |
| Interbeton Building Materials S.A | 1 m3 of ready-mixed concrete | +A2 | EPD System & UNE-EN 16758 | Full | Ecoinvent v.3.5 | GCCA industry EPD tool | 2020-21 | 50 |
| Votorantim Cimentos | 1 m3 of ready-mixed concrete | +A2 | EPD System & UNE-EN 16759 | Partial | Ecoinvent v.3.5 | BetonTec | 2021 | 50 |
References
- =WorldGBC-2021-Annual-Report.Pdf.
- UNE-EN ISO 14040:2006/A1. Gestión Ambiental. Análisis Del Ciclo de Vida. Principios y Marco de Referencia.
- Meex, E.; Hollberg, A.; Knapen, E.; Hildebrand, L.; Verbeeck, G. Requirements for Applying LCA-Based Environmental Impact Assessment Tools in the Early Stages of Building Design. Build. Environ. 2018, 133, 228–236. [Google Scholar] [CrossRef]
- UNE-EN 15978; Sustainability of Construction Works. Assessment of Environmental Performance of Buildings. Calculation Method 2012.
- Rasmussen, F.N.; Ganassali, S.; Zimmermann, R.K.; Lavagna, M.; Campioli, A.; Birgisdóttir, H. LCA Benchmarks for Residential Buildings in Northern Italy and Denmark – Learnings from Comparing Two Different Contexts. Build. Res. Inf. 2019, 47, 833–849. [Google Scholar] [CrossRef]
- Anand, C.K.; Amor, B. Recent Developments, Future Challenges and New Research Directions in LCA of Buildings: A Critical Review. Renew. Sustain. Energy Rev. 2017, 67, 408–416. [Google Scholar] [CrossRef]
- Häfliger, I.-F.; John, V.; Passer, A.; Lasvaux, S.; Hoxha, E.; Saade, M.R.M.; Habert, G. Buildings Environmental Impacts’ Sensitivity Related to LCA Modelling Choices of Construction Materials. J. Clean. Prod. 2017, 156, 805–816. [Google Scholar] [CrossRef]
- UNE-CEN/TR 15941 IN; Sustainability of Construction Works. Environmental Product Declarations Methodology for Selection and Use of Generic Data 2011.
- UNE-EN 15804:2020+A2. Sustainability of Construction Works — Environmental Product Declarations — Core Rules for the Product Category of Construction Products. Une: Madrid, Spain, 2020.
- Kellenberger, D.; Althaus, H.-J. Relevance of Simplifications in LCA of Building Components. Build. Environ. 2009, 44, 818–825. [Google Scholar] [CrossRef]
- Takano, A.; Winter, S.; Hughes, M.; Linkosalmi, L. Comparison of Life Cycle Assessment Databases: A Case Study on Building Assessment. Build. Environ. 2014, 79, 20–30. [Google Scholar] [CrossRef]
- Emami, N.; Heinonen, J.; Marteinsson, B.; Säynäjoki, A.; Junnonen, J.-M.; Laine, J.; Junnila, S. A Life Cycle Assessment of Two Residential Buildings Using Two Different LCA Database-Software Combinations: Recognizing Uniformities and Inconsistencies. Buildings 2019, 9, 20. [Google Scholar] [CrossRef]
- Lasvaux, S.; Habert, G.; Peuportier, B.; Chevalier, J. Comparison of Generic and Product-Specific Life Cycle Assessment Databases: Application to Construction Materials Used in Building LCA Studies. Int. J. Life Cycle Assess. 2015, 20, 1473–1490. [Google Scholar] [CrossRef]
- Our Mission - Eco Platform En. Available online: https://www.eco-platform.org/the-mission.html (accessed on 24 October 2023).
- Available online: https://www.indata.network/about (accessed on 24 October 2023).
- Gomes, R.; Silvestre, J.D.; de Brito, J.; Lasvaux, S. Environmental Datasets for Cement and Steel Rebars to Be Used as Generic for a National Context. J. Clean. Prod. 2021, 316. [Google Scholar] [CrossRef]
- AENOR - Declaraciones GlobalEPD En Vigor. Available online: https://www.aenor.com/certificacion/certificacion-de-producto/declaraciones-ambientales-de-producto/declaraciones-globalepd-en-vigor (accessed on 26 October 2023).
- EPD International. Available online: https://www.environdec.com/home (accessed on 26 October 2023).
- Kietzmann, A. EPD Programme at IBU. Available online: https://ibu-epd.com/en/epd-programme/ (accessed on 26 October 2023).
- DAPcons. Available online: https://www.dapcons.com/login (accessed on 26 October 2023).
- Bahramian, M.; Yetilmezsoy, K. Life Cycle Assessment of the Building Industry: An Overview of Two Decades of Research (1995–2018). Energy Build. 2020, 219, 109917. [Google Scholar] [CrossRef]
- Pomponi, F.; Moncaster, A. Scrutinising Embodied Carbon in Buildings: The next Performance Gap Made Manifest. Renew. Sustain. Energy Rev. 2018, 81, 2431–2442. [Google Scholar] [CrossRef]
- Marsh, E.; Orr, J.; Ibell, T. Quantification of Uncertainty in Product Stage Embodied Carbon Calculations for Buildings. Energy Build. 2021, 251, 111340. [Google Scholar] [CrossRef]
- Anderson, J.; Moncaster, A. Embodied Carbon of Concrete in Buildings, Part 1: Analysis of Published EPD. 2020, 1, 198–217. [Google Scholar] [CrossRef]
- Saade, M.R.M.; Guest, G.; Amor, B. Comparative Whole Building LCAs: How Far Are Our Expectations from the Documented Evidence? Build. Environ. 2020, 167, 106449. [Google Scholar] [CrossRef]
- Silvestre, J.; Lasvaux, S.; Železná, J.; Brito, J.; Pinheiro, M. NativeLCA - a Systematic Approach for the Selection of Environmental Datasets as Generic Data: Application to Construction Products in a National Context. Int. J. Life Cycle Assess. 2015, 20. [Google Scholar] [CrossRef]
- Castro, R.; Terranova, E.; Bruce-Hyrkäs, T.; Pasanen, P. The Embodied Carbon Review - Embodied Carbon Reduction in 100+ Regulations & Rating System Globally; 2018. [Google Scholar]
- Marsh, E.; Allen, S.; Hattam, L. Tackling Uncertainty in Life Cycle Assessments for the Built Environment: A Review. Build. Environ. 2023, 231, 109941. [Google Scholar] [CrossRef]
- Gelowitz, M.D.C.; McArthur, J.J. Comparison of Type III Environmental Product Declarations for Construction Products: Material Sourcing and Harmonization Evaluation. J. Clean. Prod. 2017, 157, 125–133. [Google Scholar] [CrossRef]
- Strazza, C.; Del Borghi, A.; Blengini, G.A.; Gallo, M. Definition of the Methodology for a Sector EPD (Environmental Product Declaration): Case Study of the Average Italian Cement. Int. J. Life Cycle Assess. 2010, 15, 540–548. [Google Scholar] [CrossRef]
- Martínez-Rocamora, A.; Solís-Guzmán, J.; Marrero, M. LCA Databases Focused on Construction Materials: A Review. Renew. Sustain. Energy Rev. 2016, 58, 565–573. [Google Scholar] [CrossRef]
- Loli, A.; Skaar, C.; Bergsdal, H.; Reenaas, M. Comparing Embodied GHG Emissions between Environmental Product Declaration and Generic Data Models: Case of the ZEB Laboratory in Trondheim, Norway. Build. Environ. 2023, 242, 110583. [Google Scholar] [CrossRef]
- Scrucca, F.; Baldassarri, C.; Baldinelli, G.; Bonamente, E.; Rinaldi, S.; Rotili, A.; Barbanera, M. Uncertainty in LCA: An Estimation of Practitioner-Related Effects. J. Clean. Prod. 2020, 268, 122304. [Google Scholar] [CrossRef]
- Pomponi, F.; Moncaster, A.; De Wolf, C. Furthering Embodied Carbon Assessment in Practice: Results of an Industry-Academia Collaborative Research Project. Energy Build. 2018, 167, 177–186. [Google Scholar] [CrossRef]
- Waldman, B.; Huang, M.; Simonen, K. Embodied Carbon in Construction Materials: A Framework for Quantifying Data Quality in EPDs. 2020, 1, 625–636. [Google Scholar] [CrossRef]
- Moré, F.B.; Galindro, B.M.; Soares, S.R. Assessing the Completeness and Comparability of Environmental Product Declarations. J. Clean. Prod. 2022, 375, 133999. [Google Scholar] [CrossRef]
Figure 1.
Structure of the Life Cycle Analysis (Source: own elaboration).
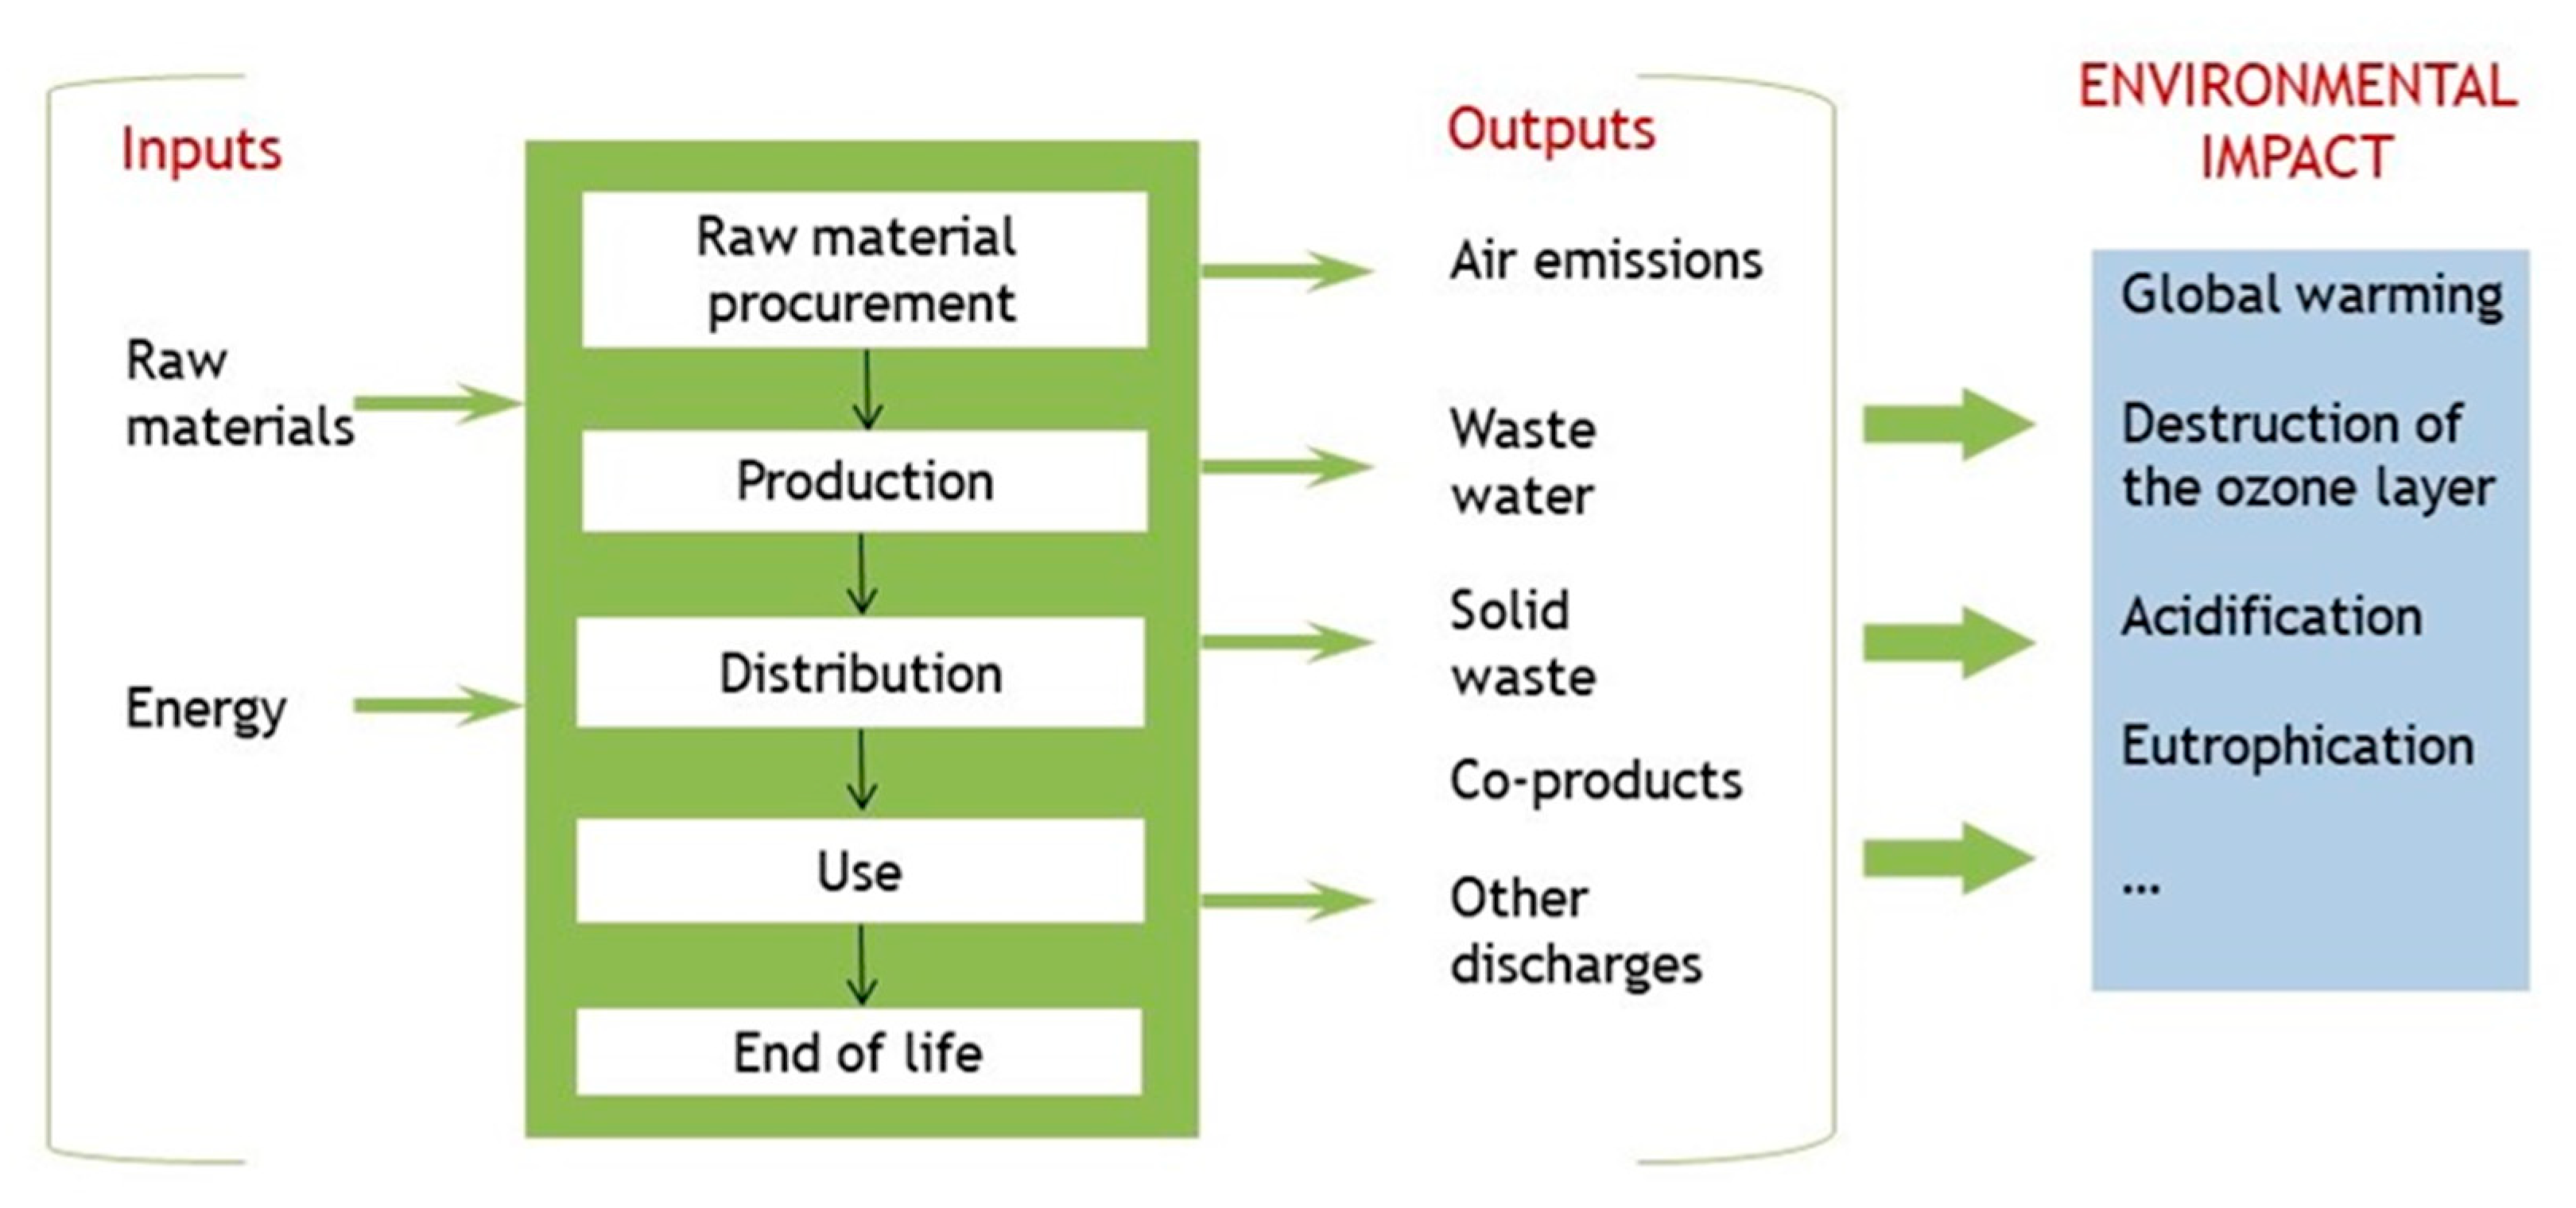
Figure 2.
Analytical scheme of the methodology (Source: own elaboration).
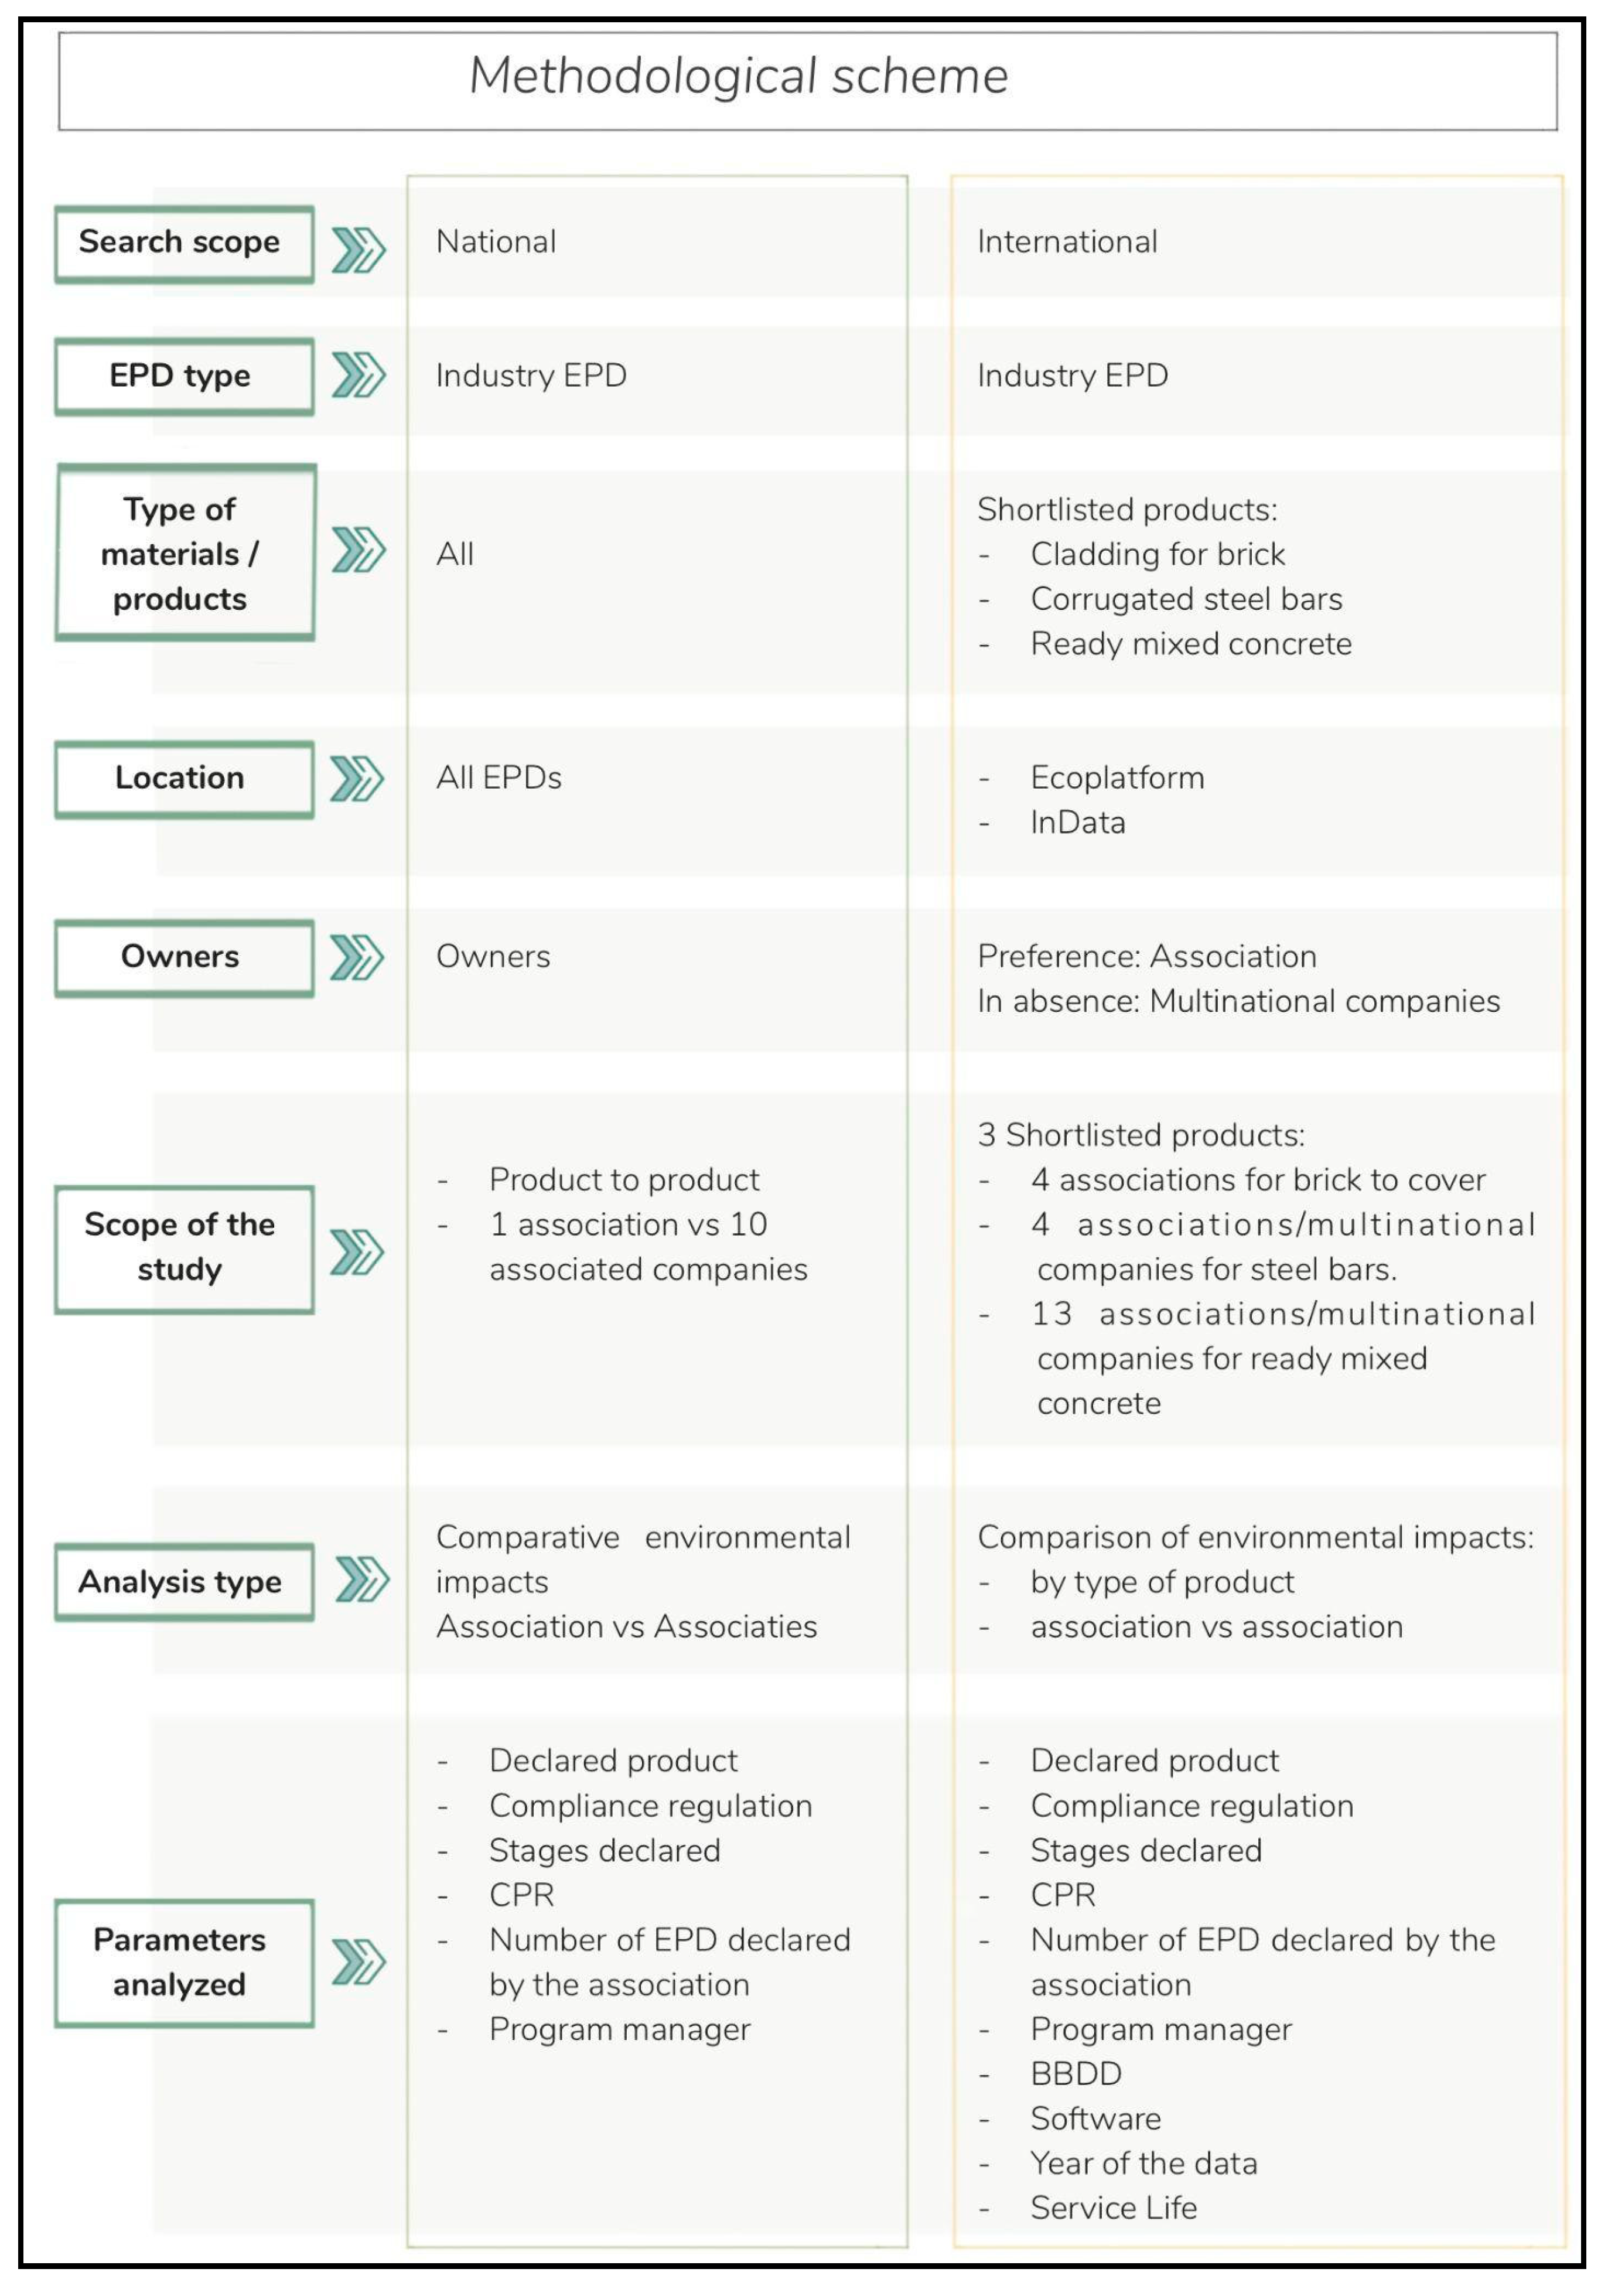
Figure 3.
Classification of EPD types (Source: own elaboration).
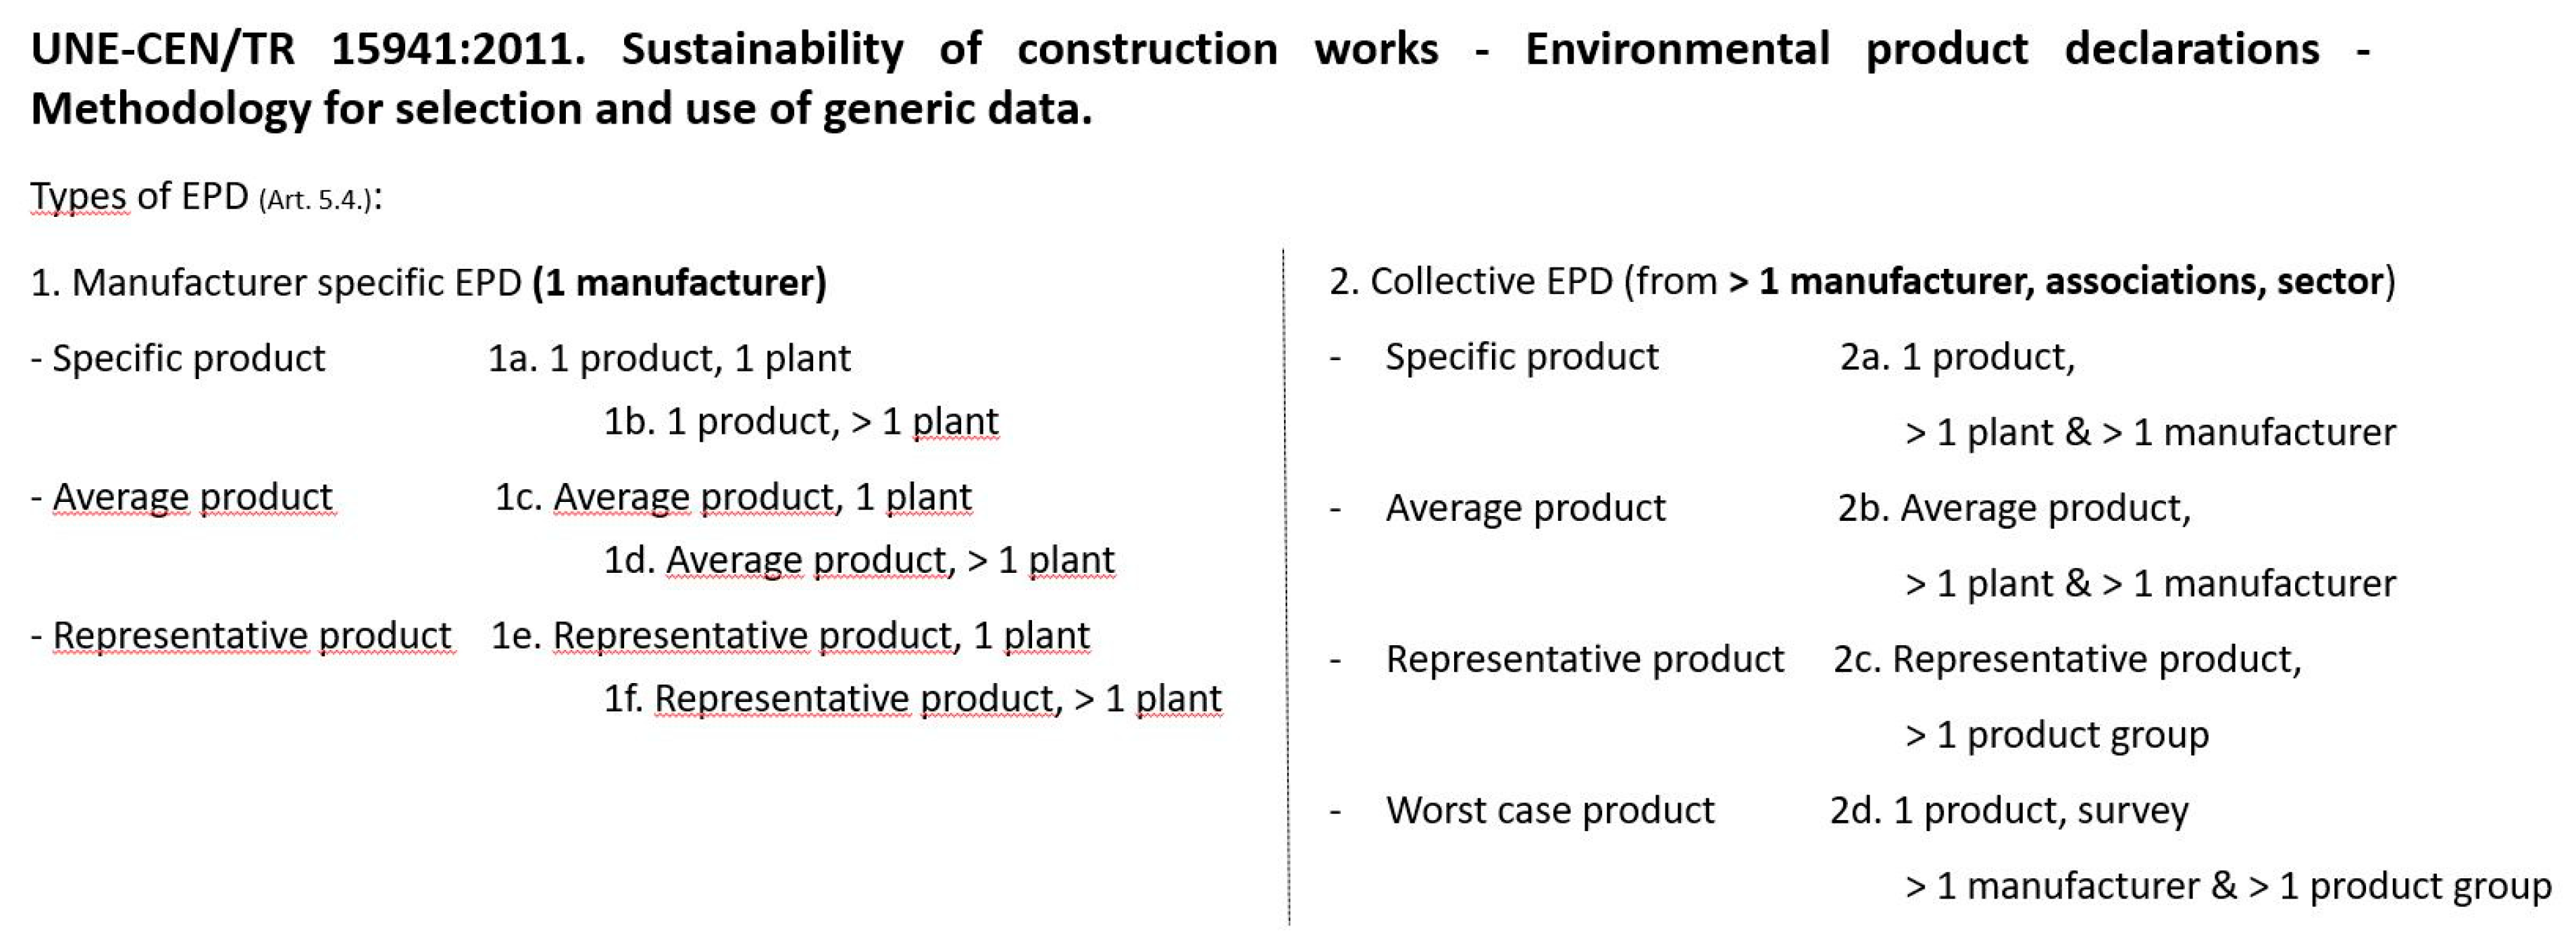
Table 1.
International policy development in the field of sustainability.
| Country | Environmental DB | LCI DB | LCA Software | Administrator / operator |
|---|---|---|---|---|
| Spain | OpenDAP | - | - | Global EPD and DAPcons |
| France | INIES | INIES | - | INIES |
| Germany | ÖKOBAUDAT and IBU | ÖKOBAUDAT | - | IBU |
| Denmark | Nationale Milieudatabase (NMD) | Nationale Milieudatabase (NMD) and ÖKOBAUDAT | LCAbyg | EPD Danmark |
| Norway | Klimagassregnskap | - | Excel based tool | EPD Norge |
| Sweden | Boverkets | - | - | The International EPD |
| Netherlands | - | - | - | Stichting MRPI |
| Italy | - | - | - | EPD Italy |
Table 2.
Definition of the three shortlisted materials.
| Product | Funtional Unit | Other interesting features |
|---|---|---|
| Ceramic brick for cladding | 1000 kg of ceramic brick for cladding | |
| Corrugated steel | 1000 kg of corrugated steel bar | |
| Mass concrete | 1 m3 of mass concrete | mechanical strength: 30-37 MPa density: 2380 kg/m3 without added additives 1 |
1 the use of any additives or other additives may cause the results to vary, as demonstrated by the studies carried out by Anderson and Moncaster for 306 EPD [24].
Table 3.
Description of the analysis intervals in the environmental impact comparison.
| Cathegory | Deviation from the mean (%) | Color |
|---|---|---|
| I | [0, ±10) | black text on pale yellow color background |
| II | [±10, ±20) | black text on salmon color background |
| III | [±20, ±50) | black text on coral color background |
| IV | [±50, ±90) | black text on red background |
| V | >±90 | white text on maroon background |
| VI | Not available | Empty cell |
Table 4.
Ratios between a manufacturer-specific EPD and the type-specific EPD. Stages A1, A2, A3, A1-3.
Table 4.
Ratios between a manufacturer-specific EPD and the type-specific EPD. Stages A1, A2, A3, A1-3.
| LCA stages | A1 | A2 | A3 | A1-3 | D |
|---|---|---|---|---|---|
| EIC1 | EC value2/TV3 | EC value/TV | EC value/TV | EC value/TV | EC value/TV |
| GWP-total | 1.57 | 0.37 | 1.23 | 1.26 | 2.03 |
| ODP | 1.79 | 2.68 | 1.18 | 1.79 | 14.33 |
| AP | 1.65 | 0.92 | 0.78 | 1.15 | 1.79 |
| EP | 1.29 | 0.85 | 1.30 | 1.23 | 4.00 |
| POCP | 1.43 | 0.83 | 1.05 | 1.17 | 1.83 |
| ADPE | 3.88 | 0.21 | 2.17 | 3.67 | 2.12 |
| ADPF | 1.46 | 0.36 | 1.24 | 1.25 | 1.64 |
1 Environmental Impact Categories; 2 Equipe Cerámica; 3 Type value.
Table 5.
Ratios between the 10 specific EPDs and the sectoral EPD. Stages A1-3.
| LCA stages A1-3 | |||||||
|---|---|---|---|---|---|---|---|
| EIC1 | Equipe Cerámica / MV2 |
Mainzu / MV |
Peronda Group / MV |
Grespania / MV |
TV3 / MV |
Average 10 EPD / MV |
|
| GWP-total | 1.14 | 0.62 | 1.08 | 1.31 | 0.90 | 0.77 | |
| ODP | 1.69 | 0.83 | 1.05 | 1.20 | 0.95 | 0.86 | |
| AP | 1.43 | 5.71 | 1.35 | 1.29 | 1.24 | 1.47 | |
| EP | 1.26 | 1.96 | 1.25 | 0.96 | 1.03 | 0.95 | |
| POCP | 1.36 | 3.13 | 1.33 | 1.27 | 1.16 | 1.17 | |
| ADPE | 0.28 | 1.12 | 0.31 | 0.16 | 0.08 | 0.22 | |
| ADPF | 1.29 | 0.74 | 1.23 | 1.51 | 1.03 | 0.89 | |
1 Environmental Impact Categories; 2 Matrix value; 3 Type value
Table 6.
Chromatic gradient of 3 sectorial EPD of brick for cladding according to UNE-EN 15804+A1 according to declared stages. Part 1 of 2: Stages A1-3, A4 and A5.
Table 6.
Chromatic gradient of 3 sectorial EPD of brick for cladding according to UNE-EN 15804+A1 according to declared stages. Part 1 of 2: Stages A1-3, A4 and A5.
| UNE-EN 15804+A1 | Stages A1-3 % of the country compared to average |
Stage A4 % of the country compared to average |
Stage A5 % of the country compared to average |
||||||||||||||||
|---|---|---|---|---|---|---|---|---|---|---|---|---|---|---|---|---|---|---|---|
| Unit | Indicator | AVG. 1 A1-3 | Spain (%) | UK (%) |
Germany (%) | AVG. 1 A4 | Spain (%) | UK (%) | Germany (%) | AVG. 1 A5 | Spain (%) | UK (%) | Germany (%) | ||||||
| Impact assessment | (kg CO2-eq.) | GWP | 2,15E+02 | 9,7 | -1,0 | -8,7 | 6,53E+00 | -28,2 | 22,8 | 5,4 | 5,10E+00 | -88,9 | 124,8 | -35,9 | |||||
| (kg CFC 11-eq.) | ODP | 6,17E-06 | -99,7 | 199,7 | -100,0 | 4,93E-07 | -100,0 | 200,0 | -100,0 | 3,60E-07 | -99,9 | 199,9 | -100,0 | ||||||
| (kg SO2-eq.) | AP | 1,51E+00 | -41,3 | 130,5 | -89,2 | 1,45E-02 | -19,8 | 86,7 | -66,9 | 5,97E-02 | -97,2 | 196,7 | -99,5 | ||||||
| (kg Phosphat-eq.) | EP | 6,83E-02 | -4,7 | 56,6 | -51,9 | 3,65E-03 | -21,9 | 94,0 | -72,1 | 2,14E-03 | -87,0 | 183,9 | -96,9 | ||||||
| (kg NMVOC eq.) | POCP | 9,20E-02 | -15,1 | 92,4 | -77,3 | 3,15E-04 | -1230,9 | 1386,7 | -155,8 | 3,17E-03 | -94,8 | 194,1 | -99,3 | ||||||
| (kg Sb-eq.) | ADPE | 5,05E-05 | -79,6 | 145,5 | -65,9 | 7,37E-06 | -95,0 | 186,4 | -91,4 | 2,81E-06 | -100,6 | 199,8 | -99,2 | ||||||
| (MJ) | ADPF | 2,26E+03 | 6,4 | 5,0 | -11,4 | 9,25E+01 | -30,9 | 31,0 | 0,0 | 4,50E+01 | -91,6 | 190,6 | -98,9 | ||||||
| Resource use | (MJ) | PERE | 2,99E+02 | 34,8 | -59,9 | 25,1 | 3,80E+00 | 15,9 | -57,7 | 41,7 | 2,21E+00 | -81,1 | 178,5 | -97,5 | |||||
| (MJ) | PERM | 1,85E-04 | 5,99E-06 | 9,90E-06 | 0% | ||||||||||||||
| (MJ) | PERT | 2,99E+02 | 34,8 | -59,9 | 25,1 | 3,80E+00 | 15,9 | -57,7 | 41,7 | 2,21E+00 | -81,1 | 178,5 | -97,5 | ||||||
| (MJ) | PENRE | 2,33E+03 | 8,0 | 4,1 | -12,1 | 9,23E+01 | -30,4 | 30,0 | 0,4 | 4,60E+01 | -91,5 | 191,3 | -99,8 | ||||||
| (MJ) | PENRM | ||||||||||||||||||
| (MJ) | PENRT | 2,33E+03 | 8,0 | 4,1 | -12,1 | 9,23E+01 | -30,4 | 30,0 | 0,4 | 4,60E+01 | -91,5 | 191,3 | -99,8 | ||||||
| (Kg) | SM | 2,47E+02 | 0% | ||||||||||||||||
| (MJ) | RSF | 3,92E-03 | 0% | ||||||||||||||||
| (MJ) | NRSF | 4,12E-02 | 0% | ||||||||||||||||
| (m3 world eq.) | FW | 3,89E+00 | 170,2 | -77,8 | -92,3 | 1,20E-01 | 174,1 | -78,3 | -95,8 | 8,70E-02 | 139,0 | -47,1 | -91,9 | ||||||
| Waste | (Kg) | HWD | 4,63E-01 | -99,9 | 199,9 | -100,0 | 2,55E-02 | -100,0 | 100,0 | -100,0 | 3,75E-02 | -100,0 | 100,0 | -100,0 | |||||
| (Kg) | NHWD | 1,82E+00 | -97,3 | 197,3 | -100,0 | 2,83E+00 | -100,0 | 100,0 | -100,0 | 4,37E-01 | 3681,3 | 97,0 | -97,0 | ||||||
| (Kg) | RWD | 3,42E-02 | 35,7 | -79,6 | 43,9 | 3,48E-04 | -68,1 | 140,1 | -72,0 | 1,50E-04 | -100,0 | 190,6 | -90,6 | ||||||
| Outflows | (Kg) | CRU | 3,36E+01 | 0% | 5,17E+01 | 0% | |||||||||||||
| (Kg) | MFR | 1,74E-01 | 0% | 1,41E+01 | 0% | ||||||||||||||
| (Kg) | MER | 9,40E-03 | 0% | 1,10E-01 | 0% | ||||||||||||||
| (MJ) | EEE | 4,47E-02 | 0% | 3,33E+00 | -78,7 | 78,7 | |||||||||||||
| (MJ) | EET | 1,37E+01 | |||||||||||||||||
1 average of all countries reporting value at that stage.
Table 7.
Chromatic gradient of 3 sectorial EPD of brick for cladding according to UNE-EN 15804+A1 according to declared stages. Part 2 of 2: Stages C2, C3, C4 and D.
Table 7.
Chromatic gradient of 3 sectorial EPD of brick for cladding according to UNE-EN 15804+A1 according to declared stages. Part 2 of 2: Stages C2, C3, C4 and D.
| Stage C2 % of the country compared to the average |
Stage C3 % of the country compared to the average |
Stage C4 % of the country compared to the average |
Stage D % of country compared to average |
|||||||||||||||||||||||
|---|---|---|---|---|---|---|---|---|---|---|---|---|---|---|---|---|---|---|---|---|---|---|---|---|---|---|
| UNE-EN 15804+A1 Unit Indicator |
AVG. 1 C2 | Spain (%) | UK (%) | Germany (%) | AVG. 1C3 | Spain (%) | UK (%) | Germany (%) | AVG. 1 C4 | Spain (%) | UK (%) | Germany (%) | AVG. 1D | UK (%) | Germany (%) | |||||||||||
| Impact assessment | (kg CO2-eq.) | GWP | 1,90E+00 | 102,2 | -86,8 | -15,4 | -4,38E+00 | -127,6 | -173,0 | 300,6 | 3,52E+00 | 146,1 | -70,8 | -75,3 | -9,27E+00 | 72,6 | -72,6 | |||||||||
| (kg CFC 11-eq.) | ODP | 1,54E-08 | -99,9 | 199,9 | -100,0 | 1,96E-07 | -100,0 | 200,0 | -100,0 | 9,10E-08 | -99,9 | 199,9 | -100,0 | -9,15E-07 | 100,0 | -100,0 | ||||||||||
| (kg SO2-eq.) | AP | 3,70E-03 | 147,3 | -77,3 | -70,0 | 1,64E-02 | -48,9 | 49,7 | -0,8 | 2,16E-02 | 141,2 | -66,4 | -74,8 | -5,20E-02 | 88,2 | -88,2 | ||||||||||
| (kg Phosphat-eq.) | EP | 9,05E-04 | 148,7 | -75,6 | -73,1 | 4,03E-03 | -49,9 | 51,4 | -1,6 | 3,36E-03 | 110,7 | -28,8 | -81,9 | -1,47E-02 | 92,1 | -92,1 | ||||||||||
| (kg NMVOC eq.) | POCP | -8,78E-04 | 212,0 | -116,6 | -95,3 | 2,40E-03 | -49,2 | 75,3 | -26,1 | 2,20E-03 | 127,3 | -45,5 | -81,8 | -6,32E-03 | 91,4 | -91,4 | ||||||||||
| (kg Sb-eq.) | ADPE | 3,70E-07 | -19,1 | 78,9 | -59,8 | 2,01E-06 | 7,2 | -45,1 | 37,9 | 1,60E-06 | 87,4 | -7,9 | -79,5 | -3,88E-05 | 98,3 | -98,3 | ||||||||||
| (MJ) | ADPF | 2,60E+01 | 102,3 | -85,4 | -16,9 | 3,84E+01 | -40,4 | 20,3 | 20,0 | 5,01E+01 | 125,4 | -49,3 | -76,1 | -1,30E+02 | 76,8 | -76,8 | ||||||||||
| Resource use | (MJ) | PERE | 1,64E+00 | 120,2 | -96,9 | -23,3 | 2,34E+00 | -24,2 | -45,5 | 69,7 | 5,68E+00 | 134,3 | -86,3 | -47,9 | -1,10E+01 | 14,1 | -14,1 | |||||||||
| (MJ) | PERM | 1,87E-07 | -100,0 | -100,0 | 6,37E-07 | -100,0 | -100,0 | 2,12E-06 | -100,0 | -100,0 | -3,68E-05 | -100,0 | ||||||||||||||
| (MJ) | PERT | 1,64E+00 | 120,2 | -96,9 | -23,3 | 2,34E+00 | -24,2 | -45,5 | 69,7 | 5,68E+00 | 134,3 | -86,3 | -47,9 | -1,10E+01 | 14,1 | -14,1 | ||||||||||
| (MJ) | PENRE | 2,61E+01 | 102,2 | -85,6 | -16,6 | 3,87E+01 | -39,3 | 17,5 | 21,7 | 5,50E+01 | 112,7 | -53,5 | -59,2 | -1,37E+02 | 75,8 | -75,8 | ||||||||||
| (MJ) | PENRM | |||||||||||||||||||||||||
| (MJ) | PENRT | 2,61E+01 | 102,2 | -85,6 | -16,6 | 3,87E+01 | -39,3 | 17,5 | 21,7 | 5,50E+01 | 112,7 | -53,5 | -59,2 | -1,37E+02 | 75,8 | -75,8 | ||||||||||
| (Kg) | SM | 9,37E+02 | ||||||||||||||||||||||||
| (MJ) | RSF | |||||||||||||||||||||||||
| (MJ) | NRSF | |||||||||||||||||||||||||
| (m3 world eq.) | FW | 9,03E-02 | 197,8 | -99,1 | -98,7 | 1,89E-01 | 189,3 | -95,8 | -93,5 | 2,19E+00 | 198,4 | -98,7 | -99,7 | -1,90E-01 | 96,8 | -96,8 | ||||||||||
| Waste | (Kg) | HWD | 7,95E-04 | -100,0 | 99,9 | -99,9 | 1,46E-02 | -100,0 | 100,0 | -100,0 | 9,55E-03 | -100,0 | 100,0 | -100,0 | -1,09E-01 | 100,0 | -100,0 | |||||||||
| (Kg) | NHWD | 9,04E-02 | -100,0 | 95,8 | -95,8 | 1,88E-02 | -100,0 | 24,8 | -24,8 | 2,13E+02 | 153,1 | -53,1 | -100,0 | -1,32E+01 | -59,4 | 59,4 | ||||||||||
| (Kg) | RWD | 4,67E-05 | 95,3 | -44,1 | -51,2 | 3,17E-04 | -28,1 | 4,7 | 23,4 | 6,80E-04 | 139,8 | -76,9 | -62,9 | -1,38E-03 | -17,4 | 17,4 | ||||||||||
| Outflows | (Kg) | CRU | 9,00E+02 | 0% | ||||||||||||||||||||||
| (Kg) | MFR | 4,60E+02 | 0% | |||||||||||||||||||||||
| (Kg) | MER | |||||||||||||||||||||||||
| (MJ) | EEE | |||||||||||||||||||||||||
| (MJ) | EET | |||||||||||||||||||||||||
1 average of all countries reporting value at that stage.
Table 8.
Chromatic gradient of 4 sectorial EPD of reinforcing bar according to UNE-EN 15804+A1 according to declared stages. Stages A1-3, A4 and A5. Part 1 of 2.
Table 8.
Chromatic gradient of 4 sectorial EPD of reinforcing bar according to UNE-EN 15804+A1 according to declared stages. Stages A1-3, A4 and A5. Part 1 of 2.
| Stages A1-3 Percentage of the country compared to the average |
Stages C3 Percentage of the country compared to the average |
Stages D Percentage of the country compared to the average |
||||||||||||
|---|---|---|---|---|---|---|---|---|---|---|---|---|---|---|
| UNE-EN 15804+A1 Unit Indicator |
AVG. 1 A1-3 | Spain (%) | CCL scand-UK (%) | Arcelor Mittal Europe (%) |
Outokumpu Oyj UK, USA y Sweden (%) |
AVG. 1 C3 | Arcelor Mittal Europe (%) |
Outokumpu Oyj UK, USA y Sweden (%) |
AVG. 1 D | Spain (%) |
Arcelor Mittal Europe (%) |
Outokumpu Oyj UK, USA y Sweden (%) |
||
| Impact assessment | (kg CO2-eq.) | GWP | 1649,5 | -75,1 | 50,3 | -50,4 | 75,2 | 2,04E+00 | -21,6 | 21,6 | -1,97E+02 | -74,7 | -308,3 | 383,0 |
| (kg CFC 11-eq.) | ODP | 1,43E-05 | 216,2 | -16,2 | -100,0 | -100,0 | 3,52E-12 | -98,7 | 98,7 | -1,69E-06 | 200,0 | -100,0 | -100,0 | |
| (kg SO2-eq.) | AP | 7,45E+00 | -61,7 | -40,9 | -77,9 | 180,5 | 6,30E-03 | -52,5 | 52,5 | -1,89E+00 | -84,6 | -133,9 | 218,5 | |
| (kg Phosphat-eq.) | EP | 5,68E-01 | -23,0 | 3,4 | -72,5 | 92,1 | 8,19E-04 | -45,3 | 45,3 | -1,49E-01 | 8,6 | -131,0 | 122,5 | |
| (kg NMVOC eq.) | POCP | 7,73E-01 | 90,2 | -30,4 | -82,8 | 22,9 | 4,80E-04 | -45,8 | 45,8 | -6,26E-02 | -68,5 | -405,3 | 473,8 | |
| (kg Sb-eq.) | ADPE | 5,12E-02 | -86,8 | -98,3 | -99,8 | 284,9 | 8,05E-07 | -41,6 | 41,6 | -2,08E-02 | -46,3 | -105,1 | 151,4 | |
| (MJ) | ADPF | 1,13E+04 | -55,7 | -100,0 | -25,1 | 180,8 | 2,35E+01 | -22,4 | 22,4 | -2,58E+03 | -77,6 | -265,0 | 342,6 | |
| Resource use | (MJ) | PERE | 2,97E+03 | -42,8 | -21,2 | -82,8 | 146,8 | 1,21E+01 | 0,8 | -0,8 | -7,16E+02 | -92,5 | -63,0 | 155,5 |
| (MJ) | PERM | 4,21E-04 | 0,0 | |||||||||||
| (MJ) | PERT | 2,97E+03 | -42,8 | -21,2 | -82,8 | 146,8 | 1,21E+01 | 0,8 | -0,8 | -7,16E+02 | -92,5 | -63,0 | 155,5 | |
| (MJ) | PENRE | 2,05E+04 | -64,9 | 38,8 | -55,7 | 81,8 | 3,45E+01 | -18,1 | 18,1 | -2,69E+03 | -73,9 | -256,6 | 330,5 | |
| (MJ) | PENRM | |||||||||||||
| (MJ) | PENRT | 2,05E+04 | -64,9 | 38,8 | -55,7 | 81,8 | 3,45E+01 | -18,1 | 18,1 | -2,69E+03 | -73,9 | -256,6 | 330,5 | |
| (Kg) | SM | 7,64E+02 | 46,6 | -96,5 | 50,5 | -0,6 | ||||||||
| (MJ) | RSF | |||||||||||||
| (MJ) | NRSF | |||||||||||||
| (m3 world eq.) | FW | 1,45E+01 | -83,1 | 50,3 | -89,8 | 122,6 | 1,42E-02 | -16,6 | 16,6 | 4,33E+00 | -123,1 | 532,3 | -409,2 | |
Table 9.
Chromatic gradient of 4 sectorial EPD of reinforcing bar according to UNE-EN 15804+A1 according to declared stages. Stages A1-3, A4 and A5. Part 1 of 2: Waste and outflows.
Table 9.
Chromatic gradient of 4 sectorial EPD of reinforcing bar according to UNE-EN 15804+A1 according to declared stages. Stages A1-3, A4 and A5. Part 1 of 2: Waste and outflows.
| Stages A1-3 Percentage of the country compared to the average |
Stages C3 Percentage of the country compared to the average |
Stages D Percentage of the country compared to the average |
||||||||||||
|---|---|---|---|---|---|---|---|---|---|---|---|---|---|---|
| UNE-EN 15804+A1 Unit Indicator |
AVG. 1 A1-3 | Spain (%) | CCL scand-UK (%) | Arcelor Mittal Europe (%) |
Outokumpu Oyj UK, USA y Sweden (%) |
AVG. 1 C3 | Arcelor Mittal Europe (%) |
Outokumpu Oyj UK, USA y Sweden (%) |
AVG. 1 D | Spain (%) | Arcelor Mittal Europe (%) |
Outokumpu Oyj UK, USA y Sweden (%) |
||
| Waste | (Kg) | HWD | 3,02E+00 | -99,2 | 264,0 | -65,9 | -98,9 | 1,67E-07 | -95,8 | 95,8 | -4,12E-02 | -91,5 | -100,0 | 191,4 |
| (Kg) | NHWD | 7,69E+01 | -100,0 | 15,1 | -96,2 | 181,0 | 2,51E+01 | -99,9 | 99,9 | -1,37E+01 | -99,9 | 292,6 | -192,7 | |
| (Kg) | RWD | 5,83E+01 | -99,9 | -99,2 | -99,6 | 298,7 | 4,35E-03 | -10,5 | 10,5 | -3,35E-02 | -94,6 | -98,6 | 193,2 | |
| Outflows | (Kg) | CRU | ||||||||||||
| (Kg) | MFR | 3,62E+01 | 0,00% | 9,50E+02 | 0,00% | |||||||||
| (Kg) | MER | |||||||||||||
| (MJ) | EEE | |||||||||||||
| (MJ) | EET | |||||||||||||
1 average of all countries reporting value at that stage.
Table 10.
Chromatic gradient of 8 sectorial EPD of ready-mixed concrete according to UNE-EN 15804+A1 according to declared stages. Stages A1-3.
Table 10.
Chromatic gradient of 8 sectorial EPD of ready-mixed concrete according to UNE-EN 15804+A1 according to declared stages. Stages A1-3.
| Stages A1-3 Percentage of the country compared to the average (%) |
||||||||||||||
|---|---|---|---|---|---|---|---|---|---|---|---|---|---|---|
| UNE-EN 15804+A1 Unit Indicator |
AVG. 1 A1-3 | Spain (association) |
UK (association) |
Germany (association) |
Thinkstep Germany | Denmark (association) |
DK Beton | Valla Iceland | Cemex Poland | |||||
| Impact assessment | (kg CO2-eq.) | GWP | 2,69E+02 | 0,7 | -18,3 | -18,6 | 5,2 | 4,8 | 11,1 | 10,7 | 4,4 | |||
| (kg CFC 11-eq.) | ODP | 3,51E+01 | -99,8 | -100,0 | -100,0 | -100,0 | -100,0 | -100,0 | -100,0 | 699,8 | ||||
| (kg SO2-eq.) | AP | 4,11E-01 | 69,4 | -11,4 | -22,9 | -27,8 | 6,1 | 13,9 | -63,5 | 36,3 | ||||
| (kg Phosphat-eq.) | EP | 1,30E-01 | 25,5 | -73,3 | -54,5 | -55,8 | 7,8 | 18,5 | 2,4 | 129,4 | ||||
| (kg NMVOC eq.) | POCP | 5,13E-02 | 33,5 | 126,2 | -49,7 | -104,8 | -69,0 | -63,9 | -35,5 | 163,2 | ||||
| (kg Sb-eq.) | ADPE | 1,18E-01 | -99,8 | -99,6 | -99,4 | -100,0 | -99,9 | -99,9 | -99,9 | 698,6 | ||||
| (MJ) | ADPF | 1,09E+03 | 87,2 | -89,7 | -8,5 | -20,7 | 24,8 | 33,1 | -10,8 | -15,3 | ||||
| Resource use | (MJ) | PERE | 1,79E+02 | -35,3 | -67,0 | 13,8 | 44,3 | 6,0 | -5,7 | 43,9 | -100,0 | |||
| (MJ) | PERM | 7,51E-02 | 596,5 | -100,0 | -100,0 | -100,0 | -100,0 | -96,5 | -100,0 | -100,0 | ||||
| (MJ) | PERT | 2,46E+02 | -52,4 | -75,9 | -16,9 | 5,3 | -22,6 | -31,2 | 5,0 | 188,7 | ||||
| (MJ) | PENRE | 1,33E+03 | 65,6 | -8,6 | -17,6 | -29,6 | 3,4 | 11,7 | -25,0 | -100,0 | ||||
| (MJ) | PENRM | 1,41E+01 | 79,6 | 118,5 | -100,0 | -100,0 | 16,7 | 35,8 | -50,6 | -100,0 | ||||
| (MJ) | PENRT | 1,15E+03 | 87,2 | -96,4 | -4,2 | -18,3 | 21,9 | 31,4 | -12,1 | -9,5 | ||||
| (Kg) | SM | 3,71E+01 | -73,4 | -16,6 | -38,0 | -100,0 | 81,0 | 137,7 | 35,2 | -25,8 | ||||
| (MJ) | RSF | 2,82E+02 | -82,7 | -85,3 | -27,5 | -98,9 | -45,6 | -28,2 | 124,2 | 244,2 | ||||
| (MJ) | NRSF | 2,74E+02 | -69,3 | -5,3 | 41,8 | -88,3 | 2,3 | -17,8 | 67,7 | 68,8 | ||||
| (m3 world eq.) | FW | 2,03E+01 | 208,9 | -98,5 | -95,4 | -97,8 | 338,7 | -94,9 | -97,5 | -63,6 | ||||
| Waste | (Kg) | HWD | 1,07E-02 | 50,1 | 254,3 | -96,5 | -99,9 | -54,1 | 12,8 | -95,4 | 28,7 | |||
| (Kg) | NHWD | 4,32E+01 | -97,7 | 100,5 | -9,7 | 95,9 | -7,9 | -57,6 | 14,8 | -38,2 | ||||
| (Kg) | RWD | 2,02E-02 | -75,8 | 107,7 | 108,2 | 47,6 | -83,7 | -17,7 | -100,0 | -86,4 | ||||
| Outflows | (Kg) | CRU | ||||||||||||
| (Kg) | MFR | 4,96E-01 | -90,2 | -100,0 | -100,0 | -100,0 | -99,4 | -15,4 | -100,0 | 605,0 | ||||
| (Kg) | MER | 1,06E-01 | 384,0 | -100,0 | -100,0 | -100,0 | 35,8 | 80,2 | -100,0 | -100,0 | ||||
| (MJ) | EEE | |||||||||||||
| (MJ) | EET | |||||||||||||
1 average of all countries reporting value at that stage.
Table 11.
Chromatic gradient of 5 sectorial EPD of ready-mixed concrete according to UNE-EN 15804+A2 according to declared stages. Stages A1-3. Part 1 of 2: Impact assessment and resource use.
Table 11.
Chromatic gradient of 5 sectorial EPD of ready-mixed concrete according to UNE-EN 15804+A2 according to declared stages. Stages A1-3. Part 1 of 2: Impact assessment and resource use.
| Stages A1-3 Percentage of the country compared to the average |
||||||||||
|---|---|---|---|---|---|---|---|---|---|---|
| UNE-EN 15804+A2 Unit Indicator |
AVG. 1 A1-3 | HOLCIM Germany (%) | Iston Istanbul Turkey (%) | Aggelos Greece (%) | Interbeton Greece (%) | Votorantim Brazil (%) | ||||
| Impact assessment | (kg CO2-eq.) | GWP-total | 2,74E+02 | -36,8 | 27,2 | 15,5 | -13,0 | 7,1 | ||
| (kg CO2-eq.) | GWP-fossil | 2,72E+02 | -36,4 | 26,6 | 14,4 | -12,4 | 7,8 | |||
| (kg CO2-eq.) | GWP-biogenic | 1,77E+00 | -89,3 | 94,4 | 184,1 | -96,6 | -92,6 | |||
| (kg CO2-eq.) | GWP-luluc | 1,01E-01 | -0,9 | 44,7 | -29,2 | -64,3 | 49,7 | |||
| (kg CFC 11-eq.) | ODP | 1,09E-05 | -100,0 | 75,4 | 18,5 | -33,4 | 39,6 | |||
| (mol H+ eq.) | AP | 8,13E-01 | -58,2 | 22,2 | 1,6 | -33,1 | 67,4 | |||
| (kg P eq.) | EP-freshwater | 8,49E-02 | -99,9 | -52,8 | 283,8 | -52,0 | -79,2 | |||
| (kg N eq.) | EP-marine | 1,20E-01 | -8,4 | 124,0 | 82,4 | -99,2 | -98,8 | |||
| (mol N eq.) | EP-terrestrial | 2,64E+00 | -51,1 | 15,3 | -5,9 | -32,1 | 73,7 | |||
| (kg NMVOC eq.) | POCP | 6,62E-01 | -54,7 | 20,5 | -5,5 | -32,6 | 72,3 | |||
| (kg Sb-eq.) | ADPE | 6,06E-04 | -98,9 | 117,8 | 102,9 | -76,4 | -45,4 | |||
| (MJ) | ADPF | 1,16E+03 | -14,9 | 74,8 | -37,5 | -36,0 | 13,7 | |||
| (m3) | WDP | 7,67E+01 | -95,0 | 8,7 | 23,7 | 25,7 | 36,9 | |||
| Resource use | (MJ) | PERE | 1,37E+02 | -50,1 | 54,3 | -49,5 | -59,6 | 104,8 | ||
| (MJ) | PERM | 4,32E+00 | -95,8 | -100,0 | 395,8 | -100,0 | -100,0 | |||
| (MJ) | PERT | 1,41E+02 | -51,5 | 49,6 | -35,8 | -60,8 | 98,5 | |||
| (MJ) | PENRE | 1,32E+03 | -25,5 | 79,4 | -29,9 | -35,8 | 11,8 | |||
| (MJ) | PENRM | 1,76E+02 | -94,3 | -99,9 | 394,3 | -100,0 | -100,0 | |||
| (MJ) | PENRT | 1,49E+03 | -33,6 | 58,3 | 20,1 | -43,3 | -1,4 | |||
| (Kg) | SM | 1,54E+01 | -33,9 | -100,0 | -41,0 | -23,5 | 198,3 | |||
| (MJ) | RSF | 4,66E+01 | 288,5 | -100,0 | -93,7 | 5,2 | -100,0 | |||
| (MJ) | NRSF | 7,73E+01 | 307,5 | -100,0 | -93,5 | -14,0 | -100,0 | |||
| (m3 world eq.) | FW | 1,95E+00 | -71,8 | 2,1 | 15,4 | 18,5 | 35,9 | |||
1 average of all countries reporting value at that stage.
Table 12.
Chromatic gradient of 5 sectorial EPD of ready-mixed concrete according to UNE-EN 15804+A2 according to declared stages. Stages A1-3. Part 2 of 2: Waste and outflows.
Table 12.
Chromatic gradient of 5 sectorial EPD of ready-mixed concrete according to UNE-EN 15804+A2 according to declared stages. Stages A1-3. Part 2 of 2: Waste and outflows.
| Stages A1-3 Percentage of the country compared to the average |
||||||||||
|---|---|---|---|---|---|---|---|---|---|---|
| UNE-EN 15804+A2 Unit Indicator |
AVG. 1 A1-3 | HOLCIM Germany (%) | Iston Istanbul Turkey (%) | Aggelos Greece (%) | Interbeton Greece (%) | Votorantim Brazil (%) |
||||
| Waste | (Kg) | HWD | 4,98E+01 | -100,0 | -100,0 | 300,0 | -100,0 | -100,0 | ||
| (Kg) | NHWD | 3,54E+01 | 5,5 | -0,7 | -58,1 | -100,0 | 53,3 | |||
| (Kg) | RWD | 6,14E-02 | -18,5 | -85,1 | 103,7 | -100,0 | -100,0 | |||
| Outflows | (Kg) | CRU | ||||||||
| (Kg) | MFR | 2,47E+01 | -100,0 | -100,0 | -78,9 | -100,0 | 278,9 | |||
| (Kg) | MER | 4,33E-03 | -100,0 | -100,0 | -100,0 | -100,0 | 300,0 | |||
| (MJ) | EEE | |||||||||
| (MJ) | EET | |||||||||
1 average of all countries reporting value at that stage.
Table 13.
Comparison of GWP-total, PERT and PENRT indicators at stage A1-3 for the three studied materials: corrugated steel, brick and concrete.
Table 13.
Comparison of GWP-total, PERT and PENRT indicators at stage A1-3 for the three studied materials: corrugated steel, brick and concrete.
| UNE-EN 15804+A1 Stages A1-3 |
GWP-total (Kg CO2-eq.) | PERT (MJ) | PENRT (MJ) | |
|---|---|---|---|---|
| Reinforcing bar | Spain2 | 410.0 | 1,700.0 | 7,190.0 |
| CCL scand-UK1 | 2,480.0 | 2,340.0 | 28,400.0 | |
| ArcelorMittal Europa *multinacional |
818.0 | 512.0 | 9,070.0 | |
| Outokumpu Reino Unido, EE.UU y Suecia. *multinacional |
2,890.0 | 7,330.0 | 37,200.0 | |
| Brick for cladding | España | 236.0 | 403.0 | 2,520.0 |
| UK | 213.0 | 120.0 | 2,430.0 | |
| Alemania | 196.5 | 373.9 | 2,052.0 | |
| Ready-mixed concrete | España | 271.0 | 117.0 | 2,150.0 |
| Gran Bretaña | 220.0 | 59.2 | 41.3 | |
| Alemania | 219.0 | 204.0 | 1,100.0 | |
| Thinkstep Alemania | 283.1 | 258.6 | 939.1 | |
| Dinamarca | 282.0 | 190.0 | 1,400.0 | |
| DK Beton *empresa |
299.0 | 169.0 | 1,510.0 | |
| Valla Islandia *empresa |
298.0 | 258.0 | 1,010.0 | |
| CEMEX Polonia *empresa |
281.0 | 709.0 | 1,040.0 |
1 Company specific data; 2 Association EPD; 3 Developed generic data.
Disclaimer/Publisher’s Note: The statements, opinions and data contained in all publications are solely those of the individual author(s) and contributor(s) and not of MDPI and/or the editor(s). MDPI and/or the editor(s) disclaim responsibility for any injury to people or property resulting from any ideas, methods, instructions or products referred to in the content. |
© 2023 by the authors. Licensee MDPI, Basel, Switzerland. This article is an open access article distributed under the terms and conditions of the Creative Commons Attribution (CC BY) license (http://creativecommons.org/licenses/by/4.0/).
Copyright: This open access article is published under a Creative Commons CC BY 4.0 license, which permit the free download, distribution, and reuse, provided that the author and preprint are cited in any reuse.


