
Submitted:
16 October 2025
Posted:
17 October 2025
You are already at the latest version
Abstract
Purpose Missing data are a fundamental challenge in Life Cycle Assessment (LCA). A promising way to address such gaps is the direct use of already calculated environmental impact assessments of upstream products. Although companies increasingly publish environmental information like Environmental Product Declarations (EPD), there is still limited research on integrating those emission factors directly as LCA results within standard LCA software to ensure seamless accessibility. Methods This paper presents a method to integrate aggregated emission factors from EPDs into LCI databases. The method combines reverse calculation with proxy selection, where proxies represent ecosphere flows. This enables the calculation of inventory results and the characterization of impacts in life cycle impact assessment (LCIA). The approach allows emission factors to be made available as LCA results within common LCA programs. Results and discussion The method is demonstrated by integrating the German ökobaudat (OBD) database – containing EPDs - into the open-source software Brightway. An example illustrates how conventional and EPD-based data can be used simultaneously to close data gaps in a user-friendly way. Conclusions The study shows that data lacking supply chain information can be incorporated into conventional LCA software. The proposed approach increases usability, as only one LCA modelling and calculation step is required , and it can be applied across different data sources and software environments.
Keywords:
life cycle assessment
; life cycle inventory
; data gaps
; environmental product declaration
; emission factor
; sustainability
; buildings
; brightway
; ökobaudat
1. Introduction
Is it better to assume zero or use imperfect data to fill data gaps in Life Cycle Assessment (LCA)? Data gaps are a common issue in LCA and must be addressed for a meaningful interpretation of the analysis to support decision-making. Del Rosario et al. (2021) conduct two similar LCA studies of a sustainable building with and without significant data gaps. The first LCA is based on EPDs and has data gaps in the transportation scenarios, whereas the second one uses ecoinvent data to fill these gaps. Filling data gaps in the second LCA has led to a significant increase in all results in most indicators compared to the first LCA. The data used to fill the data gaps, representing the transportation, significantly contributes to the results and assuming them to be zero leads to biased results. If relevant data in LCA is missing, the re is a growing risk that decisions cannot be made or that they are based on biased results.
Specifically, data gaps in a product’s or service’s upstream and downstream process structure must not only be known but also be quantifiable to determine the environmental influences. To ensure robust LCAs, it is essential to have a background system that reliably represents upstream processes as well as a consistent foreground system with primary data. Obtaining primary information from internal sources regarding direct emissions and purchased energy is straightforward for the LCA modeller at a company level (Baehr et al. 2024). In contrast, secondary data often is not directly available as it is containing the process structure of the upstream processes of purchased goods or services. These average processes are commonly used for the background system, which relies on Life Cycle Inventory (LCI) databases (Hauschild et al. 2017, p. 80). However, the background system often lacks environmental information with regard to specific processes, although the LCI databases are continuously being expanded (ecoinvent 2023). The absence of data gaps in the systems pertaining to the foreground and background is imperative for the evaluation of the environmental impact of goods or services.
Therefore, it is necessary to implement strategies to fill data gaps to obtain consistent product systems in the LCA model. These strategies include proxy selection and data creation (Zargar et al. 2022). Proxy selection, i.e. selecting a similar data set as a proxy by using a representative precursor or a similar technology in the database, inevitably results in a reduction in data quality. Data creation through empirical evaluations or the utilisation of other models such as text mining algorithms and scenario develoment, is highly elaborate. Neither proxy selection nor data creation are ideal solutions to fill data gaps. It is therefore essential to identify convenient ways to fill data gaps for meaningful LCA results.
1.1. Existing Environmental Data Sources
Currently, environmental data can already fill data gaps and be integrated into LCA. A large number of organizations already provide specific environmental data due to mandatory or volutary reporting acitivities. In accordance with the EU Non-Financial Reporting Directive or the Corporate Sustainability Reporting Directive (European Parliament and Council 2022), sustainability reporting is mandatory for several companies. Alternatively, organizations may choose to report voluntarily in accordance with ISO Net Zero Standards (International Organization for Standardization 2023), the Greenhouse Gas Protocol (World Resources Institute and World Business Council et al. 2004) or the corporate standard of the Science Based Targets initiative (SBTi) (2024). All these reporting activities generate specific environmental data. Consequently, these reported environmental data can be used as input data to fill data gaps in other LCA studies. (Baehr et al. 2024)
Standardized environmental data is available as a reliable data source. Established standards already exist to facilitate comparison of reported environmental data within a company but also along the supply chain (Fritz et al. 2017; de Villiers et al. 2022). Formats for the standardized reporting of the life cycle environmental performance of products are not only environmental product declarations (EPDs) adhere to the ISO EN 14025 (International Organization for Standardization 2006a) but also the more specific standard for EPDs of the building sector, outlined in EN 15804 (Deutsches Institut für Normung 2022). Information regarding EPD data is available from, e.g. the ECO Platform (2025), the Institut Bauen und Umwelt e.V. (2024), and the International EPD® System, where approximately 23,000 validated EPDs are available as of 2024. Other standardized schemes for the reporting of the life cycle environmental performance of products include the product carbon footprint in accordance with ISO 14067 (International Organization for Standardization 2018) or the Greenhouse Gas Protocol Standard (2016) as well as the carbon footprint in accordance with regional standards such as the European Commission’s recommendation (European Commission 2021). These reporting standards for environmental data are based on recognized methodologies and verification procedures, making them a reliable source to fill data gaps.
A key challenge is that standardized environmental data is difficult to integrate into common process-based LCI databases due to their aggregation level. They are aggregated concerning life cycle phases and unit processes on the one hand and characterized impacts on the other hand. Intermediates or elementary flows which could be subject to inventory or impact indicator calculation are not available. Another limitation for use in LCA is the availability of only few impact categories, usually only global warming potential emission factor, e.g., from the Greenhouse Gas Protocol (2016) the Intergovernmental Panel on Climate Change (IPCC) (2021) or the German Umweltbundesamt (2022). EPDs contain emission factors for 19 defined impact categories of the impact assessment method Environmental Footprint (EF) (European Commission 2023) in accordance with the EN 15804 (Deutsches Institut für Normung 2022). Each emission factor for one of these impact categories, e.g. the carbon footprint, can be interpreted as a limited LCA and is one characterization result within an LCA (Meinrenken et al. 2020). The underlying data used to calculate the inventory results comes usually from process-based LCI databases, which represent the most disaggregated level of environmental data and cover information on the entire supply chain. For instance, emission factors can be further aggregated e.g. in EPDs and disaggregated based on its supply chain information in LCA. When it comes to the transfer of emission factors for intermediate products to the subsequent company in the supply chain, the transferred information is limited to aggregated environmental information without process information or any other methodological description (Schmidt 2011). Although emission factors are frequently derived from process-based LCI databases and therefore contain supply chain information, the aggregation into single numerical values obscures the underlying process chains. This limits the integration of emission factors into LCI databases, which rely on detailed process-based information to calculate inventory results. Consequently, addressing data gaps in LCA requires standardized sources such as EPDs, yet their potential remains unrealized as long as process-based information is inaccessible.
1.2. Integrating Emission Factors from EPDs in LCA
The central research question concerns how emission factors from standardized EPDs can be systematically integrated into LCA methodologies. Although environmental data sources—such as emission factors provided in EPDs or company-reported environmental metrics—are increasingly available, they typically lack detailed, process-based information. Even though an LCA must be conducted to create an EPD in accordance with EN 15804, final results only contain numbers in a PDF document for each module. These modules in the LCA, categorize processes into modules A-D. Module A encompasses the product stage and the construction process. Module B addresses the use stage and module C the end of life stage. Finally, module D covers the benefits and loads beyond the system boundary. Subsequently, the defined impact categories must be utilized to obtain results for each module. (Deutsches Institut für Normung 2022)
The EPD documentation lacks any process-related information, and thus each impact category reported in an EPD can be interpreted as an emission factor. As a result, the data structures used in EPDs differ fundamentally from those employed in conventional LCI databases, which are grounded in process-based modeling.
Process-based databases are designed to map the technosphere to model the entirety of a product’s process structure throughout its life cycle, incorporating manufacturing, use phase and end-of-life (Hauschild et al. 2017, p. 149). The life cycle of a product as modelled in the process-based database is comprised of unit processes, which represent the smallest element (Hauschild et al. 2017, p. 76). These unit processes are interconnected by flows, which can either be inputs or outputs (Steen et al. 1995). Unit processes may be grouped to form products and intermediate products, thereby representing the concept of the technosphere, which encompasses technical and economic structures (Hauschild et al. 2017, p. 78). The technosphere is linked to the ecosphere, representing the natural environment (Hauschild et al. 2017, p. 78). The utilisation of process-based databases is a common element in conventional LCA programs.
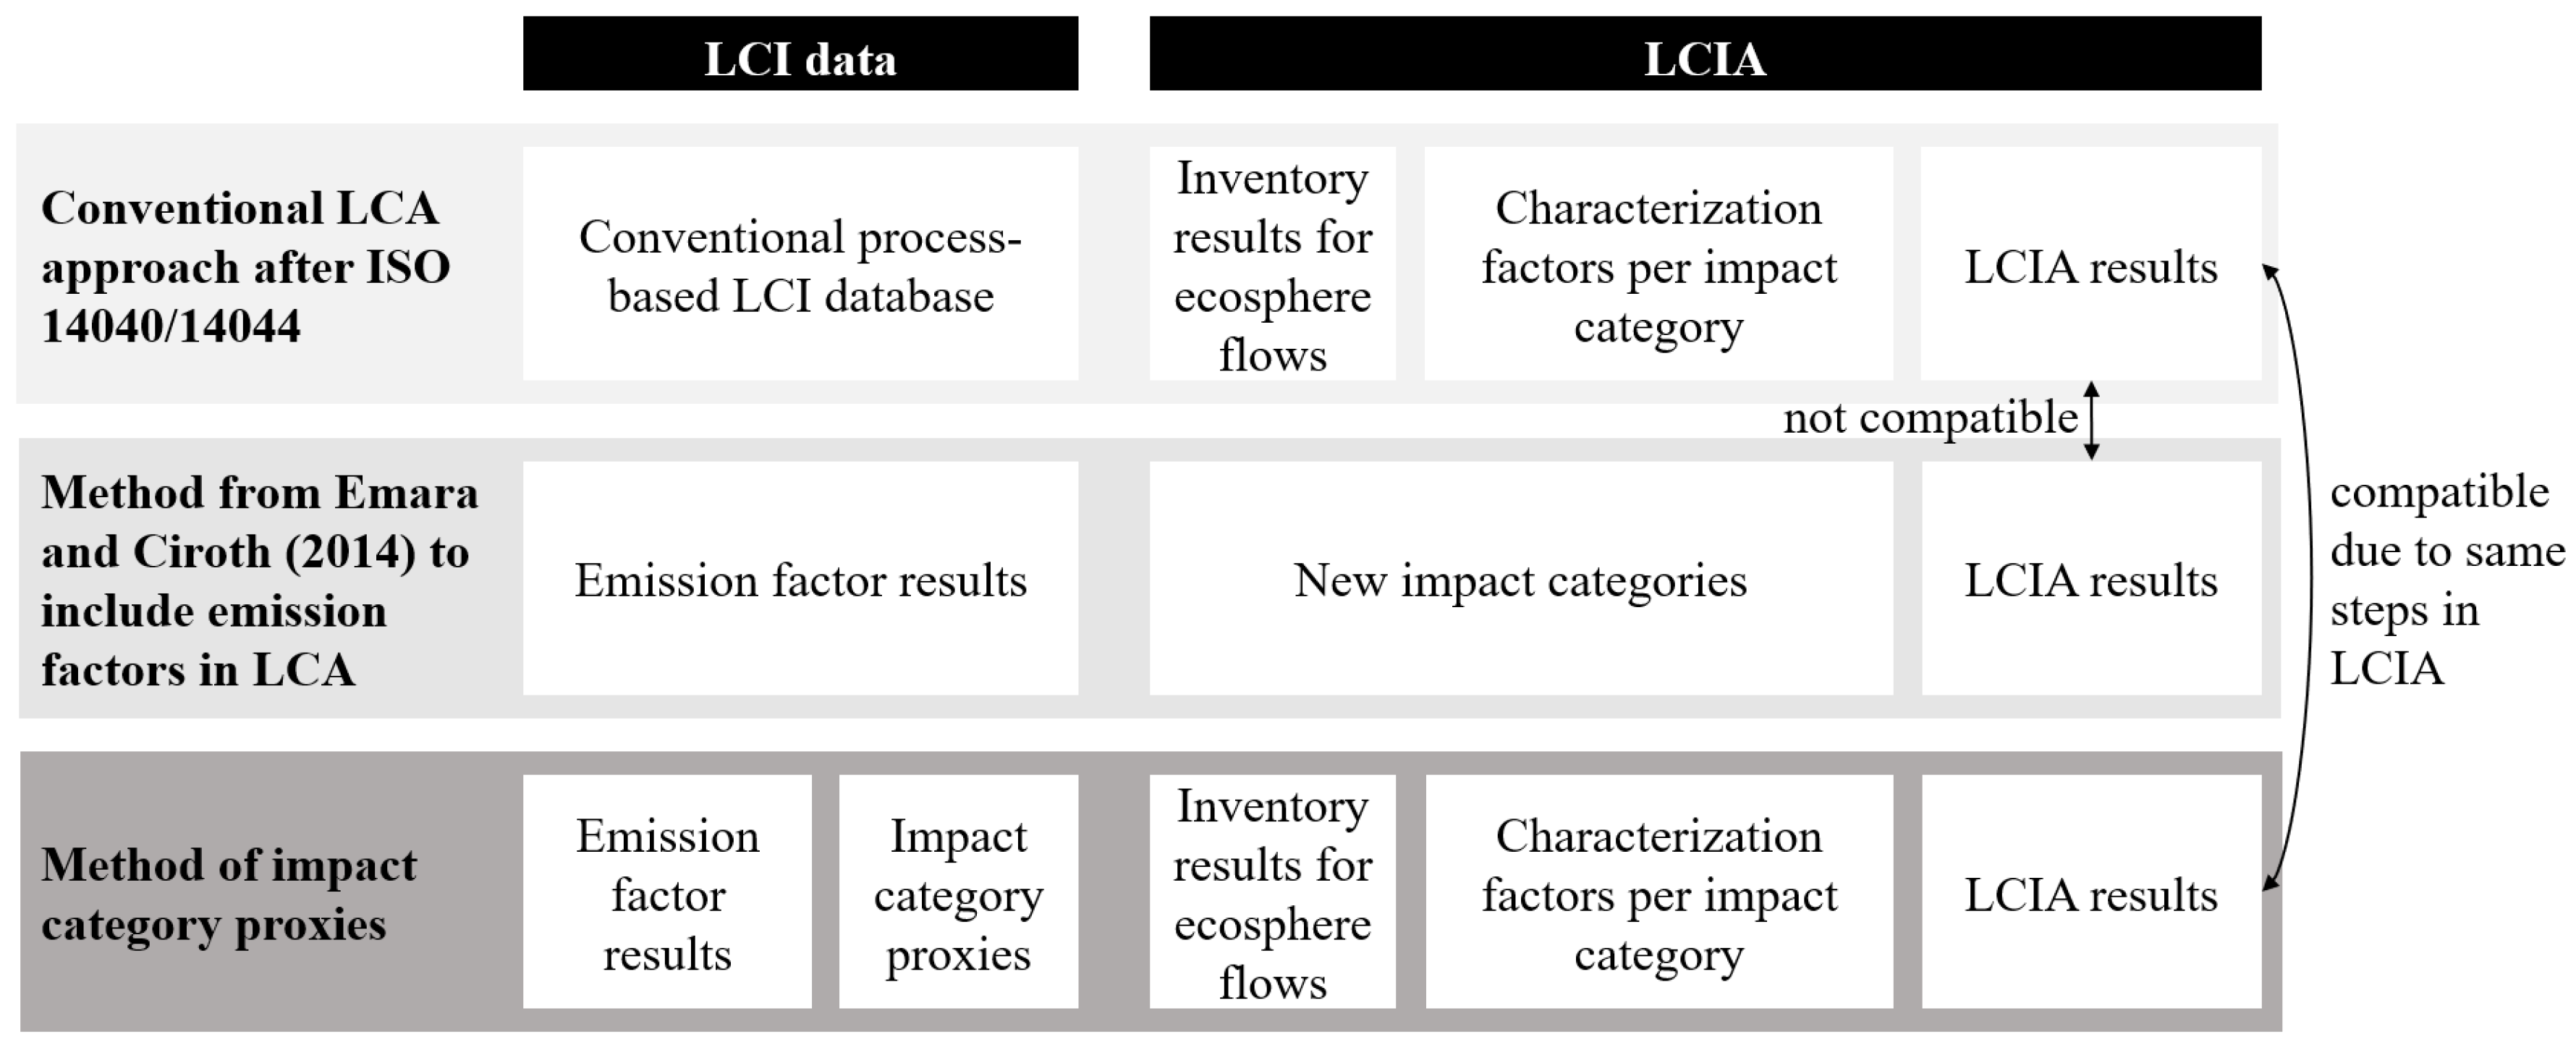
LCA programs orient their calculation on existing data sources such as process-based databases, as well as on established standards, namely the ISO 14040 (International Organization for Standardization 2006b) and ISO 14044 (International Organization for Standardization 2006c). In the context of a conventional LCA performed in LCA software in adherence with the ISO standards, the sequence of calculating impacts is predefined for two out of four LCA phases: the LCI and the LCIA. The LCI comprises technosphere and ecosphere flows. Technosphere flows are interlinkages within the LCI database and ecosphere flows interact with the environment (Hauschild et al. 2017, p. 79). These interlinkages to the ecosphere permit the aggregation of relevant ecosphere flows for each impact category with the subsequent conversion of these flows using characterisation factors to yield LCIA results per impact category (Hauschild et al. 2017, p. 81-82). The characterisation factors are dependent upon the impact categories selected for the LCIA. This approach is displayed in the upper part of Figure I.
The literature shows two approaches for the integration of EPDs in LCA software. A first approach is a reconstruction method presented by Zhang et al. (2024). They connect the EPD database KBOB, whose background data are no longer current, with the ecoinvent database to establish a harmonized and up-to-date LCI database. This integration process eliminates the problem of missing process-based background data and makes it straightforward to implement these EPDs in LCA. Abu-Ghaida et al. (2024) also use a reconstruction method to integrate EPD in LCA. In contrast to Zhang et al. (2024), the background information of their EPDs is unknown, but similarly, they link their EPDs to the ecoinvent database. In addition to the doubled work of the reconstruction process, which can be seen in both studies, it is unclear whether, in the study of Abu-Ghaida et al. (2024), the equivalent products from ecoinvent are an adequate representation of the EPDs. These studies present the method of reconstructing EPDs by using the ecoinvent database. However, this approach is inefficient, as it duplicates effort by reconstructing environmental data that is already provided in EPDs.
Second, creating new impact categories is another approach to display the EPD emission factor results in LCA. Emara and Ciroth (2014) create new impact categories to import an EPD database in the conventional LCA software openLCA and SimaPro. New impact categories were added to the LCA software, which can deal with the available emission factors in the EPDs. These new impact categories sum up emission factors from EPDs but cannot deal with process-based LCI databases. The new impact categories cannot deal with process-based LCI databases, because these contain environmental flows which have different units than emission factors, meaning that they cannot be summed up. As a result, EPDs and process-based data cannot be used within one LCA calculation using this method. In addition, the authors note that the contribution analysis shows few details in the form of the contribution of each EPD as background information is lacking. This approach currently represents the most established method for integrating emission factors into LCA. However, it requires modifications to the existing LCA programs, since the LCIA is bypassed when using EPDs. As displayed in the middle part of Figure I including new impact categories in LCA demands a detailed understanding of the software, making the implementation highly complex and technically challenging.
Previous approaches have shown significant methodological and practical limitations and are not sufficient to integrate EPD data into LCA to fill data gaps. The largest barrier is the absence of process-based data of the supply chain in EPDs. The creation of new impact categories is maintenance-intensive and complex to implement and the generation of two results due to two calculations of the process-based and the non-process-based database is inconvenient. However, this integration of EPD data would offer significant benefits, but there is a need for increasing user-friendliness.
1.3. Discrepancy Between Data Structure and LCA Software
So far, LCA programs such as Brightway (Mutel 2017b) and its graphical user interface, the Activity Browser (Steubing et al. 2020) cannot directly process emission factors or EPDs. due to their aggregation structure This software is utilized to demonstrate the method of integrating EPDs in LCA. The open-source software Brightway2 provides the advantage of facilitating a more detailed understanding of the software’s functionality of the code. The code of this LCA software is written in Python and performs the LCI and the LCIA in a predefined sequence, which implies that the impact category results of the LCIA are automatically visualized in the software. The program is capable of working with process-based LCI databases, such as the ecoinvent database (Weidema et al. 2013). Each database is a set of activities and the ecosystem is represented by the biosphere3 database in the open-source Python code. Because of the full transparency of open-source code, this software is the base for a fully automated and programming-based methodology for integrating emission factors and EPD into LCA software. (Mutel 2017; Steubing et al. 2020)
This study aims to develop a user-friendly approach for importing an EPD database into LCA programs to be used simultaneously with LCI databases in the same LCA. The methodology employed here is analogous to that described by Emara and Ciroth (2014) but shall avoid the presentation of two results stemming from the data structure of process-based LCI databases and EPD emission factors within a single LCA calculation.
Our approach is integrating the ökobaudat1 (OBD) database (Bundesministerium für Wohnen, Stadtentwicklung und Bauwesen 2024) as an exemplary EPD database in the LCA software Brightway (Mutel 2017) and the Activity Browser (Steubing et al. 2020). OBD serves as an illustrative example of an EPD database that highlights the structural complexity of integrating emission factors into LCA software.
The description of the method is divided into sections to identify relevant differences in the structure of EPD and process-based databases, how results are calculated and displayed by the LCA software Brightway and the Activity Browser and the approach of reverse calculation and impact category proxies. Based on this, the results present the chosen mathematical representations applied to each impact category, along with the technical implementation in Python and an illustrative LCA calculation. Furthermore, the discussion section identifies the advantages and limitations of the methodology. The paper ends with concluding remarks and recommendations for future research.
2. Methods: Integrating Emission Factors in LCA Programs
Firstly, the method of reverse calculation is presented, which details the integration of emission factors into LCA programs. For the implementation of EPDs, which in this example of the OBD are using EF v3.0 as impact assessment method, the approach has to ensure that the ecosphere flow i is exclusively representative of the impact category k. Therefore, it is essential that the ecosphere flow i is a unique flow (chapter 2.2) and does not appear in other impact categories. When the ecosphere flow i is a non-unique flow, it would result in the non-transparent influencing of results of other impact categories (chapters 2.3 and 2.4). The emission factor results as well as the proxy database are stored within the LCA program in the same format as any process-based database as illustrated in Figure I.
2.1. Reverse Calculation and Impact Category Proxies to Integrate Emission Factors in LCA
The integration of emission factors into process-based databases is achieved through the utilisation of reverse calculation and the inverse of the characterisation factor. In contrast to previous methods, which use the creation of novel impact categories for the LCIA and provide two distinct outcomes, our method develops impact category proxies. The differences between the conventional LCA approach, previous methods to include emission factors in LCA and our method of impact category proxies are shown in Figure I. Our method of impact category proxies is shown in the lower part of Figure I. This new method can process emission factors and process-based data simultaneously and displays one LCA result. To provide only one outcome per LCA calculation, the impact category proxies must fulfil specific requirements to not affect the LCIA calculation of the LCA software. Therefore, the impact category proxies are initiated at the level of the LCI to perform the LCIA at the subsequent step. The impact category proxies consist of one or multiple ecosphere flows per proxy and are implemented into the LCI using reverse calculation. The proxies link the emission factor database in the LCI to the ecosphere in the absence of any supply chain information. This implementation of the proxies ensures the correctness of the contribution per emission factor to the LCA result during the performance of the LCIA. The LCA results from our method utilising impact category proxies and reverse calculation can be directly summed up to conventional ones by the LCA program due to the structure of the approach. A comparative overview of methods is provided in Figure I.
Figure 1.
Overview of existing and new methodologies for emission factor integration in LCA in comparison to the conventional LCA approach.
Figure 1.
Overview of existing and new methodologies for emission factor integration in LCA in comparison to the conventional LCA approach.
The following section outlines the mathematically methodology for reverse calculation of emission factors for integration in LCI databases. The detailed calculations can be found in the supplementary information. It should be noted that the numbering of the equations herein corresponds to that in the supplementary material; consequently, some numbers have been omitted. The conventional approach serves as basis:
Ek: Characterization result for each impact category k
LCIAik: Characterization factor for ecosphere flow i in category k
mi: Inventory result for ecosphere flow i
The objective is to identify a possible conversion factor, called impact category proxy, for determining suitable inventory amounts out of the emission factor results in the LCI, without influencing the LCIA. Consequently, our methodology exclusively affects , whereas LCIAik remains unaltered to maintain consistency with the calculation steps of a conventional LCA approach, as illustrated in Figure I.
The LCA characterization results , which represent the emission factors , are known. These emission factors need to be modified in a way, that the multiplication by the characterization factors will result in the initial emission factors. Therefore, a reverse characterization factor has to be introduced. This means, the mathematical product of the impact category proxy and the characterisation factors need to be one. The reverse characterization factor, referred to as thefor each impact category k referring to an ecosphere flow i, is defined as the inverse of the characterization factors .
2.2. Finding Unique Flows in the Relevant Impact Categories to the Ecosphere
To identify unique ecosphere flows amongst all flows, a programming-based approach in Python has been employed. The code is accessible via GitHub2 and is designed to quantify the number of duplicates within the list of all ecosphere flows of the relevant impact assessment method. This enables the selection of unique ecosphere flows within one impact assessment method for every impact category, where applicable.
In the event that at least one unique ecosphere flow, , is present within all relevant impact categories k in the LCA, the , can be expressed as follows for the impact categories :
This ensures that the ecosphere flow i is exclusively representative of the impact category and reduces equation (1) by all summands except one.
The EF 3.0 which is required by EN 15804 for EPDs comprises 19 impact categories, 15 of which have a unique corresponding ecosphere flow . When no unique ecosphere flows are available, two workable solutions exist to address this issue: either a balancing mechanism (chapter 2.3) or a summation of other impact category results (chapter 2.4), dependent on the impact category’s structure, may be employed.
2.3. Balancing Mechanism for Non-Unique Ecosphere Flows
In the absence of any unique ecosphere flow within the impact category , the utilization of proxies as previously outlined would increase another impact category . The inventory result consists of two parts, the results for impact category with its unique ecosphere flow and the part from the non-unique ecosphere flow of the impact category This can be expressed as follows for the impact category :
The performance of the LCIA using (1) will return:
Or expressed in a simpler formula:
In order to achieve balance, the unintentional increase is counteracted by a negative amount to reach a net of zero. It can be expressed as follows:
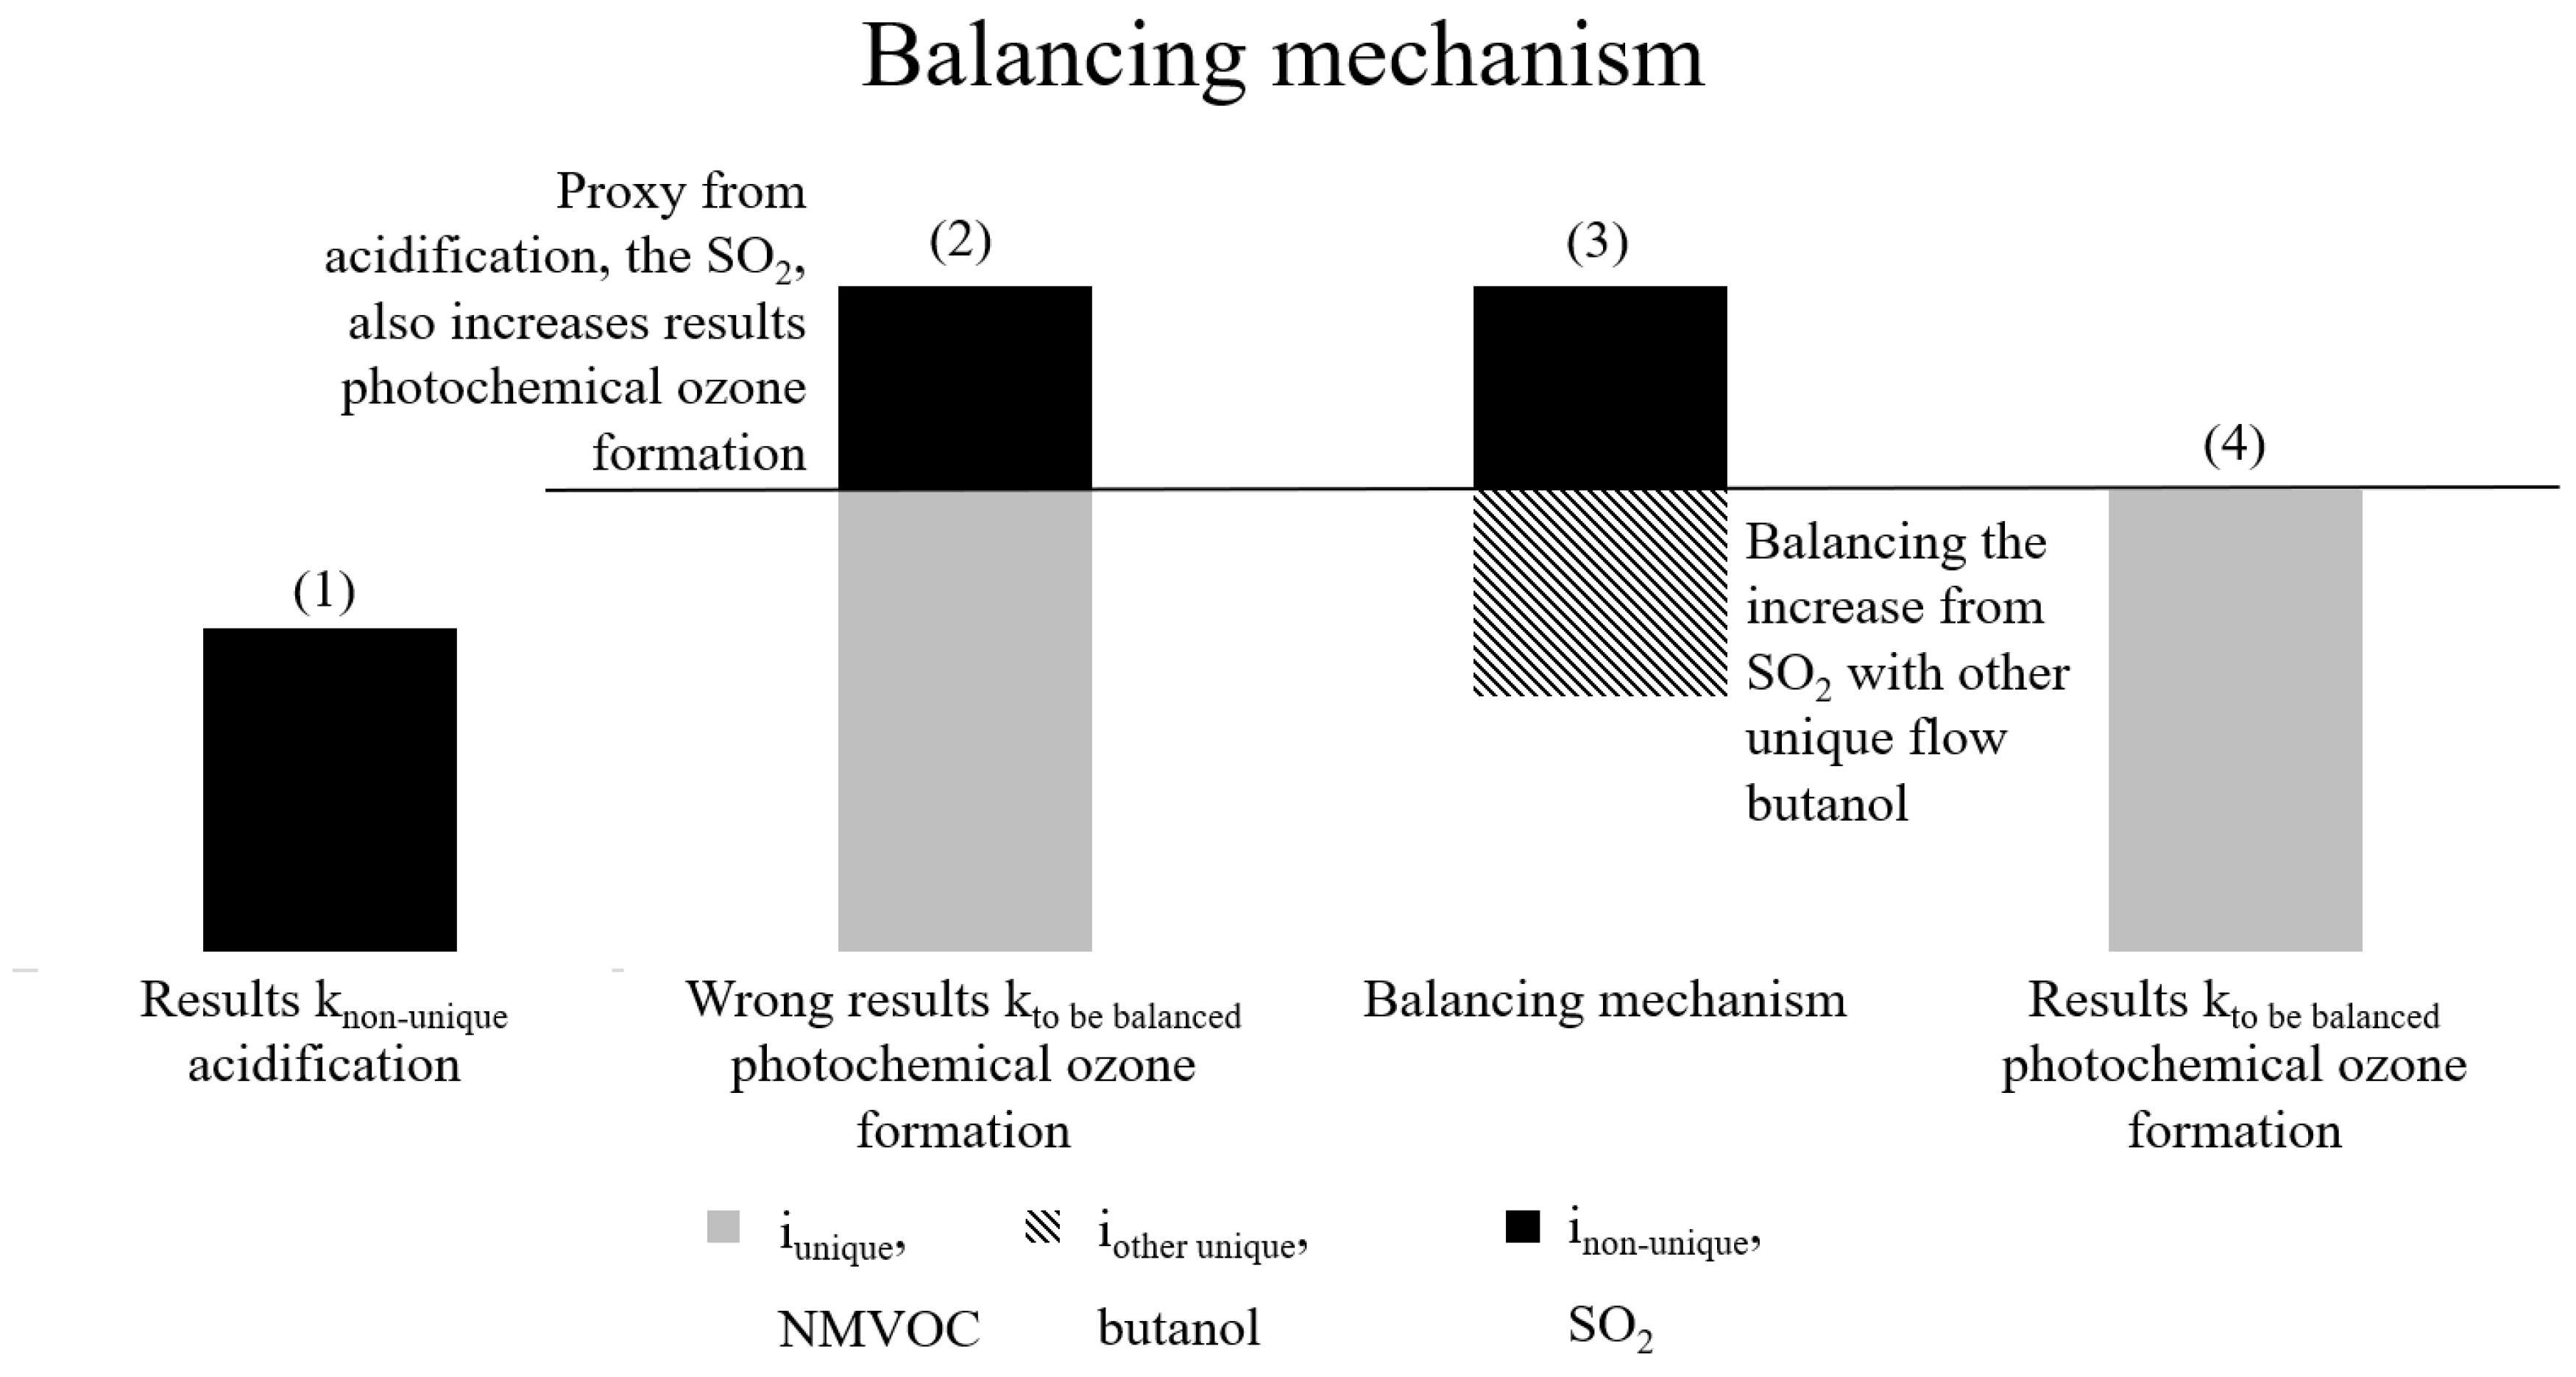
An example can be observed concerning the impact categories of acidification and photochemical ozone formation and is illustrated in Figure II. In the context of acidification, it is impossible to identify a unique ecosphere flow. However, the ecosphere flow “sulphur dioxide” (SO2), which is also included in the impact category photochemical ozone formation , can be considered as representative ecosphere flow in the . By utilising SO2 in the proxy, it is possible to obtain a correct characterization result for the impact category acidification (1). Furthermore, SO2 is recognised by the impact category of photochemical ozone formation , which will there lead to an increase in the results. The impact category photochemical ozone formation already has a unique ecosphere flow , the non-methane volatile organic compounds from unspecified origin (NMVOC) and is already correctly represented by t. The utilisation of the proxy for acidification with the non-unique ecosphere flow SO2 for acidification has the consequence of producing incorrect results in photochemical ozone formation (2).
This is why the proxy of the impact category , in the example of acidification, requires a balancing in the impact category , in the example of photochemical ozone formation. In order to achieve a balancing of the impact category , it is necessary to introduce a second unique flow in the impact category , with a . To return to the previous example, a secondary unique ecosphere flow is required in the photochemical ozone formation, in order to balance the increase coming from SO2 of acidification. Consequently, a negative amount, representing a fictious environmental uptake, of a substance such as butanol is necessary to reduce the results of the photochemical ozone formation (3). As butanol is a unique ecosphere flow of photochemical ozone formation, no other impact categories are affected, and the results of photochemical ozone formation are represented correctly (4). This is illustrated in Figure II.
Figure 2.
Graphical explanation of the balancing mechanism of impact assessment results which is used for impact categories without unique ecosphere flows, in the example of acidification which is why the photochemical ozone formation is balanced.
Figure 2.
Graphical explanation of the balancing mechanism of impact assessment results which is used for impact categories without unique ecosphere flows, in the example of acidification which is why the photochemical ozone formation is balanced.
The for the balancing mechanism is derived using the following formulas (1), (3), (5) and (7):
The proxy for the other unique ecosphere flow can then be derived and expressed as follows:
The increase can be derived from the characterization factors of the non-unique ecosphere flows in the impact categories and and from the characterization factor of the other unique ecosphere flow in the impact category . Overall, the same methodology as described in section 2.2 is employed to calculate the proxy, but the balancing mechanism is required due to the non-unique ecosphere flow in the impact category .
When a non-unique ecosphere flow has an impact on more than one other impact category, the formula can be extended by integrating other impact categories and their respective balancing.
The EF 3.0, which is used for EPDs in OBD, has three impact categories, where the balancing mechanism must be applied. The chosen ecosphere flows for these impact categories are presented in Table I.

Table 1.
Impact categories affected by the balancing mechanism in the OBD.
| Impact category | ||
| Acidification potential, Accumulated Exceedance (AP) | Sulphur dioxide (‘air’, ’lower stratosphere + upper troposphere’) | Butanol ('air', 'low population density, long-term') |
| Eutrophication potential - terrestrial | Nitrate (‘air’) | Nitrate (‘water, ground’) |
| Depletion potential of the stratospheric ozone layer (ODP) | Methane, dichlorodifluoro-, CFC-12 ('air', 'low population density, long-term') | Carbon dioxide, fossil ('air', 'urban air close to ground') |
2.4. Impact Category k as Sum of Other Impact Categories
If a specific characterization result of an impact category k is the sum of other characterization results, the proxy for the specific impact category can be set to zero. E.g., the GWP100 in EN 15804 is comprised of the GWP100, fossil, the GWP100, biogenic and the GWP100, luluc. Consequently, the GWP100 total does not need to have a proxy. The characterization result is correctly displayed by the proxies for GWP100, fossil, GWP100 biogenic and GWP100, luluc and also accounts for the GWP100.
With the derivation of proxies using reverse calculation, the balancing mechanism, the handling of summed impact categories, the methodology is applied in practice in the following sections.
2.5. Case Study Description
The case study focuses on the technical building equipment of a small wooden house (9 m²), designed as a student learning space at a German university. This 9 m2 room is fully independent of the sewer system as it has no bathroom. Therefore, a complete LCA of the technical building equipment is conducted to enable comparison of alternative technical configurations.
The functional unit is the technical functionality of a building including a warm space, electricity, light and smoke detection per year. The life cycle stage modules considered in the case study are module A, the production of the materials for the equipment without the transport to the construction site, module B, the heating demand, and module C, the end-of-life treatment of the technical building equipment for the technical building equipment. Electricity consumption by users is excluded due to uncertainty in usage patterns of the study room.
Based on this goal and scope definition, the LCI modelling is described in the following. This includes the choice of data sources, the modelled components and specific modelling assumptions. OBD data is used as a primary data source, as it is the standard LCA database for the construction sector in Germany. To close data gaps, the ecoinvent database 3.9 cutoff is used. Within the OBD database, six out of 13 parts of the technical building equipment can be found. For the remaining components, six ecoinvent datasets for the communication module, a control cabinet, a display (5”), a motion sensor and a smoke detector and for the heating system a combination of OBD and ecoinvent datasets are used. The heating system is modelled combines the underfloor heating system from OBD with heat production from an air-water heat pump from ecoinvent. The ecoinvent dataset for the heat pump is taken as, heat pumps in the OBD do not indicate which electricity mix is used to operate the heat pump. In the OBD, neither the background system is visible, nor the documentation indicate the used electricity mix. As it is expected that the electricity consumption for the heat pump has a large influence on the results, ecoinvent data is used to model the heating system. The background system of heat pumps in ecoinvent provides detailed information on the exact electricity demand and the electricity origin. The heating demand is assumed to be 3900 kWh/year. Therefore, the German electricity mix from 2019, which is available in ecoinvent, is included to run the heat pump in the model. A self-sufficiency ratio to run the heat pump with electricity from PV and the electricity storage of 25% is assumed after (Bee et al. 2019).
The lifetime of the components is taken from the European Commission and Joint Research Centre (2021) and for the PV panel form Fraunhofer ISE (2024). The lifetimes as well as the components and their data source are available as supplementary information.
The following step in the process is the specification of the LCIA method. Currently, the OBD database contains results for two impact assessment methods, but EN 15804-A2 will replace EN 15804-A1 in the future; hence, this study will focus on A2. The EN 15804 standard mandates the use of the EF impact assessment method and therefore the EF 3.0 impact categories. After the EN 15804 standard, results from six out of the 19 environmental impact categories are optional. The additional environmental impact categories are ecotoxicity, human toxicity (carcinogenic and non-carcinogenic), ionising radiation, particulate matter formation and land use. Furthermore, the Global Warming Potential (GWP) 100, land use and land use change may be excluded if its contribution is less than 5 % of the total GWP100 across the declared modules, except module D. Mandatory impact categories are acidification, climate change (total, biogenic, fossil and land use and land use change), energy resources: non-renewable, eutrophication (freshwater, marine and terrestrial), material resources, metals/minerals, ozone depletion, photochemical oxidant formation: human health and water use. (Figl and Kusche 2023)
The case study framework establishes the basis for implementing the OBD database in Brightway2, as described in the following section.
3. Results: Implementation of the OBD Database in Brightway2
This section describes the integration of the OBD database into Brightway2 using the proxy selection method, enabling combined use of conventional process-based databases and EPDs.
3.1. Technical Implementation in Python
This section outlines how to import the products and their respective emission factors from the OBD database into the LCI of the LCA program Brightway.
The OBD is incorporating EPD data for the construction sector and provides LCIA results for all impact categories, broken down by the life-cycle stage modules (A-D) in accordance with EN 15804. The database contains approximately 1,400 EPD datasets that are grouped as follows:
-specific datasets for products of a certain manufacturer,
-average datasets of products provided by multiple companies or standing for multiple plants or products, representative datasets for products in certain countries, template datasets for products with unspecific information,
-and generic datasets created using secondary data such as literature.
The products are identified by a unique identifier, the UUID and each of which is linked to LCIA results. Furthermore, some products have different scenarios per module. For example, a given product is associated with one scenario using recycled parts and another scenario without recycled parts. These different scenarios lead to different emission effects for the same product. Furthermore, the data is varying, such that some products are associated with several scenarios, while others have none. Additionally, the number of modules specified varies across products, with some modules being specified in aggregated form (e.g. 'A1-A3'). The code is available on GitHub3. The CSV file of the OBD database is parsed into a data frame using the Python pandas library (The pandas development team 2020). To facilitate data processing, technical measures are necessary to enable data structure comparability for the Activity Browser. German names are employed where the English name is missing and in certain cases non-numeric characters, which indicate different types of data gaps, are substituted with 0. To enhance user-friendliness, the possibility of aggregation of modules and the direct visibility of scenarios have been integrated into the technical import structure. The configurable number of modules in the aggregation allows for the inclusion of a specific subset of modules, such as only module A, the construction phase. Similarly, it is also possible to include the aggregate of all modules associated with a particular product specified in a scenario. To achieve this aggregation, the import process includes a series of steps to standardize the data provided by the CSV file. This standardization facilitates subsequent calculations and the further processing of the data:
3.1.1. Labelling Scenarios
UUIDs of products do not provide insight into the presence of scenarios in the data set. Aggregating solely by UUID would include all scenario-specific variations, leading to incorrect results, as distinguishing between different scenarios of a single product with one UUID would not be possible.
To resolve this, a unique composite key is built by combining a scenario with the product and its UUID. Subsequently, these UUID-scenario tuples serve as the base for further aggregation. This is achieved by the insertion of a new column which bears the concatenation of the 'UUID' column and the 'Szenario' or scenario column. Unmarked rows, i.e. rows which do not bear a specific scenario identifier, are used to fill up the scenario rows. As an example, a product may be associated with two scenarios, 1 and 2, which are represented by two rows for module: 'C', and one row for the modules 'A' and 'B' belonging to both scenarios. It is then assumed that modules ‘A’ and ‘B’ are identical for both scenarios. In this example product, the import script will copy the unmarked rows and insert them once for each scenario. Consequently, the scenarios are effectively assigned in rows labelled 'A,B,C'.
3.1.2. Inconsistent Data Entries for Life Cycle Stage Modules
The OBD data entries of life cycle stage modules vary considerably between products. Not all life cycle stage modules are available. One product might contain data for module 'A1' and 'B', another for 'A1' and 'C', and a third one for 'A1-A3'. To ensure consistency, each product-scenario-tuple must be provided with the modules that are currently absent. The newly inserted rows for each life cycle stage module have a value of 0 as the emission factor. This process standardizes the data structure across all products and modules, enabling automated processing and comparability. As a result, users can perform LCA calculations with all 471 products from the OBD, even when some products lack data for certain modules, without requiring manual adjustments. However, the insertion of 0 values does not indicate that there are no emissions in these modules. It simply serves to ensure a standardized basis for the comparison of existing data.
3.1.3. Aggregation of Life Cycle Stage Modules 'A1-A3'
The OBD includes the aggregated modules 'A1-A3' for certain products and the disaggregated modules 'A1', 'A2' and 'A3' for others. Since the 'A1-A3' module lacks weighting information, they cannot be disaggregated to 'A1', 'A2' and 'A3'. Consequently, the import script aggregates the individual modules 'A1', 'A2' and 'A3' when they are provided for a product. This results in the data being structured in a consistent manner, which simplifies automated data processing. This yields a data frame comprising the aggregated module 'A1-A3' for all products.
The resulting data frame, containing the enhanced OBD data, can now be imported into Brightway2. Each product-scenario-tuple is imported and is required to have at least a 0 or an emission factor for each of the life cycle stage modules 'A1-A3', 'A4', 'A5', 'B1', 'B2', 'B3', 'B4', 'B5', 'B6', 'B7', 'C1', 'C2', 'C3', 'C4' and 'D'.
Further custom aggregations may be applied before importing with either the Pandas/Python default means or the provided 'custom_aggregate' function. The 'custom_aggregate' function will insert a specific key into the resulting data frame. This key contains the instructions for the aggregation, for example, the key 'A1-A5', indicates that the modules 'A1-A3', 'A4', and 'A5' should be aggregated. The aggregation function is based on a fixed module order which is defined in the configuration. The 'custom_aggregate' function is primarily used to reduce the modelling effort. The grouping of modules generates one single activity, whereas the ungrouped modules indicate one activity per module. Consequently, for grouped modules, only one activity is required to be selected during modelling, which is less time-consuming.
The goal of the LCI is to hand over the correct inventory amounts to the LCIA to be able to calculate LCA results. Inventory amounts from EPDs as data source can be calculated by multiplying the emission factor and the as described in formula (6). The proxies are stored in a database.
This proxy database links the emission factors for each impact category to ecosphere flows, allowing for the calculation of the LCIA. The proxy ecosphere flows have been carefully selected as described in chapter 2.2., 2.3 and 2.4. The setup of the proxy database is achieved through a manual configuration, which defines the mapping of an OBD impact category k to an array of ecosphere flows i and the corresponding amount. This corresponding amount is calculated using the three solutions for proxy calculation as described in chapters 2.2, 2.3 and 2.4. For the first case of a unique flow in an impact category, the corresponding amount is the reciprocal characterization factor as described in formula (3) in chapter 2.2. For the second case of the impact category not consisting of any unique ecosphere flows and the employment of the balancing mechanism, the corresponding amount is calculated using formula (7) from chapter 2.3. For the third case of the impact category being the sum of other impact categories, the value of zero is the corresponding amount as described in chapter 2.4. Subsequently, each corresponding amount of ecosphere flows i is imported as a Brightway activity, with links to the ecosphere. The ecosphere in Brightway is represented by the biosphere3 database and has been pre-implemented in Brightway. The proxy database is not only linked to ecosphere flows but also to impact categories in the OBD. Therefore, the data frame which contains the standardised and potentially aggregated OBD data, is imported in such a way that each product, scenario, module (and aggregation) combination is imported as a Brightway activity. These OBD Brightway activities have exchanges to the proxy database activities for each impact category.
The implemented workflow ensures standardization, aggregation, and integration of OBD data into Brightway2. Each product-scenario-module combination is mapped to the proxy database for all relevant impact categories. The implemented data structure ensures consistency across modules, allows for aggregation where needed, and facilitates automated LCA calculations for all products.
3.2. Case Study Results of LCA Calculations with Data from Process-Based and EPD Databases
In Figure III, the relative results per impact category and component are visible. Results displayed in blue represent data from OBD 4 and results in red data from ecoinvent. For all components from OBD besides the inverter, no data is available for the impact categories ecotoxicity freshwater, human toxicity carcinogenic and non-carcinogenic, ionising radiation: human health and land use. Results of these impact categories are incomplete and are therefore not included in the following figures.
Figure 3.
Results per impact category and component, in blue data from OBD and in red data from ecoinvent.
Figure 3.
Results per impact category and component, in blue data from OBD and in red data from ecoinvent.
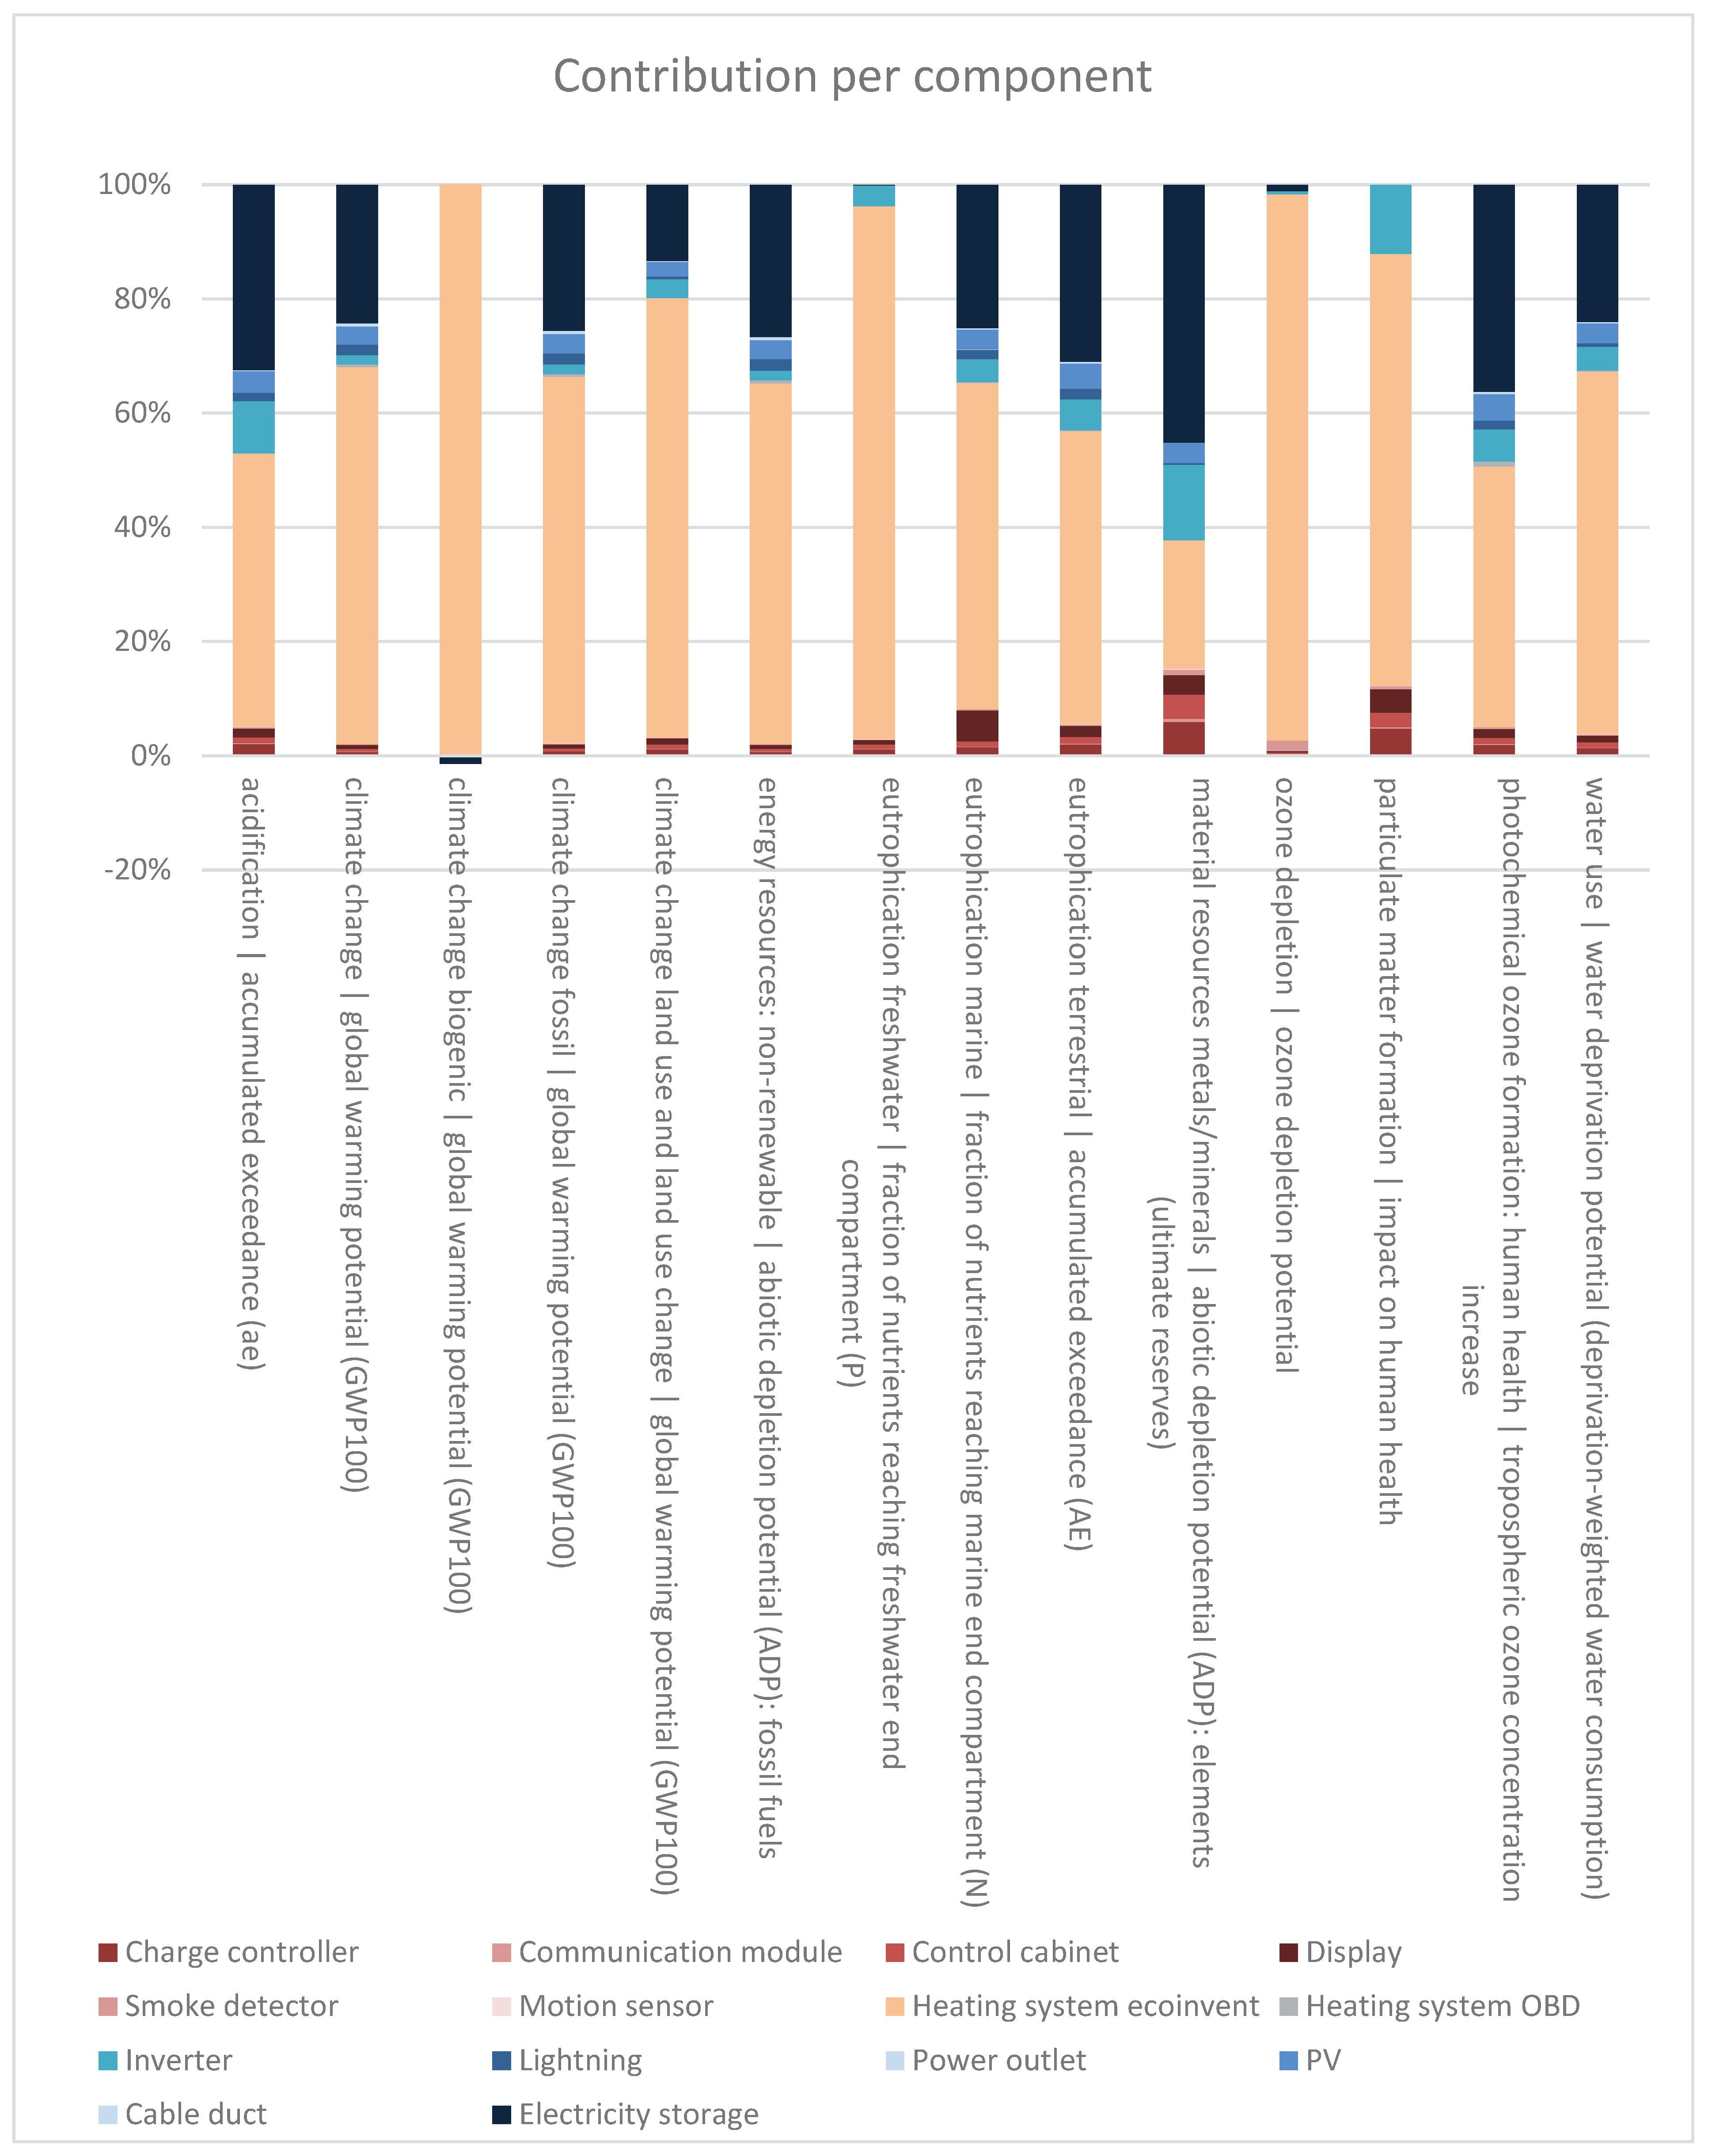
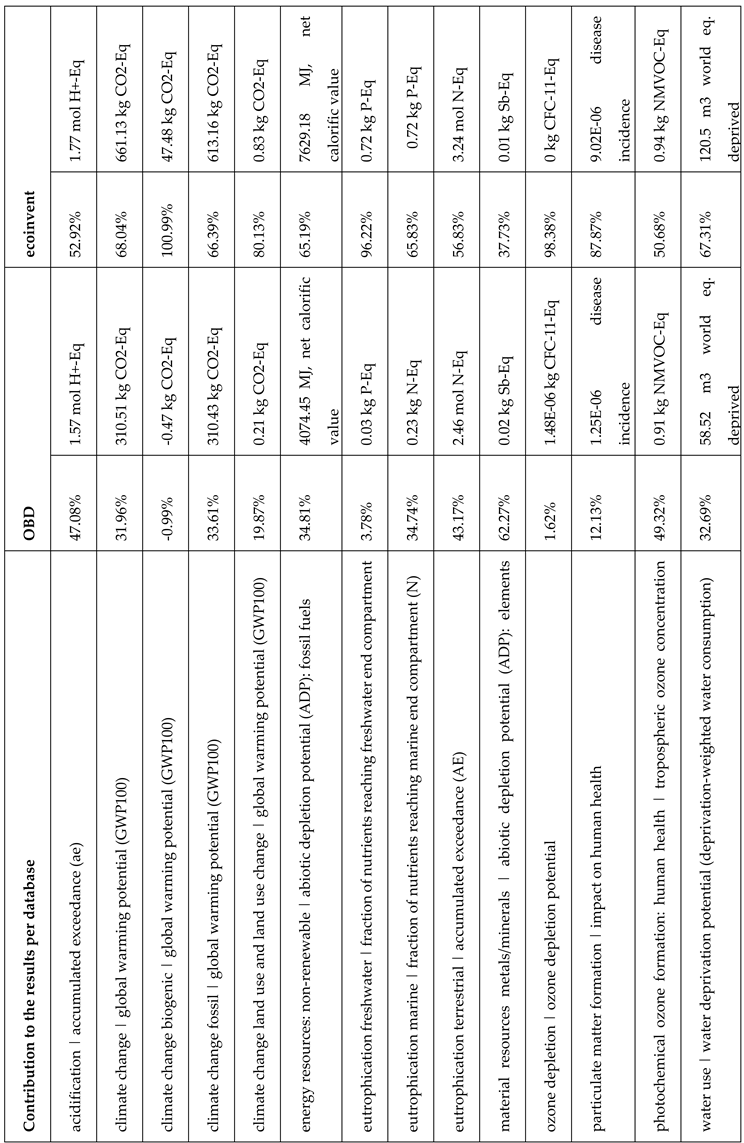
The heating system is the largest contributor across all impact categories. It consists of data from the OBD and the ecoinvent database. The analysis shows that the underfloor heating system accounts for 0.5% and the heat pump for 65.3% of the GWP100 total. Almost all of the contributions to the GWP100 from the heating system are derived from ecoinvent data. A similar pattern is observed in other impact categories, which is why an increased share of the contribution from ecoinvent data is visible. The contribution of each database to the results per impact category is displayed in Table II.
Table 2.
Contribution of ecoinvent and OBD data to the results.
The heating system contributes the most to all impact categories, which is why its data quality is analysed in more detail. Since that the seasonal performance factor of the heat pump in ecoinvent, which is 2.8, is from 1998, this will result in an overestimation of the share of the heating system. Additionally, the data quality of the heat pump is influenced not only by the temporal accuracy, but also by assumptions for the electricity demand. For the heat pump, the assumed self-sufficiency ratio of 25% is likely to be higher due to the large electricity storage. This would decrease the impact resulting from the grid electricity consumption of the heat pump. Due to the highly uncertain electricity consumption of the users, which is excluded in this example, PV electricity may be unavailable for heat pump operation. Therefore, a self-sufficiency ratio of 25% of the heat pump is assumed to be sufficiently valid. The data quality of assumptions from the electricity demand and the temporal accuracy of the heating system datasets from OBD and ecoinvent are sufficiently illustrating this example of process-based and emission factor databases in one LCA calculation.
One component is examined in detail to exemplarily assess the precision of the method. The original ecoinvent dataset of the Lithium iron phosphate (LiFePO4) battery (per 1kWh storage); 1kWh storage capacity is compared to the results in the Activity Browser, because it contributes significantly to the results of the example. The results in the Activity Browser are generated by using the method described above and deviate from the original ones in the range of 10-5 to 10-9 depending on the impact category. The deviation per impact category is displayed in Table III with the impact categories underlined where a balancing mechanism is performed. The highest deviation in percent from the absolute values is 0.8% for the ozone depletion followed by 0.003% for eutrophication: freshwater. The lowest deviation from the absolute results is 9.7 10-12 for the energy resources: non-renewable, whereas all other results deviate in the range of 10-8 and 10-9.
Table 3.
Deviation of results in absolute values displayed in the Activity Browser from the original OBD datasets with the impact categories underlined where a balancing mechanism is performed.5.
Table 3.
Deviation of results in absolute values displayed in the Activity Browser from the original OBD datasets with the impact categories underlined where a balancing mechanism is performed.5.
| Deviation of results displayed in the Activity Browser from the original OBD datasets of the product Lithium iron phosphate (LiFePO4) battery (per 1kWh storage); 1kWh storage capacity | |
| acidification | accumulated exceedance (ae) | 7.2 E-08 |
| climate change | global warming potential (GWP100) | 2.7 E-05 |
| climate change biogenic | global warming potential (GWP100) | 3.4 E-09 |
| climate change fossil | global warming potential (GWP100) | 2.7 E-05 |
| climate change land use and land use change | global warming potential (GWP100) | 3.9 E-09 |
| energy resources: non-renewable | abiotic depletion potential (ADP): fossil fuels | 3.8 E-08 |
| eutrophication freshwater | fraction of nutrients reaching freshwater end compartment (P) | 2.7 E-08 |
| eutrophication marine | fraction of nutrients reaching marine end compartment (N) | 5.1 E-09 |
| eutrophication terrestrial | accumulated exceedance (AE) | 6.1 E-09 |
| material resources metals/minerals | abiotic depletion potential (ADP): elements (ultimate reserves) | 1.5 E-08 |
| ozone depletion | ozone depletion potential | 1.1 E-08 |
| photochemical ozone formation: human health | tropospheric ozone concentration increase | 3.1 E-08 |
| water use | water deprivation potential (deprivation-weighted water consumption) | 5.4 E-08 |
The deviation of the results being in the range of 10-8 for the impact categories with a balancing mechanism suggest that the mechanism does not affect result precision. The GWP100 total as well as the GWP100 fossil show the lowest precision of all impact categories. The GWP100 total is calculated by summing up GWP100 biogenic, GWP100 fossil and GWP100 land use and land use change, which is why the lowest precision of all summands determines the precision of the GWP100 total. After analysing the code importing the data in Brightway, the data is given with a much higher precision to Brightway than shown in Table III. Additionally, Brightway does not round when importing data. The only case, where Brightway is rounding to at least one decimal point, is the export of data to the Ecospold1 XML format (Brightway Developers 2024). This means that the pandas library is decreasing the precision when handling .csv data formats, which has been reported in the Stackoverflow forum (Stackoverflow 2022). In general, these differences in LCA calculations are neglectable. The results displayed in the Activity Browser represent the original OBD datasets with sufficient precision.
This example shows the simple use of a conventional process-based database, the ecoinvent database, together with an emission factor database, the OBD, in one LCA calculation. The presented methodology is used to import the OBD database in the LCA program, the Activity Browser, to calculate an LCA using data from OBD and ecoinvent simultaneously. The supplementary information includes the structure of the exemplarily activity of the product “cable duct” as well as the database of all proxies including their calculations in the Activity Browser.
This demonstration confirms that the method is technically feasible and operational within existing LCA software, providing a foundation for discussing advantages and limitations.
4. Discussion: Practical Implications and Limitations of the Method and the Example
The following sections first highlight the method’s practical implications, particularly in integrating EPD databases such as the OBD with conventional LCI data sources, before addressing limitations and user considerations.
4.1. Advantages and Challenges of Integrating the OBD Database in LCA
The integration of the OBD database as an example using proxies allows the integration of OBD products in LCA with products from other process-based databases such as the ecoinvent database. This increases user-friendliness as only one LCA modelling and calculation is required when using emission factors without process-based information and databases with process-based information. In addition, a lot of other data, e.g. from EPD databases such as OBD, are easily available for LCA calculations.
To facilitate the utilisation of OBD, it would be beneficial to improve certain aspects of the database. Enhancing the user-friendliness of the OBD could be achieved by providing standardised textual descriptions of end-of-life scenarios, data gaps and of EPD system boundaries including impact categories. Firstly, the impact categories that must be used when publishing an EPD in accordance with EN 15804 must originate from the European Commission’s EF methodology. However, the version of the EF is not indicated. It is therefore necessary to request the EF version of the EPD before integrating the data into the LCA. Secondly, an issue of utilising our method for the OBD database is observed when importing OBD data. Numerous ways of indicating data gaps or data outside the system boundaries exist, such as NaN or 0. For OBD users this supplementary information might be crucial, but increases the effort of digital data management. Furthermore, the OBD database provides not only LCIA results but also end-of-life scenarios, which make the import progress more challenging. These scenarios cannot be immediately identified, since the names of the scenarios vary considerably. Data preprocessing is inevitable due to end-of-life scenarios and the form of storing data gaps. Provided textual information about impact category versions, EPD system boundaries and end-of-life scenarios would reduce the effort required for data processing and would ensure the provision of transparent information. Nevertheless, these issues come from the data quality of the raw data and do not hinder in applying the methodology.
4.2. Limitations Due to Missing Background Information on Emission Factors
Although the presented method enables emission factors to be used in LCA, it cannot address their most significant limitation: missing data transparency. The lack of transparency in the process structure prevents an assessment of the quality of the data. Consequently, the quality of the emission factors is unclear and modelling errors and inaccurancies cannot be detected. The lack of transparency, especially due to missing process-based background information, is a general issue even when utilising EPD as a standardized and validated data source as Strazza et al. (2016) also mention and cannot be solved with this methodology. As Mendoza Beltran et al. (2020) demonstrate, background information can be highly relevant, particularly in the context of changes in the electricity mix within an electricity-intensive production process. Due to missing process-based background data in the example, performing a contribution analysis using the OBD results in the Activity Browser does not display any contributions for the OBD data. This is due to the absence of process information in emission factor databases such as the OBD and will happen for any other emission factor database as well. In order to make such emission factor databases without process information available in the LCI, proxies are used to assign a representative ecosystem flow to each emission factor in the LCI. This representative ecosphere flow functions solely as placeholder and does not represent interpretable content. Furthermore, a contribution analysis for multiple products from emission factor databases within a single LCA model is feasible. A contribution analysis would at least indicate the share of impacts attributable to a single emission factor, even though process-based information is not available. A Monte Carlo Simulation to assess the uncertainty of the LCA is infeasible, because emission factor databases lack uncertainty information. To mitigate the risk arising from the lack of transparency of emission factors, only validated LCA data, such as EPD data, should be imported. Additionally, it is essential that emission factors are updated regularly, and that the most up-to-date emission factor data is employed. Even though the analysis of results is limited, the utilisation of emission factor data instead of generic process-based data can even be more accurate when current and manufacturer-specific data, for example as EPD, is utilised.
4.3. Significance of User Awareness When Applying the Method
Several key considerations for users emerge from the application of the method. Expert users must critically evaluate their LCA models when integrating multiple data sources to achieve reliable results. As Valente et al. (2024) point out, that technical barriers such as differences in structure and nomenclature, including varying names for processes, units, LCIA methods, and characterisation factors, have the potential to hinder interoperability between databases (Valente et al. 2024). Beyond this, disparities in modelling approaches, system boundaries, and allocation methods can result in duplication and inconsistency if data quality is not systematically evaluated (Bauer et al. 2013). When expert users properly address these challenges in their LCA models, the selective integration of multiple databases to fill specific data gaps can improve the completeness and robustness of LCA results.
Expert users benefit from the proposed method's single integrated result compared to existing dual-output approaches but must comprehend the constraints in the hotspot analysis due to absent process-based background information. However, the analysis functions remain fundamentally constrained because EPDs contain aggregated emission factors. These emission factors lack process-based background data, which is needed for detailed contribution analysis. This limitation extends beyond our specific approach and affects all approaches that rely on emission factors rather than detailed process-based data, requiring expert user awareness when interpreting results.
In addition, the proposed method of integrating emission factors into LCA allows the utilisation of any impact assessment method within the LCIA, which is incorrect. Emission factors are LCA results that are clearly linked to one particular impact category. When another impact category is used when making available emission factors in LCA programs employing the proposed method, it results in incorrect values. The consistency between impact categories of providing emission factors and integrating them as data source in LCA has already been discussed by Strazza et al. (2016). The presented method employs the use of a proxy to assign a substitute ecosphere flow to every emission factor in the LCI. This ecosphere flow is an artificial construct that serves solely as a workaround to make data available. This fictitious ecosphere flow enables the application of any available impact category for result calculation, but only one is correct. The impact category used for the data provision of emission factors must be the same as the one used for the data integration in LCA. As an example, our method allows the calculation of OBD results using GWP100 after IPCC 2021, which is an incorrect approach given that the OBD is only valid for GWP100 total after EF 3.0, EN15804. Users must be aware that this method is only applicable for corresponding impact categories.
Additionally, users need to take into account, that not all environmental impact categories are mandatory in the EPD. In the provided example of the OBD, some OBD datasets lack impact categories. These should be left out in the results, as demonstrated in the example in chapter 3.2. This results in a lack of information in a maximum of 7 out of 19 impact categories. Users must evaluate whether the more specific EPD data outweighs the lack of information in the additional impact categories. In general, user awareness avoids application errors and ensures the great benefit through providing usable emission factor data.
4.4. General Applicability and Flexibility of the Method
Additionally, our approach offers the benefits of its general validity and providing access to more specific data. In addition to regional data, the LCA can also integrate supplier-specific data from and for environmental reporting. As illustrated in the example, the OBD provides more specific and regional data for the calculation of environmental impacts. Such data can be utilised with low effort by employing the proposed methodology and integrating it into the Brightway and Activity Browser structure. The available data can help to fill data gaps and to use more suitable data, which increases the quality of the results.
Furthermore, by the general validity of this approach the method is not restricted to a specific set of data sources, emission factors or LCA programs. It permits the general integration of LCA emission factors in the form of impact category results without process-based background data into LCA. The approach is not limited to the previously presented example of the OBD integration; however, this example provides a foundation for integrating additional emission factors into general LCA software. Accordingly, the CSV file of the OBD, which is read by the Python code to integrate it into Brightway, could serve as a template for the inclusion of further EPD data. The code provided allows for the integration of all environmental declarations with results for the impact categories as specified in EN 15804. It is sufficient to modify the emission factor numbers and names in order to integrate other EPDs using the same impact categories as the OBD. When integrating emission factors with other impact categories, it is essential to modify the configuration file, including proxies and the balancing mechanism, in accordance with the outlined method. To calculate the proxies and implement the balancing mechanism, it is necessary to know all of the characterisation factors within the impact assessment method. Therefore, this approach is universally applicable. Users may employ this method to transform any database into a format readable by any LCA program allowing the integration of emission factors into the software.
5. Conclusions: Recommendations and Outlook
The presented method can be used to fill data gaps in LCAs with emission factors when LCI databases do not provide the necessary information. Unlike earlier methodologies, the presented methodology employs the LCA program structure, which facilitates the processing of LCIA results. Earlier methods require post-processing of the results, as the program displays two separate results. The method under discussion here implements the emission factor databases in an earlier LCA calculation step, the LCI, and leaves the LCIA with its impact categories unchanged. This allows the results of emission factor databases and conventional process-based databases to be summed up by the program, thus producing a single result for each LCA calculation. This method provides the distinct advantage of simplifying the evaluation of results and has a wide applicability. Furthermore, it offers access to more specific data; for example, it allows supplier-specific data to be integrated into LCA. Its validity is also not restricted to a specific set of data sources.
User awareness is a critical aspect to consider when implementing this method. Users must be aware of the impact assessment method they utilise, as using any impact assessment method within the LCIA is incorrect. Users should be informed that not all environmental impact categories are mandatory in the EPD and must therefore be excluded from the results if they have not been reported in the EPD. Additionally, the absence of process-based background information in EPDs leads to a constrained contribution analysis and an inability to conduct an uncertainty assessment. It is essential for users to be aware of the absence of process-based background data and the impact assessment method that has been selected.
The method is not limited to a specific example and allows for the integration of any emission factor data without process-based background information in LCA programs. The open-source code will contribute to an increase in the number of users and support other milestones, enhancing data availability in LCA.
Supplementary Materials
The following supporting information can be downloaded at the website of this paper posted on Preprints.org.
Author Contributions
Conceptualization: Vanessa Schindler; Methodology: Vanessa Schindler, Moritz Kohlhase; Formal analysis and investigation: Vanessa Schindler; Writing - original draft preparation: Vanessa Schindler, Moritz Kohlhase; Writing - review and editing: Heidi Hottenroth, Ingela Tietze, Resources: InvestBW.
Funding
This work was supported by InvestBW.
Data Availability Statement
The code supporting the findings of this study is openly available in two GitHub repositories: Finding unique biosphere flows of an impact assessment method: https://github.com/Vanessa-IREES/Finding-unique-biosphere-flows.git Integrating emission factors in LCI databases – brightway-ef4lca: https://github.com/Vanessa-IREES/brightway-ef4lca.git
Acknowledgements
All authors contributed to the study's conception and design. Material preparation, data collection and analysis were performed by Vanessa Schindler and Moritz Kohlhase. The first draft of the manuscript was written by Vanessa Schindler and Moritz Kohlhase and review and editing by Heidi Hottenroth and Ingela Tietze. All authors commented on previous versions of the manuscript. The authors gratefully acknowledge the support of Prof. Dr. Tobias Viere, whose supervision was instrumental throughout the development of this study. The authors acknowledge that a preprint version of this manuscript is available at Preprints.org (DOI: 10.20944/preprints202505.0503.v1).
Conflict of Interest
The authors declare that they have no conflict of interest.
References
- Abu-Ghaida H, Ritzen M, Hollberg A, Theissen S, Attia S, Lizin S (2024) Accounting for product recovery potential in building life cycle assessments: a disassembly network-based approach. Int J Life Cycle Assess 29:1151–1176. [CrossRef]
- Baehr J, Zenglein F, Sonnemann G, Lederer M, Schebek L (2024) Back in the Driver’s Seat: How New EU Greenhouse-Gas Reporting Schemes Challenge Corporate Accounting. Sustainability 16:3693. [CrossRef]
- Bauer C, Hischier R, Mutel C, Nemecek T, Reinhard J, Vadenbo CO, Weidema BP, Wernet G (2013) Overview and methodology. Data quality guideline for the ecoinvent database version 3. The ecoinvent Centre, St. Gallen.
- Bee E, Prada A, Baggio P, Psimopoulos E (2019) Air-source heat pump and photovoltaic systems for residential heating and cooling: Potential of self-consumption in different European climates. Build Simul 12:453–463. [CrossRef]
- Brightway Developers (2024) bw2io.export.ecospold1 — Brightway documentation. https://docs.brightway.dev/en/latest/content/api/bw2io/export/ecospold1/index.html#module-contents. Accessed 20 Dec 2024.
- Bundesministerium für Wohnen, Stadtentwicklung und Bauwesen (2024) ÖKOBAUDAT. https://www.oekobaudat.de/. Accessed 22 Feb 2024.
- de Villiers C, La Torre M, Molinari M (2022) The Global Reporting Initiative’s (GRI) past, present and future: critical reflections and a research agenda on sustainability reporting (standard-setting). Pacific Accounting Review 34:728–747. [CrossRef]
- Del Rosario P, Palumbo E, Traverso M (2021) Environmental Product Declarations as Data Source for the Environmental Assessment of Buildings in the Context of Level(s) and DGNB: How Feasible Is Their Adoption? Sustainability 13:6143. [CrossRef]
- Deutsches Institut für Normung (2022) DIN EN 15804:2022-03, Nachhaltigkeit von Bauwerken_- Umweltproduktdeklarationen_- Grundregeln für die Produktkategorie Bauprodukte; Deutsche Fassung EN_15804:2012+A2:2019_+ AC:2021.
- ECO Platform (2025) ECO PORTAL - Eco Platform en. https://www.eco-platform.org/epd-data.html. Accessed 11 Aug 2025.
- ecoinvent (2023) Releases Overview. https://support.ecoinvent.org/releases-overview. Accessed 28 Oct 2024.
- Emara Y, Ciroth A (2014) The database ÖKOBAU.DAT in openLCA and SimaPro. https://nexus.openlca.org/ws/files/8051. Accessed 21 May 2024.
- European Commission (2021) Commission Recommendation (EU) 2021/2279 of 15 December 2021 on the use of the Environmental Footprint methods to measure and communicate the life cycle environmental performance of products and organisations.
- European Commission, Joint Research Centre (2021) Level(s) indicator 2.1: Bill of Quantities, materials and lifespans. https://susproc.jrc.ec.europa.eu/product-bureau/sites/default/files/2021-01/UM3_Indicator_2.1_v1.1_34pp.pdf. Accessed 17 Oct 2024.
- European Parliament and Council (2022) Directive (EU) 2022/2464 of the European Parliament and of the Council of 14 December 2022 amending Regulation (EU) No 537/2014, Directive 2004/109/EC, Directive 2006/43/EC and Directive 2013/34/EU, as regards corporate sustainability reporting (Text with EEA relevance).
- Figl H, Kusche O (2023) ÖKOBAUDAT-Handbuch Technisch/formale Informationen und Regeln zur ÖKOBAUDAT-Datenbank Version 2.1. https://www.oekobaudat.de/fileadmin/downloads/2023-11-20_OEBD-Handbuch_v2.1_Red_2023-12-18.pdf. Accessed 8 Jul 2024.
- Fraunhofer ISE (2024) Photovoltaics Report. In: Fraunhofer-Institut für Solare Energiesysteme ISE. https://www.ise.fraunhofer.de/de/veroeffentlichungen/studien/photovoltaics-report.html. Accessed 28 Oct 2024.
- Fritz MMC, Schöggl J-P, Baumgartner RJ (2017) Selected sustainability aspects for supply chain data exchange: Towards a supply chain-wide sustainability assessment. Journal of Cleaner Production 141:587–607. [CrossRef]
- Greenhouse Gas Protocol (2016) Global Warming Potential Values. https://ghgprotocol.org/sites/default/files/ghgp/Global-Warming-Potential-Values%20%28Feb%2016%202016%29_1.pdf. Accessed 12 Apr 2024.
- Hauschild MZ, Rosenbaum RK, Olsen SI (2017) Life Cycle Assessment: Theory and Practice. Springer.
- Heijungs R (2022) The revised mathematics of life cycle sustainability assessment. Journal of Cleaner Production 350:131380.
- Intergovernmental Panel on Climate Change (IPCC) (2021) IPCC Emissions Factor Database | GHG Protocol. https://ghgprotocol.org/Third-Party-Databases/IPCC-Emissions-Factor-Database. Accessed 10 Jun 2024.
- International Organization for Standardization (2023) ISO 14068-1:2023(en) Climate change management — Transition to net zero — Part 1: Carbon neutrality.
- International Organization for Standardization (2006a) ISO 14025:2006(en) Environmental labels and declarations.
- International Organization for Standardization (2018) ISO 14067:2018(en) Greenhouse gases — Carbon footprint of products — Requirements and guidelines for quantification.
- International Organization for Standardization (2006b) ISO 14040:2006(en) Environmental management — Life cycle assessment — Principles and framework.
- International Organization for Standardization (2006c) ISO 14044:2006(en) Environmental management — Life cycle assessment — Requirements and guidelines.
- International Standardization Organization (2006) ISO 14025:2006 - Environmental labels and declarations.
- Meinrenken CJ, Chen D, Esparza RA, Iyer V, Paridis SP, Prasad A, Whillas E (2020) Carbon emissions embodied in product value chains and the role of Life Cycle Assessment in curbing them. Sci Rep 10:6184. [CrossRef]
- Mendoza Beltran A, Cox B, Mutel C, van Vuuren DP, Font Vivanco D, Deetman S, Edelenbosch OY, Guinée J, Tukker A (2020) When the Background Matters: Using Scenarios from Integrated Assessment Models in Prospective Life Cycle Assessment. Journal of Industrial Ecology 24:64–79. [CrossRef]
- Mutel C (2017) Brightway: An open source framework for Life Cycle Assessment. Journal of Open Source Software 2:236. [CrossRef]
- Science Based Targets initiative (SBTi) (2024) SBTi CORPORATE NET-ZERO STANDARD.
- Stackoverflow (2022) Pandas read csv file with float values results in weird rounding and decimal digits. In: Stackoverflow. https://stackoverflow.com/questions/47368296/pandas-read-csv-file-with-float-values-results-in-weird-rounding-and-decimal-dig? Accessed 24 May 2024.
- Steen B, Carlson R, Löfgren G (1995) SPINE. A Relation Database Structure for Life Cycle Assessments.
- Steubing B, de Koning D, Haas A, Mutel CL (2020) The Activity Browser — An open source LCA software building on top of the brightway framework. Software Impacts 3:100012. [CrossRef]
- Strazza C, Del Borghi A, Magrassi F, Gallo M (2016) Using environmental product declaration as source of data for life cycle assessment: a case study. Journal of Cleaner Production 112:333–342. [CrossRef]
- The pandas development team (2020) Pandas.
- Umweltbundesamt (2022) CO2-Emissionsfaktoren für fossile Brennstoffe: Aktualisierung 2022. Dessau-Roßlau.
- Valente A, Vadenbo C, Fazio S, Shobatake K, Edelen A, Sonderegger T, Karkour S, Kusche O, Diaconu E, Ingwersen WW (2024) Elementary flow mapping across life cycle inventory data systems: A case study for data interoperability under the Global Life Cycle Assessment Data Access (GLAD) initiative. Int J Life Cycle Assess 29:789–802. [CrossRef]
- Weidema B, Bauer C, Hischier R, Mutel C, et al., The ecoinvent Centre (2013) Overview and methodology. Data quality guideline for the ecoinvent database version 3.
- World Resources Institute and World Business Council, for Sustainable Development, GHG Protocol Initiative Team (2004) The Greenhouse Gas Protocol - A Corporate Accounting and Reporting Standard.
- Zargar S, Yao Y, Tu Q (2022) A review of inventory modeling methods for missing data in life cycle assessment. Journal of Industrial Ecology 26:1676–1689. [CrossRef]
- Zhang X, Heeren N, Bauer C, Burgherr P, McKenna R, Habert G (2024) The impacts of future sectoral change on the greenhouse gas emissions of construction materials for Swiss residential buildings. Energy and Buildings 303:113824. [CrossRef]
| 1 | This database is provided by the German Federal Ministry for Housing, Urban Development and Building at no cost. https://www.oekobaudat.de/en/service/downloads.html
|
| 2 | |
| 3 | |
| 4 | Please note, that the OBD version from 2023 has been used. |
| 5 | Please note, that the OBD version from 2023 has been used. |
Disclaimer/Publisher’s Note: The statements, opinions and data contained in all publications are solely those of the individual author(s) and contributor(s) and not of MDPI and/or the editor(s). MDPI and/or the editor(s) disclaim responsibility for any injury to people or property resulting from any ideas, methods, instructions or products referred to in the content. |
© 2025 by the authors. Licensee MDPI, Basel, Switzerland. This article is an open access article distributed under the terms and conditions of the Creative Commons Attribution (CC BY) license (http://creativecommons.org/licenses/by/4.0/).
Copyright: This open access article is published under a Creative Commons CC BY 4.0 license, which permit the free download, distribution, and reuse, provided that the author and preprint are cited in any reuse.


