Submitted:
29 January 2025
Posted:
30 January 2025
You are already at the latest version
Abstract
The AEC’s resource consumption and environmental impact necessitate a shift towards sustainable, circular practices. Building Information Modeling, powered by information technology, serves as a key enabler in this transition, offering lifecycle data management capabilities from design to deconstruction. However, current BIM models lack embedded lifecycle and circularity data, limiting their effectiveness for sustainability integration. This study addresses this gap by proposing a BIM Object Library Framework that embeds lifecycle, cost, and circularity data into objects and aims at enabling informed, sustainability-driven decision-making. Through a proof of concept, the research demonstrates how embedding LCA and CE metrics into BIM objects enhances environmental and circular impact assessments. The framework aligns with standards such as ISO 14040 and EN 15804, EU Level(s) and United Nations’ 2030 Agenda for Sustainable Development. Limitations such as data integration complexity and the need for specialized expertise occurred. However, this framework provides a scalable foundation for future research, including automating data integration, enhancing metric calculations, developing interactive circularity dashboards to improve as a decision-support tool. This study advances circular BIM adoption, integrating sustainability principles into digital design workflows from the object level, while serving as a centralized repository for sustainability-driven decision-making.
Keywords:
BIM
; LCA
; Circular Economy
; BIM Object Library
; Sustainable Construction
; Environmental Impact Assessment
1. Introduction
The construction industry, as one of the largest global consumers of resources, is under increasing pressure to adopt sustainable practices that address the environmental impacts of buildings throughout their lifecycle. Climate change, resource scarcity, and the need to minimize waste have driven the industry to explore a transition to circular economy (CE) principles. CE represents a shift from the linear “take, make, dispose” model toward a regenerative model that promotes resource efficiency, minimizes waste, and encourages the reuse and recycling of materials. Central to this paradigm shift is Building Information Modeling (BIM), that has become a valuable tool for enhancing collaboration, efficiency, and data management throughout the building lifecycle, from early design stage (EDS) and construction to operation and end of life (EoL). Despite BIM’s transformative potential, however, the integration of sustainability and circularity measures within BIM models remains limited. Current BIM models and libraries are often designed to support general design and project management goals but lack the embedded data necessary for comprehensive environmental and lifecycle assessments (LCA). BIM Objects are defined as digital representations of physical building elements that include both geometric and non-geometric data as metadata, such as material properties, performance specifications, and manufacturer information [1]. They are fundamental elements in building information models, allowing for accurate design, analysis, and management of construction projects throughout their lifecycle [2]. Despite the advancements in BIM the literature reveals a palpable gap in studies that comprehensively address LCA and circularity measures and BIM processes or heterogeneous BIM data. Existing literature highlights this challenge, emphasizing the need for a holistic approach that combines BIM with LCA data and circularity metrics, allowing stakeholders to assess the environmental impacts of building materials and construction processes. Guignone et al. (2023) state 70% of research on BIM-LCA has been published recently, between 2020 and 2022, showing a significant interest surge, that the primary benefits of BIM-LCA integration are reducing manual data entry, enabling real-time evaluation, and enhancing decision-making. They also mention the lack of standardized methodologies and best practices across studies. Barriers include the complexity of tools, data interoperability issues, and the need for methodological standardization [3]. While market policy, technology-related barriers, and legal and institutional frameworks are the most significant obstacles to CE adoption in the construction industry [4].
Our study aims to address these critical gaps by proposing the development of a comprehensive, information-rich BIM object library framework, specifically tailored to support LCA and CE assessments. The proposed framework’s value lies in its alignment with ISO 14044 [5], EN 15804 [6], EN 15978 [7], and the EU Level(s) framework [8]. The paper is structured as follows. Literature Review, Research Design, Framework, BIM object library with embedded LCA and CE metrics, Proof of concept (PoC) and Results as validation of the framework. Ending with Discussion and Conclusion as a synthesis of insights from the application, findings, limitations, and directions for future research.
2. Literature Review
2.1. Circularity, Life Cycle Assessment and End of Life
An analysis on the application of the CE in the construction and building industry highlights the evolution of research trends and shows that the CE in construction is still an emerging field, with a growing interest from academics worldwide to help reduce greenhouse gas (GHG) emissions [9]. Particularly LCA is a crucial methodology for evaluating the environmental impacts of buildings, from raw material extraction to EoL disposal. Roberts et al. (2020) emphasizes the importance of integrating LCA from the EDS to ensure a comprehensive evaluation of a building’s environmental impact [10]. Häfliger et al. (2017) propose linking building material inventory data with environmental impact databases to improve LCA application [11]. The environmental burdens related to construction materials and operational phases [12], and LCA methodologies highlight the need for standardized data to predict and measure the impacts of EoL activities [13]. This need is reinforced by transparent data collection as fundamental to effective LCA. National and international standards, including Austrian Standards [14], ISO 14025 [15], and EN 15978 [7], provide specific EoL assessment guidelines for construction materials, establishing benchmarks for environmental performance. Additionally, EN 15804 [6] offers lifecycle impact assessment tools specifically for construction products, assisting in the evaluation of sustainability in material use. Yet, scholars identify the EoL phase as one of the most unsustainable parts of the building lifecycle, recommending design strategies like reuse and disassembly as necessary steps toward circularity in construction [16]. Akbarieh et al. (2020) support the global push for a unified BIM framework to facilitate sustainable EoL practices [17]. This aligns with design for deconstruction strategies that can improve EoL by planning for the reuse of building elements at the design stage [16]. Further, scholars suggest that integrating BIM at the project inception can yield a more seamless transition to sustainable EoL processes, supporting continuous data management for both physical and digital assets [18,19].
2.2. BIM, Not a Model but Heterogenous Data
Within the context of BIM, this transition requires to not only optimize building design and construction but also facilitate the integration of CE principles into digital models. However, BIM is not just a single, unified 3D-model. It consists of heterogeneous data from multiple sources, including graph-structured data such as Industry Foundation Classes (IFC), semi-structured data such as spreadsheet tables, plans and CAD drawings. As well as structured data like contracts, reports, or specifications, stored in text formats. Thus, BIM facilitates the integration and management of heterogeneous data throughout the entire lifecycle of a building.
2.3. Challenges in BIM-LCA Integration
BIM’s potential to foster environmentally responsible construction has captured the attention of scholars and industry professionals alike. Eastman et al. (2011) pioneered this discussion by outlining BIM’s capacity for improving efficiency and reducing waste during the construction phase [18,19]. Further works have built on this foundation, exploring BIM’s role in the broader context of sustainable design and LCA [18,20]. The potential for BIM to automate material quantification, thus facilitating more accurate and streamlined LCA needs to be also addressed [21]. However, the literature often reflects an underutilization of BIM for LCA, primarily due to the complexity of integrating environmental impact data [22]. For instance, showing how BIM can streamline the evaluation of life cycle costs and environmental performance of various infill materials, enabling more informed decisions during the planning phase [23]. Similarly, BIM-LCA integration is used to quantify the carbon emissions, identifying operational emissions, particularly from HVAC systems [24]. The bibliometric study by Mahmud et al. (2024) reveals the evolution and current trends in BIM-LCA research, emphasizing the growing need for interdisciplinary collaboration [25]. Moreover, the potential of BIM and LCA in reducing carbon emissions during the construction of prefabricated buildings, showcasing significant emission reductions must be highlighted [26]. The technological advancements and challenges in BIM-LCA integration, point out the necessity of overcoming software interoperability issues to fully realize the benefits of this combined approach [27]. The identification of information required for inclusion in BIM objects—whether at the project, element, or material level—to assess what data designers need to provide and what may already exist within the objects [28]. Incorporating environmental and economic data into the digital representation of products by manufacturers could facilitate automated Life Cycle Assessment (LCA) and Life Cycle Costing (LCC) analyses. However, certain data specific to each project can only be supplied by the designer, crucial for a complete LCA/LCC study. LCA studies can be categorized into three types: screening, simplified, and complete [29]. A complete LCA adheres to the framework outlined in ISO 14040:2006, involving a detailed evaluation of the environmental impacts of a building or product across its entire life cycle. Moreover, the importance of clearly defining the system boundaries as a critical aspect of any LCA has to be emphasized [30]. The data used for an LCA study can be classified into three categories: generic, average, or specific [31]. One proposal states that a BIM object should include data on the environmental impacts across the following categories for the A1–A3 lifecycle modules: acidification potential (AP), global warming potential (GWP), eutrophication potential (EP), abiotic depletion potential for materials (ADPM), abiotic depletion potential for fossil fuels (ADPE), photochemical ozone creation potential (POCP), ozone depletion potential (ODP), renewable energy use (PE-Re), and non-renewable energy use (PE-NRe) and its expected service life [28]. BIM holds significant potential for fostering sustainable construction by integrating environmental and economic data into digital models to streamline Life Cycle Assessment (LCA) and Life Cycle Costing (LCC), but challenges like software interoperability and project-specific data requirements must be addressed for full realization.
2.4. BIM for Circular Design and Material Reuse
Moreover, the concept of circularity has only recently begun to permeate BIM. Pomponi and Moncaster (2017) provided one of the first comprehensive discussions on the potential for BIM to support CE principles [32]. Recent literature explores various dimensions of BIM supporting CE. Studies focus on integrating CE with BIM to evaluate the detachability of building components [33]. Similarly, Askar et al. (2024) propose a conceptual framework in the role of BIM in supporting circularity that guides the development of BIM-based CE models, addressing challenges and barriers in automating circularity within BIM environments [34]. BIM-based sustainability assessment examines how BIM can be adapted to support CE, emphasizing the use of environmental product declarations (EPD) and Key Performance Indicators (KPI) within BIM models [35]. Further, the integration of circularity data in BIM through information delivery specifications (IDS), enables semi-automated compliance checking and addressing the need for consistent terminology [36]. Heisel and McGranahan (2024) highlight the importance of computational tools and circularity indicators (CI) in EDS, which are crucial for embedding circular design principles from the outset [37]. As the industry moves toward greater automation and standardization in CE, further work is needed to refine these models, ensure consistent data integration, and optimize the use of computational tools for embedding circular design principles early in the construction lifecycle.
2.5. Future Directions for Circularity in Construction
This evolving synergy between tools and CE holds great promise for promoting resource efficiency and sustainability in the built environment. Particularly, De Wolf et al. (2023) discuss LCA tools and databases, providing criteria for their characterization to support circularity frameworks like Level(s) [38]. Moreover, user-centric frameworks, early design tools, and characterisation frameworks for parametric building LCA tools enhance the usability and effectiveness of LCA in sustainable design practices [39,40,41]. Parametric approaches and structural optimization methods for sustainable construction design focus on environmental impacts and circularity [42]. Furthermore, Honic et al. (2023), Turan and Fernandez (2015) contribute to assessing material quantities, estimating material stock and flows, respectively, all of which are crucial aspects of incorporating such measures into sustainable construction practices [43,44]. Despite such work, there remains a gap in detailed explorations of how BIM can systematically incorporate circularity measures as a new dimension of BIM (8D) arises [45]. Research touches on the potential of BIM drivers but falls short in providing a framework for their development with a focus on sustainability as more studies call for standardization across BIM libraries to enhance their usability and reliability [46]. Accessibility and maintenance of BIM libraries have emerged as significant concerns. An exploration on the issues surrounding BIM library creation and the ongoing management, emphasizes the need for user-friendly platforms [47]. The challenges associated with keeping BIM objects up to date with current product specifications are ongoing, with solutions remaining elusive in the literature [48]. A proposal on future research to focus on further developing a material and component bank that links with BIM, to help in tracking the availability of reusable building elements and allow designers to check what components from deconstructed buildings are available for use in new projects [49]. The current state of research points towards an impending evolution of BIM capabilities to include robust LCA and CE measures [50]. For measuring circularity in BIM, it’s essential to specify information on material inputs and anticipated outputs, including the fraction of materials being biological, virgin resources, reused, or recycled. This data capture process aligns with the principles of life-cycle assessment indicators [51]. Despite this emphasis, there is a noticeable absence of specific data relating to these aspects within BIM objects. While existing literature acknowledges the importance of sustainable construction and environmental impact reduction, there is a lack of detailed insights into circularity, material reuse, and resource efficiency within BIM objects themselves, indicate a limited presence of specific data on these aspects. Specific details regarding circularity, material reuse, and resource efficiency within BIM objects appear to be scarce. For instance, the importance of CE models in construction but offer limited insights into the incorporation of circularity data within BIM data [36]. Similarly, sustainable construction through BIM-integrated LCA lacks explicit details on circularity data within BIM objects [52]. Furthermore, while advocating for common standards, many do not delve into specific circularity data integration within BIM objects.
2.6. Towards a Comprehensive Circular Strategy in the Construction Sector
To establish a CE within the construction sector, a comprehensive strategy is imperative, involving diverse measures such as advocating for policies favoring deconstruction and reuse over demolition, employing assessment methodologies like LCA, and ensuring accessible digital repositories like MPs to facilitate the reuse of building materials [53]. Further, identifying sustainability and circularity “hotspots,” guiding targeted improvements like using renewable materials, enhancing utility and durability, designing for disassembly, and ensuring building flexibility - together optimize circular performance and enable performance forecasting for similar structures [54]. Conducted interviews indicate that 83% of respondents believe that LCA information should be integrated into digital documentation. However, all respondents expressed concerns regarding its limited availability [44]. Furthermore, to compute circularity metrics effectively, comprehensive data on materials and products is imperative, sourced either from databases or MPs or digital product passports (DPPs) [55,56]. Valuable insights into the MP’s potential argue that MPs can serve as a crucial tool for achieving greater material efficiency and that they can play a pivotal role in the shift towards a more CE [57]. Furthermore, the operationalization of MPs within BIM environments integrating MPs into BIM can significantly streamline the process of documenting, accessing, and managing material-related information throughout the lifecycle of a building [58]. While there is consensus on the potential benefits, scholars are calling for concerted efforts to develop comprehensive and standardized BIM approaches that are equipped with detailed life cycle data. A further study explores the alignment between LCA and CE principles [59]. Here, the majority of LCA studies reviewed show limited incorporation of CE concepts, particularly in their goal setting, scope definition, and inventory data. Few LCA studies include CE-specific indicators in their impact assessments, sensitivity analyses, or conclusions. Only around 7% of studies (17 out of 237) offer comprehensive CE recommendations, meaning detailed suggestions for implementing CE practices. The manufacturing sector (22% of studies) and construction sector (21%) show above-average levels of documentation for integrating CE principles. However, the construction sector nonetheless performs poorly overall, with only 2% of its studies offering comprehensive CE-related recommendations. The lack of CE-specific data and recommendations, particularly in sensitive industries like construction, highlights the need for methodologies that not only assess environmental impacts but also actively support the transition to circular economic models [59]. Xue et al. (2021) provides a comprehensive analytical review focusing on the integration of BIM and LCA to promote CE principles. But the study highlights a scarcity of research integrating CE principles into BIM-based LCA, particularly concerning material reusability, recyclability, and EoL scenarios [52]. Challenges include the need for synchronized methodologies, comprehensive databases compatible with BIM, and seamless information exchange between BIM and LCA tools. Notably current BIM practices face inefficiencies, hindering the consideration of sustainability and CE during the design process. It is essential to understand the full impact of CE on greenhouse gas emissions and how digital tools, such as BIM, can better integrate with CE practices for advancing CE in construction [60].
In conclusion, while recent progress has been made in integrating LCA, CE principles, and BIM, further research is needed to fully harness BIM’s potential for fostering sustainable, circular construction. Efforts should focus on enriching BIM with comprehensive life cycle and circularity data, streamlining CE integration, and enhancing BIM’s accessibility and usability for LCA and CE assessments to mitigate climate change.
3. Research Design
We hypothesize that the lack of comprehensive data on lifecycle and circularity within BIM objects themselves presents a significant challenge in the pursuit of environmentally conscious practices. Without detailed information embedded directly in this level of BIM, stakeholders may struggle to effectively assess and implement CE principles, hindering progress towards a more sustainable built environment. Addressing this challenge is paramount for advancing the integration of life cycle and circularity data within BIM processes and heterogeneous BIM data ensuring the viability of future construction endeavors. Thus, the novel contribution of this research lies in the creation of a structured, data-rich BIM library framework that directly embeds LCA, cost and CE metrics into BIM objects, offering a practical tool for stakeholders to make informed, sustainability-driven decisions. This study builds upon ISO 14044, EN 15804, EN 15978, and the EU Level(s). By integrating LCA and CE data within BIM, this study provides a scalable framework ensuring that environmental and economic impacts are considered. The study addresses the following questions:
RQ1: How can an information-rich BIM object library support circularity and sustainability throughout the building lifecycle?
RQ2: What specific data does a BIM object library need to contain to enable assessment of life cycle impact and circularity?
The core of the study lies in leveraging BIM datasets, enriched with life cycle data and cost information. The research design, Figure 1, uses both a top-down and bottom-up approach to explore and validate the use of BIM for comprehensive LCAs and CAs. The top-down approach involves breaking down the BIM models into elements, such as material layers and building components, and enriching these elements with life cycle and cost data. These elements are stored in a BIM object library. The library serves as a repository that can later be used to supply different building designs. A bottom-up approach is applied, wherein a specific use case is modeled utilizing the BIM object library. The PoC tests and validates the BIM-based framework by conducting a comprehensive LCA and circularity assessment. This step demonstrates how effective the BIM objects and models are in representing scenarios and contributing to assessments. The framework is based on and adapted from: ISO 14044, for conducting LCAs, offering guidelines on how to quantify the environmental impacts of building materials and processes. EN 15804 and EN 15978, to measure and evaluate the environmental performance of building products and buildings. EU Level(s) Framework, for integrating CE principles, addressing key sustainability objectives such as minimizing waste, reducing resource use, and promoting adaptability and deconstruction. Through careful analysis, the framework aims to identify areas for potential improvement and informed decision making.
4. Framework
This framework aims at providing a scalable foundation for IT-driven sustainability assessments, model integration, and environmental impact analysis in construction The following sections outline the core components of the framework: Section 4.1 Data template forms the backbone of the framework, providing a detailed structure for capturing the necessary information to perform LCAs. The template aligns with established standards, Table 2, ensuring that the assessment is both comprehensive and relevant to real-world construction practices. Hence, Section 4.2 Key Metrics and Assessment outlines this key metrics used to assess building components across several dimensions, including geometric, environmental, and economic impacts. By calculating global warming potential (GWP), acidification potential (AP), and primary energy non renewable total (PENRT), the framework offers a clear understanding of the environmental burden. Additionally, it evaluates recycling and disposal potentials and includes cost analyses to ensure that economic factors are also considered alongside sustainability goals. This systematic approach allows for iterative improvements and informed decision making in building design.
Figure 2.
BIM Object Library Framework for Assessing Life Cycle Impact and Circularity Measures.
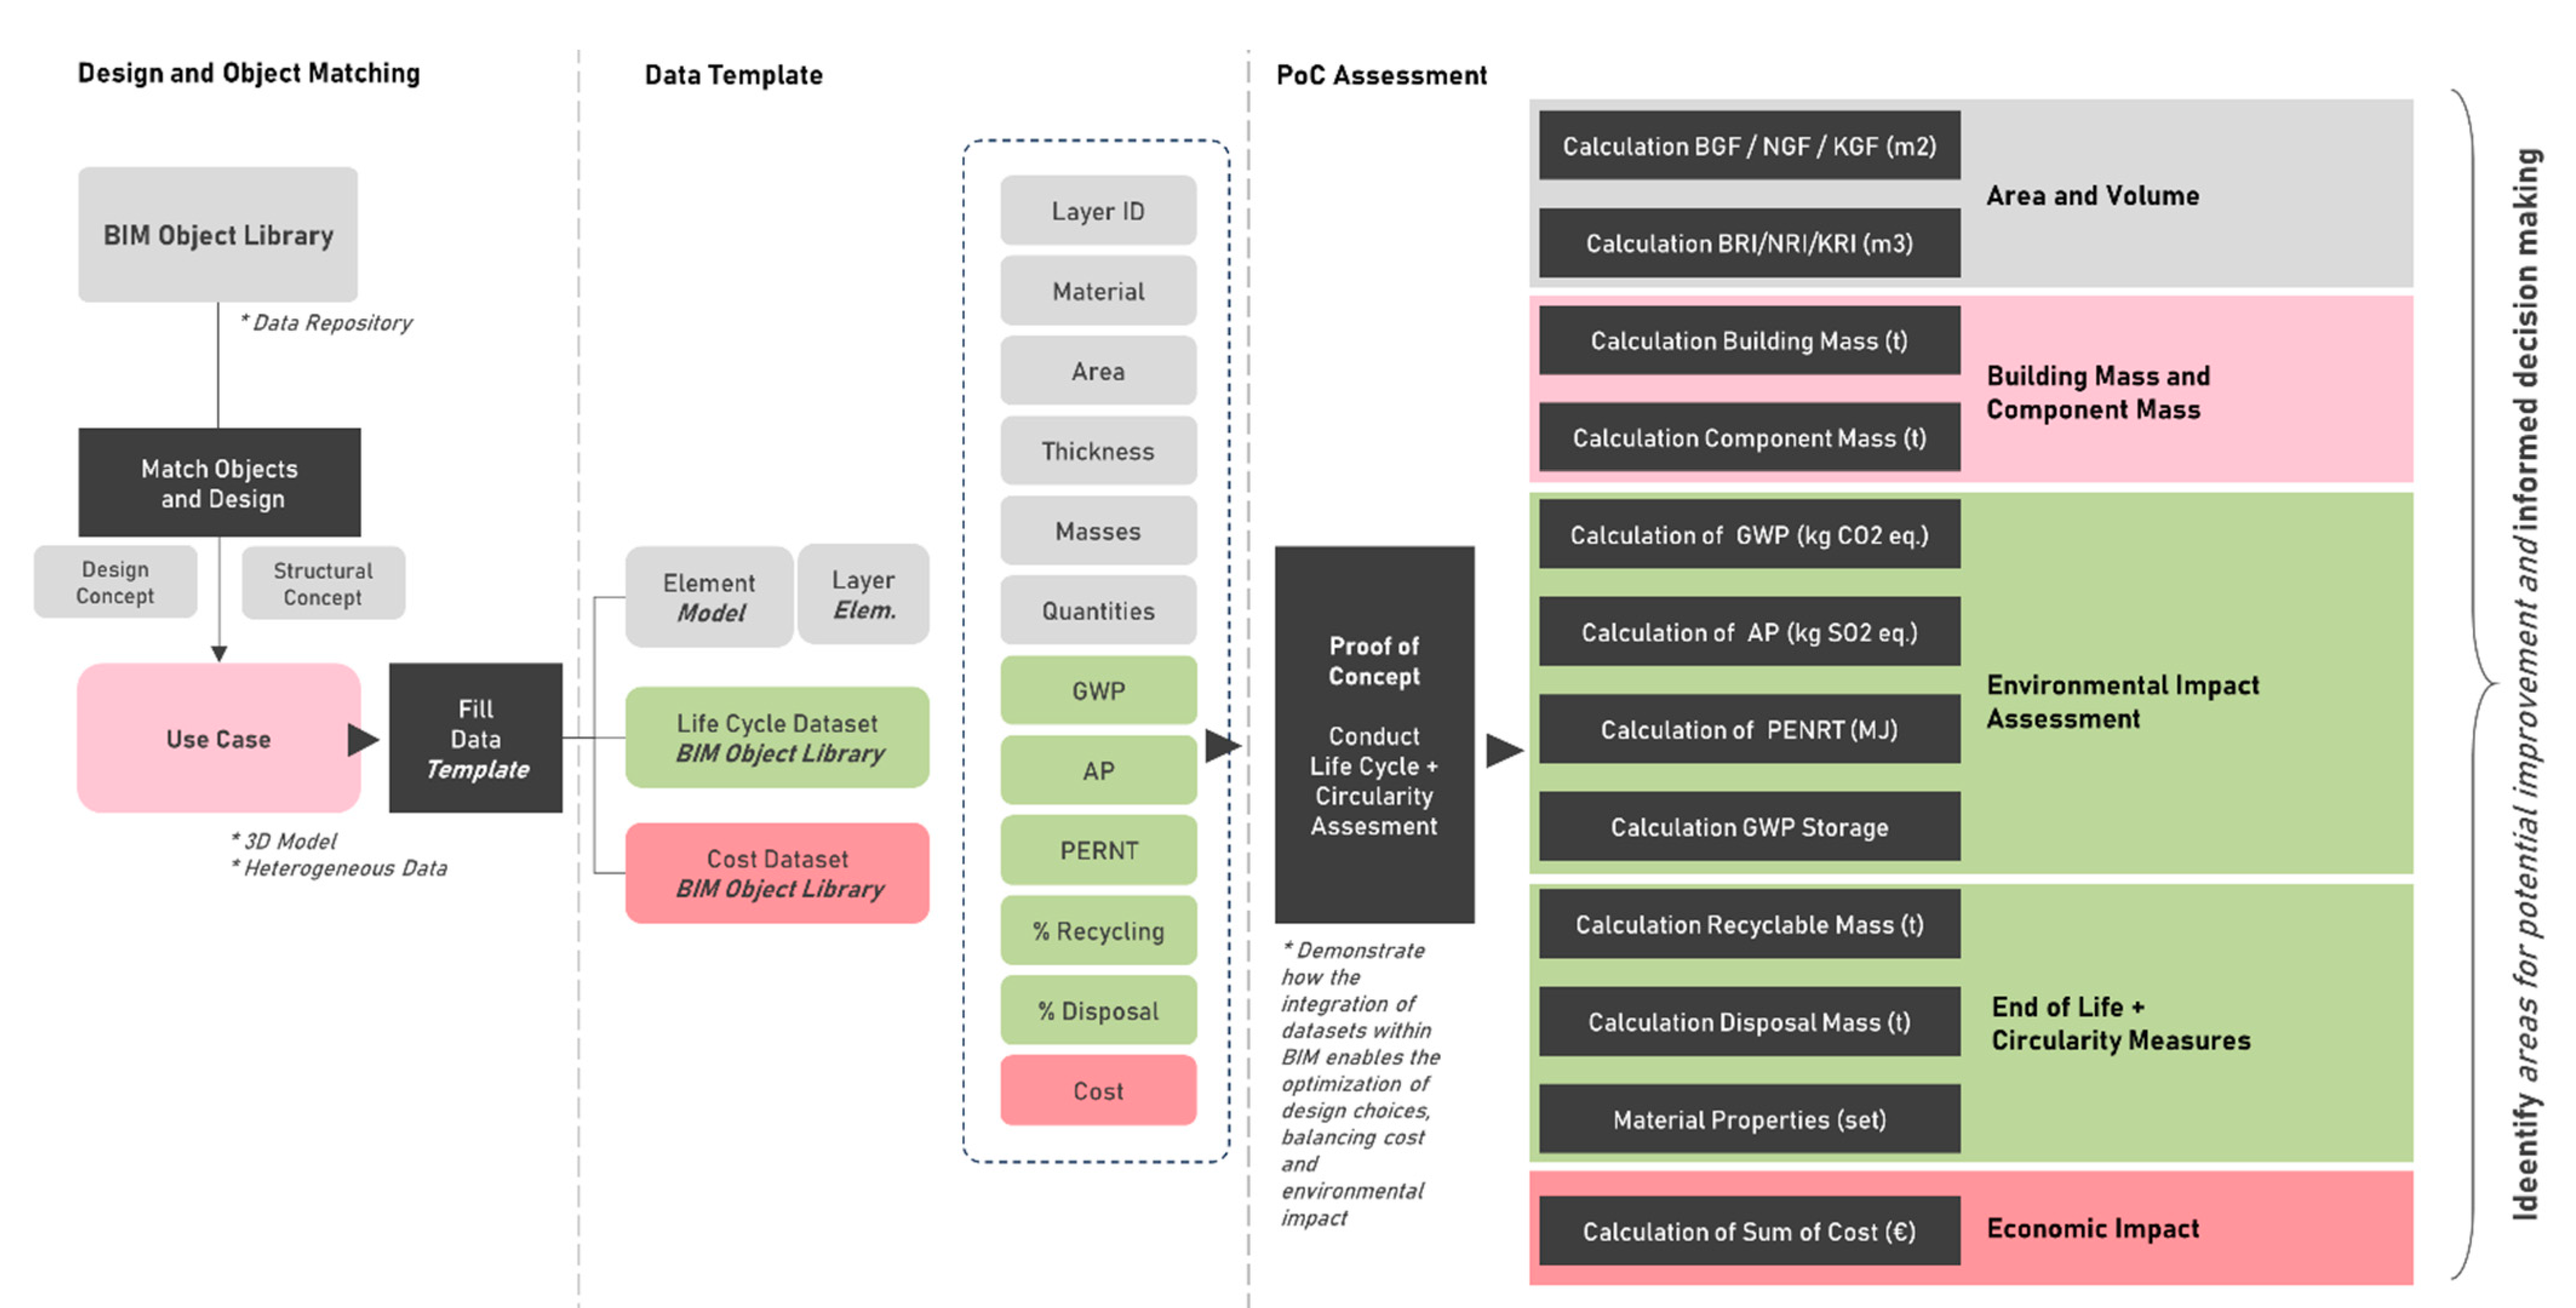
4.1. Data Template
The data template provides a detailed structure across several key areas, Table 1, such as: component information, material properties, environmental impact metrics, mass and environmental impact, waste and recycling potential, environmental impact at different stages and cost information.
4.2. Key Metrics and Assessment
This section outlines the key metrics (goal and scope, ÖNORM EN ISO 14040) to assess building components across several dimensions, including area and volume, calculating gross and net floor areas, as well as other spatial dimensions. Building mass and component mass, offering a detailed analysis of the materials used and their associated mass, allowing for the consideration of environmental impacts. Environmental impact assessment, quantifying critical environmental metrics such as GWP, AP and PENRT, while also analyzing biogenic CO2 storage capabilities. EoL and Circularity Measures, assessing recycling and disposal rates, material properties. Economic impact, calculating the costs associated with components and construction.

Table 2.
Key Metrics derived from Goal and Scope definition ÖNORM EN ISO 14040 and Assessment structured in Category, Calculation/Metric, Units, Relevant Standard/Framework and Reference Details.
Table 2.
Key Metrics derived from Goal and Scope definition ÖNORM EN ISO 14040 and Assessment structured in Category, Calculation/Metric, Units, Relevant Standard/Framework and Reference Details.
| Category | Calculation/Metric | Units | Relevant Standard/Framework | Reference Details |
| Area and Volume | Building Gross Floor Area (GFA) | m² | EN 15978 | Basis for functional units in building LCA calculations. |
| Net Gross Floor Area (NFA) | m² | EN 15978 | Supports defining the building scope in environmental assessments. | |
| Construction Gross Floor Area (CFA) | m² | EN 15978 | Used in establishing the functional and declared units for assessment. | |
| Gross Room Volume (GRV) | m³ | EN 15978 | Contributes to scope definition in whole-building environmental assessments. | |
| Net Room Volume (NRV) | m³ | EN 15978 | Supports calculations, aligning with EN 15978 system boundary. | |
| Construction Room Volume (CRV) | m³ | EN 15978 | Part of volume-based functional unit definitions within whole-building LCA. | |
| Building Mass and Component Mass | Total Building Mass | tons / kg | EN 15804, EN 15978 | Mass data used in building-level and component-level LCA stages. |
| Building Mass after 100 Years | tons / kg | EN 15978 | Relevant for assessing impacts over the life cycle and future material needs. | |
| Individual Component Masses | tons / kg | EN 15804 | Supports environmental assessments of specific materials and their life cycle impacts. | |
| Environmental Impact Assessment | GWP (Global Warming Potential) | kg CO₂ equivalent | ISO 14044, EN 15804, EN 15978, EU Level(s) | Core LCA metric for assessing climate impact across product and building levels. |
| AP (Acidification Potential) | kg SO₂ equivalent | ISO 14044, EN 15804, EN 15978 | Used in impact assessments to quantify acidification in product and building LCA. | |
| PENRT (Primary Energy Non-Renewable Total) | MJ | ISO 14044, EN 15804, EN 15978 | Reflects non-renewable energy use, integral in environmental impact analysis. | |
| GWP Storage | kg CO₂ equivalent | EN 15804, EU Level(s) | Assesses CO₂ sequestration potential within materials, contributing to GWP balance. | |
| EoL and Circularity Measures | Recyclable Mass | tons / kg | EN 15804, EN 15978, EU Level(s) | Critical for EoL analysis, assessing recyclability within LCA. |
| Disposal Mass | tons / kg | EN 15804, EN 15978 | Used to evaluate end-of-life disposal impacts and circularity metrics. | |
| Material Properties | descriptive | EN 15804, EU Level(s) | Describes attributes influencing circularity, EoL recovery, and reuse. | |
| Economic and Regulatory Impact | Cost | € | EN 15978, EU Level(s) | Supports life cycle cost (LCC) assessments and economic evaluations in LCA. |
5. Proof of Concept
In the following sections, the focus will shift to the PoC, firstly the BIM object library datasets: the digital model dataset, followed by an exploration of the lifecycle dataset and cost dataset. These datasets form the BIM object library, Figure 3. The three datasets consequently include geometric and material information on each component layer, enabling matching of objects and design and consequently resulting environmental and cost assessment in the LCA of the PoC.
5.1. Digital Model Dataset (Component Catalogue)
In this section, we emphasize the role of BIM as a platform for consolidating heterogeneous data. We present a synthetically generated dataset. This data has been self-created as part of a research-led teaching approach. This means that the dataset was not sourced from external repositories but was specifically developed for the purposes of this study. The origin of datasets is becoming increasingly important, especially in the context of data-driven approaches, the question often arises as to where the data used comes from and under what conditions it was collected. This aspect is particularly relevant, as the quality and availability of data have a direct impact on the validity and reproducibility of research outcomes. The process of model generation is an integral part of the dataset creation, which underscores the importance of the model generation step in this context. By choosing to create a synthetic dataset, we ensure control over data quality. Additionally, it guarantees that the dataset adheres to the requirements of this framework. This approach offers the advantage of avoiding potential biases from external datasets and provides a transparent, traceable research process. For the synthetically generated dataset, Figure 4, interdisciplinary student teams employed parametric design approaches for both architectural and structural designs, utilizing tools like Rhino 3D, Grasshopper, and Karamba 3D. These efforts were complemented by traditional building physics methods to determine preliminary building components and materials. Quality assurance was paramount, involving expert evaluations and thorough model checks using Solibri. This process resulted in the creation of eight distinct BIM models, which were refined and validated. The refined models were then stored as native models and Industry Foundation Classes (IFC) files for further processing. Further, we focus on the detailed analysis and validation of the eight generated BIM models. This process results in the selection of four models for further decomposition into individual building elements and components, while one model is reserved for future validation in the PoC. The selected models are decomposed into elements, such as walls, slabs, roofs, beams, columns, and foundations. Post-processing involves verifying the correctness, feasibility, and building physics of the components (in an Austrian context), making necessary adjustments to ensure compliance with all relevant standards. The validated components are compiled into a comprehensive component catalogue (spreadsheet-based repository), Figure 5.
5.2. Lifecycle Dataset
The Lifecycle Dataset provides crucial information for conducting a LCA and CA of the building, evaluating the environmental impact from material extraction to EoL. This section will describe how lifecycle data is collected and structured.
The lifecycle dataset leverages the baubook [61] platform, providing validated data on building materials and environmental indicators. This captures detailed lifecycle and circularity metrics at the material level for each component layer, ensuring a rigorous assessment of environmental impact. Key metrics are shown in Table 3 and support a comprehensive evaluation of each material’s environmental impact across emissions, energy use, waste, recyclability, and life span.
5.3. Cost Dataset
The Cost Dataset enables the evaluation of the building’s economic performance, providing insights into the financial viability. The cost dataset employs BKI data and refers to construction cost data provided by the Baukosteninformationszentrum Deutscher Architektenkammern GmbH (BKI) in Germany [62]. We determined the costs of individual component packages or layers, recorded at the component level and expressed as gross costs allocated to the component in terms of €/m². In this study, cost data from the BKI 2017 cost database was utilized as a foundational source. The cost data is structured according to the DIN 276 cost classification [63]. Each cost item is linked to specific BKI numbers to ensure precise categorization and reference. To adjust for inflation and rising construction costs, a 22% increase was applied using the 2022 construction price index, updating the 2017 data. Additionally, valued added tax was adjusted from the German 19% to the Austrian 20% to reflect local tax requirements. A comparative analysis with real-world data from construction firms and online sources ensured the estimates remained relevant.
5.4. Proof of Concept - Life Cycle Assessment
This Proof of Concept LCA provides a structured approach to evaluating the use cases building materials’ environmental, economic, and circularity impacts, as shown in Figure 6. The matching of objects and design in the PoC, Figure 6, demonstrates the application of the proposed framework. By component selection and matching it ensures that only feasible objects are chosen for the predefined use case. The use case is a residential complex located in Vienna. Each element is assessed based on the design space and concept, as well as the structural concept, to ensure they fit into the use case design. This involves matching the components that adhere to the predefined design and structural requirements.
The PoC consists of four stages: Goal and Scope, which defines the assessment boundaries from design to end-of-life; Life Cycle Inventory, which uses BIM to integrate lifecycle data through a filled data template; Impact Assessment, evaluating indicators such as GWP, material recyclability, and costs; and Interpretation, synthesizing results to propose actionable recommendations. The following results section presents the detailed analysis of the spatial, material, environmental, circularity, and economic impacts of the PoC, offering a comprehensive evaluation of the use case’s performance across key metrics.
6. Results
The following subsections provide the results of the PoC across key metrics: Section 7.1.1 focuses on the Area and Volume results, where the gross, net, and construction floor areas and volumes are systematically analyzed to establish the building’s spatial dimensions. Following this, Section 7.1.2 delves into the Building Mass and Component Mass, providing a detailed breakdown of the material quantities and masses used in construction. Section 7.1.3 shifts to the Environmental Impact Assessment, where we quantify the building’s contributions to global warming, acidification, and energy consumption, alongside evaluating the CO2 storage capabilities of biogenic materials. Section 7.1.4 examines the EoL and Circularity Measures, analyzing the building’s materials for their recyclability and disposal options at the end of the building’s life. Finally, Section 7.1.5 addresses the Economic Impact, assessing the financial costs associated with the components and construction.
6.1. Area and Volume
The calculations of area and volume are critical in understanding the spatial and functional attributes of a building project. The Gross Floor Area (GFA), Net Floor Area (NFA), and Construction Floor Area (CFA) are key metrics that quantify the extent of usable space and construction footprint within a structure. In this project, the GFA totals 4893.27 m², reflecting the overall floor space, while the NFA, which excludes structural elements and non-usable spaces, amounts to 4461.56 m². The CFA, representing the space dedicated to construction components, is 431.71 m². Similarly, volumetric calculations provide insights into the spatial dynamics of rooms, with the Gross Room Volume (GRV) measuring 14260.07 m³, the Net Room Volume (NRV) 11997.52 m³, and the Construction Room Volume (CRV) 2262.55 m³. These metrics, exported from the BIM model, are essential for assessing the building’s spatial, and overall design effectiveness.
6.2. Building Mass and Component Mass
The assessment of masses and quantities refers to the detailed analysis of the masses and quantities of building materials that are used in the building design. Each material’s density (expressed in kg/m³) and dimensions (thickness in cm, area in m²) are considered to determine the total volume in cubic meters (m³). This volume is used to calculate the mass of each material, which is expressed in both kilograms (kg) and tons (t). We categorize the building materials into three primary classifications: organic, mineral, and metallic. The classification is crucial for understanding the long-term behavior of these materials, including their durability, environmental impact, and ease of recycling. Figure 7 illustrates the relative mass distribution of the building materials Organic Materials: These include natural materials like wood, which comprise 14% of the total building mass, approximately 639.87 tons. Mineral Materials: Representing the largest portion of the building mass (85% or 4009.23 tons), these include concrete, screed, and insulation materials. Metallic Materials: Although minimal, metallic components such as steel and aluminum are critical for structural integrity. Other Components: Windows, doors, and other components, comprising a smaller percentage of the total mass.
A more granular analysis of the materials used in construction is presented in Figure 8, which includes the specific types of materials and their corresponding mass. Concrete emerges as the dominant material, accounting for over half of the building’s total mass. Wood and screed/fill also contribute significantly, while other materials such as insulation, sealing, and flooring is present in smaller quantities. To assess the long-term sustainability and durability of the building materials, we calculate the mass of the building components after 100 years. This projection considers the expected lifespan of each element and layer and its replacement over time. For each element—whether slab, ceiling, wall, beam, or foundation—the data provides a breakdown of the materials that compose each layer, Figure 9, along with the corresponding mass of each material layer. This same process is applied across all elements in the building, ensuring consistent data for the assessment of environmental impacts.
Figure 10 provides a comprehensive view of the mass accumulation of the whole building over a 100-year lifecycle. Key structural elements like slabs, which starts at 1,353,327.87 kg, increase over time, reaching 1,468,748.05 kg by EoL, due to material additions due to maintenance or renovations. Wooden ceilings and walls, particularly in living areas, show significant growth, with the wooden ceiling in the living area rising from 637,417.59 kg to 1,092,167.77 kg over time. Windows and doors, experience notable mass increases at regular intervals, indicating replacement. In contrast, certain components such as reinforced concrete beams, columns, and foundations remain quite constant in mass throughout the lifecycle, highlighting their durability and limited need for intervention. By the EOL, the total mass of the building reaches 6,023.04 tons, reflecting cumulative additions and replacements over its lifetime. Moreover, the complexity of building elements must be considered, as various layers beyond the primary materials contribute to the total mass of an element over the building’s lifecycle. For example, a slab isn’t just a single layer of concrete; it includes layers such as parquet flooring, dry screed, insulation, and aggregate fill, each with different lifespans and environmental impacts. The parquet layer, with a lifespan of 25 years, needs to be replaced four times over 100 years, increasing its mass contribution from 11.1 kg/m² to 44.4 kg/m². Similarly, the dry screed and insulation layers, with lifespans of 50 years, are replaced once over the same period, doubling their initial mass contributions. In contrast, the reinforced concrete floor slab (642.24 kg/m²), with a much longer lifespan, remains unchanged throughout the 100 years. This dynamic interplay of materials shows that while the main structural elements like concrete remain stable, other layers significantly influence the total mass and environmental impact due to their frequent replacements. Thus, when assessing a building’s lifecycle, it’s crucial to consider the replacement cycles of these additional materials, which can greatly affect both maintenance planning and the building’s overall environmental footprint.
6.3. Environmental Impact Assessment
In the environmental impact assessment, key indicators are considered critical for evaluating the environmental impact. In the environmental impact assessment, key metrics considered are the GWP, measured in kg or tons CO₂ equivalent, which evaluates the building’s contribution to climate change; the AP, expressed in kg SO₂ equivalent, assessing the acidifying effects on soil and water; and the Total Demand for PENRT, measured in mega- or gigajoules, representing the consumption of non-renewable energy resources throughout the building’s lifecycle, Figure 11.
This assessment is further granulated by analyzing the individual building elements, Table 4. The environmental impact assessment reveals significant variations in the contribution of different building elements to key sustainability metrics, both at the year of construction and after 100 years. Walls show the most significant reduction in GWP, contributing to substantial carbon savings with -306.3 t CO₂ eq. at construction and -525.52 t CO₂ eq. after 100 years, highlighting their role in reducing the building’s overall carbon footprint. In contrast, Slabs and Ceilings, while offering an initial carbon savings of -51.65 t CO₂ eq., exhibit a large increase in both AP and PENRT, with 3552.29 kg SO₂ eq. and 13435.51 GJ respectively after 100 years, indicating a notable long-term environmental impact. Elements like Beams, Columns, Stairs, and Foundations contribute smaller amounts to GWP, AP, and PENRT, but their impact remains consistent over time. Overall, the building demonstrates a net carbon savings over its lifecycle, with GWP improving from -300.19 t CO₂ eq. at construction to -408.4 t CO₂ eq. after 100 years. However, the rise in AP and PENRT over time highlights the growing demand for energy and its associated environmental burdens, particularly from high-impact elements like slabs and ceilings. This suggests opportunities for targeting these elements to further reduce the long-term environmental impacts. It is possible to target specific materials or components for further optimization to improve overall sustainability.
6.4. End of Life and Circularity Measures
To assess recyclable and disposal mass at the end of a material’s life EoL, the total material mass is split into recyclable versus waste fractions. Figure 12 illustrates the EoL material mass distribution after 100 years, measured in tons (t). Recyclable mass accounts for 2,716.05 tons, represented in green, shows the amount of material that can be reclaimed and reused after its lifespan. Disposal mass accounts for 3,306.99 tons, represented in red, indicates the portion of material that will be considered waste and will need to be disposed of.
More granular, the Table 5 presents the recyclable and disposal mass of the use cases building elements after 100 years at the EoL, measured in tons (t). For instance, elements like the Concrete Slab (General) and Wooden Ceiling (Living Area), despite having substantial recyclable masses (695.93 tons and 492.12 tons respectively), also have large disposal masses (772.82 tons and 600.05 tons). This suggests that significant amounts of material will still end up as waste, even if a portion can be recycled. Some elements, such as the wooden flat roof and concrete balcony, exhibit a balanced split between recyclable and disposal mass, indicating that about half of these materials can be recovered, while the other half becomes waste. Conversely, partition walls and interior walls have much higher disposal rates, with over 170 tons of partition wall material being discarded versus only 50 tons being recyclable. This suggests significant waste potential for these elements. Despite their small contribution to the overall mass, steel beams and steel columns have relatively high recyclability percentages, reflecting efficient material recovery.
A closer examination of key building components shows how they contribute to the overall material flows. For example, the foundation slab with an initial mass of 1,353,327.87 kg accumulates an additional 115,420.19 kg by 50 years, reaching a total mass of 1,468,748.05 kg by the EoL. At this stage, 656,508.57 kg of the slab can be recycled, while 696,819.30 kg will become waste. This pattern is consistent across gradually accumulated mass over time, leading to significant amounts of waste and recyclable materials at the EoL, Figure 13 and Figure 14. Similarly, the wooden ceiling layers reach a total mass of 323,861.14 kg by 100 years, 146,541.33 kg of that mass being recyclable and 177,319.82 kg waste. The exterior wood frame wall follows a similar trajectory, growing to 198,162.84 kg, with 58,404.97 kg recyclable and 139,757.87 kg waste. The data also emphasizes the recycling potential for windows and doors. For instance, the total mass of wooden windows reaches 39,753.45 kg by 100 years, with 19,876.73 kg available for recycling. Likewise, the concrete stair and foundations see over half of their mass becoming either recyclable or waste. Importantly, the recycling potential outlined in this data reflects the amount of material that could be recycled rather than what is inevitably destined for disposal. This distinction highlights the significant opportunity to recover and reuse materials during demolition, depending on the waste management strategies employed. As the building reaches the end of its lifecycle, the importance of effective dismantling practices becomes paramount to reduce environmental impact by prioritizing material recovery.
6.5. Economic Impact
The cost over 100 years reveals significant variation in different building components, reflected in the increases between initial construction costs and the projected costs over time, Table 6. Over a 100-year period, the costs for building components vary widely, highlighting specific areas. Windows and doors show the highest cost increases (200.05% and 167.60%, respectively), driven by frequent replacement needs. Walls and slabs and ceilings also see cost rises (55.12% and 29.06%). In contrast, structural elements like beams, columns, and foundations have no increase over time, due to their long-term. Focusing on individual layers of elements, materials like parquet flooring (25 years), clay and lime plasters (35 years), and insulation (35-50 years) will need more frequent replacement compared to structural components like reinforced concrete and cross-laminated timber (both lasting 100 years).
The building’s costs are shown at 10-year intervals, Figure 15, with major cost increases around the 50-year mark, where the first significant replacements occur. By the end of the 100-year period, the building’s total costs accumulate to around €7,002,282. However, there is a sharp increase in costs between year 40 and 50, marking the first major maintenance and replacement cycle. This surge corresponds to scheduled replacements of floors, ceilings, windows, doors, and potentially insulation. The costs continue to rise as further replacements occur in subsequent decades.
7. Discussion
The PoC presented in this study validates the applicability of the proposed framework for integrating LCA and CE measures directly into BIM object data. This integration aims to address the significant gap in environmental data within BIM processes. By embedding detailed life cycle and circularity information into BIM objects, stakeholders can effectively assess and implement CE principles, advancing environmentally conscious construction practices. This discussion addresses the research questions, synthesizes the key insights from the application of the framework, potential areas for improvement, and explores the implications for informed decision-making.
7.1. Addressing the Research Questions
The information-rich BIM Object Library (RQ1): The implementation demonstrated that an information-rich BIM object library can enhance the capability to assess and support circularity and sustainability in EDS. By embedding detailed LCA and CE data into BIM objects, stakeholders can perform comprehensive analyses of material quantities, environmental impacts, and EoL scenarios and cost information. This integration facilitates early-stage decision-making, allowing for adjustments that optimize sustainability outcomes.
Essential information for assessing life cycle impact and circularity (RQ2): The findings indicate that the BIM object library must contain: Detailed Material Specifications: This includes quantities, masses, and environmental properties relevant to LCA metrics such as GWP, AP, and PENRT. Circularity Data: Information on material recyclability and potential for waste at the EoL stage is crucial for assessing long-term sustainability. Economic Data: Cost benchmarks, maintenance schedules, and replacement cycles should be included to provide a comprehensive view of long-term economic impacts.
7.2. Insights from the PoC Implementation
Digital Building Model of the Use Case and BIM Object Library
The primary objective was to align the BIM object library with the building concept, resulting in a digital model utilizing enriched BIM data. Initial challenges included modeling errors in the provided use case model, such as component duplication and improper layering, which were rectified through model optimization. Simplifying the model by removing non-essential elements and consolidating components improved usability and accuracy for subsequent evaluations.
Feasibility and Compliance Assessments
Feasibility assessments verified the availability and practicality of elements specified in the model, revealing discrepancies like non-standard insulation thicknesses. Structural evaluations ensured that component dimensions adhered to engineering standards for load-bearing capacities. Compliance with building physics regulations, including thermal, acoustic, and fire protection standards, was confirmed, ensuring the model’s applicability in real-world scenarios.
Matching the Model and Library
A comprehensive component catalog was developed from the evaluated model, detailing specifications, and categorizing components based on the model representation. The catalog served as a crucial tool for assessing feasibility and aligning the model with the BIM object library. The refined BIM model was meticulously matched to the BIM object library data, ensuring that each element within the model corresponded accurately to the library’s components. This alignment was critical for facilitating precise assessments of life cycle impacts and circularity measures. One key insight from the PoC implementation is that working with heterogeneous BIM data formats—combining structured BIM models with external data repositories in spreadsheet format—proved feasible and offered flexibility in managing diverse data types. This approach allowed the integration of detailed, external life cycle and circularity metrics into the BIM environment. However, this method also introduced certain limitations, such as challenges in data synchronization and potential inconsistencies between the model and external data sources. Hence, manual data handling and checking of consistency of data across heterogeneous sources occurred.
7.3. Quantitative Analyses and Potential Areas for Improvement
Material Optimization
Material mass assessments highlighted a heavy reliance on mineral materials, particularly concrete, which accounted for 85% of the total mass. Organic materials like wood offered advantages in recyclability and lower environmental impact. This suggests opportunities to substitute high-impact materials with sustainable alternatives, especially in components like slabs and ceilings that significantly contribute to the building’s environmental footprint. While a high recyclable mass is often seen as a positive outcome, it is not necessarily the most desirable goal from a sustainability perspective. The key objective should be to minimize the overall material mass in the first place while ensuring that the materials used have a high recyclability rate. For instance, elements like the Concrete Slab (General) and Wooden Ceiling (Living Area), despite having substantial recyclable masses (695.93 tons and 492.12 tons respectively), also have large disposal masses (772.82 tons and 600.05 tons). This suggests that significant amounts of material will still end up as waste, even if a portion can be recycled. Furthermore, relying on large material masses, even with high recyclability, contributes to resource extraction, energy consumption, and emissions over the material’s lifecycle. Instead, focusing on designs that reduce overall material use while maintaining high recyclability would result in both lower environmental impact and greater material efficiency. While partition walls and interior walls have high disposal masses (170.03 tons and 135.66 tons), the more critical issue is the overall mass itself, which could be reduced through lightweight materials with better recycling rates. Similarly, steel beams and steel columns, though small in recyclable mass, offer a more desirable model by minimizing material use and still having good recycling potential relative to their size. In summary, the goal should not be to achieve high recyclable mass but to reduce the total material while ensuring that a greater proportion of materials used are fully recyclable.
Environmental Impact Assessment
The integration of key environmental indicators—GWP, AP, and PENRT allows for a robust assessment of a building’s environmental performance. These metrics help stakeholders measure and reduce the environmental impacts of their buildings, contributing to global efforts toward sustainability, resource efficiency, and climate change mitigation. The LCA identified that slabs and ceilings were major contributors to AP and PENRT due to their material intensity. Conversely, walls (with primary material wood) provided substantial carbon savings over time. Targeting high-impact components for material substitution or design improvements could significantly reduce the building’s overall environmental impact.
Circularity Measures and Waste Reduction
At the building’s EoL, approximately 2,716.05 tons of material would be recyclable, while 3,306.99 tons were destined for disposal. Enhancing circularity thus involves: Choosing materials with higher recycling rates. Adopting modular designs that facilitate easy dismantling and reuse.
Cost-Effectiveness and Maintenance Optimization
Over a 100-year life span, maintenance and replacements led to a 67.73% increase in costs, predominantly due to frequent replacements of windows and doors. Structural components such as beams and columns exhibited stability with no additional costs. Insights include: Investing in longer-lasting materials for high-maintenance elements can reduce long-term costs. Incorporating economic data into BIM objects allows for budgeting and highlights potential cost savings. The comparison between standardized cost benchmarks and actual firm, Table 7, prices revealed significant disparities. Notably, firm prices for interior wood and gypsum walls, and glulam beams exceeded BKI benchmarks, while prices for windows and foundations were significantly lower. This variability underscores the importance of continuous cost analysis for budget accuracy and cost-efficiency optimization.
7.4. Limitations and Challenges
While the PoC presented in this study provides valuable insights into the integration of LCA and CE measures within BIM objects, limitations were encountered that could impact the applicability of the findings: Initial errors in component duplication and layering highlighted the need for meticulous modeling practices. Discrepancies between modeled specifications and commercially available materials necessitated adjustments, emphasizing the importance of aligning digital models with real-world constraints. The integration of extensive LCA and CE data increases the complexity of BIM objects, requiring advanced software capabilities and user expertise. While the study focused on key environmental indicators such as GWP, AP, and PENRT, the assessment may not have encompassed other important sustainability metrics. Broader environmental impacts, such as biodiversity loss or water use, were not explicitly considered, which may limit the comprehensiveness of the sustainability evaluations. The application of the framework to the use case of residential building in Vienna may restrict the findings’ applicability to other building types, locations, or scales. The unique characteristics of the use case, including local regulations, material availability, and environmental conditions, may not be representative of broader contexts, limiting the generalizability of the conclusions drawn. The economic analysis focused primarily on cost comparisons between BKI benchmarks and actual firm prices. However, it did not include a comprehensive lifecycle cost analysis that incorporates operational energy consumption, maintenance costs, and potential savings from sustainable technologies. This omission may result in an incomplete understanding of the long-term economic implications of design choices. The successful application of the proposed framework and the effective use of the BIM object library depend heavily on user expertise. Stakeholders with varying levels of experience in BIM, LCA, and CE may face challenges in fully leveraging the framework’s capabilities, potentially hindering its adoption and implementation in practice.
8. Conclusions and Future Research
This study demonstrates the feasibility of integrating Life Cycle Assessment and Circular Economy metrics into BIM object data, addressing a critical gap in current BIM workflows by embedding environmental, circularity, and cost information. The proposed BIM object library framework enables comprehensive sustainability assessments, material optimization, and lifecycle cost analysis, enhancing decision-making across the building lifecycle. By serving as a centralized repository for sustainability data, this framework streamlines data management, supports informed decision-making, and improves environmental impact assessments. The proof-of-concept (PoC) validation confirms its practical utility, demonstrating its ability to optimize material use, enhance spatial efficiency, and minimize waste. The integration of key LCA indicators—such as Global Warming Potential—alongside CE metrics provides a robust assessment approach, ensuring alignment with ISO 14044, EN 15804, and the EU Level(s) framework. Despite its strengths, challenges such as data complexity, interoperability limitations, and the need for specialized expertise remain. Future research should prioritize: Automating sustainability metrics calculations to improve efficiency, enhancing interoperability between BIM and sustainability assessment databases, and developing interactive visualization to support real-time decision-making, Table 8. Further future developments could explore the integration of AI and digital twin technologies into the BIM framework to enhance automation and real-time sustainability assessments. AI-driven algorithms could analyze embedded lifecycle and circularity data to predict material performance, cost efficiency, and sustainability impacts at various project stages directly starting at object level. Additionally, incorporating digital twin technology would allow for real-time monitoring and simulation of environmental impacts, enabling dynamic updates to sustainability strategies throughout a building’s lifecycle. The automation of BIM object libraries through AI and digital twins would further streamline data-driven decision-making and enhance adaptability to sustainability requirements in real-world construction projects. In conclusion, this research advances circular BIM adoption by embedding sustainability principles into digital design workflows from the very object on, serving as a centralized repository and providing standardized, data-driven insights. This framework provides a scalable foundation for future research, enabling advancements in IT-driven sustainability assessments, digital twin integration, and real-time environmental impact analysis in AEC.
Declaration of Generative AI and AI-Assisted Technologies in the Writing Process
During the preparation of this work, the authors used DeepL and GPT to improve readability, language precision, and consistency in terminology, as the authors are non-native English speakers. This allowed the authors to focus on the scientific rigor and clarity of the content. After using these tools, the authors thoroughly reviewed and edited the manuscript, taking full responsibility for its final content.
Acknowledgments
This research was partially funded by the Austrian Research Promotion Agency (FFG) under the City of Tomorrow program, within the scope of the project titled “Housing 4.0 - Digital Platform for Affordable Living.” We gratefully acknowledge their support in enabling this research.
References
- bSDD Search. https://search.bsdd.buildingsmart.org/?SearchText=object&ShowPreview=true (accessed 31 October 2024).
- NBS BIM Object Standard. https://source.thenbs.com/bimlibrary/nbs-bim-object-standard (accessed 31 October 2024).
- Guignone, G.; Calmon, J.L.; Vieira, D.; Bravo, A. BIM and LCA integration methodologies: A critical analysis and proposed guidelines. J. Build. Eng. 2023, 73, 106780. [CrossRef]
- Abdulai, S.F.; Nani, G.; Taiwo, R.; Antwi-Afari, P.; Zayed, T.; Sojobi, A.O. Modelling the relationship between circular economy barriers and drivers for sustainable construction industry. Build. Environ. 2024, 254. [CrossRef]
- ÖNORM EN ISO 14044:2021 03 01. https://www.austrian-standards.at/de/shop/onorm-en-iso-14044-2021-03-01~p2568309 (accessed 31 October 2024).
- ÖNORM EN 15804:2022 02 15. https://www.austrian-standards.at/de/shop/onorm-en-15804-2022-02-15~p2614831 (accessed 31 October 2024).
- ÖNORM EN 15978:2012 10 01. https://www.austrian-standards.at/de/shop/onorm-en-15978-2012-10-01~p1963407 (accessed 31 October 2024).
- Level(s) - European Commission. https://environment.ec.europa.eu/topics/circular-economy/levels_en (accessed 31 October 2024).
- Norouzi, M.; Chàfer, M.; Cabeza, L.F.; Jiménez, L.; Boer, D. Circular economy in the building and construction sector: A scientific evolution analysis. J. Build. Eng. 2021, 44. [CrossRef]
- Roberts, M.; Allen, S.; Coley, D. Life cycle assessment in the building design process – A systematic literature review. Build Environ 2020, 185, 107274. [CrossRef]
- Häfliger, I.-F.; John, V.; Passer, A.; Lasvaux, S.; Hoxha, E.; Saade, M.R.M.; Habert, G. Buildings environmental impacts’ sensitivity related to LCA modelling choices of construction materials. J. Clean. Prod. 2017, 156, 805–816. [CrossRef]
- Buyle, M.; Braet, J.; Audenaert, A. Life cycle assessment in the construction sector: A review. Renew. Sustain. Energy Rev. 2013, 26, 379–388. [CrossRef]
- Giorgi, S. Assessment methods and digital tools to support circular building strategies. IOP Conf. Series: Earth Environ. Sci. 2024, 1402. [CrossRef]
- Austrian Standards Jahresbericht 2021. https://cdn.austrian-standards.at/asset/reb_dokumente/Ueber-uns/Ueber-AS/ASI/Austrian_Standards_International_T%C3%A4tigkeitsbericht_2021.pdf (accessed 20 December 2024).
- ÖNORM ISO 14025:2006 09 01. https://www.austrian-standards.at/de/shop/onorm-iso-14025-2006-09-01~p1515466 (accessed 31 October 2024).
- Charef, R.; Lu, W. Factor dynamics to facilitate circular economy adoption in construction. J. Clean. Prod. 2021, 319. [CrossRef]
- Akbarieh, A.; Jayasinghe, L.B.; Waldmann, D.; Teferle, F.N. BIM-Based End-of-Lifecycle Decision Making and Digital Deconstruction: Literature Review. Sustainability 2020, 12, 2670. [CrossRef]
- Sacks R, Eastman C, Lee G, et al. BIM Handbook. BIM Handbook. Epub ahead of print 14 August 2018. [CrossRef]
- Eastman CM., Teicholz PM., Sacks Rafael, et al. BIM handbook: a guide to building information modeling for owners, managers, designers, engineers and contractors.
- Azhar S. Building Information Modeling (BIM): Trends, Benefits, Risks, and Challenges for the AEC Industry. Leadership and Management in Engineering 2011; 11: 241–252. [CrossRef]
- Malmqvist, T.; Glaumann, M.; Scarpellini, S.; Zabalza, I.; Aranda, A.; Llera, E.; Díaz, S. Life cycle assessment in buildings: The ENSLIC simplified method and guidelines. Energy 2010, 36, 1900–1907. [CrossRef]
- Soust-Verdaguer, B.; Llatas, C.; García-Martínez, A. Critical review of bim-based LCA method to buildings. Energy Build. 2017, 136, 110–120. [CrossRef]
- Sajid, Z.W.; Khan, S.A.; Hussain, F.; Ullah, F.; Khushnood, R.A.; Soliman, N. Assessing economic and environmental performance of infill materials through BIM: a life cycle approach. Smart Sustain. Built Environ. Epub ahead of print 4 July 2024. [CrossRef]
- Zhao, L.; Guo, C.; Chen, L.; Qiu, L.; Wu, W.; Wang, Q. Using BIM and LCA to Calculate the Life Cycle Carbon Emissions of Inpatient Building: A Case Study in China. Sustainability 2024, 16, 5341. [CrossRef]
- Al Mahmud, J.; Arefin, S.; Ahmmed, I. Uncovering the research tapestry: bibliometric insights into BIM and LCA – exploring trends, collaborations and future directions. Constr. Innov. Epub ahead of print 2 May 2024. [CrossRef]
- Ding, Y.; Guo, Z.-Z.; Zhou, S.-X.; Wei, Y.-Q.; She, A.-M.; Dong, J.-L. Research on carbon emissions during the construction process of prefabricated buildings based on BIM and LCA. J. Asian Arch. Build. Eng. 2024, 1–13. [CrossRef]
- Namaki, P.; Vegesna, B.S.; Bigdellou, S.; Chen, R.; Chen, Q. An Integrated Building Information Modeling and Life-Cycle Assessment Approach to Facilitate Design Decisions on Sustainable Building Projects in Canada. Sustainability 2024, 16, 4718. [CrossRef]
- Santos, R.; Costa, A.A.; Silvestre, J.D.; Pyl, L. Integration of LCA and LCC analysis within a BIM-based environment. Autom. Constr. 2019, 103, 127–149. [CrossRef]
- Gantner J, Tom Saunders, Sebastien Lasvaux, et al. Operational guidance for life cycle assessment studies of the Energy-Efficient Buildings Initiative (EeBGuide). 2011.
- ISO 14040:2006 - Environmental management – Life cycle assessment – Principles and framework, https://www.iso.org/standard/37456.html (accessed 6 November 2024).
- Silvestre, J.D.; Lasvaux, S.; Hodková, J.; de Brito, J.; Pinheiro, M.D. NativeLCA - a systematic approach for the selection of environmental datasets as generic data: application to construction products in a national context. Int. J. Life Cycle Assess. 2015, 20, 731–750. [CrossRef]
- Pomponi, F.; Moncaster, A. Circular economy for the built environment: A research framework. J. Clean. Prod. 2017, 143, 710–718. [CrossRef]
- John, O.G.; Forth, K.; Theißen, S.; Borrmann, A. Estimating the Circularity of Building Elements using Building Information Modelling. IOP Conf. Series: Earth Environ. Sci. 2024, 1363, 012043. [CrossRef]
- Askar, R, Karaca F, Bragança L, et al. The Role of BIM in Supporting Circularity: A Conceptual Framework for Developing BIM-Based Circularity Assessment Models in Buildings. 2024, pp. 649–658. [CrossRef]
- Almeida, R.; Chaves, L.; Silva, M.; Carvalho, M.; Caldas, L. Integration between BIM and EPDs: Evaluation of the main difficulties and proposal of a framework based on ISO 19650:2018. J. Build. Eng. 2023, 68. [CrossRef]
- Tomczak, A.; Benghi, C.; van Berlo, L.; Hjelseth, E. Requiring Circularity Data in Bim With Information Delivery Specification. Circ. Econ. 2024, 1. [CrossRef]
- Heisel, F, McGranahan J. Enabling Design for Circularity with Computational Tools. 2024, pp. 97–110. [CrossRef]
- De Wolf C, Cordella M, Dodd N, et al. Whole life cycle environmental impact assessment of buildings: Developing software tool and database support for the EU framework Level(s). Resour Conserv Recycl 2023; 188: 106642. [CrossRef]
- Di Bari R, Horn R, Bruhn S, et al. Buildings LCA and digitalization: Designers’ toolbox based on a survey. IOP Conf Ser Earth Environ Sci 2022; 1078: 012092. [CrossRef]
- Hollberg, A.; Tjäder, M.; Ingelhag, G.; Wallbaum, H. A Framework for User Centric LCA Tool Development for Early Planning Stages of Buildings. Front. Built Environ. 2022, 8. [CrossRef]
- Säwén, T.; Magnusson, E.; Kalagasidis, A.S.; Hollberg, A. Tool characterisation framework for parametric building LCA. IOP Conf. Series: Earth Environ. Sci. 2022, 1078. [CrossRef]
- Honic, M.; Ferschin, P.; Breitfuss, D.; Cencic, O.; Gourlis, G.; Kovacic, I.; De Wolf, C. Framework for the assessment of the existing building stock through BIM and GIS. Dev. Built Environ. 2022, 13. [CrossRef]
- Turan, I, Fernandez J. Material Across Scales: Combining Material Flow Analysis And Life Cycle Assessment to Promote Efficiency in A Neighborhood Building Stock. 2015. Epub ahead of print 7 December 2015. [CrossRef]
- Çetin, S.; Raghu, D.; Honic, M.; Straub, A.; Gruis, V. Data requirements and availabilities for material passports: A digitally enabled framework for improving the circularity of existing buildings. Sustain. Prod. Consum. 2023, 40, 422–437. [CrossRef]
- Charef, R. The use of Building Information Modelling in the circular economy context: Several models and a new dimension of BIM (8D). Clean. Eng. Technol. 2022, 7, 100414. [CrossRef]
- Nepal MP, Jupp JR, Aibinu AA. Evaluations of BIM: Frameworks and Perspectives. In: Computing in Civil and Building Engineering (2014). Reston, VA: American Society of Civil Engineers, 2014, pp. 769–776.
- Gu, N.; London, K. Understanding and facilitating BIM adoption in the AEC industry. Autom. Constr. 2010, 19, 988–999. [CrossRef]
- Li, X.; Shen, G.Q.; Wu, P.; Yue, T. Integrating Building Information Modeling and Prefabrication Housing Production. Autom. Constr. 2019, 100, 46–60. [CrossRef]
- Lima PRB de, Rodrigues C de S, Post JM. Integration of BIM and design for deconstruction to improve circular economy of buildings. Journal of Building Engineering 2023; 80: 108015. [CrossRef]
- Lu, Y.; Wu, Z.; Chang, R.; Li, Y. Building Information Modeling (BIM) for green buildings: A critical review and future directions. Autom. Constr. 2017, 83, 134–148. [CrossRef]
- Palumbo, E.; Soust-Verdaguer, B.; Llatas, C.; Traverso, M. How to Obtain Accurate Environmental Impacts at Early Design Stages in BIM When Using Environmental Product Declaration. A Method to Support Decision-Making. Sustainability 2020, 12, 6927. [CrossRef]
- Xue, K.; Hossain, U.; Liu, M.; Ma, M.; Zhang, Y.; Hu, M.; Chen, X.; Cao, G. BIM Integrated LCA for Promoting Circular Economy towards Sustainable Construction: An Analytical Review. Sustainability 2021, 13, 1310. [CrossRef]
- Freek van Eijk, Anca Turtoi, Abdulla Moustafa, et al. (PDF) Circular buildings and infrastructure - State of play report ECESP Leadership Group on Buildings and Infrastructure 2021. https://www.researchgate.net/publication/359062006_Circular_buildings_and_infrastructure_-_State_of_play_report_ECESP_Leadership_Group_on_Buildings_and_Infrastructure_2021 (2021, accessed 31 October 2024).
- Khadim, N.; Agliata, R.; Thaheem, M.J.; Mollo, L. Whole building circularity indicator: A circular economy assessment framework for promoting circularity and sustainability in buildings and construction. Build. Environ. 2023, 241. [CrossRef]
- Plociennik C, Pourjafarian M, Saleh S, et al. Requirements for a Digital Product Passport to Boost the Circular Economy. Lecture Notes in Informatics (LNI), Proceedings - Series of the Gesellschaft fur Informatik (GI) 2022; P-326: 1485–1494.
- Bergquist, A.-K.; David, T. Beyond Planetary Limits! The International Chamber of Commerce, the United Nations, and the Invention of Sustainable Development. Bus. Hist. Rev. 2023, 97, 481–511. [CrossRef]
- Honic, M, Kovacic I, Rechberger H. Concept for a BIM-based Material Passport for buildings. IOP Conf Ser Earth Environ Sci 2019; 225: 012073. [CrossRef]
- Honic, M.; Kovacic, I.; Aschenbrenner, P.; Ragossnig, A. Material Passports for the end-of-life stage of buildings: Challenges and potentials. J. Clean. Prod. 2021, 319. [CrossRef]
- de Araujo JB, de Oliveira JFG. Proposal of a Methodology Applied to the Analysis and Selection of Performance Indicators for Sustainability Evaluation Systems. 2008, pp. 593–600. [CrossRef]
- Illankoon, C.; Vithanage, S.C. Closing the loop in the construction industry: A systematic literature review on the development of circular economy. J. Build. Eng. 2023, 76, 107362. [CrossRef]
- Welcome to baubook — English. https://www.baubook.info/en/welcome-to-baubook?set_language=en (accessed 11 November 2024).
- BKI - Baukosteninformationszentrum für Architekten. https://bki.de/ (accessed 11 November 2024).
- DIN 276:2018 12. https://www.austrian-standards.at/de/shop/din-276-2018-12~p2452589 (accessed 12 November 2024).
Figure 1.
Research Design, Top Down and Bottom Up Approach.
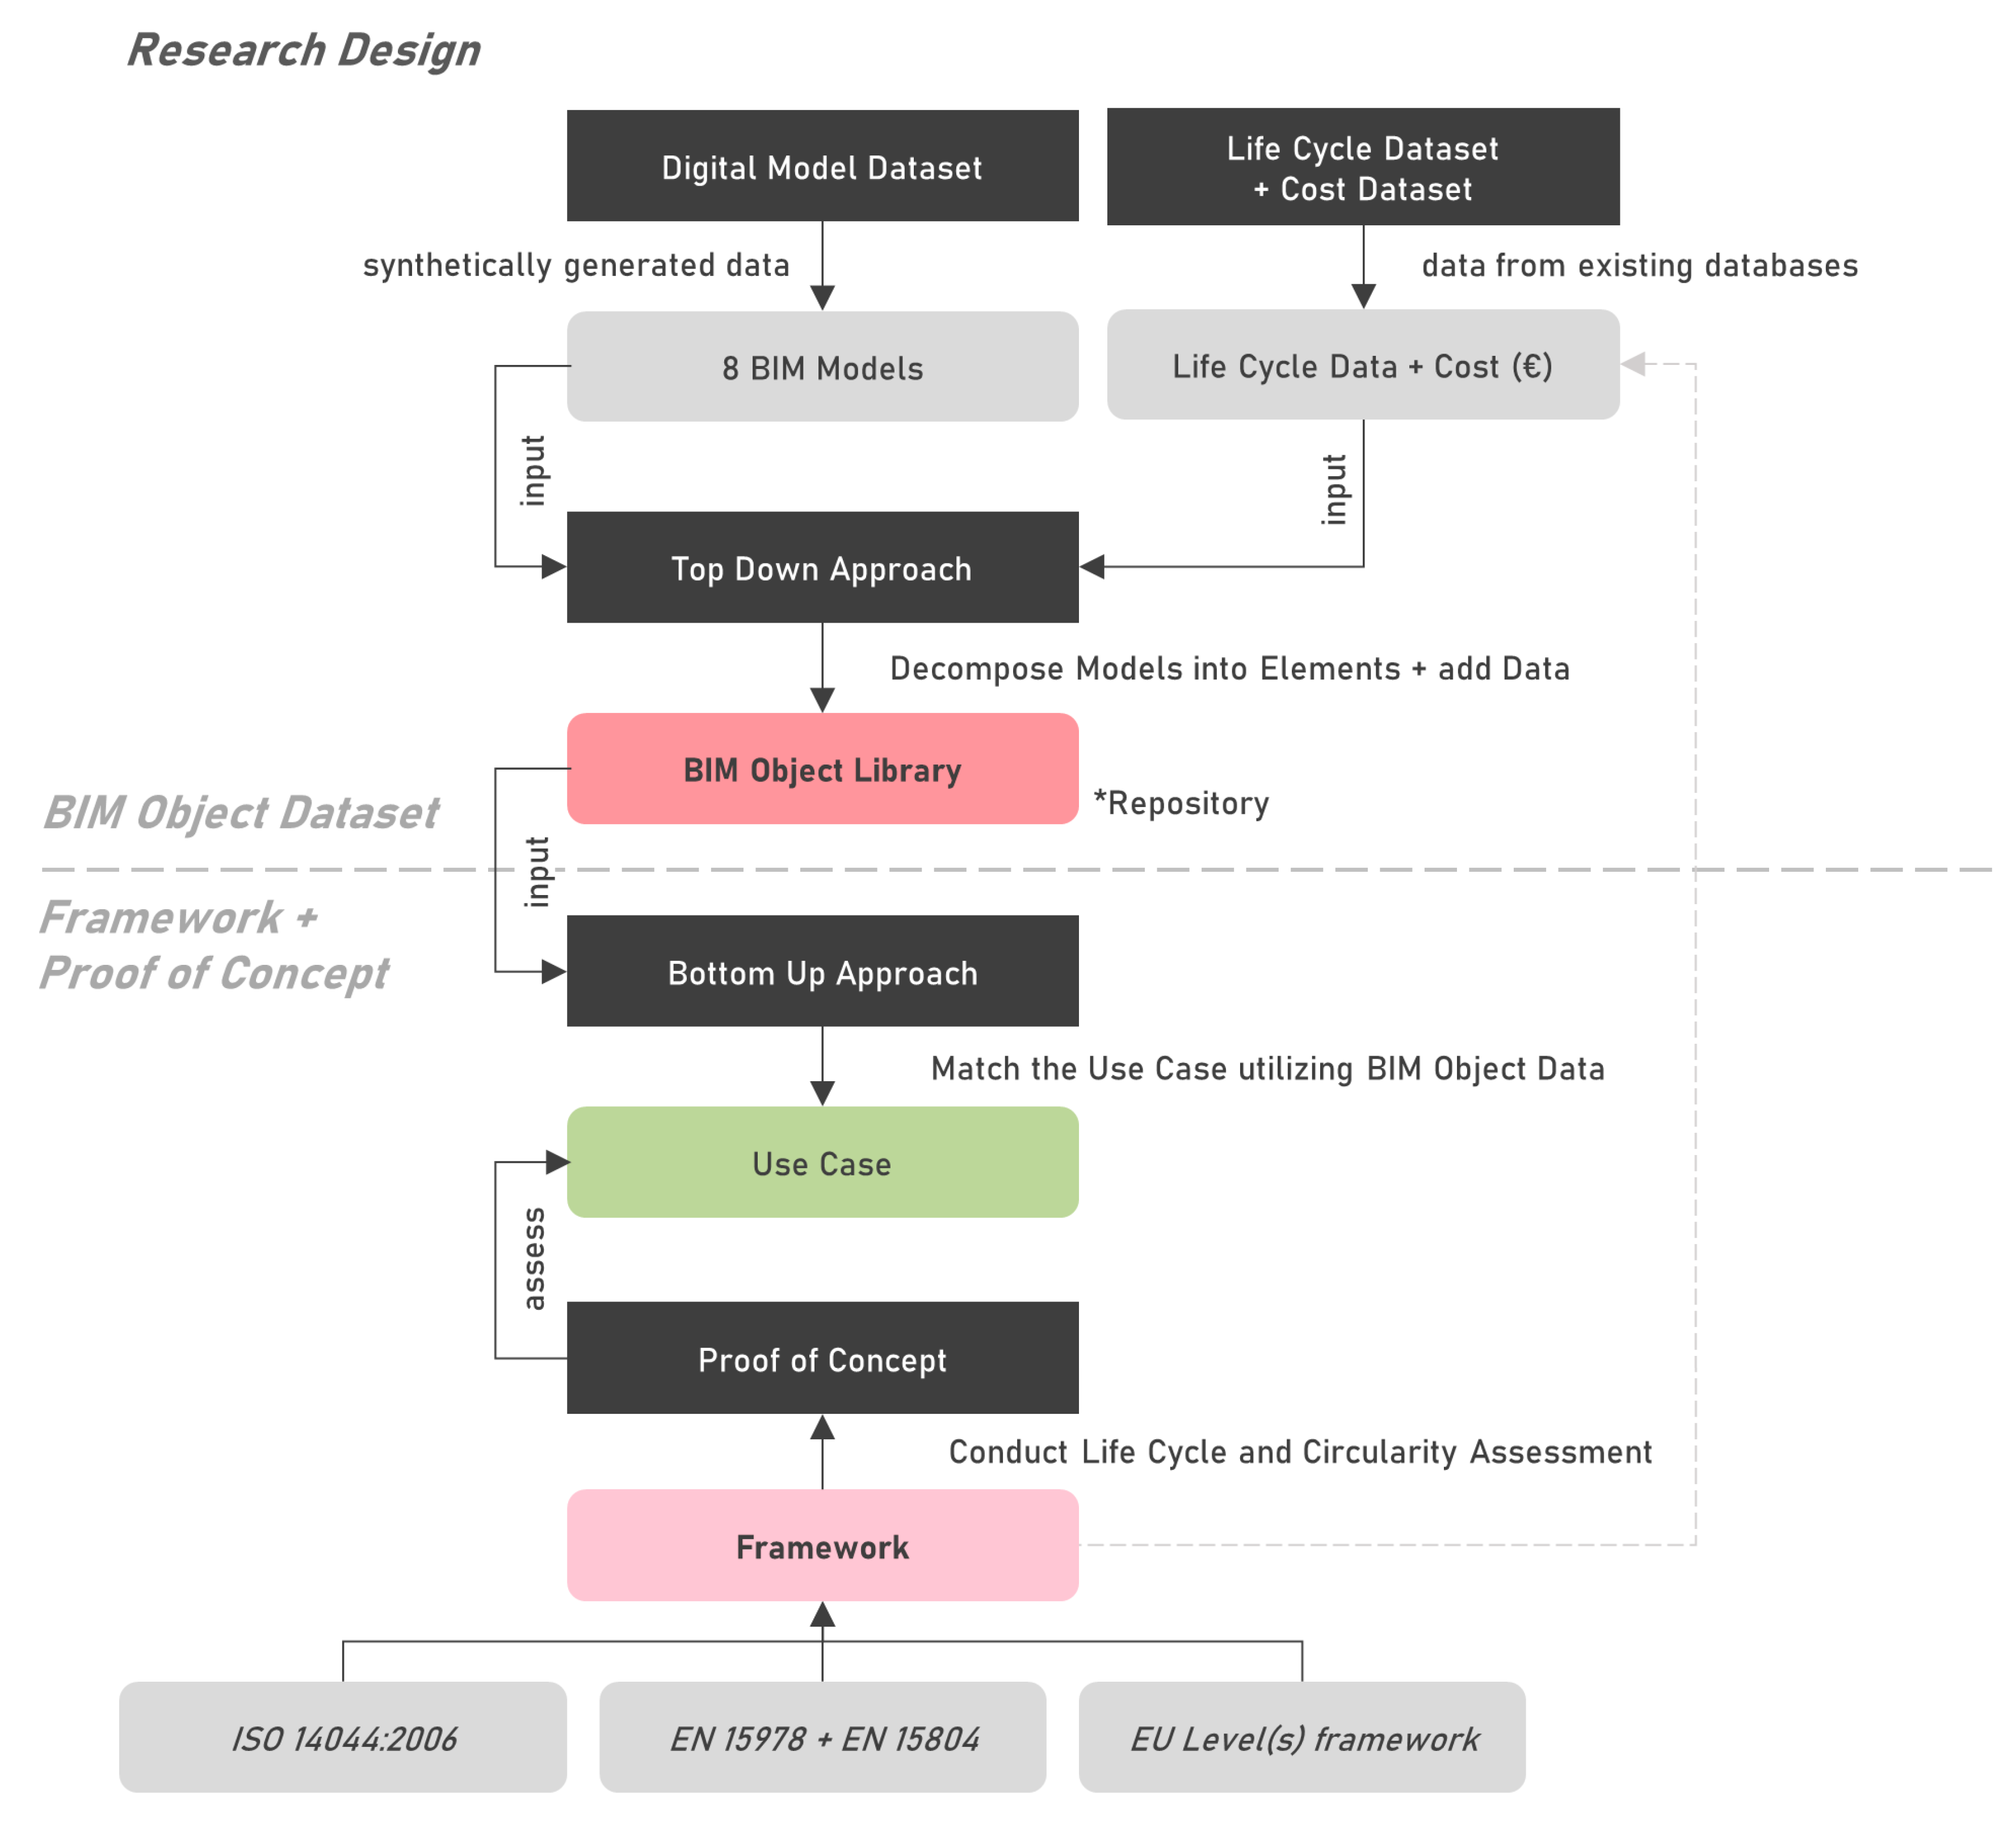
Figure 3.
BIM Object Library and Datasets.
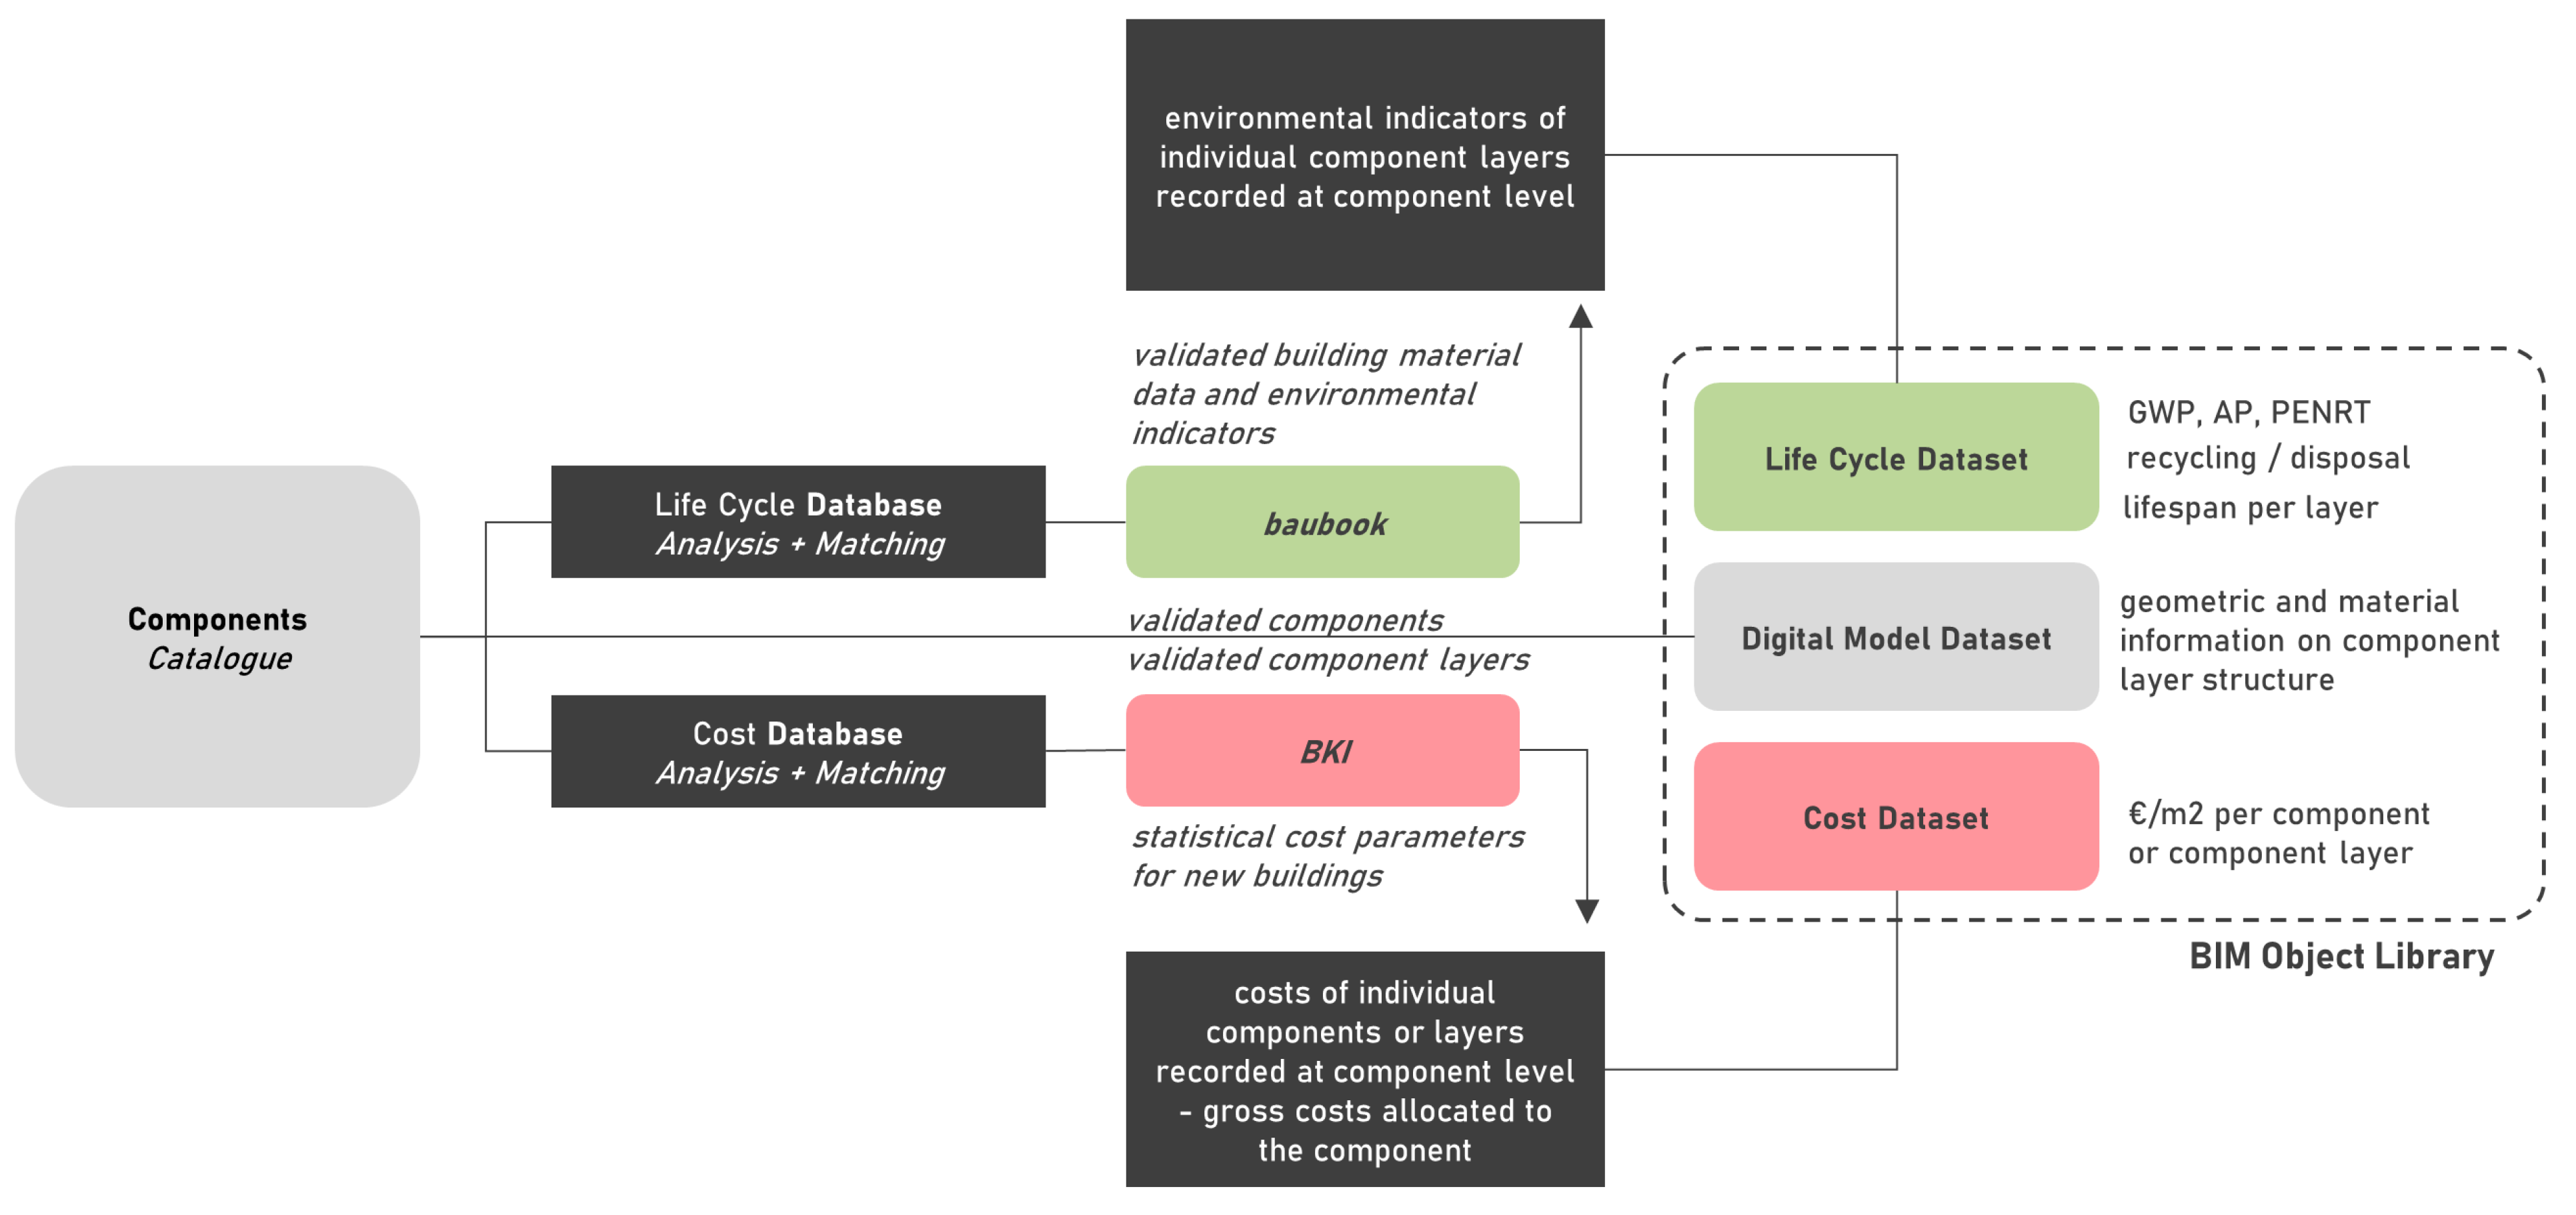
Figure 4.
Generation of Digital Model Dataset - Model Creation.
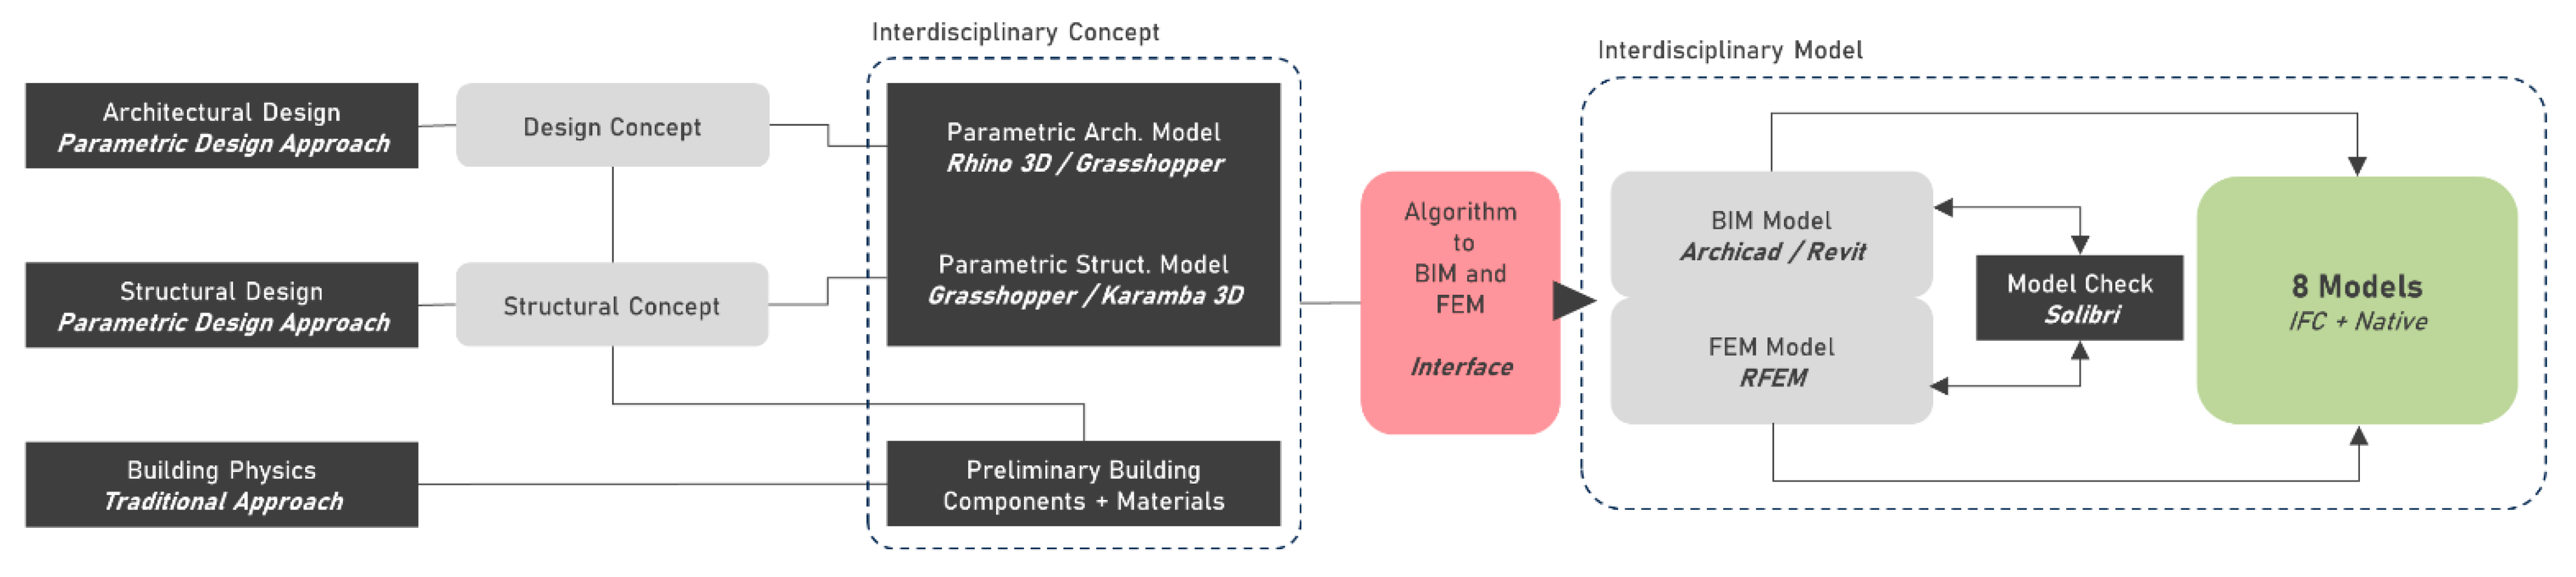
Figure 5.
Generation of Digital Model Dataset - Component Catalogue.
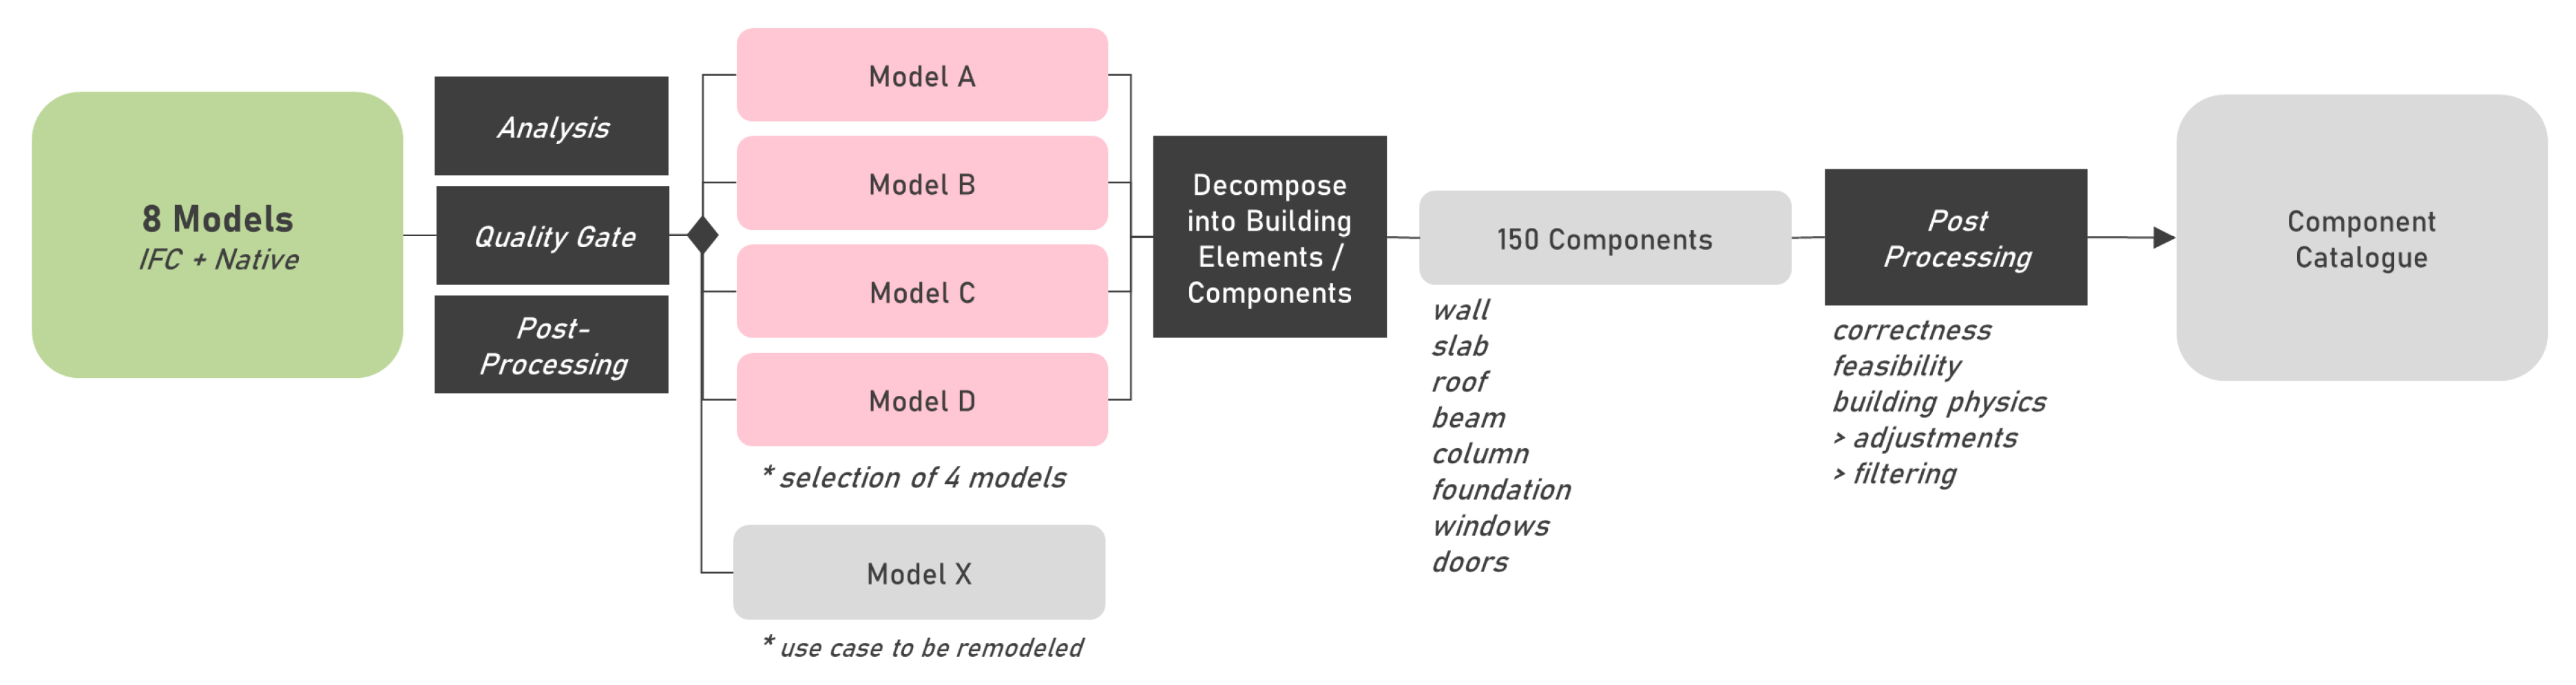
Figure 6.
Proof of Concept – Matching of BIM Objects with Scope of Design and conducted Life Cycle Assessment structure aligning with ISO 14040.
Figure 6.
Proof of Concept – Matching of BIM Objects with Scope of Design and conducted Life Cycle Assessment structure aligning with ISO 14040.
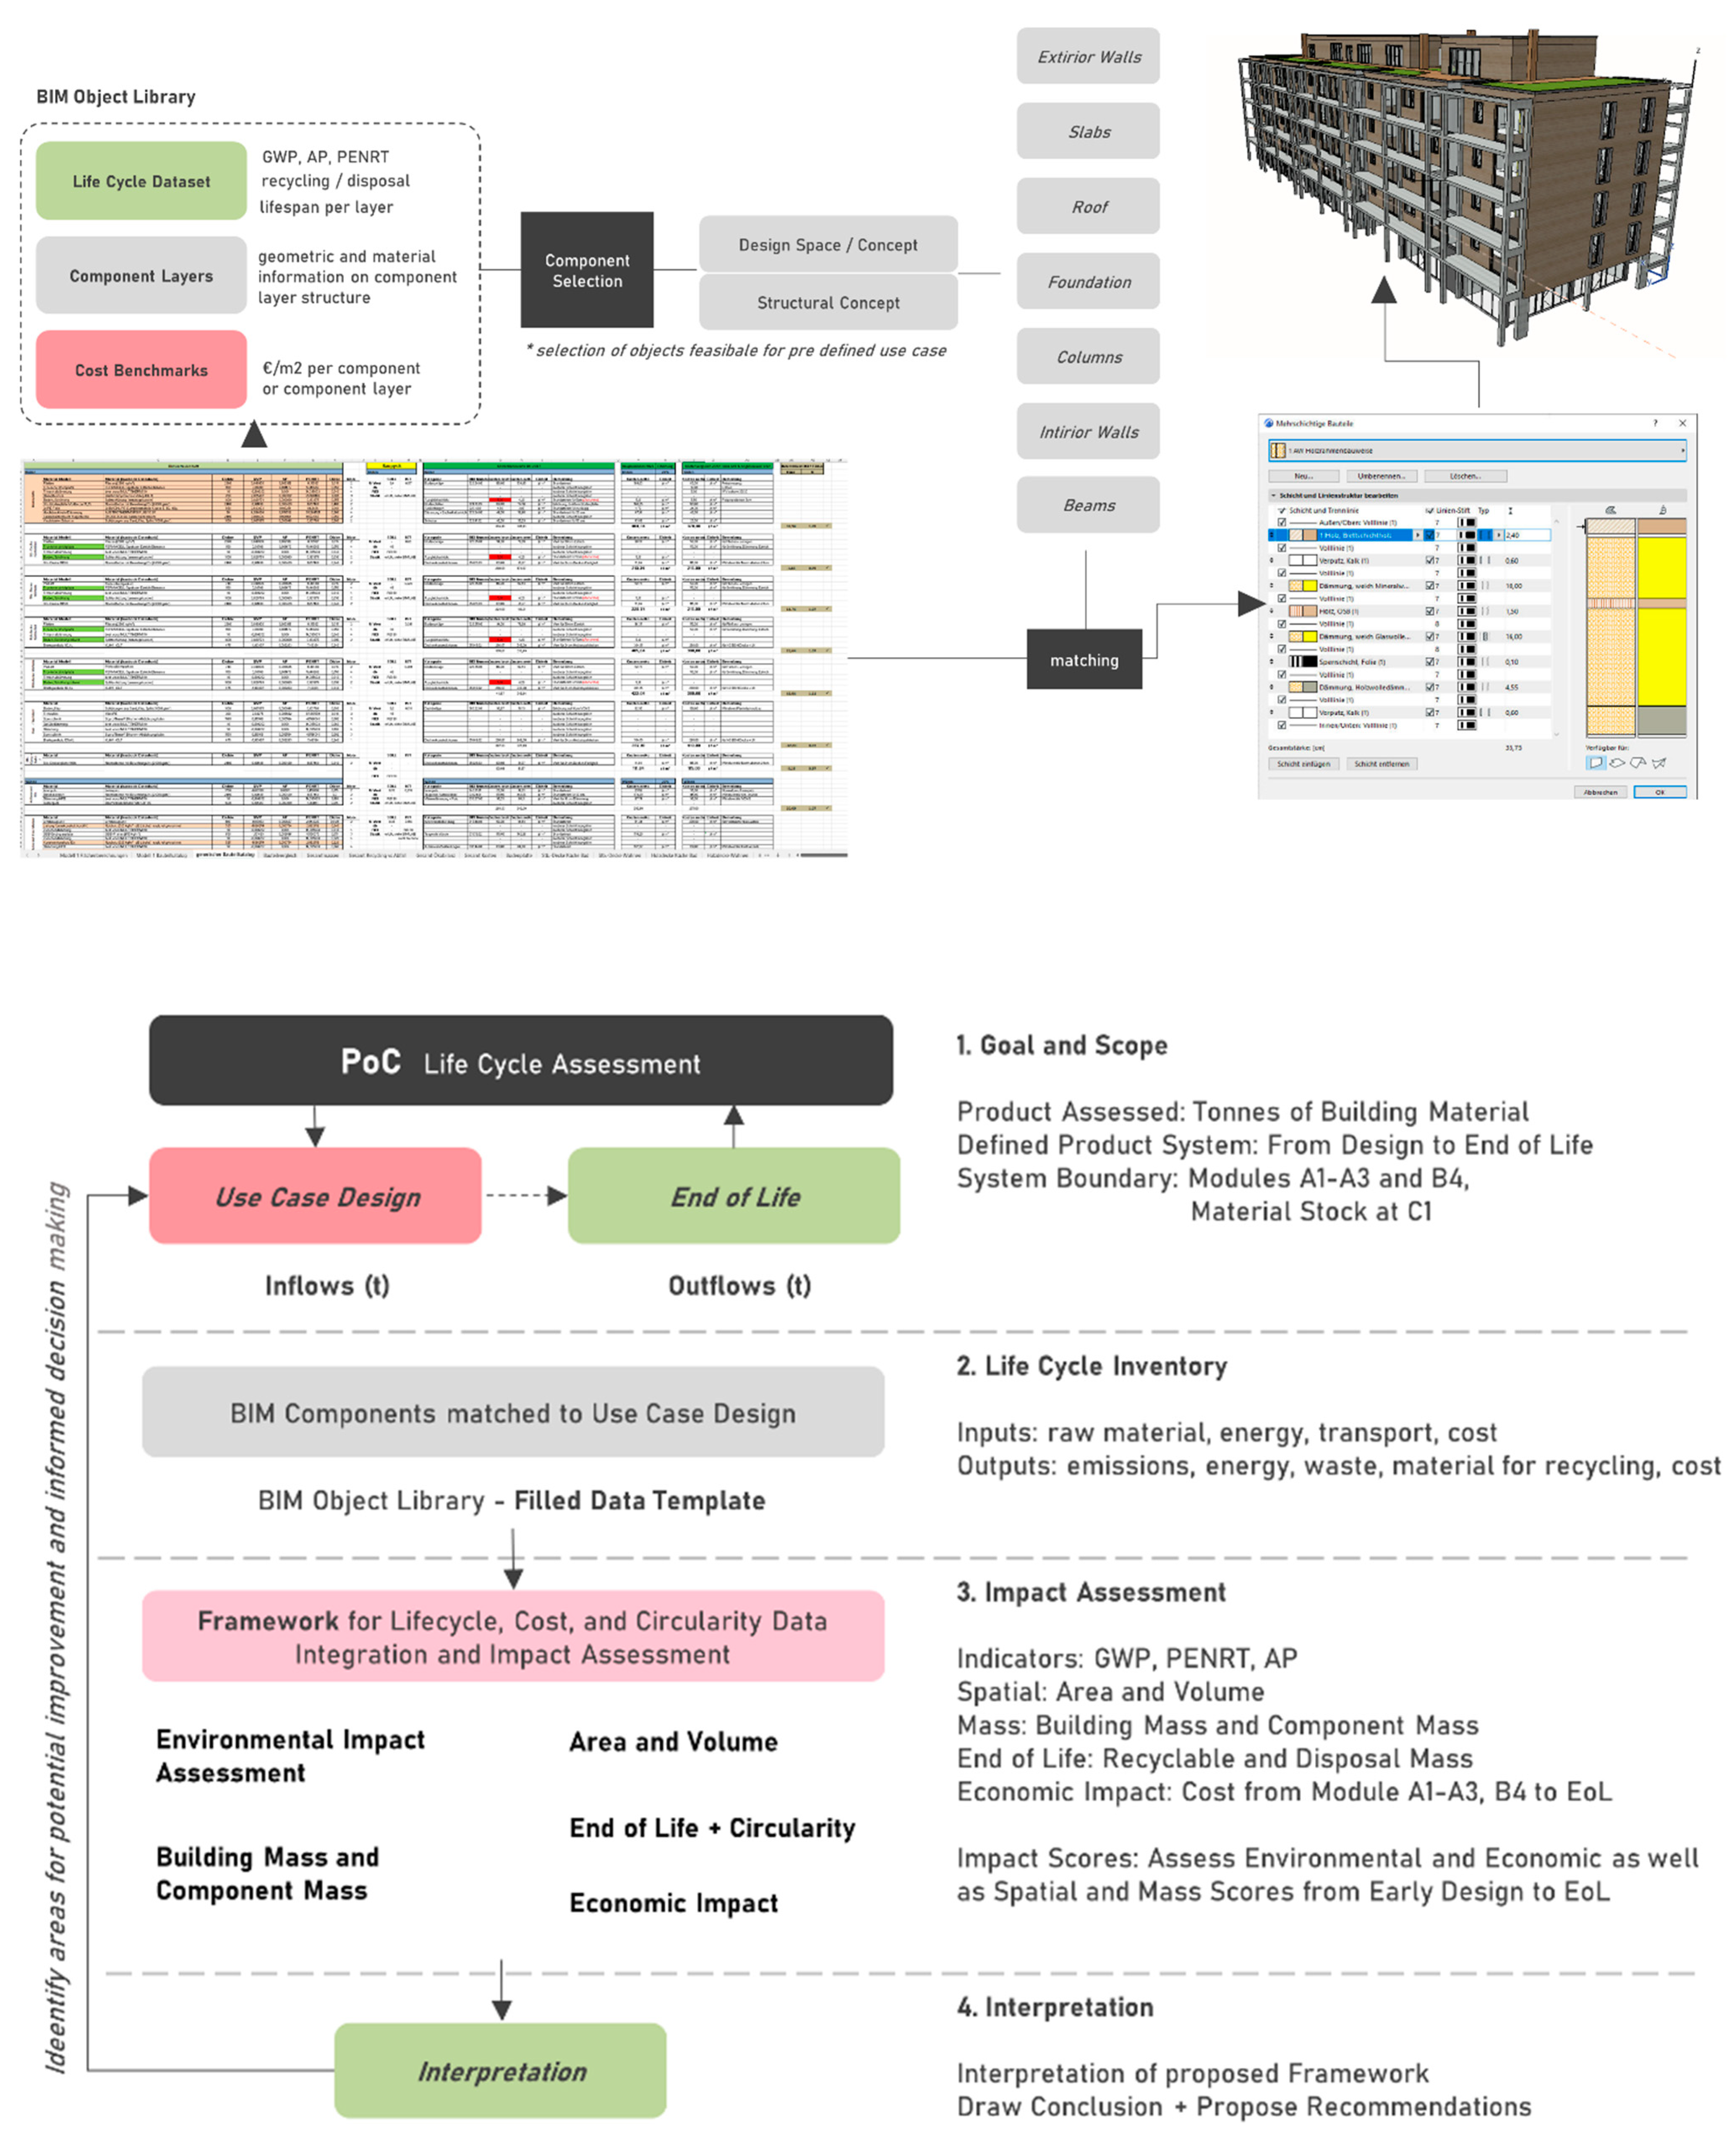
Figure 7.
Building Mass per Material Category Organic, Mineral, Metallic and Components.
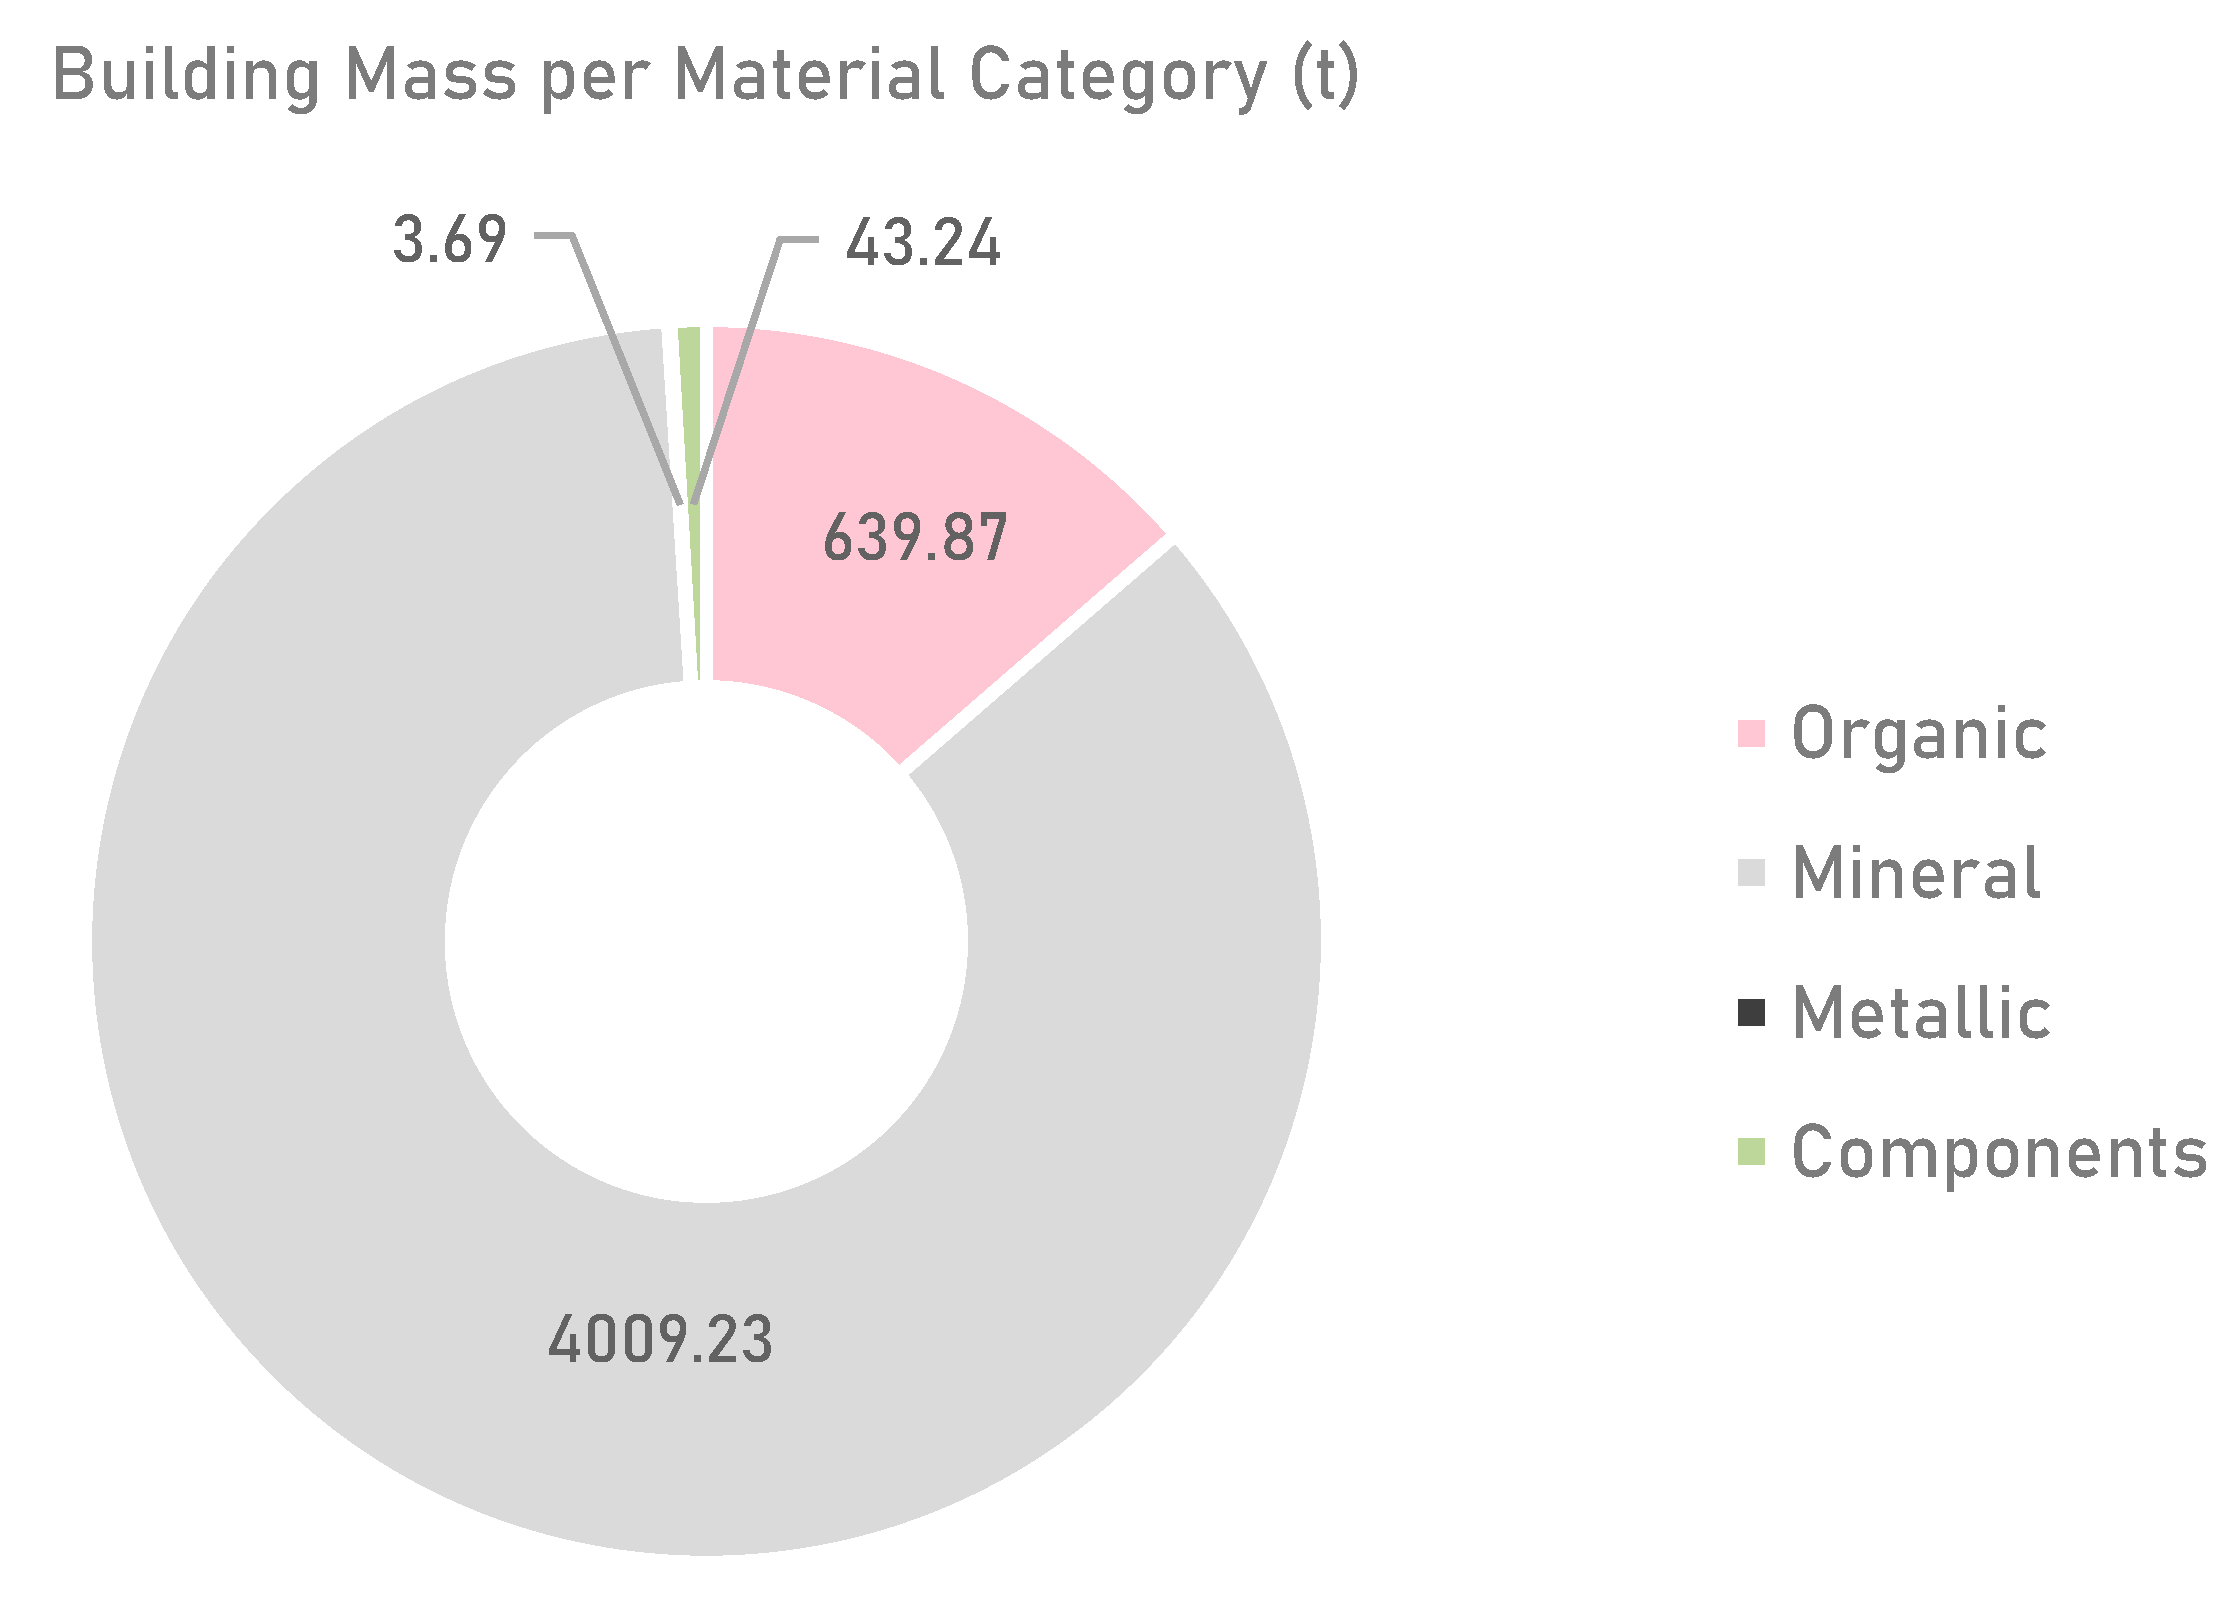
Figure 8.
Granular Analysis of Materials and Mass.
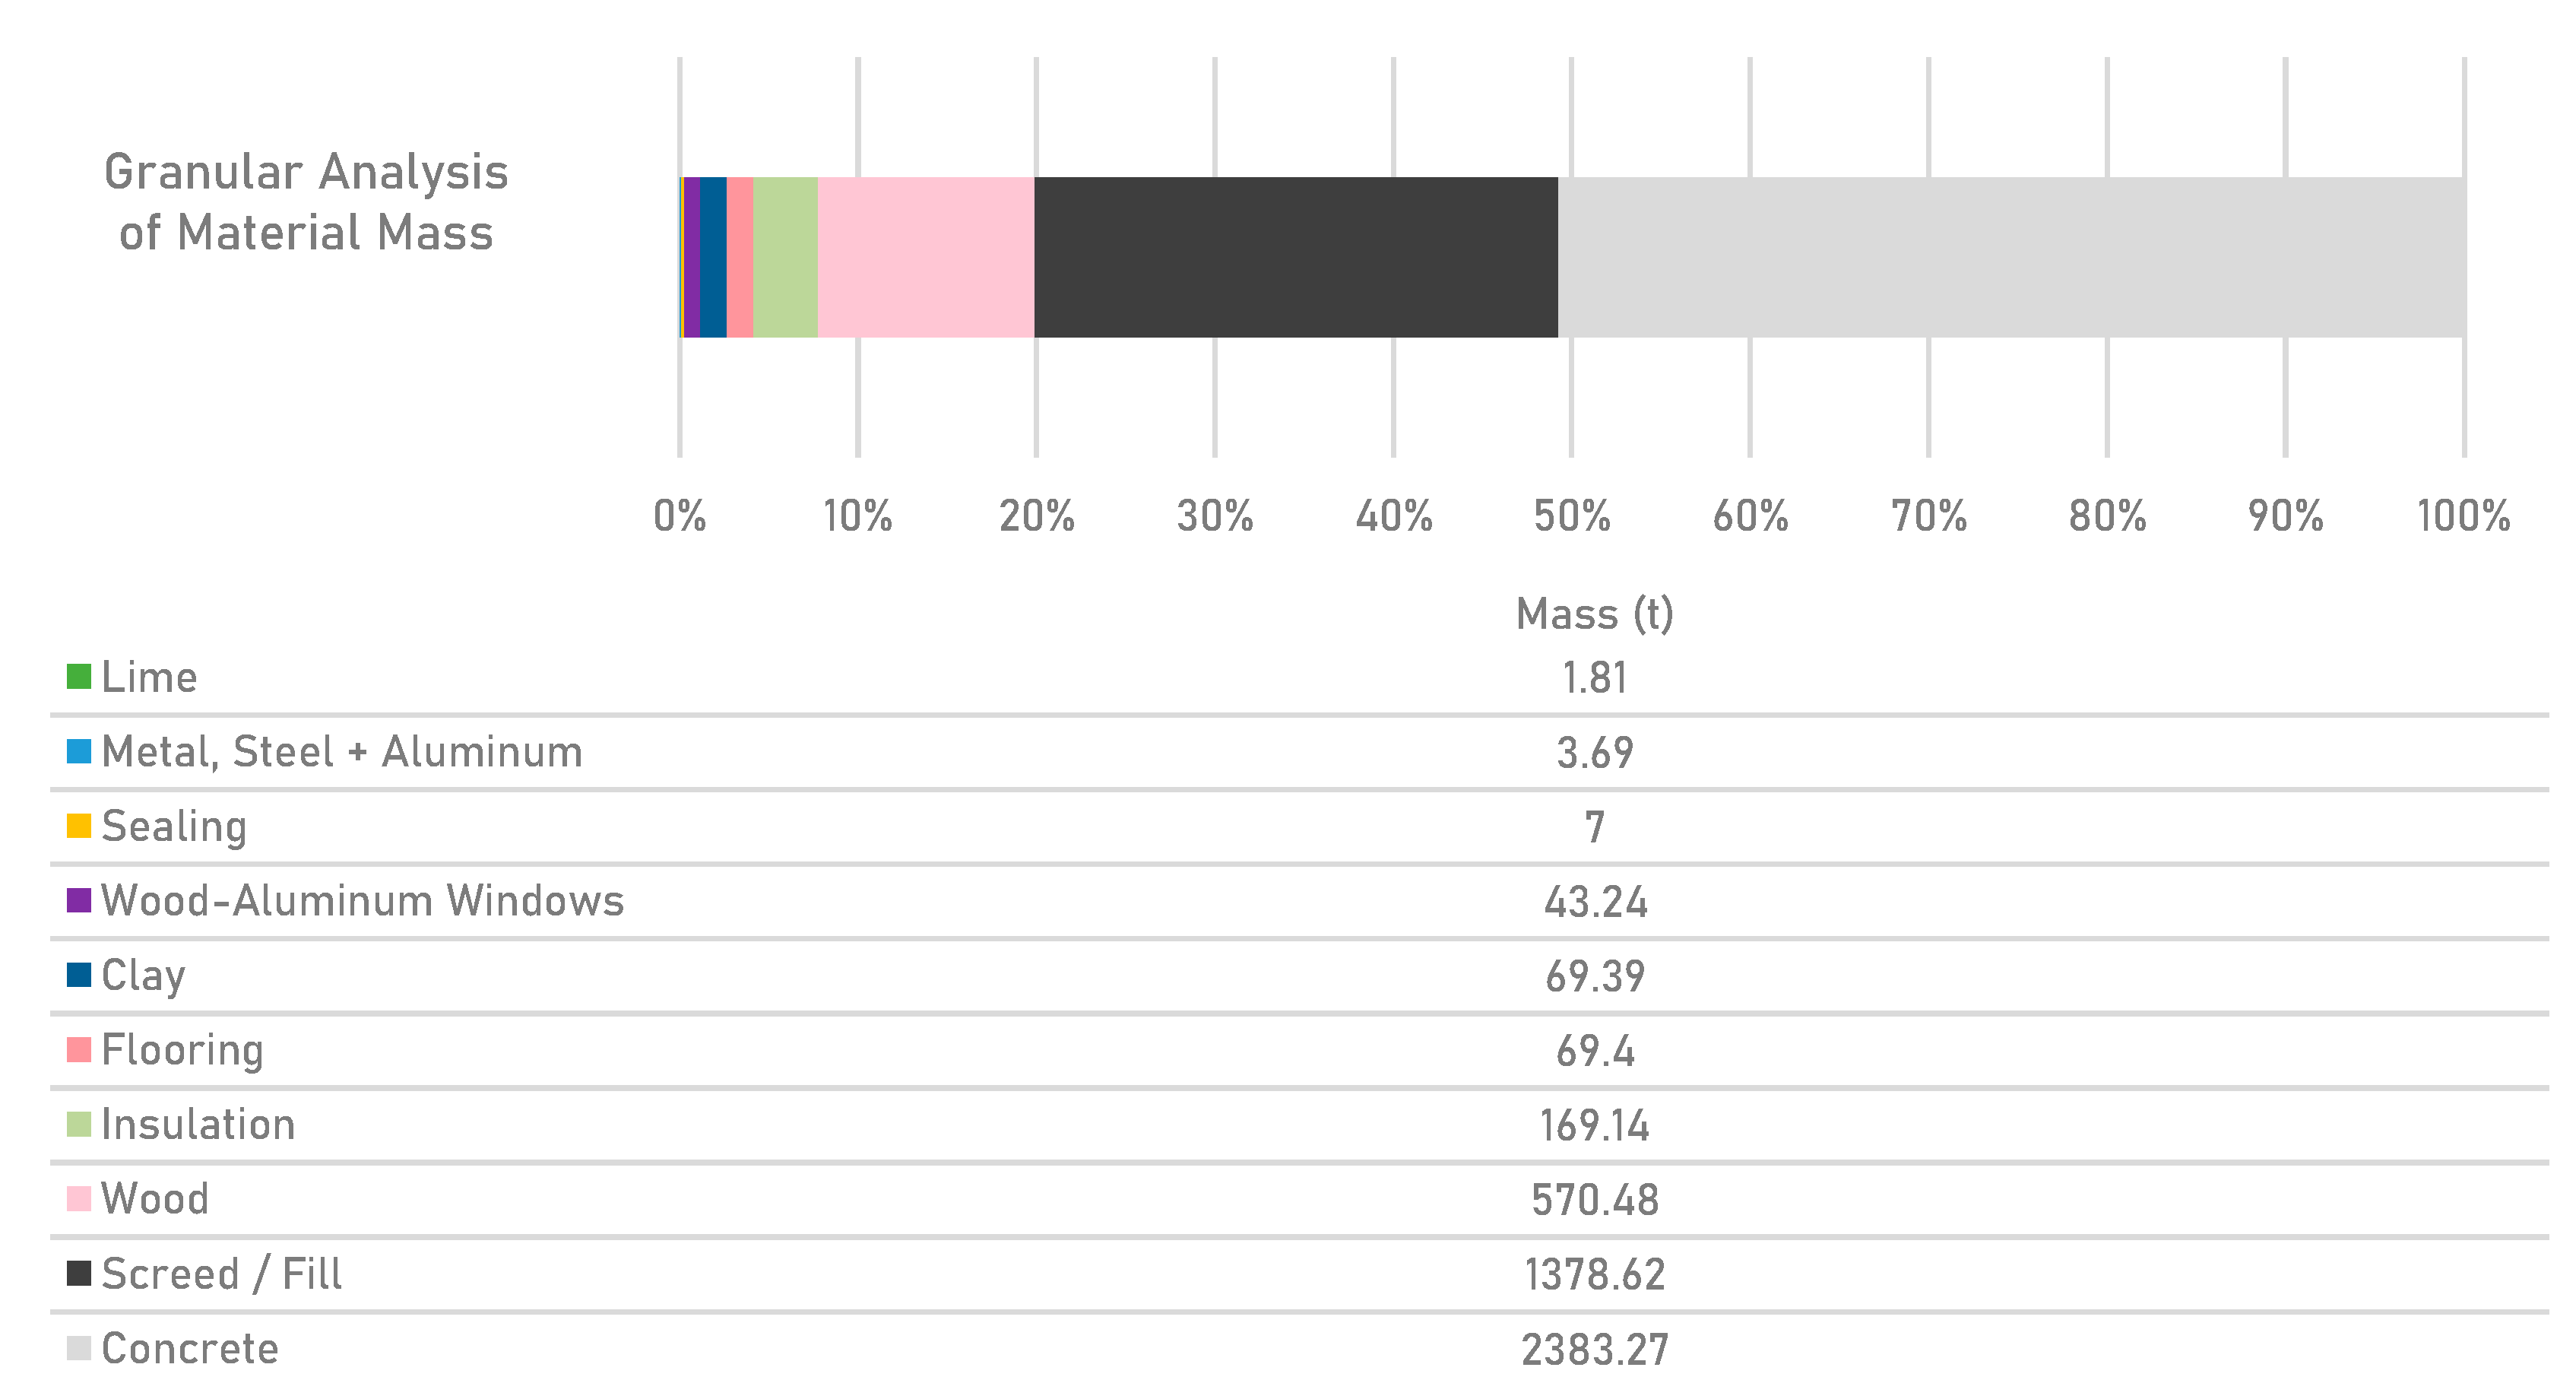
Figure 9.
Granular Analysis of Mass of Component (Element) Groups.
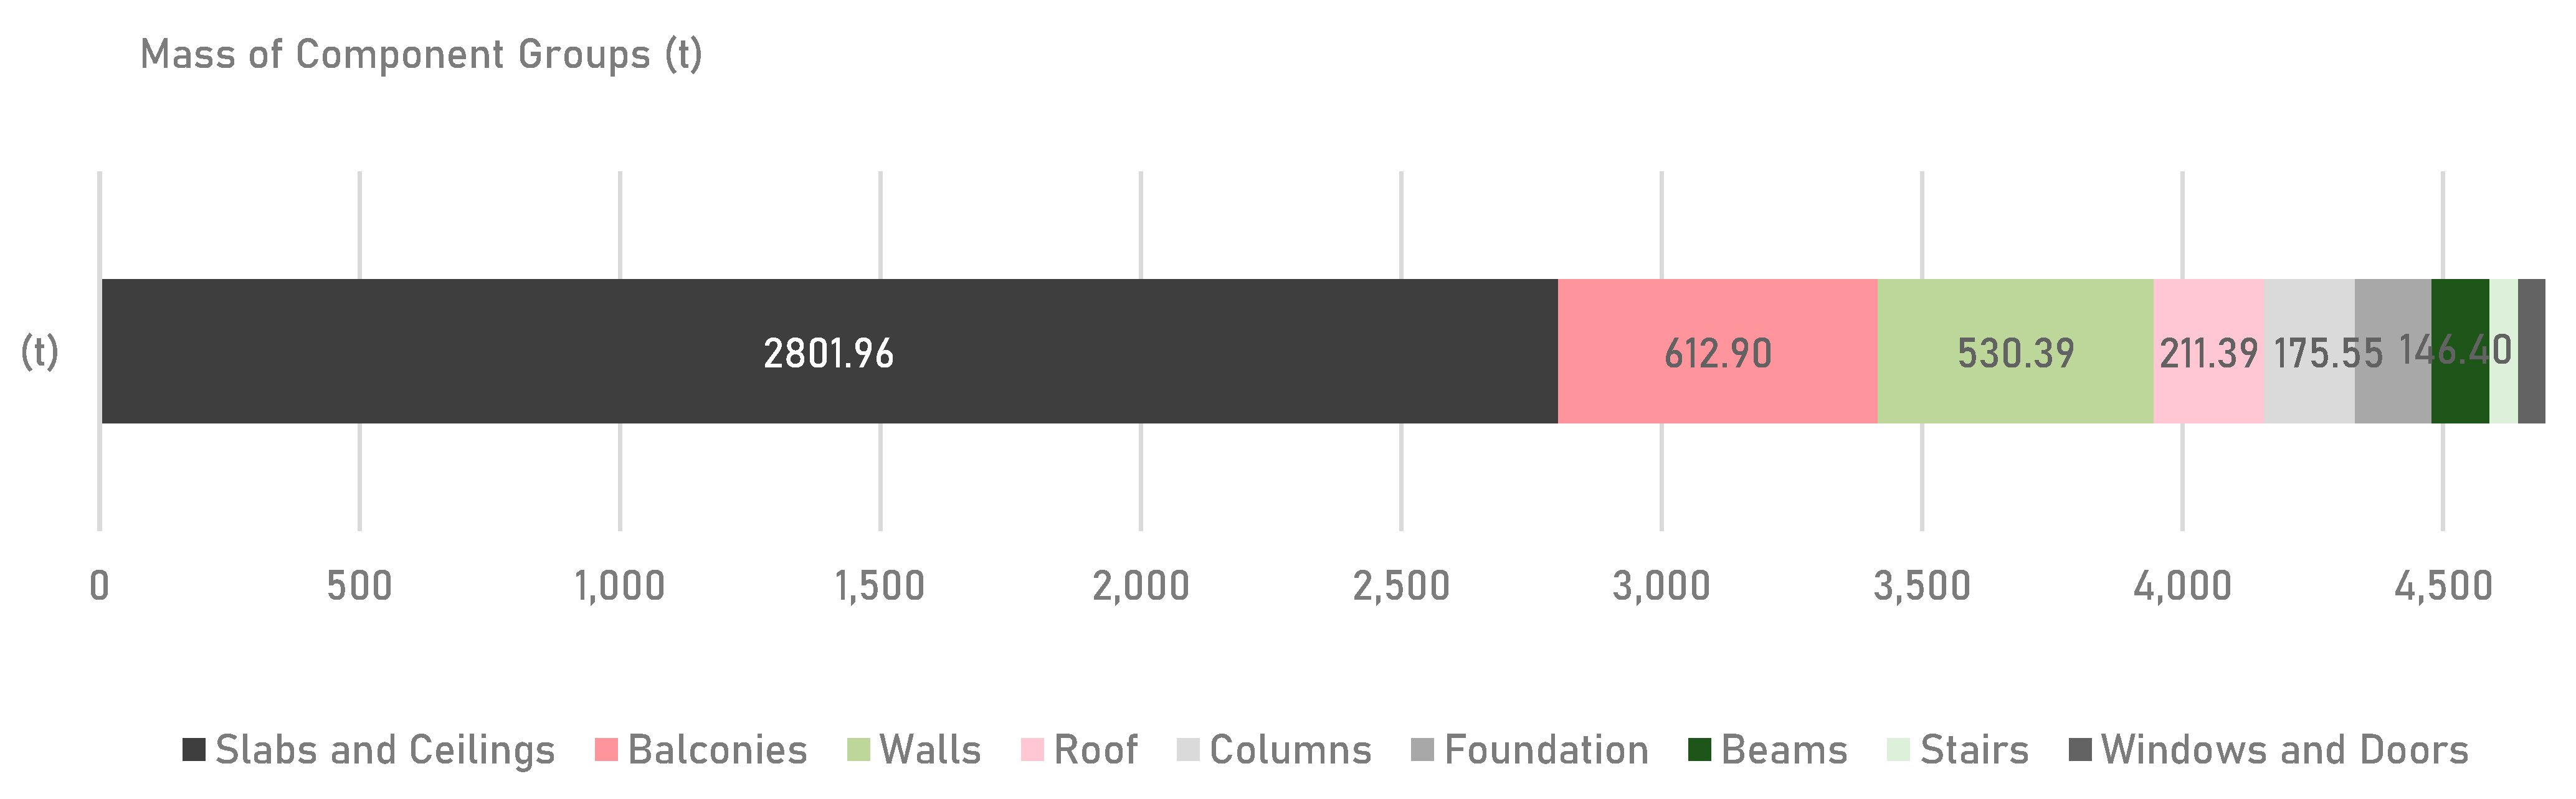
Figure 10.
Comparison of Mass at Construction and Mass after 100 Years at the assumed End of Life.
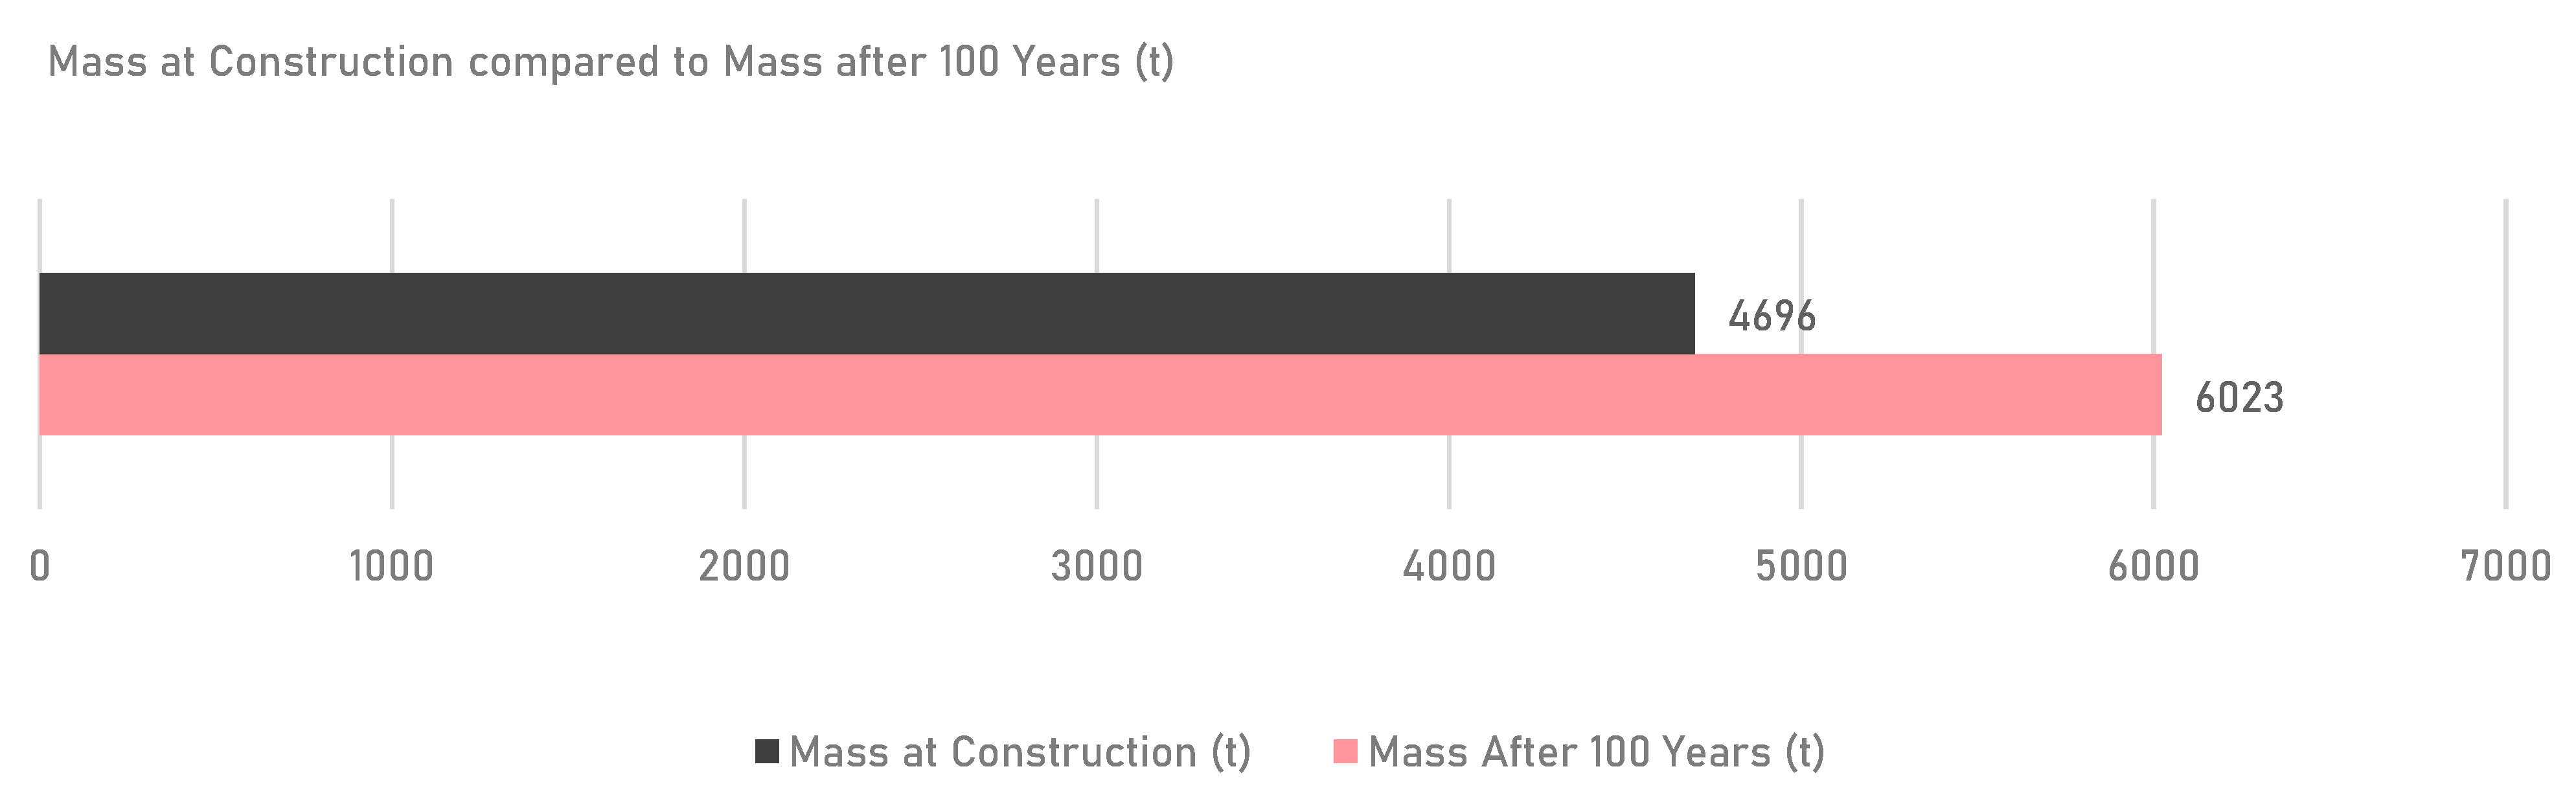
Figure 11.
Key Indicators of the Environmental Impact Assessment, GWP, AP and PENRT.
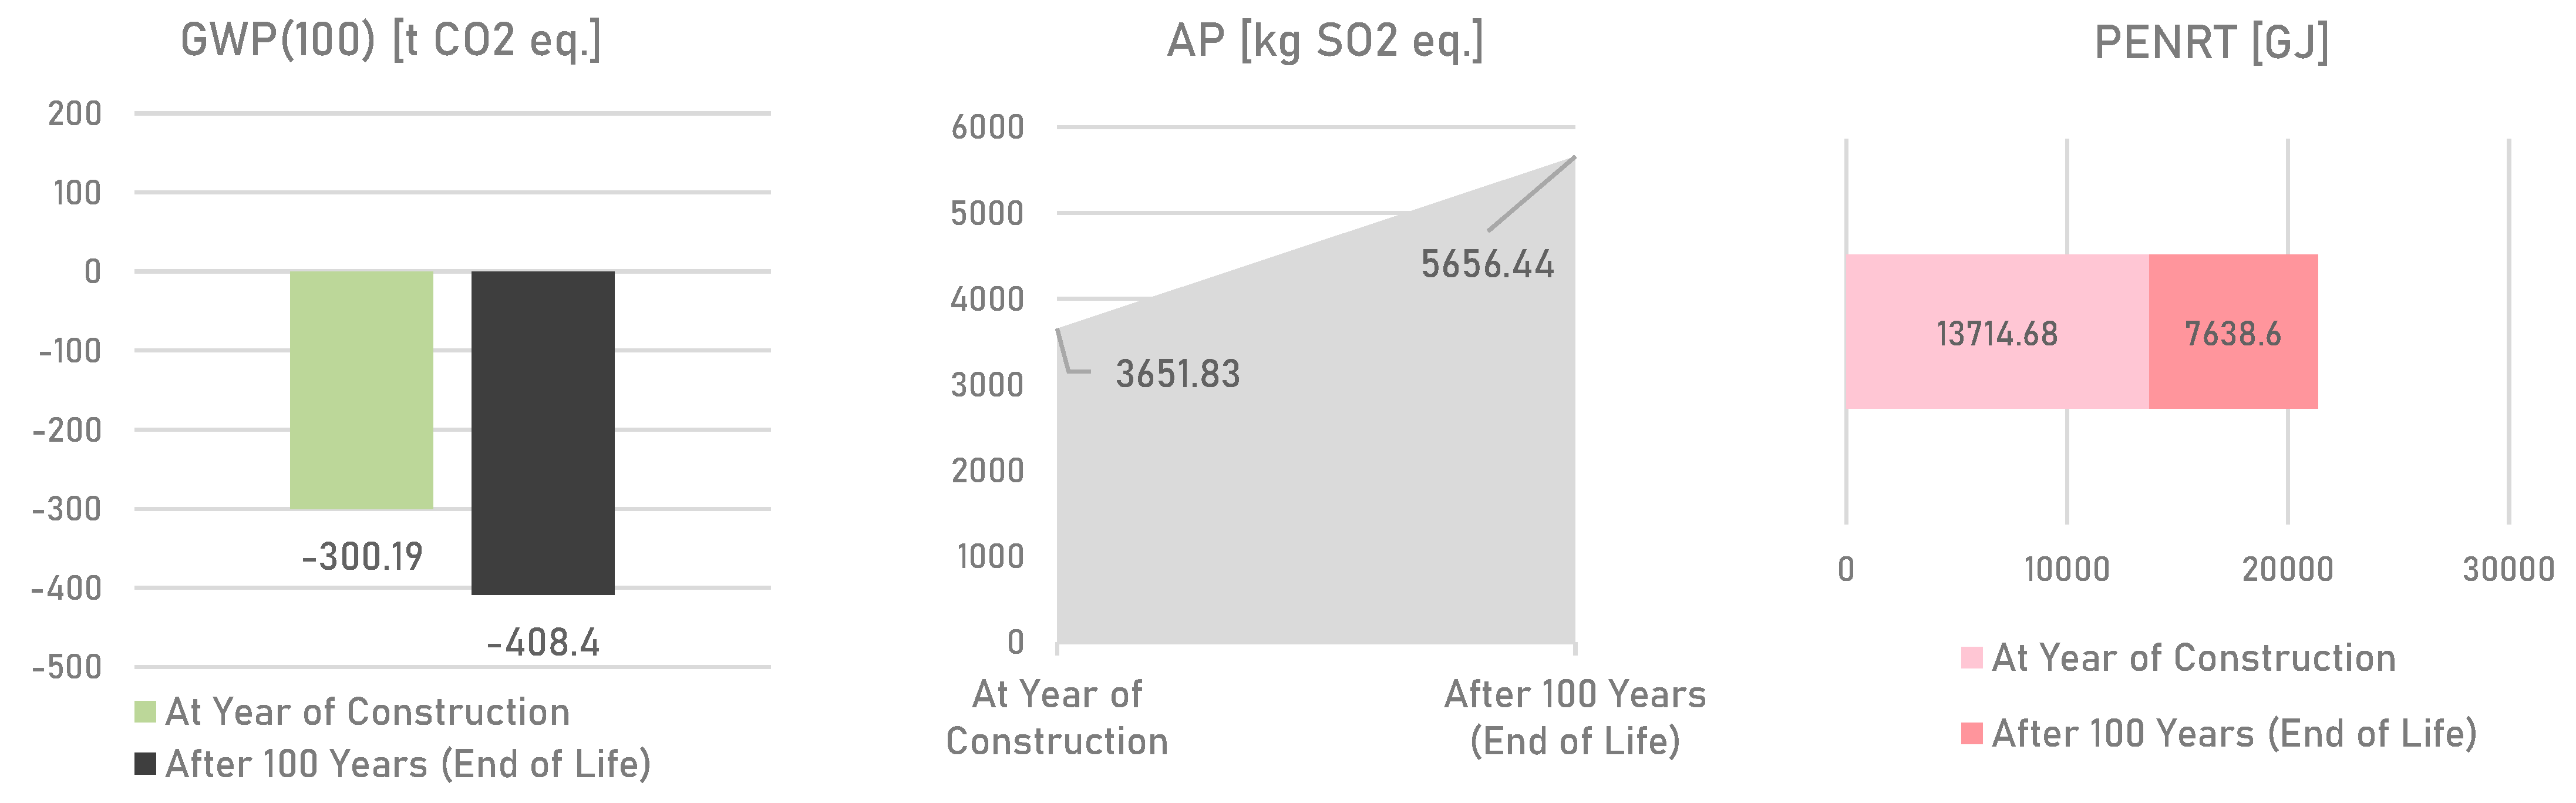
Figure 12.
EoL material mass distribution after 100 years - Recycling and Disposal Share.
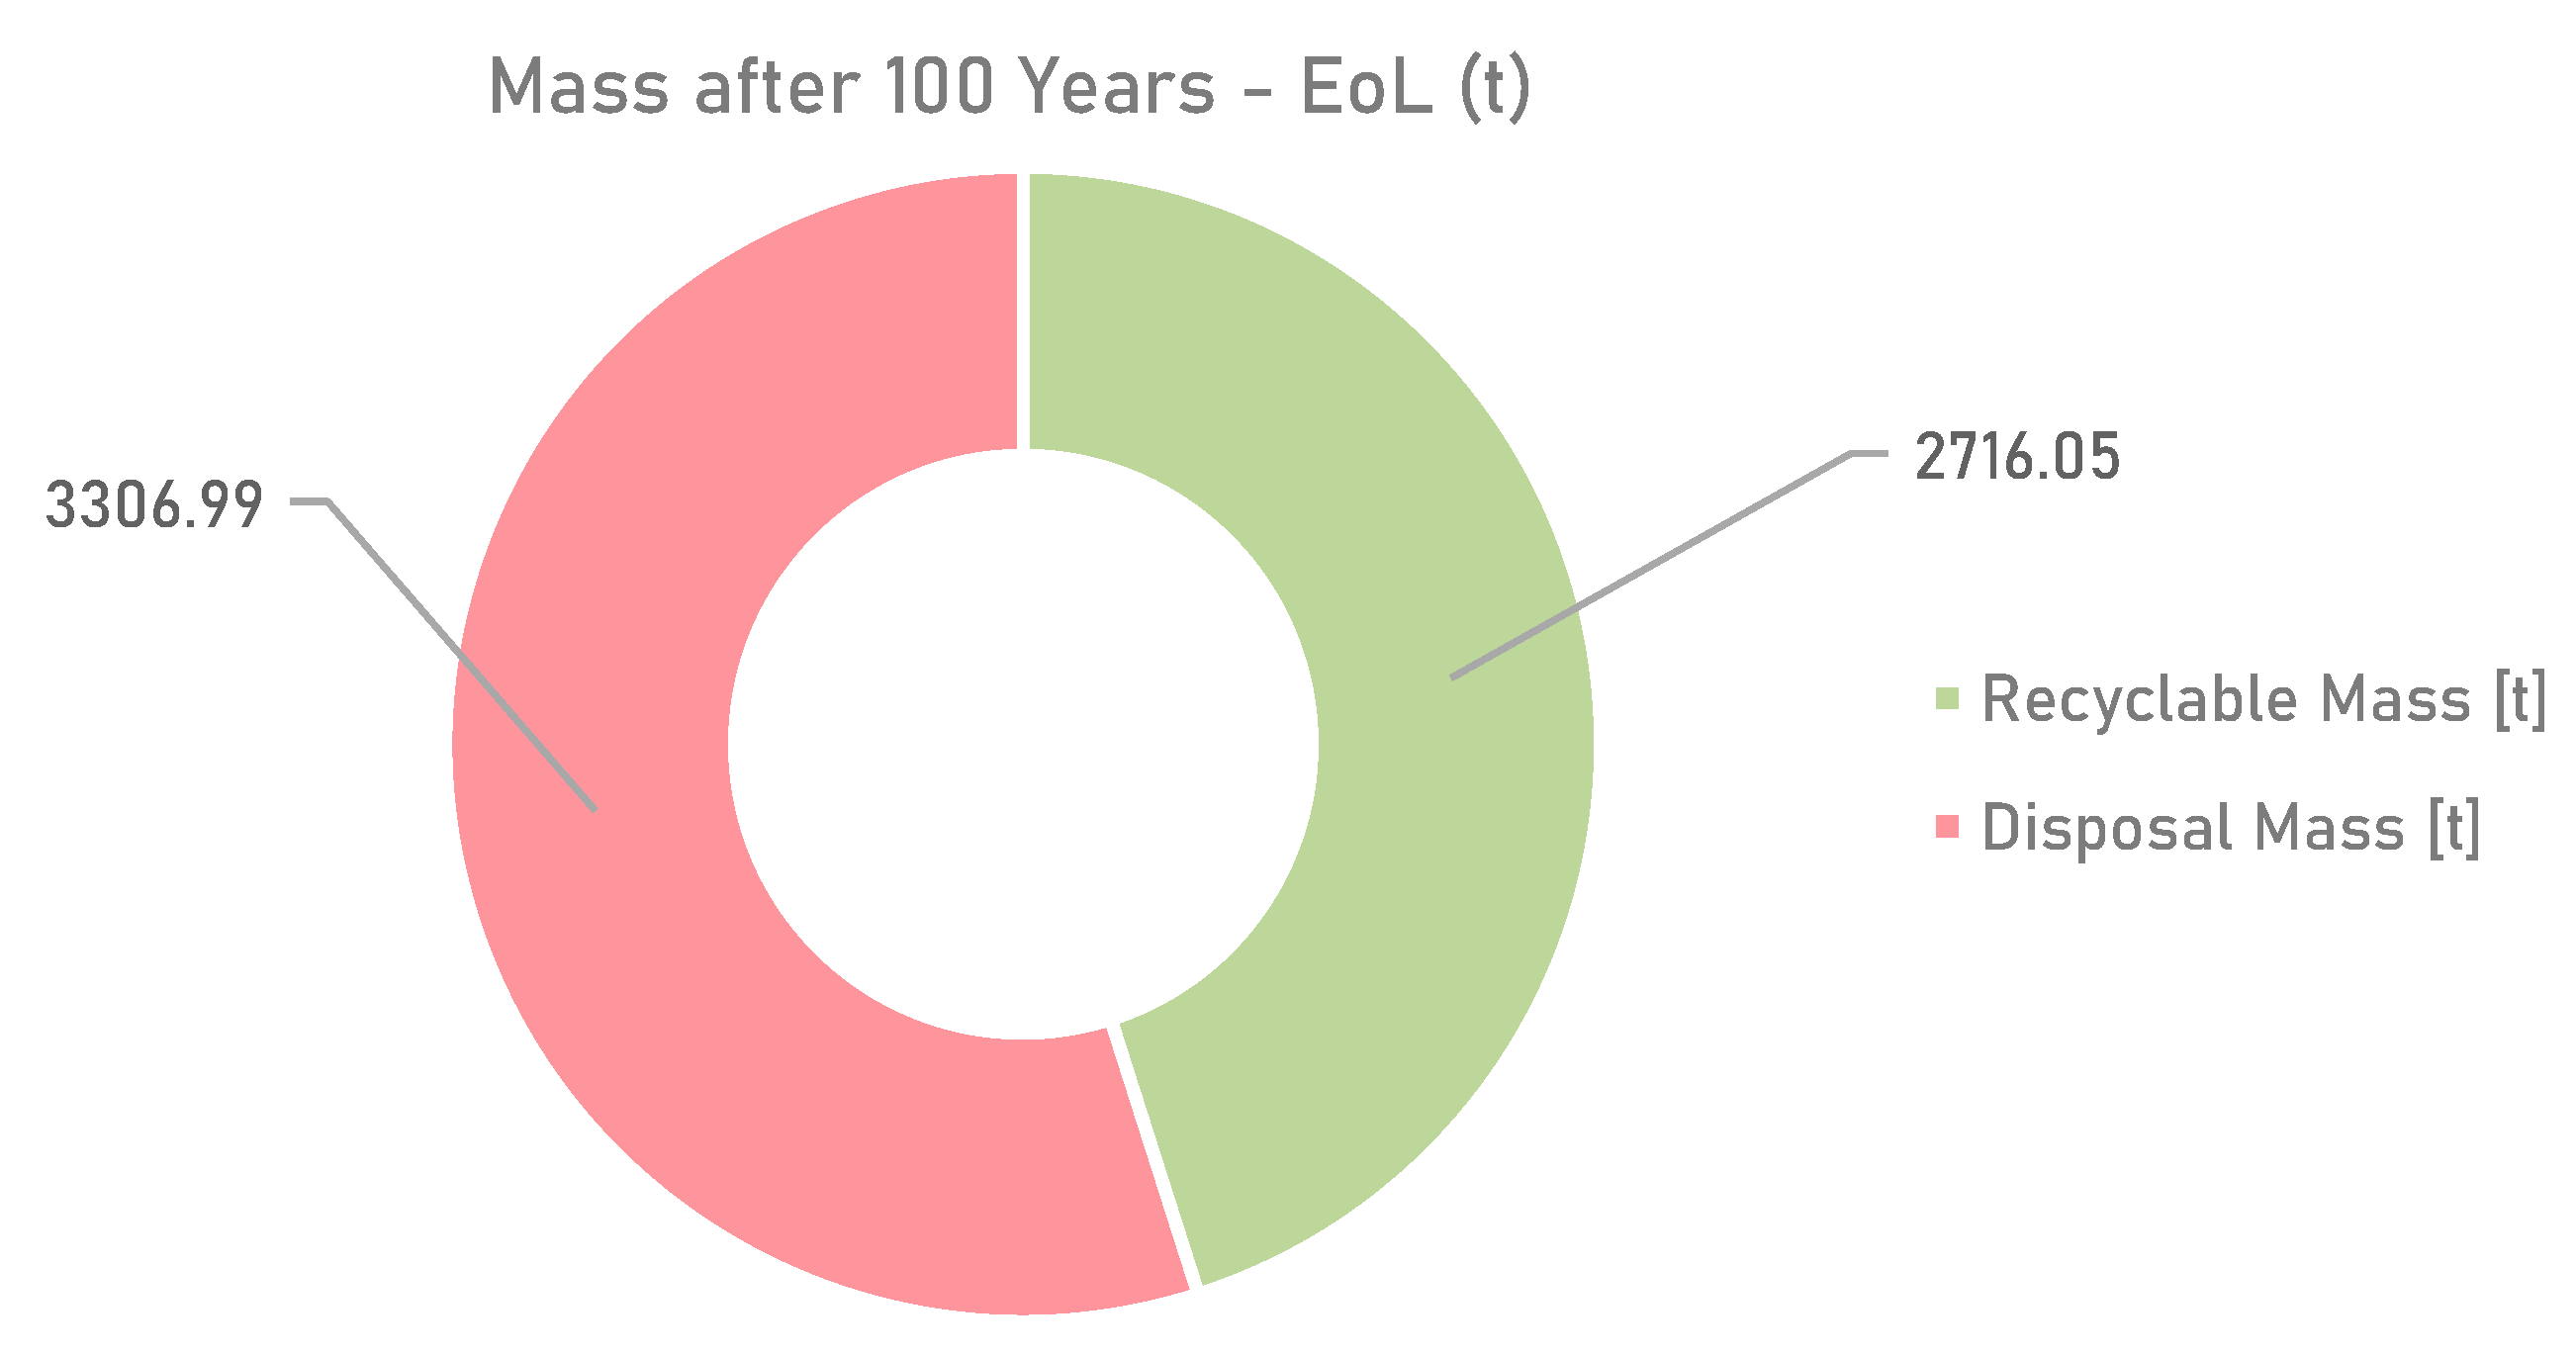
Figure 13.
Mass Increase Trend of Total Mass (t) over Life Cycle period, measured in tons.
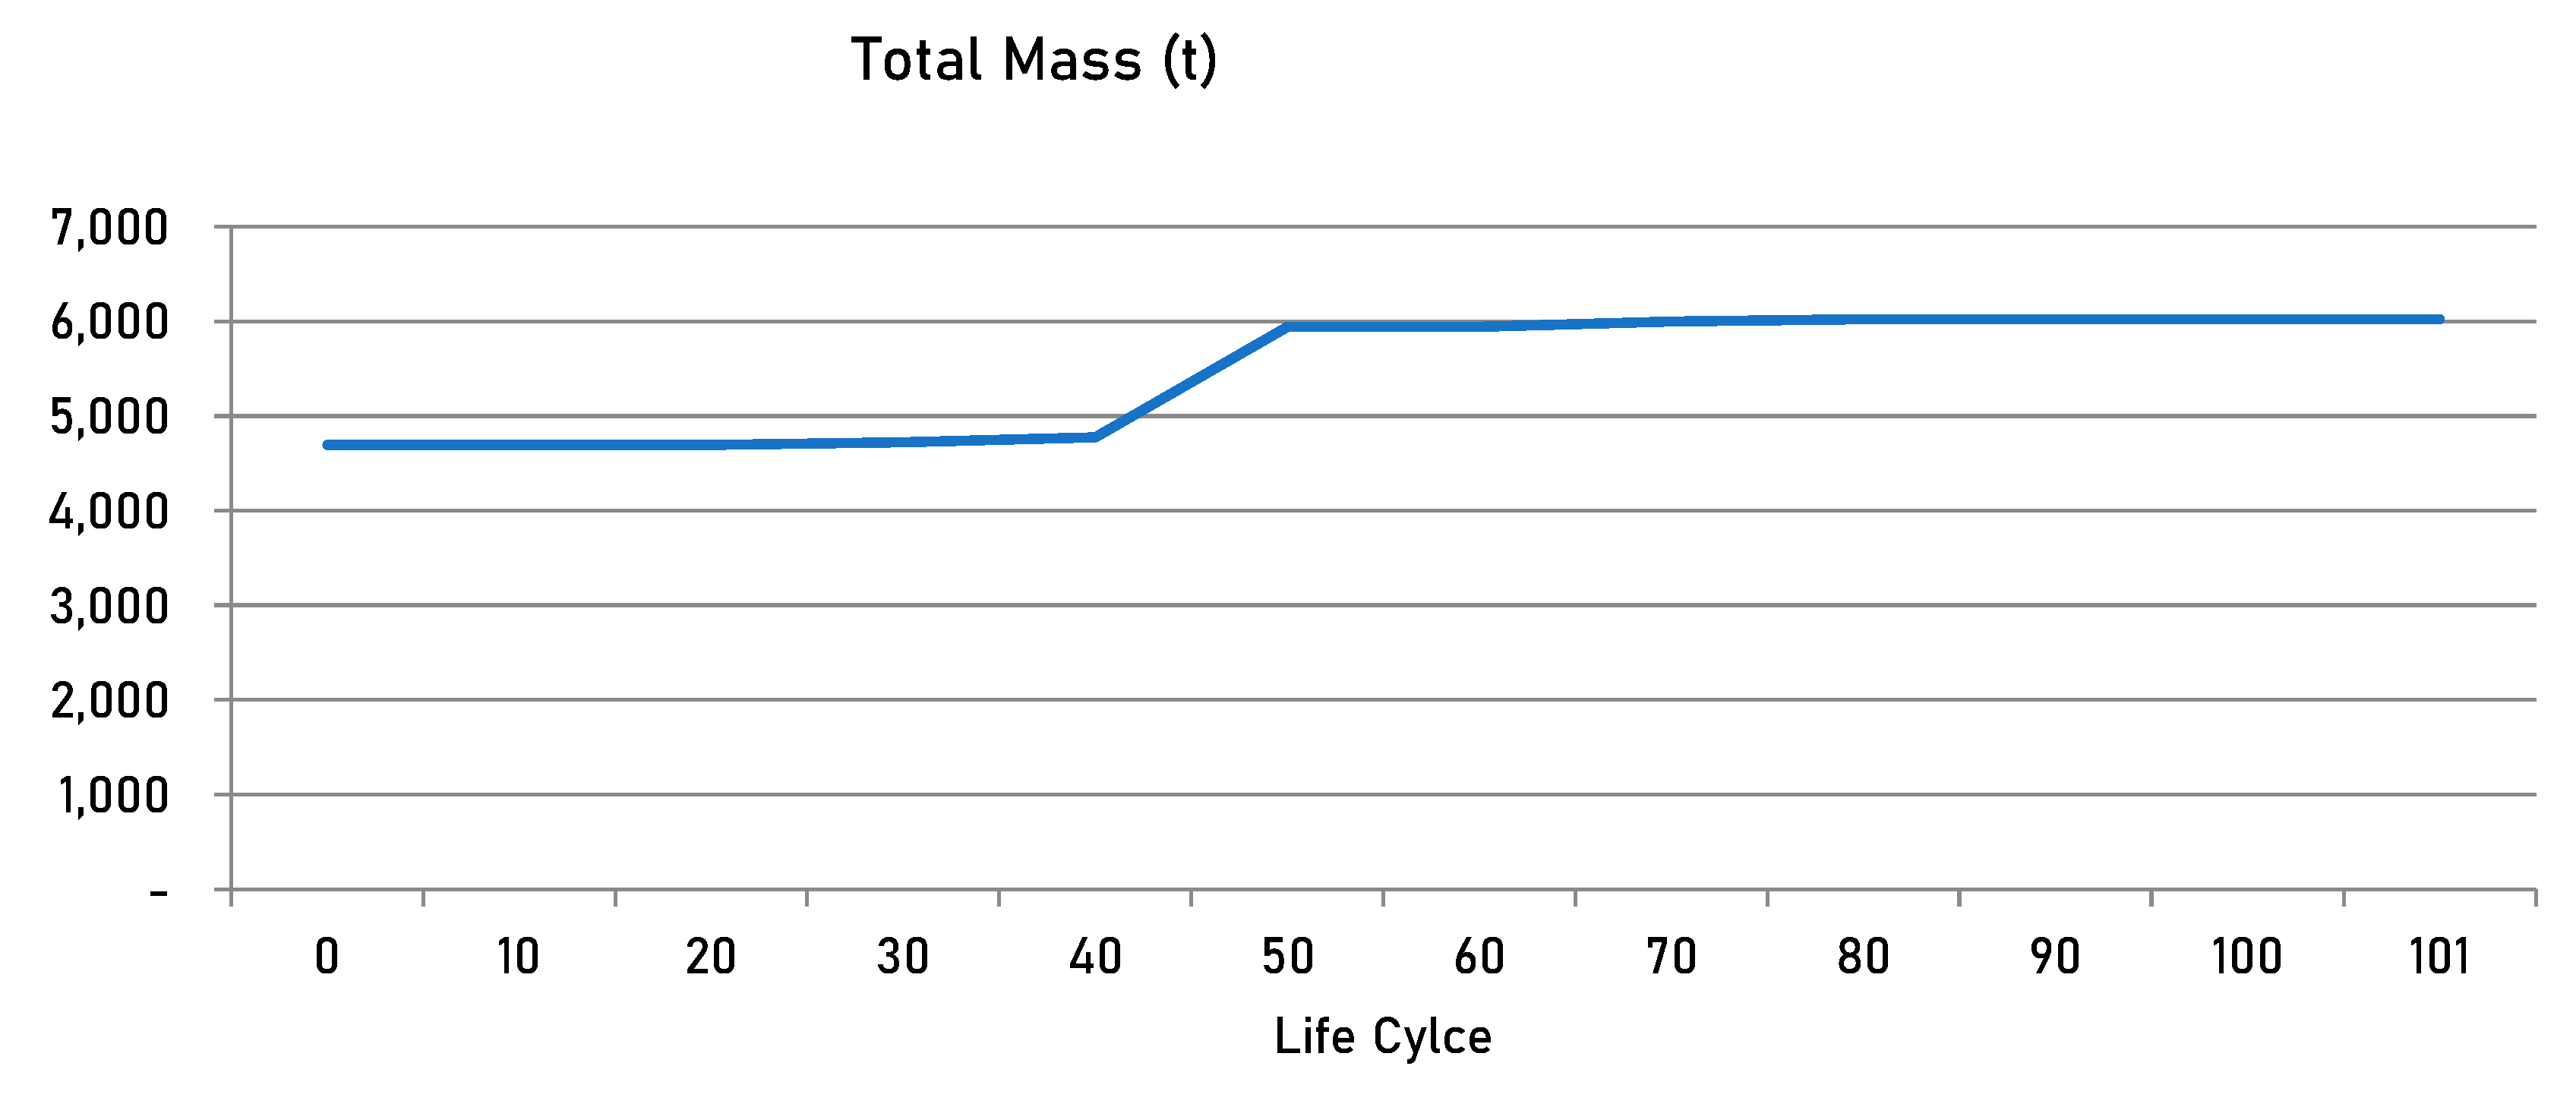
Figure 14.
Mass Increase Trend of Disposal Mass (t) over Life Cycle period, measured in tons (left) and Mass Increase Trend of Recyclable Mass (t) over Life Cycle period, measured in tons (right).
Figure 14.
Mass Increase Trend of Disposal Mass (t) over Life Cycle period, measured in tons (left) and Mass Increase Trend of Recyclable Mass (t) over Life Cycle period, measured in tons (right).
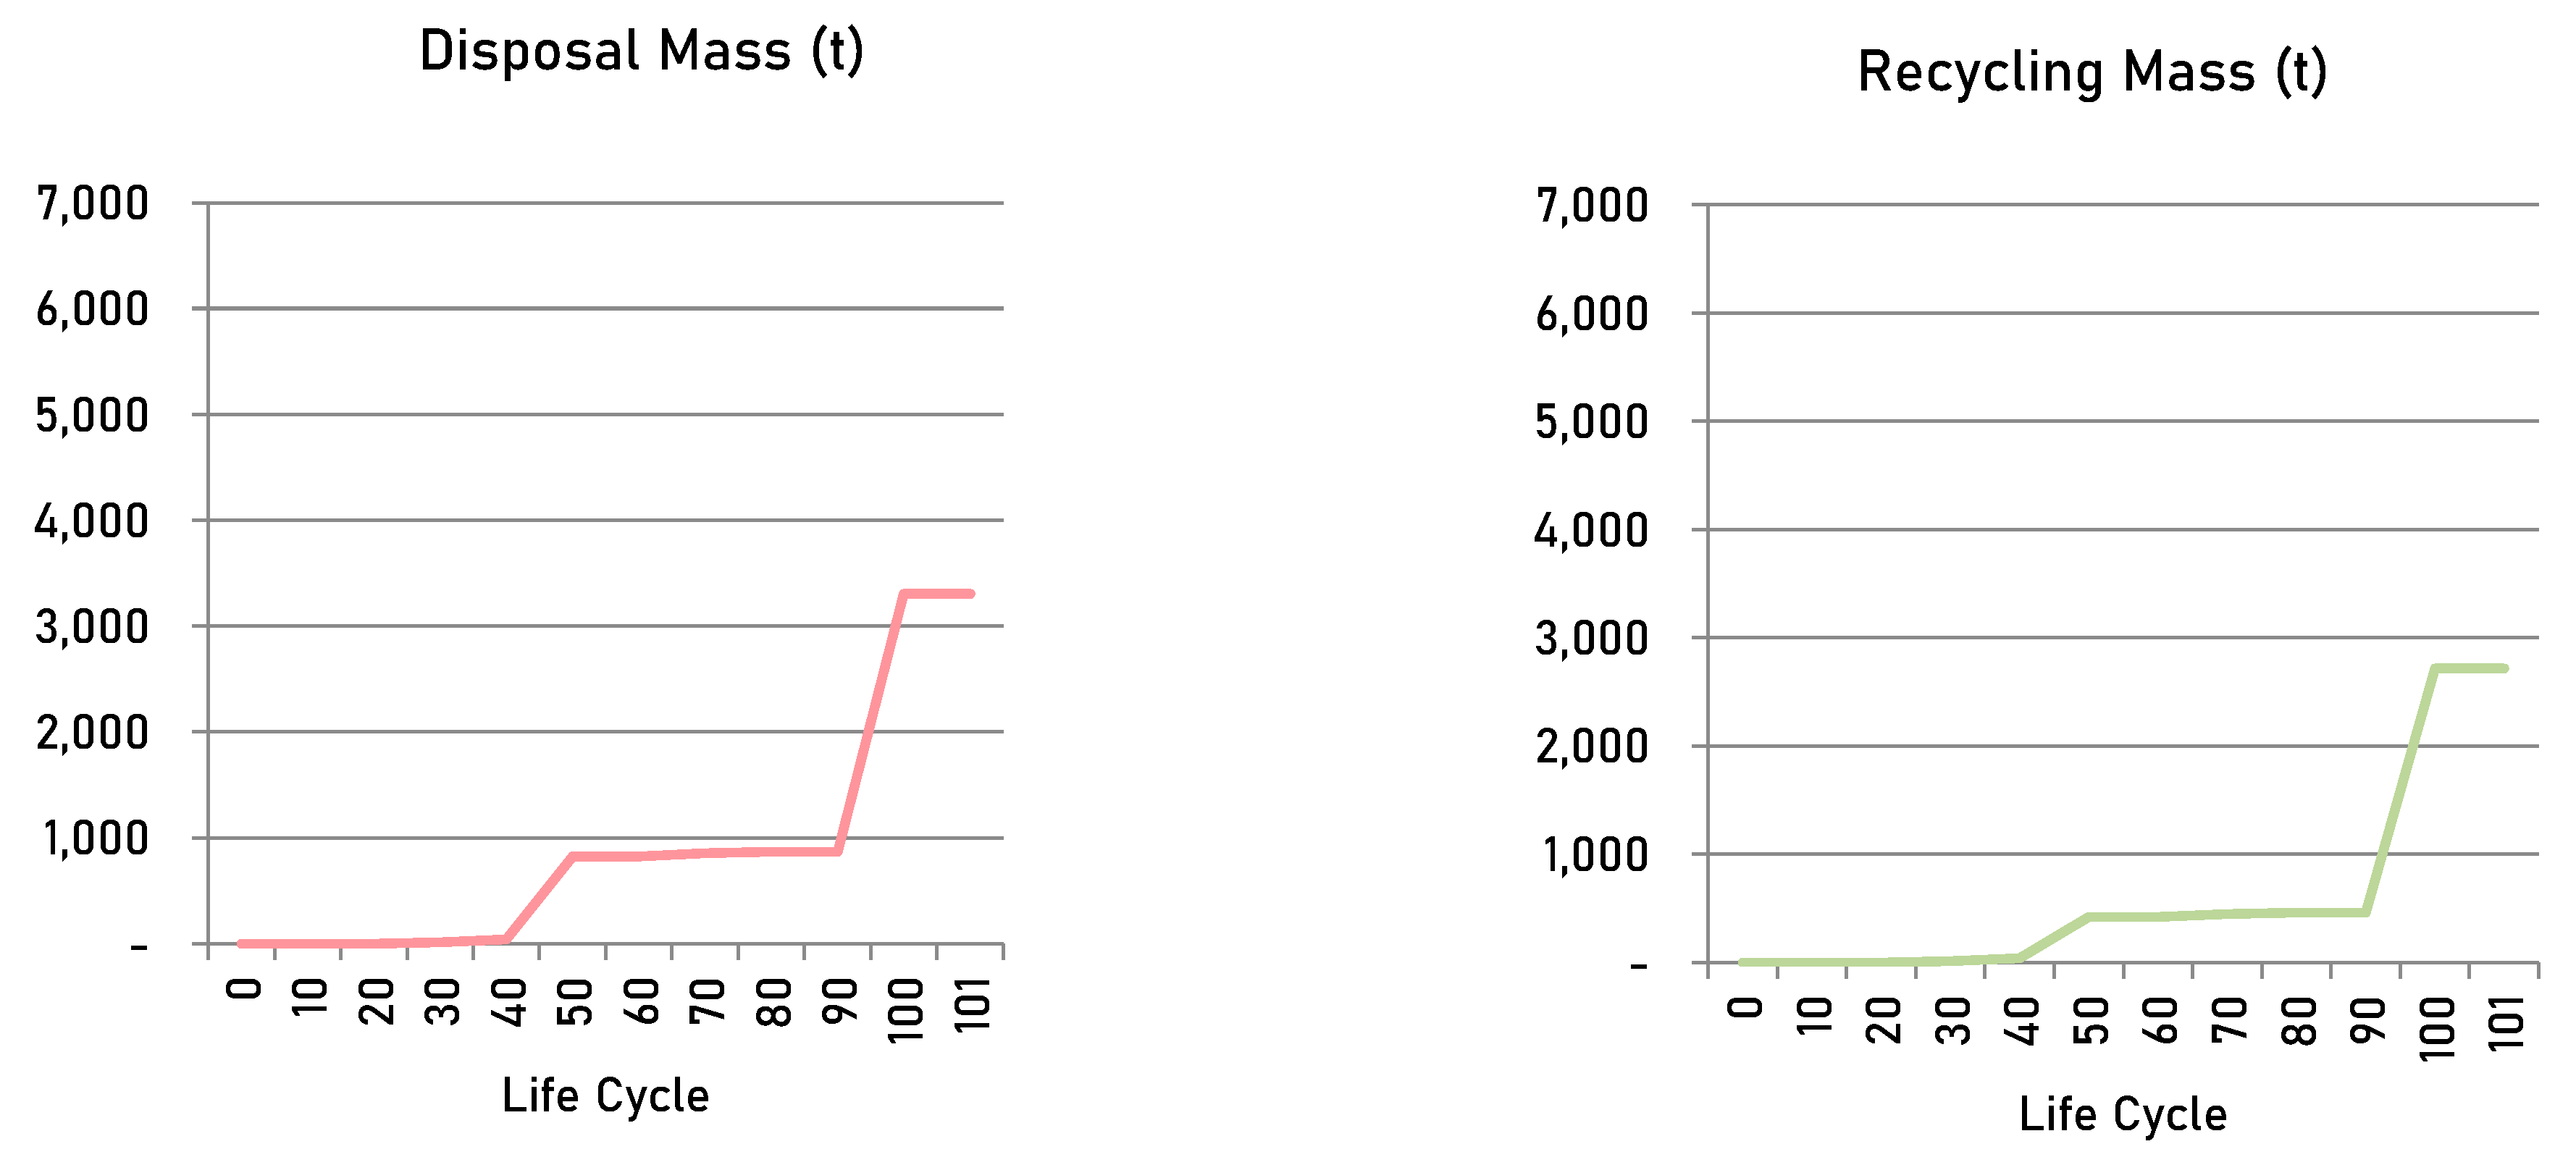
Figure 15.
Net Life Cycle Costs Over a 100-Year Period.
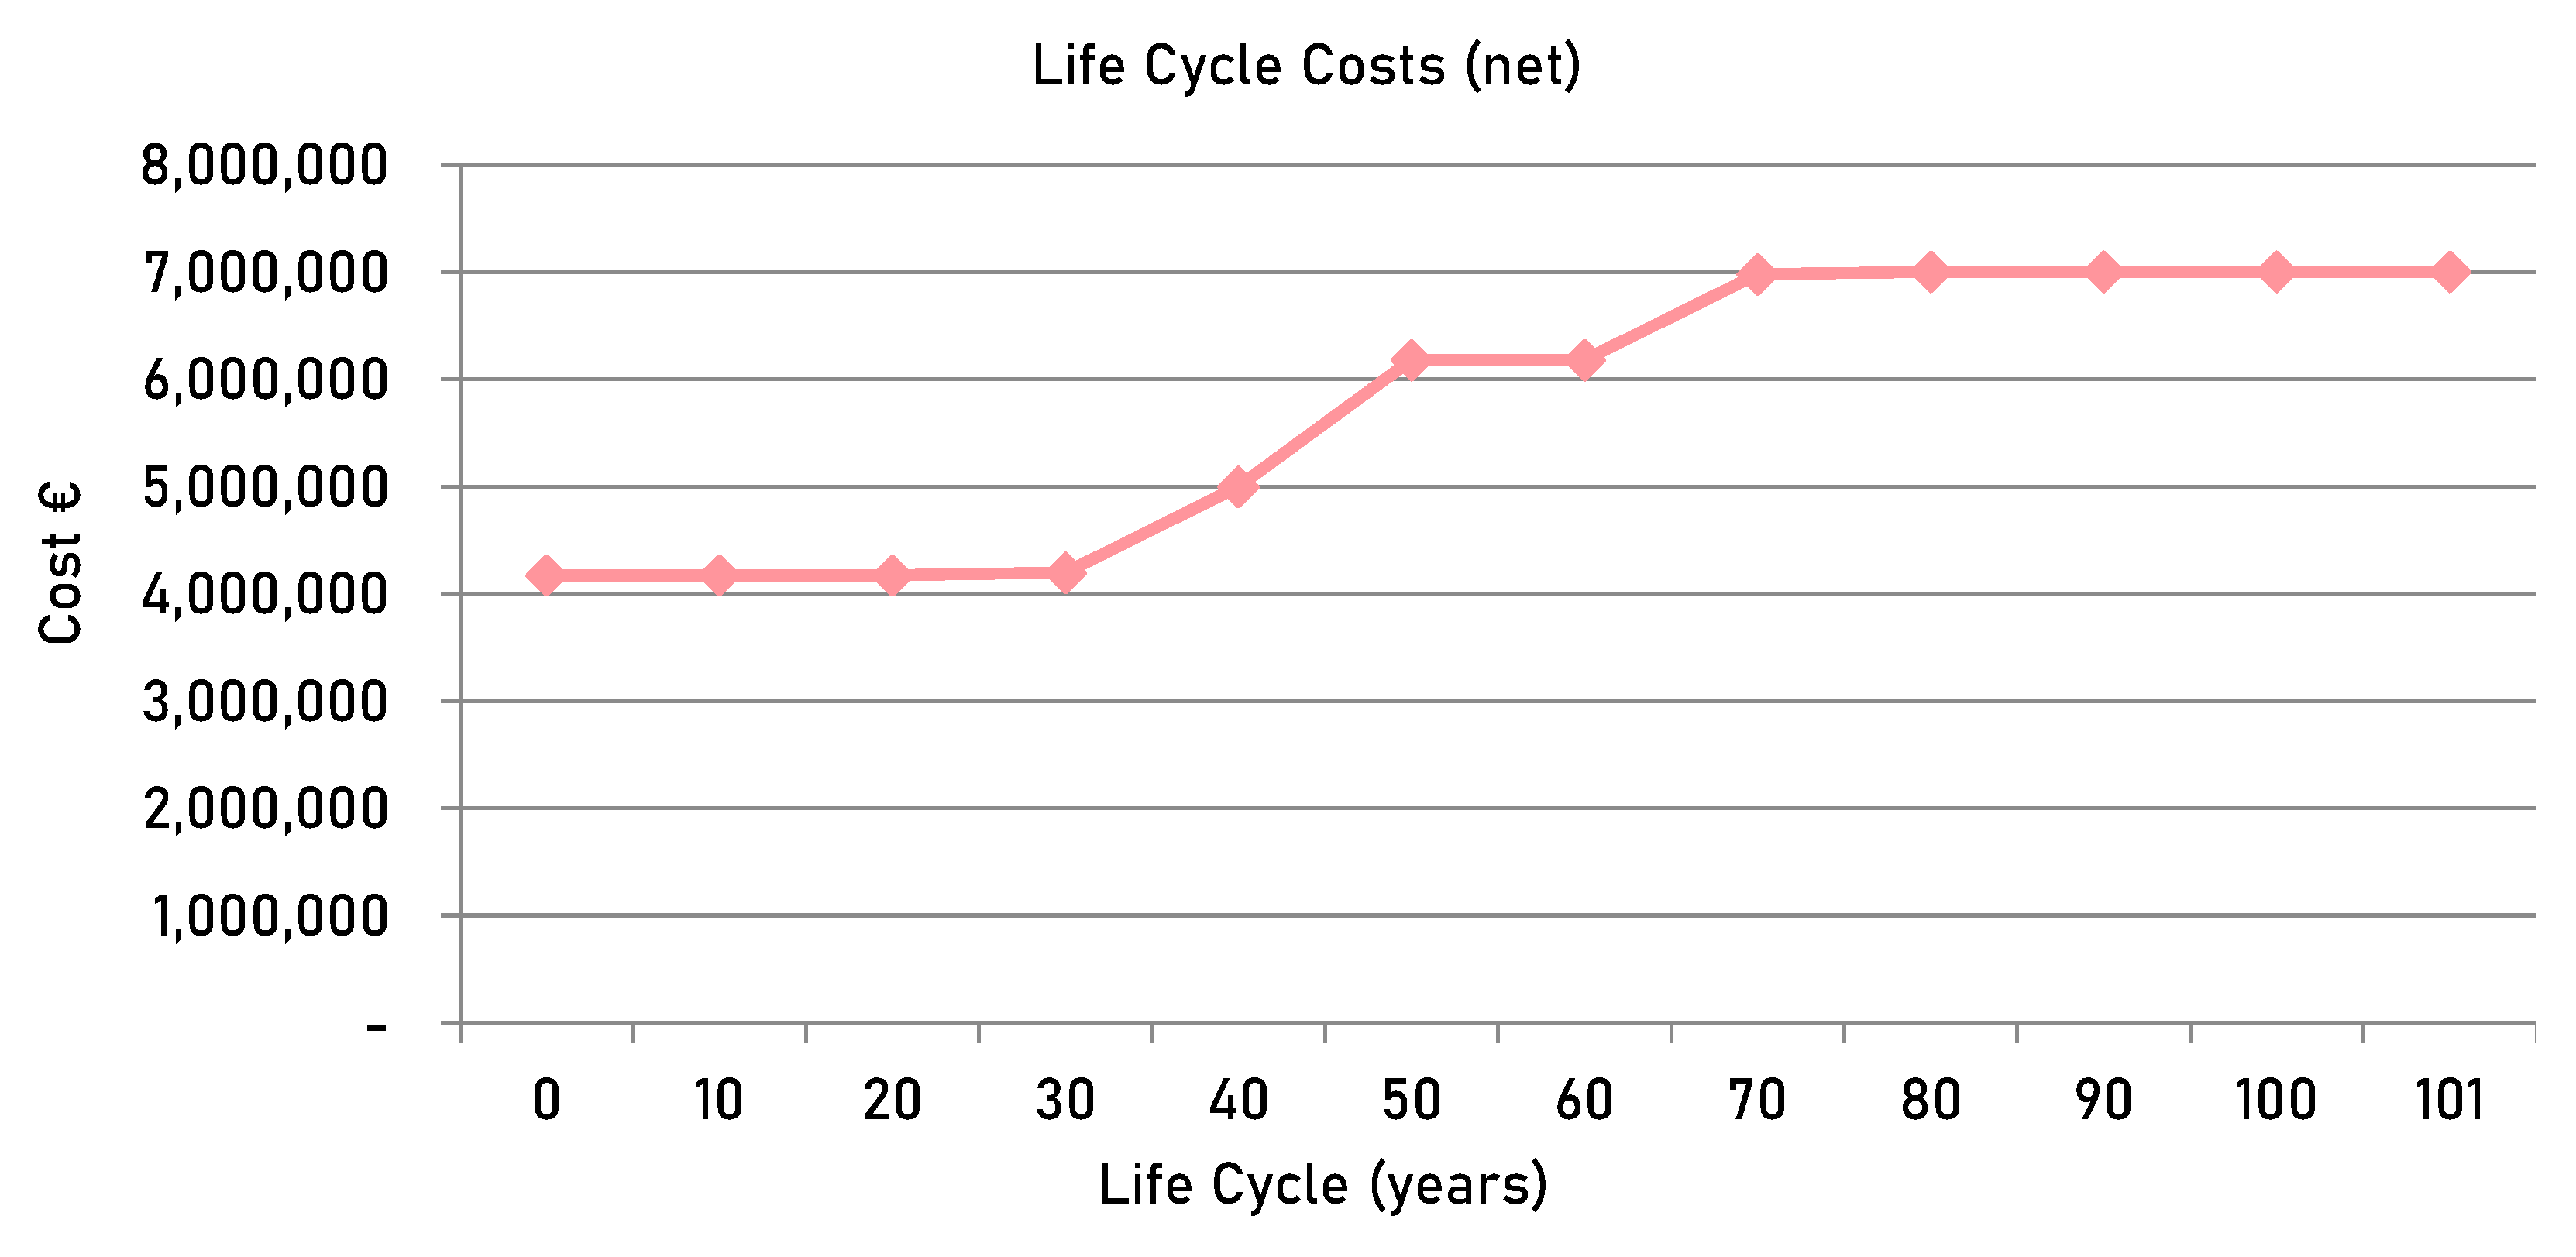
Table 1.
BIM Object Library Template listed in Category, Parameter, Description and Unit or Examples.
Table 1.
BIM Object Library Template listed in Category, Parameter, Description and Unit or Examples.
| Category | Parameter | Description | Unit/Examples |
| Component | Type | Horizontal or vertical Component / Element of Building | Wall, Slab, Beam, Column, Roof, Foundation, Flooring… |
| ID Component | Identification of Component | WE01(Exterior Wall 01) | |
| Component Information | Component Layers | List of various construction components. | e.g., Tiles, Dry Screed Plate |
| ID Layer | Identification of Layer | WE01-01 | |
| Corresponding Construction Layers | Specific types of materials used in construction. | e.g., FERMACELL gypsum fiber screed | |
| Lifespan | Expected lifespan of each material. Note: Over 100 years, the initial data will be multiplied by the number of times indicated by the lifespan. | Number of years (e.g., 10, 25, 35, 50, 100 years) | |
| Thickness of Layers | Thickness of each material layer. | Measurement in meters (e.g., 0.015 m) | |
| Material Properties | Material Classification | Classification based on the function of the material. | e.g., Flooring, Insulation |
| Building Material Category | Type of material based on composition. | organic, mineral, metallic | |
| Harmful Substances | List of harmful substances contained in the material / layer. | e.g., KMF, DEHP, H/F/C/KW, PAK | |
| Density | Density of each material / component layer | kg/m³ (e.g., 2300 kg/m³) | |
| Environmental Impact Metrics | GWP | Potential contribution to global warming. | kg CO2 eq./kg |
| AP | Potential to contribute to acidification. | kg SO2 eq./kg | |
| Primary Energy Non Renewable total (PENRT) | Primary Energy Non Renewable total. Primary energy input. | MJ/kg | |
| Disposal Classification | Dimensionless classification categorizing disposal difficulty, impacting waste volume calculations via multipliers. | Dimensionless (classification scale) | |
| Recycling Potential | Expressed as a percentage, indicating recyclability and potential for waste reduction. | Percentage (%) | |
| Mass and Environmental Impact | Mass per Area | Mass of material per square meter. | kg/m² |
| Mass at Construction | Mass of the material at the time of construction. | kg | |
| Mass after 100 Years | Mass of the material after 100 years. | kg | |
| Waste and Recycling Potential | Recycling Potential | Classification of the material’s potential for recycling and disposal. | Potential rating from 1 to 5 (e.g., high to medium to low) |
| Recyclable Mass at Construction | Mass of material that can be recycled after EOL considered at the time of construction. | kg | |
| Waste Mass at Construction | Mass of material that becomes waste after EOL considered at the time of construction. | kg | |
| Recyclable Mass after 100 Years | Mass of material that can be recycled after 100 years. Recyclable Mass at Construction * (100 / Lifespan) | kg | |
| Waste Mass after 100 Years | Mass of material that becomes waste after 100 years. Waste Mass at Construction * (100 / Lifespan) | kg | |
| Environmental Impact at Different LC- Stages |
GWP at Construction | Environmental impact in terms of GWP at the time of construction. | t CO2 eq. |
| AP at Construction | Environmental impact in terms of AP at the time of construction. | kg SO2 eq. | |
| PENRT at Construction | Primary energy non renewable total at the time of construction. | GJ | |
| GWP(100) after 100 Years | Environmental impact in terms of GWP after 100 years. GWP at Construction * (100 / Lifespan) | t CO2 eq. | |
| AP after 100 Years | Environmental impact in terms of AP after 100 years. AP at Construction * (100 / Lifespan) | kg SO2 eq. | |
| PENRT after 100 Years | Primary energy non renewable total after 100 years. PENRT at Construction * (100 / Lifespan) | GJ | |
| GWP Storage | The amount of CO2 stored in biogenic materials, expressed in kg or t CO2 eq./m² | t CO2 eq. | |
| Cost Information | Costs at Construction | Cost per square meter for each material/component as of 2022. | €/m² |
| Costs after 100 Years | Cost per square meter for each material/component after 100 years. Cost at Construction * (100 / Lifespan) | €/m² |
Table 3.
Metrics, Discription and Unit of Lifecycle Dataset.
| Metric | Description | Unit |
|---|---|---|
| GWP | Measures greenhouse gas emissions for each material, assessing climate change impact. | kg CO₂-equivalent |
| AP | Calculates emissions contributing to acidification, assessing impacts on ecosystems, infrastructure, and health. | kg SO₂-equivalent |
| Primary Energy Non-Renewable Total (PENRT) | Indicates total non-renewable energy consumed throughout a material’s lifecycle, reflecting resource depletion. | Megajoules (MJ) |
| Disposal Classification | Dimensionless classification categorizing disposal difficulty, impacting waste volume calculations via multipliers. | Dimensionless (classification scale 1 to 5) |
| Recycling Potential | Expressed as a percentage, indicating recyclability and potential for waste reduction. | Percentage (%) |
| Lifespan per Layer | Represents expected service life of each material element layer, accounting for durability and replacement cycles. | Years (yr) |
Table 4.
Granular Display of Individual Building Elements of the Environmental Impact Assessment.
| Element | At Year of Construction | After 100 Years EoL | ||||
|---|---|---|---|---|---|---|
| GWP(100) [t CO2 eq.] |
AP [kg SO2 eq.] |
PENRT [GJ] |
GWP(100) [t CO2 eq.] |
AP [kg SO2 eq.] |
PENRT [GJ] |
|
| Slabs and Ceilings | -51,65 | 2447,59 | 9136,02 | 32,62 | 3552,29 | 13435,51 |
| Walls | -306,3 | 1001,87 | 3663,38 | -525,52 | 1901,78 | 7002,49 |
| Beams | 3,31 | 42,74 | 254,05 | 30,05 | 42,74 | 254,05 |
| Columns | 21,86 | 73 | 326,56 | 21,86 | 73 | 326,56 |
| Stairs | 8,96 | 23,82 | 92,02 | 8,96 | 23,82 | 92,02 |
| Foundations | 23,63 | 62,81 | 242,65 | 23,63 | 62,81 | 242,65 |
| Sum | -300,19 | 3651,83 | 13714,68 | -408,4 | 5656,44 | 21353,28 |
Table 5.
Granular presentation of the recyclable and disposal mass of the use cases building elements after 100 years at the EoL.
Table 5.
Granular presentation of the recyclable and disposal mass of the use cases building elements after 100 years at the EoL.
| Elements after 100 Years EoL | Recyclable Mass [t] | Disposal Mass [t] |
| Concrete Slab - General | 695,93 | 772,82 |
| Concrete Slab - Kitchen/Bathroom | 94,00 | 116,48 |
| Concrete Slab - Living Area | 261,57 | 325,65 |
| Wooden Ceiling - Kitchen/Bathroom | 146,54 | 177,32 |
| Wooden Ceiling - Living Area | 492,12 | 600,05 |
| Wooden Flat Roof | 119,92 | 120,18 |
| Concrete Balcony | 306,45 | 306,45 |
| Exterior Wall 01 | 32,69 | 36,67 |
| Exterior Wall 02 | 58,40 | 139,76 |
| Interior Wall 01 | 59,32 | 135,66 |
| Interior Wall 02 | 52,96 | 52,96 |
| Partition Wall | 50,29 | 170,03 |
| Shaft Walls | 7,42 | 14,05 |
| Attica | 13,53 | 30,17 |
| Concrete Beams | 49,78 | 49,78 |
| Glulam Beams | 8,12 | 2,71 |
| Steel Beams | 0,39 | 0,13 |
| Concrete Columns | 85,07 | 85,07 |
| Glulam Columns | 3,73 | 1,24 |
| Steel Columns | 0,34 | 0,11 |
| Concrete Stairs | 27,76 | 27,76 |
| Wooden Windows | 19,88 | 19,88 |
| Glass Surfaces Windows | 20,61 | 20,61 |
| Wooden Doors | 11,67 | 3,89 |
| Glass Surfaces Doors | 24,37 | 24,37 |
| Concrete Foundations | 73,20 | 73,20 |
| Sum Mass [t] | 2716,05 | 3306,99 |
Table 6.
Initial Construction Costs and The Costs after 100 Years at EoL displayed in Euro (€) and Increase in Percent (%).
Table 6.
Initial Construction Costs and The Costs after 100 Years at EoL displayed in Euro (€) and Increase in Percent (%).
| Component | At Construction (€) | After 100 Years (€) | Increase (%) |
|---|---|---|---|
| Slabs and Ceilings | 1,749,324.11 | 2,258,235.42 | 29.06% |
| Walls | 1,099,900.92 | 1,706,316.42 | 55.12% |
| Beams | 118,544.09 | 118,544.09 | 0% |
| Columns | 200,372.80 | 200,372.80 | 0% |
| Stairs | 50,048.93 | 50,048.93 | 0% |
| Windows | 462,468.37 | 1,387,405.12 | 200.05% |
| Doors | 470,244.18 | 1,258,845.62 | 167.60% |
| Foundations | 22,513.61 | 22,513.61 | 0% |
| Total | 4,173,417.02 | 7,002,282.01 | 67.73% |
| Incl. 20% VAT | 5,008,100.42 | 8,402,738.41 |
Table 7.
Exzerpt of Cost Comparison between BKI and Actual Firm Prices.
| Component | Difference (€) | Difference (%) |
|---|---|---|
| Interior Wall Wood | -141.09 | 47% |
| Interior Wall Gypsum | -75.16 | 50% |
| Beam Glulam | 14,406.87 | 16% |
| Window | 206.13 | -46% |
| Foundation Concrete | 119.08 | -48% |
Table 8.
Future Research and Expected Benefits.
| Future Research |
Description | Expected Benefits |
|---|---|---|
| Data Integration Interoperability | Develop systems that integrate data from environmental metrics, cost benchmarks, and external databases. Ensure interoperability between building models and various databases to enable smooth data exchanges across project stages. | Enhanced collaboration among stakeholders and informed decision-making through consistent data flow and reduced information silos. |
| Automated Calculation of Key Metrics | Focus on automating the calculation of critical metrics (GWP, AP, PENRT, recycling/disposal rates) and dynamically link them to model components. | Improved efficiency and accuracy in environmental impact assessments, allowing immediate reflection of design/material changes in circularity and sustainability assessments. |
| Flexible Assessment Approaches | Research variant-based approaches for assessing area, volume, mass, environmental impacts, and economic implications, independently or in combination, to cater to specific project requirements. | Iterative design processes by offering flexible assessments, supporting quick adjustments as project details evolve. |
| Interactive Dashboards | Develop real-time dashboards with features such as component-specific impacts, aggregate project impacts, and benchmarking against industry standards. | Monitor circularity and environmental impacts in real time, suggesting material/process improvements and encouraging continuous improvement. |
| Decision-Support Tool | Create decision-support tools that provide real-time feedback on environmental and economic implications, with scenario analysis for testing materials, configurations, and circularity measures. | Design choices, optimizing for both sustainability and cost-efficiency through informed scenario-based decisions. |
Disclaimer/Publisher’s Note: The statements, opinions and data contained in all publications are solely those of the individual author(s) and contributor(s) and not of MDPI and/or the editor(s). MDPI and/or the editor(s) disclaim responsibility for any injury to people or property resulting from any ideas, methods, instructions or products referred to in the content. |
© 2025 by the authors. Licensee MDPI, Basel, Switzerland. This article is an open access article distributed under the terms and conditions of the Creative Commons Attribution (CC BY) license (http://creativecommons.org/licenses/by/4.0/).
Copyright: This open access article is published under a Creative Commons CC BY 4.0 license, which permit the free download, distribution, and reuse, provided that the author and preprint are cited in any reuse.


