
Submitted:
23 February 2024
Posted:
23 February 2024
You are already at the latest version
Abstract
The European Green Deal is the policy established by the EU against global environmental problems. However, it is closely concerned with the countries carrying import and export activities with the EU. Because it is planned to impose an obligation to declare greenhouse gas emission inventories of products imported into the EU, the EU will soon begin to assess the CBAM on imports from carbon-intensive industries. This regulation is expected to affect Turkey-EU trade relations. One of the industries that Turkey has export relations with the EU is the building materials industry. For this reason, it will have had necessary to provide sustainability criteria for the export of building materials. However, there is no database in Turkey where the inventory data of building materials is declared. In Turkey, within the scope of EU Green Deal action plans, it is aimed to create different structures for environmental information of building materials in the medium and long term. In light of such information, within the scope of this study it is aimed to create reference information for building material databases to be developed in Turkey. The study recommends weight and normalization reference values following the life cycle assessment methodology defined by ISO 14040 and ISO 14044 international standards. Twelve environmental impact categories accepted in the literature, including greenhouse gas emissions, have been considered as the environmental impacts of building materials. Semi-structured interviews were held with twenty-one industry stakeholders in Tur-key to determine the weight reference values. The results obtained from the semi-structured interviews were combined using the AHP method. An extensive research study was conducted on Turkey’s national inventory data to determine normalization reference values. Environmental impact calculations were carried out for different building materials in a case study to present the importance of regional adaptation of the determined reference values. The recommended reference information may be used in greenhouse gas emission declarations under the EU Green Deal and other potential environmental impact declarations from building materials.
Keywords:
European green deal
; greenhouse gas emissions
; building materials
; environmental impact
; sustainability.
1. Introduction
The scope of the European Green Deal was developed to ensure sustainability in EU countries; it is aimed to reduce greenhouse gas emissions to 1990 levels by 2030 in EU countries and to be carbon neutral until 2050 [1]. A gradual transition to CBAM, which entered into force in October 2023, will be achieved within three years. Within the scope of CBAM, it will be obligatory to declare inventory data of greenhouse gas emissions of products imported into the EU. Products will be taxed based on their greenhouse gas emissions. For this reason, the European Green Deal has become essential for non-EU countries with import and export relations with EU countries [2]. Turkey exports products to the EU in many industries, including the building materials industry. There has yet to be a database in Turkey where inventory data of building materials has been declared. However, within the scope of the European Green Deal, it is estimated that some tools will be established in which the sustainability criteria are carried out, and the inventory data of the building materials are declared in order to be able to export the building materials [3].
Building materials cause various environmental problems in their life cycle, including greenhouse gas emissions. Construction activities and buildings are responsible for 50% of natural resource use, 30% of energy consumption, 40% of carbon dioxide (CO2) emissions, 12% of water consumption, and 25% of solid waste generation on a global scale [4,5,6]. The life cycle means the process of the raw material supply, manufacture, transportation, use, and disposal of products or services. LCA, on the other hand, is an approach through which potential environmental impacts of both products and services during their life cycles are identified, reported, and managed [7,8,9,10]. There is no limitation in ISO 14044 (2006) [11] for the environmental impact categories assessed in LCAs. However, the assessed environmental impact categories have to be internationally accepted. Within the scope of this study, twelve environmental impact categories were evaluated, of which eleven are acidification, air pollution, ecological toxicity, eutrophication, fossil fuel depletion, global warming, human health, land-use, ozone depletion, photochemical smog formation, water intake comes from the EN 15804:2012+A2:2019 [12] standard; another one, indoor air quality, comes from BEES, a building material evaluation tool. In the literature, there are many studies that take into account the environmental impacts of building materials on the twelve environmental impact categories referred to here.
Estokova et al. (2017) [13] concluded that 30,4% of acidification potential from building materials in Central Europe. Pacheco-Torgal & Jalali (2011) [14] stated that even though most of the existing buildings are built following legal regulations, the practitioners may need to learn the toxic properties of the materials or contain toxic building materials due to economic factors. For instance, some blast furnace slags and fly ashes used in concrete have radioactive properties. The energy requirements of building materials in the life cycle stages, such as raw material supply, production, and transportation, are primarily based on fossil fuels. Depending on the combustion of fossil fuels in vehicle engines, pollutants such as nitrogen monoxide (NO), carbon monoxide (CO), CO2, volatile organic compounds (VOC), nitrogen dioxide (NO2), and ozone (O3) are released [15] and these pollutants cause photochemical smog formation. As stated in the CACC (2019) [16] news, 1500 billion bricks used worldwide are produced in polluting kilns. 90% of the bricks in the world are produced in Central Asia, and significant air pollutants are released while transporting these materials to the global market. Alyüz & Veli (2006) [17] state that building materials cause a significant amount of VOC emissions due to the use of chemical substances both in their production and in their application in the building and that the essential sources of VOCs are building materials and decoration materials. Häfliger et al. (2017) [18] indicate in their study that one-third of the total greenhouse gas emissions in the world originate from the construction industry. High levels of greenhouse gas emissions, including carbon emissions, cause an increase in the global warming potential. CFCs, widely used in buildings’ air conditioning and ventilation systems, cause ozone depletion when released into the atmosphere [19]. The report CCAC (2015) [20] states that the emissions of substances from ozone depletion increase by 8-15% every year due to population growth and urbanization. Marzouk et al. (2017) [21] estimate that building materials contribute to eutrophication in their life cycle 44% production and transportation phase, 16% on-site transportation and application phase, 2% using phase, 23% maintenance and repair phase, 12% demolition phase, and 3% recycle phase, respectively. Islam et al. (2016) [5] expressed that 77% of shipping containers used for shelter in Australia cause eutrophication during their life cycle. In their study, Kim & Chae (2016) [22] determined that coarse aggregate and fine aggregates used in the concrete production phase, which is one of the basic building materials, cause both acidification and eutrophication. Water is used directly and indirectly during the production of building materials [23]. Following a series of case studies carried out in non-residentials in Australia, McCormack et al. (2007) [24] determined that 5 to 20 m3 of embodied water per m2 of gross floor area is consumed, and the building materials that cause embodied water are steel, concrete, and carpet, respectively. Specifically, in commercial buildings, replacing carpets in approximately ten years increases embodied water [25]. Land use in the raw material extraction phase [26], production phase [27], and building materials’ waste storage and disposal phases cause land degradation. The environmental impacts of building materials referred to above cause variable effects on human health, and the tolerance levels of different individuals towards the same substance also vary. There are studies in the literature on the details of the human health impact caused by building materials [28,29,30,31]. The necessity of declaring the greenhouse gas emission information of building materials within the scope of the EU Green Deal in the near future has formed the starting point of this study. Moreover, it is foreseen by the construction industry stakeholders in Turkey that reified declarations regarding greenhouse gas emissions and other environmental impacts of building materials will be made pursuant to the EU Green Deal. Another issue is that there are no databases in Turkey in which the environmental impacts of building materials are declared during their life cycles. From this point of view, within the scope of this study, it is aimed to propose reference information based on LCA for building material databases to be developed in Turkey. The reference information includes weighting and normalization values based on regional conditions in Turkey. A case study is presented in the discussion section to demonstrate the importance of the recommended reference information. In the case study with floor covering materials and exterior wall finishing materials, the total environmental impact scores of the materials were calculated based on twelve environmental impact categories. Comparisons are made to show the importance of regional adaptation of the recommended reference information. It is thought that the proposed weight and normalization values will provide important information to the decision makers in determining the environmental sustainability of building materials.
2. Materials and Methods
2.1. Life Cycle Assessment
The phases of LCA defined in international standards ISO 14040 (2006) [32] and ISO 14044 (2006) [11] are shown in Figure 1. LCA includes four mandatory phases: goal and scope definition, inventory analysis, impact assessment, and interpretation [32]. The impact assessment phase has optional elements called weighting, normalization, and grouping [33]. Implementation of optional phases does not imply a preference. If the study becomes clearer with the implementation of these phases, it is necessary to implement these phases.
2.2. Environmental Impact Calculation Method
The potential environmental impacts of building materials are converted to numerical values by the following equations. The total environmental score is calculated by the equation below:
where, IESj is the total environmental score calculated for each j building material; W is environmental performance weight; EISj is environmental impact score of each j building material; n is the number of building materials. Within the scope of this study, only the environmental performance score has been calculated for building materials. Economic and social impacts, which are the other dimensions of sustainable development, are excluded from the scope of this study. Therefore, W=100 is taken into account. If the economic and social sustainability impacts were also taken into account, these impacts should be added to the right side of the equation by multiplying by their weights.
EISj is calculated by the following equation:
where, p is the number of environmental impact categories; IASjk is the normalized, weighted environmental impact assessment score of building material j according to the k environmental impact category [34].
IASjk is calculated by the following equation:
where IAjk is the environmental impact assessment score of building material j according to the k environmental impact category; wk is the relative importance weight of the k environmental impact category, NFk is the normalized value of the k environmental impact category [34].
IAjk is calculated by the following equation:
where, IFij is the inventory input i of building material j; EFi is emission factors for inventory input i, n is the number of inventory inputs of the k environmental impact category [34].
2.3. Weighting Calculation Method: Analytical Hierarchy Process
The analytic hierarchy process as expressed in Saaty (2001) [35] is “the objective mathematical expression of the subjective and personal preferences of an individual or a group in making a decision”. It provides the opportunity to measure ideas, feelings, thoughts, and experiences numerically. The application steps are as follows:
- The requirement for the pairwise comparison matrix to be consistent is that its maximum eigenvalue (λmax) is equal to the matrix size (n) [40]. The consistency ratio of the pairwise comparison matrix is calculated with the following equation [41]. If CR<0,1, the matrix is consistent; otherwise, decision-makers need to revise their judgments in the pairwise comparison matrix until obtaining acceptable consistency [42].
In the literature, the RI values obtained for matrix dimensions 1, 2, 3, …., 15 as a result of a series of studies are given in Saaty (2008) [40] (p.264).
2.4. Normalization Factors Calculation Method
Twelve environmental impact categories considered in the study are measured in different units. In order to calculate the total environmental impact of a building material, these values should be on the same scale. This is possible by implementing the LCA’s normalization phase of the impact assessment phase.
According to ISO 14044 (2006) [11], normalization is performed by dividing the numerical results of the environmental impact categories by the reference values. For example, the reference values for Germany and the Netherlands are total inputs and outputs per capita, while in China, the total environmental burdens per unit building floor area in a year in the entire construction industry are taken into account. In Australia, per capita, environmental impacts are calculated for the reference year, while in the USA, the amount of emissions released per capita for the reference year is calculated. Many of the environmental impact assessment tools divide the environmental impacts of the reference area by the population of the area under calculation and consider the per capita environmental impact as the normalization factors.
Normalization factors are calculated with the following equation.
where NFi is the normalization factor for impact category i (impact/year/capita); CFi,s, the emission factor of impact category i (impact of one gram of substance s, impact/g); Es, substance emissions for the reference area (g/year); P is the population of the reference area (capita) [43].
Emission factors (or characterization factors) are coefficients representing the contributions of reference substances that contribute to the concerned environmental impact category. These values are determined mostly by assuming a normal distribution among the emission factors of the reference substances [43].
3. Results
3.1. Weighting Reference Values
In ISO 14040 (2006) [32] and ISO 14044 (2006) [11] international standards, there is no limitation on determining the weights of environmental impact categories. However, it is stated that the chosen environmental mechanism and the reference values should be compatible with the reference period of the study. In order to ensure regional adaptation, three groups, namely green building consultants, green building designers, and green building practitioners operating in Turkey, were requested to participate in the study voluntarily.
The green building consultants can be accredited professionals working in green building consulting institutions, architects working within green building design institutions, and engineers involved in Turkey’s green building production phase. Within the scope of the study, semi-structured interviews were conducted with a total of twenty-one industry stakeholders, seven green building consultants, seven green building designers, and seven green building practitioners. Stakeholders were requested to vote on the environmental impact categories as short-term (0-10 years), medium-term (10-100 years), and long-term (>100), according to the fundamental comparison scale in Saaty (1987) [39] (p. 163). Values depending on the personal judgment of stakeholders were then combined using the AHP technique.
Figure 2 shows the hierarchical structure created to determine the weights of environmental impact categories. According to the information obtained from the semi-structured interviews, a 12×12 dimensional pairwise comparison matrix was created. According to the AHP procedure described in the previous section, the normalized matrix, rela-tive importance weight vector, and priority calculations were made.
The maximum eigenvalue of the matrix was calculated as λmax= 12,591. This value is equal to the matrix size (n). The consistency index CI was calculated as follows:
Based on the consistency index, the consistency ratio CR was calculated as follows:
The RI value is taken from Saaty (2008) [40] (p. 264). Since n=12 for the 12×12 matrix, the value of 1,54 was considered and CR=0,035< 0,1 is calculated, the matrix is consistent.
3.1. Weighting Reference Values
The emission factors considered in the characterization of environmental impacts in this study are as follows: 100-year time horizon of the IPCC for global warming; direct use of inventories approach for water depletion and indoor air quality; SETAC’s environmental problems approach acidification, air pollution, ecological toxicity, eutrophication, fossil fuel depletion, human health, land-use, ozone depletion, photochemical smog formation.
In the normalization value calculations, 2018 was chosen as the reference year. When the inventory data shared by the Turkish Ministry of Environment, Urbanization and Climate Change, Turkish Ministry of Agriculture and Forestry, TurkStat, and EMEP is examined, it has been determined that the values including the environmental impact categories taken into consideration belong to 2018. Another reason is that the Ministry of Environment, Urbanization of Turkey declares inventory data from two previous years every year. In order to obtain the normalization reference information values, it is necessary to calculate the impacts caused by each Turkish citizen in each environmental impact category within a year. According to TurkStat data, the population of Turkey as of 31 December 2018 is 82 003 882 people [45].
The normalization reference information value calculations for the global warming, air pollution, acidification, and water depletion environmental impact categories are shown below.
3.2.1. Calculation of Global Warming Normalization Reference Information Value
The Turkish Ministry of Environment, Urbanization, and Climate Change calculate Turkey’s national greenhouse gas emissions using the IPCC Guidelines. According to the greenhouse gas inventory results, the total greenhouse gas emissions in 2018 were calculated as 522 million tons (Mt) of CO2 equivalent [46]. TurkStat declared total greenhouse gas emission per capita in Turkey in 2018 as 6,4 tons of CO2 equivalent. Since this data is directly declared as CO2 eq./year/capita by TurkStat, the global warming environmental impact category normalization value is considered in the calculations as 6 400 000 g CO2 eq./year/capita.
3.2.2. Calculation of Air Pollution Normalization Reference Information Value
Turkey is preparing a national emission inventory by the Turkish Ministry of Environment, Urbanization and Climate Change and the CLRTAP of the EMEP Protocol. According to SETAC’s environmental problems approach, the impacts of air pollution are measured through nitrogen oxides (NOx), sulfur dioxide (SOx), and particulate matter (PM) emissions. According to Turkey’s Informative Inventory Report, NOx emissions were 785 kilotonnes, and SOx (as SO2) emissions were 2519 kilotonnes in 2018 [47]. According to EMEP data, PM10 emissions were 239,08 kilotonnes and PM2.5 emissions were 193,64 kilotonnes in 2018 in Turkey [48]. Considering these emission values and air pollution emission factors, the air pollution normalization reference information value was calculated in terms of microDALYs reference unit as in Table 1.
3.2.3. Calculation of Acidification Normalization Reference Information Value
NH3, NOx, SOx acidifiers were obtained from Turkey’s 5th Statement on Climate Change [47]. Emission amounts, emission factors, acidification index calculation, and normalization value calculation are shown in Table 2. For other acidifiers hydrochloric acid (HCl), hydrocyanate (HCN), hydrofluoric acid (HF), hydrogen sulphur (H2S), and sulfuric acid (H2SO4), Turkey’s national emission inventory data for the reference year is not available.
3.2.4. Calculation of Water Depletion Normalization Reference Information Value
While calculating the normalization reference information of the water depletion environmental impact category, the inventory inputs were used directly without any impact assessment. According to 2018 TurkStat data, the average daily water depletion per person in Turkey is 224 liters/day/capita [49]. The normalization reference information is taken into account as 81 760 liters/year/capita.
An extensive study was carried out in calculating the normalization reference information. Here, the calculations of the normalization reference information values of the environmental impact categories of global warming, air pollution, acidification, and water depletion, which are the shortest examples, are shown. There are numerous emission factors for the other eight environmental impact categories. There are many calculations in obtaining the normalization reference information values, so the calculation of the normalization reference information values for all environmental impact categories cannot be shown here. The normalization reference information values obtained after all calculations and the normalization values used for the USA in BEES Online (BEES 4.0) software are shown in Table 3.
4. Discussion
This section shows an example application using the weight and normalization values generated as reference information. The study was tested with two groups of building materials. Evaluated building material groups are floor coverings and exterior wall finishing materials. Information on the building materials is shown in Table 4. The building materials in Table 4 are produced in Turkey.
- The case study LCA’s goal and scope definition: The goal of the case study is to determine the environmental performance of the building materials given in Table 4 in twelve environmental impact categories regarded in the study.
The functional unit (gram) of each building material was taken into account in the calculations. Previously mentioned twelve environmental impact categories were evaluated. Selected impact assessment approaches are 100-year time horizon of the IPCC, direct use of inventories approach and environmental problems approach. The system boundary of the study is the cradle-to-grave approach. The service life of building materials is assumed to be 50 years. In BEES calculations, it is assumed that the building materials are transported in one direction from 500 miles.
- 2.
- The case study LCA’s inventory analysis: As mentioned before, there is no platform, no database, no legal obligation or encouraging application where the inventory data within the life cycle of building materials are declared in Turkey. For this reason, the life cycle inventory data of the building materials given in Table 4 were obtained from the BEES Online database while performing the case study within the scope of the study.
- 3.
- The case study LCA’s impact assessment: The total environmental score is calculated by summing the effects into twelve environmental impact categories of the building materials evaluated in the case study. Equation 1 to equation 4 were used to calculate total environmental scores. In order to show the importance of regional adaptation of the reference information values calculated in the study, the total environmental scores of the building materials in Table 4 were calculated by using different weights and normalization values.
For Group 1- Set 1 evaluation, the weights and normalization reference information values determined within the scope of this study were used. For Group 1- Set 2 evaluation, the weights determined within the scope of this study and the USA normalization values in Table 3 were used. For Group 1-Set 3 evaluation, calculations were made using the BEES Stakeholder Panel weights defined in BEES Online software and the USA normalization values in Table 3.
As a result of the three different calculations mentioned above, the impacts of global warming potential depending on the greenhouse gas emissions in the life cycle of the building materials in Table 4 are shown in Figure 4. As stated in the introduction of the study, building materials are going to start to be taxed on greenhouse gas emissions within the scope of the EU Green Deal. For this reason, greenhouse gas emission declarations of building materials have become very important. The local conditions of the geographies where the building materials are produced need to be adapted to the study at this stage. Otherwise, misleading results may occur. Set 2 and Set 3 evaluations within the scope of the study were carried out to show the results that would be revealed if refer-ence information adapted to local conditions was not used.
For example, if the weights and normalization reference information were not calculated within the scope of this study and the weights and normalization values defined in the BEES online software were directly used, the global warming potential per function-al unit of the ceramic tile with recycled content would be obtained as 0,0030 g CO2 equivalent/year/ capita. However, by using the reference information value adapted to the local conditions of Turkey, the global warming potential per functional unit of the same material was obtained as 0,0124 g CO2 eq. /year/ capita.
Figure 5 shows the total environmental scores of building materials, including eleven other environmental impact categories, in addition to their global warming potential, based on greenhouse gas emissions. Total environmental scores were obtained by sum-ming the impacts of the functional unit of the evaluated materials in twelve environmental impact categories. Evaluating the impacts of environmental impact categories by summing them up is a more holistic approach. For example, according to Figure 5, the total environmental impact score is 82,47 in Set 1 calculations for ceramic tile with recycled content, while the total environmental impact score for Set 3 calculations is 132,63. These differences are more closely related to the techniques and technologies used by the countries in the building material production processes and the system boundaries. If the total environmental impact scores are used for building material selection, the importance of the score difference will become more apparent.
When the calculations for Group 1 materials are also performed for Group 2 materials in Table 4, the global warming potential impacts of the building materials depend on the greenhouse gas emissions in their life cycle (Figure 6), and the total environmental impact scores are shown in Figure 7.
The environmental performance rankings here are the result of comparisons between building materials. Since the study was carried out for a limited number of building material alternatives, similarity in the rankings is an expected result. However, the total environmental scores calculated for the same building material in all three evaluation sets differ. This shows that the weights and normalization values used are not superior to each other, but the values obtained depending on the regional adaptation affect the results of the studies.
- 4.
- The case study LCA’s impact interpretation: Set 1 calculation for Group 1 and Group 2 building materials reflect calculations using weights and normalization reference information obtained in the present study. Set 2 calculations were made to show how there would be differences in the evaluations if only the weights were calculated and normalization values were not calculated for Turkey within the scope of the study. Set 3 calculations showed how the results would be affected if the values defined in BEES Online were used directly, without obtaining weights and normalization values for Turkey.
Set 1, Set 2, and Set 3 calculation results for Group 1 and Group 2 building materials to show that it has become imperative to consider the compatibility of the chosen environmental mechanism and the reference values with the scale of time and space, as specified in ISO 14044 (2006) [11]. Because the emission amounts, populations, and weights of the chosen environmental impact categories of the USA and Turkey for the reference year are different, all these differences affect the study’s results.
5. Conclusions
This study recommends reference information values that can be used in declaring both the global warming potentials of building materials due to greenhouse gas emissions and other internationally accepted environmental impacts. Since the reference information varies greatly according to the internal factors of the geography where the application is made, the opinions of the local industry stakeholders were consulted. In addition, Turkey’s national inventory data was used. A case study was performed to demonstrate the use of the recommended weight and normalization reference information. The purpose of the case study was carried out to show how the results change in the direct use of existing building material evaluation tools without adapting to local conditions. In the case study, only the environmental performance of building materials was considered. In future studies, the economic and social dimensions of sustainable development can be adapted to the study.
The reference information recommended in the study is based on the LCA. Although the relative structure of LCA is criticized from time to time in the literature, it continues to be used reliably because ISO international standards also define it. The LCA process requires extensive data collection. Especially for the inventory analysis phase, the inputs, outputs, system boundaries, and environmental impacts of the unit processes of building materials should be well known. There are national inventory databases of building materials in some developed countries. However, there has yet to be such a database in Turkey. The building material manufacturers do not tend to share this data. This is due to two main reasons. i) In Turkey, as in many developing countries, economic concerns are more prominent than ecological concerns. ii) Another reason is that the national legislation has no legal obligation on this issue. However, as stated in the study’s introduction, the EU Green Deal is closely related to Turkey in this regard. After October 2023, when the EU Green Deal came into force, declaring inventory data of building materials exported to EU countries will be obligatory within three years. Although concrete steps have yet to be taken in Turkey, construction industry stakeholders anticipate that structures will be created where inventory data of building materials will be shared.
In the absence of reference information proposed to be used nationally, it is thought that the reference information recommended in the study can be used reliably. This study had two important limitations: the first was the lack of national inventory data, and the second was that industry stakeholders did not accept interview requests, which was a relatively lesser limitation than the first. In future studies, the opinions of more stakeholders such as building material manufacturers, state authorities, and legislators can be consulted in determining the weight values.
Local LCA tool development, which may require effort, time and high costs, should be encouraged and supported. With the cooperation of universities, industry and state authorities, databases of building materials produced, used and exported in Turkey can be created.
| Abbreviation | Definition |
| AHP | Analytical Hierarchy Process |
| BEES | Building for Environmental and Economic Sustainability |
| CBAM | Carbon Border Adjustment Mechanism |
| CCAC | Climate and Clean Air Coalition |
| CFC | Chlorofluorocarbon |
| CLRTAP | Convention on Long-Range Transboundary Air Pollution |
| EMEP | European Monitoring and Evaluation Program |
| EU | European Union |
| IPCC | Intergovernmental Panel on Climate Change |
| LCA | Life Cycle Assessment |
| SETAC | Society of Environmental Toxicology and Chemistry |
| Turkiye IMSAD | Association of Turkish Construction Material Producers |
| TurkStat | Turkish Statistical Institute |
Author Contributions
Ak: Aytekin, Kusan & Zorluer: conceptualization, methodology, formal analysis, visualization, writing -review& editing, supervision. This publication was produced from the first author’s Ph.D. thesis.
Funding
This study was funded by Afyon Kocatepe University coordinatorship of scientific research projects.
Acknowledgments
We gratefully acknowledge the financial support provided by Afyon Kocatepe University coordinatorship of scientific research projects to the Research Project 17.FEN.BİL.42.
Conflicts of Interest
The authors declare that there is no conflict of interest for the article.
References
- Montanarella, L.; Panagos, P. The Relevance of Sustainable Soil Management within the European Green Deal. Land Use Policy 2021, 100, 104950. [Google Scholar] [CrossRef]
- Leonard, M.; Pisani-Ferry, J.; Shapiro, J.; Tagliapietra, S.; Wolff, G.B. The Geopolitics of the European Green Deal; Bruegel Policy Contribution, 2021.
- Association of Turkish Construction Material Producers. Turkey IMSAD Building Industry Report 2020; İMSAD-R/2021-07/390; 2021; pp 1–204.
- Pacheco-Torgal, F.; Labrincha, J.A. The Future of Construction Materials Research and the Seventh UN Millennium Development Goal: A Few Insights. Construction and Building Materials 2013, 40, 729–737. [Google Scholar] [CrossRef]
- Islam, H.; Zhang, G.; Setunge, S.; Bhuiyan, M.A. Life Cycle Assessment of Shipping Container Home: A Sustainable Construction. Energy and Buildings 2016, 128, 673–685. [Google Scholar] [CrossRef]
- Zhang, Y.; Teoh, B.K.; Wu, M.; Chen, J.; Zhang, L. Data-Driven Estimation of Building Energy Consumption and GHG Emissions Using Explainable Artificial Intelligence. Energy 2023, 262, 125468. [Google Scholar] [CrossRef]
- European Comission. Workshop on Integrated Product Policy; Final Report; 1998.
- Guinée, J.B.; Heijungs, R.; Huppes, G.; Zamagni, A.; Masoni, P.; Buonamici, R.; Ekvall, T.; Rydberg, T. Life Cycle Assessment: Past, Present, and Future. Environ. Sci. Technol. 2011, 45, 90–96. [Google Scholar] [CrossRef] [PubMed]
- Carretero-Ayuso, M.J.; García-Sanz-Calcedo, J. Comparison between building roof construction systems based on the LCA. Revista de la Construcción. Journal of Construction 2018, 17, 123–136. [Google Scholar] [CrossRef]
- Uygunoğlu, T.; Sertyeşilişik, P.; Topçu, İi. B. 20 - Methodology for the Evaluation of the Life Cycle in Research on Cement-Based Materials. In Waste and Byproducts in Cement-Based Materials; de Brito, J., Thomas, C., Medina, C., Agrela, F., Eds.; Woodhead Publishing Series in Civil and Structural Engineering; Woodhead Publishing, 2021; pp 601–615. [CrossRef]
- ISO 14044:2006. Environmental Management - Life Cycle Assessment - Requirements and Guideline, Brussels.
- EN 15804:2012+A2:2019. Sustainability of Construction Works. Environmental Product Declarations. Core Rules for the Product Category of Construction Products, Brussels.
- Estokova, A.; Vilcekova, S.; Porhincak, M. Analyzing Embodied Energy, Global Warming and Acidification Potentials of Materials in Residential Buildings. Procedia Engineering 2017, 180, 1675–1683. [Google Scholar] [CrossRef]
- Pacheco-Torgal, F.; Jalali, S. Toxicity of Building Materials: A Key Issue in Sustainable Construction. International Journal of Sustainable Engineering 2011, 4, 281–287. [Google Scholar] [CrossRef]
- Ashraf, A.; Butt, A.; Khalid, I.; Alam, R.U.; Ahmad, S.R. Smog Analysis and Its Effect on Reported Ocular Surface Diseases: A Case Study of 2016 Smog Event of Lahore. Atmospheric Environment 2019, 198, 257–264. [Google Scholar] [CrossRef]
- CACC (Climate and Clean Air Coalition). Mitigating Black Carbon and Other Pollutants from Brick Production; Climate and Clean Air Coalition, 2019; pp 1–15.
- Alyüz, B.; Veli, S. İç Ortam Havasında Bulunan Uçucu Organik Bileşikler ve Sağlık Üzerine Etkileri. Trakya Üniversitesi Fen Bilimleri Dergisi 2006, 7, 109–116. [Google Scholar]
- Häfliger, I.-F.; John, V.; Passer, A.; Lasvaux, S.; Hoxha, E.; Saade, M.R.M.; Habert, G. Buildings Environmental Impacts’ Sensitivity Related to LCA Modelling Choices of Construction Materials. Journal of Cleaner Production 2017, 156, 805–816. [Google Scholar] [CrossRef]
- Newman, P.A.; Oman, L.D.; Douglass, A.R.; Fleming, E.L.; Frith, S.M.; Hurwitz, M.M.; Kawa, S.R.; Jackman, C.H.; Krotkov, N.A.; Nash, E.R.; Nielsen, J.E.; Pawson, S.; Stolarski, R.S.; Velders, G.J.M. What Would Have Happened to the Ozone Layer If Chlorofluorocarbons (CFCs) Had Not Been Regulated? Atmospheric Chemistry and Physics 2009, 9, 2113–2128. [Google Scholar] [CrossRef]
- CCAC(Climate and Clean Air Coalition). HFC Initiative; Climate and Clean Air Coalition, 2015; pp 1–2.
- (21) Marzouk, M.; Abdelkader, E.M.; Al-Gahtani, K. Building Information Modeling-Based Model for Calculating Direct and Indirect Emissions in Construction Projects. Journal of Cleaner Production 2017, 152, 351–363. [Google Scholar] [CrossRef]
- Kim, T.H.; Chae, C.U. Environmental Impact Analysis of Acidification and Eutrophication Due to Emissions from the Production of Concrete. Sustainability 2016, 8, 578. [Google Scholar] [CrossRef]
- Rahman, M. M.; Rahman, M. A.; Haque, M. M.; Rahman, A. Sustainable Water Use in Construction. In Sustainable Construction Technologies; Tam, V. W. Y., Le, K. N., Eds.; Butterworth-Heinemann, 2019; pp 211–235. [CrossRef]
- McCormack, M.; Treloar, G.J.; Palmowski, L.; Crawford, R. Modelling Direct and Indirect Water Requirements of Construction. null 2007, 35, 156–162. [Google Scholar] [CrossRef]
- Hoekstra, A.Y. The Water Footprint of Industry. In Assessing and Measuring Environmental Impact and Sustainability; Klemeš, J.J., Ed.; Butterworth-Heinemann: Oxford, 2015; pp. 221–254. [Google Scholar] [CrossRef]
- Willis, A.-M. Concrete and Not so Concrete Impacts. Information Ecology 1998, 1–13. [Google Scholar]
- Esin, T.; Cosgun, N. A Study Conducted to Reduce Construction Waste Generation in Turkey. Building and Environment 2007, 42, 1667–1674. [Google Scholar] [CrossRef]
- Menzies, D.; Kreiss, K. Building-Related Illnesses; CRC Press, 2006; pp 763–810. [CrossRef]
- Crook, B.; Burton, N.C. Indoor Moulds, Sick Building Syndrome and Building Related Illness. Fungal Biology Reviews 2010, 24, 106–113. [Google Scholar] [CrossRef]
- Darçın, P.; Balanlı, A. Yapı Ürünlerinden Kaynaklanan Uçucu Organik Bileşiklerin Yapı Biyolojisi Açısından İrdelenmesi. Megaron 2018, 13, 597–607. [Google Scholar] [CrossRef]
- Zorlu, K.; Tıkansak Karadayı, T. İç Mekan Hava Kalitesinde Yapı Malzemelerinin Rolü. Sinop Üniversitesi Fen Bilimleri Dergisi 2020, 5, 193–211. [Google Scholar] [CrossRef]
- ISO 14040:2006. Environmental Management-Life Cycle Assestment-Principles and Framework, Brussels.
- Klöpffer, W.; Grahl, B. Life Cycle Assessment (LCA): A Guide to Best Practice; John Wiley & Sons, 2014. [CrossRef]
- Lippiatt, B.C. Building for Environmental and Economic Sustainability Technical Manual and User Guide; National Institute of Standards and Technology: United States of America, 2007. [Google Scholar]
- Saaty, T.L. Fundamentals of the Analytic Hierarchy Process. In The Analytic Hierarchy Process in Natural Resource and Environmental Decision Making; Schmoldt, D.L., Kangas, J., Mendoza, G.A., Pesonen, M., Eds.; Managing Forest Ecosystems; Springer Netherlands: Dordrecht, 2001; pp. 15–35. [Google Scholar] [CrossRef]
- Wang, Y.-M.; Liu, J.; Elhag, T.M.S. An Integrated AHP–DEA Methodology for Bridge Risk Assessment. Computers & Industrial Engineering 2008, 54, 513–525. [Google Scholar] [CrossRef]
- Yulong, L.; Xiande, W.; Zhongfu, L. Safety Risk Assessment on Communication System Based on Satellite Constellations with the Analytic Hierarchy Process. Aircraft Engineering and Aerospace Technology 2008, 80, 595–604. [Google Scholar] [CrossRef]
- Deng, X.; Hu, Y.; Deng, Y.; Mahadevan, S. Supplier Selection Using AHP Methodology Extended by D Numbers. Expert Systems with Applications 2014, 41, 156–167. [Google Scholar] [CrossRef]
- Saaty, R.W. The Analytic Hierarchy Process—What It Is and How It Is Used. Mathematical Modelling 1987, 9, 161–176. [Google Scholar] [CrossRef]
- Saaty, T.L. Relative Measurement and Its Generalization in Decision Making Why Pairwise Comparisons Are Central in Mathematics for the Measurement of Intangible Factors the Analytic Hierarchy/Network Process. Rev. R. Acad. Cien. Serie A. Mat. 2008, 102, 251–318. [Google Scholar] [CrossRef]
- Ansah, R.H.; Sorooshian, S.; Bin Mustafa, S. Analytic Hierarchy Process Decision Making Algorithm. Global Journal of Pure and Applied Mathematics 2015. [CrossRef]
- Hafeez, K.; Malak, N.; Zhang, Y.B. Outsourcing Non-Core Assets and Competences of a Firm Using Analytic Hierarchy Process. Computers & Operations Research 2007, 34, 3592–3608. [Google Scholar] [CrossRef]
- Ryberg, M.; Vieira, M.D.M.; Zgola, M.; Bare, J.; Rosenbaum, R.K. Updated US and Canadian Normalization Factors for TRACI 2.1. Clean Techn Environ Policy 2014, 16, 329–339. [Google Scholar] [CrossRef]
- National Institute of Standards and Technology (NIST). Available online: www.nist.gov (accessed on 8 September 2022).
- TurkStat (Turkish Statistical Institute). Address Based Population Registration System 2018; Report No. 30709; 2019.
- TurkStat (Turkish Statistical Institute). Greenhouse Gas Emission Statistics 1990-2019; Report No. 37196; 2020.
- Turkish Ministry of Environment and Urbanization and Climate Change. Turkey’s 5th Statement on Climate Change, Annual Informative Inventory Report for Turkey for the United Nations Economic Commission for Europe; 2021; p 324.
- EMEP Centre on Emission Inventories and Projections. Available online: www.ceip.at/data-viewer (accessed on 14 January 2023).
- TurkStat (Turkish Statistical Institute). Municipal Water Statistics 2018; Report No. 30668; 2019.
Figure 1.
Elements of LCA defined in ISO 14040.
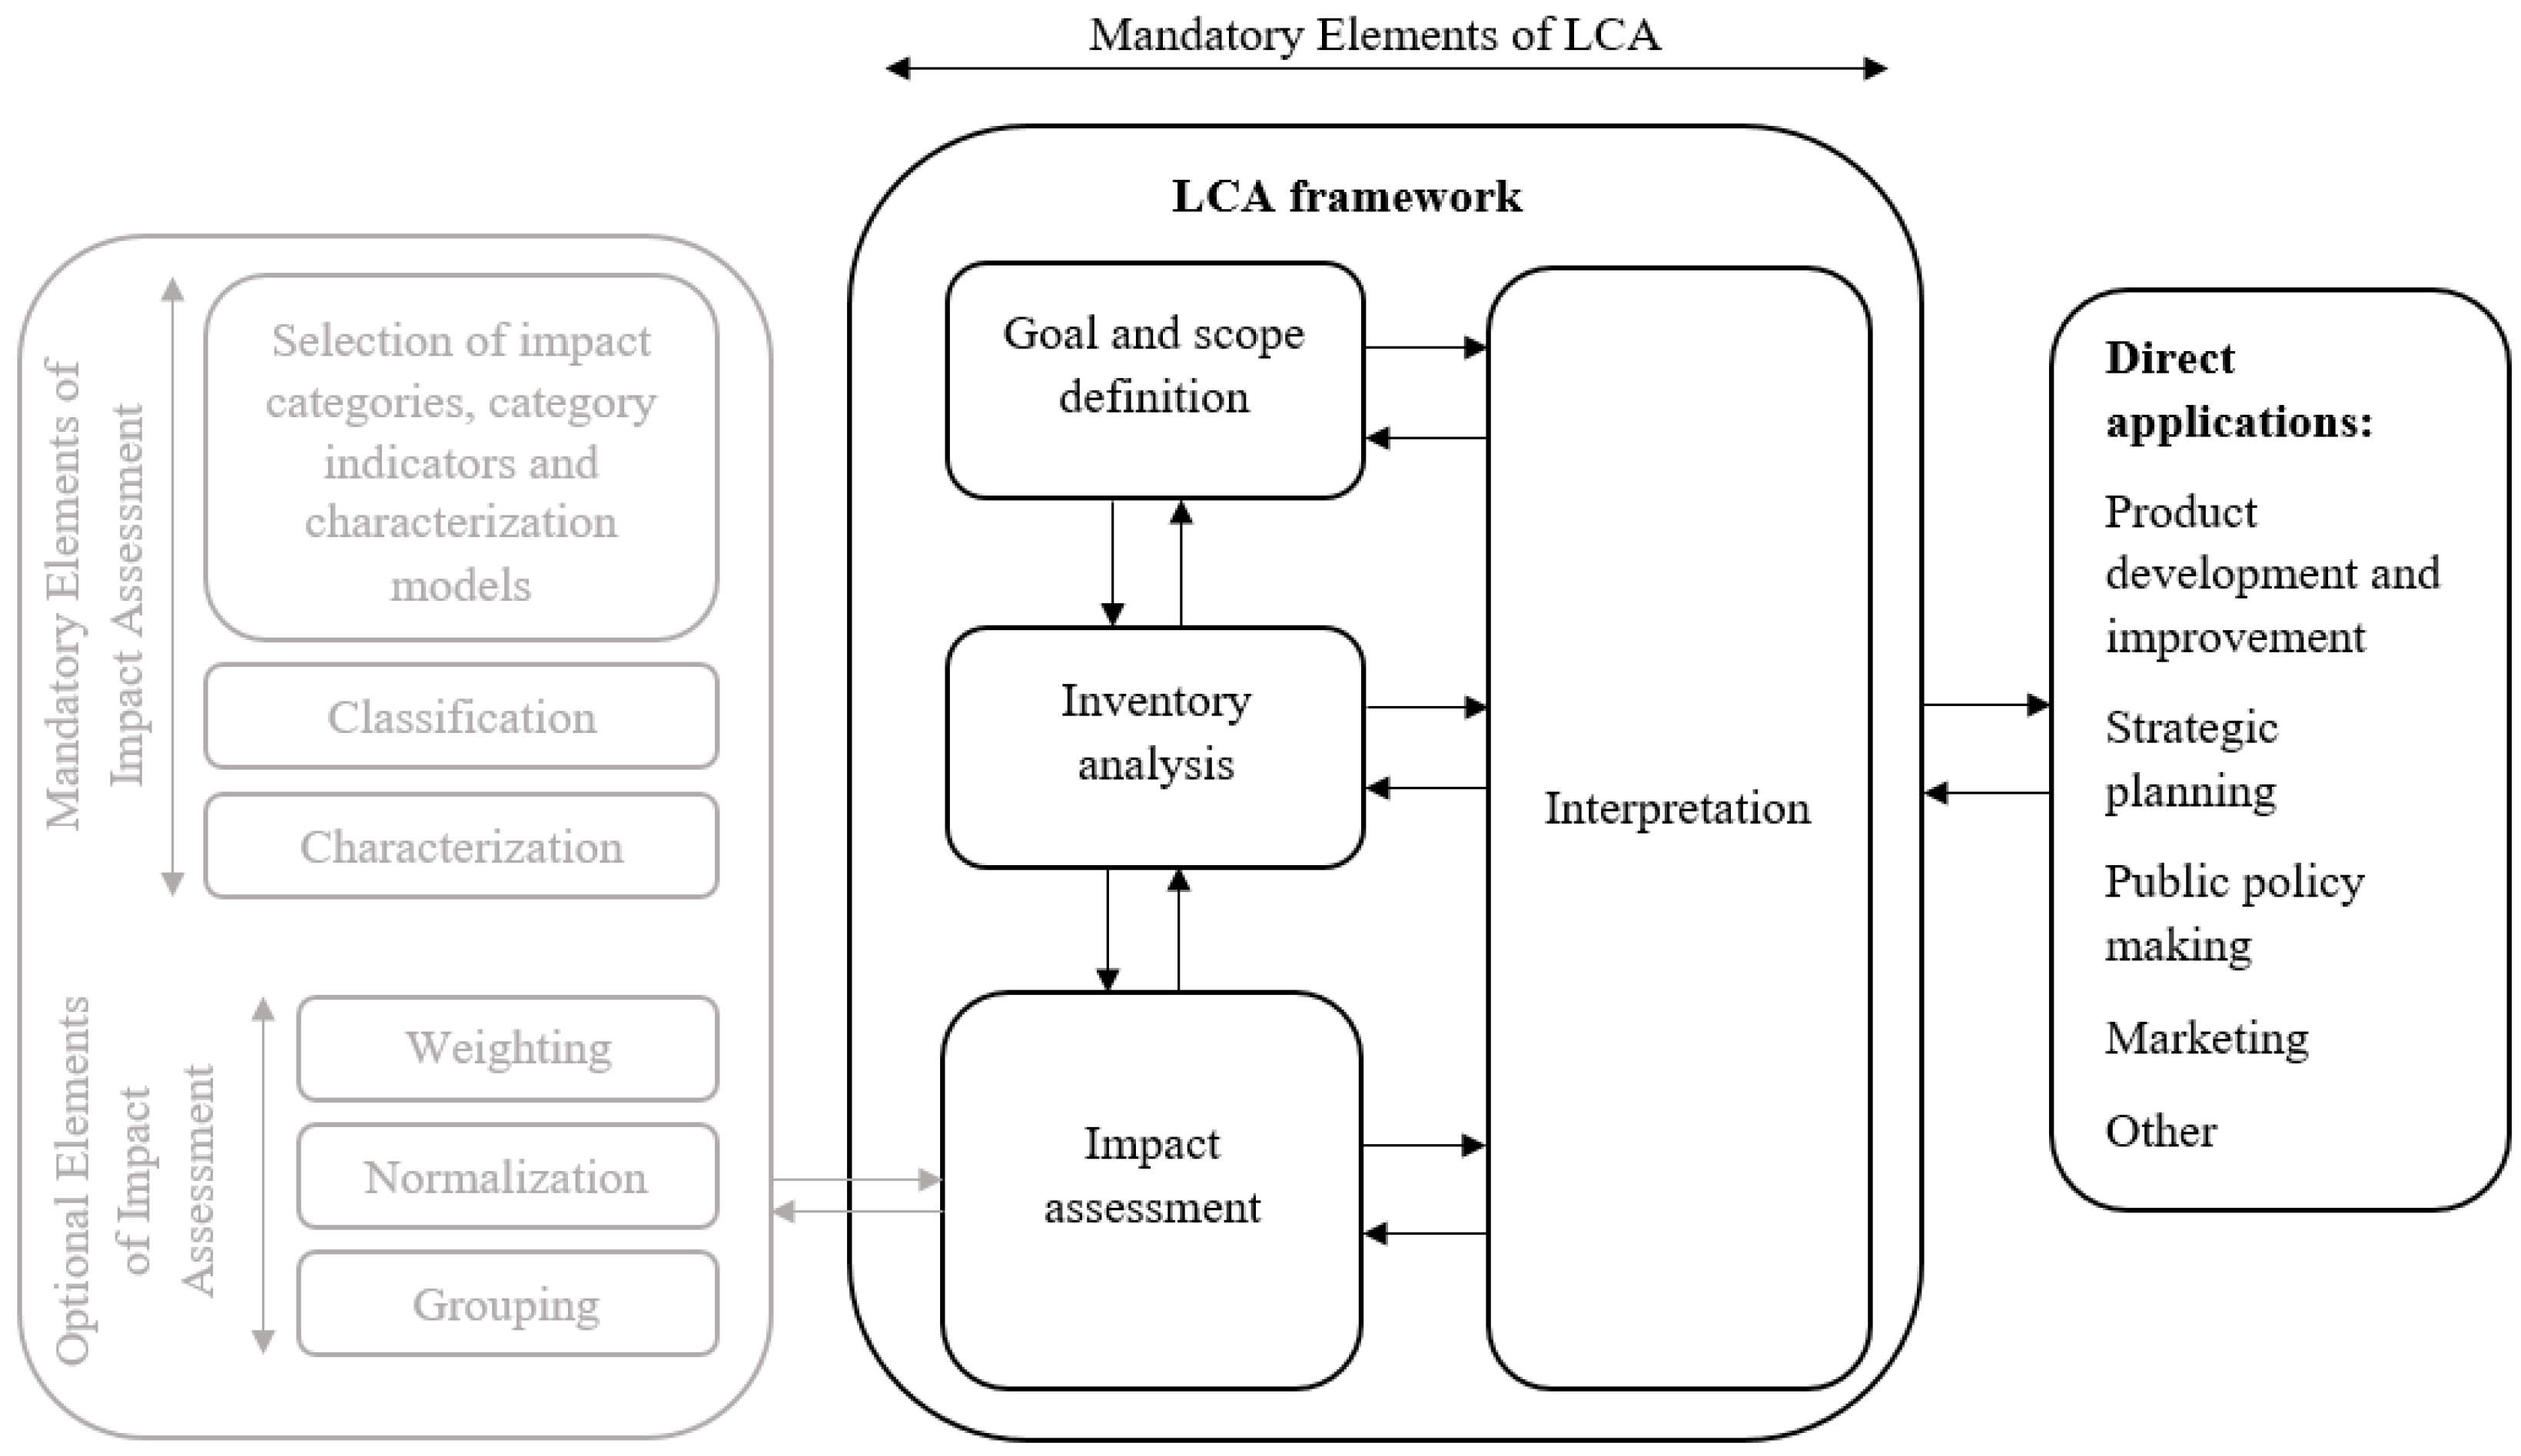
Figure 2.
Hierarchical structure for obtaining the weights of environmental impact categories.
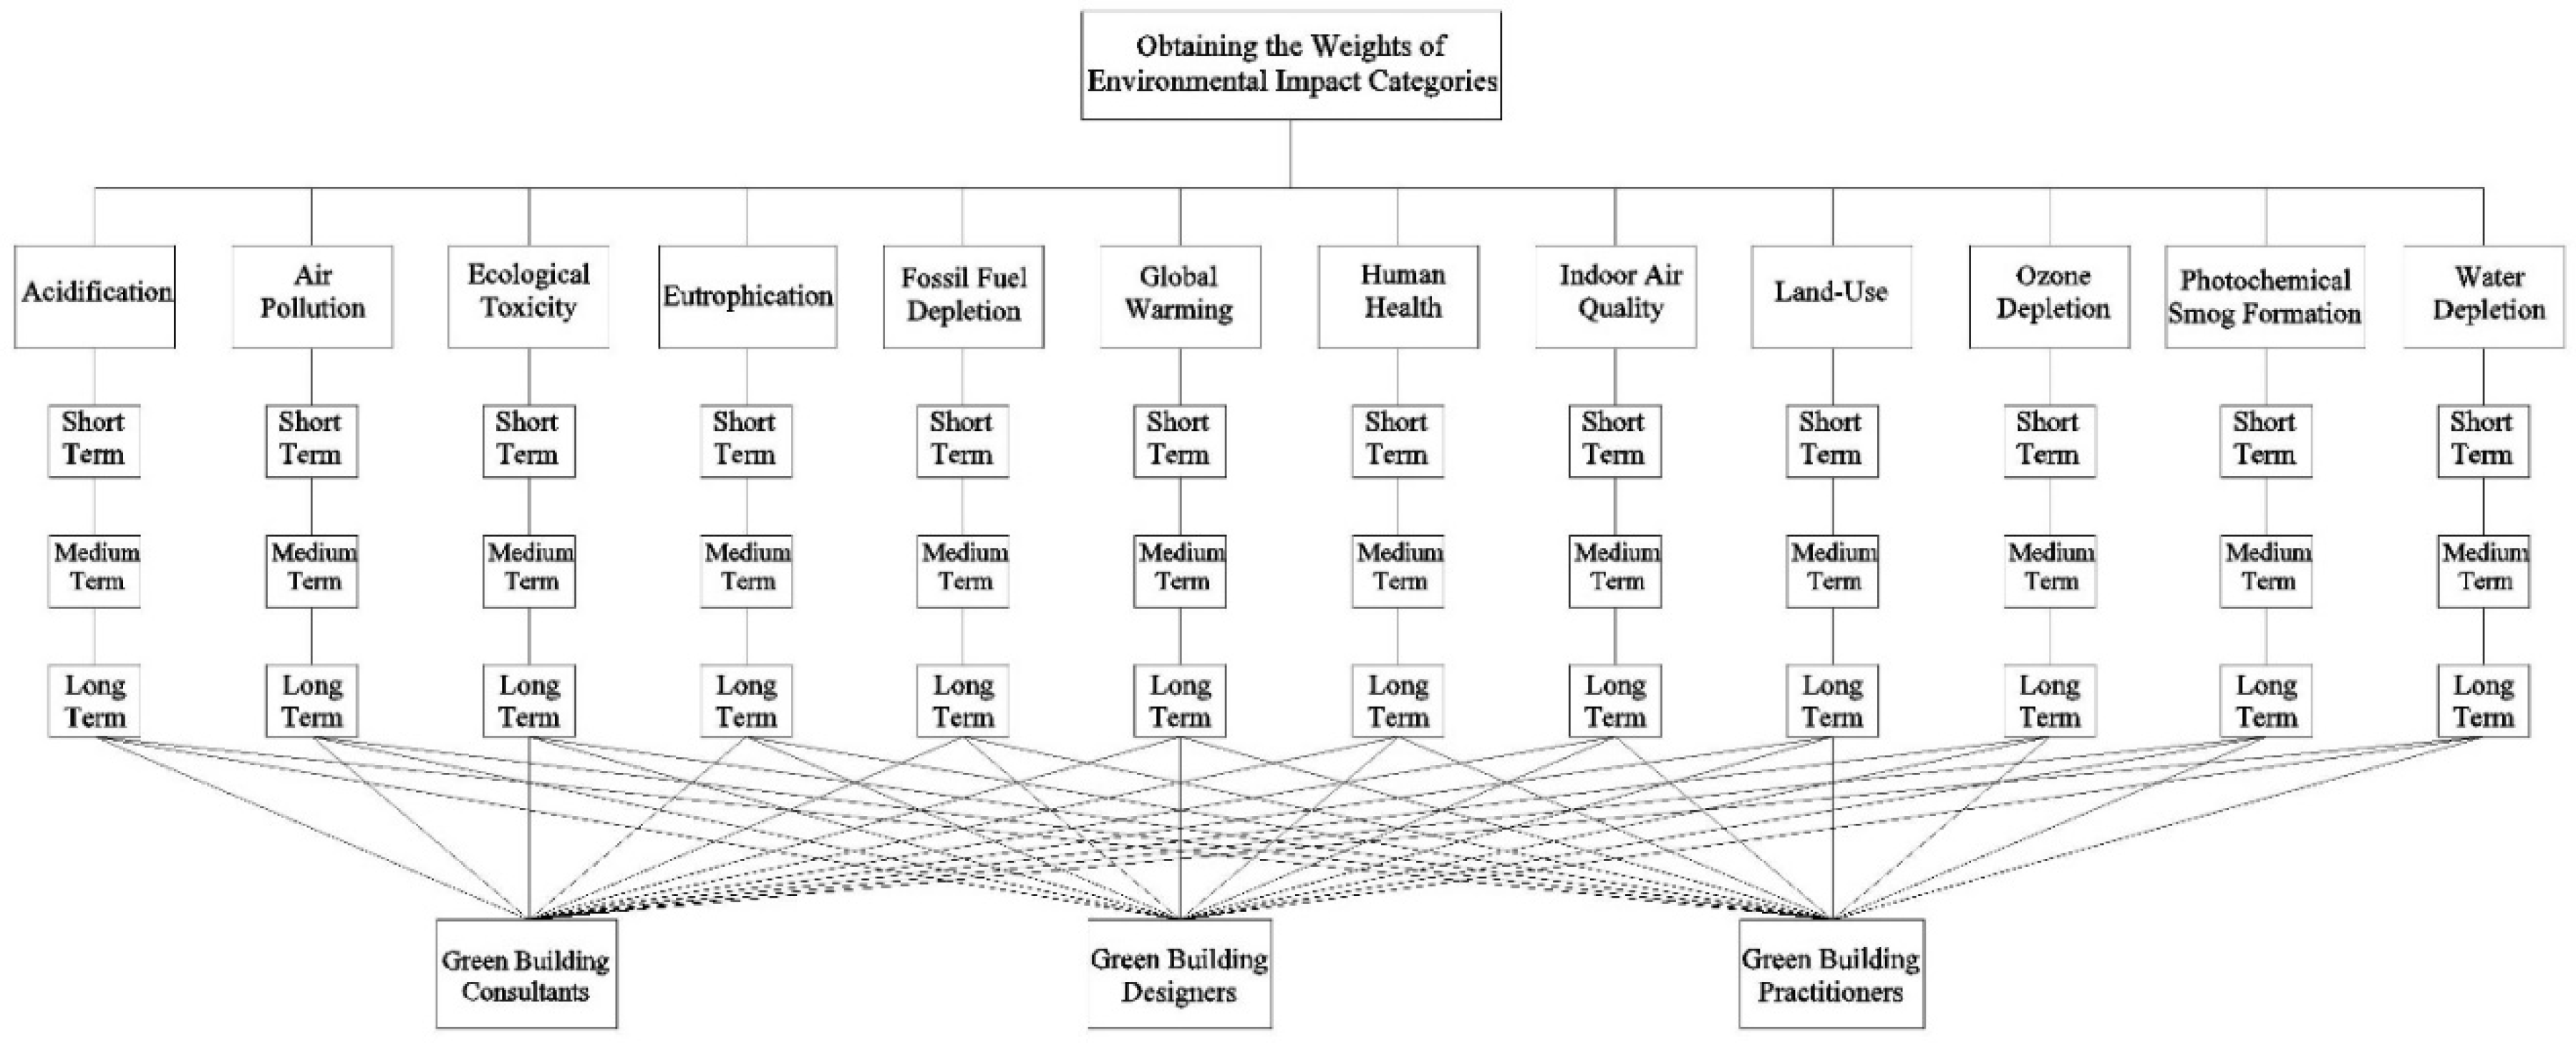
Figure 3.
Weight reference values and BEES Stakeholder Panel weights.
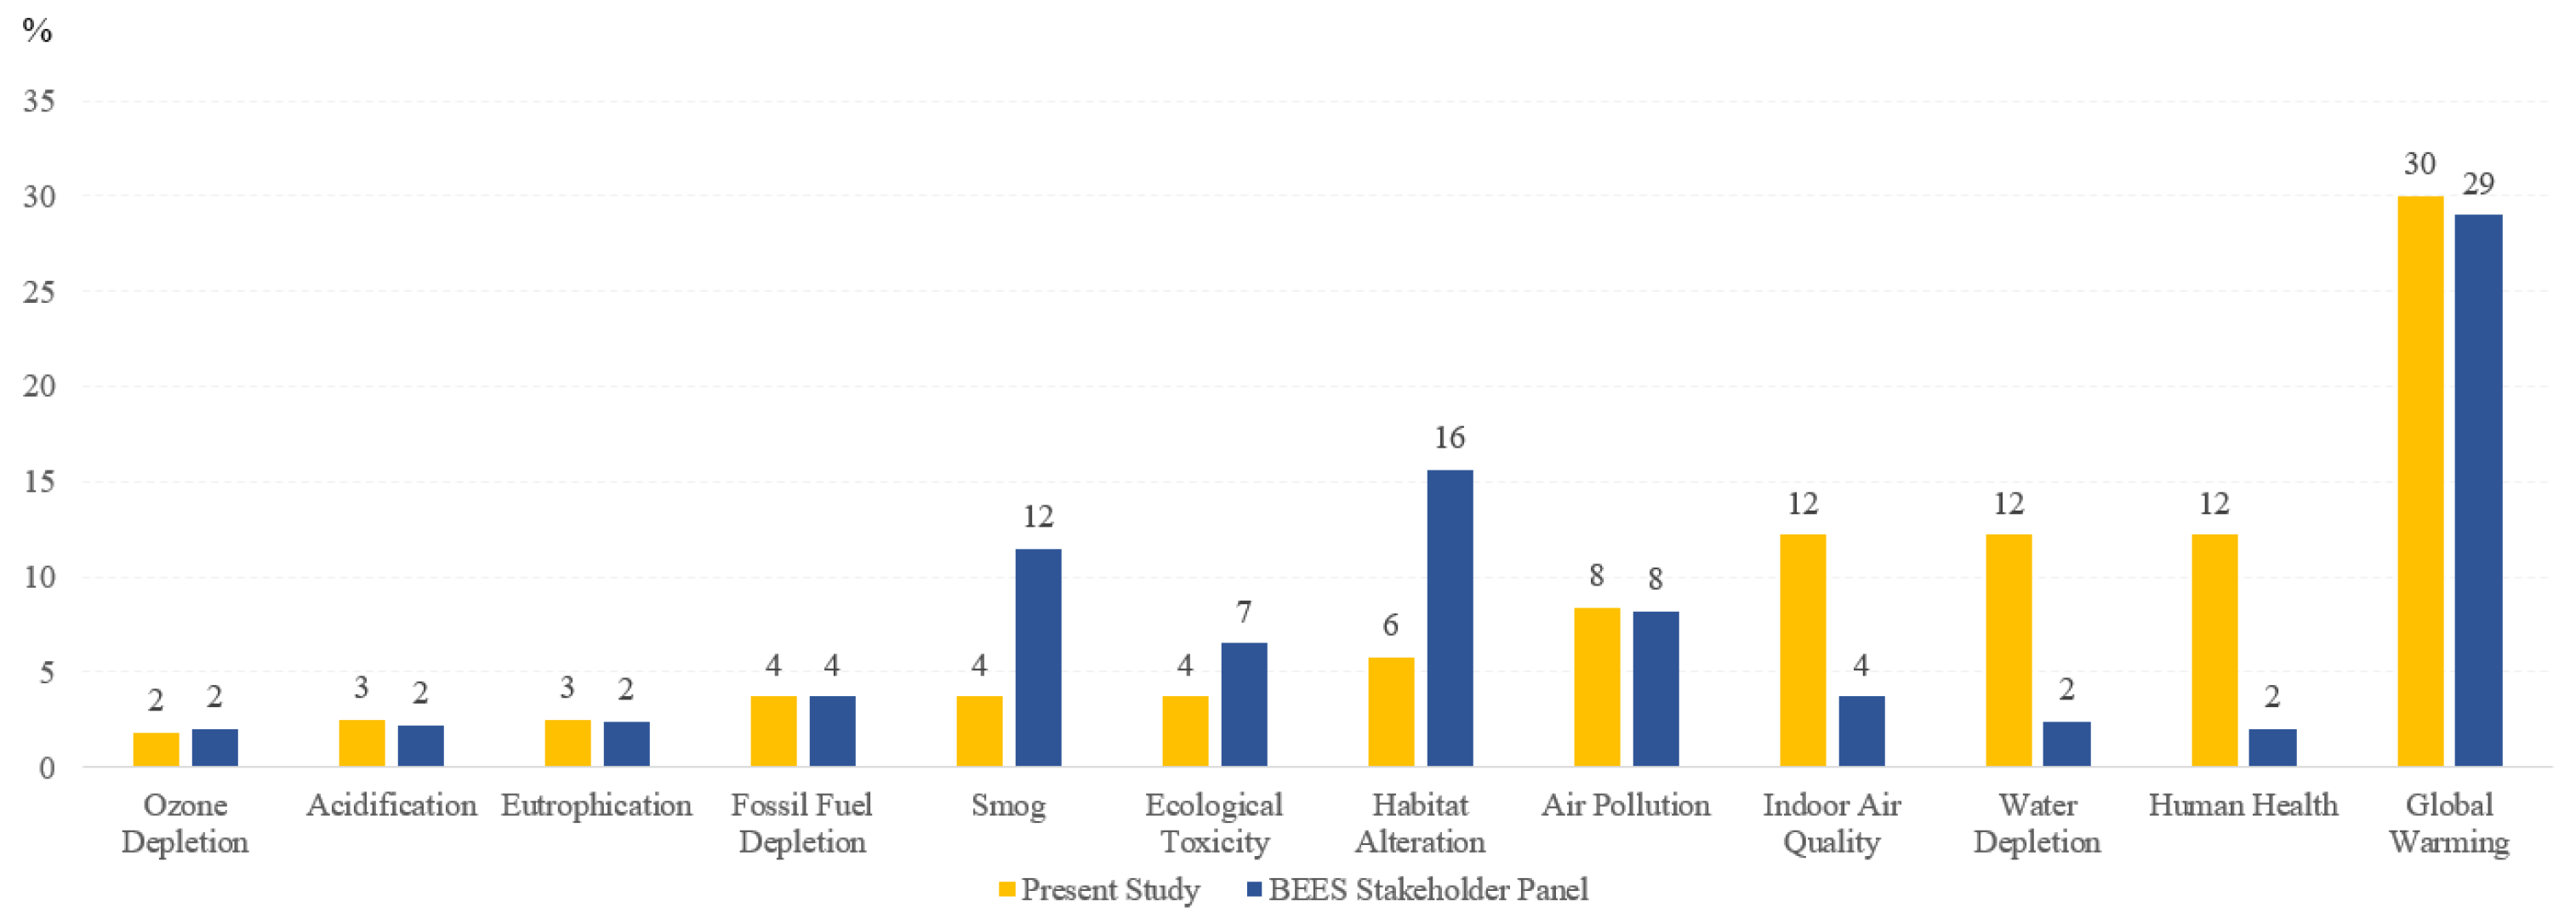
Figure 4.
Global warming potentials due to greenhouse gas emissions of flooring materials.
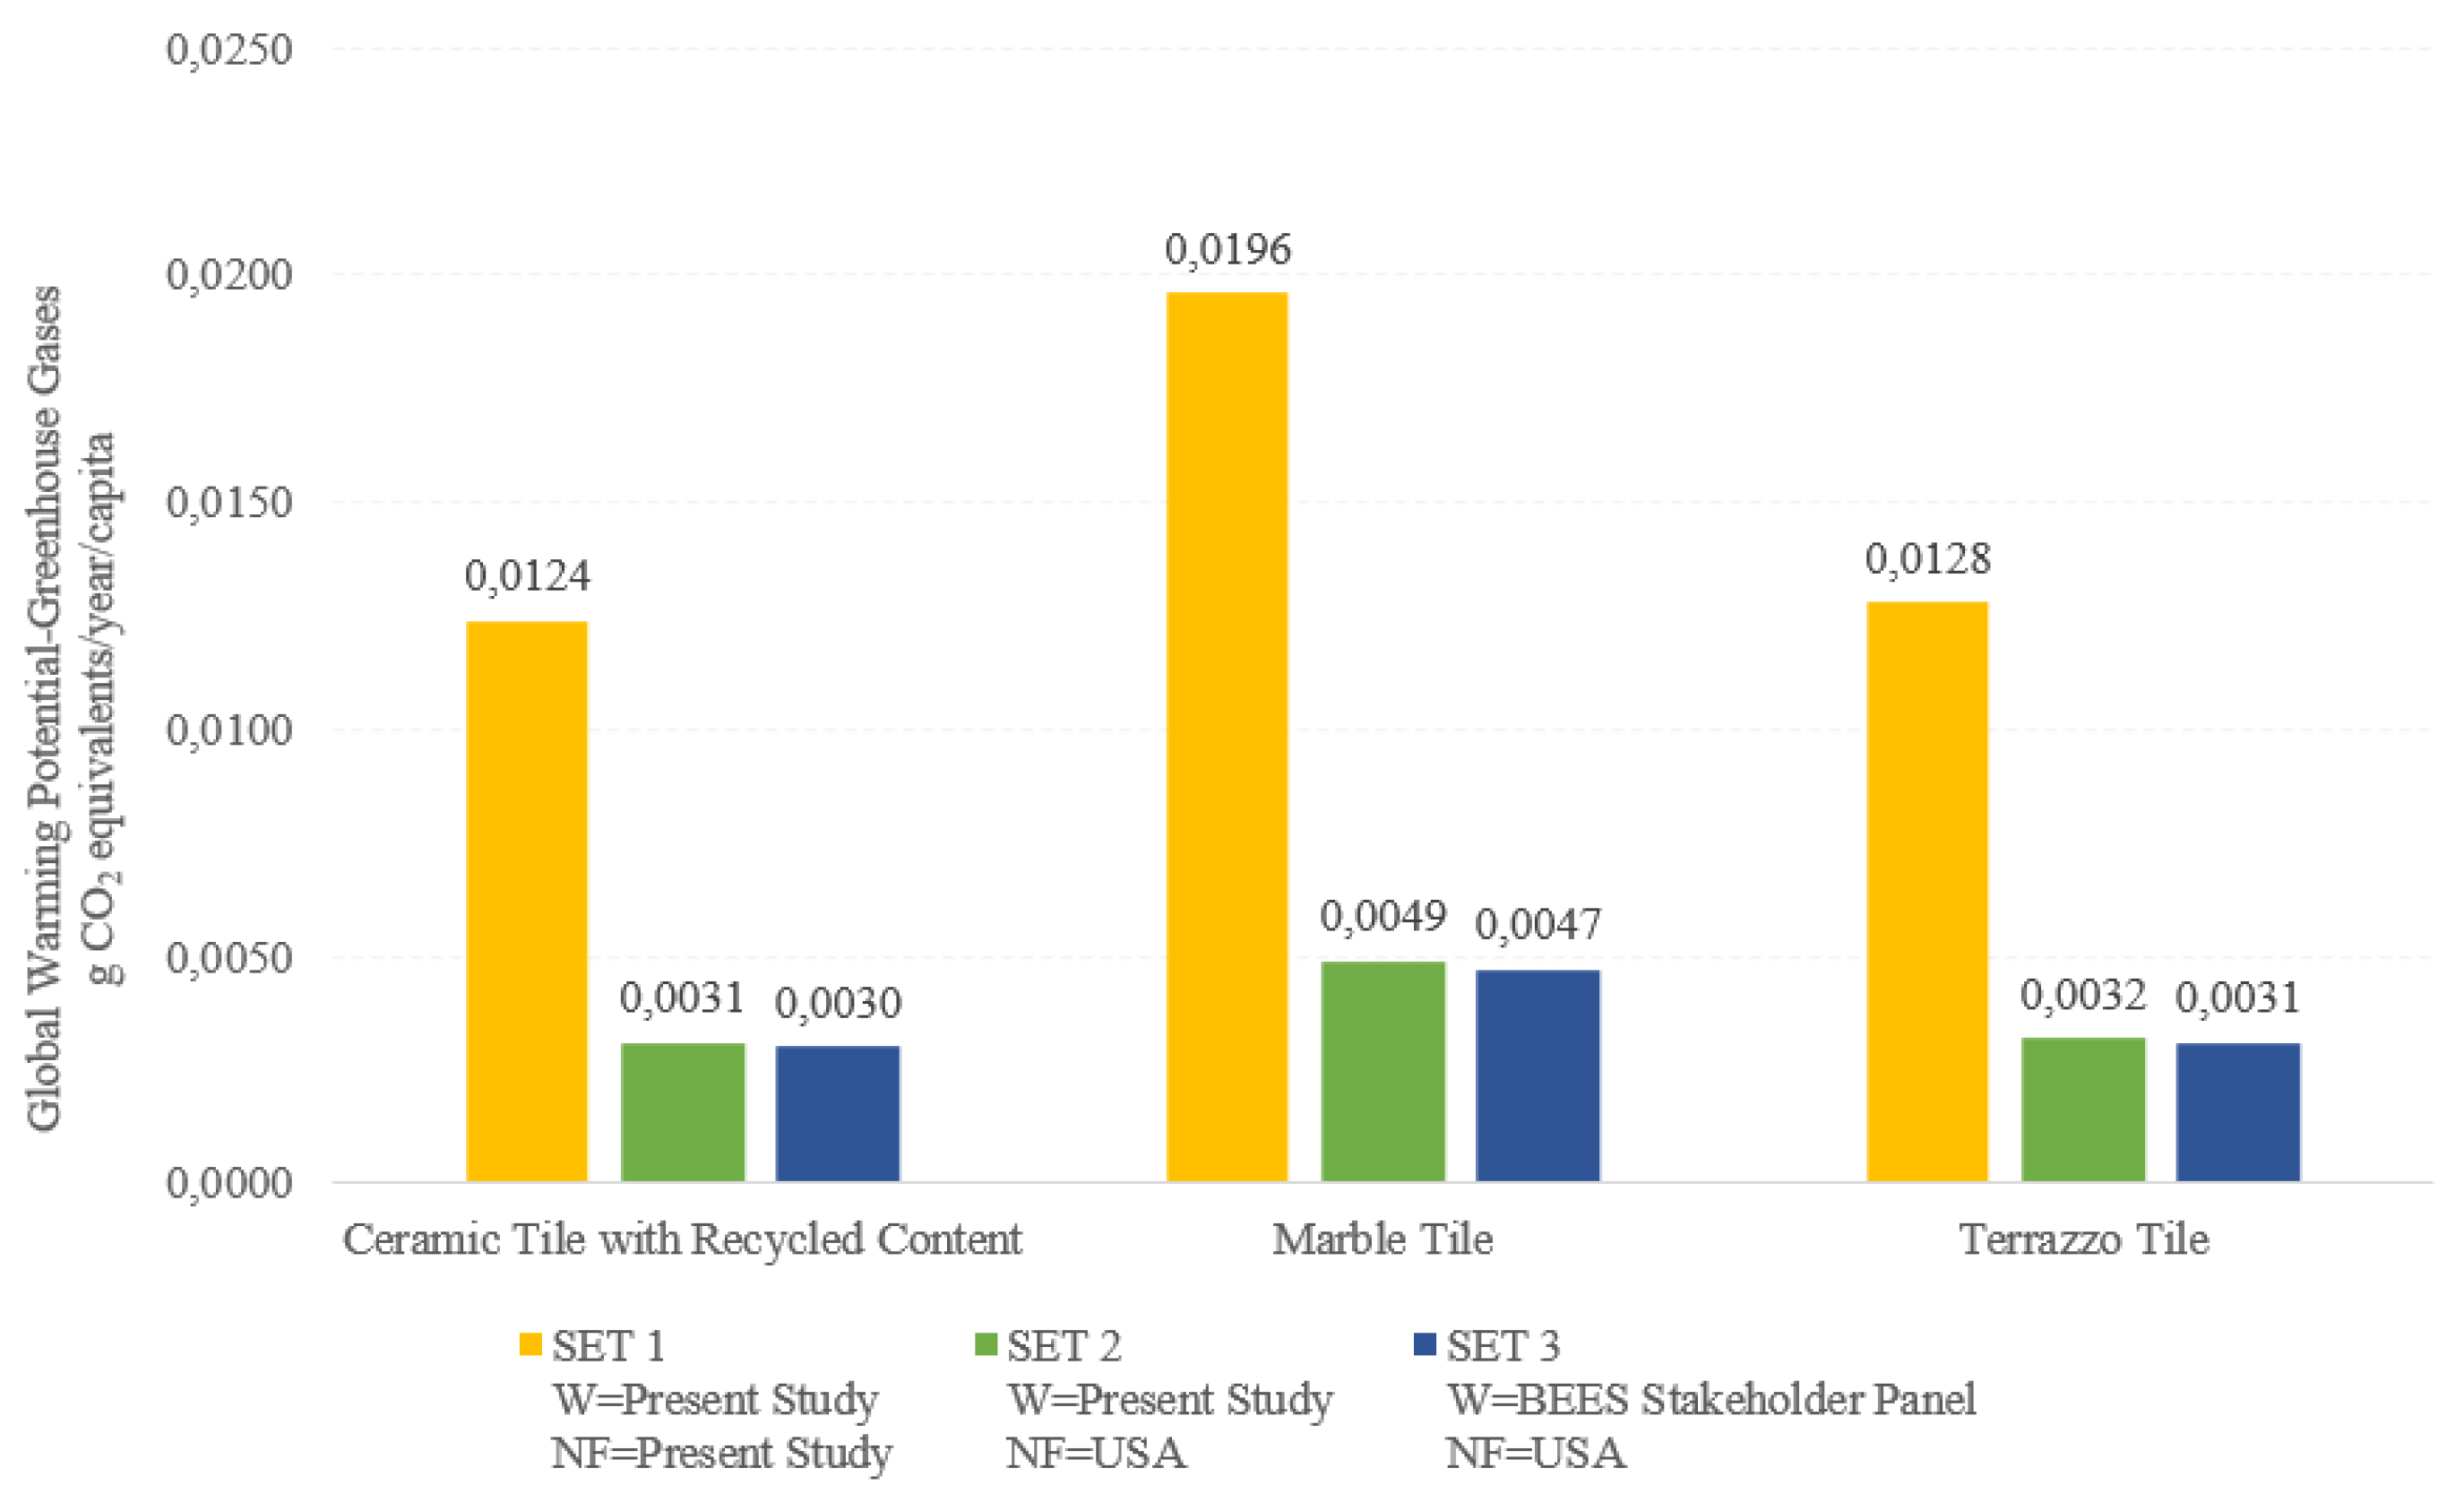
Figure 5.
Total environmental impact scores of flooring materials calculated according to different weights and normalization values.
Figure 5.
Total environmental impact scores of flooring materials calculated according to different weights and normalization values.
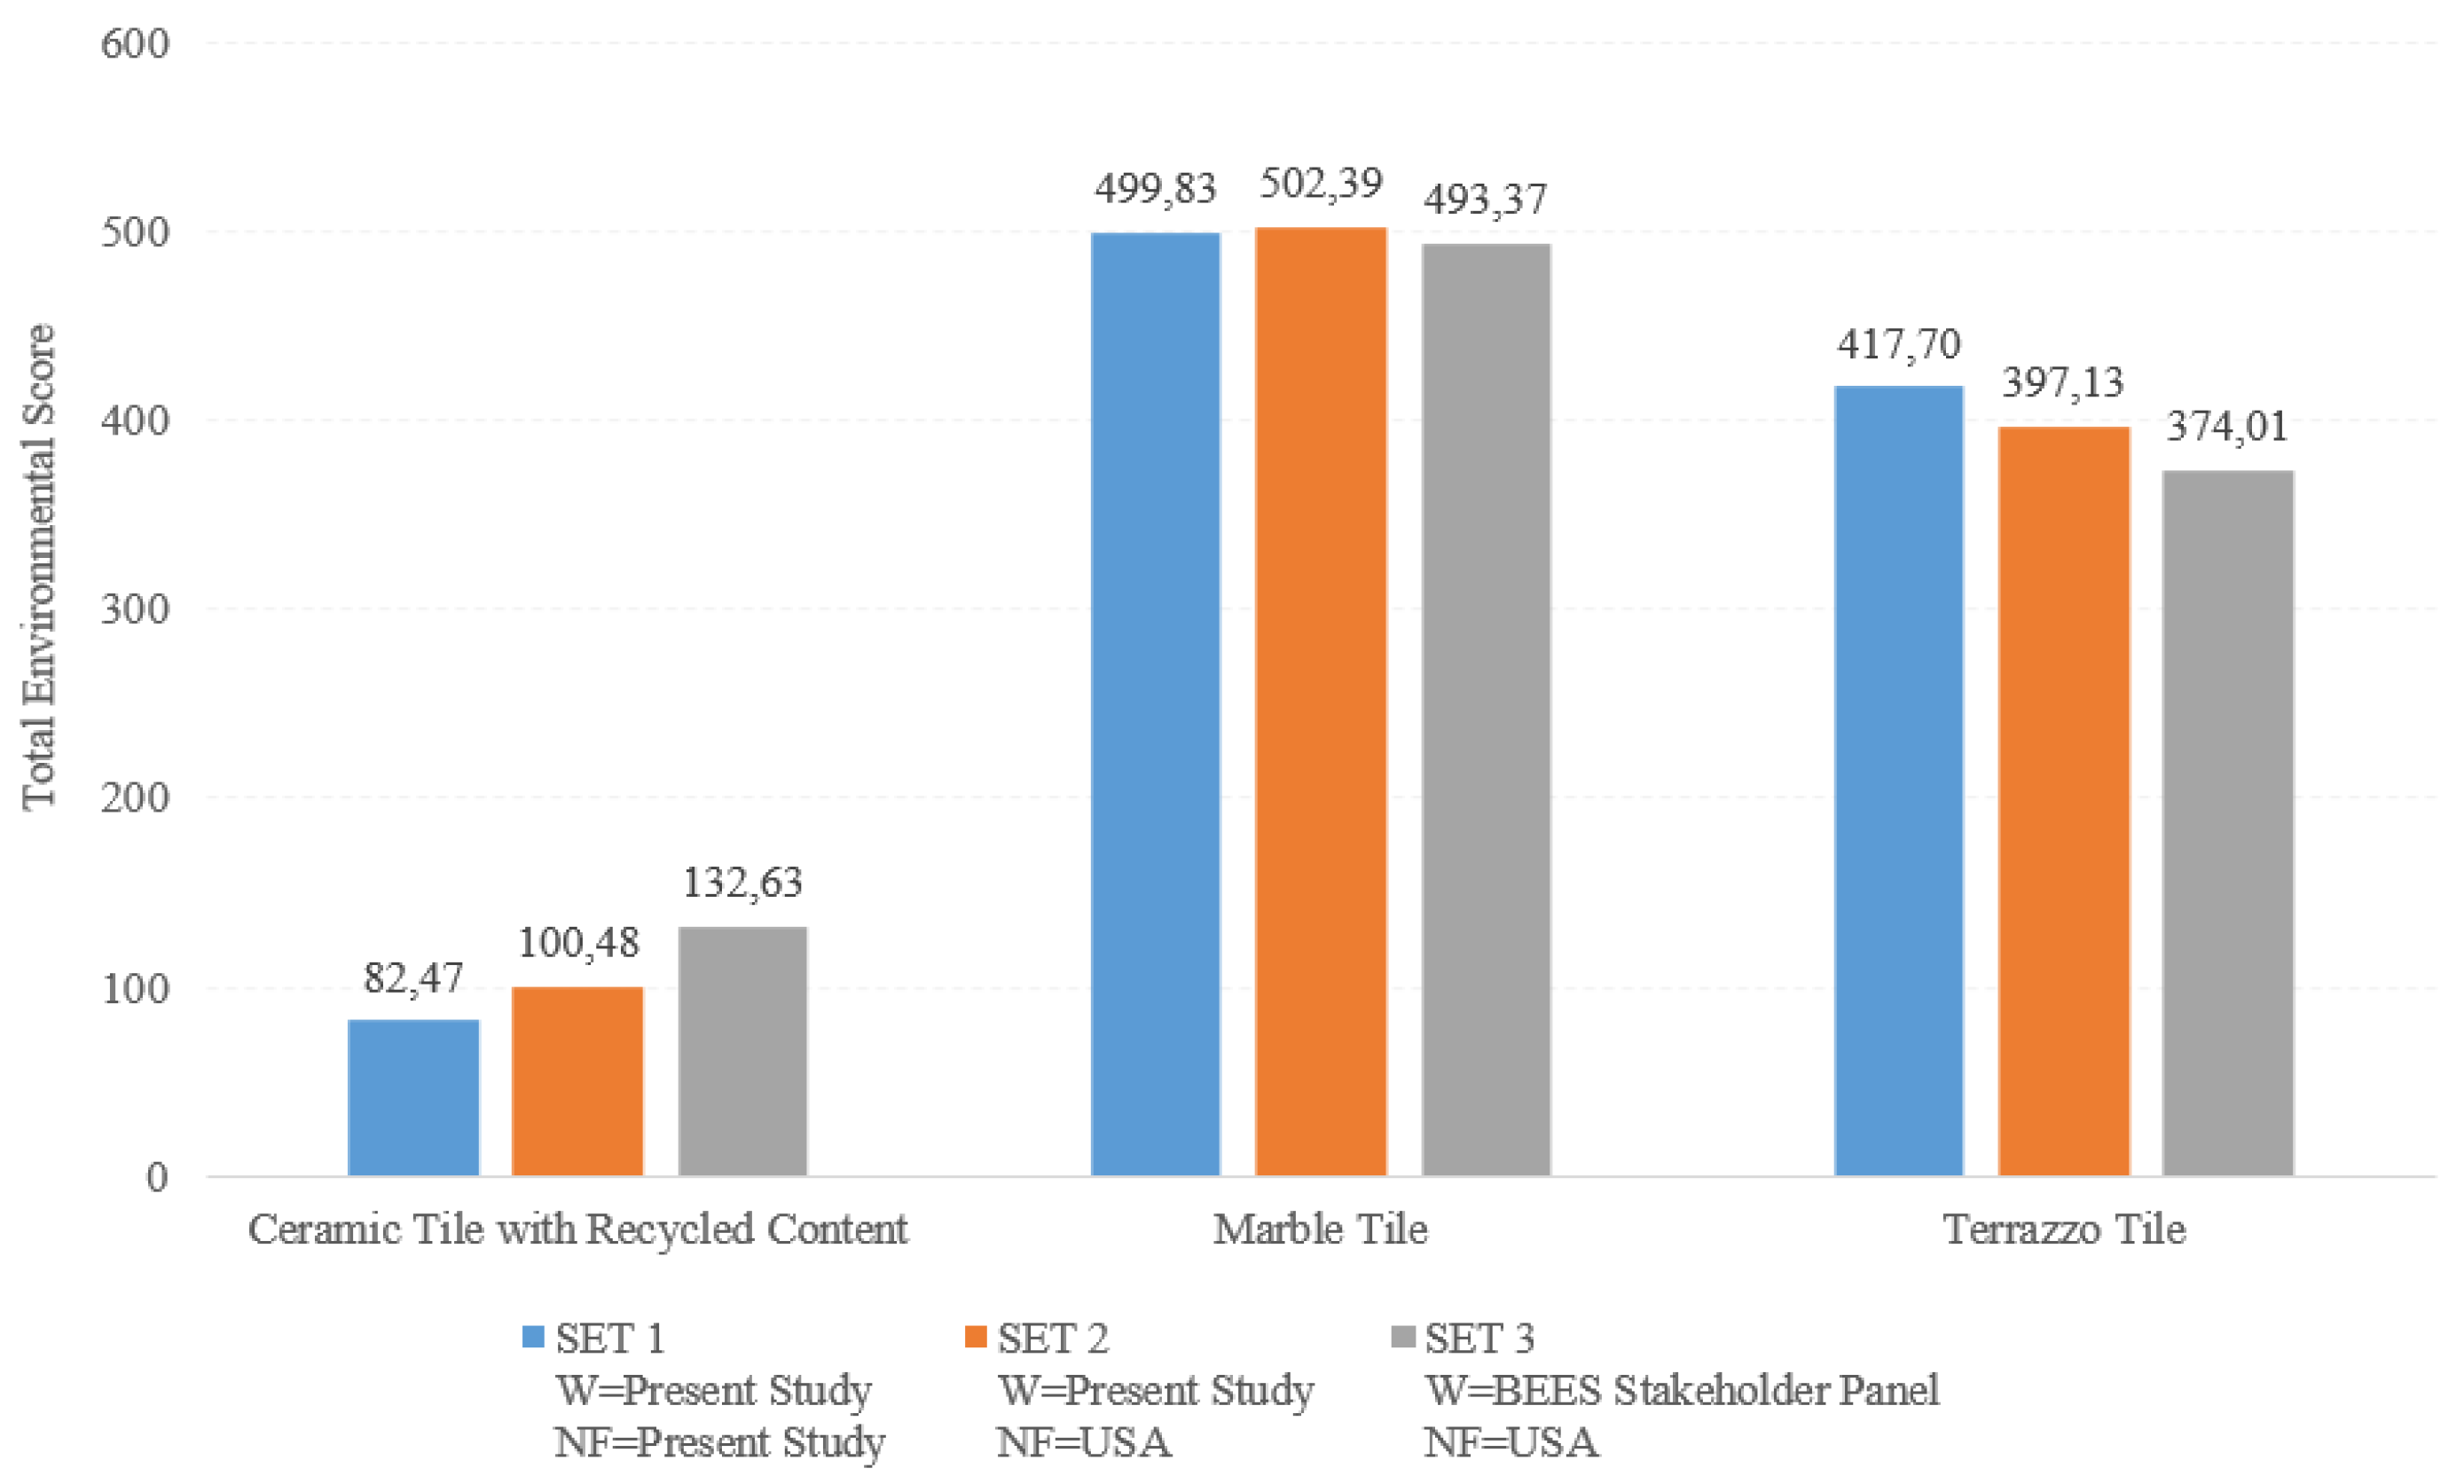
Figure 6.
Global warming potentials due to greenhouse gas emissions of exterior wall finishes materials.
Figure 6.
Global warming potentials due to greenhouse gas emissions of exterior wall finishes materials.
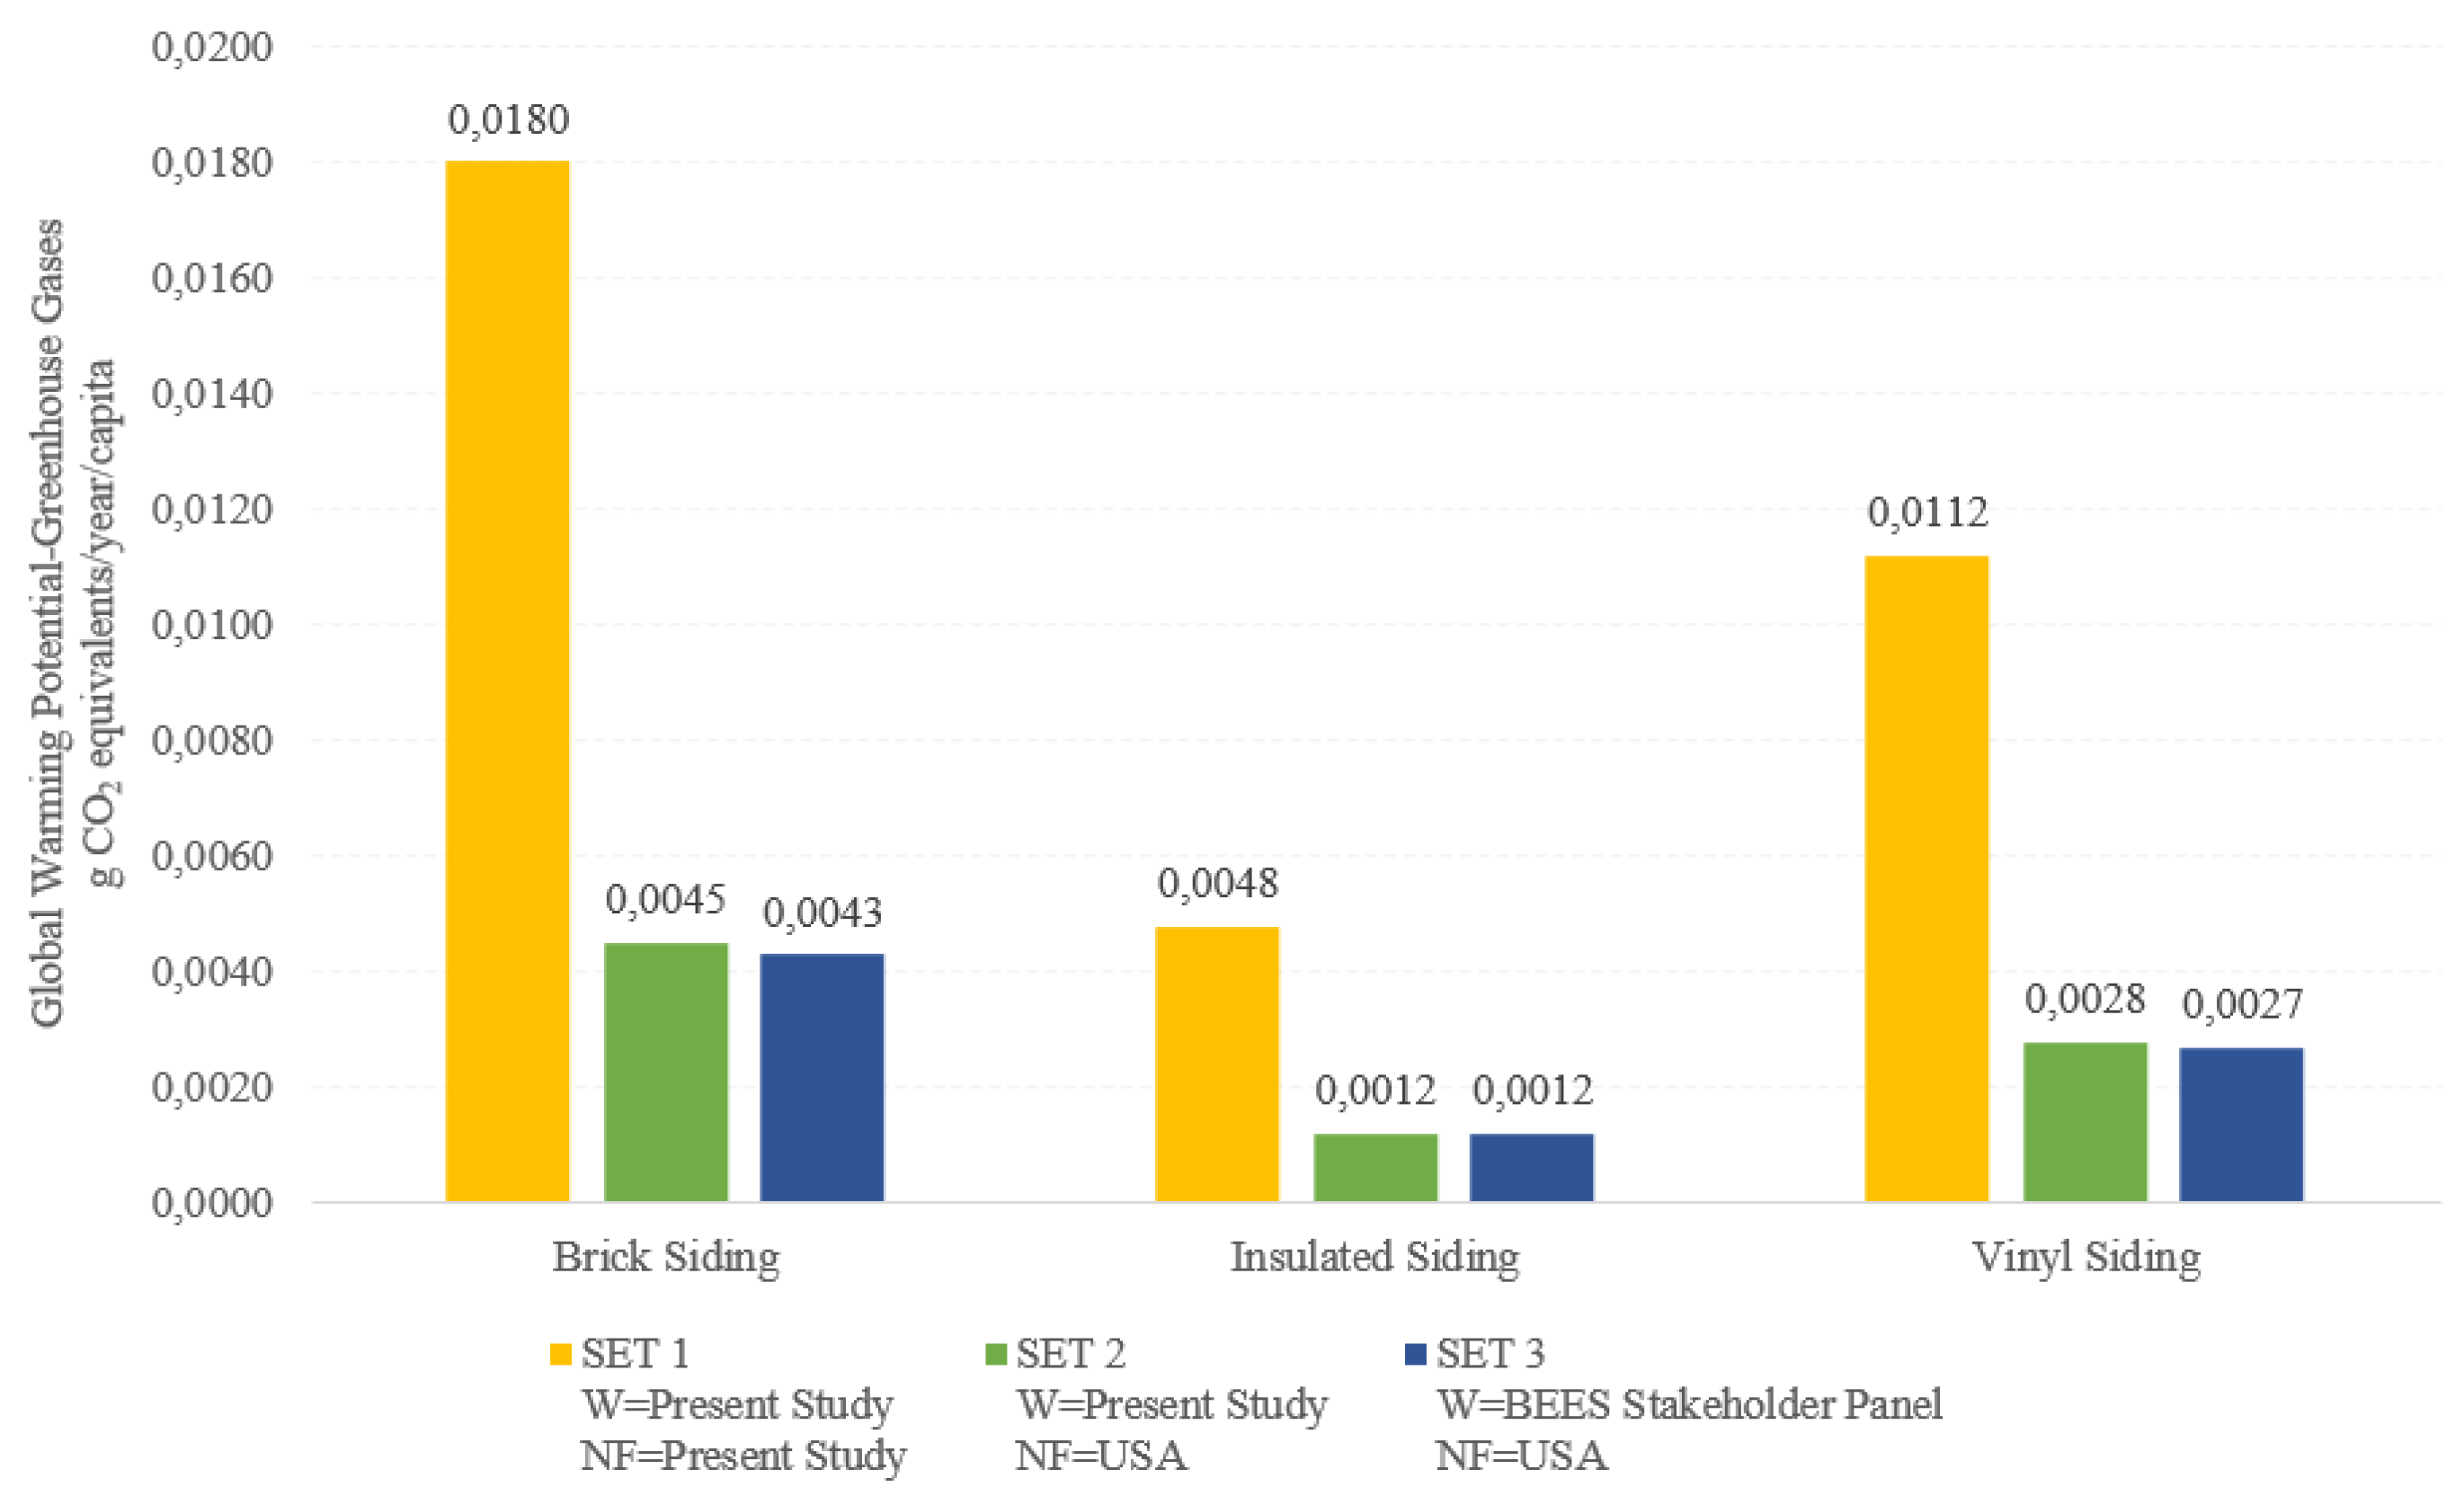
Figure 7.
Total environmental impact scores of exterior wall finishes materials calculated according to different weights and normalization values.
Figure 7.
Total environmental impact scores of exterior wall finishes materials calculated according to different weights and normalization values.
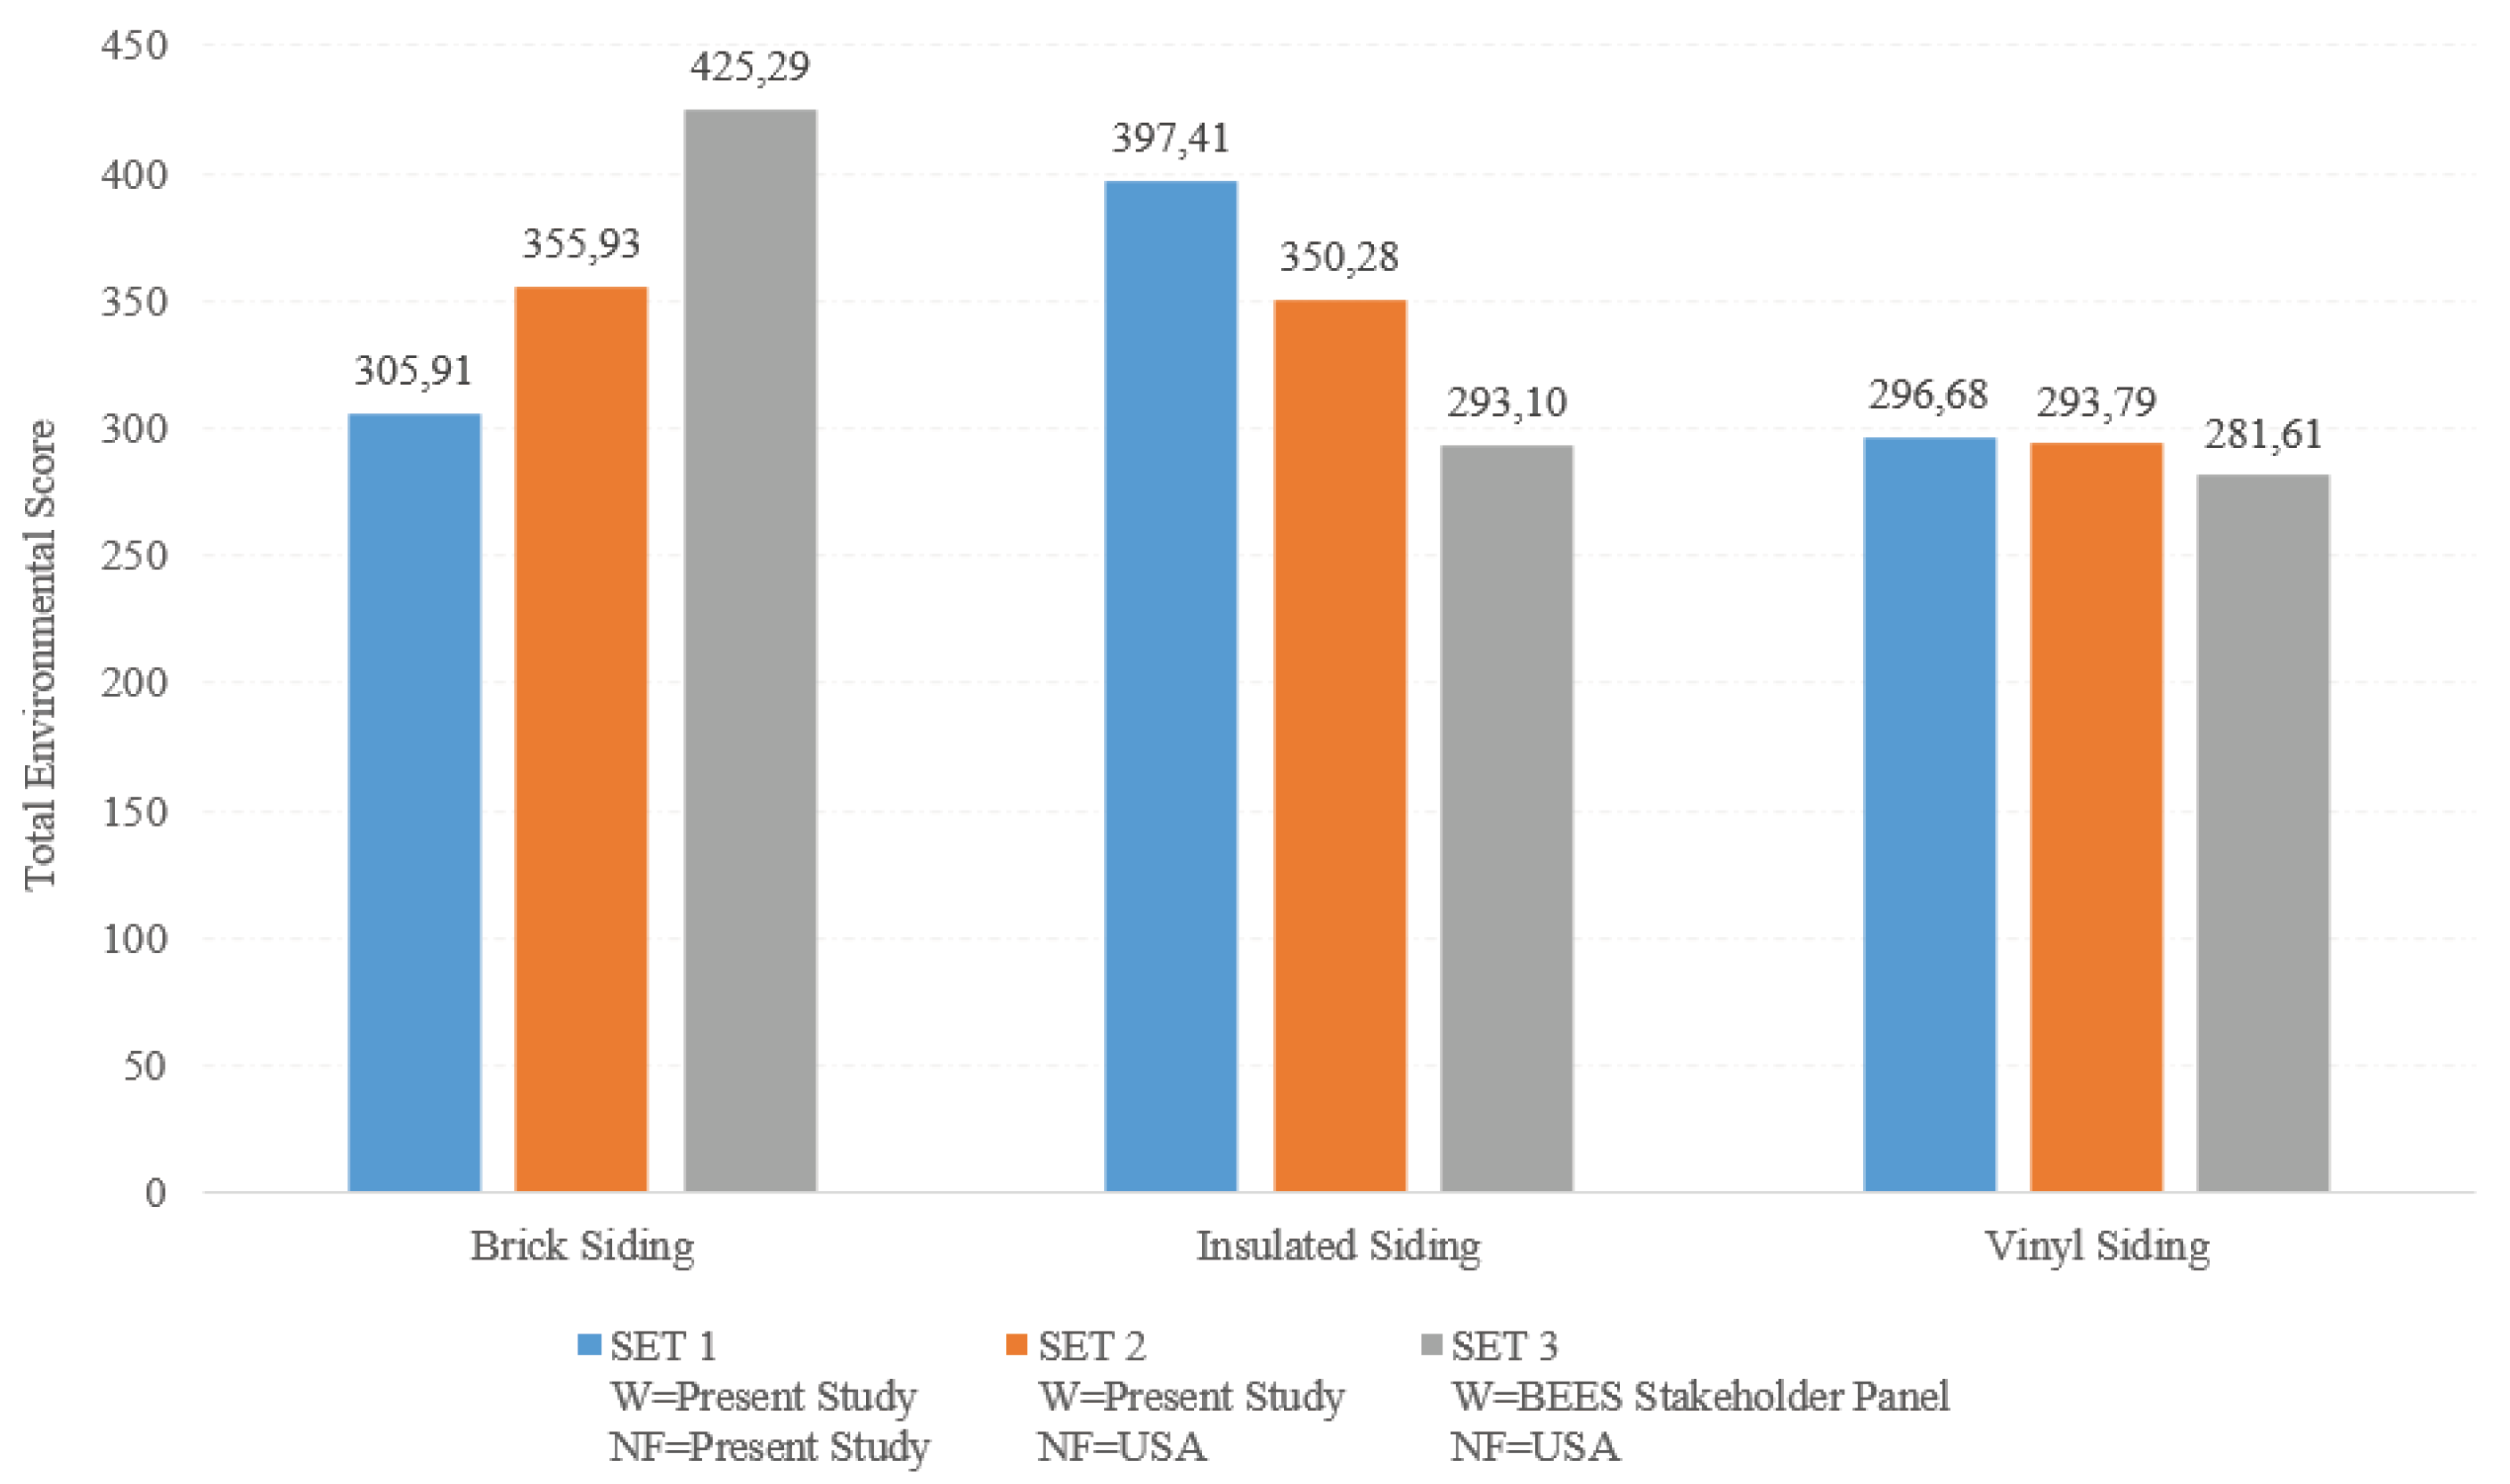

Table 1.
Obtaining the air pollution environmental impact category normalization reference information value.
Table 1.
Obtaining the air pollution environmental impact category normalization reference information value.
| Air pollutants | NOx | >PM10 | <=PM10 | Unspecified PM | SOx |
| Emission factors | 0,002 | 0,046 | 0,083 | 0,046 | 0,014 |
| Emissions | 7,85E+11 g | NA | 239,08E+9 g (PM10) 193,64E+9 g (PM2.5) |
NA | 2,52E+12 g |
| Air pollution index | 1 570 000 000 | - | 35 915 760 000 | 35 266 000 000 | |
| Total | 72 751 760 000 microDALYs/year | ||||
| Population (capita) | 82 003 882 | ||||
| Normalization reference information value | 887,17 microDALYs/year/capita | ||||
| NA: not available mi: inventory input i as in grams CPi: microDALYs per functional unit of inventory input i (as gram in this table) | |||||
Table 2.
Obtaining the acidification environmental impact category normalization reference information value.
Table 2.
Obtaining the acidification environmental impact category normalization reference information value.
| Acidifiers | NH3 | HCl | HCN | HF | H2S | NOx | SOx | H2SO4 |
| Emission factors | 95,49 | 44,70 | 60,4 | 81,26 | 95,9 | 40,04 | 50,79 | 33,30 |
| Emissions | 7,28E+11 g | NA | NA | NA | NA | 7,85E+11 g | 2,519E+12 g | NA |
| Acidification index | 6,952E+13 | - | - | - | - | 3,143E+13 | 1,279E+14 | - |
| Total | 2,289E+14 H+ eq./year | |||||||
| Population (capita) | 82 003 882 | |||||||
| Normalization reference information value | 2 791 186,52 H+ eq./year/capita | |||||||
| NA: not available mi: inventory input i as in grams APi: millimoles of hydrogen ions per functional unit of inventory input i (as gram in this table) | ||||||||
Table 3.
Normalization values.
| Environmental impact categories | Reference unit | Present Study | USA [44] |
|---|---|---|---|
| Acidification | H+ eq./year/capita | 2 791 186,52 | 7 800 200 000 |
| Air Pollution | microDALYs/year/capita | 887,17 | 19 200 |
| Ecological Toxicity | g 2,4-D eq./ year/capita | 43 238,69 | 81 646,72 |
| Eutrophication | g N eq./ year/capita | 27 104,47 | 19 214,20 |
| Fossil Fuel Depletion | MJ energy/year/capita | 300 489,72 | 35 309 |
| Global Warming | g CO2 eq./ year/capita | 6 400 000 | 25 582 640,09 |
| Human Health | g C7H8 eq./ year/capita | 13 357 199,68 | 274 557 555,37 |
| Indoor Air Quality | g TotalVOCs/ year/capita | 35 108,09 | 35 108,09 |
| Land Use | count/acre/capita | 0,002344 | 0,00335 |
| Ozone Depletion | g CFC-11 eq./ year/capita | 2,439 | 340,19 |
| Photochemical Smog Formation | g NOx eq./ year/capita | 11 870,17 | 151 500,03 |
| Water Depletion | liters/ year/capita | 81760 | 529 957,75 |
Table 4.
Testing materials.
| Groups of Building Materials | Building Material |
|---|---|
| GROUP 1: Floor coverings | Ceramic Tile with Recycled Content |
| Marble Tile | |
| Terrazzo Tile | |
| GROUP 2: Exterior wall finishes | Brick Siding |
| Insulated Siding | |
| Vinyl Siding |
Disclaimer/Publisher’s Note: The statements, opinions and data contained in all publications are solely those of the individual author(s) and contributor(s) and not of MDPI and/or the editor(s). MDPI and/or the editor(s) disclaim responsibility for any injury to people or property resulting from any ideas, methods, instructions or products referred to in the content. |
© 2024 by the authors. Licensee MDPI, Basel, Switzerland. This article is an open access article distributed under the terms and conditions of the Creative Commons Attribution (CC BY) license (http://creativecommons.org/licenses/by/4.0/).
Copyright: This open access article is published under a Creative Commons CC BY 4.0 license, which permit the free download, distribution, and reuse, provided that the author and preprint are cited in any reuse.


