
Submitted:
17 January 2025
Posted:
20 January 2025
You are already at the latest version
Abstract
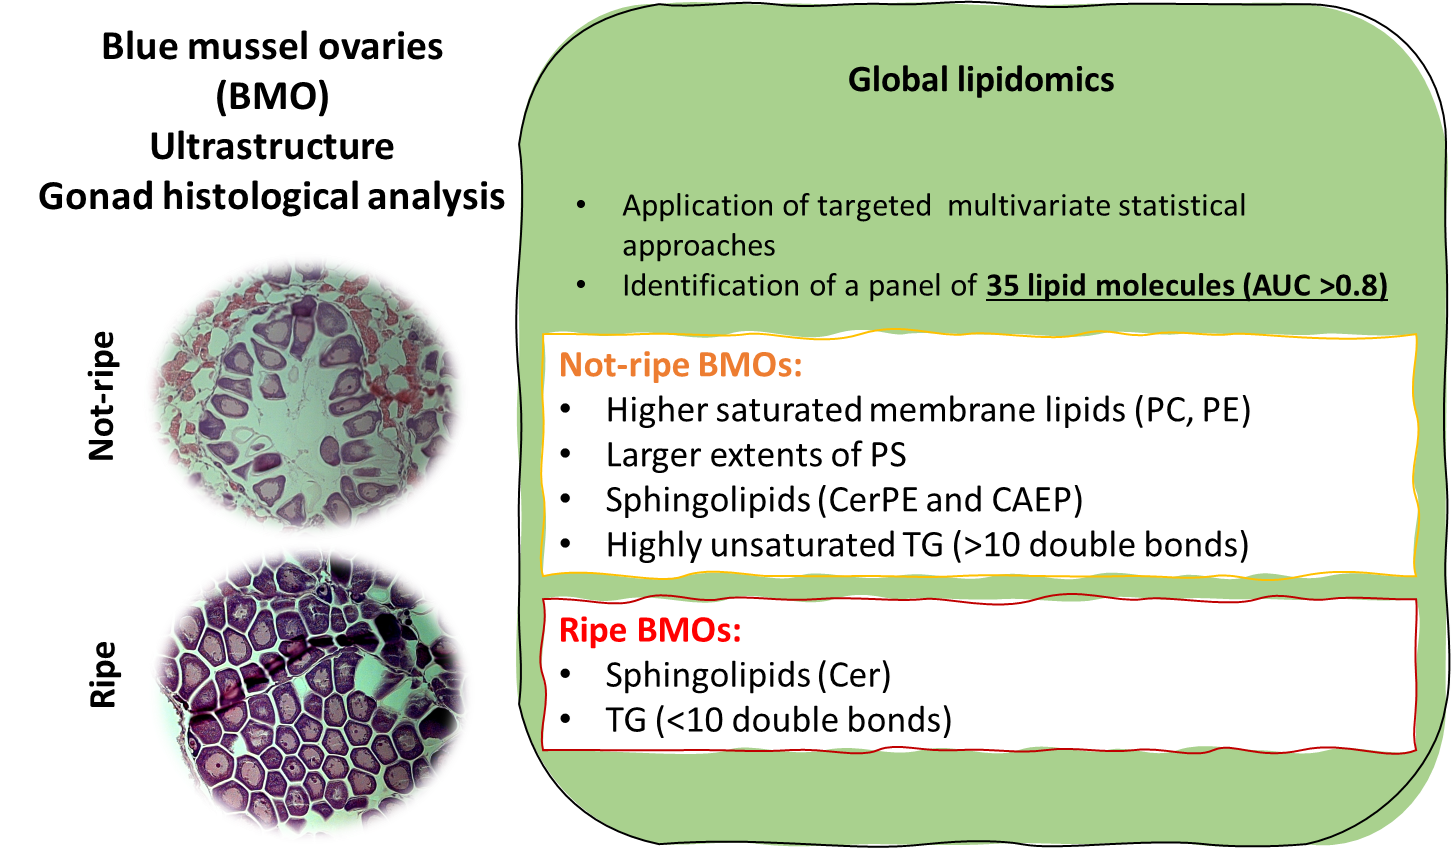
Gonadal histological analysis (GHA) is the traditional method for assessing the gonad maturation status of blue mussels (Mytilus edulis). GHA has some operational disadvantages, such as limited processing outputs, subjectivity in the assessment of transitional stages of gonadal maturation and the need for experienced and trained operators. Lipids could become important indicators of gonadal maturation as they cover many essential functions during such process in mussels.In this work, blue mussel ovaries (BMOs) ultrastructure is integrated with LC-MS lipidomics fingerprinting to identify markers for ovarian maturation through the application of supervised chemometrics (volcano analysis, orthogonal partial least squares discriminant analysis – OPLS-DA) and machine learning (RandomForest). BMOs are classified here as ripe or non-ripe by means of GHA and gamete volume fraction (GVF). Receiving operating characteristics (ROC) curves were used to classify the results of the different statistics according to their area under the curve (AUC), and the functional role of important lipids was assessed by lipid ontology enrichment (LiOn) analysis.This approach allowed the selection of a panel of 35 lipid molecules (AUC>0.8) that can distinguish not ripe from ripe BMOs. The ceramide phosphoethanolamine (CerPE) 40:2 was the molecule with the highest classification ability (AUC 0.905), whereas glycerophosphoserines (PS) was the class mostly changing between the two groups. LiOn analysis indicated significant differences in the functional roles of these lipids, highlighting enrichment terms associated with membrane lipids, lysosomes and highly unsaturated triglycerides (TG) in not ripe ovaries, whereas terms associated with storage lipids and low saturated TG characterised ripe BMOs.
Keywords:
lipidomics
; gonad histology
; blue mussels
; ovary maturation
; lipid markers
1. Introduction
Mussels are important species for marine ecosystems as they are recognised as habitat engineers and provide valuable ecosystem services for coastal areas and their economies [1,2]. Mussels are valuable aquaculture resources characterised by an extremely low environmental footprint [3,4], high nutritional properties [5], and their demand as food products is projected to increase in the future net-zero society [6]. Unfortunately, despite their prospective importance, mussel production in Europe has stagnated since 1999 [7], and the expansion of the mussel aquaculture sector is hampered by various factors, including climate change [8]. Therefore, it is important to increase our knowledge of mussel physiology and biochemistry and to identify further useful tools to monitor and predict the ability of mussels to adapt and thrive in future environmental scenarios.
Gonadal development is the main physiological process that runs through the annual life cycle of temperate mussels [9]. Blue mussels (Mytilus edulis) have an annual reproductive cycle with an accumulation of energy resources in late summer and autumn, a gonadal maturation process that extends through winter, and one or more spawning events in spring and early summer [10,11,12,13,14]. During maturation, gonads proliferate on the mantle, which undergoes a series of ultrastructural and biochemical reorganisations. In mature mussels, the mantle can account for 50% of the total body dry weight [14]. In resting females, the mantle consists of a single-layered cuboidal epithelium that is ciliated on the inner surface and composed of adipogranular (ADG) and vesicular connective tissue (VCT) cells [15]. ADG and VCT cells support oocyte development by providing glycogen and lipids, respectively [12]. The oocytes increase in numbers and mature, accumulating lipid droplets that form the yolk reserves of the embryos [16]. Glycogen is consumed during the development process, while lipids are accumulated in the oocytes [17,18]. This process leads to the annual accumulation patterns of lipids in several bivalve species, including Crassostrea gigas [19,20,21], Ostrea edulis [22], M. edulis [17,23], Mytilus galloprovincialis [24], Modiolus barbatus [25], Chlamis nobilis [26], Tapes decussatus and Tapes philippinarum [27].
Detailed information about the maturation of the gonads is important for the industrial production of mussels in hatcheries, where the mussels are artificially conditioned (so-called broodstock conditioning) to maximise gamete production. Mussels do not store their oocytes for prolonged periods of time, as it is their physiology to partially or completely spawn within a few weeks of sexual maturity [28]. Missing the right time window for gonad development can lead to unnecessary resource consumption, uncontrolled spawning or the occurrence of pre-spawning atresia [28,29,30].
Various histological, biochemical and molecular methods have been used to assess gonadal maturation in bivalves. Historical approaches included the use of allometric ratios as a measure of mussel condition. The condition index, which measures the ratio of soft tissue to shell [31], and the gonadosomatic index, which measures the ratio of mantle to soft tissue [32], are two commonly cited examples in the literature. Traditional techniques also include gonadal smears and gonadal histological analysis (GHA) [33,34]. The fastest method to obtain information on the gonadal status of mussels is the gonadal smear, although the loss of tissue structure due to sample preparation makes it difficult to distinguish between different stages of maturity. The ultrastructure of the tissue is well preserved in the GHA, making it the most important technique for analysing the reproductive cycle in bivalves [10,12,30,34,35,36]. The limitations of GHA are the limited sample size (e.g. the number of samples that can be processed per time unit), the difficulty in distinguishing transitional stages of development, and a certain degree of subjectivity that requires experienced operators in classifying the degree of development of gonads [37,38]. GHA has also been coupled with stereological indices, leading to the development of several quantitative indices of gonadal maturation, such as gamete volume fraction (GVF) or oocyte cytoplasmic area, overcoming some of the limitations of classical GHA [11,39,40,41,42]. Hines and co-workers compared classical histological approaches with metabolic and molecular techniques and showed that the latter two methods are advantageous in distinguishing sex in dormant or spent mussels [43].
Lipids play important role in mussel gonad maturation, as several authors have reported direct changes in lipid composition as a result of the maturation process [18,21,44,45,46]. Triglycerides (TG) were the major lipid class that changed during gonadal development in the ovaries of both Pecten maximus and C. gigas, accumulating in mature individuals [21,44]. Martinez-Pita and co-workers found no changes in the composition of lipid classes between the different stages of ovarian development in M. galloprovincialis and Donax trunchulus [18,45]. When analysing fatty acids (FA), these authors observed an increase in FA18:4n-3 in mature females of both species and of FA18:0, FA18:3n-3 and docosahexaenoic acid (DHA, FA22:6n-3) specifically in mature female mussels. The complexity of observing a direct effect of gamete development on gonad lipid composition may be related to the seasonal behaviour of the gonad development in bivalves, which tends to span over several months [11,12,13,32]. Furthermore, gonads are also a non-uniform tissue, as several developmental stages (or regressions) can occur simultaneously in the same organism [18,47], which greatly increases the difficulty of such a task.
Lipidomics and the use of liquid chromatography coupled with mass spectrometry (LC-MS) could offer several advantages over conventional lipid analysis techniques when analysing a complex tissue such as bivalve gonads. First, the study of lipids at molecules level combines information from FA and lipid class composition analysis, revealing patterns that are otherwise lost when relying on only one of these two traditional lipid profiling techniques [48]. Second, modern MS platforms are characterised by higher sensitivity than traditional detectors used in lipid class analysis, providing an opportunity to evidence and extend existing knowledge on the role covered by minor, uncommon and poorly understood lipid classes in ovarian maturation of mussels. To date, rare are the studies investigating gamete development in marine invertebrates using LC-MS. One of the first examples of this type of study comes from Chansela and coworkers who investigated the lipid composition of Paeneus marguirensis ovaries using a mass spectrometry imaging approach [49]. The authors showed how follicles from the same histological preparation, but with different maturation stages, differed in their composition of major phosphocholine (PC) and TG molecular species. The results of this study demonstrate the presence of low unsaturated PC species (PC 32:1) and highly unsaturated TG (58:9) especially in the early developing gonadal areas. However, PC and TG associated with essential polyunsaturated FA such as eicosapentaenoic acid (EPA, FA20:5n-3), arachidonic acid (AA, FA20:4n-6) and DHA were only abundant in mature follicles.
More recently, the lipidome of the gonads of M. edulis has been characterised in detail, focusing on sex-specific differences between testis and ovaries [50]. In the present study, we aim to build on this previous work and continue here to analyse the blue mussel ovarian (BMO) lipidome by integrating GHA with LC-MS global untargeted lipidomics through a comprehensive statistical approach, incorporating unsupervised and supervised multivariate chemometrics and machine learning (RandomForest – RF [51]), applied here to highlight potential lipid markers that distinguish between histologically ripe (stage III) and non-ripe BMOs (stages I-II).
2. Materials and Methods
2.1. Mussels Collection and Sample Preparation
Commercial size blue mussels (Mytilus edulis, average shell size 5.6 ± 0.6 cm) were obtained from local growers on the West Coast of Scotland (Inverlussa Marine Services - www.inverlussa.com, Loch Spelve, Isle of Mull, UK) in February 2017. Mussels rearing and processing (sizing, feeding, aquarium rearing conditions) used in this study has been described in a previous publication [50] and details are provided in Methods Supplement 1. Each adult was opened “book-like” by cutting the hinge and abductor muscle with a scalpel and carefully removing the gills with bow scissors. The left valve mantle lobe was dissected and placed in a 1.5 mL tube (Eppendorf), snap-frozen in liquid nitrogen and stored at -80 °C for lipid analysis. The right mantle lobe was excised and stored in 7 mL Bijoux tubes (VWR) in 4% buffered seawater formalin for GHA.
2.2. Histological Analyses
The sex of each adult animal was determined by GHA after haematoxylin and eosin (H&E) staining, the standard method for sex determination and assessment of gonadal maturation [30,35,43,52]. H&E-stained slides were photographed with an Axioshop 2 inverted microscope (CarlZeiss) equipped with an AxioCam MRc5 camera (CarlZeiss) and acquired with the corresponding AxioVision 4.7 software. The GHA scores were assigned according to the ultrastructure of the gonads using a 4-staging classification system [10,12,53]. The reference samples used in the gonad classification system are shown in Methods Supplement 2a. Three different sections (anterior, medial and posterior) of the mantle of each mussel were scored to distinguish between ripe (stage III, N=25) and non-ripe (stages I-II, N=26) ovaries. The distinction between vitellogenic and atretic/degenerating gonads was made according to the criteria reported by [28] and [16] as described in Methods Supplement 2b. When different stages occurred simultaneously in a single section, the decision on staging was based on the condition of the largest part of the preparation [18]. A stereological variable to quantify the percentage of mantle area covered by gametes (gamete volume fraction – GVF) was calculated by image analysis of the GHA preparations using ImageJ software (www.imagej.nih.gov) via the colour threshold method (see Methods Supplement 2c for details). GVF was calculated as the percentage between the total mantle surface area and the mantle surface area covered with gametes. The relationship between GHA and GVF is shown in Appendix A (Figure A1). All GHA and GVF scores are provided in Supplementary Data 1.
2.3. Lipid Extraction
Frozen dissected BMOs were freeze-dried (ẞ18 LO plus, Christ) and ground to a fine powder in liquid nitrogen; ≈ 0.05 g of powdered dry BMOs were individually homogenised in HPLC water (Fisherbrand) for 1 min in glass potters (1:8 weight:volume) on ice. Aliquots of the homogenate (20 µL) from each gonad were pooled and formed the biological quality control (BQC) samples. Lipid extraction was performed according to [54] as described in [50]. Total lipids were extracted from 50 µL of BMO homogenate and BQC with 6 mL of 2:1 chloroform:methanol (both Fisherbrand) in pre-combusted (450°C 5 hr) 20 mL screw-cap vials (Pyrex). The mixture was shaken vigorously, then each vial was flushed with nitrogen and extracted on ice for 1 hr under dark conditions. The organic extract was separated from the pellet by centrifugation (350 g, 5 min, 4 °C) and collected in a clean tube. The pellet was re-extracted with a further 3 mL of chloroform:methanol. A 0.9 % KCl solution (VWR) was added to the organic extract to obtain a final ratio of 2:1:0.8 chloroform:methanol:KCl, and the polar and organic phases were separated after a second centrifugation step (350 g, 5 min, 4 °C). The organic layer was recovered and evaporated under nitrogen flow (NVap, Organomation). The dried lipid extracts were weighed (0.0001 g accuracy) and resuspended in 0.5 mL chloroform, yielding the BMO total lipid extract (TLE).
2.4. LC-MS Untargeted Lipidomics
Global lipidomics analyses of BMO TLE were performed by liquid chromatography coupled with high-resolution mass spectrometry (LC-MS) via a binary ultra-high pressure liquid chromatography (UHPLC) system (1250 Accela, ThermoFisher) connected to an electron spray ionization (ESI) and an Orbitrap mass analyser (Exactive, ThermoFisher). Separation was performed on a C18 Hypersil Gold 100 × 2.1 mm 1.9 nm particle size (ThermoFisher) maintained at 50 °C. The binary solvent system comprised a constant flow rate of 400 μL min-1 with a gradient as described in Supplementary Table S1. Water and acetonitrile were HPLC grade and purchased from Fisherbrand, isopropanol was LC-MS grade (Hypergrade LiChrosolv, Merck), while ammonium formate and formic acid were both LC-MS grade and purchased from Sigma-Aldrich. TLEs were resuspended in 3:1 methanol:chloroform at a concentration of 1 mg mL- 1 for 3 μL injection volume.
All samples were analysed in positive (POS) and negative (NEG) ion mode over the m/z range of 250–2000 Da at a resolution of 100,000 FWHM and a scan speed of 1 Hz. Mass error was kept below 5 ppm by routine calibrations for both polarities using a calibration solution (Pierce™ LTQ ESI calibration solutions, ThermoFisher). Chromatograms and mass spectra were reviewed and integrated using Xcalibur software (ThermoFisher).
2.5. Data Processing
The raw LC-MS data were processed using Progenesis QI (Nonlinear Dynamics, Waters). Lipids were identified by the exact mass of the precursor ion (MS', 5 ppm Δm/z), and with the exception of CAEP (ceramide aminoethyl phosphonates [55]), lipid IDs are reported according to the LIPID MAPs nomenclature standard system [56,57]. Raw data from LC-MS lipid adducts for POS and NEG were experimentally evaluated using the lipid standard mixture (Supplementary Table S2) purchased from Avanti Polar Lipids (www.avantilipids.com) and Matreya (www.matreya.com). Lipid IDs were obtained by searching for exact masses in the lipid mass spectra libraries LIPID MAPS (www.lipidmaps.org), Human Metabolome Data Base – HMDB (www.hmdb.ca) and Metlin (www.metlin.scripps.edu), as well as from an in-house lipid database derived from lipidomics studies on bivalves and other marine invertebrates, which served as a tool for the identification of unusual marine lipids [55,58,59,60,61,62,63,64,65,66]. Isomeric lipid molecules resolved by reverse phase separation (same exact mass 5 Δppm, but different retention time) are distinguished with a lowercase letter after the lipid ID (i.e. PC 38:5a and PC 38:5b). The full set of lipids identified in the BMO and used in this study is included in Supplementary Data 1. All LC-MS raw data files and experimental metadata have been deposited in the Metabolights [67] data repository (www.ebi.ac.uk/metabolights/MTBLS8492) and are available under the study identifier MTBLS8492.
2.6. Data Analysis
The statistical analysis was performed with the statistical platform R (version 4.2.0). Data are presented as mean ± standard deviation unless otherwise stated. Statistical differences were considered significant at p<0.05.
The peak intensity tables (PIT), created from LC-MS data obtained by POS and NEG ionisation modalities, were manually sorted to remove contaminant masses. Further data filtering included removing features with >30% missing values, with the remaining missing values replaced by a small value (half of the minimum intensity value) and characteristics with low repeatability removed by filtering out using BQC and the interquartile range. The filtering of the raw data was performed using the filtering functions of the R-based package "MetaboAnalystR" [68]. At this stage, POS and NEG data were merged into a single dataset to avoid redundancy in the analysis. Duplicate lipids (i.e., observed in the POS and NEG data) were manually checked for their retention time between the different samples; if they matched, the ionization polarity that gave the best results in terms of signal for that specific lipid class was retained, assessed using as reference the lipid standard mixture.
The PIT was autoscaled (mean centered and divided by each lipid standard deviation), and the preliminary approach used to highlight lipids that differ between ripe and non-ripe BMOs involved principal component analysis (PCA) obtained from the R package "factoextra" [69] as unsupervised statistical model [70]. This approach was used to highlight the presence of outliers; a brief discussion of the results can be found in Appendix A. Other important markers were identified by supervised statistical methods on Pareto-scaled data (mean centered and divided by the square root of the standard deviation of each lipid). Pareto-scaling of the data was used to include information regarding molecule abundances that would otherwise be lost by autoscaling [71]. The first approach used in biomarker discovery involved the identification of significant variables via volcano plots. The volcano plot was calculated via the R package "MetaboAnalystR" [68] and plotted via the package "EnhancedVolcano" [72]. For the volcano plot, the lipids were filtered by a fold change (FC) >1.3 and following Wilcoxon rank sum test with a false discovery rate (FDR, [73]), adjusted p-value <0.05. Orthogonal partial least squares discriminant analysis (OPLS-DA, [74]), from the "MetaboAnalystR" package was the second supervised method used to identify lipids associated with the two gonad maturation conditions. The performance of OPLS-DA was assessed by 10-fold leave one out cross-validation (LOOCV) and model fit was tested by a 2000-fold permutation test (see Appendix A [75]). Important lipids were identified in the Sigma plot, and lipids characterised by a p(corr)<-0.6 and >0.6 were retained as considered important in distinguishing ripe and non-ripe BMOs. RandomForest – RF [51] was the last method used here. RF is a machine learning algorithm that was trained as shown in [76] and was obtained from the package "RandomForest" [77]. In this study, RF was used as a classification method (RFclass) using the grouping variables (ripe/non-ripe) and as a regression method (RFreg) considering the GVF. In both cases, the best 10% of RF classification (lowest out-of-bag error rate – OOB-ER) and RF regression (highest percentage of variability explained – PVE) were considered as important markers. A backward purging approach for the top 5% of lipids for both RFclass and RFreg was used to identify the most important molecules detected by the two approaches (see Methods Supplement 2d for details on model training). The results of all four statistical approaches were compared using a Venn diagram and ranked according to their ROC (Receiving Operating Characteristics) curves and AUC (Area Under the Curve) values. ROC and AUC values were calculated using the biomarker discovery function of the MetaboAnalyst package. Details of the full ROC and AUC analyses of all biomarkers identified in this chapter can be found in Table C1 (Appendix C).
The Lipid Ontology (LiOn) enrichment analysis terms were calculated and analysed via the LiOn web platform [78]. PCA analysis of LiOn terms was visualised via GO-PCA [79] and presented as a heatmap plot using Euclid as the distance matrix and Complete as the clustering algorithm. Enriched LiOn terms were ordered by p-value (calculated with a t-test), and terms were considered significantly different if the FDR-adj p-value was <0.05 [73].
3. Results and Discussion
In this study, a total of 51 BMOs were analysed using LC-MS global untargeted lipidomics. Ovaries were categorised as ripe (N=25) or not ripe (N=26) based on their GHA scores and GVF (Supplementary Data 1). Stereological analyses such as GVF are less prone to subjectivity bias than GHA, especially when assessing histological preparation, which indicates the presence of different gonadal stages in the same tissue [80]. In contrast, gonadal atresia and gamete degeneration are hardly recognised when using GVF alone [28]. Therefore, the two approaches offer the best performance in combination. GVF increased significantly in ripe BMOs, providing higher confidence in the criteria used for GHA classification (Figure A1).
During ovarian maturation, the area covered by follicles increases due to oocyte proliferation, with the volume covered by energy support cells decreasing [10,15,16]. As the oocytes proliferate, lipids are accumulated in the gonads at the expense of glycogen content [17,18,41]. This usually leads to the reported strong seasonal fluctuations in the major lipid classes of bivalves [19,23,27,44,81]. BMOs lipidomics profiles here are integrated with GHA and GVF through various chemometric and machine learning approaches to identify specific lipid molecules associated with the maturation process of BMOs.
3.1. Multivariate Chemometrics
Our investigation started with the application of a multivariate unsupervised chemometric approach such as PCA (Figure A2). As unsupervised approach (e.g. samples are plotted without “a priori” consideration of grouping variables), PCA does not suffer from problems of overfitting, however, PCA can be difficult to interpret to distinguish highly similar and heterogeneous groups with small multivariate differences, a large number of features and a small amount of variability explained by the main axes [82]. Selecting the correct orthogonal axes that best explain the differences between ripe and immature BMO was problematic through PCA, because a high percentage of variability is explained by the first four pairs of principal components of the PCA model (>10%, Figure A2A). Indeed, in all the PCA plots showing the combination of main 5 principal components, the two BMO groups did not evidence marked differences on their lipidomic profiles, observation expected given the heterogeneous origin of the different gonad samples considered in this study (see Method Supplement 1).
To highlight specific lipids linked to the two BMO groups, we continued the biomarker discovery approach by using more powerful supervised statistical models such as volcano plot, OPLS-DA and RF. Through volcano analysis important lipids distinguishing ripe from undeveloped BMOs are highlighted based on their fold change (FC, here 1.3 is considered as cut-off value) and their statistical significance (FDR p<0.05, calculated according to a non-parametric Wilcoxon rank test). The resulting plot is shown in Figure 1A and led to the selection of 25 significant features (Table A1). Volcano plots provide a quick and reliable option for identifying markers that define a particular condition, although this statistical approach is limited to pairwise comparisons and often lacks statistical power, especially when analysing typical -omics datasets where the number of variables is far greater than the number of observations. In these cases, correction factors for the false discovery rate are usually applied, which reduce the statistical power of the test [83,84], and, indeed, volcano analysis resulted in the most restrictive (lowest number of important feature highlighted) of the methods discussed in this work.
OPLS-DA is an extension of partial least squares regression and an approach characterised by a fast computation time and a decomposition of the variance of the samples into uncorrelated (orthogonal to the groups, orthogonal T-score) and correlated (predictive, T-score) to the grouping factor [74]. The results of OPLS-DA can be found in Figure 1B and show that 10.2% of the variance within our observation is correlated with the two BMO maturation classes (T-score). OPLS-DA as a supervised method may suffer from overfitting problems, especially when the number of observations is small. Therefore, an assessment of model performance (cross-validation) and permutation tests (time-consuming) are required to obtain a measure of model fit [75]. Model performances and fitting were evaluated respectively by a 10-fold LOOCV (predicted: R2x:0.102, R2y: 0.5, Q2:0.363, orthogonal: R2x: 0.167, R2y: 0.17, Q2: 0.07, Figure A3A), and 2000-fold permutation (Q2: 0.436 p<0.001 and R2y: 0.669 p<0.05, Figure A3B). From the resulting S-Plot, a set of 40 important lipids (Table A1) correlated with the grouping variable (ripe and non-ripe BMOs) were selected, setting an arbitrary threshold for the p(corr) value <-0.6 and >0.6 (Figure 1C).
The final approach used in this study is RF, a machine learning method that creates a series of classification (or regression) trees (a “forest”) by continuously bootstrapping the sample set. For each bootstrapping, the data set is split into a test sample (66% of the samples) and an out-of-bag sample (training data with 33% of the observations). As a bootstrapping method, RF is also robust to several attributes that may constrain other statistical approaches (e.g., zero values, normality and homoscedasticity assumptions), while in classification mode it assumes a balanced number of observations [51,76], and compared to the previous statistical approaches, RF is far more computationally intensive [76]. From the training data, the algorithm recursively selects a random set of variables whose ability to predict a categorical response (ripe or non-ripe BMO) or its correlation with a continuous response variable (as GVF) is evaluated using training data and tested on OOB samples.
Partitioning is based on the identification of the predictor that minimises either the within-group variance (categorical response variable) or the error in the regression against the response, in the case of a continuous response variable [51,76]. The optimal predictor becomes the best node of the forest, and the process is repeated for all the number of trees specified in the function. In RF classification (RFclass), the variables with the lowest OOB error rate (OOB-ER) are the best predictors for the categorical variables, with the lower OOB-ER indicating the higher predictive significance of a given molecule. In RF regression (RFreg), the importance of each predictor is evaluated as the proportion of variation explained (PVE), a measure of the reduction in the predictive ability of the tree when that variable is removed. A backward purging (BP) approach is used to select the most important features in the RF. BP consists of performing multiple RFs on the most informative subset of variables (here the top 5% of features are selected from both RFclass and RFreg, Figure 2) and recording the performance of each variable (in terms of OOB-ER or PVE). The results of the BP process of the RFclass data showed that the saturated PC 28:0 (OOB-ER 0.12) was the best predictor of ripe/non-ripe condition (Figure 2A). As for RFreg, the BP process yielded unsaturated phosphatidic acid (PA) 44:4 (PVE 0.70, Figure 2B), followed by saturated ether-linked PC such as PC(O-30:1/P-30:0), PC(O-30:0) and PC(30:0), all with a PVE of 0.69 as most important molecules. All the saturated plasmanyl/plasmenyl and diacyl PC molecules and PA(44:4) were included in the panel of 35 lipids reported in Table 1, and will be discussed later in the text. In the next sections, we will compare the different roles of important lipids (through LiOn enrichment analysis) and the results of the four different statistical approaches here described. Aiming to maintain the maximum amount of meaningful information [76], it was convened to select the top 10% of molecules (threshold over which model performances substantially improved, see Methods Supplement 2d) as important for RF (≈83 molecules for RFclass and RFreg, Table C1).
3.2. Comparison of the Outputs Obtained by the Different Statisatical Approaches
The four different statistical models applied in this study allowed the selection of a total of 123 relevant lipid molecules (respectively 25, 40, 72 and 92 via Volcano plot, OPLS-DA, RFclass and RFreg, Table A1) differentiating ripe from not ripe BMO from 838 molecules present in the PIT (Supplementary Data 2). It should be noticed that none of the PC, glycerophosphoethanolamines (PE), glycerophosphoinositols (PI) and triglycerides (TG) detected by the present statistical approach was a major component of the blue mussel gonad lipidome [50] supporting also the previous observation made on the PCA analysis plots.
Key features highlighted by the different approaches are compared using a Venn diagram (Figure 3). RFreg and RFclass yielded the largest number of unique molecules (respectively 41 and 12 molecules, i.e. 33.3% and 9.8% of the total), while only 4 variables were exclusive to OPLS-DA (3.3% of the total) and 2 variables were detected only by volcano analysis (1.6%). Ten variables were common for all four approaches (8.1%). The comparison between classification (Volcano, OPLS-DA and RFclass) and regression approaches (RFreg) shows that 51 (41.5% of the total) molecules (out the 92 considered important and highlighted by RFreg) was common with one of more of the models here evaluated. This, again, indicates that there was a large consensus between GVF and the classification criteria used to define the two BMO groups.
The functional role of the lipids that differentiated undeveloped from ripe BMOs was investigated via LiOn enrichment analysis (Figure 4). Figure 4A shows the PCA analysis for LiOn terms, which reveals a clear distinction of the function of those molecules since 84% of the samples (43/51) could be correctly clustered according to the functional role of the highlighted lipids. Terms related to storage lipids, lipid bodies and TG were enriched in ripe BMOs, which could be attributed to vitellogenesis and accumulation of lipid bodies in the yolk granules [16]. Interestingly, TG species, identified by the various statistical methods, showed inverse pattern according to their unsaturation levels: TG molecules bearing highly unsaturated acyl residuals (DB >10) resulted inversely correlated with GVF, and also more abundant in undeveloped BMOs, opposite pattern was observed for TG with <10 DB (Table A1). This observation could be the result of rearrangment and/or resorbition of PUFA during ovarian maturation/regression [85]. Although increased content of unsaturated TG was reported in ripe ovarian follicles of P. marguensis [49], others reported reported dominance of saturated and monounsaturated acyl moyeties in TG of mud crab ovaries, Scylla paramamosain [86] and sea sponges [87].
In the not-ripe BMO group was instead observed a significant up-regulation of ‘membrane components’, an enrichment terms associated with membrane lipids (Figure 4B). The previous term is mainly linked to the larger abundance in undeveloped ovaries of diacyl and ether-linked (associated with the term ‘plasmalogen’) PC and PE molecules. This observation could be related to the greater surface area of the gonad covered by support cells, such as ADG and VCT, that are characteristic of early maturation stages of bivalve ovaries [15], which is also supported by the reduction of GVF found in non-ripe BMOs compared to mature ones (Figure A1).
At the same time many of such membrane lipids included saturated and short chained molecules, features connected with the up-regulation of terms including ‘below average transition temperature’ and ‘below average bilayer thickens’. On the contrary, longer and more unsaturated PC and PE were more abundant in ripe BMOs, leading to the up-regulation of ‘PUFA’ and ‘fatty acids with more than 18C’ terms for this group.
In addition, terms related to ‘lysosomes’, the ‘Golgi apparatus’ and ‘mitochondrion’ were also upregulated in the immature BMO group. The former two of these terms are connected with sphingolipids (Ceramides - Cer, CAEP and CerPE), since these classes of lipids are produced in the Golgi apparatus and act in autolysis and atretic processes [88]. The larger content of such lipids in undeveloped BMOs (Table A1) could be related to gonadal degeneration and atresia, as the presence of lysosomes and vacuoles together with macrophage infiltration into follicles characterises atresia in mussel ovaries [28]. Interestingly, opposite patterns could be evidenced between Cer, higher on ripe BMOs and correlated with GVF, CAEP and CerPE. Such pattern could be related with the role of Cer as stabilizers in adipose tissue, and hence could be again related to accumulation of yolk reserves in ripe ovaries [89]. The mitochondrion term is associated to the detection by RFreg of a cardiolipin (CL) 88:21 which resulted also weakly inversely correlated with GVF (Spearman rank r=-0.05, Table A1). The reason behind this observation is unclear, since the same molecule did not evidence a significantly different content between the two BMO groups (FDR p>0.05). CL are fundamental lipids found in the inner mitochondrial membrane, participating in cellular respiration [90]. Highly unsaturated CL were found predominant in mussel gonads [50] and generally distinguish mussels from other groups of bivalves such as clams [91]. CL(88:21) must contain four 22C acyl residuals, since 24C FA detected in blue mussel gonads were saturated or monounsaturated species [50]. Therefore, it is likely that this molecule included three DHA and one FA22:3 non-methylene interrupted dienoic (NMID). Nevertheless, the connection of the aforementioned molecule with mussel ovarian development is unclear, if we exclude the structural role of NMID FA in mussel gonads [92]. An increase of CL(88:24) was observed in quiescent scallops (Placopecten magellanus), whereas larger extents of CL containing 18C FA (FA18:0 and FA18:1) were found in ripe (pre-spawning) individuals [93]. Given the different biology of the two species (dioecious for mussels and hermaphrodite for scallops) it becomes more difficult to directly compare our result and the previous study.
3.4. Ranking the Panel of Potential Biomarkers
ROC curves were generated for all important variables selected by each statistical method to distinguish ripe from not ripe BMOs and these were ranked using the AUC (Table A1). ROC curves are the graphical representation between the sensitivity (true positive) and specificity (true negative) of a biomarker [94]. AUC can range between 0.5 (diagonal line, random effect, 50% specific and 50% sensitive) and 1 (perfect biomarker, 100% specific and sensitive). The optimal cut-off value (maximum specificity and sensitivity) of a specific biomarker is calculated using the maximum distance between the ROC curve and the diagonal line (Youden index [95]). Molecules with AUC values between 0.8 and 0.9 have been considered as potential biomarker candidates for various human diseases in the past [96,97]. Out of all the important variables highlighted by the statistical approach used in this study, 35 had an AUC value >0.8 and are listed in Table 1. From the AUC>0.8 variables (35/123), 10 were detected by all four statistical approaches, 17 by a combination of three of these approaches, 6 by two models and just 2 by a single model. This observation emphasises the importance of combining multiple orthogonal statistical approaches, as any biomarker discovery method will inevitably have some limitations if unaccompanied.
In the present study, no lipid was found to be a perfect marker of the two different gonadal stages (e.g. AUC =1). One molecule showed an AUC >0.9: CerPE(40:2), which had and AUC of 0.905 (95%CI: 0.799-0.981, Figure 5A) and was more abundant in undeveloped ovaries (Figure 5B). CerPE(40:2) was characterised by a sensitivity of 80% (true positive rate) and a specificity of 100% (true negative rate). Three other CerPE ranked among AUC>0.8 molecules (Table 1): CerPE(35:3/2), CerPE(34:3)a and CerPE(40:1), with AUC values of 0.874, 0.845 and 0.806, respectively. Other ceramide lipids important for distinguishing between ripe and immature BMO included CAEP 42:2 and 42:3 with AUC values of 0.808 and 0.804, respectively. All the previous CerPE and CAEP molecules were minor components of these classes detected in Mytilus gonads [50] and were all found mainly in undeveloped BMO; the role of these sphingolipid classes in marine invertebrates is not yet fully understood. CerPE and CAEP are mainly found in invertebrate membranes [55,98,99,100,101] and are synthesised from ceramide precursors by the action of a specific CDP ethanolamine:ceramide phosphotransferase localised in the Golgi apparatus [102]. In the scientific literature there are scarce reports on the role of CerPE and CAEP in bivalve ovarian maturation. Pauletto and coworkers [103] reported a differential expression for genes involved in complex ceramide metabolism between ovarian oocytes and spawned oocytes in the clam Venerupsis decussatus. Other authors hypothesised a similar function for CerPE and CAEP of the vertebrate analogue sphingomyelin (SM), which, can form specific domains of the cell membrane defined as membrane rafts [101]. The decrease in CerPE and CAEP observed in ripe females could also be a consequence of the gamete maturation process, as a decrease in SM was observed in Xenopus laevis during oocyte maturation under the influence of progesterone [104].
Glycerophosphoserines (PS) represented the lipid class that, overhall, changed mostly between the two BMO groups (Table 1). PS(38:5) was the second most important biomarker of BMO maturity (AUC 0.894) and several of the other nine PS molecules with AUC>0.8 (36:2, 38:5, 38:6a, 39:6, 40:2, 40:5, 40:6 and O-38:5/P-38:4 and O-38:6/P-38:5) are between the main diacyl and plasmanyl/plasmenyl PS species found in Mytilus gonads [50]. All AUC>0.8 PS were more abundant in undeveloped BMOs. PS are secondary components of cell membranes, found mainly on the cytosolic side of the lipid bilayer [105]. Their relevance as markers of BMO development could be linked to different reasons. PS may be converted into different glycerophospholipids, by the action of phosphotransferases, during ovarian maturation, as observed in largemouth gudgeon (Coreius guichenoti) ovaries [106]. On the contrary, the larger content of PS in undeveloped BMOs could be also linked to apoptotic processes in degenerating gonads, since the exteriorisation of PS is considered to be one of the “triggers” for phagocytosis of apoptotic cells [107,108], as observed in UV exposed O. edulis haemocytes [109] and in apoptotic ovarian cells of Drosophila melanogaster [110,111].
The third molecule for relevance as biomarker evidenced in this study is the ether-linked PE O-36:2/P-36:1c (AUC: 0.875; Table 1). All PE molecules with AUC>0.8 were plasmanyl/plasmenyl forms (O-34:3/P-34:2, O-36:1/P-36:0b, O-36:2/P-36:1b, O-36:3/P-36:2, O-37:2/P-37:1, O-37:3/P-37:2, O-37:4/P-37:3 and O-39:3/P-39:4) but did not include any of the principal PE forms described in blue mussel gonads [50], increasing the complexity of explaining they physiological motivation behind our observation. All the AUC>0.8 PE resulted mainly abundant in undeveloped BMOs, and this could possibly be related with synthesis of PC, during ovarian development, thorugh sequential methylation of PE [112]. A total of seven PC molecules had an AUC >0.8; six of which were saturated molecules (28:0, 30:0 and the plasmanyl/plasmenyl O-30.0, O-31:0 and O-32:0; Table 1) and resulted distincly abundant in not ripe BMOs. The long chained and highly unsaturated ether-linked PC(46:10/P-46:9)a characterised, instead, ripe BMOs. This trend is in agreement with what reported by other authors on the PC composition of ovaries in the shrimp P. marguiensis: saturated PC molecules were found in undeveloped regions of the ovary, whereas highly unsaturated PC (containing 20-22C PUFAs) had an higher coverage ripe ovarian parts [49]. PC and PE are the two major membrane lipids in bivalves [21,50,66,113,114]. Given the low unsaturation of PC and PE with AUC>0.8 and abundant in not ripe BMOs, it is likely that these molecules carried saturated or monounsaturated FA rather than long-chain PUFA. Acyl residues of membrane lipids represent energy sources during embryonic development in invertebrates [115,116], so their enrichment with PUFA at later developmental stages may be important for the proper development of the offspring. To such extent, PUFA enrichment patterns have been observed for PC and PE fractions in maturating scallop ovaries [44].
Lastly, four PA molecules (38:6, 40:6, 44:4 and the plasmalogen O-38:6/P-38:5), one glycerophosphoglycerol (PG) 34:1 and the lyso-glycerophosphocholine (LPC) 22:2 completed the panel of 35 molecules with an AUC >0.8 in distinguishing ripe from not ripe BMOs (Table 1). All these lipid species were more abuntand in undeveloped ovaries, with the exception of PA(44:4) and LPC(22:2). There are not many reports on the role of such minor glycerophospholipid classes in bivalves or invertebrates ovarian maturation, due also to their low abundance which is hardly observable through traditional lipid analysis methods [48]. Therefore, we can only speculate about their role in the development of the BMO. PA and PG are intermediates of glycerophospholipid biosynthesis, each forming the precursors of the major membrane lipid classes and of cardiolipins [105]. PA concentration increases in Xenopus oocytes as response to insulin treatment, as a result of phospholipase D, which produces lyso-glycerophosphate (LPA) which participate in lipid signalling of oocyte maturation [112]. A reduction in most of PG was instead observed in sea sponges in reproductive individuals [87], observation that could agree with data discussed in the present study. LPC are metabolites of PC formed by the Lands cycle by the action of a phospholipase that cleaves one of the FA residues [117]. LPC(22:2) is a molecule that is likely to bear a 22:2 NMID FA [50]. NMID FA are endogenous lipids of mussels which are preferentially incorporated in the mantle, competing with C20 and C22 PUFA under reproductive demands [92], which can suggest the a role for LPC(22:2) in restructuring of membrane lipids in ripe BMOs. Nevertheless, especially for these minor lipids, further evidences are needed to obtain a definitive overview of the system.
4. Conclusions
Rapid and informative tools for measuring the maturity stage of female mussels are useful both for industrial applications, as they can be used to monitor gamete maturation in hatcheries to reduce problems with uncontrolled spawning and pre-spawning atresia, and for monitoring the reproductive status of native mussel populations. The high resolution and ability to work at the lipid molecule level make LC-MS lipidomics an important platform for studying lipid biomarkers that can assess maturation status in BMOs. To fulfil this task, we applied different supervised statistical approaches that were more powerful than non-supervised approaches (PCA) in highlighting the small differences between the BMO groups studied. By combining the four supervised statistical approaches used here (Volcano, OPLS-DA, RFclass and RFreg), it was possible to highlight a panel of 35 lipid species that differ to a high degree (AUC>0.8) between ripe and undeveloped BMOs. These potential markers include CerPE, CAEP, LPC, PA, PC, PE, PG and PS. In many cases, however, the exact role and reason for the importance of AUC>0.8 lipids for classification could only be speculated upon similarities reported by others in different model organisms. Future studies should aim to better understand the role played by lipids during gamete development in marine invertebrates such as bivalves, focussing on less studied lipid classes.
The set of potential lipid biomarkers should be validated and possibly quantified using further independent gonad samples, and if confirmed, the protocol should be improved and refined to develop a non-lethal assay. GHA is considered a traditional approach for monitoring gonadal development in marine mussels [118] and is an important tool for investigating the reproductive physiology, toxicology, life cycle and population structure of bivalves [10,11,16,28,32,34,37,119]. In the future, GHA will continue to be a necessary diagnostic tool, but technological advances and the application of state-of-the-art high-throughput omics techniques should support and complement traditional techniques to increase our knowledge of the physiology of marine organisms and their ability to adapt to a changing environment.
Supplementary Materials
The following supporting information can be downloaded at: www.mdpi.com/xxx/s1: Methods Supplement 1: Mussel rearing conditions; Methods Supplement 2: Histological analyses and Machine learning model training; Supplementary tables: LC-MS conditions and Lipid molecular standard mix; Supplementary Data 1: Raw Peak Intensity Table and molecules ID details; Supplementary Data 2: List of all lipid species identified in the blue mussel ovaries (BMOs) according to exact mass (5 Δppm).
Author Contributions
Conceptualization, VAL; methodology, VAL and PDW; software, VAL and MKD; formal analysis, VAL; investigation, VAL; data curation, VAL; writing—original draft preparation, VAL; writing—review and editing, SC, ADH, CDV; visualization, VAL; supervision, MKD, PDW, SC and ADH; project administration, ADH; funding acquisition, ADH. All authors have read and agreed to the published version of the manuscript.
Funding
This research was funded by the European Social Fund and Scottish Funding Council as part of Developing Scotland’s Workforce in the Scotland 2014-2020 European Structural and Investment programme (Ref: UHI_SAMS_DSW_PGR_AY16/17).
Institutional Review Board Statement
“The animal study protocol was approved by the Institutional Review Board (or Ethics Committee) of the University of the Highlands and Islands with protocol code ETH884 Lipidomics and Proteomics investigation of Commercial Bivalve production in Scotland on the 6th February 2017).
Informed Consent Statement
Not applicable.
Data Availability Statement
Data is available through the various supplementary materials enclosed with the manuscript and all LC-MS raw data files and experimental metadata have been deposited in the Metabolights [67] data repository (www.ebi.ac.uk/metabolights/MTBLS8492) and are available under the study identifier MTBLS8492.
Acknowledgments
The authors would like to thank: Inverlussa Marine Services (www.inverlussa.com) for providing their top-quality mussels for our experiment; Ms. Christine Beveridge (Scottish Association for Marine Sciences – SAMS) for her fantastic expertise of aquarium setup. Ms. Debbie Falchney (Institute of Aquaculture, University of Stirling) for her tutorial on gonad histological preparation; Mr. Seshu Tammireddy (University of the Highlands and Islands) for those many hours discussing about LC-MS and lipid HPLC separation. VAL thanks also Dr Holger Husi for the long chats on data analysis and machine learning which a lot helped in the conceptualization of this work.
Conflicts of Interest
The authors declare no conflicts of interest.
Appendix A
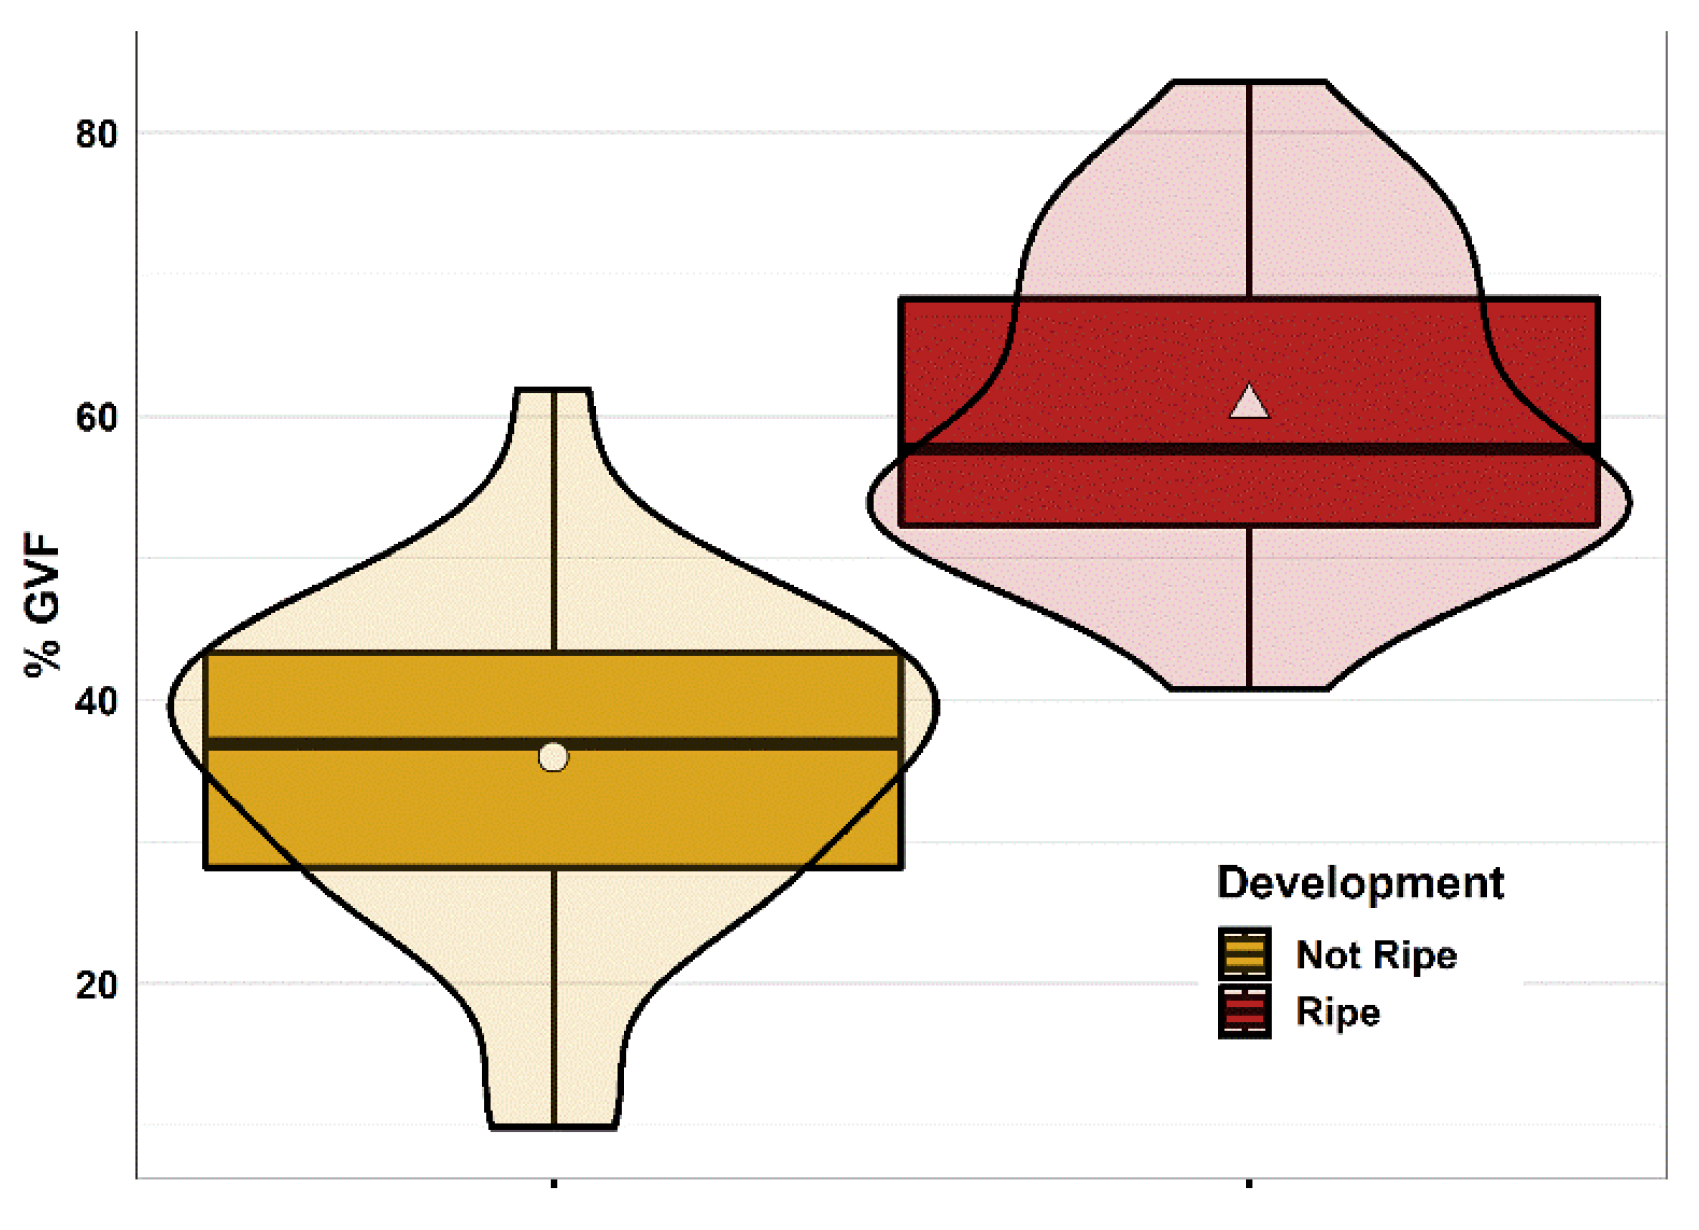
The relation between ripe and not ripe females GVF is shown in Figure A1. Ripe females were characterised by a significantly higher GVF (Welch’s t-test t:-7.865, df:49, p<0.001) compared with not ripe ones (average GVF was 60.73±11.01% in ripe and 36.01±11.44% in not ripe females).
Figure A1.
Gonad histology analysis (GHA) and gamete volume fraction (GVF): differences between not ripe and ripe females. n=25 for ripe and n=26 for not ripe females. The marker in each box plot indicates the group average, band inside the box indicates the group median, the box includes observation between 1st (25th percentile) and 3rd (75th percentile) quartile, whiskers represent values between ±1.5 *inter quartile range (IQR), observations over ±1.5*IQR are reported as outliers (black dots); violin shapes represent the variable distribution in each sample group. Plotted via R package ‘ggplot2’.
The score plots representing Principal component analysis are reported in Figure A2. In the plots the observations are color-coded according to the BMO ripening groups while shapes are coded according to the different origin of the BMOs included in this study. There are no marked differences in the lipidome between the two BMOs groups or according to the different origin of the samples. The clustering in principal components one and two accounted for 31% of variability explained (Figure A2A), components two and three 21.2% (Figure A2B), components three and four 16.9% (Figure A2C) whereas the fourth and fifth principal components taken together explained 13.4% of multivariate differences (Figure A2D). These latter two components possibly resulted in the best separation of the two BMOs ripening groups, still with an observed large overlapping of the confidence intervals.
Figure A2.
Principal component analysis (PCA) of global lipidomics data in relation to ripe and not ripe females (colour coded) and gamete volume fraction (GVF- blue stacked arrow). Different shapes indicate the origin of the BMOs analysed in the study. A: Scree plot representing main principal components explaining for the variability of lipidomics data. B: PCA score plot for 1st and 2nd components; C: PCA score plot for 2nd and 3rd components; D: PCA score plot for 3rd and 4th components; E: PCA score plot for 4th and 5th components. Individual samples are reported as single markers in the plot, ellipses offer the 95% confidence interval. Computed and plotted via R package ‘factoextra’ [69].

Figure A3.
orthogonal partial least squares discriminant analysis (OPLS-DA) model validation: for discrimination between ripe and not ripe females. A: ten-fold leave one out cross-validation (LOOCV); B: 2000-fold permutation test. Computed via ‘MetaboAnalystR’.
Figure A3.
orthogonal partial least squares discriminant analysis (OPLS-DA) model validation: for discrimination between ripe and not ripe females. A: ten-fold leave one out cross-validation (LOOCV); B: 2000-fold permutation test. Computed via ‘MetaboAnalystR’.
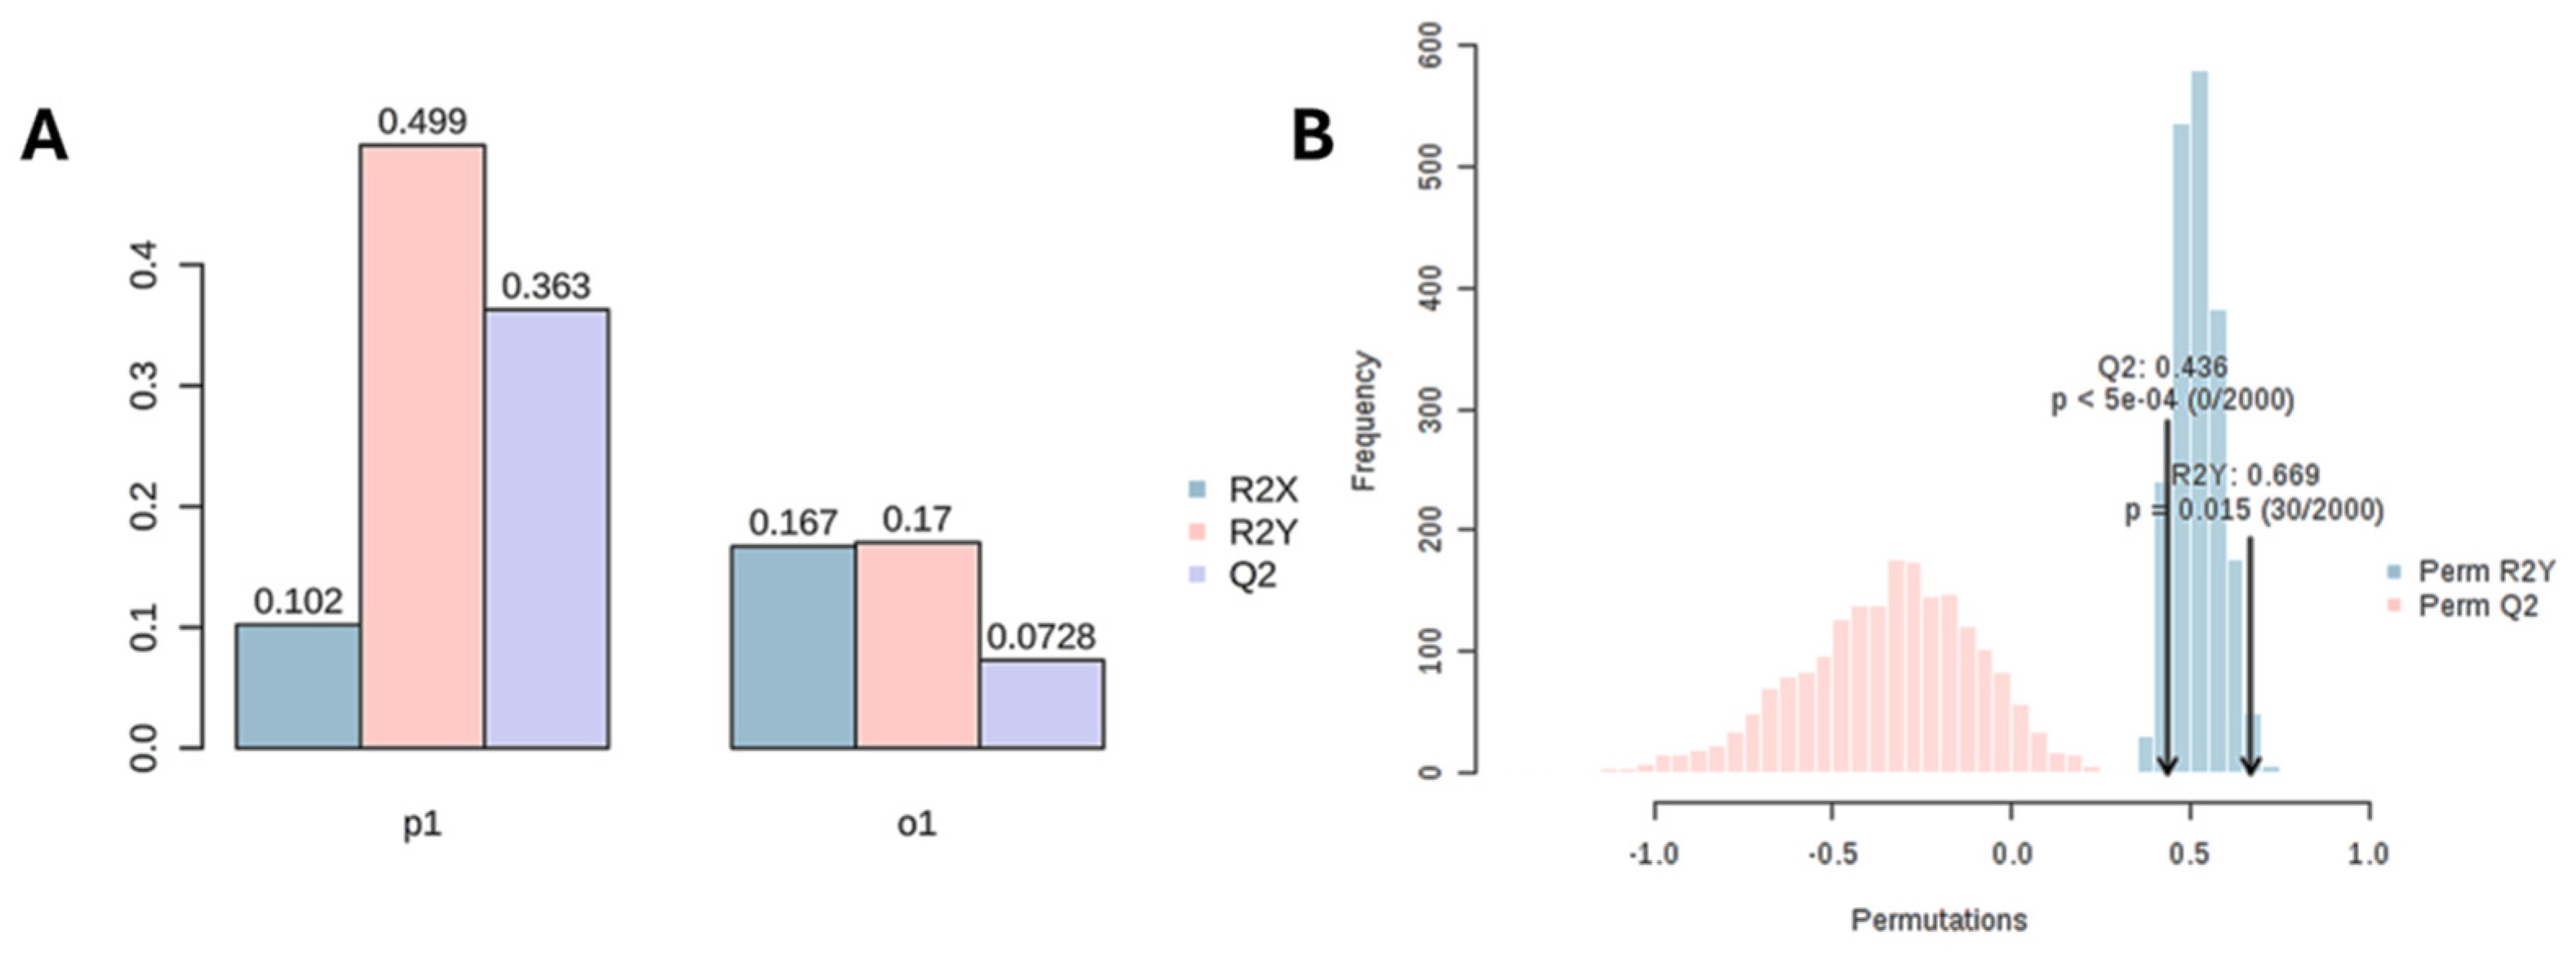

Table A1.
Lipid molecules markers of gonad ripeness identified by the supervised statistical approaches in BMO and ranked according to receiving operating curves (ROC) and area under the curve (AUC). Isomeric lipid molecules resolved by reverse phase separation (same exact mass 5 Δppm, but different retention time) are distinguished with a lowercase letter after the lipid ID. Pval: Wilcoxon Rank test with p-value adjusted for false discovery rate [73]; FC: fold changes; r: Spearman rank correlation coefficient calculated on gamete volume fraction (GVF). Computed via R package ‘MetaboanalystR’. Average is calculated on Pareto scaled data ± 95% CI (N=26 Not ripe and N=25 Ripe). Bold panel of potential Lipid biomarkers (AUC > 0.8).
| Lipid ID | AUC | Pval | FC | r | Volcano | OPLS-DA | RFclass | RFreg | Not-Ripe | Ripe |
|---|---|---|---|---|---|---|---|---|---|---|
| Average ± CI (95%) | Average ± CI (95%) | |||||||||
| CAEP.35.3 | 0.74 | <0.01 | 0.39 | -0.48 | x | x | 1855.96 ± 247.94 | 1393.62 ± 125.7 | ||
| CAEP.42.2 | 0.81 | <0.01 | 1.58 | -0.60 | x | x | x | 47.59 ± 9.06 | 20.67 ± 7.5 | |
| CAEP.42.3 | 0.8 | <0.01 | 3.13 | -0.56 | x | x | x | 36.95 ± 11.25 | 11.19 ± 6.08 | |
| Cer.36.2a | 0.58 | 0.09 | 0.21 | -0.10 | x | 267.81 ± 60.62 | 224.45 ± 23.52 | |||
| Cer.38.1 | 0.76 | <0.01 | -0.99 | 0.38 | x | 47.24 ± 13.18 | 75.37 ± 14.06 | |||
| Cer.42.0 | 0.76 | <0.01 | -0.5 | 0.51 | x | 61.06 ± 8.32 | 87.2 ± 11.11 | |||
| CerPE.34.1 | 0.76 | <0.01 | 0.57 | -0.43 | x | 450.48 ± 85.69 | 277.56 ± 41.11 | |||
| CerPE.34.2b | 0.75 | <0.01 | 0.58 | -0.54 | x | 128.16 ± 22.58 | 84.28 ± 13.44 | |||
| CerPE.34.3a | 0.84 | <0.01 | 0.98 | -0.67 | x | x | x | 95.62 ± 20.84 | 48.43 ± 8.13 | |
| CerPE.35.3/2 | 0.87 | <0.01 | 1.08 | -0.67 | x | x | x | 132.82 ± 29.82 | 55.95 ± 7.87 | |
| CerPE.40.1 | 0.81 | <0.01 | 1.17 | -0.57 | x | x | x | 34.15 ± 7.02 | 13.71 ± 5.25 | |
| CerPE.40.2 | 0.9 | <0.01 | 1.48 | -0.74 | x | x | x | x | 46.4 ± 7.88 | 17.69 ± 4.48 |
| CerPE.42.1 | 0.8 | 0.01 | 5.5 | -0.53 | x | x | x | 7.66 ± 5.08 | 0.23 ± 0.45 | |
| CerPE.d44.2 | 0.79 | <0.01 | 0.73 | -0.52 | x | 52.96 ± 10.36 | 31.51 ± 4.19 | |||
| CL.88.21 | 0.56 | 0.68 | -0.3 | -0.05 | x | 39.63 ± 15.32 | 44.23 ± 15.59 | |||
| DG.32.1 | 0.59 | 0.2 | -0.21 | 0.17 | x | 1223.06 ± 217.88 | 1396.08 ± 272.03 | |||
| DG.33.2 | 0.56 | 0.43 | -0.13 | 0.18 | x | 254.51 ± 47.85 | 270.76 ± 52.22 | |||
| LPC.22.2 | 0.81 | <0.01 | -1.63 | 0.41 | x | x | 115.47 ± 39.6 | 308.4 ± 101.03 | ||
| LPC.22.5 | 0.76 | <0.01 | -2.39 | 0.42 | x | 65.26 ± 37.91 | 244.7 ± 114.32 | |||
| LPC.22.6 | 0.72 | <0.01 | -1.86 | 0.41 | x | x | 131.28 ± 61.4 | 497.37 ± 246.18 | ||
| LPE.22.6 | 0.61 | 0.22 | -0.73 | 0.22 | x | x | 27 ± 10.79 | 38.01 ± 18.64 | ||
| PA.38.6 | 0.82 | <0.01 | 5.66 | -0.54 | x | x | x | 12.45 ± 6.38 | 1.46 ± 1.54 | |
| PA.40.6 | 0.86 | <0.01 | 2.85 | -0.70 | x | x | x | x | 33.14 ± 12.05 | 8.31 ± 3.64 |
| PA.44.4 | 0.81 | <0.01 | -1.76 | 0.63 | x | x | 102.52 ± 41.73 | 226.25 ± 58.24 | ||
| PA.O-38.2/P-38.1 | 0.74 | 0.01 | 1.36 | -0.48 | x | x | 32.04 ± 6.9 | 20.2 ± 7.86 | ||
| PA.O-38.5/P-38.4 | 0.72 | <0.01 | 4.13 | -0.41 | x | x | 6.66 ± 3.71 | 1.22 ± 1.53 | ||
| PA.O-38.6/P-38.5 | 0.85 | <0.01 | 2.12 | -0.68 | x | x | x | x | 46.5 ± 13.09 | 15.64 ± 4.86 |
| PC.28.0 | 0.84 | <0.01 | 1.35 | -0.55 | x | x | x | x | 426.29 ± 119.56 | 140.95 ± 36.64 |
| PC.29.0 | 0.79 | <0.01 | 0.94 | -0.42 | x | 326.9 ± 78.46 | 150.35 ± 29.08 | |||
| PC.30.0 | 0.85 | <0.01 | 1.37 | -0.60 | x | x | x | x | 1149.26 ± 291.11 | 396.62 ± 108.82 |
| PC.31.0 | 0.76 | <0.01 | 0.66 | -0.36 | x | x | 706.06 ± 121.33 | 419.14 ± 60.12 | ||
| PC.32.0 | 0.78 | <0.01 | 0.95 | -0.51 | x | x | 1181.4 ± 230.72 | 572.94 ± 110.41 | ||
| PC.42.3 | 0.73 | 0.1 | -0.49 | 0.40 | x | x | 435.88 ± 121.3 | 582.86 ± 82.68 | ||
| PC.42.4 | 0.72 | <0.01 | -0.53 | 0.30 | x | x | 76.01 ± 13.45 | 104.97 ± 12.52 | ||
| PC.O-29.0 | 0.8 | <0.01 | 1.57 | -0.51 | x | x | x | 274.36 ± 86.89 | 97.24 ± 36.48 | |
| PC.O-30.0 | 0.8 | <0.01 | 1.48 | -0.54 | x | x | x | 862.53 ± 256.36 | 318.65 ± 112.49 | |
| PC.O-30.1/P-30.0 | 0.72 | <0.01 | 0.6 | -0.39 | x | x | x | 479.19 ± 98.68 | 292.4 ± 56.3 | |
| PC.O-30.2/P-30.1 | 0.69 | <0.01 | 0.68 | -0.31 | x | 489.48 ± 140.93 | 197.21 ± 62.1 | |||
| PC.O-31.0 | 0.8 | <0.01 | 1.37 | -0.55 | x | x | x | 68.9 ± 21.25 | 41.64 ± 9.75 | |
| PC.O-31.1/P-31.0 | 0.75 | <0.01 | 0.85 | -0.45 | x | 313.33 ± 66.93 | 170.76 ± 36.29 | |||
| PC.O-32.0 | 0.8 | <0.01 | 1.35 | -0.56 | x | x | x | x | 923.78 ± 291.49 | 351.64 ± 111.32 |
| PC.O-38.1/P-38.0 | 0.76 | <0.01 | -0.69 | 0.51 | x | 400.67 ± 74.02 | 634.91 ± 112.22 | |||
| PC.O-38.5/P-38.4 | 0.68 | 0.02 | -0.37 | 0.33 | x | 3158.87 ± 452.94 | 4126.82 ± 599.14 | |||
| PC.O-39.2/P-39.1 | 0.71 | 0.02 | -0.5 | 0.41 | x | 587.31 ± 109.84 | 964.5 ± 162.84 | |||
| PC.O-40.2/P-40.1 | 0.78 | <0.01 | -0.73 | 0.51 | x | x | 587.31 ± 109.84 | 964.5 ± 162.84 | ||
| PC.O-42.10/P-42.9a | 0.81 | <0.01 | -1.43 | 0.14 | x | x | x | x | 145.61 ± 41.99 | 341.56 ± 83.65 |
| PE.36.3a | 0.65 | 0.05 | 0.16 | 0.26 | x | 33 ± 6.89 | 43.8 ± 10.85 | |||
| PE.38.4a | 0.57 | 0.28 | 0.1 | -0.42 | x | x | 102.72 ± 14.62 | 96.79 ± 11.17 | ||
| PE.37.4 | 0.72 | 0.01 | 1.19 | -0.37 | x | 33.96 ± 9.79 | 17.15 ± 5.86 | |||
| PE.39.5 | 0.76 | <0.01 | 0.72 | -0.48 | x | x | 75.17 ± 13.77 | 39.58 ± 7.07 | ||
| PE.41.5 | 0.64 | 0.01 | 0.62 | -0.28 | x | 33.31 ± 12.76 | 16.49 ± 4.91 | |||
| PE.42.9c | 0.56 | 0.59 | -0.22 | 0.23 | x | 185.63 ± 49.07 | 193.23 ± 41.74 | |||
| PE.O-34.3/P-34.2 | 0.83 | 0.01 | 0.98 | -0.51 | x | x | 53.51 ± 20.01 | 24.5 ± 4.84 | ||
| PE.O-35.3/P-35.2 | 0.77 | 0.01 | 0.97 | -0.46 | x | 40.95 ± 14.52 | 18.98 ± 4.37 | |||
| PE.O-36.1/P-36.0b | 0.87 | <0.01 | 1.63 | -0.74 | x | x | x | x | 65.23 ± 19.65 | 21.09 ± 4.88 |
| PE.O-36.1/P-36.0c | 0.77 | <0.01 | 0.88 | -0.58 | x | 91.33 ± 25.83 | 41.6 ± 7.31 | |||
| PE.O-36.2/P-36.1b | 0.85 | <0.01 | 0.96 | -0.62 | x | x | x | 94.97 ± 22.76 | 47.13 ± 7.8 | |
| PE.O-36.2/P-36.1c | 0.88 | <0.01 | 0.97 | -0.73 | x | x | 251.77 ± 50.85 | 121.82 ± 15.8 | ||
| PE.O-36.3/P-36.2 | 0.85 | <0.01 | 0.61 | -0.58 | x | x | 308.04 ± 55.87 | 193.04 ± 19.3 | ||
| PE.O-37.2/P-37.1 | 0.86 | <0.01 | 0.99 | -0.71 | x | x | x | 231.1 ± 39.56 | 121.75 ± 21.86 | |
| PE.O-37.3/P-37.2 | 0.84 | <0.01 | 0.51 | -0.55 | x | x | x | 428.34 ± 49.7 | 300.34 ± 26.36 | |
| PE.O-37.4/P-37.3 | 0.87 | <0.01 | 0.74 | -0.40 | x | x | x | 84.17 ± 14.05 | 50.25 ± 6.82 | |
| PE.O-38.2/P-38.1 | 0.8 | <0.01 | 0.63 | -0.62 | x | x | 627.28 ± 92.01 | 407.74 ± 58.2 | ||
| PE.O-38.3/P-38.2 | 0.78 | <0.01 | 0.38 | -0.52 | x | 1411.67 ± 151.08 | 1084.61 ± 86.66 | |||
| PE.O-39.2/P-39.1 | 0.73 | <0.01 | 0.51 | -0.47 | x | 125.68 ± 18.84 | 92.57 ± 15.07 | |||
| PE.O-39.3/P-39.2 | 0.8 | <0.01 | 0.45 | -0.56 | x | x | 360.03 ± 39.86 | 264.36 ± 23.89 | ||
| PE.O-39.4/P-39.3 | 0.73 | <0.01 | 0.38 | -0.38 | x | x | 194.69 ± 27 | 146.64 ± 13.67 | ||
| PE.O-40.7/P-40.6b | 0.67 | 0.07 | -0.24 | 0.35 | x | 886.89 ± 125.56 | 1034.58 ± 117.48 | |||
| PE.O-41.4/P-41.3 | 0.65 | 0.04 | 0.25 | -0.33 | x | 110.58 ± 15.74 | 92.1 ± 9.6 | |||
| PG.34.1 | 0.86 | <0.01 | 2.19 | -0.70 | x | x | x | x | 25.61 ± 8.8 | 7.32 ± 2.83 |
| PI.40.3 | 0.62 | 0.05 | -0.28 | 0.21 | x | 294.18 ± 38.48 | 350.62 ± 36.02 | |||
| PI.40.4 | 0.65 | 0.04 | -0.39 | 0.32 | x | 266.66 ± 45.88 | 331.8 ± 43.8 | |||
| PI.40.8 | 0.71 | 0.01 | -0.39 | 0.47 | x | x | 118.42 ± 14.83 | 147.88 ± 16.72 | ||
| PI.41.5 | 0.6 | 0.26 | -0.2 | 0.33 | x | 102.64 ± 16.24 | 115.25 ± 13.04 | |||
| PI.41.6 | 0.74 | <0.01 | -0.49 | 0.54 | x | 103.73 ± 14.79 | 140.82 ± 13.95 | |||
| PI.42.3 | 0.79 | <0.01 | -0.95 | 0.53 | x | x | 45.08 ± 10.05 | 78.71 ± 12.29 | ||
| PI.42.10a | 0.71 | 0.02 | -0.71 | 0.43 | x | 27.67 ± 6.84 | 41.65 ± 10.88 | |||
| PI.44.7 | 0.61 | 0.03 | -0.61 | 0.22 | x | 11.63 ± 4.06 | 26.72 ± 12.24 | |||
| PI.O-38.5/P-38.4a | 0.76 | <0.01 | 1.03 | -0.59 | x | 55.34 ± 11.27 | 30.46 ± 8.17 | |||
| PI.O-40.2/P-40.1 | 0.73 | 0.01 | -1.37 | 0.35 | x | 16.8 ± 6.25 | 44.17 ± 17.7 | |||
| PS.34.1 | 0.8 | <0.01 | 6.82 | -0.54 | x | x | x | 13.17 ± 7.65 | 0.53 ± 0.75 | |
| PS.36.2 | 0.81 | <0.01 | 7.06 | -0.56 | x | x | x | 16.21 ± 10.11 | 0.14 ± 0.22 | |
| PS.38.2a | 0.64 | 0.1 | -0.42 | 0.32 | x | 55.04 ± 12.89 | 68.49 ± 13.29 | |||
| PS.38.4 | 0.64 | 0.03 | 1.55 | -0.35 | x | 27.56 ± 19.08 | 5.6 ± 1.94 | |||
| PS.38.5 | 0.89 | <0.01 | 1.61 | -0.71 | x | x | x | x | 215.46 ± 51.5 | 66.38 ± 17.26 |
| PS.38.6a | 0.84 | <0.01 | 1.23 | -0.60 | x | x | x | 164.04 ± 40.39 | 66.94 ± 16.21 | |
| PS.39.6 | 0.82 | <0.01 | 1.21 | -0.55 | x | x | 96.45 ± 35.18 | 39.88 ± 10.52 | ||
| PS.40.2 | 0.83 | <0.01 | 0.75 | -0.68 | x | x | 157.85 ± 32.77 | 91.97 ± 13.65 | ||
| PS.40.5 | 0.82 | <0.01 | 1.52 | -0.67 | x | 41.86 ± 11.05 | 18.17 ± 5.55 | |||
| PS.40.6 | 0.89 | <0.01 | 1.06 | -0.74 | x | x | x | 329.08 ± 66.25 | 155.36 ± 27.89 | |
| PS.40.8a | 0.78 | <0.01 | 4 | -0.46 | x | x | 46.14 ± 17.07 | 9.88 ± 4.45 | ||
| PS.42.3b | 0.6 | 0.26 | 0.11 | -0.25 | x | 82.48 ± 17.25 | 72.17 ± 12.55 | |||
| PS.42.4 | 0.61 | 0.03 | 0.3 | -0.23 | x | 265.25 ± 70.08 | 188.69 ± 29.82 | |||
| PS.O-34.0 | 0.78 | <0.01 | 1.45 | -0.58 | x | x | 41.47 ± 14.23 | 15.36 ± 4.76 | ||
| PS.O-38.1/P-38.0 | 0.58 | 0.15 | -0.41 | 0.03 | x | 49.83 ± 10.01 | 59.14 ± 5.8 | |||
| PS.O-38.2/P-38.1 | 0.7 | 0.04 | 0.41 | -0.44 | x | 403.79 ± 54.5 | 327.41 ± 58.89 | |||
| PS.O-38.5/P-38.4 | 0.88 | <0.01 | 0.82 | -0.74 | x | x | x | 163.08 ± 24.44 | 94.22 ± 13.23 | |
| PS.O-38.6/P-38.5 | 0.86 | <0.01 | 0.99 | -0.67 | x | x | x | 361.75 ± 74.27 | 168.69 ± 30.8 | |
| PS.O-40.0 | 0.7 | 0.01 | -0.6 | 0.36 | x | 66.34 ± 12.97 | 88.35 ± 13.27 | |||
| PS.O-40.6/P-40.5 | 0.75 | <0.01 | 0.36 | -0.46 | x | x | 372.13 ± 29.19 | 294.14 ± 34.19 | ||
| PS.O-42.5/P-42.4b | 0.79 | <0.01 | 0.44 | -0.57 | x | x | x | 313.53 ± 31.31 | 233.07 ± 24.54 | |
| PS.O-42.6/P-42.5b | 0.79 | <0.01 | 0.45 | -0.52 | x | x | 226.36 ± 26.28 | 165.82 ± 14.05 | ||
| TG.44.0 | 0.76 | <0.01 | -0.77 | 0.49 | x | 371.86 ± 72.65 | 620.47 ± 120.92 | |||
| TG.46.4 | 0.78 | <0.01 | -0.91 | 0.52 | x | x | 389.78 ± 87.09 | 641.69 ± 122.92 | ||
| TG.47.4 | 0.78 | <0.01 | -1.01 | 0.56 | x | 233.64 ± 57.24 | 399.27 ± 78.14 | |||
| TG.49.4 | 0.74 | 0.01 | -0.61 | 0.55 | x | 898.38 ± 176.02 | 1280.61 ± 184.12 | |||
| TG.49.5 | 0.73 | 0.01 | -0.58 | 0.51 | x | 967.3 ± 181.85 | 1356.58 ± 186.94 | |||
| TG.50.1 | 0.73 | 0.01 | -0.56 | 0.46 | x | 3679.66 ± 783.32 | 4970.1 ± 532.03 | |||
| TG.51.7 | 0.68 | 0.05 | -0.43 | 0.46 | x | 803.73 ± 148.86 | 1007.24 ± 129.46 | |||
| TG.52.1b | 0.72 | <0.01 | -0.62 | 0.45 | x | 2349.98 ± 497.12 | 3209.19 ± 324.5 | |||
| TG.52.2 | 0.73 | 0.01 | -0.5 | 0.47 | x | 5644.84 ± 1125.16 | 7359.71 ± 769.69 | |||
| TG.52.3 | 0.67 | 0.08 | -0.41 | 0.38 | x | 5871.8 ± 1225.93 | 7209.96 ± 967.84 | |||
| TG.54.1b | 0.75 | <0.01 | -0.69 | 0.52 | x | 1119.48 ± 233.54 | 1650.3 ± 207.51 | |||
| TG.54.6 | 0.71 | 0.02 | -0.44 | 0.51 | x | 10750.34 ± 1936.83 | 13813.28 ± 1289.65 | |||
| TG.55.5 | 0.69 | 0.03 | -0.41 | 0.48 | x | 1918.8 ± 352.6 | 2479.95 ± 257.98 | |||
| TG.56.8 | 0.76 | <0.01 | -0.98 | 0.58 | x | x | 150.5 ± 34.36 | 263.58 ± 60.64 | ||
| TG.58.2a | 0.74 | <0.01 | -0.69 | 0.35 | x | 350.25 ± 73.99 | 476.86 ± 48.03 | |||
| TG.62.13 | 0.64 | 0.03 | 0.34 | -0.21 | x | 3162.55 ± 736.72 | 2296.29 ± 325.35 | |||
| TG.63.13 | 0.64 | 0.03 | 0.53 | -0.24 | x | x | 539.74 ± 170.8 | 348.6 ± 78.85 | ||
| TG.64.16b | 0.7 | 0.01 | 0.58 | -0.33 | x | 740.92 ± 199.04 | 464.71 ± 88.7 | |||
| TG.66.15 | 0.61 | 0.07 | 1.33 | -0.22 | x | 332.46 ± 148.58 | 180.21 ± 61.03 | |||
| TG.66.18 | 0.62 | 0.03 | 0.47 | -0.22 | x | 910.13 ± 314.41 | 524.17 ± 151.27 | |||
| TG.O-52.1 | 0.76 | <0.01 | -0.93 | 0.46 | x | x | 369.81 ± 102.77 | 637.06 ± 140.8 |
References
- van den Burg, S.W.K., et al., Exploring mechanisms to pay for ecosystem services provided by mussels, oysters and seaweeds. Ecosystem Services, 2022. 54.
- Sea, M.A., J.R. Hillman, and S.F. Thrush, The influence of mussel restoration on coastal carbon cycling. Glob Chang Biol, 2022. 28(17): p. 5269-5282.
- Nijdam, D., T. Rood, and H. Westhoek, The price of protein: Review of land use and carbon footprints from life cycle assessments of animal food products and their substitutes. Food Policy, 2012. 37(6): p. 760-770.
- Yaghubi, E., et al., Farmed Mussels: A Nutritive Protein Source, Rich in Omega-3 Fatty Acids, with a Low Environmental Footprint. Nutrients, 2021. 13(4).
- Lopez, A., F. Bellagamba, and V.M. Moretti, Nutritional quality traits of Mediterranean mussels (Mytilus galloprovincialis): A sustainable aquatic food product available on Italian market all year round. Food Science and Technology International, 2022. 29(7): p. 718-728.
- Krause, G., et al., Prospects of Low Trophic Marine Aquaculture Contributing to Food Security in a Net Zero-Carbon World. Frontiers in Sustainable Food Systems, 2022. 6.
- Avdelas, L., et al., The decline of mussel aquaculture in the European Union: causes, economic impacts and opportunities. Reviews in Aquaculture, 2020. 13(1): p. 91-118.
- Stewart-Sinclair, P.J., et al., A global assessment of the vulnerability of shellfish aquaculture to climate change and ocean acidification. Ecol Evol, 2020. 10(7): p. 3518-3534.
- Navarro, E. and J.I.P. Iglesias, Energetics of reproduction related to evironmental variability in bivalve molluscs. Haliotis, 1995. 24: p. 43-55.
- Duinker, A., et al., Gonad development and spawning in one and two year old mussels (Mytilus edulis) from Western Norway. Journal of the Marine Biological Association of the United Kingdom, 2008. 88(07).
- Murray, H.M., D. Gallardi, and T. Mills, Effect of culture depth and season on the condition and reproductive indices of blue mussels (Mytilus edulis L.) cultured in a cold-water coastal environment. Journal of Shellfish Research, 2019. 38(2): p. 351-362, 12.
- Seed, R. and R.A. Brown, A comparison of the reproductive cycles of Modiolus modiolus (L.), Cerastoderma (=Cardium) edule (L.), and Mytilus edulis L. in Strangford Lough, Northern Ireland. Oecologia, 1977. 30(2): p. 173-188.
- Villalba, A., Gametogenic cycle of cultured mussel, Mytilus galloprovincialis, in the bays of Galicia (NW Spain). Aquaculture, 1995. 130(2): p. 269-277.
- Pieters, H., J.H. Kluytmans, and D.I. Zandee, Tissue composition and reproduction of Mytilus edulis in relation to food availability. Netherlands Journal of Sea Research, 1980. 14(3/4): p. 349-361.
- Pipe, R.K., Ultrastructural and cytochemical study on interactions between nutrient storage cells and gametogenesis in the mussel Mytilus edulis. Marine Biology, 1987. 96: p. 519-528.
- Pipe, R.K., oogenesis in the marine mussel Mytilus edulis: an ultrastructural study. Marine Biology, 1987. 95: p. 405-414.
- Zandee, D.I., et al., Seasonal variations in biochemical composition of Mytilus edulis with reference to energy metabolism and gametogenesis. Netherlands Journal of Sea Research, 1980. 14(1): p. 1-29.
- Martínez-Pita, I., et al., Biochemical composition, lipid classes, fatty acids and sexual hormones in the mussel Mytilus galloprovincialis from cultivated populations in south Spain. Aquaculture, 2012. 358-359: p. 274-283.
- Dagorn, F., et al., Exploitable Lipids and Fatty Acids in the Invasive Oyster Crassostrea gigas on the French Atlantic Coast. Mar Drugs, 2016. 14(6): p. 104-116.
- Pazos, A.J., et al., Seasonal variations of the lipid content and fatty acid composition of Crassostrea gigas cultured in E1 Grove, Galicia, n.W. Spain. Comp. Biochem. Physiol., 1996. 114B(2): p. 171-179.
- Soudant, P., et al., Comparison of the lipid class and fatty acid composition between a reproductive cycle in nature and a standard hatchery conditioning of the Pacific Oyster Crassostrea gigas. Comparative Biochemistry and Physiology Part B: Biochemistry and Molecular Biology, 1999. 123(2): p. 209-222.
- Abad, M., et al., Seasonal variations of lipid classes and fatty acids in flat oyster, Ostrea edulis, from San Cibran (Galicia, Spain). Camp. Biochem. Physiol., 1995. 110C(2): p. 109-118.
- Alkanani, T., et al., Role of fatty acids in cultured mussels, Mytilus edulis, grown in Notre Dame Bay, Newfoundland. Journal of Experimental Marine Biology and Ecology, 2007. 348(1-2): p. 33-45.
- Orban, E., et al., Seasonal changes in meat content, condition index and chemical composition of mussels (Mytilus galloprovincialis) cultured in two different Italian sites. Food Chem, 2002. 77: p. 57-65.
- Mladimeo, I., et al., The reproductive cycle, condition index and biochemical composition of the horse-bearded mussel Modiolus barbatus. Helgol Mar Res, 2007. 61: p. 183-192.
- Zheng, H., et al., Cloning and expression of vitellogenin (Vg) gene and its correlations with total carotenoids content and total antioxidant capacity in noble scallop Chlamys nobilis (Bivalve: Pectinidae). Aquaculture, 2012. 366-367: p. 46-53.
- Beninger, P.G., Seasonal variations of the major lipid classes in relation to the reproductive activity of two species of clams raised in a common habitat: Tapes decussatus l. (Jeffreys, 1863) and T. philippinarum (Adams & Reeve, 1850). J. Exp. Mar. Biol. Ecol., 1984. 79: p. 79-90.
- Beninger, P.G., Caveat observator: the many faces of pre-spawning atresia in marine bivalve reproductive cycles. Marine Biology, 2017. 164(8).
- Fearman, J. and N.A. Moltschaniwskyj, Warmer temperatures reduce rates of gametogenesis in temperate mussels, Mytilus galloprovincialis. Aquaculture, 2010. 305: p. 20-25.
- Helm, M.M. and N. Bourne, Hatchery culture of bivalves: a practical manual;. FAO Fisheries technical paper 471, ed. A. Lovatelli. 2004, Rome: FAO, Food and Agriculture Organizatio.
- Lucas, A. and P.G. Beninger, The use of physiological condition indices in marine bivalve aquaculture. Aquaculture, 1985. 44: p. 187-200.
- Toro, J.E., R.J. Thompson, and D.J. Innes, Reproductive isolation and reproductive output in two sympatric mussel species (Mytilus edulis, M. trossulus) and their hybrids from Newfoundland. Marine Biology, 2002. 141(5): p. 897-909.
- Chipperfield, P.N.J., Observations on the breeding and settlement of Mytilus edulis (L.) in British waters. Journal of Marine Biological Association of the United Kingdom, 1953. 32(2): p. 449-476.
- Seed, R., Ecology, in Marine mussels: their ecology and physiology, B.L. Bayne, Editor. 1976, Cambridge University Press: Cambridge, UK.
- Gosling, E., Bivalve mollusc, biology, ecology and culture. 2004: Fishing New books, Blakwell Science.
- Gosling, E., Bivalve Molluscs, Biology, Ecology and culture. 2004: Blackwell Publishing. 443.
- Beninger, P.G., A qualitative and quantitative study of the reproductive cycle of the giant scallop, Placopecten magellanicus, in the Bay of Fundy (New Brunswick, Canada). Canadian journal of Zoology, 1987. 65(3): p. 495-498.
- Fraser, M., et al., Sex determination in blue mussels: Which method to choose? Marine Environmental Research 120, 2016. 120: p. 78-85.
- Bayne, B.L., et al., Further studies on the effects of stress in the adult on the eggs of Mytilus edulis. Journal of the Marine Biological Association of the United Kingdom, 1978. 58(4): p. 825-841.
- Newell, R. and B. Bayne, Seasonal changes in the physiology, reproductive condition and carbohydrate content of the cockle Cardium (= Cerastoderma) edule (Bivalvia: Cardiidae). Marine Biology, 1980. 56(1): p. 11-19.
- Pipe, R., Seasonal cycles in and effects of starvation on egg development in Mytilus edulis. Marine Ecology Progress Series, 1985: p. 121-128.
- Murray, H.M. and L.M.N. Ollerhead, A comparison of ArcGIS and Image J software tools for calculation of gonad volume fraction (GVF) froom histological sections of blue mussel cultured in deep and shallow sites on the Nortehrn coast of Newfoundland. Can. Tech. Rep. Fish. Aquat. Sci., 2018. 3275: p. vi-17.
- Hines, A., et al., Comparison of histological, genetic, metabolomics, and lipid-based methods for sex determination in marine mussels. Anal Biochem, 2007. 369(2): p. 175-86.
- Duinker, A., B.E. Torstersen, and Ø. Lie, Lipid classes and fatty acid composition of female gonads of great scallops: a selective field study. Journal of Shellfish Research, 2004. 23(2): p. 507-514.
- Martínez-Pita, I., et al., Effect of diet on the lipid composition of the commercial clam Donax trunculus (Mollusca: bivalvia): sex-related differences. Aquaculture Research, 2012. 43(8): p. 1134-1144.
- Soudant, P., et al., Impact of the quality of dietary fatty acids on metabolism and the composition of polar lipid classes in female gonads of Pecten maximus (L.). Journal of Experimental Marine Biology and Ecology, 1996. 205: p. 149-163.
- Chérel, D. and P.G. Beninger, Oocyte atresia characteristics and effect on reproductive effort of Manila clam Tapes philippinarum (Adams and Reeve, 1850). Journal of Shellfish Research, 2017. 36(3): p. 549-557.
- Laudicella, V.A., et al., Application of lipidomics in bivalve aquaculture, a review. Reviews in Aquaculture, 2020. 12: p. 678-702.
- Chansela, P., et al., Composition and localization of lipids in Penaeus merguiensis ovaries during the ovarian maturation cycle as revealed by imaging mass spectrometry. PLoS One, 2012. 7(3): p. e33154.
- Laudicella, V.A., et al., Sexual dimorphism in the gonad lipidome of blue mussels (Mytilus sp.): New insights from a global lipidomics approach. Comp Biochem Physiol Part D Genomics Proteomics, 2023. 48: p. 101150.
- Breiman, L., Random forests. Machine Learning, 2001. 45: p. 5-32.
- Bayne, B.L., Marine mussels: their ecology and physiology. Vol. 10. 1976: Cambridge University Press.
- Alfaro, A.C., A.G. Jeffs, and S.H. Hooker, Reproductive behavior of the green-lipped mussel, Perna canaliculus, in northern New Zealand. Bulletin Of Marine Science, 2001. 69(3): p. 1095–1108.
- Folch, J., M. Lees, and G.H. Sloane Stanley, A simple method for the isolation and purification of total lipids from animal tissues. J biol Chem, 1957. 226(1): p. 497-509.
- Facchini, L., et al., Ceramide lipids in alive and thermally stressed mussels: an investigation by hydrophilic interaction liquid chromatography-electrospray ionization Fourier transform mass spectrometry. J Mass Spectrom, 2016. 51(9): p. 768-81.
- Fahy, E., et al., A comprehensive classification system for lipids. J Lipid Res, 2005. 46(5): p. 839-61.
- Fahy, E., et al., Update of the LIPID MAPS comprehensive classification system for lipids. J Lipid Res, 2009. 50 Suppl: p. S9-14.
- Boselli, E., et al., Characterization of phospholipid molecular species in the edible parts of bony fish and shellfish. J Agric Food Chem, 2012. 60(12): p. 3234-45.
- Chen, S., N.A. Belikova, and P.V. Subbaiah, Structural elucidation of molecular species of pacific oyster ether amino phospholipids by normal-phase liquid chromatography/negative-ion electrospray ionization and quadrupole/multiple-stage linear ion-trap mass spectrometry. Anal Chim Acta, 2012. 735: p. 76-89.
- Liu, Z.Y., et al., Characterization of glycerophospholipid molecular species in six species of edible clams by high-performance liquid chromatography-electrospray ionization-tandem mass spectrometry. Food Chem, 2017. 219: p. 419-427.
- Yin, F.W., et al., Identification of glycerophospholipid molecular species of mussel (Mytilus edulis) lipids by high-performance liquid chromatography-electrospray ionization-tandem mass spectrometry. Food Chem, 2016. 213: p. 344-51.
- Facchini, L., et al., Seasonal variations in the profile of main phospholipids in Mytilus galloprovincialis mussels: A study by hydrophilic interaction liquid chromatography-electrospray ionization Fourier transform mass spectrometry. J Mass Spectrom, 2018. 53(1): p. 1-20.
- Facchini, L., et al., Structural characterization and profiling of lyso-phospholipids in fresh and in thermally stressed mussels by hydrophilic interaction liquid chromatography-electrospray ionization-Fourier transform mass spectrometry. Electrophoresis, 2016. 37(13): p. 1823-38.
- Losito, I., et al., Fatty acidomics: Evaluation of the effects of thermal treatments on commercial mussels through an extended characterization of their free fatty acids by liquid chromatography - Fourier transform mass spectrometry. Food Chem, 2018. 255: p. 309-322.
- Guercia, C., P. Cianciullo, and C. Porte, Analysis of testosterone fatty acid esters in the digestive gland of mussels by liquid chromatography-high resolution mass spectrometry. Steroids, 2017. 123: p. 67-72.
- Donato, P., et al., Comprehensive lipid profiling in the Mediterranean mussel (Mytilus galloprovincialis) using hyphenated and multidimensional chromatography techniques coupled to mass spectrometry detection. Anal Bioanal Chem, 2018. 410(14): p. 3297-3313.
- Yurekten, O., et al., MetaboLights: open data repository for metabolomics. Nucleic Acids Res, 2024. 52(D1): p. D640-D646.
- Xia, J. and J. Chong, MetaboanlystR: An R package for comprehensive analysis of metabolomics data. 2018.
- Kassambara, A. and F. Mudt, Package 'factoextra'. 2017.
- Wold, S., K. Esbensen, and P. Geladi, Principal Component Analysis. Chemometrics and Intelligent Laboratory Systems, 1987. 2: p. 37-52.
- van den Berg, R.A., et al., Centering, scaling, and transformations: improving the biological information content of metabolomics data. BMC Genomics, 2006. 7: p. 142.
- Blighe, K., S. Rana, and M. Lewis, EnhancedVolcano: Publication-ready volcano plots with enhanced colouring and labeling. 2019.
- Benjamini, Y. and Y. Hochberg, Controlling the false discovery rate: a practical and powerful approach to multiple testing. Journal of the Royal statistical society: series B (Methodological), 1995. 57(1): p. 289-300.
- Bylesjö, M., et al., OPLS discriminant analysis: combining the strengths of PLS-DA and SIMCA classification. Journal of Chemometrics, 2006. 20(8-10): p. 341-351.
- Gromski, P.S., et al., A tutorial review: Metabolomics and partial least squares-discriminant analysis--a marriage of convenience or a shotgun wedding. Anal Chim Acta, 2015. 879: p. 10-23.
- Brieuc, M.S.O., et al., A practical introduction to Random Forest for genetic association studies in ecology and evolution. Mol Ecol Resour, 2018. 18(4): p. 755-766.
- Liaw, A. and M. Wieiner, Package 'randomForest'. 2018.
- Molenaar, M.R., et al., LION/web: a web-based ontology enrichment tool for lipidomic data analysis. Gigascience, 2019. 8(6).
- Wagner, F., GO-PCA: An Unsupervised Method to Explore Gene Expression Data Using Prior Knowledge. PLoS One, 2015. 10(11): p. e0143196.
- Newell, R.I., et al., Temporal variation in the reproductive cycle of Mytilus edulis L.(Bivalvia, Mytilidae) from localities on the east coast of the United States. The Biological Bulletin, 1982. 162(3): p. 299-310.
- Pernet, F., S. Gauthier-Clerc, and E. Mayrand, Change in lipid composition in eastern oyster (Crassostrea virginica Gmelin) exposed to constant or fluctuating temperature regimes. Comp Biochem Physiol B Biochem Mol Biol, 2007. 147(3): p. 557-65.
- Ren, S., et al., Computational and statistical analysis of metabolomics data. Metabolomics, 2015. 11(6): p. 1492-1513.
- Checa, A., C. Bedia, and J. Jaumot, Lipidomic data analysis: tutorial, practical guidelines and applications. Anal Chim Acta, 2015. 885: p. 1-16.
- Franceschi, P., M. Giordan, and R. Wehrens, Multiple comparisons in mass-spectrometry-based -omics technologies. TrAC Trends in Analytical Chemistry, 2013. 50: p. 11-21.
- Pazos, A.J., et al., Lipid Classes and Fatty Acid Composition in the Female Gonad of Pecten maximus in Relation to Reproductive Cycle and Environmental Variables. Comparative Biochemistry and Physiology Part B: Biochemistry and Molecular Biology, 1997. 117(3): p. 393-402.
- Zeng, X., et al., Variations in lipid composition of ovaries and hepatopancreas during vitellogenesis in the mud crab Scylla paramamosain: Implications of lipid transfer from hepatopancreas to ovaries. Aquaculture Reports, 2024. 35.
- Koutsouveli, V., et al., Oogenesis and lipid metabolism in the deep-sea sponge Phakellia ventilabrum (Linnaeus, 1767). Sci Rep, 2022. 12(1): p. 6317.
- Merrill, A.H., et al., Sphingolipids—The enigmatic lipid class: Biochemistry, physiology, and pathophysiology. Toxicology and Applied Pharmacology, 1997. 142: p. 208-225.
- Alexaki, A., et al., De Novo Sphingolipid Biosynthesis Is Required for Adipocyte Survival and Metabolic Homeostasis. J Biol Chem, 2017. 292(9): p. 3929-3939.
- Dudek, J., Role of Cardiolipin in Mitochondrial Signaling Pathways. Front Cell Dev Biol, 2017. 5: p. 90.
- Kraffe, E., et al., A striking parallel between cardiolipin fatty acid composition and phylogenetic belonging in marine bivalves: A possible adaptative evolution? Lipids, 2008. 43(10): p. 961.
- Fernández-Reiriz, M.J., J.L. Garrido, and J. Irisarri, Fatty acid composition in Mytilus galloprovincialis organs: trophic interactions, sexual differences and differential anatomical distribution. Marine Ecology Progress Series, 2015. 528: p. 221-234.
- Kraffe, E., et al., Effect of reproduction on escape responses, metabolic rates and muscle mitochondrial properties in the scallop Placopecten magellanicus. Marine Biology, 2008. 156(1): p. 25-38.
- Fan, J., S. Upadhye, and A. Worster, Understanding receiver operating characteristic (ROC) curves. CJEM, 2006. 8(1): p. 19-20.
- Youden, W.J., Index for rating diagnostic tests. Cancer, 1950. 3(1): p. 32-35.
- Ren, C., et al., Lipidomic analysis of serum samples from migraine patients. Lipids Health Dis, 2018. 17(1): p. 22.
- Liu, C., et al., Lipidomic characterisation discovery for coronary heart disease diagnosis based on high-throughput ultra-performance liquid chromatography and mass spectrometry. RSC Advances, 2018. 8(2): p. 647-654.
- Kariotoglou, D.M. and S.K. Mastronicolis, Phosphonolipids in the mussel Mytilus galloprovincialis. Z. Naturforsch., 1998. 53c: p. 888–896.
- Kariotoglou, D.M. and S.K. Mastronicolis, Sphingophosphonolipid molecular species from edible mollusks and a jellyfish. Comparative Biochemistry and Physiology Part B: Biochemistry and Molecular Biology, 2003. 136(1): p. 27-44.
- Losito, I., et al., Tracing the Thermal History of Seafood Products through Lysophospholipid Analysis by Hydrophilic Interaction Liquid Chromatography(-)Electrospray Ionization Fourier Transform Mass Spectrometry. Molecules, 2018. 23(9): p. 2212-2228.
- Le Grand, F., et al., Membrane phospholipid composition of hemocytes in the Pacific oyster Crassostrea gigas and the Manila clam Ruditapes philippinarum. Comp Biochem Physiol A Mol Integr Physiol, 2011. 159(4): p. 383-91.
- Vacaru, A.M., et al., Ceramide phosphoethanolamine biosynthesis in Drosophila is mediated by a unique ethanolamine phosphotransferase in the Golgi lumen. J Biol Chem, 2013. 288(16): p. 11520-30.
- Pauletto, M., et al., Insights into molecular features of Venerupis decussata oocytes: a microarray-based study. PLoS One, 2014. 9(12): p. e113925.
- Tilly, J.L. and R.N. Kolesnick, Sphingolipid signaling in gonadal development and function. Chemistry and Physics of Lipids, 1999. 102: p. 149-155.
- Vance, D.E., Glycerolipids biosynthesis in eukaryotes., in Biochemistry of lipids, lipoproteins and membranes, V.D.E.a.V. J., Editor. 1996, Elsevier. p. 153-180.
- Zhu, J., et al., Characterization of Ovarian Lipid Composition in the Largemouth Bronze Gudgeon (Coreius guichenoti) at Different Development Stages. Fishes, 2024. 9(7).
- Fadok, V.A., et al., A receptor for phosphatidylserine-specific clearance of apoptotic cells. Nature, 2000. 405(6782): p. 85-90.
- Segawa, K. and S. Nagata, An Apoptotic ‘Eat Me’ Signal: Phosphatidylserine Exposure. Trends in Cell Biology, 2015. 25(11): p. 639-650.
- Gervais, O., T. Renault, and I. Arzul, Induction of apoptosis by UV in the flat oyster, Ostrea edulis. Fish Shellfish Immunol, 2015. 46(2): p. 232-42.
- Meehan, T.L., et al., Analysis of phagocytosis in the Drosophila ovary, in Oogenesis: Methods and Protocols, I.P. Nezis, Editor. 2016, Springer New York: New York, NY. p. 79-95.
- Serizier, S.B. and K. McCall, Scrambled eggs: apoptotic cell clearance by non-professional phagocytes in the Drosophila ovary. Frontiers in Immunology, 2017. 8.
- Mostafa, S., N. Nader, and K. Machaca, Lipid Signaling During Gamete Maturation. Front Cell Dev Biol, 2022. 10: p. 814876.
- Soudant, P., et al., Separation of major polar lipids in Pecten maximus by highperformance liquid chromatography and subsequent determination of their fatty acids using gas chromatography. Journal of Chromatography B, 1995. 673(15-26).
- Laudicella, V.A., et al., Lipidomics analysis of juveniles’ blue mussels (Mytilus edulis L. 1758), a key economic and ecological species. PLoS One, 2020. 15(2): p. e0223031.
- Rey, F., et al., Unravelling polar lipids dynamics during embryonic development of two sympatric brachyuran crabs (Carcinus maenas and Necora puber) using lipidomics. Sci Rep, 2015. 5: p. 14549.
- Whyte, J.N.C., N. Boume, and C.A. Hodgson, Assessment of biochemical composition and energy reserves in larvae of the scallop Patinopecten yessoensis. J. Exp. Mar. Biol. Ecol., 1987. 113: p. 113-124.
- Yamashita, A., et al., Acyltransferases and transacylases that determine the fatty acid composition of glycerolipids and the metabolism of bioactive lipid mediators in mammalian cells and model organisms. Prog Lipid Res, 2014. 53: p. 18-81.
- Johnstone, J., The spawning of the mussel (Mytilus edulis). Proceeding and Transactions of the Livrpool biological Society, 1898. 13: p. 104-121.
- Cuevas, N., et al., Development of histopathological indices in the digestive gland and gonad of mussels: integration with contamination levels and effects of confounding factors. Aquat Toxicol, 2015. 162: p. 152-164.
Figure 1.
Volcano and orthogonal partial least squares discriminant analysis (OPLS-DA) for discrimination between ripe and not ripe BMOs. A: Volcano plot; NS – Not Significant; FC – fold change; FDR p<0.05 false discovery rate (FDR) p>0.05. B: OPLS-DA score plot; C: OPLS-DA Sigma plot. A Computed via ‘MetaboAnalystR’ [68] and plotted via ‘EnhancedVolcano’ package [72]. B, C: computed via ‘MetaboAnalystR’ and plotted via ‘gglot2’.

Figure 2.
Backward purging process to select the most important features from the top 5% of RF ranked molecules. A: RFclass; B: RFreg. Computed via ‘RandomForest’ package [77] and plotted via ‘ggplot2’ package.
Figure 2.
Backward purging process to select the most important features from the top 5% of RF ranked molecules. A: RFclass; B: RFreg. Computed via ‘RandomForest’ package [77] and plotted via ‘ggplot2’ package.
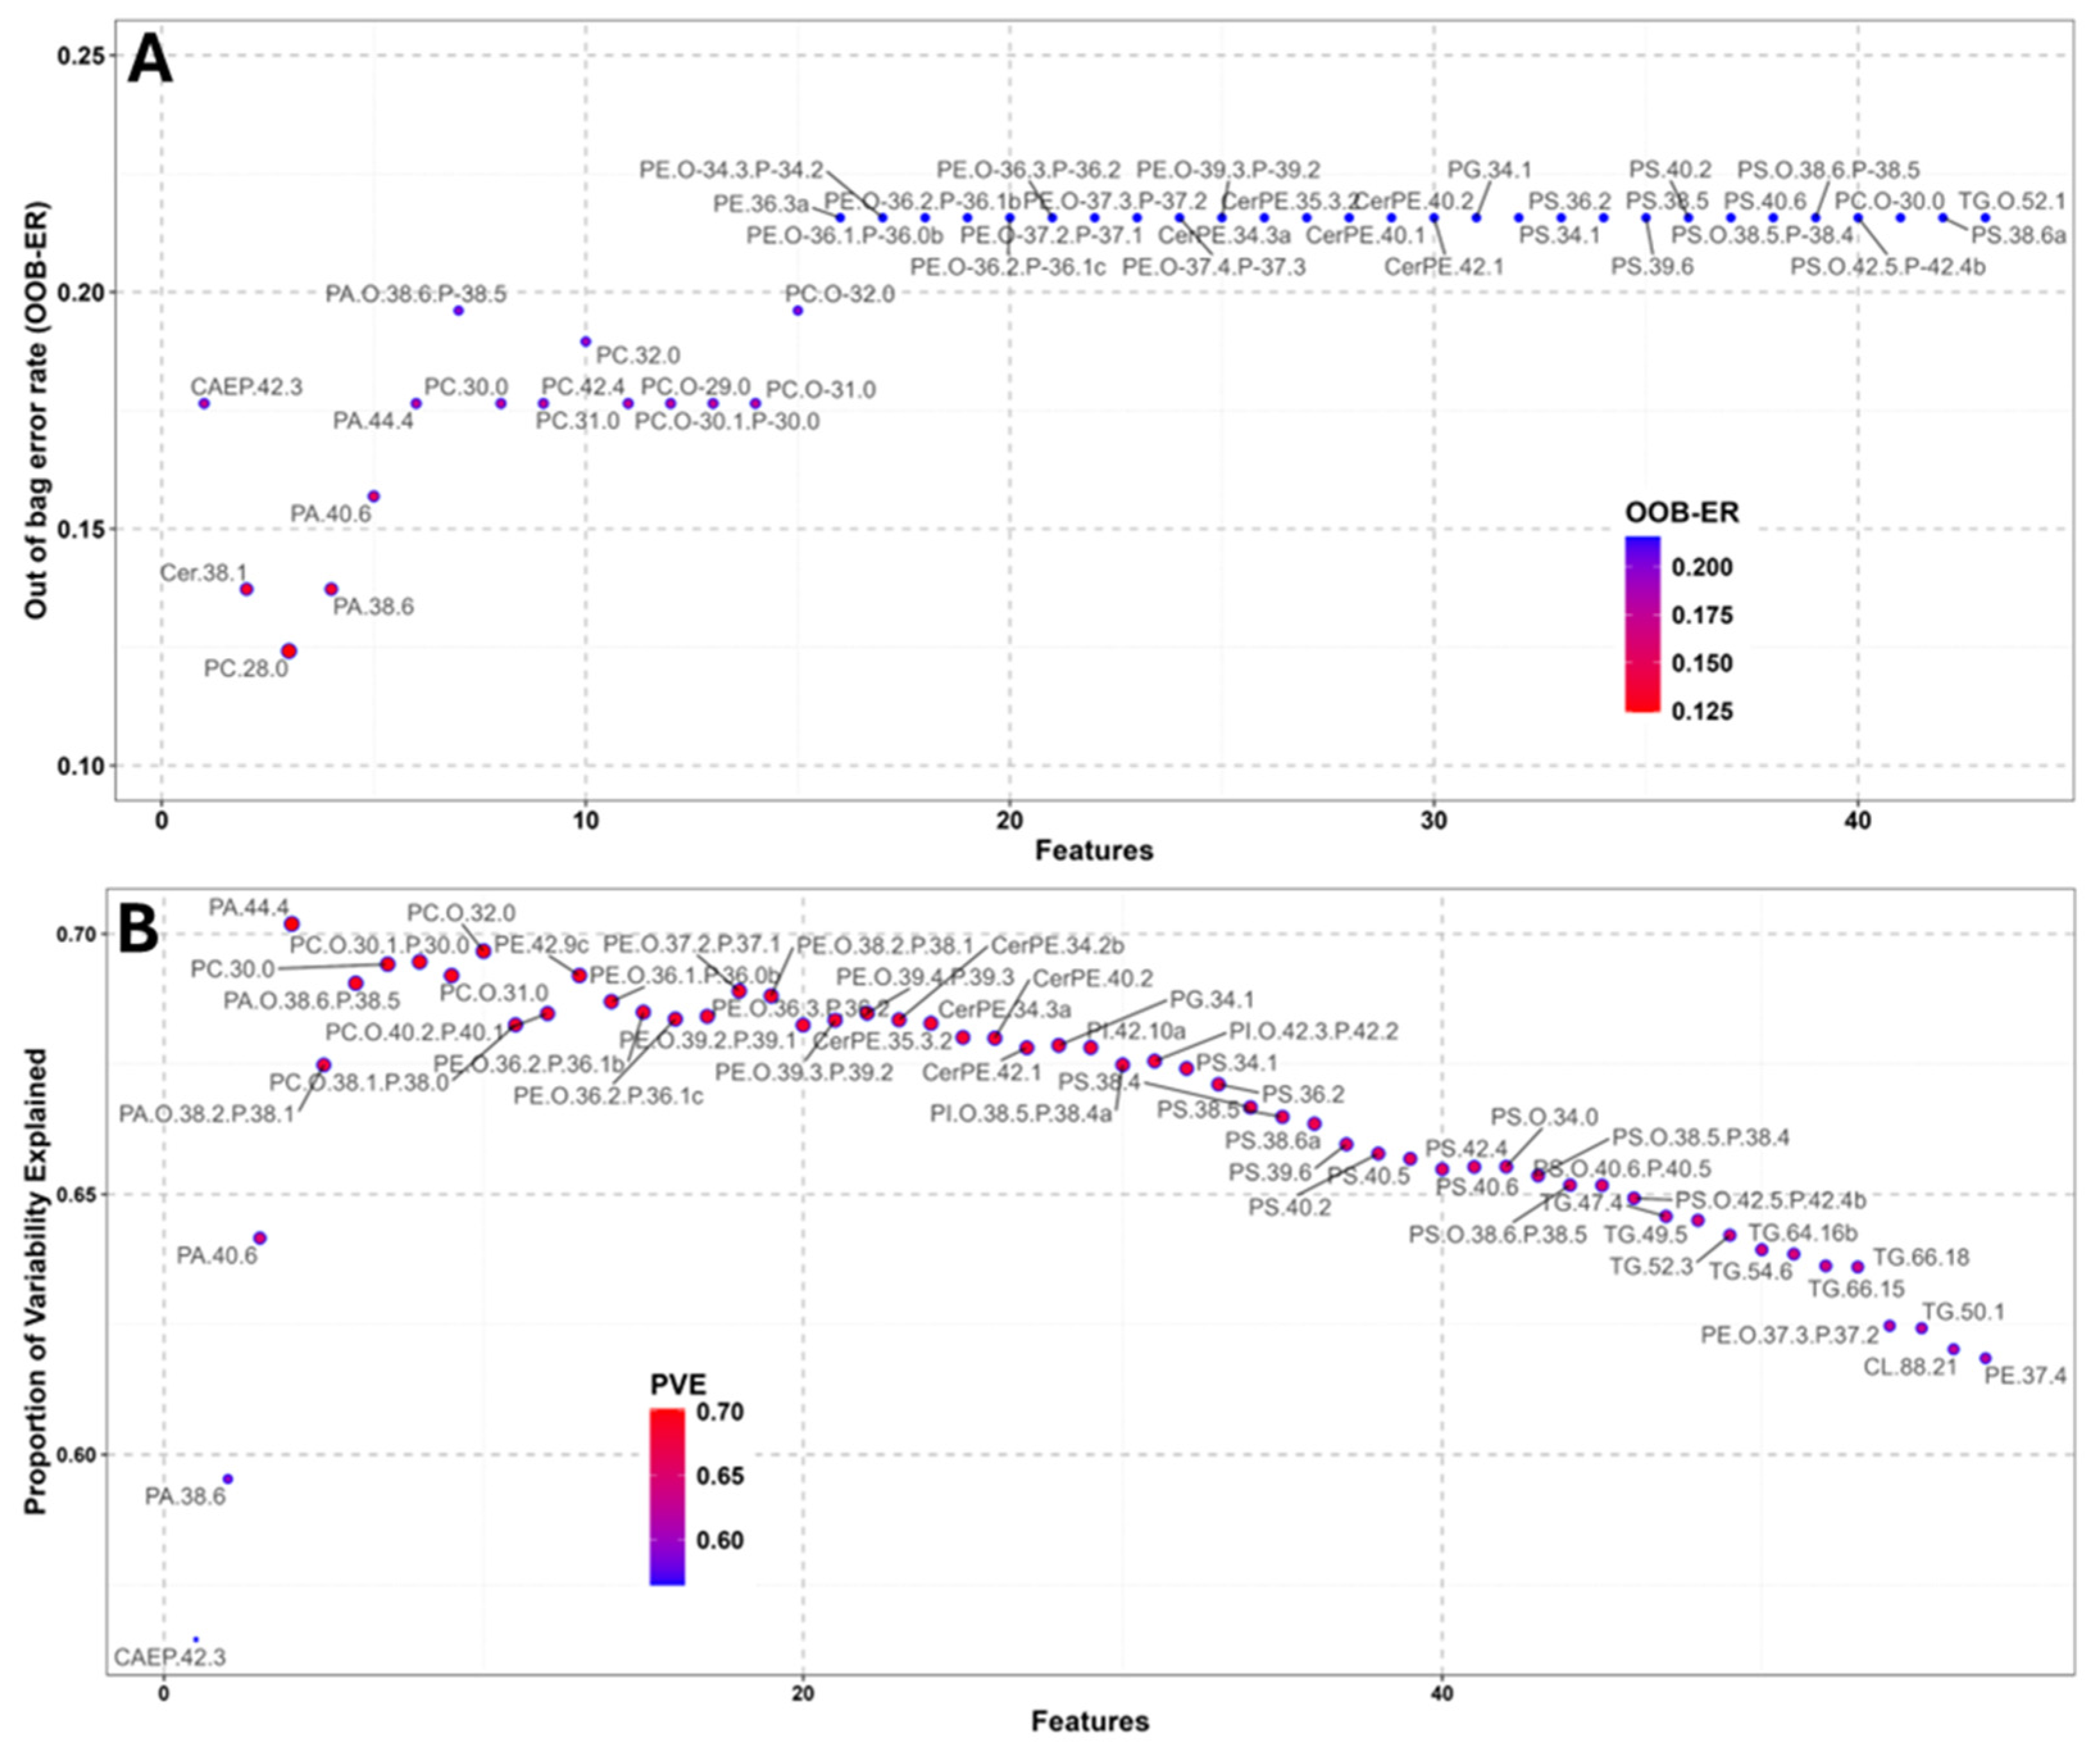
Figure 3.
Venn diagram showing the comparison between important features evidenced by the four different supervised statistical models. Obtained from https://bioinfogp.cnb.csic.es/tools/venny/.
Figure 3.
Venn diagram showing the comparison between important features evidenced by the four different supervised statistical models. Obtained from https://bioinfogp.cnb.csic.es/tools/venny/.
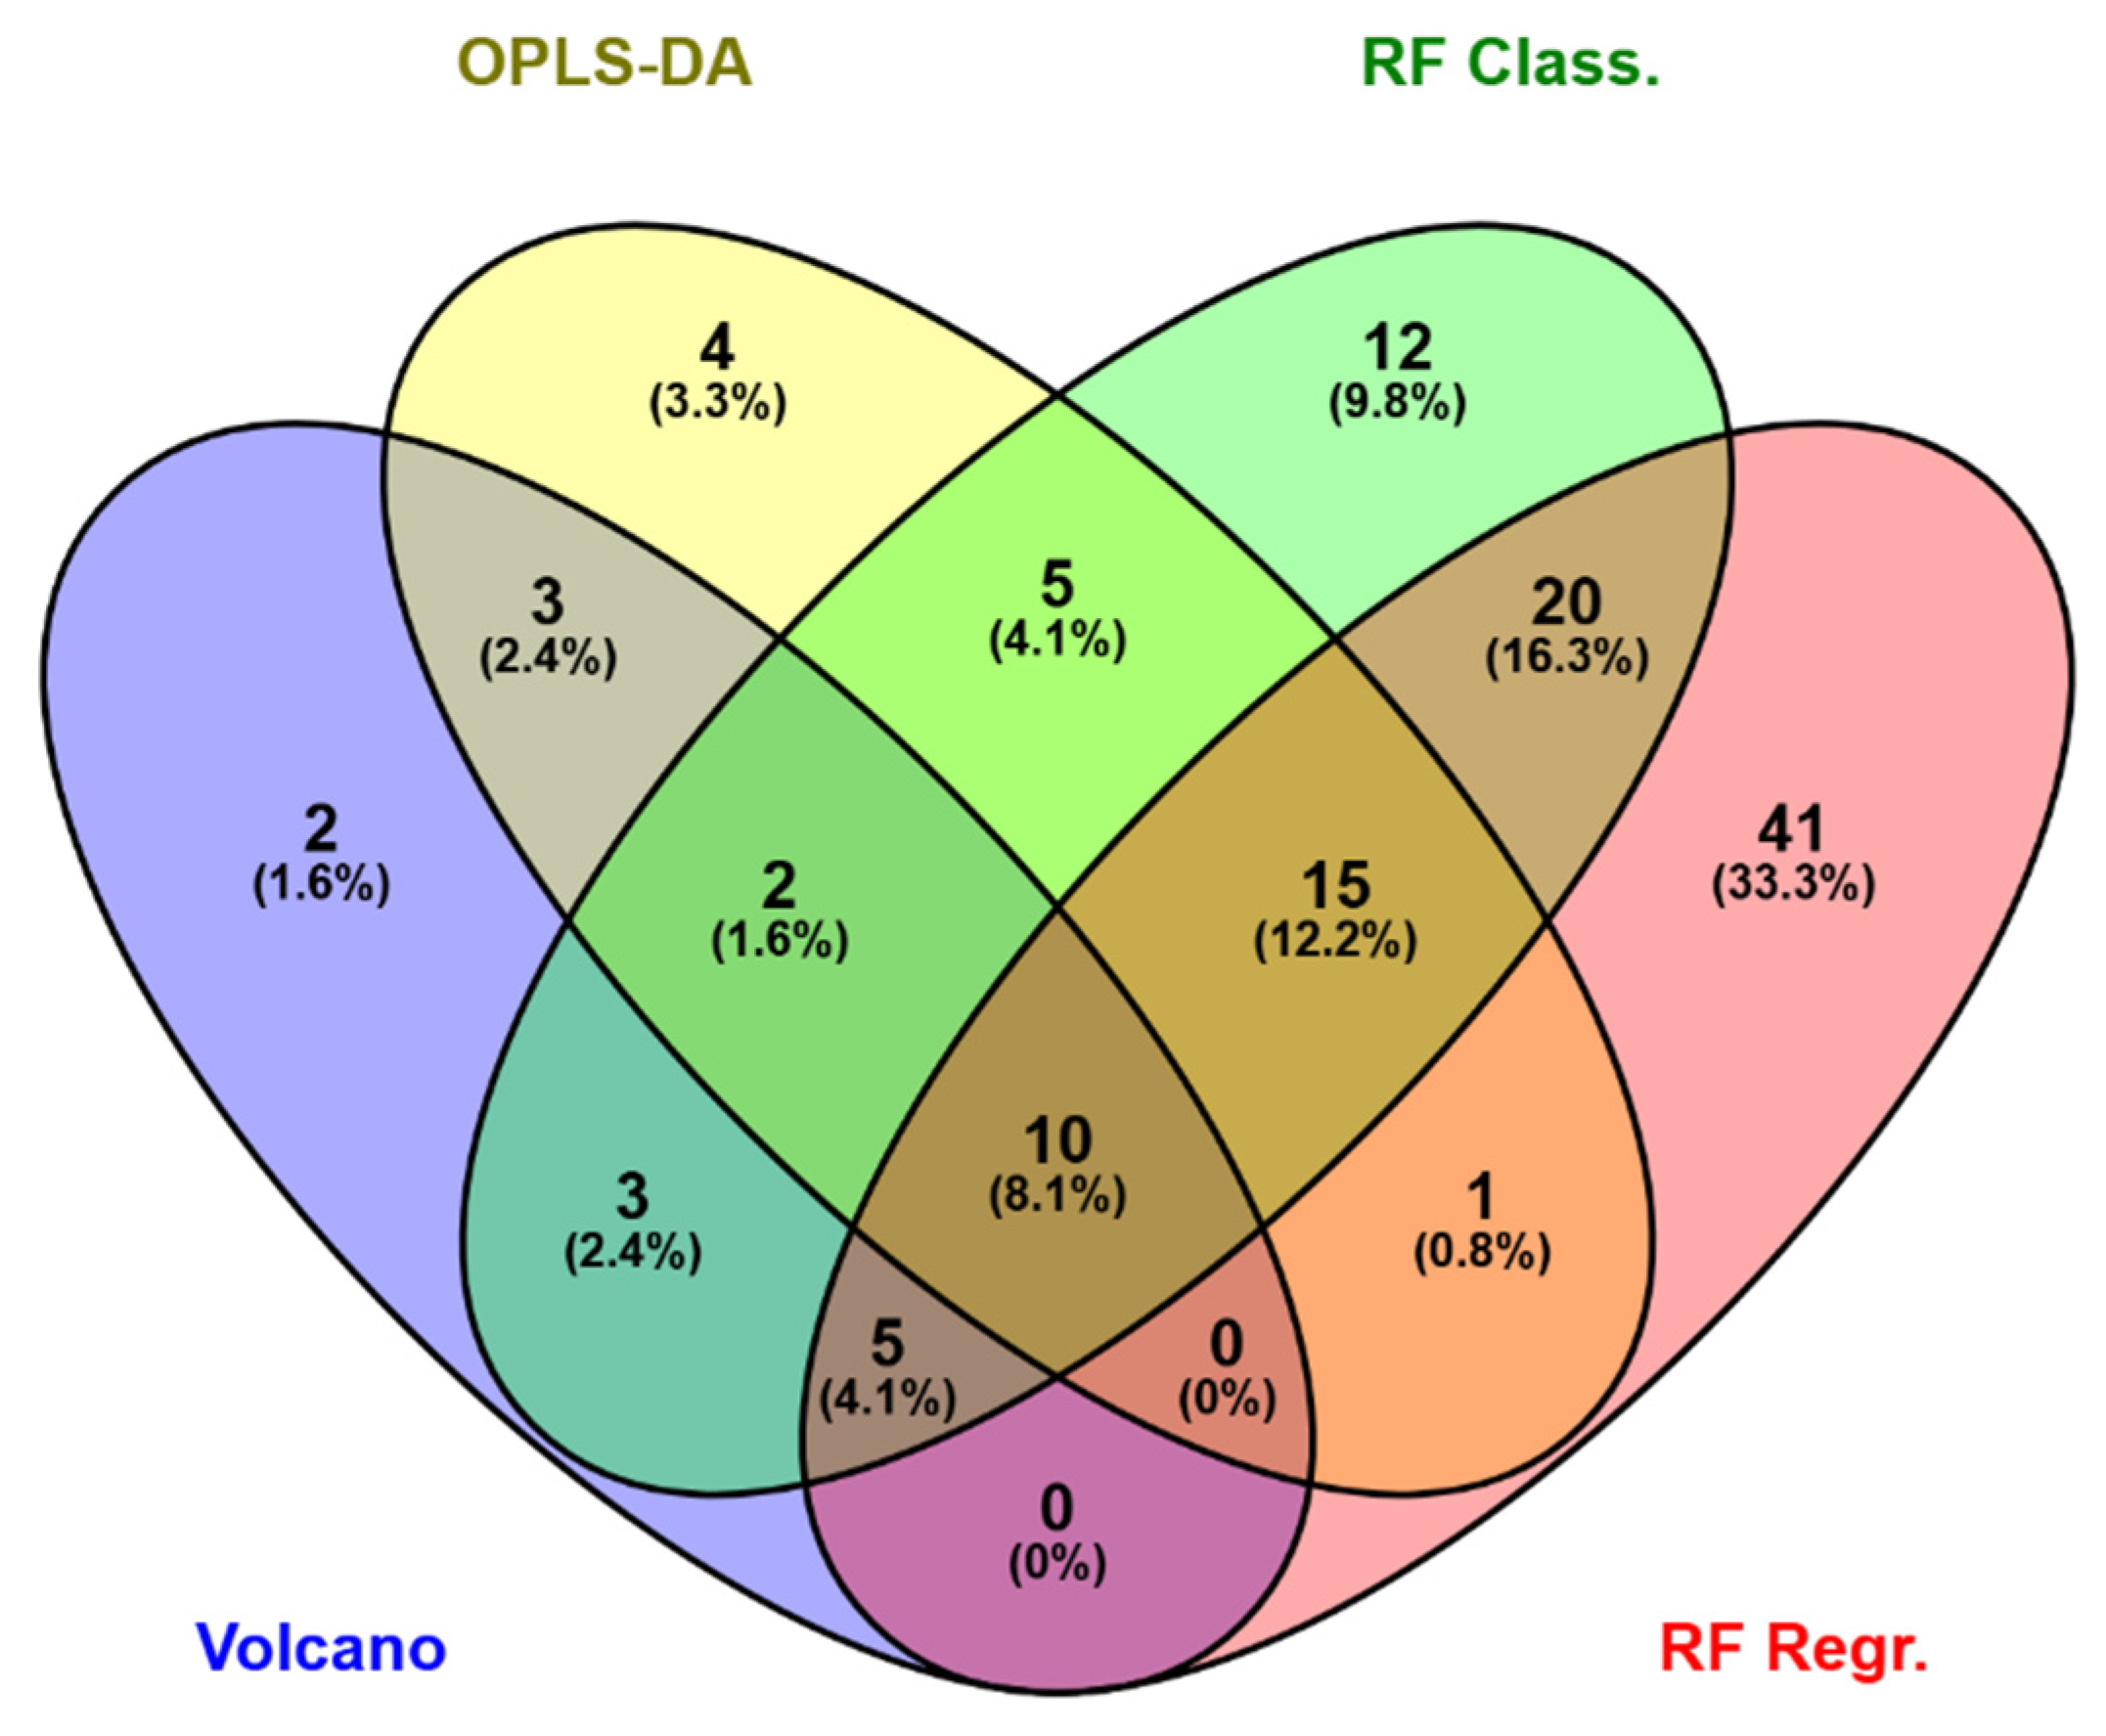
Figure 4.
Lipid Ontology (LiOn) term enrichment analysis for important lipids in distinction between ripe and not ripe blue mussel ovaries (BMOs). A: Heatmap plot of Principal Component analysis of LiOn terms. Complete is used as cluster algorithm and Euclidean distance as distance measure. B: LiOn terms ranking in the comparison between not ripe and ripe females. LiOn is an ontology database containing information related to lipid metabolism linked with a subset of lipid-species. LiOn terms are ordered according to molecules p-values (t-test) and in red are reported terms significantly different for FDR adjusted [73] p-value (q values). A computed and plotted via LiOn-PCA heatmap module [79] and B via LiOn enrichment analysis module [78].
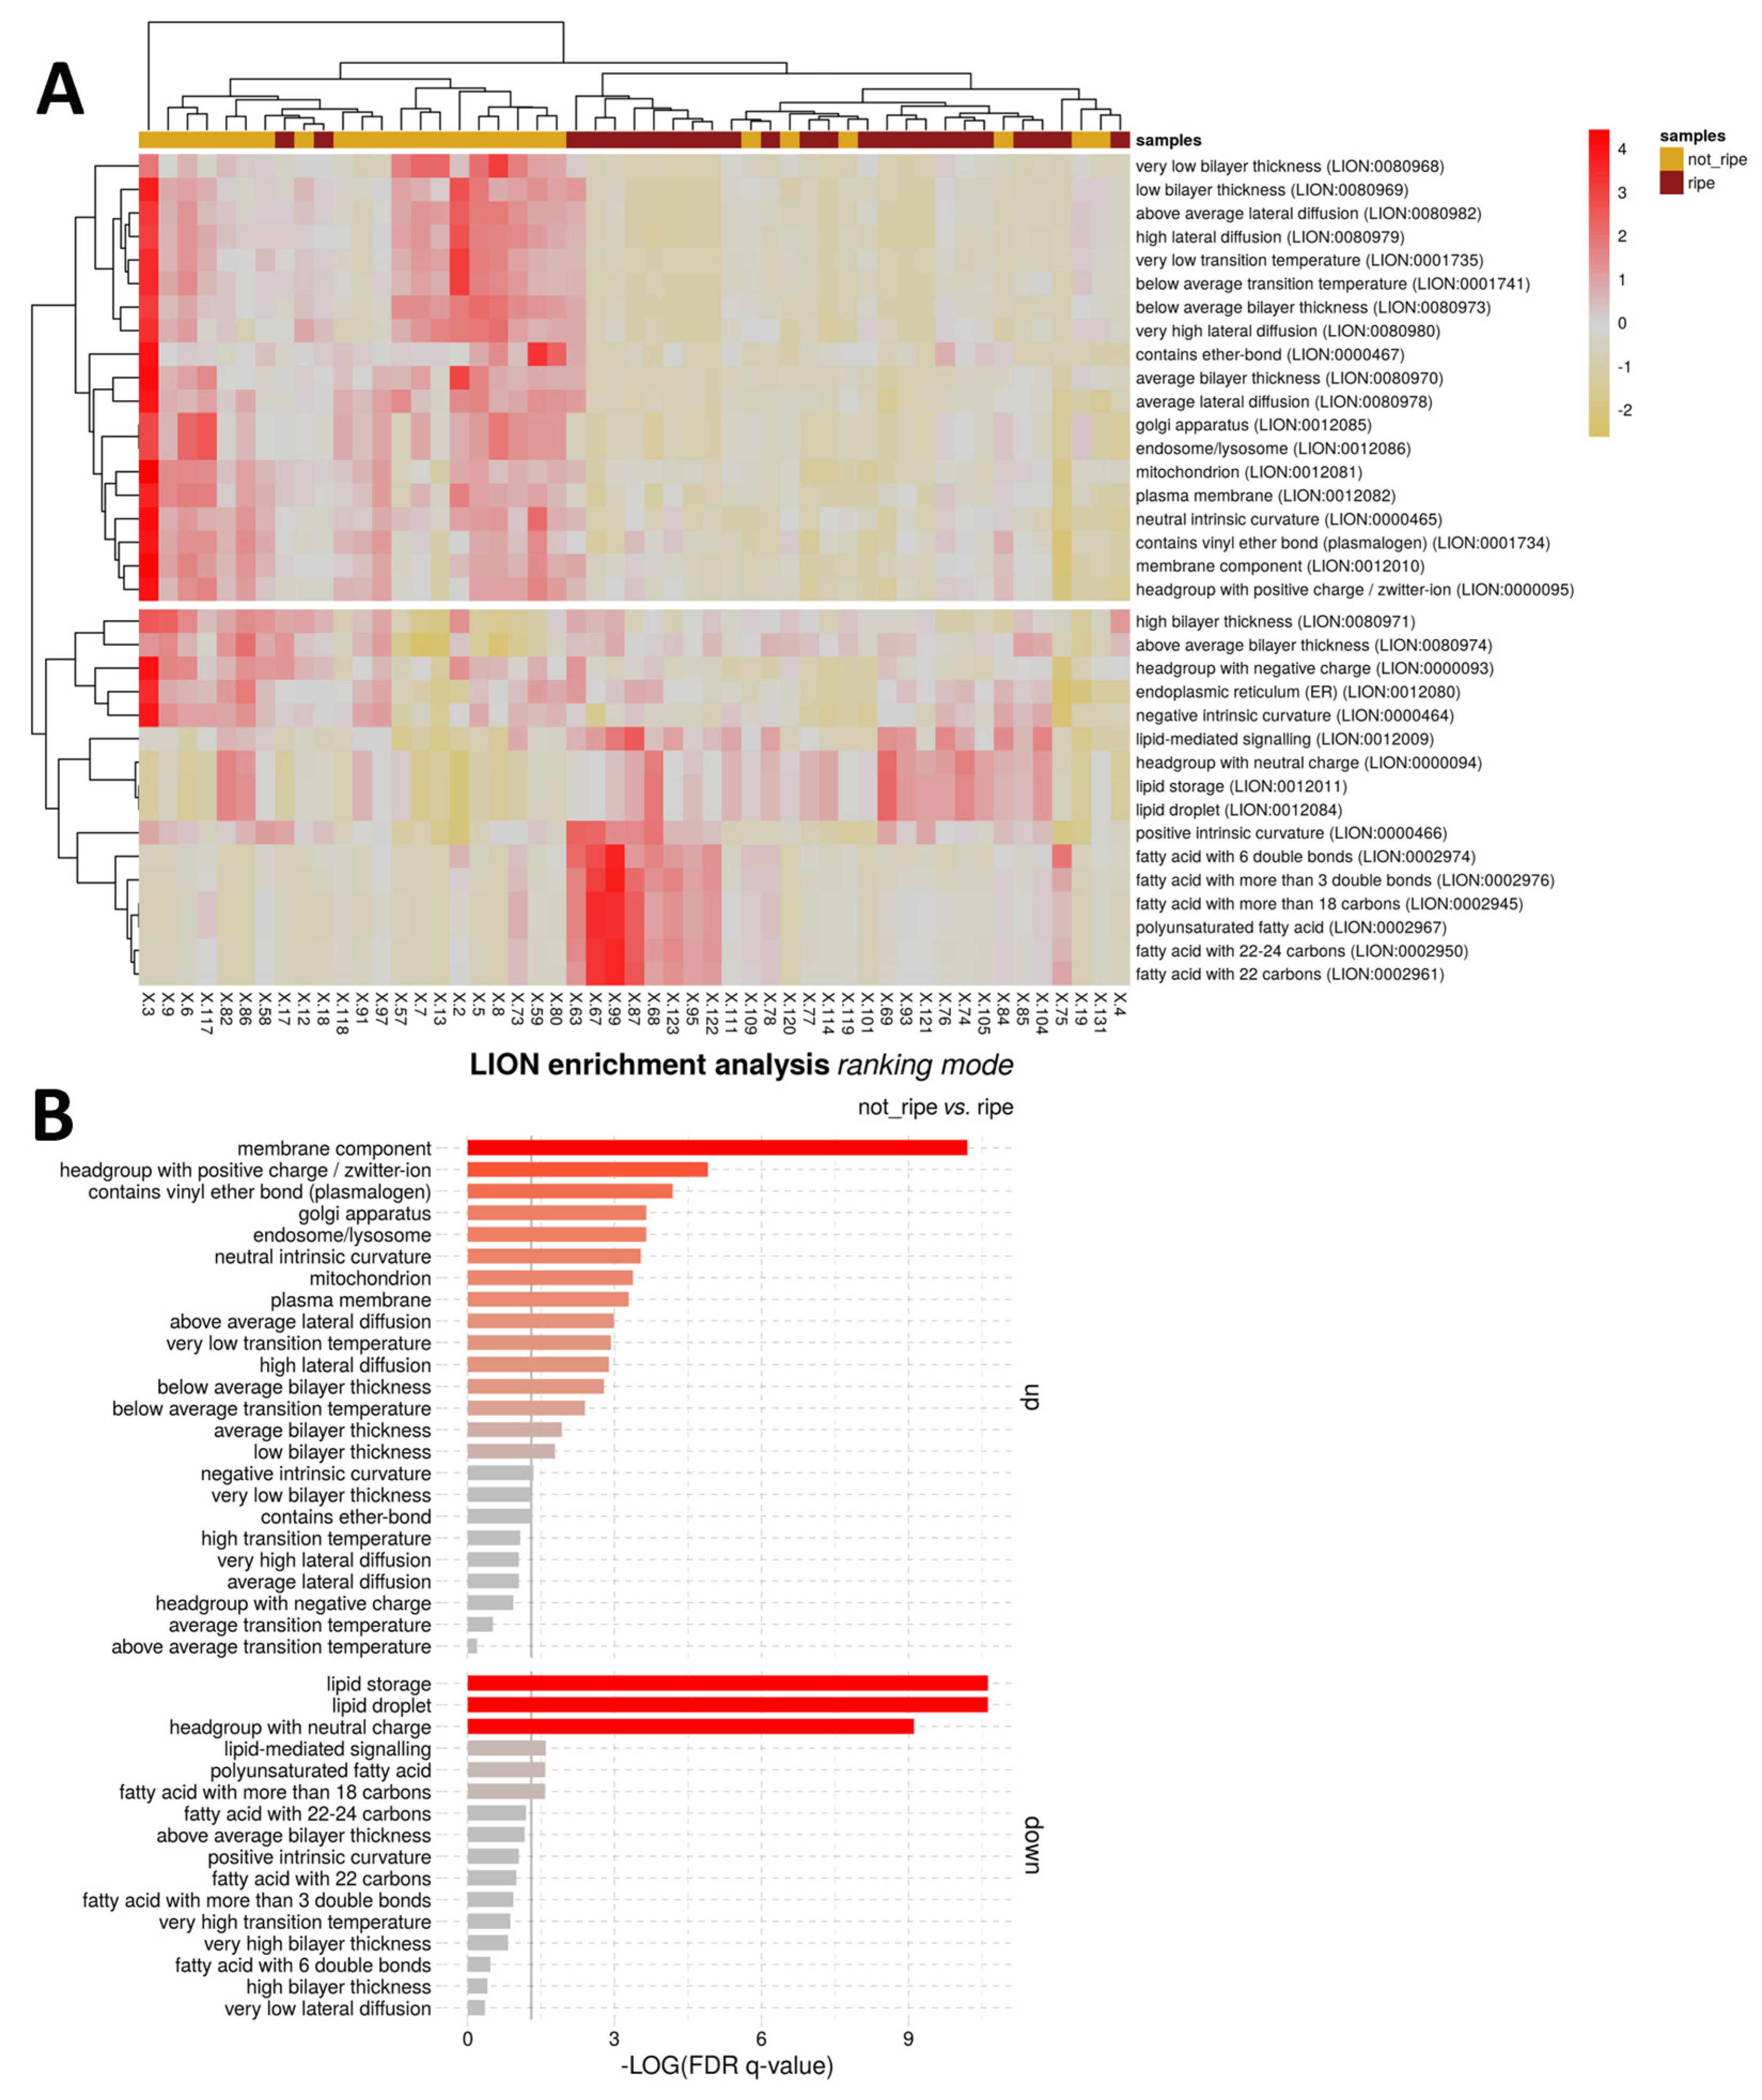
Figure 5.
Receiving operating characteristics (ROC) curves and area under the curve (AUC) for CerPE(40:2). A: ROC curve reporting the AUC, the 95% CI for AUC, and the Cut-off threshold with values of sensitivity and specificity, diagonal line marks a 0.5 AUC (no effect). B: Box-plot reporting the Pareto scaled variable distribution, blue horizontal intercept evidence the Cut-off point; box includes observation between 1st (25th percentile) and 3rd (75th percentile) quartile, whiskers represent values between ±1.5 * interquartile range (IQR), observations over ±1.5*IQR are reported as outliers (black dots); violin shapes represent the variable distribution. A: Computed and plotted via ‘MetaboAnalystR’ [68]; B: plotted via ‘ggplot2’.

Table 1.
Lipid species (AUC>0.8) markers of gonad ripeness identified by the supervised statistical approaches in blue mussel ovary (BMO) and ranked according to receiving operating curves (ROC) and area under the curve (AUC). Isomeric lipid molecules resolved by reverse phase separation (same exact mass 5 Δppm, but different retention time) are distinguished with a lowercase letter after the lipid ID. Cut-off: value of the variable that maximises sensitivity and specificity; Sens.: sensitivity of a variable, true positive ratio at the Cut-off value; Spec.: Specificity of the variable (true negative ratio) at the Cut-off value; p-value: Wilcoxon Rank test with p-value adjusted for false discovery rate [73]; FC: fold changes. The complete set of variables highlighted by statistical methods is available in Table C1. Computed via R package ‘MetaboanalysR’ [68].
| Lipid ID(1) | AUC | 95% CI | p-value(2) | FC | Volcano | OPLS-DA | RFClass | RFreg | Not ripe Average ± CI (95%) |
Ripe Average ± CI (95%) |
|---|---|---|---|---|---|---|---|---|---|---|
| CAEP(42:2) | 0.808 | 0.671-0.925 | 3.63E-04 | 1.57 | X | X | X | 47.59 ± 9.06 | 20.67 ± 7.5 | |
| CAEP(42:3) | 0.804 | 0.683-0.916 | 9E-03 | 3.13 | X | X | X | 36.95 ± 11.25 | 11.19 ± 6.08 | |
| CerPE(34:3)a | 0.845 | 0.729-0.939 | 2.08E-03 | 0.98 | X | X | X | 95.62 ± 20.84 | 48.43 ± 8.13 | |
| CerPE(35:3/2) | 0.874 | 0.771-0.954 | 2.08E-03 | 1.08 | X | X | X | 132.82 ± 29.82 | 55.95 ± 7.87 | |
| CerPE(40:1) | 0.806 | 0.668-0.93 | 3.62E-03 | 1.17 | X | X | X | 34.15 ± 7.02 | 13.71 ± 5.25 | |
| CerPE(40:2) | 0.905 | 0.799-0.981 | 3.04E-04 | 1.48 | X | X | X | X | 46.4 ± 7.88 | 17.69 ± 4.48 |
| LPC(22:2) | 0.806 | 0.673-0.922 | 7.42E-03 | -1.62 | X | 115.47 ± 39.6 | 308.4 ± 101.03 | |||
| PA(38:6) | 0.815 | 0.69-0.917 | 0.023 | 5.66 | X | X | X | 12.45 ± 6.38 | 1.46 ± 1.54 | |
| PA(40:6) | 0.861 | 0.749-0.958 | 7.42E-03 | 2.85 | X | X | X | X | 33.14 ± 12.05 | 8.31 ± 3.64 |
| PA(44:4) | 0.811 | 0.685-0.925 | 0.014 | -1.75 | X | X | 102.52 ± 41.73 | 226.25 ± 58.24 | ||
| PA(O-38:6/P-38:5) | 0.851 | 0.735-0.94 | 2.62E-03 | 2.12 | X | X | X | X | 46.5 ± 13.09 | 15.64 ± 4.86 |
| PC(28:0) | 0.842 | 0.732-0.939 | 3.62E-03 | 1.35 | X | X | X | X | 426.29 ± 119.56 | 140.95 ± 36.64 |
| PC(30:0) | 0.848 | 0.717-0.943 | 2.36E-03 | 1.37 | X | X | X | X | 1149.26 ± 291.11 | 396.62 ± 108.82 |
| PC(O-30:0) | 0.803 | 0.672-0.927 | 0.012 | 1.48 | X | X | X | 862.53 ± 256.36 | 318.65 ± 112.49 | |
| PC(O-31:0) | 0.8 | 0.664-0.902 | 0.014 | 1.37 | X | X | X | 68.9 ± 21.25 | 41.64 ± 9.75 | |
| PC(O-32:0) | 0.802 | 0.668-0.919 | 0.016 | 1.35 | X | X | X | X | 923.78 ± 291.49 | 351.64 ± 111.32 |
| PC(O-46:10/P-46:9)a | 0.811 | 0.68-0.915 | 2.25E-03 | -1.42 | X | X | X | X | 145.61 ± 41.99 | 341.56 ± 83.65 |
| PE(O-34:3/P-34:2) | 0.828 | 0.717-0.942 | 0.059 | 0.98 | X | X | 53.51 ± 20.01 | 24.5 ± 4.84 | ||
| PE(O-36:1/P-36:0)b | 0.868 | 0.748-0.962 | 2.66E-03 | 1.63 | X | X | X | X | 65.23 ± 19.65 | 21.09 ± 4.88 |
| PE(O-36:2/P-36:1)b | 0.848 | 0.719-0.949 | 3.62E-03 | 0.96 | X | X | X | 94.97 ± 22.76 | 47.13 ± 7.8 | |
| PE(O-36:2/P-36:1)c | 0.875 | 0.772-0.948 | 2.08E-03 | 0.97 | X | X | 251.77 ± 50.85 | 121.82 ± 15.8 | ||
| PE(O-36:3/P-36:2) | 0.851 | 0.737-0.95 | 7.42E-03 | 0.61 | X | X | 308.04 ± 55.87 | 193.04 ± 19.3 | ||
| PE(O-37:2/P-37:1) | 0.858 | 0.749-0.948 | 1.32E-03 | 0.99 | X | X | X | 231.1 ± 39.56 | 121.75 ± 21.86 | |
| PE(O-37:3/P-37:2) | 0.845 | 0.719-0.938 | 2.08E-03 | 0.51 | X | X | X | 428.34 ± 49.7 | 300.34 ± 26.36 | |
| PE(O-37:4/P-37:3) | 0.868 | 0.752-0.964 | 3.26E-03 | 0.74 | X | X | X | 84.17 ± 14.05 | 50.25 ± 6.82 | |
| PE(O-39:3/P-39:2) | 0.8 | 0.692-0.905 | 3.62E-03 | 0.45 | X | X | 360.03 ± 39.86 | 264.36 ± 23.89 | ||
| PG(34:1) | 0.86 | 0.735-0.96 | 7.29E-03 | 2.19 | X | X | X | X | 25.61 ± 8.8 | 7.32 ± 2.83 |
| PS(36:2) | 0.81 | 0.65-0.913 | 3.0E-03 | 7.06 | X | X | X | 16.21 ± 10.11 | 0.14 ± 0.22 | |
| PS(38:5) | 0.894 | 0.79-0.962 | 1.32E-03 | 1.61 | X | X | X | X | 215.46 ± 51.5 | 66.38 ± 17.26 |
| PS(38:6)a | 0.84 | 0.728-0.935 | 3.62E-03 | 1.23 | X | X | X | 164.04 ± 40.39 | 66.94 ± 16.21 | |
| PS(39:6) | 0.823 | 0.695-0.926 | 0.033 | 1.21 | X | X | 96.45 ± 35.18 | 39.88 ± 10.52 | ||
| PS(40:2) | 0.828 | 0.72-0.926 | 7.94E-03 | 0.75 | X | X | 157.85 ± 32.77 | 91.97 ± 13.65 | ||
| PS(40:5) | 0.82 | 0.691-0.92 | 5.49E-03 | 1.52 | X | 41.86 ± 11.05 | 18.17 ± 5.55 | |||
| PS(40:6) | 0.889 | 0.785-0.981 | 2.08E-03 | 1.06 | X | X | X | 329.08 ± 66.25 | 155.36 ± 27.89 | |
| PS(O-38:5/P-38:4) | 0.875 | 0.777-0.957 | 1.29E-03 | 0.82 | X | X | X | 163.08 ± 24.44 | 94.22 ± 13.23 | |
| PS(O-38:6/P-38:5) | 0.855 | 0.732-0.956 | 2.36E-03 | 0.99 | X | X | X | 361.75 ± 74.27 | 168.69 ± 30.8 |
1 Isomeric lipid molecules resolved by reverse-phase separation (same exact mass 5 Δppm, but different retention time) are differentiated with a lowercase letter after the lipid ID. 2 FDR-adj p-value [73].
Disclaimer/Publisher’s Note: The statements, opinions and data contained in all publications are solely those of the individual author(s) and contributor(s) and not of MDPI and/or the editor(s). MDPI and/or the editor(s) disclaim responsibility for any injury to people or property resulting from any ideas, methods, instructions or products referred to in the content. |
© 2025 by the authors. Licensee MDPI, Basel, Switzerland. This article is an open access article distributed under the terms and conditions of the Creative Commons Attribution (CC BY) license (http://creativecommons.org/licenses/by/4.0/).
Copyright: This open access article is published under a Creative Commons CC BY 4.0 license, which permit the free download, distribution, and reuse, provided that the author and preprint are cited in any reuse.


