
Submitted:
13 January 2025
Posted:
15 January 2025
You are already at the latest version
Abstract
Background: Oligodendrocytes (OLs) are highly sensitive to oxygen-reactive species produced during neuro-inflammation. α7 nAChRs are expressed in glial cells where they can modulate several physiological and pathological functions. OL progenitors (OPCs) respond to cholinergic stimuli via muscarinic receptors that are mainly involved in the modulation of their proliferation. Differently, the role of nicotinic receptors, in particular α7 nAChRs, has been poorly investigated. In this study, we evaluated the expression of α7 nAChRs in a model of OPCs (Oli neu) and the potential effects mediated by their selective activation. Methods: The effects of α7 nAChRs stimulation on cell proliferation and survival were assessed by the MTT assay. RT-PCR and Western blot analysis were used to analyse the expression of α7 nAChRs and proliferative and differentiative markers (PCNA, MBP). The antioxidant and anti-inflammatory properties of α7 nAChRs were analysed evaluating NFR2 expression and ROS levels through DCFDA staining while Oil Red O staining was used for lipid content analysis. Results: The α7 nAChR is expressed both in OPCs and OLs and its stimulation by the selective agonist ICH3 increases cell proliferation without modifying the OLs differentiation capability. Moreover, ICH3 showed anti-inflammatory and antioxidant effects against LPS exposure. Conclusions: The results herein obtained confirm the role of α7 nAChR in the modulation of neuroinflammatory processes as well as their protective effects on OLs
Keywords:
α7 nicotinic receptors
; oligodendrocytes
; cell proliferation
; oxidative agents
; neuroinflammation
1. Introduction
Neuroinflammation is a defensive mechanism activated within the nervous system as a consequence of infections or neurodegeneration, tipically associated to neurological disorders [1]. Glial cells such as astrocytes and microglia participate actively in regulating some neuroinflammatory pathways, but the role played by oligdendocytes (OLs) in this context is still poorly investigated. OLs, the myelinating glial cells of the CNS, are dynamic cells that may contribute to maintain CNS homeostasis [2,3]. In this context, a deeper exploration of the role of OLs in neuroinflammation becomes particularly intriguing.
Several analyses have highlighted that nicotinic acetylcholine receptors (nAChRs) have a new emerging role in regulating neuroinflammation [1]. Evidence of the neuroprotective role of nAChRs was obtained in the rat cerebral cortex, in which the neuroprotective effects were antagonized by mecamylamine, a nAChR antagonist, but not by scopolamine, a muscarinic acetylcholine receptor antagonist [4]. Moreover, some research groups have shown that targeting α7 nAChR subtype provides neuroprotection in neurons and glial cells. In particular, the stimulation of α7 nAChR in the glial cells triggers the activation of the “cholinergic anti-inflammatory pathway”, primarily associated with the activation of the master regulator of oxidative stress, nuclear factor erythroid 2-related factor (NRF2) and heme oxygenase-1 (HO-1) [5,6,7]. Additionally, α7 nAChR modulates other key regulators of inflammation and oxidative stress. For instance, the recruitment of NF-kB nuclear translocation and the phosphorylation of Janus kinase 2 can initiate signal transduction mediated by signal transducer and activator of transcription 3 (STAT3) [8,9,10]. Moreover, it has been demonstrated that the selective activation of α7 nAChR can reduce TNF-α levels and release cyclooxygenase-2 and prostaglandin E2: these effects are counteracted by α-bungarotoxin, confirming the α7 nAChR implication in the modulation of neuroinflammation [11].
Considerable evidence supports the beneficial properties of α7 nAChRs in several models, but the central question remains in understanding the mechanism by which α7 nAChR mediates neuroprotection. For these reasons, the identification of new ligands able to act as selective agonists of the α7 nAChRs is crucial to investigate their function and to identify new potential diagnostic markers and therapeutic targets.
Based on our previous studies, we investigated the effects of α7 nAChR stimulation with the selective agonist ICH3 [12]. The pharmacological profile of this orthosteric α7 agonist was previously studied in different models, among them in rat oxaliplatin-induced neuropathy- to explore the role of α7 nAChR in pain reduction, nervous tissue protection, and glial activation [13]. The effects of ICH3 were also assessed in obesity models, demonstrating the potential role of this ligand in mediating the α7 nAChR anti-inflammatory pathway [14,15]. Moreover, the selective activation of α7 nAChRs by ICH3 in peripheral nerve regeneration contributes to improve Schwann cells (SCs) regenerating properties and to promote a supportive microenvironment [16,17].
Based on our previous results, in this paper we planned to evaluate the effects of α7 nAChR stimulation on various cellular processes, including oligodendrocyte (OLs) proliferation, differentiation, and survival. Additionally, we assessed the antioxidant and anti-inflammatory properties associated to α7 nAChR stimulation through reactive oxygen species (ROS) detection and lipid content analysis.
2. Material and Methods
2.1. Cell Culture
The Oli neu cell line was obtained from Dr Trotter’s laboratory [18]. This is a primary culture enriched in OLs and their precursor cells, derived from the brains of 15-day-old mouse embryos.
After removal of the neurons by immunocytolysis, the line was then immortalized by transfection with a retroviral vector, which encodes for a hybrid protein between the outer domain of the human EGF receptor and neu tyrosine kinase [18,19]. Cells were cultured on poly-l-lysine-coated dishes (100 μg/mL; Sigma-Aldrich, St. Louis MO, USA), in Dulbecco’s Modified Eagle’s Medium (DMEM; Sigma- Aldrich, St. Louis, MO, USA) supplemented with 50 μg/mL of streptomycin, 50 IU/mL of penicillin, 2 mM of glutamine (Immunological sciences, Rome, Italy), 25 μg/mL gentamicin (Sigma-Aldrich, St. Louis, MO, USA), 2% horse serum (Sigma-Aldrich, St. Louis, MO, USA), 10 μg/mL transferrin (Sigma-Aldrich, St. Louis, MO, USA), 10 μg/mL insulin (Sigma-Aldrich, St. Louis, MO, USA), 100 μM putrescine (Sigma-Aldrich, St. Louis, MO, USA), 200 nM progesterone (Sigma-Aldrich, St. Louis, MO, USA), 500 nM triiodothyronine (Sigma-Aldrich, St. Louis, MO, USA), 220 nM sodium selenite (Sigma-Aldrich, St. Louis, MO, USA) and 520 nM l-thyroxine (Sigma-Aldrich, St. Louis, MO, USA). The cell line was maintained at 37 °C in a humidified atmosphere with 10% CO2.
2.2. Pharmacological Treatments
(R)-(-)-3-Methoxy-1-oxa-2,7-diaza-7,10-ethanospiro [4.5]dec-2-ene sesquifumarate (ICH3) was synthesized according to a published procedure [12], and was used at a final concentration of 10 μM. To mimic the inflammatory environment in vitro, Oli neu were treated with lipopolysaccharide (LPS, Sigma-Aldrich, St. Louis, MO, USA), at a final concentration of 1 μg/mL. α-bungarotoxin (α-BTX) at 100 nM concentration was used as selective antagonist of α7 nAChRs [17,20].
2.3. Cell Viability Assay
Cell proliferation was assessed by colorimetric assay based on 3-(4.5-dimethyl thia-zol 2-y1)-2.5-diphenyl tetrazolium bromide (MTT, Sigma-Aldrich, St. Louis, MO, USA) metabolization, according to the protocol optimized by Mosmann [21]. Cells were seeded on poly-l-lysine-coated 96-well plates at a density of 1.2 × 10⁴ cells/well. After 24 h, cells were treated at different experimental time points (ranging from 1 to 4 days in vitro; DIV) with 10 μM ICH3, 100 μM muscarine, 100 nM α-BTX, α-BTX + ICH3; the control is represented by the cells maintained in the culture medium alone.
Muscarine was used as a control, since previous studies have demonstrated the ability of this molecule to stimulate cell proliferation of oligodendrocyte precursors (OPCs).
MTT was dissolved in PBS at 5 mg/mL to obtain the 10× stock solution. The stock solution was diluted (1×), added in each well and then incubated at 37°C for 3 h. A solution of isopropanol, HCl 0.04 M and 1% Triton X-100 was added to all wells and mixed thoroughly to mechanically dissolve the dark blue crystals. For each well, the optical density (OD) at 570 nm was measured by Multiskan FC (Thermofisher Scientific, Waltham, MA, USA).
The possible toxicity of ICH3 and LPS on Oli neu cells was assessed by a viability assay using trypan blue staining. Oli neu cells were treated with 10 μM ICH3, 1 μg/μL LPS + DMSO, ICH3 + LPS for 24, 72, and 120 h. The floating and adherent cells were collected and stained with trypan blue, a dye that stains only dead cells. The percentage of dead cells was analysed by LUNA-FX7TM Automated Cell Counter (Logos Biosystems, Gyeonggi-do, South Korea).
2.4. Morphological analysis
Cells were seeded on poly-l-lysine-coated 60 mm-dishes at a density of 3.5 × 10⁵ cells. After 24 h from seeding, cells were treated with 10 μM ICH3. After 72 h and 120 h treatments, 3 bright-field images for dishfor each experimental condition were analysed by counting the processes emitted by each cell using ImageJ software imaging software (NIH, Bethesda, MD, USA). The experiments were performed in triplicate.
2.5. Total RNA Extraction and RT-PCR Analysis
Total RNA was extracted using TRI Reagent® (Sigma-Aldrich, St. Louis, MO, USA), according to the manufacturer’s instructions. RNA was quantified at NanoDropTM 2000 spectrophotometer (Thermo Fisher Scientific, Waltham, MA, USA). For each sample, 1 μg of total RNA was reverse transcribed using 5× All-In-One RT MasterMix with AccuRT Genomic DNA Removal Kit (Applied Biological Materials Inc., Richmond, CA, USA), according to the manufacturer’s protocol. For each sample, primers and GoTaq® Green Master Mix (Promega Italia, Milan, Italy) were added to 100 ng of cDNA.
The expression of the transcripts was evaluated by semi-quantitative RT-PCR analysis, using the following primers:
a7 nAChR: forward 5′- AACCATGCGCCGTAGGACA-3′
reverse 5′- CTCAGCCACAAGCAGCAGCATGAA -3′
GAPDH: forward 5′-TGGCATTGTGGAAGGGCTCATGA-3′
reverse 5′-ATGCCAGTGAGCTTCCCGTTCAG-3′
2.6. Protein Extraction and Western Blot Analysis
Cells were homogenized in lysis buffer (Tris-EDTA 10 mM, 0.5% NP40, and NaCl 150 mM) containing a protease inhibitor cocktail (Sigma-Aldrich, St. Louis, MO, USA). After protein extraction, the total amount of protein was determined by a Pierce BCA Protein Assay Kit (Thermo Fisher Scientific, Waltham, MA, USA) according to the manufacturer’s protocol. The protein extracts were run on SDS-polyacrilamide gel (SDS-PAGE) and transferred to polyvinylidene difluoride (PVDF) sheets (Merck Millipore, Darmstadt, Germany). Membranes were blocked in 5% non-fat milk powder (Sigma-Aldrich, St. Louis, MO, USA) in PBS containing 0.1% Tween-20 and then incubated overnight at 4°C with one of the following primary antibodies: anti-PCNA (dilution 1:700, Sigma-Aldrich, St. Louis, MO, USA), anti-α7 nAChR antibody (dilution 1:800, Bioss, Woburn, MA, USA), anti-NRF2 (1:1000, Immunological Science, Milan, Italy), anti-α tubulin (1:500, Immunological Science, Milan, Italy) and anti-Histone H3 (1:5000, Abcam, Cambridge, UK). α-Tubulin was used as reference protein for loading control. The blots were washed three times with PBS + 0.1% Tween-20, then incubated with secondary antibodies for 1 h at room temperature (RT): anti-rabbit horseradish peroxidase (1:10,000, Promega, Madison WI, USA) or anti-mouse horseradish peroxidase (1:10,000, Immunological Science, Milan, Italy). Immunoreaction was revealed by ECL chemiluminescence reagent (Immunological Science, Milan, Italy). The bands were detected by exposition to Chemidoc (Molecular Imager ChemiDoc XRS + System with Image Lab Software; Bio-Rad, CA, USA).
2.7. ROS Detection Assay
ROS production was measured using dichloro-dihydro-fluorescein diacetate (DCFDA; Enzo Life Sciences, New York, NY, USA) used as an oxidation substrate.
Cells were seeded on poly-l-lysine-coated 96-well plates at a density of 1 × 10⁴ cells/well. The next day, the cells were incubated with 10 μM ICH3, 1μg/μL LPS, ICH3 + LPS, for 2 h. 20 μM H2O2 was used as positive control.
The ROS scavenger N-acetyl-l-cysteine (NAC; Enzo Life Sciences, New York, NY, USA) at a final concentration of 10 μM was used to inhibit ROS production; it was added 45 min before the pharmacological treatments. Then, the medium was removed, and cells were incubated with 10μM DCFDA for 30 min at RT. The same protocol was used in differentiating cells, 120 h after seeding. The fluorescence was read at wavelengths of 485 nm of excitation and 530 nm of emission using the Glomax Multi Detection System (Promega Italia, Milan, Italy).
2.8. Lipid Droplets Detection Assay
The fat-soluble dye Oil Red O was used to detect lipid droplets (LDs). It has the appearance of a red powder soluble in isopropanol, which dissolves lipid molecules, turning them orange-red in color. Cells were seeded on poly-l-lysine-coated 24-well plates at a density of 3 × 10⁴ cells/well. After 48 h or 120 h of treatment with 10 μM ICH3, 1μg/μL LPS, ICH3 + LPS, the cells were fixed with 4% paraformaldehyde for 20 min at RT and washed five times in PBS in order to remove the dead cells. Then, cells were incubated with the working solution (Oil Red O:dH2O, v/v, 2:3) for 30 min in the dark and washed three times in PBS. Finally, cells were incubated with Hoechst 33342 (1:1000 in PBS, Thermo Scientific, Waltham, MA, USA) for 10 min at RT, for the nuclei counterstaining. At the end, coverslips were fixed on microscope slides with a PBS-glycerol (3:1; v/v) solution. The images were acquired with a Zeiss microscope through the Zen lite software (Zeiss, Oberkochen, Germany). A quantitative analysis can also be obtained from Oil Red O staining by measuring absorbance. Cells were seeded on poly-l-lysine-coated 96-well plates at a density of 1 × 10⁴ cells/well. After 48 h or 120 h, cells were incubated with the working solution (Oil Red O:dH2O, v/v, 2:3) for 30 min in the dark. After 5 washes in dH2O to remove excess of the dye, 50 μL of isopropanol have been added in each well and left stirring for 10 min at RT. LDs quantification was obtained by Clariostar Plus Microplate Reader (BMG Labtech, Ortenberg, Germania); the optical density (OD) was measured at 570 nm.
2.9. Statistical Analysis
Data were presented as the mean ± standard error of the mean (SEM). Student’s t-test or one-way ANOVA tests were used to evaluate statistical significance within the different samples. Results were considered statistically significant at p < 0.05 (*), p < 0.01 (**), p < 0.001 (***) and p < 0.0001 (****). Data analyses were performed with GraphPad Prism 9 (GraphPad Software, La Jolla, CA, USA).
3. Results
3.1. Analysis of α7 nAChR Expression
First, we have analyzed the expression of α7 nAChR after ICH3 agonist treatment in Oli neu cells. ICH3 treatment increases the expression of α7 nAChR transcript (Figure 1A), but not the protein (Figure 1B-C). Furthermore, α7 nAChR expression progressively increases during the maintenance of OPCs in vitro.
3.2. Analysis of Cell Proliferation and Morphology
The MTT assay is commonly used to evaluate cell growth [22,23]; for this purpose, it was used to examine the possible effects of ICH3 on Oli neu cell growth. We evaluated the effect of ICH3 on Oli neu cells after 1-2-3-4 DIV (day in vitro) of treatment, comparing the following experimental conditions: 10 µM ICH3, 100 nM α-BTX, 100 nM α-BTX + 10 µM ICH3, and 100 µM muscarine (MUSC); the control condition consisted of Oli neu cells grown in standard culture medium in absence of cholinergic agonists or antagonists. The α-BTX is a known antagonist of α7 nAChR [24] and therefore was used to evaluate its ability to prevent the ICH3 effects. Muscarine was used as positive control, given that previous studies [23] demonstrated that muscarinic stimulation induced the proliferation of oligodendrocyte precursors. We found that ICH3 treatment, as well as muscarine treatment, significantly increased cell growth, compared to the control condition (Figure 2A). As expected, the pro-proliferative effects of ICH3 was counteracted by α-bungarotoxin, which did not show significant changes when used alone (Figure 2A).
This result was further supported by the increase of Proliferating Cell Nuclear Antigen (PCNA) protein expression in Oli neu cells treated with 10 µM ICH3 for 72 h, as indicated by Western blot analysis (Figure 2B). Indeed, PCNA is specifically expressed in actively replicating cells; it is a cofactor of DNA polymerase δ and increases the synthesis of the guide-strand during DNA replication [25]. Even in this case, α-bungarotoxin alone had no significant effect on PCNA protein expression level compared to the control condition and fully reverted the ICH3 pro-proliferative action when used in combination with the α7 agonist (Figure 2B).
To evaluate the effect of ICH3 treatment on Oli neu cell morphology, the reorganization of the cytoskeleton leading to the extension of cellular processes was investigated, as previously described [26]. After 72 h and 120 h of treatment with 10 µM ICH3 or vehicle (culture medium, ctrl), the morphology of Oli neu cells was analysed by counting the number of processes emitted by each cell in both experimental conditions (Figure 2C). Oli neu cells as well as the OPCs underwent a progressive and spontaneous differentiation if cultured in the presence of thyroid hormones [27]. In line with this outcome, we observed a progressive increase in the number of processes in the control condition, comparing Oli neu cells at 72 h and 120 h of culture. Instead, no significant difference in Oli cell processes branching after ICH3 treatment was observed neither at 72 h nor at 120 h compared to the respective control conditions (Figure 2C-E). In order to verify the putative effects of ICH3 on OL differentiation, we evaluated the expression of Myelin Basic Protein (MBP), a typical myelin protein expressed by Ols, by Western blot analysis. As reported in Figure 2F, the MBP is expressed at very low levels in OPCs at 24 h of culture. However, as expected, its expression increases after 120 h of culture, confirming a spontaneous differentiation of Oli neu cells when maintained in culture in complete medium. Interestingly the agonist ICH3 did not modify the MBP expression neither at 24 or 120 h of culture.
3.3. Analysis of the Antioxidant Properties Mediated by α7 nAChR Activation
The antioxidant properties of ICH3 have been previously demonstrated [14,16], as well as the specific increase of reactive oxygen species (ROS) intracellular levels induced by LPS [28,29]. Figure 3 shows the effect of ICH3 treatment analyzed on LPS-stimulated Oli neu cells after 24 h and 120 h in culture. The intracellular ROS production was evaluated by dichloro-dihydro-fluorescein diacetate (DCFDA) staining and the ROS scavenger N-acetyl-l-cysteine (NAC) was used for counteracting the ROS increase. As expected, LPS treatment strongly enhanced ROS levels also in Oli neu cells thanks to the Toll-like receptor 4 expression [3,30]. The ROS increase was observed at both the experimental time points considered (24 h and 120 h) as representative of two different stage of OL differentiation (Figure 3B,D). Instead, in the presence of both NAC and ICH3, the LPS-induced ROS levels were significantly reduced. On the other hand, as a positive control of the experiment, the Oli neu cells were also treated with H2O2 (20 µM), which is known to trigger oxidative stress [31]. As shown in Figure 3A and 3C, after 24h and 120h respectively, H2O2 caused a significant increase of ROS levels, albeit to a lower extent than in LPS treated cells. NAC was able to counteract the H2O2-induced ROS increase.
To establish if nAChR stimulation has effects on cell viability after LPS treatment, we evaluated the percentage of cell death after 1μg/mL LPS in the presence or absence of 10 μM ICH3 after 24 h and 120 h of culture. As shown in Figure 3, the treatment with LPS induces an increase in the percentage of dead cells both at 24 h and 120 h (Figure 3E, F). When added alone, ICH3 does not induce significant variation on cell death and in combination with LPS does not modify the percentage of LPS-induced dead cells both in OPCs (at 24 h of culture) and in more diffentiated OLs (120 h).
Measurement of ROS levels by DCFDA staining in Oli neu cells under the following experimental conditions: 1μg/mL LPS, 10 μM ICH3, and 1μg/mL LPS + 10 μM ICH3, in the presence or absence of NAC (10 μM). Cells were analysed after 24 h (B) or 120 h (D) from seeding to evaluate the responses of OPCs or pro-OL cells in different experimental conditions. H2O2 (20 μM) treatment was a positive control both in cells maintained in culture for 24 h (A) and 120h (C). Data are presented as mean ± SEM of five independent experiments performed in sextuplicate. One-way ANOVA test followed by the Turkey multiple comparison post-test statistically compared the different experimental conditions (**p < 0.01, ***p < 0.001, ****p < 0.0001).
Cell viability in Oli neu cells after LPS and ICH3 treatment. Oli neu cells were plated in sextuplicate and treated with complete medium (CTRL), ICH3 10 μM, LPS 1 μg/mL and LPS + ICH3. After 24 h (E) and 120 h (F) of treatment, the cells were counted using trypan blue dye. The graph, showing the percentage of dead cells, was obtained from the average ± SEM of three independent experiments.
Considering that the anti-oxidant and anti-inflammatory system is regulated by Nrf2/Keap1 [32], protein expression levels of Nrf2 were analyzed by immunoblotting at 4 h after treatment with LPS and ICH3. As reported in Figure 4A, a decrease in Nrf2 protein was observed in cytoplasmic extracts of cells treated with ICH3 in the presence of LPS. Under oxidative stress, Nrf2 is phosphorylated and moves from the cytoplasm to the nucleus by disrupting the complex with Keap1 [33,34]. Thereby, Nrf2 translocation was analysed by Western blot in nuclear extracts obtained by the same samples used to evaluate the cytoplasmic expression of NFR2. The results showed that, in CTRL condition, Nrf2 is largely expressed in the cytoplasm, and lower levels are present in the nuclei. In the presence of LPS the levels of NRF2 in the cytoplasm and nuclei are comparable, while when ICH3 is present with LPS the amount of Nrf2 in the cytoplasm decreases while increases in the nuclei.
3.4. Analysis of ICH3 Effects on Lipid Content in Oli Neu Cells
The role of lipid droplets (LDs) in lipid metabolism is well known, but in recent years these organelles have become relevant also in the cellular stress response, including inflammation [35].
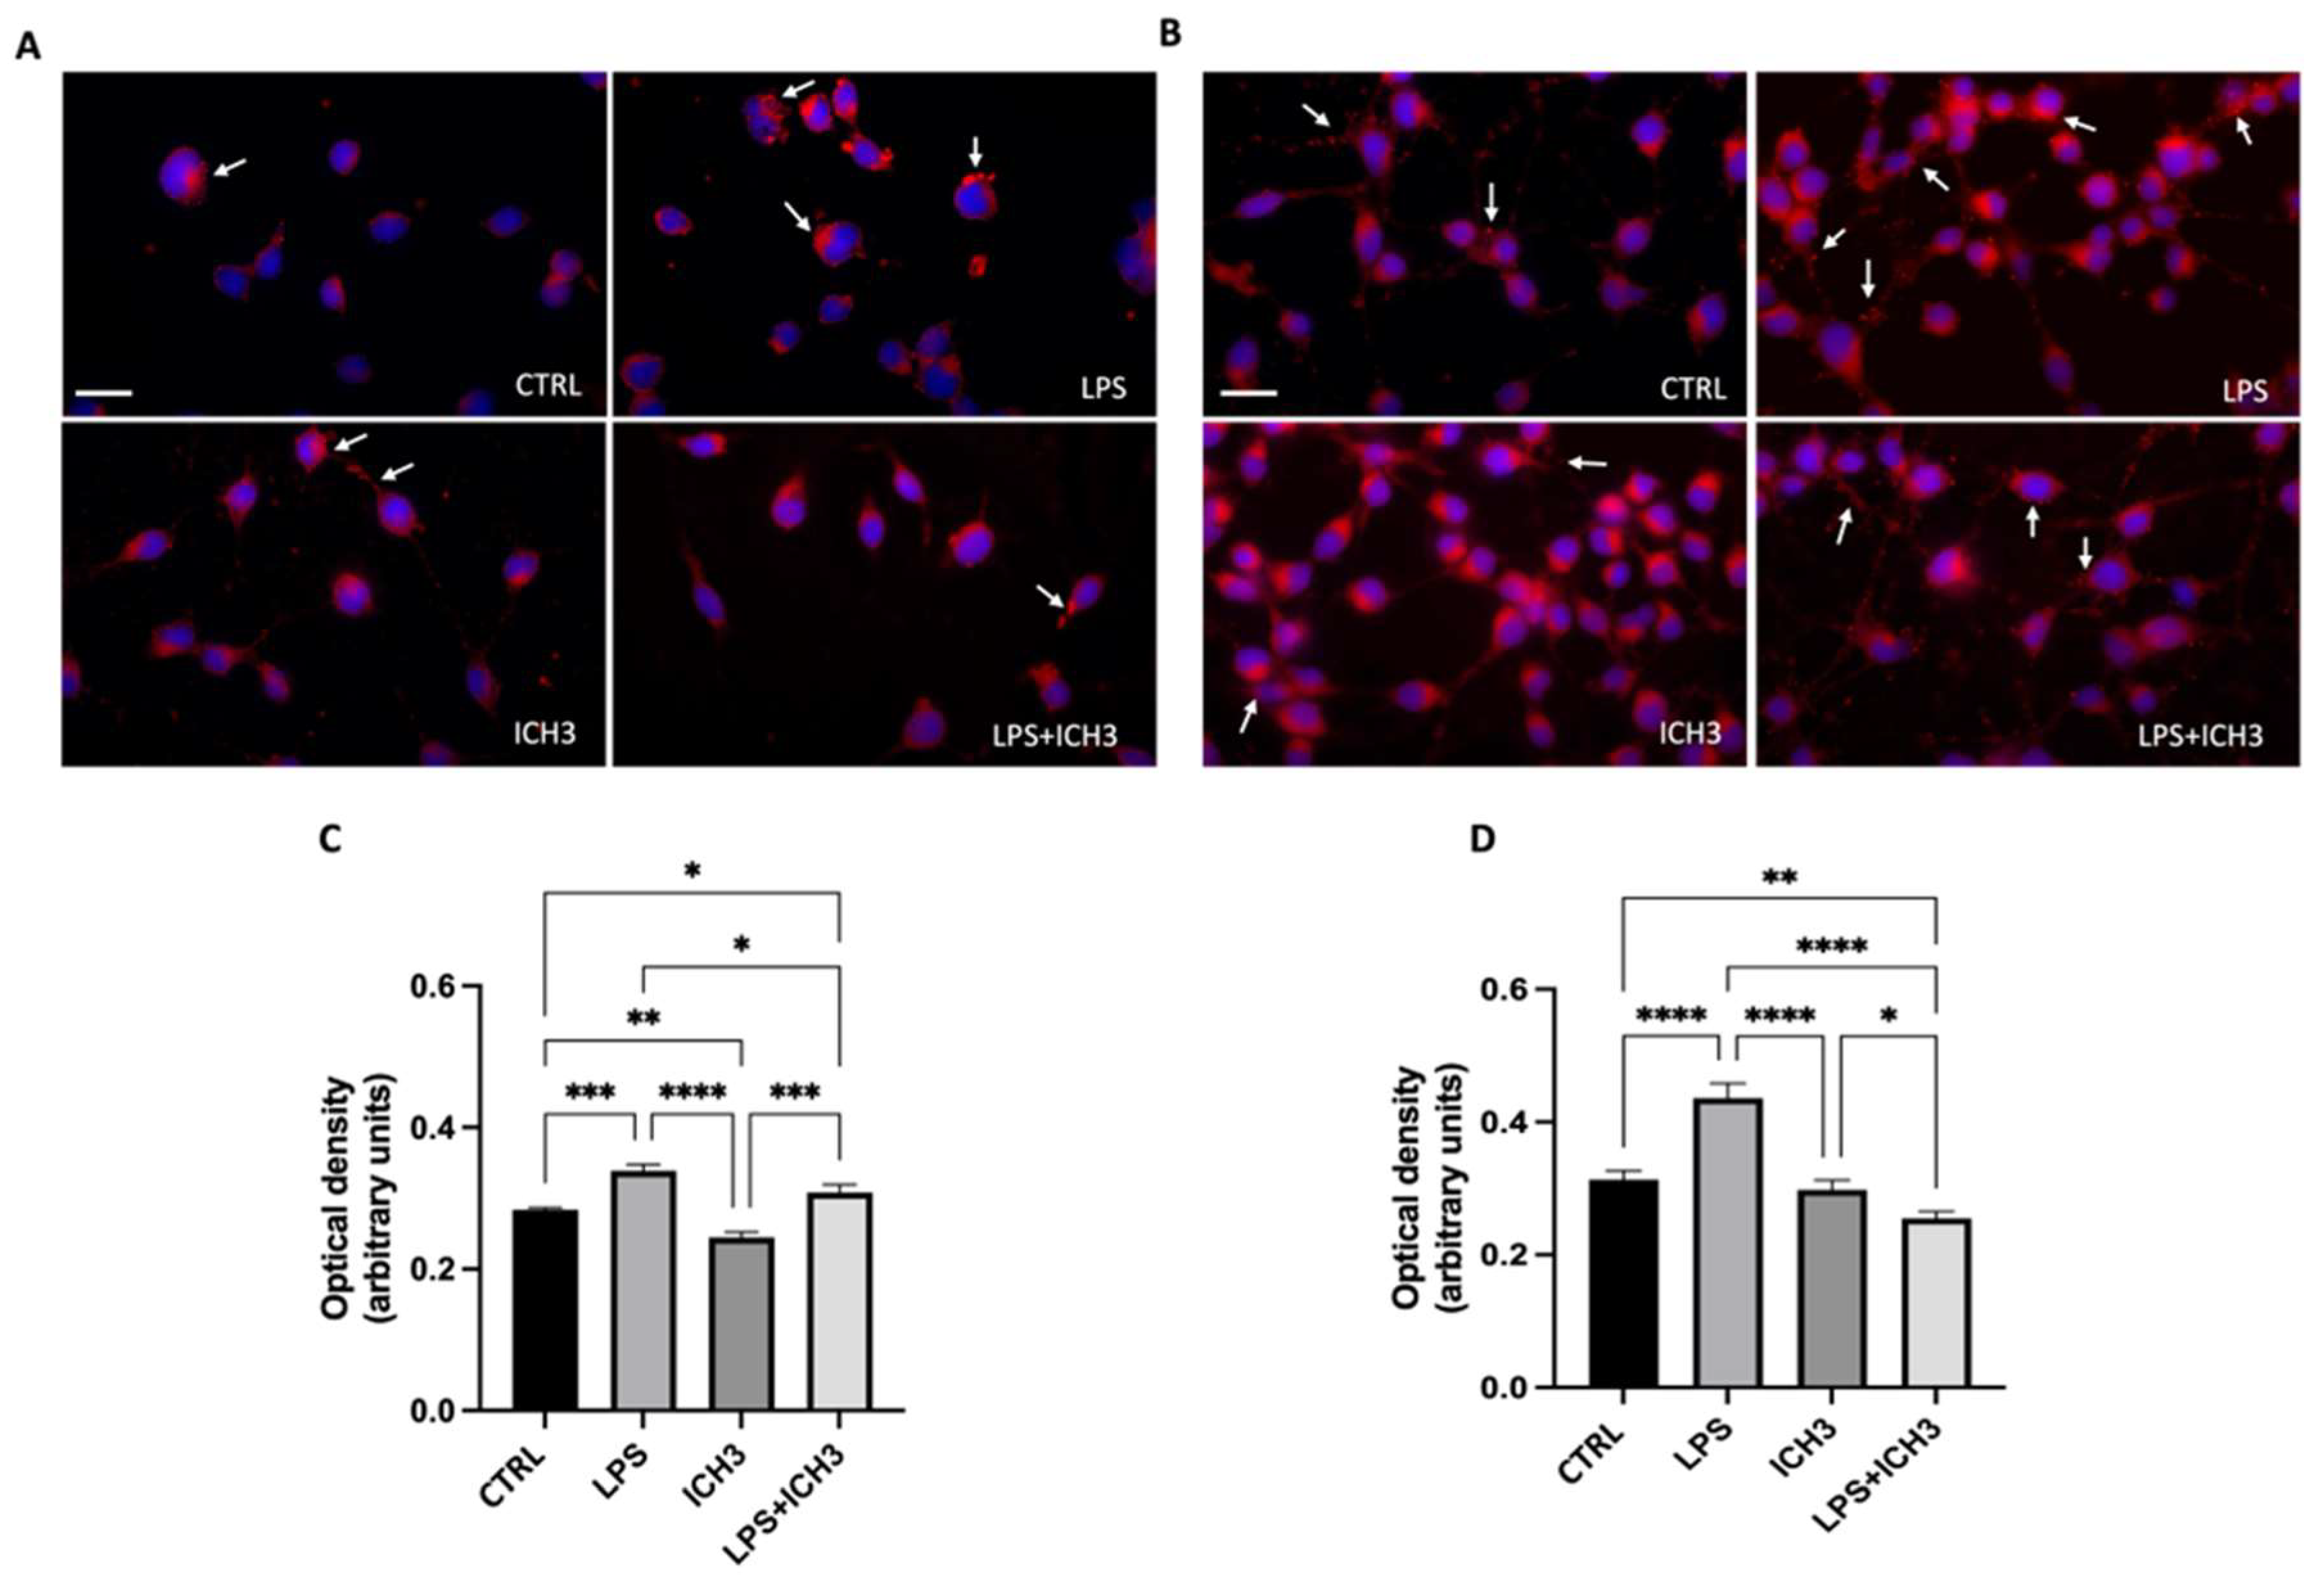
After analysis of ROS intracellular levels, we evaluated the content of LDs in Oli neu cells after inflammatory stimulation (LPS treatment), in the presence or absence of 10µM ICH3 at 48 h (Figure 5A, C) and 120 h (Figure 5 B, D). Cells were treated with LPS 1 μg/mL, ICH3 10 μM or LPS + ICH3 10 μM for 48 h and 120 h to compare the amount of LDs in Oli neu cells at different stages of OL differentiation by staining with Oil Red O. Through qualitative and quantitative analysis, we observed that, as expected, the amount of LDs was increased after LPS treatment. ICH3 alone did not lead to large changes compared to the untreated cells. After 48 h, ICH3 was able to reduce LD levels in the presence of LPS (Figure 5C), albeit the effects were more evident in pro-OLs (120 h in culture) (Figure 5D).
4. Discussion
Whereas the ability of OL progenitors (OPCs) to respond to cholinergic stimuli via muscarinic acetylcholine receptors is well known [36], the role of nAChRs is still poorly understood. In the present study, we assessed the expression of α7 nAChRs in Oli neu cell line, a representative murine OPCs in vitro model, and investigated the potential effects of their selective activation. To this end, we took advantage of ICH3, a selective α7 nAChR agonist prepared and formerly tested by our research group, as an example for its anti-inflammatory properties in various cell models, among which rat Schwann cells [16,17]. Indeed, it has been shown that the α7 nAChR is involved in the cholinergic anti-inflammatory pathway, enhancing the production of anti-inflammatory cytokines and suppressing the activity of mononuclear phagocytes, such as dendritic cells and macrophages [37]. As previously demonstrated, Oli neu cells express O4 and Claudin-11, two OLs’ markers [26], and progressively differentiate if cultured in thyroid hormones-supplemented medium [27]. Therefore, all the experiments performed in this study were carried out over time points ranging from 24 h to 120 h, to put in evidence any potential difference related to the differentiation state of Oli neu cells.
The analysis of α7 nAChR expression following ICH3 agonist treatment in Oli-neu cells revealed intriguing results regarding the regulation of this receptor at the transcript and protein levels. Our findings indicate that ICH3 treatment leads to a significant upregulation of α7 nAChR mRNA expression, suggesting a selective enhancement of the transcriptional activity. Notably, despite the increased mRNA levels, this upregulation does not translate into a corresponding increase in protein expression (Figure 1). This discrepancy between mRNA and protein expression suggests potential post-transcriptional or translational regulatory mechanisms that limit the production or stability of the α7 nAChR protein. The lack of a parallel increase in protein expression also points to the possibility of feedback mechanisms within the cells that modulate receptor protein levels, preventing an excessive accumulation that could alter cellular homeostasis. Additionally, we found a progressive increase in α7 nAChR expression observed during the maintenance of OPCs in vitro, suggesting a time-dependent regulation of this receptor during OLs maturation.
We also demonstrate that ICH3 induced a significant increase of Oli neu cell growth, strengthening the pro-proliferative effect mediated by muscarine, as known also from a previous study [2]. The proliferation rate was studied by the MTT assay, at different experimental times ranging from 1 to 4 DIV. According to the MTT results, we found an increased expression of PCNA in ICH3-treated cells. Indeed, PCNA is predominantly expressed in proliferating cells and plays a crucial role in DNA replication and repair. By contrast, the treatment of Oli neu cells with the α7 nAChR antagonist α-BTX completely counteracted the ICH3 pro-proliferative effect as well as the PCNA increase, confirming that these effects are to a large extent dependent on the selective activation of α7 nAChRs (Figure 1) [4].
However, this boost in cell growth does not correlate with an acceleration of Oli neu differentiation, as assessed by the mean number of cellular processes and the level of MBP expression, a typical myelin protein localized in mature OLs. In fact , we did not find any differences in cell branching between ICH3-treated and untreated cells, neither at 72 h nor at 120 h of culture. On the contrary, we detected a significant overall trend in cell processing increase comparing the two different time points of culture, thus confirming the capability of Oli neu to progressively differentiate in the presence of thyroid hormones. Accordingly, also the MBP expression in Oli neu cells (both in ICH3-treated cells and in control samples) significantly increased from 24 h to 120 h in culture, albeit it was not influenced by ICH3 (Figure 2).
OLs are highly susceptible to oxidative stress and the antioxidant properties of ICH3 have already been demonstrated [14,16]. Our previous studies indicated that OPCs as well as Oli neu cells can respond to LPS treatment by engaging TRL4, which activates the transcription of pro-inflammatory cytokines, including IL-6 and TNF-α [3,30]. Given the connection between inflammatory response and ROS production, we tested the effects of ICH3 treatment after exposure of Oli neu cells to LPS, resulting in an in vitro inflammatory microenvironment. We measured the intracellular ROS levels in the ICH3-treated and untreated cells. As expected, we found that LPS (as well as H2O2) significantly increased ROS levels in Oli neu cells and that this inflammatory action was counteracted by the ROS scavenger NAC. We also found that ICH3 was able to reduce the LPS-induced ROS levels, substantiating its known antioxidant properties (Figure 3). Moreover, we observed that our α7 nAChR agonist was also able to regulate the activation of Nrf2, as proved by the Nrf2 translocation from the cytoplasm to the nuclei of the Oli neu cells. In fact, the early stimulation of Oli neu cells with LPS caused a significant increase of Nrf2 both in the nuclei and in the cytoplasm, but interestingly the presence of ICH3 both alone and in combination with LPS, caused a significant increase of Nrf2 in the nuclei, suggesting an activation of the antioxidant agent following LPS stimulation (Figure 4).
Since we had previously demonstrated that LPS has an effect on cell death in Oli neu cells [26], we examinedwhether ICH3 was able to counteract the LPS effects. We analysed the cell death after LPS stimulation with or without ICH3. Interestingly, we confirmed that LPS significantly increased cell death both in OPCs (1 DIV) and in more differentiated OLs (4 DIV); however,α7 nAChR stimulation by ICH3 did not induce cell death and the combined administration of ICH-3 with LPS did not counteract the LPS-mediated effects.
Given the considerable advances in understanding lipid homeostasis in the CNS as well as the involvement of LDs in various neurodegenerative diseases [38], we evaluated LD accumulation using Oil Red O staining under control conditions and after treatment with LPS, ICH3, or both. As expected, quantitative and qualitative analyses revealed increased LD accumulation following LPS exposure, an effect that was significantly reduced by ICH3 treatment at 48 h and, even more evidently, at 120 h of culture, when more differentiated OLs contain a higher lipid amount, potentially useful for myelination processes. Collectively, our data show that the selective activation of α7 nAChR is able to decrease both the ROS levels and the amount of LDs induced by the inflammatory stimulus of LPS, probably through the NRF2 regulator factor activation. In general, the antioxidant and anti-inflammatory effects of ICH3 were more pronounced after 120 h of culture as a possible consequence of the increased levels of α7 nAChR expression in more differentiated OLs.
5. Conclusions
OLs are particularly sensitive to oxidant agents able to impair their survival. The results discussed in this paper demonstrate that OLs are capable to respond to inflammatory microenvironment, contributing to modulate the neuroinflammatory processes. The presence of α7 nAChRs in OPCs and OLs might exert a protective role for these cells, in particular during inflammatory events. In fact, we show that the selective activation of α7 nAChRs counteracts the LPS-induced ROS and LDs production and promotes Nrf2 translocation in the nuclei. Thus, our data suggest a potential role of α7 nAChRs in the homeostasis reestablishment and in reducing neuroinflammation. Moreover. we found that α7 nAChRs promote the OPC proliferation without modifying the spontaneous ability of OPCs to differentiate in pro-OLs. This outcome may have a strategic role to stimulate the production of new oligodendrocyte precursors able to rescue the potentially lost OLs during inflammatory processes. These and other previous results confirm the neuroprotective role of α7 nAChRs and further highlight their ability to modulate the “cholinergic anti-inflammatory pathway” involving also OLs.
Author Contributions
Conceptualization: A.M.T. Methodology: C.G.; G.P; T.D.M. ICH3 synthesis: C.D.; C.M. Formal analysis: C.G.; G.P.; G.S. Investigation: C.G.; G.P.; T.D.M. Data curation: C.G.; G.P. Writing original draft preparation, C.G.; G.P.; G.S. Writing, review and editing: A.M.T. All authors have read and agreed to the published version of the manuscript.
Funding
This research received no external funding.
Institutional Review Board Statement
Not applicable.
Informed Consent Statement
Not applicable.
Acknowledgments
The authors are grateful to Prof. Marco de Amici for his comments and revision. The research was supported by Ateneo Sapienza funds and by MIUR CIB 2019 to A.M.T.
Conflicts of Interest
The authors declare no conflicts of interest.
References
- Piovesana, R.; Salazar Intriago, M.S.; Dini, L.; Tata, A.M. Cholinergic Modulation of Neuroinflammation: Focus on A7 Nicotinic Receptor. Int. J. Mol. Sci. 2021, 22, 4912. [Google Scholar] [CrossRef] [PubMed]
- Kim, Y.S.; Joh, T.H. Microglia, Major Player in the Brain Inflammation: Their Roles in the Pathogenesis of Parkinson’s Disease. Exp. Mol. Med. 2006, 38, 333–347. [Google Scholar] [CrossRef]
- Rosa, P.M.; Martins, L.A.M.; Souza, D.O.; Quincozes-Santos, A. Glioprotective Effect of Resveratrol: An Emerging Therapeutic Role for Oligodendroglial Cells. Mol. Neurobiol. 2018, 55, 2967–2978. [Google Scholar] [CrossRef]
- Takada, Y.; Yonezawa, A.; Kume, T.; Katsuki, H.; Kaneko, S.; Sugimoto, H.; Akaike, A. Nicotinic Acetylcholine Receptor-Mediated Neuroprotection by Donepezil Against Glutamate Neurotoxicity in Rat Cortical Neurons. J. Pharmacol. Exp. Ther. 2003, 306, 772–777. [Google Scholar] [CrossRef] [PubMed]
- Egea, J.; Buendia, I.; Parada, E.; Navarro, E.; León, R.; Lopez, M.G. Anti-Inflammatory Role of Microglial Alpha7 nAChRs and Its Role in Neuroprotection. Biochem. Pharmacol. 2015, 97, 463–472. [Google Scholar] [CrossRef] [PubMed]
- Shytle, R.D.; Mori, T.; Townsend, K.; Vendrame, M.; Sun, N.; Zeng, J.; Ehrhart, J.; Silver, A.A.; Sanberg, P.R.; Tan, J. Cholinergic Modulation of Microglial Activation by A7 Nicotinic Receptors. J. Neurochem. 2004, 89, 337–343. [Google Scholar] [CrossRef] [PubMed]
- Yuen, T.J.; Silbereis, J.C.; Griveau, A.; Chang, S.M.; Daneman, R.; Fancy, S.P.J.; Zahed, H.; Maltepe, E.; Rowitch, D.H. Oligodendrocyte-Encoded HIF Function Couples Postnatal Myelination and White Matter Angiogenesis. Cell 2014, 158, 383–396. [Google Scholar] [CrossRef]
- De Jonge, W.J.; Van Der Zanden, E.P.; The, F.O.; Bijlsma, M.F.; Van Westerloo, D.J.; Bennink, R.J.; Berthoud, H.-R.; Uematsu, S.; Akira, S.; Van Den Wijngaard, R.M.; et al. Stimulation of the Vagus Nerve Attenuates Macrophage Activation by Activating the Jak2-STAT3 Signaling Pathway. Nat. Immunol. 2005, 6, 844–851. [Google Scholar] [CrossRef]
- Guerra-Álvarez, M.; Moreno-Ortega, A.J.; Navarro, E.; Fernández-Morales, J.C.; Egea, J.; López, M.G.; Cano-Abad, M.F. Positive Allosteric Modulation of Alpha-7 Nicotinic Receptors Promotes Cell Death by Inducing Ca 2+ Release from the Endoplasmic Reticulum. J. Neurochem. 2015, 133, 309–319. [Google Scholar] [CrossRef] [PubMed]
- Tracey, K.J. The Inflammatory Reflex. Nature 2002, 420, 853–859. [Google Scholar] [CrossRef]
- De Simone, R.; Ajmone-Cat, M.; Carnevale, D.; Minghetti, L. Activation of A7 Nicotinic Acetylcholine Receptor by Nicotine Selectively Up-Regulates Cyclooxygenase-2 and Prostaglandin E2 in Rat Microglial Cultures. J. Neuroinflammation 2005, 2, 4. [Google Scholar] [CrossRef]
- Dallanoce, C.; Magrone, P.; Matera, C.; Frigerio, F.; Grazioso, G.; De Amici, M.; Fucile, S.; Piccari, V.; Frydenvang, K.; Pucci, L.; et al. Design, Synthesis, and Pharmacological Characterization of Novel Spirocyclic Quinuclidinyl-Δ 2 -Isoxazoline Derivatives as Potent and Selective Agonists of A7 Nicotinic Acetylcholine Receptors. ChemMedChem 2011, 6, 889–903. [Google Scholar] [CrossRef] [PubMed]
- Di Cesare Mannelli, L.; Pacini, A.; Matera, C.; Zanardelli, M.; Mello, T.; De Amici, M.; Dallanoce, C.; Ghelardini, C. Involvement of A7 nAChR Subtype in Rat Oxaliplatin-Induced Neuropathy: Effects of Selective Activation. Neuropharmacology 2014, 79, 37–48. [Google Scholar] [CrossRef] [PubMed]
- Scabia, G.; Cancello, R.; Dallanoce, C.; Berger, S.; Matera, C.; Dattilo, A.; Zulian, A.; Barone, I.; Ceccarini, G.; Santini, F.; et al. ICH3, a Selective Alpha7 Nicotinic Acetylcholine Receptor Agonist, Modulates Adipocyte Inflammation Associated with Obesity. J. Endocrinol. Invest. 2020, 43, 983–993. [Google Scholar] [CrossRef]
- Pernarella, M.; Piovesana, R.; Matera, C.; Faroni, A.; Fiore, M.; Dini, L.; Reid, A.J.; Dallanoce, C.; Tata, A.M. Effects Mediated by the A7 Nicotinic Acetylcholine Receptor on Cell Proliferation and Migration in Rat Adipose-Derived Stem Cells. Eur. J. Histochem. 2020, 64. [Google Scholar] [CrossRef]
- Salazar Intriago, M.S.; Piovesana, R.; Matera, A.; Taggi, M.; Canipari, R.; Fabrizi, C.; Papotto, C.; Matera, C.; De Amici, M.; Dallanoce, C.; et al. The Mechanisms Mediated by A7 Acetylcholine Nicotinic Receptors May Contribute to Peripheral Nerve Regeneration. Molecules 2021, 26, 7668. [Google Scholar] [CrossRef] [PubMed]
- Botticelli, E.; Guerriero, C.; Fucile, S.; De Stefano, M.E.; Matera, C.; Dallanoce, C.; De Amici, M.; Tata, A.M. A7 Nicotinic Acetylcholine Receptors May Improve Schwann Cell Regenerating Potential via Metabotropic Signaling Pathways. Cells 2023, 12, 1494. [Google Scholar] [CrossRef]
- Jung, M.; Krämer, E.; Grzenkowski, M.; Tang, K.; Blakemore, W.; Aguzzi, A.; Khazaie, K.; Chlichlia, K.; Von Blankenfeld, G.; Kettenmann, H.; et al. Lines of Murine Oligodendroglial Precursor Cells Immortalized by an Activated Neu Tyrosine Kinase Show Distinct Degrees of Interaction with Axons In Vitro and In Vivo. Eur. J. Neurosci. 1995, 7, 1245–1265. [Google Scholar] [CrossRef] [PubMed]
- Trotter, J.; Schachner, M. Cells Positive for the O4 Surface Antigen Isolated by Cell Sorting Are Able to Differentiate into Astrocytes or Oligodendrocytes. Dev. Brain Res. 1989, 46, 115–122. [Google Scholar] [CrossRef]
- Wilson, P.T.; Hawrot, E.; Lentz, T.L. Distribution of Alpha-Bungarotoxin Binding Sites over Residues 173-204 of the Alpha Subunit of the Acetylcholine Receptor. Mol. Pharmacol. 1988, 34, 643–650. [Google Scholar]
- Mosmann, T. Rapid Colorimetric Assay for Cellular Growth and Survival: Application to Proliferation and Cytotoxicity Assays. J. Immunol. Methods 1983, 65, 55–63. [Google Scholar] [CrossRef] [PubMed]
- Sylvester, P.W. Optimization of the Tetrazolium Dye (MTT) Colorimetric Assay for Cellular Growth and Viability. Methods Mol. Biol. Clifton NJ 2011, 716, 157–168. [Google Scholar] [CrossRef]
- De Angelis, F.; Bernardo, A.; Magnaghi, V.; Minghetti, L.; Tata, A.M. Muscarinic Receptor Subtypes as Potential Targets to Modulate Oligodendrocyte Progenitor Survival, Proliferation, and Differentiation. Dev. Neurobiol. 2012, 72, 713–728. [Google Scholar] [CrossRef]
- Deneris, E.S.; Connolly, J.; Rogers, S.W.; Duvoisin, R. Pharmacological and Functional Diversity of Neuronal Nicotinic Acetylcholine Receptors. Trends Pharmacol. Sci. 1991, 12, 34–40. [Google Scholar] [CrossRef] [PubMed]
- Boehm, E.M.; Gildenberg, M.S.; Washington, M.T. The Many Roles of PCNA in Eukaryotic DNA Replication. In The Enzymes; Elsevier, 2016; Vol. 39, pp. 231–254 ISBN 978-0-12-804735-4.
- Guerriero, C.; Puliatti, G.; Di Marino, T.; Tata, A.M. Effects Mediated by Dimethyl Fumarate on In Vitro Oligodendrocytes: Implications in Multiple Sclerosis. Int. J. Mol. Sci. 2022, 23, 3615. [Google Scholar] [CrossRef] [PubMed]
- Ahlgren, S.C.; Wallace, H.; Bishop, J.; Neophytou, C.; Raff, M.C. Effects of Thyroid Hormone on Embryonic Oligodendrocyte Precursor Cell Developmentin Vivoandin Vitro. Mol. Cell. Neurosci. 1997, 9, 420–432. [Google Scholar] [CrossRef] [PubMed]
- Shah, S.A.; Khan, M.; Jo, M.; Jo, M.G.; Amin, F.U.; Kim, M.O. Melatonin Stimulates the SIRT 1/Nrf2 Signaling Pathway Counteracting Lipopolysaccharide ( LPS )-Induced Oxidative Stress to Rescue Postnatal Rat Brain. CNS Neurosci. Ther. 2017, 23, 33–44. [Google Scholar] [CrossRef] [PubMed]
- Kahremany, S.; Babaev, I.; Gvirtz, R.; Ogen-Stern, N.; Azoulay-Ginsburg, S.; Senderowitz, H.; Cohen, G.; Gruzman, A. Nrf2 Activation by SK-119 Attenuates Oxidative Stress, UVB, and LPS-Induced Damage. Skin Pharmacol. Physiol. 2019, 32, 173–181. [Google Scholar] [CrossRef]
- Li, Y.; Du, X.; He, B. Lipopolysaccharide Upregulates the Expression of CINC-3 and LIX in Primary NG2 Cells. Neurochem. Res. 2016, 41, 1448–1457. [Google Scholar] [CrossRef] [PubMed]
- Ward, J.F.; Evans, J.W.; Limoli, C.L.; Calabro-Jones, P.M. Radiation and Hydrogen Peroxide Induced Free Radical Damage to DNA. Br. J. Cancer. Suppl. 1987, 8, 105–112. [Google Scholar]
- Tu, W.; Wang, H.; Li, S.; Liu, Q.; Sha, H. The Anti-Inflammatory and Anti-Oxidant Mechanisms of the Keap1/Nrf2/ARE Signaling Pathway in Chronic Diseases. Aging Dis. 2019, 10, 637–651. [Google Scholar] [CrossRef]
- Kobayashi, A.; Kang, M.-I.; Okawa, H.; Ohtsuji, M.; Zenke, Y.; Chiba, T.; Igarashi, K.; Yamamoto, M. Oxidative Stress Sensor Keap1 Functions as an Adaptor for Cul3-Based E3 Ligase To Regulate Proteasomal Degradation of Nrf2. Mol. Cell. Biol. 2004, 24, 7130–7139. [Google Scholar] [CrossRef] [PubMed]
- Yamamoto, T.; Suzuki, T.; Kobayashi, A.; Wakabayashi, J.; Maher, J.; Motohashi, H.; Yamamoto, M. Physiological Significance of Reactive Cysteine Residues of Keap1 in Determining Nrf2 Activity. Mol. Cell. Biol. 2008, 28, 2758–2770. [Google Scholar] [CrossRef] [PubMed]
- Jarc, E.; Petan, T. A Twist of FATe: Lipid Droplets and Inflammatory Lipid Mediators. Biochimie 2020, 169, 69–87. [Google Scholar] [CrossRef]
- Fields, R.D.; Dutta, D.J.; Belgrad, J.; Robnett, M. Cholinergic Signaling in Myelination. Glia 2017, 65, 687–698. [Google Scholar] [CrossRef]
- Gatta, V.; Mengod, G.; Reale, M.; Tata, A.M. Possible Correlation between Cholinergic System Alterations and Neuro/Inflammation in Multiple Sclerosis. Biomedicines 2020, 8, 153. [Google Scholar] [CrossRef] [PubMed]
- Ralhan, I.; Chang, C.-L.; Lippincott-Schwartz, J.; Ioannou, M.S. Lipid Droplets in the Nervous System. J. Cell Biol. 2021, 220, e202102136. [Google Scholar] [CrossRef] [PubMed]
Figure 1.
(A) RT-PCR analysis of α7 nAChR transcript levels in Oli neu cells in CTRL or upon 24 h of 10 µM ICH3 treatment. GAPDH was used as the housekeeping gene. The gel reported is representative of three independent experiments. Densitometric analysis was obtained from the mean ± SEM of three independent experiments. Student’s t-test was used to statistically compare the different experimental conditions (*p < 0.05). (B,C) Western blot analysis of α7 expression in Oli neu cells in CTRL or upon 24 h or 120 h of 10 µM ICH3 treatment. α-Tubulin was used as an internal reference protein. The figures are representative of three independent experiments. Densitometric analysis was obtained from the mean ± SEM of three experiments. Student’s t-test was used to statistically compare the different experimental conditions (n.s, p > 0.05 ctrl vs ICH3 at 24 h and 120 h).
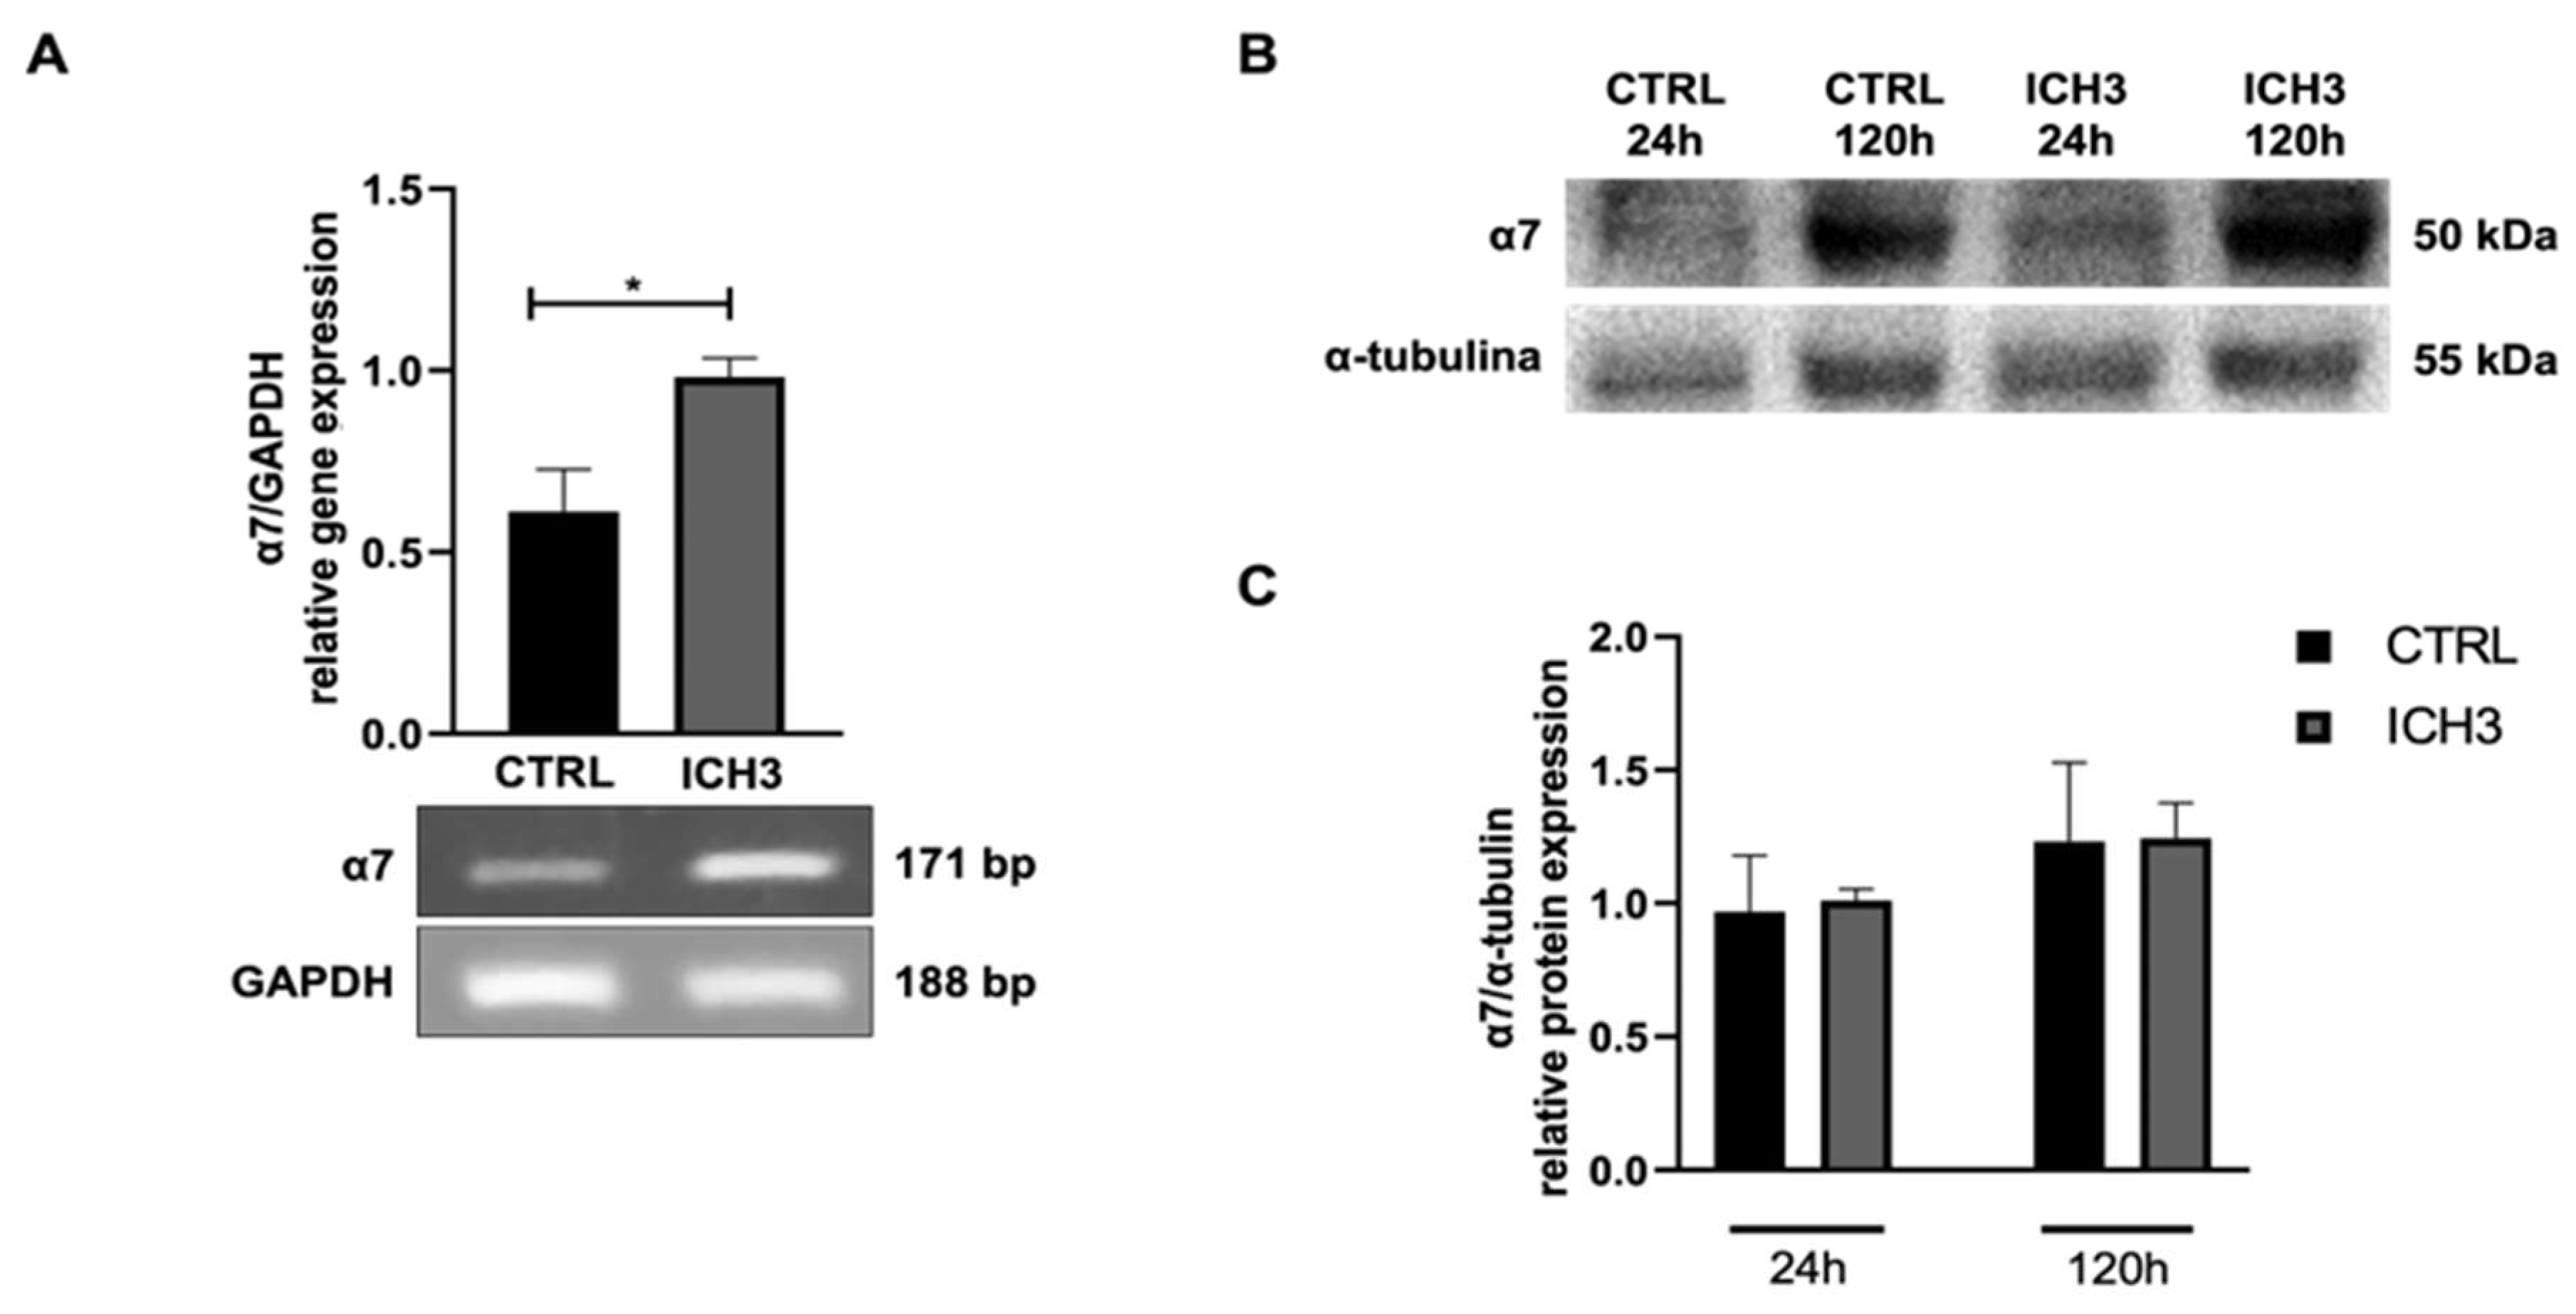
Figure 2.
(A) Analysis of Oli neu cells growth by MTT assay in the control condition (CTRL, culture medium) and after treatment with 10 µM ICH3, 100 nM α-BTX, 100 nM α-BTX + 10 µM ICH3, and 100 µM MUSC (1, 2, 3, 4 DIV; days in vitro). Data are presented as mean ± SEM of three independent experiments performed in quadruplicate. Student’s t-test was used to statistically compare the vehicle and treatment condition at each different experimental time (*p < 0.05, ***p < 0.001, ****p < 0.0001). (B) Representative Western blot for PCNA protein expression in Oli neu cells treated for 72 h as follows: CTRL (culture medium), 10 µM ICH3, 100 nM α-bungarotoxin, and 100 nM α-bungarotoxin + 10 µM ICH3. α-Tubulin was used as internal reference protein. Densitometric analysis shown in the graph was obtained from three independent experiments. Student’s t-test was used to statistically compare the different experimental conditions (*p < 0.05). (C) Representative images of Oli neu cells after 72 h or 120 h in the control condition or after 10 µM ICH3 treatment. Scale bar: 40 µm. (D,E) In the graphs are reported the number of branching/cell in the different experimental conditions at 72 h and 120 h of treatment, respectively. Number of cells analysed at 72 h = 201 (in CTRL condition) and 138 (with ICH3 treatment); number of cells analyzed at 120 h = 722 (in Ctrl condition) and 643 (in the presence of ICH3). Student’s t-test was used to statistically compare CTRL and ICH3 treated cells at 72 h of treatment. (F) Representative Western blot for MBP protein expression in Oli neu cells maintained for 24 h or 120 h in culture in the absence or presence of 10 µM ICH3. α-Tubulin was used as reference protein. The graph reported the densitometric analysis obtained from three independent experiments. No significant difference was observed in CTRL and ICH3 condition at both time points analyzed.
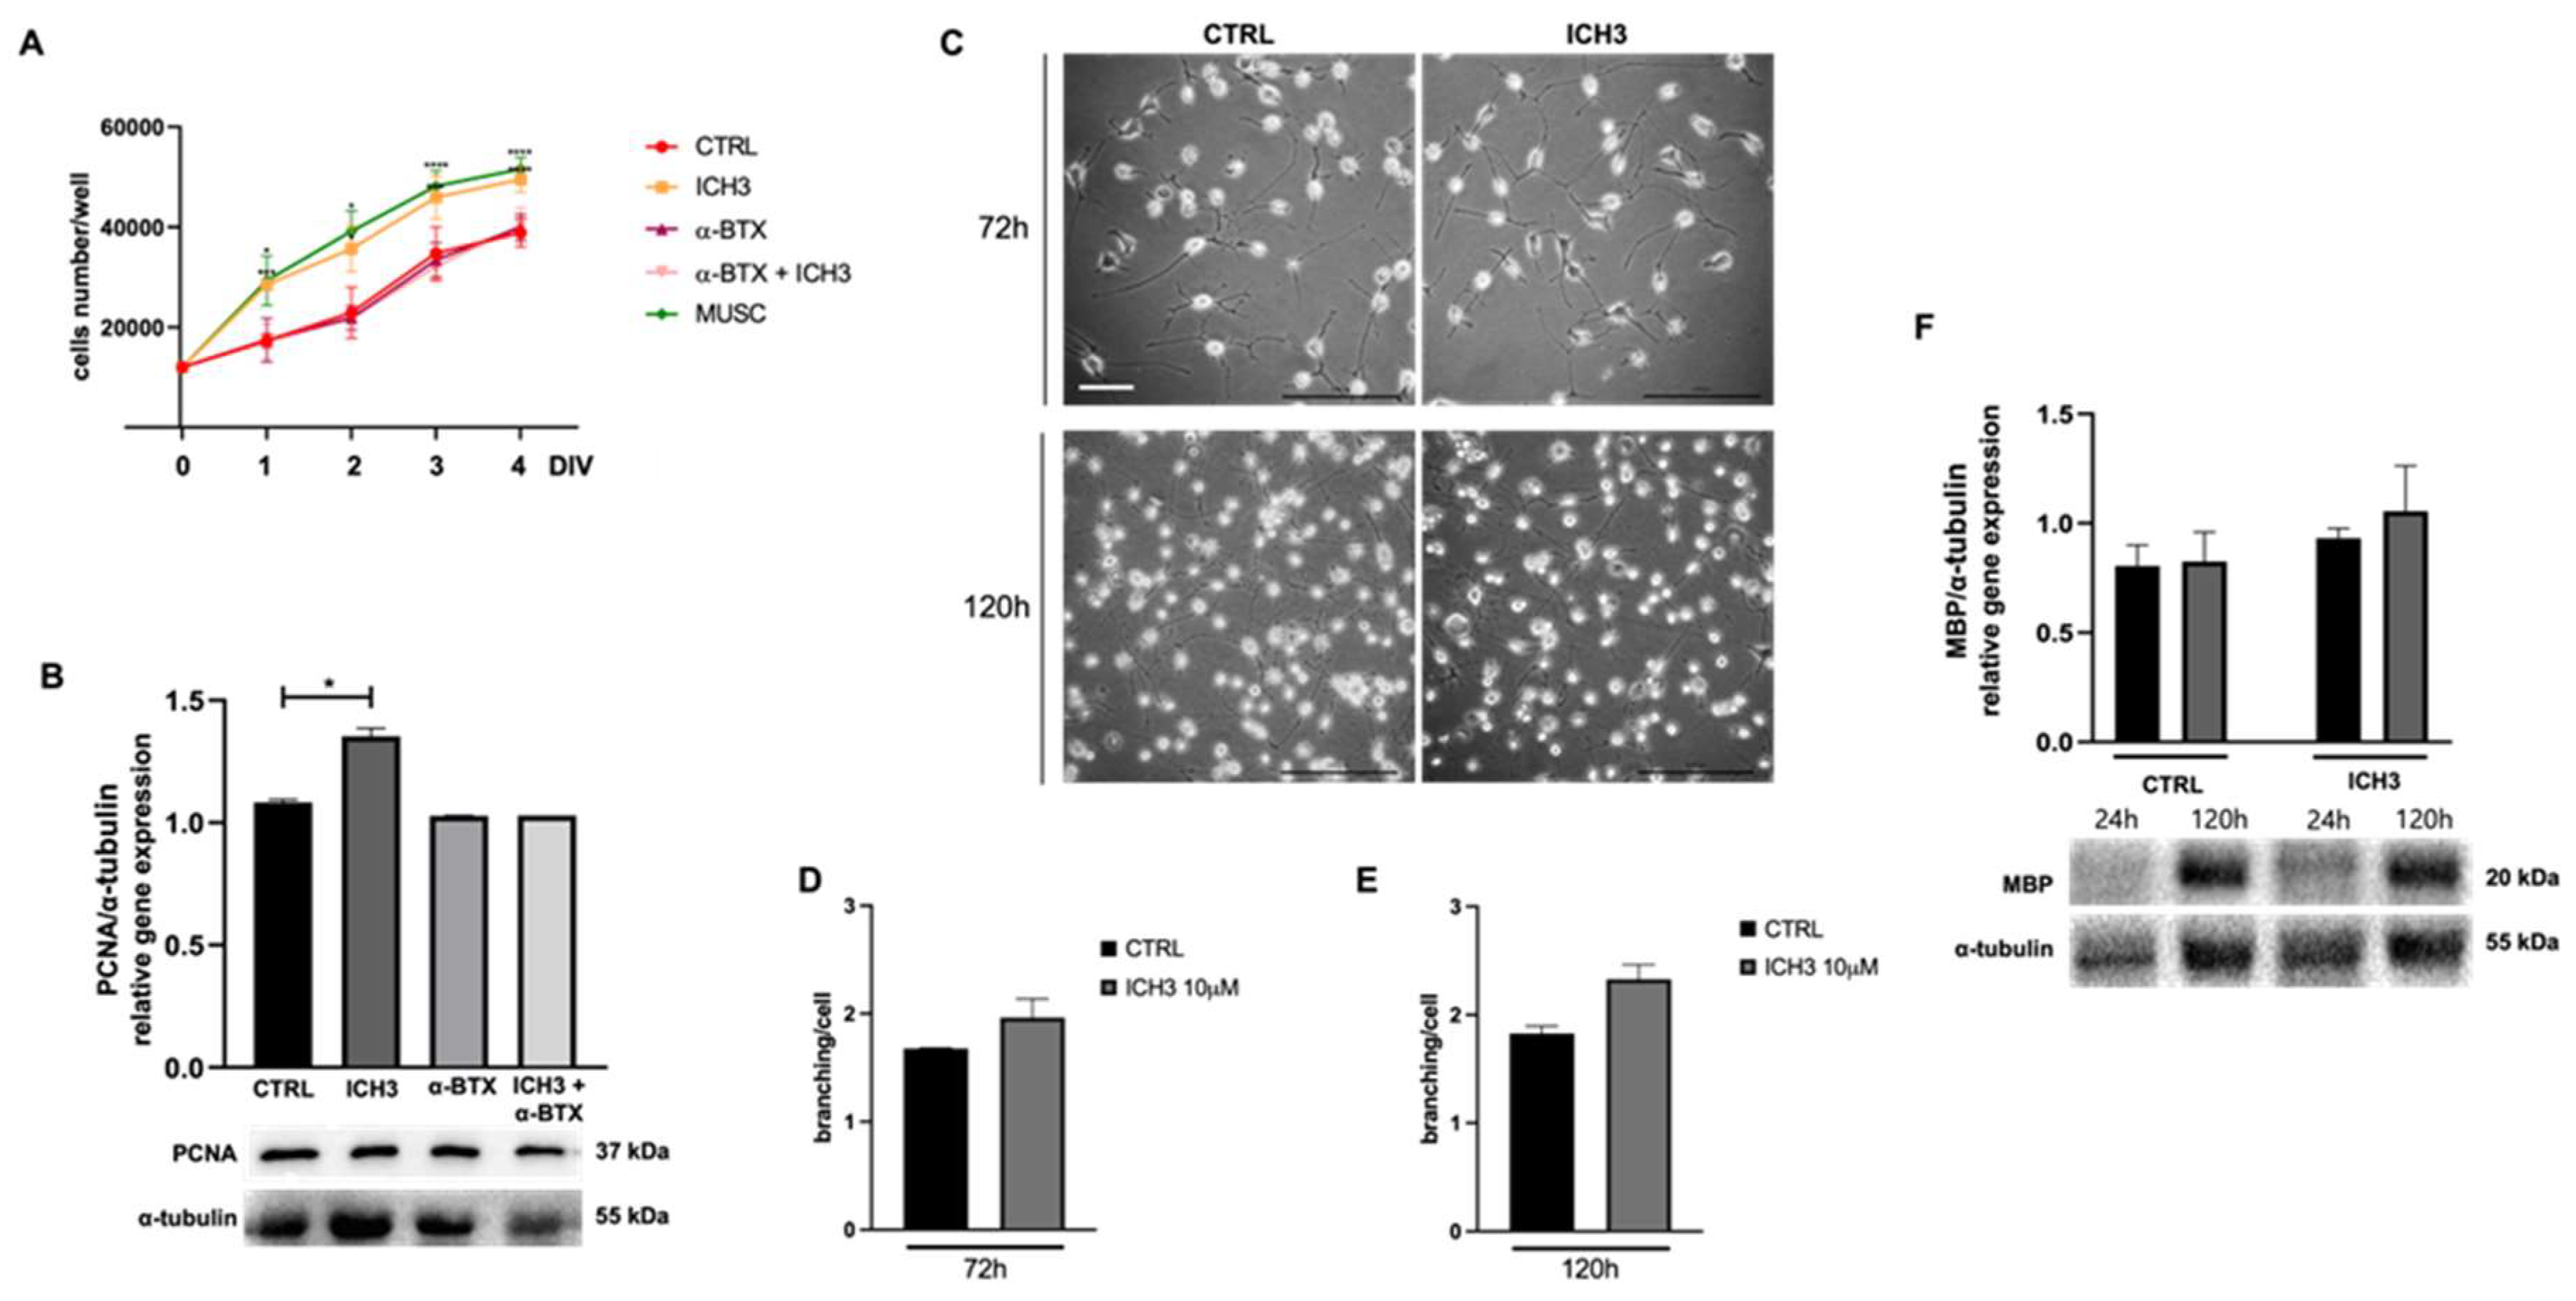
Figure 3.
Anti-Oxidant Properties Mediated by α7 nicotinic agonist in Oli Neu Cells.
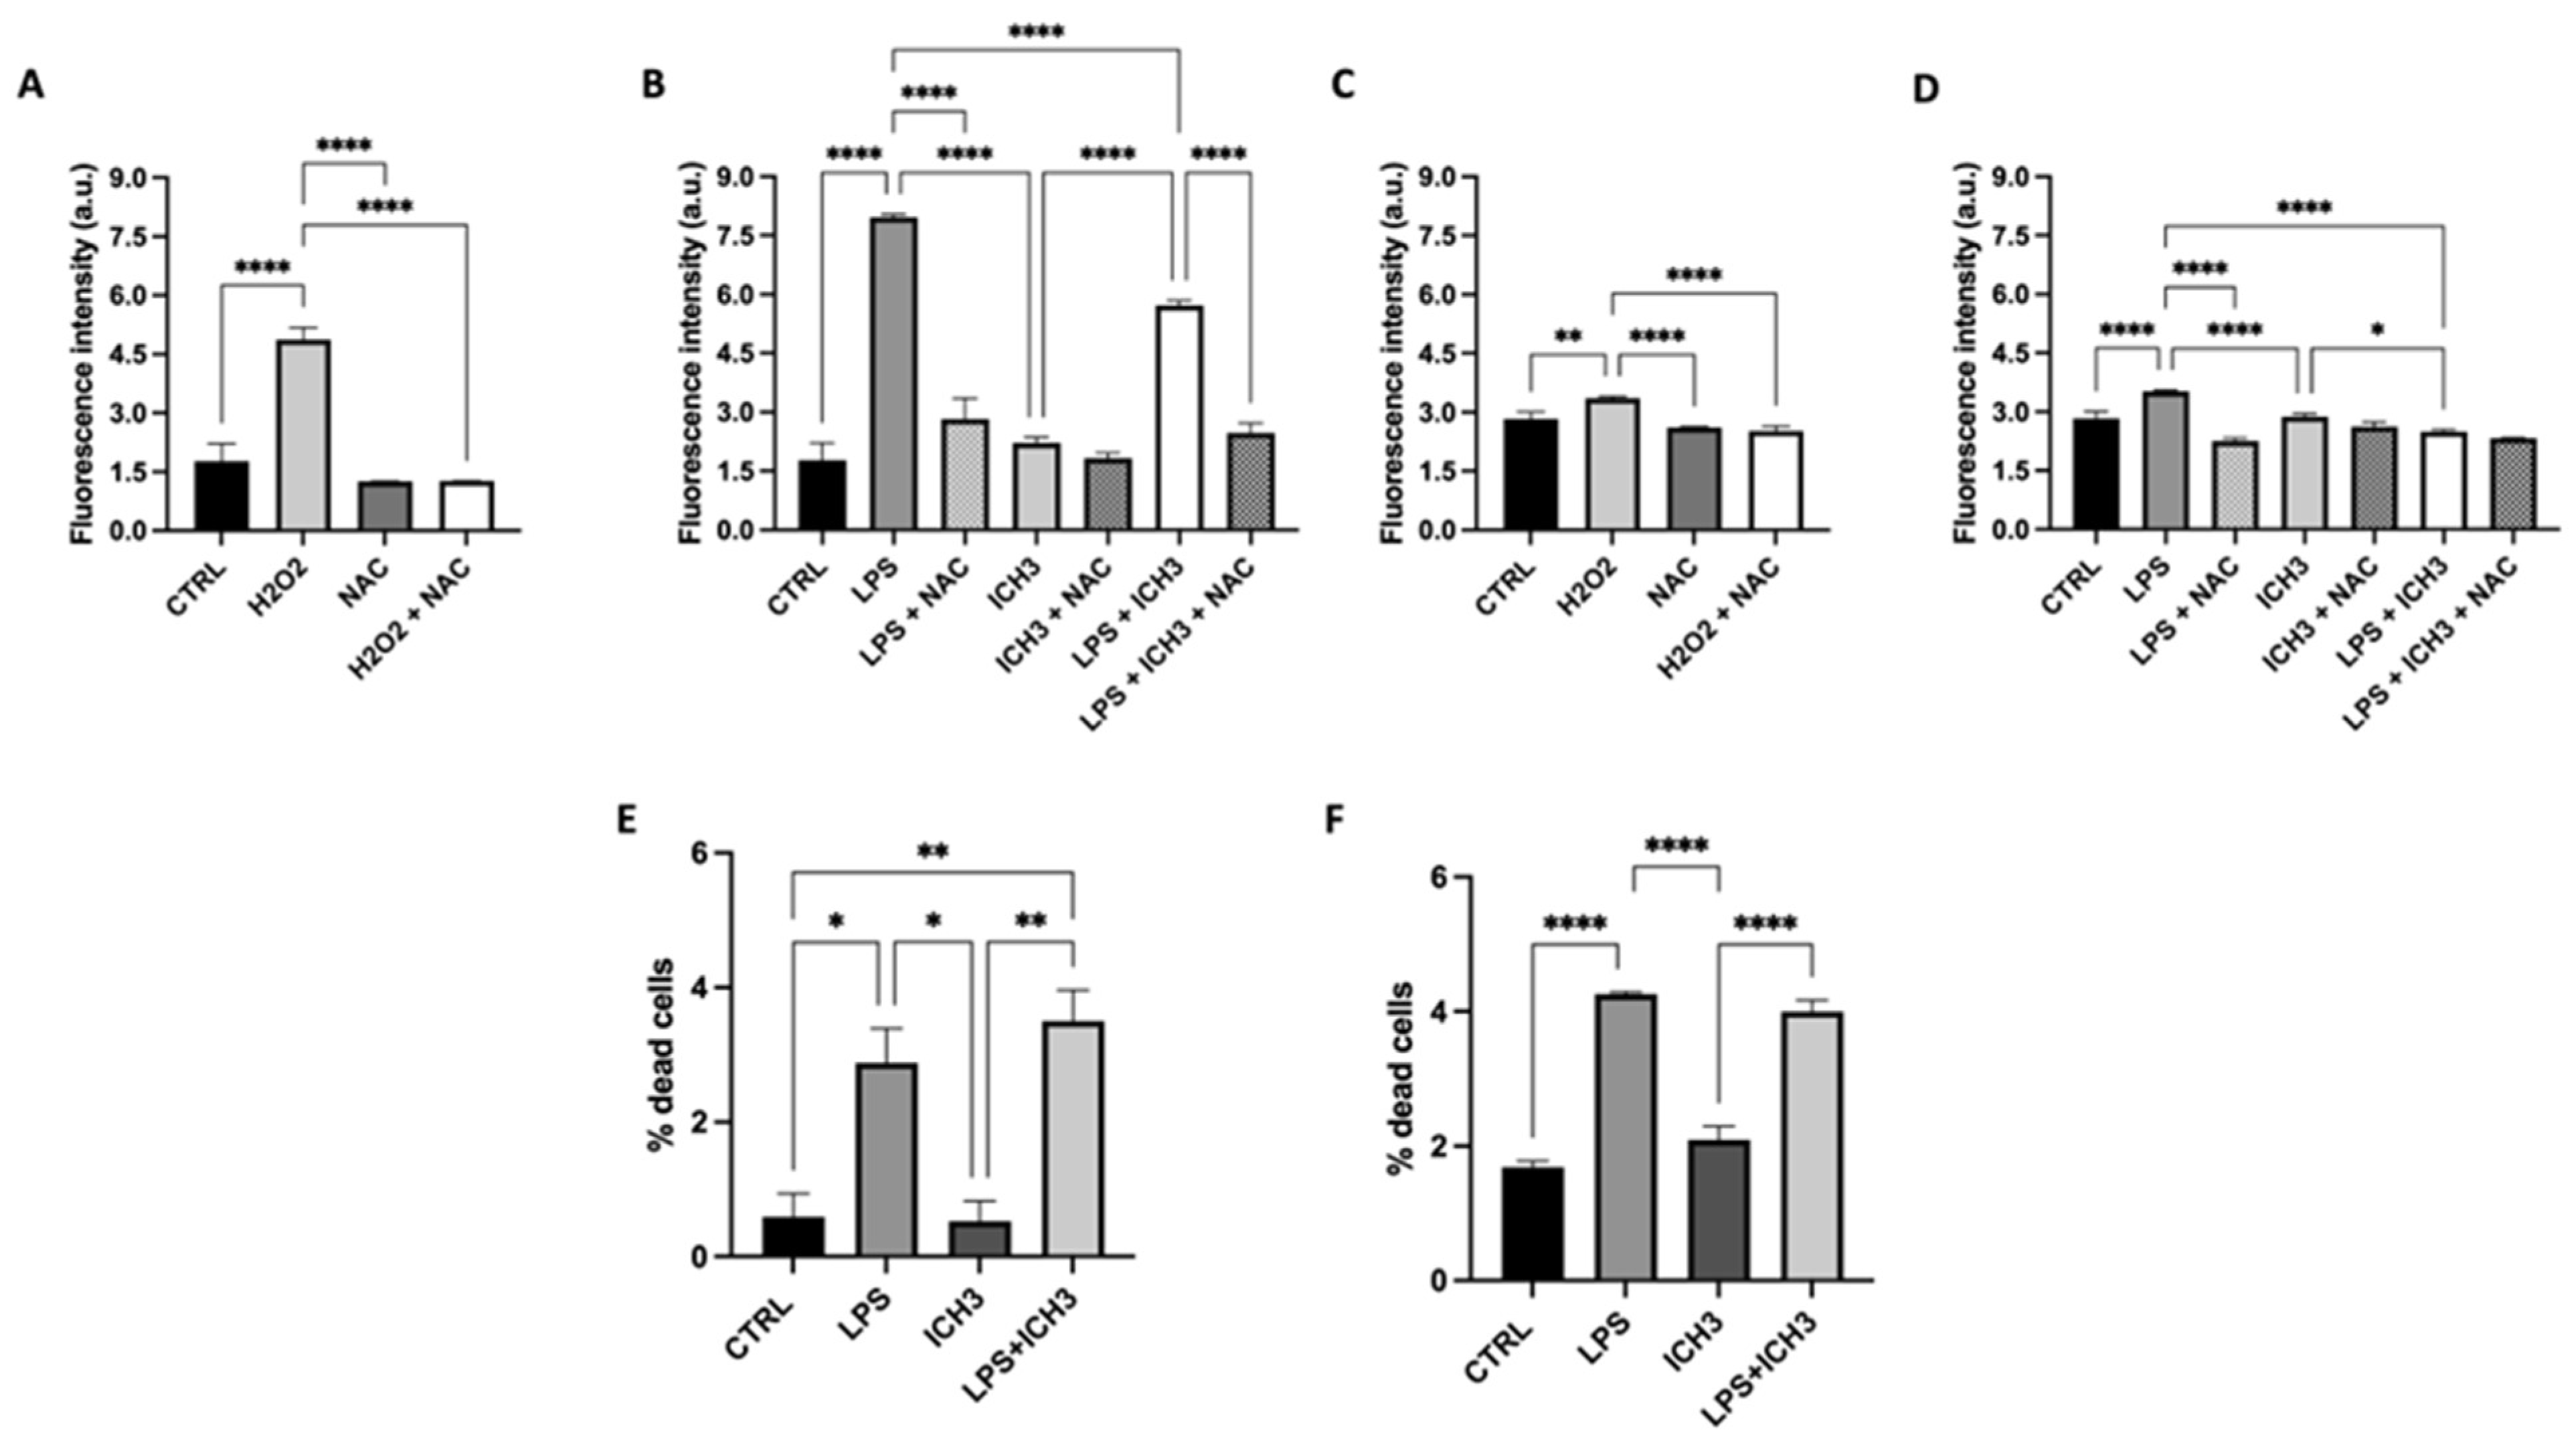
Figure 4.
Represenattive Western blot for protein expression of NRF2 in (A) cytoplasmic and (B) nuclear extracts of Oli neu cells after 4 h of treatment under the following experimental conditions: CTRL (untreated cells), 1 μg/mL LPS, 10 μM ICH3 and 1 μg/mL LPS + 10 μM ICH3. α-Tubulin and Histone H3 were used as cytoplasmic and nuclear reference proteins, respectively. Densitometric analysis showed in the graphs was obteined from three independent experiments ± SEM. One way ANOVA test follow by the Tukey multiple comparison post-hoc test was used to statistically compare the different experimental conditions (*p < 0.05; **p < 0.01).
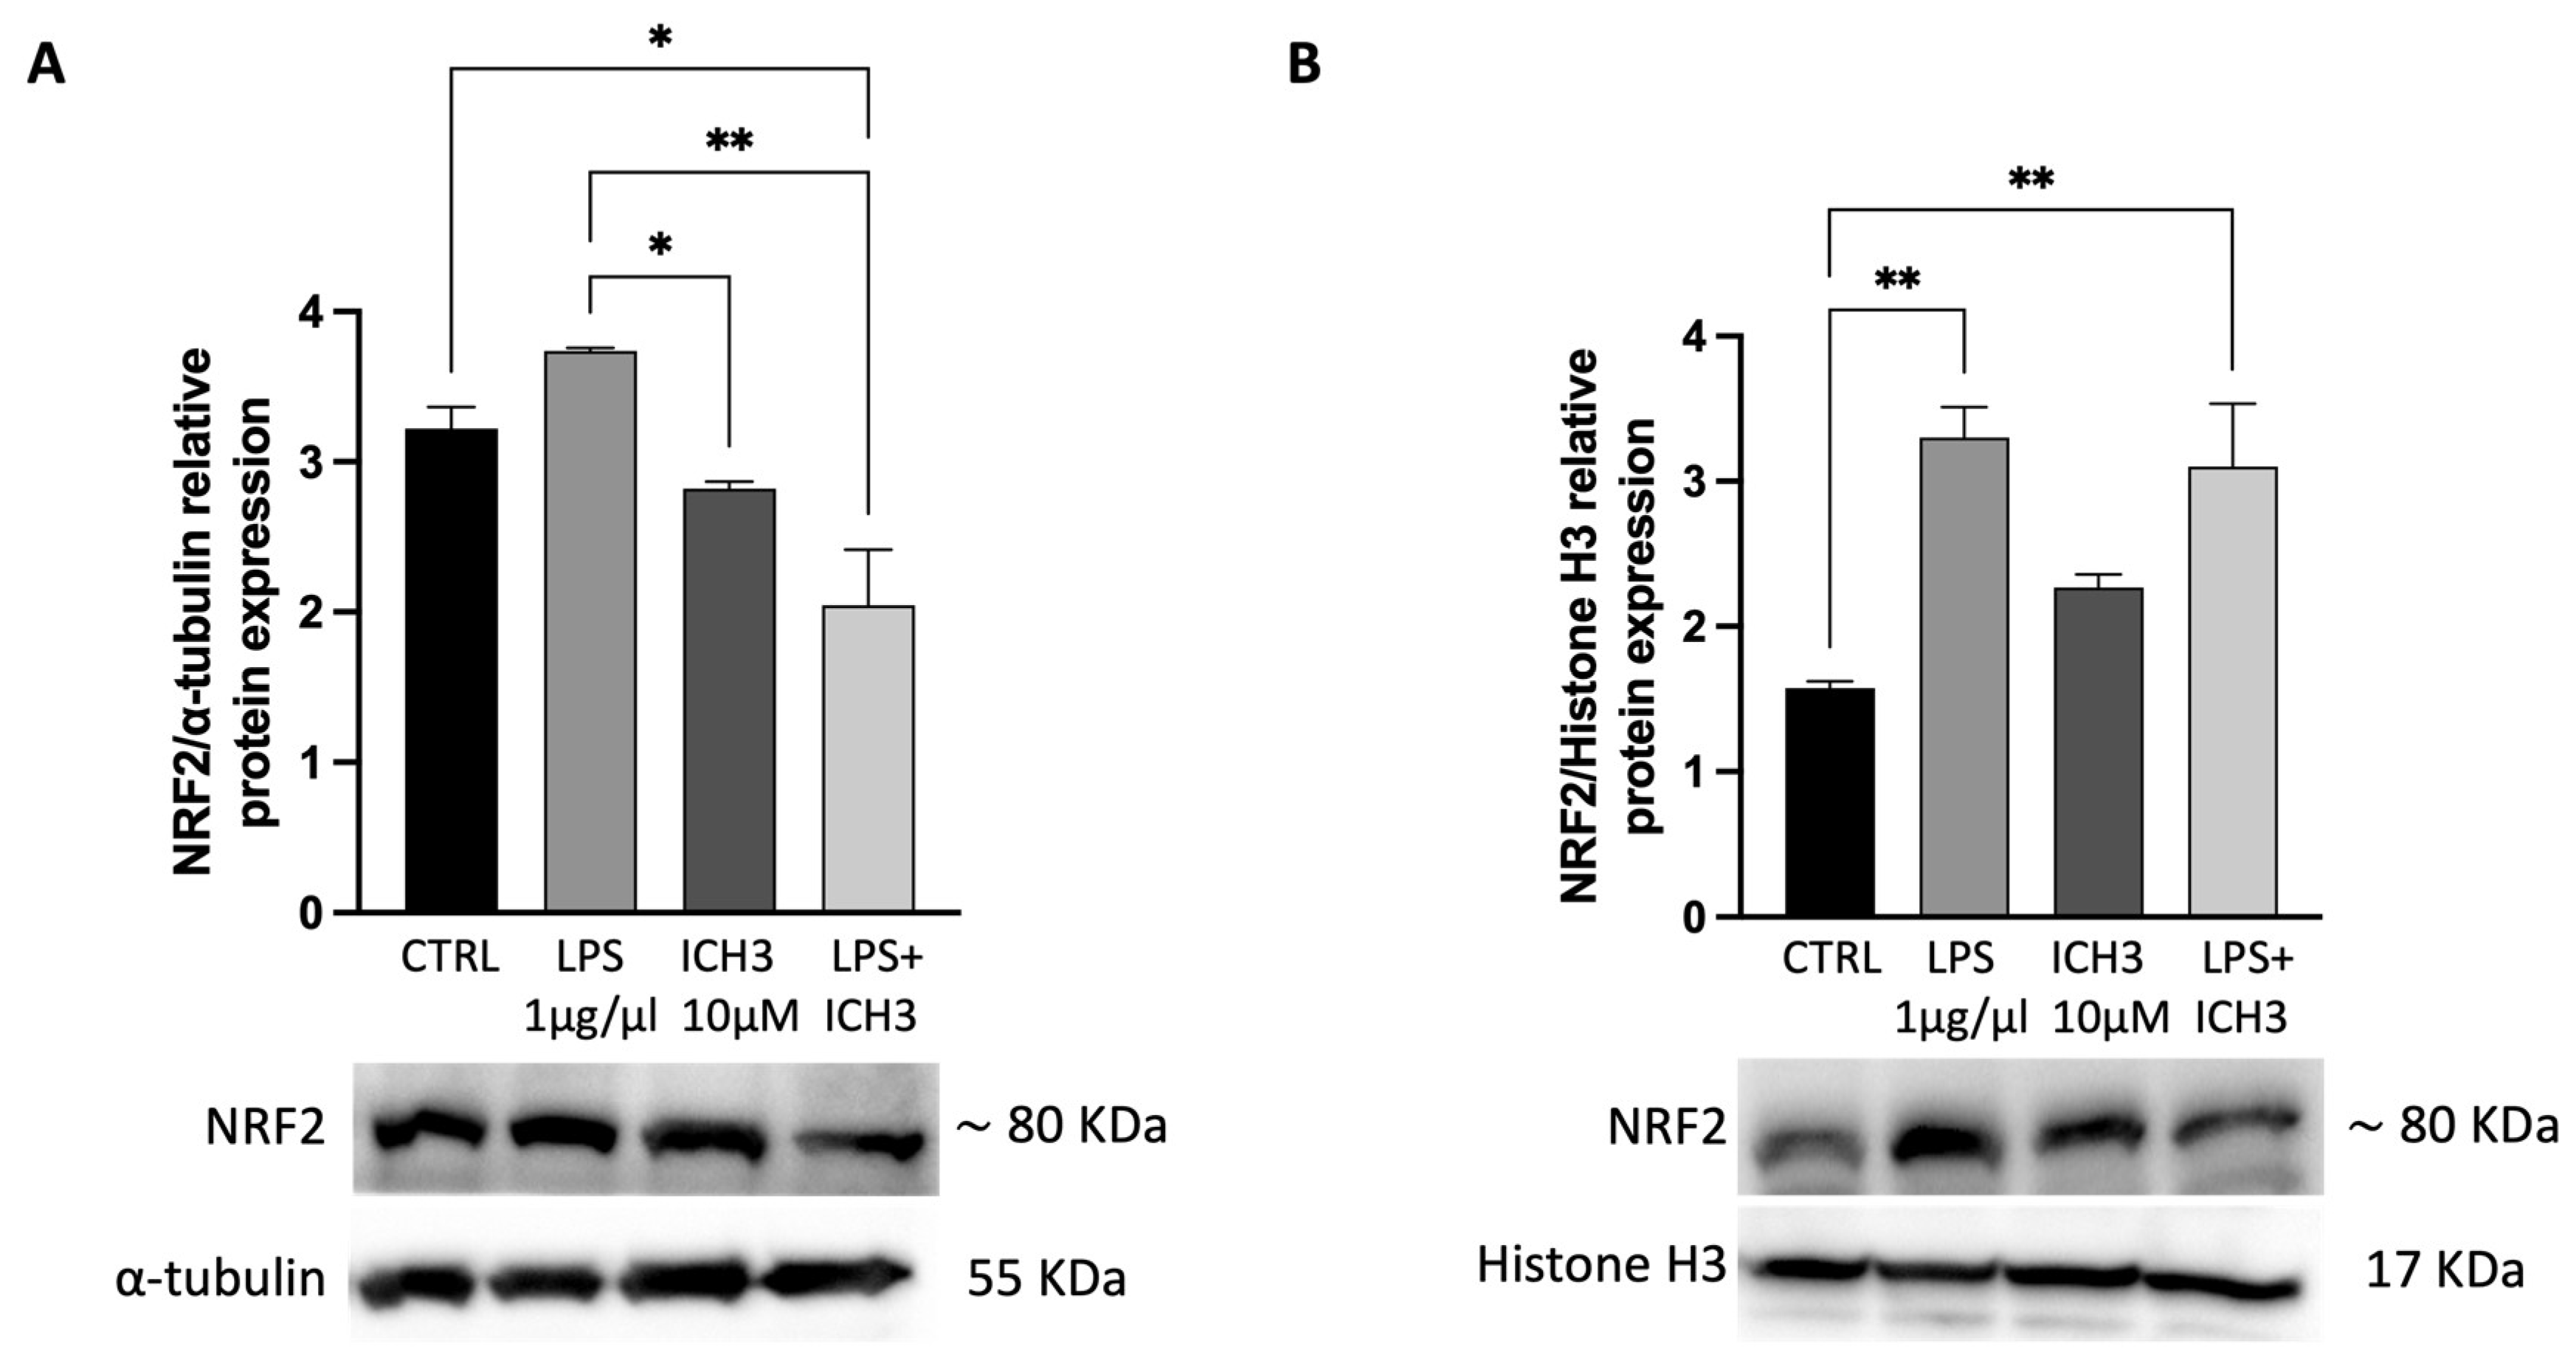
Figure 5.
Oil red O staining in Oli neu cells after (A,C) 48h and (B,D) 120 h from seeding with 1 μg/mL LPS, 10 μM ICH3 and 1 μg/mL LPS + 10 μM ICH3. Images were acquired using a Zeiss fluorescence microscope. Scale bars = 10 μm. The graphs show the optical density relative to the LDs intracellular quantity measured in Oli neu cells in the following experimental conditions: CTRL (untreated cells), LPS, ICH3, and LPS + ICH3, after 48 h (C) and 120 h (D). Quantification was obtained using a multimodal microplate reader (CLARIOstar® Plus, BMG Labtech). The data are the average ± SEM of three independent experiments performed in sextuplicate. One-way ANOVA test followed by the Turkey multiple comparison post-test was used to statistically compare the different experimental conditions (*p < 0.05; **p < 0.01; ***p < 0.001; ****p < 0.0001).
Disclaimer/Publisher’s Note: The statements, opinions and data contained in all publications are solely those of the individual author(s) and contributor(s) and not of MDPI and/or the editor(s). MDPI and/or the editor(s) disclaim responsibility for any injury to people or property resulting from any ideas, methods, instructions or products referred to in the content. |
© 2025 by the authors. Licensee MDPI, Basel, Switzerland. This article is an open access article distributed under the terms and conditions of the Creative Commons Attribution (CC BY) license (http://creativecommons.org/licenses/by/4.0/).
Copyright: This open access article is published under a Creative Commons CC BY 4.0 license, which permit the free download, distribution, and reuse, provided that the author and preprint are cited in any reuse.


