Submitted:
13 January 2025
Posted:
13 January 2025
You are already at the latest version
Abstract
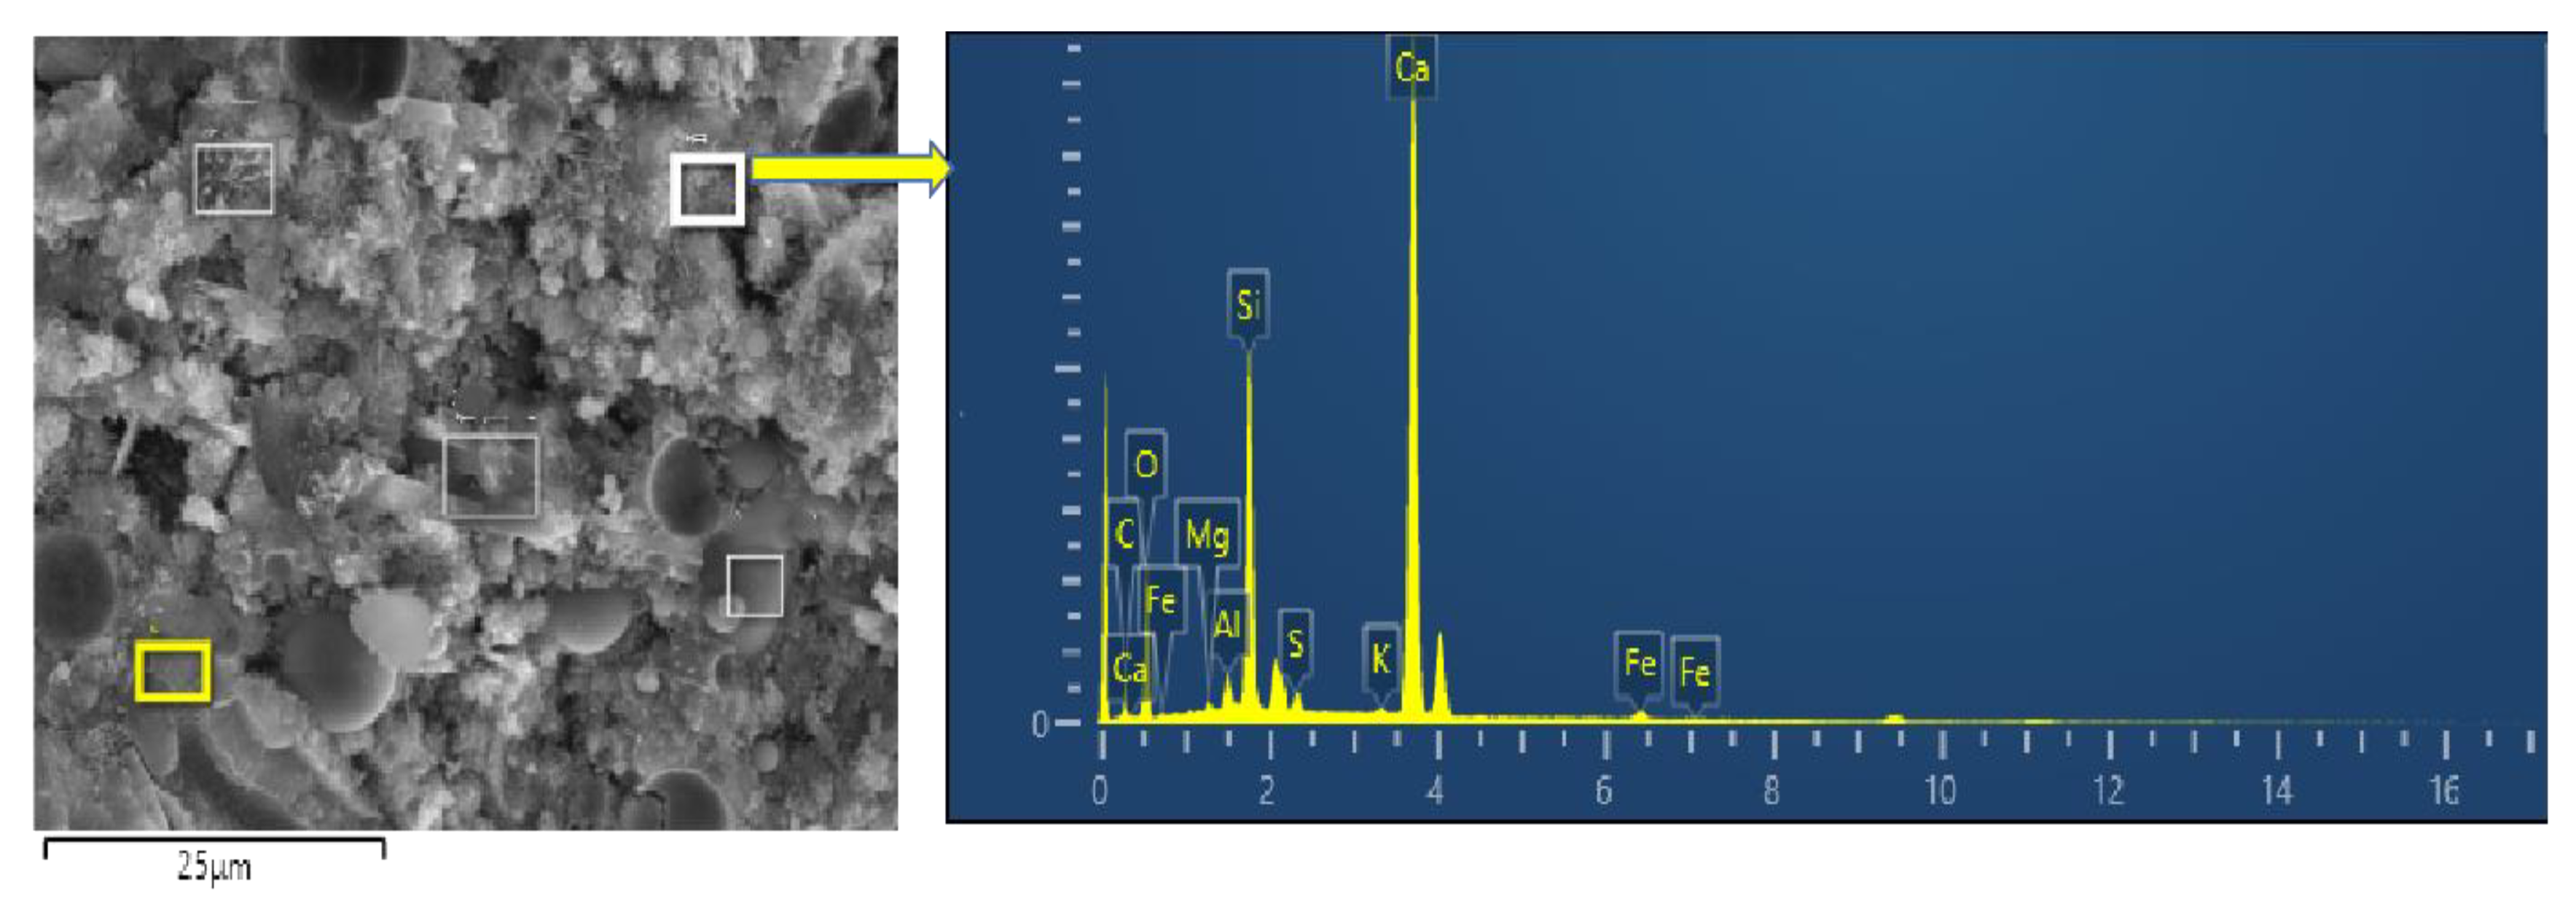
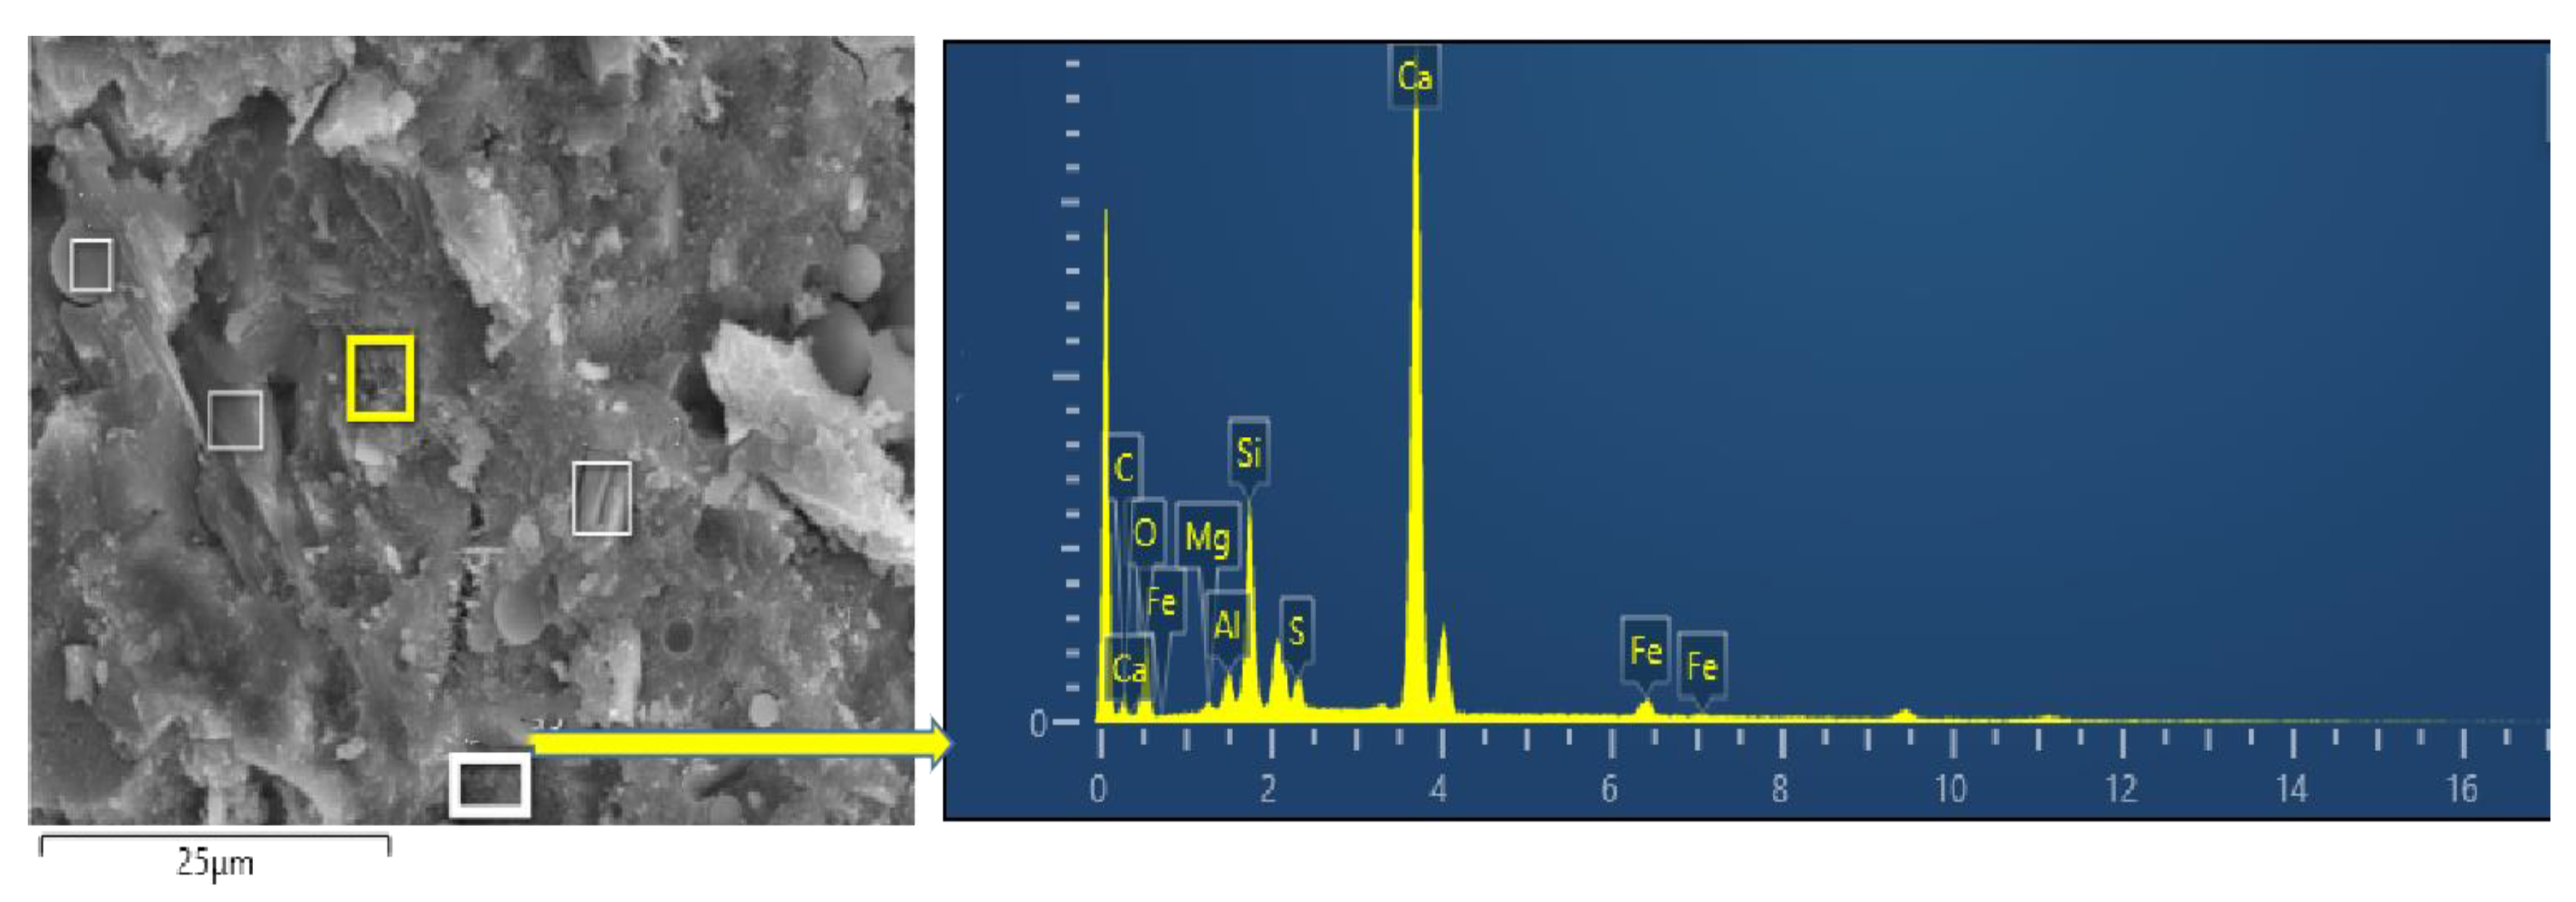
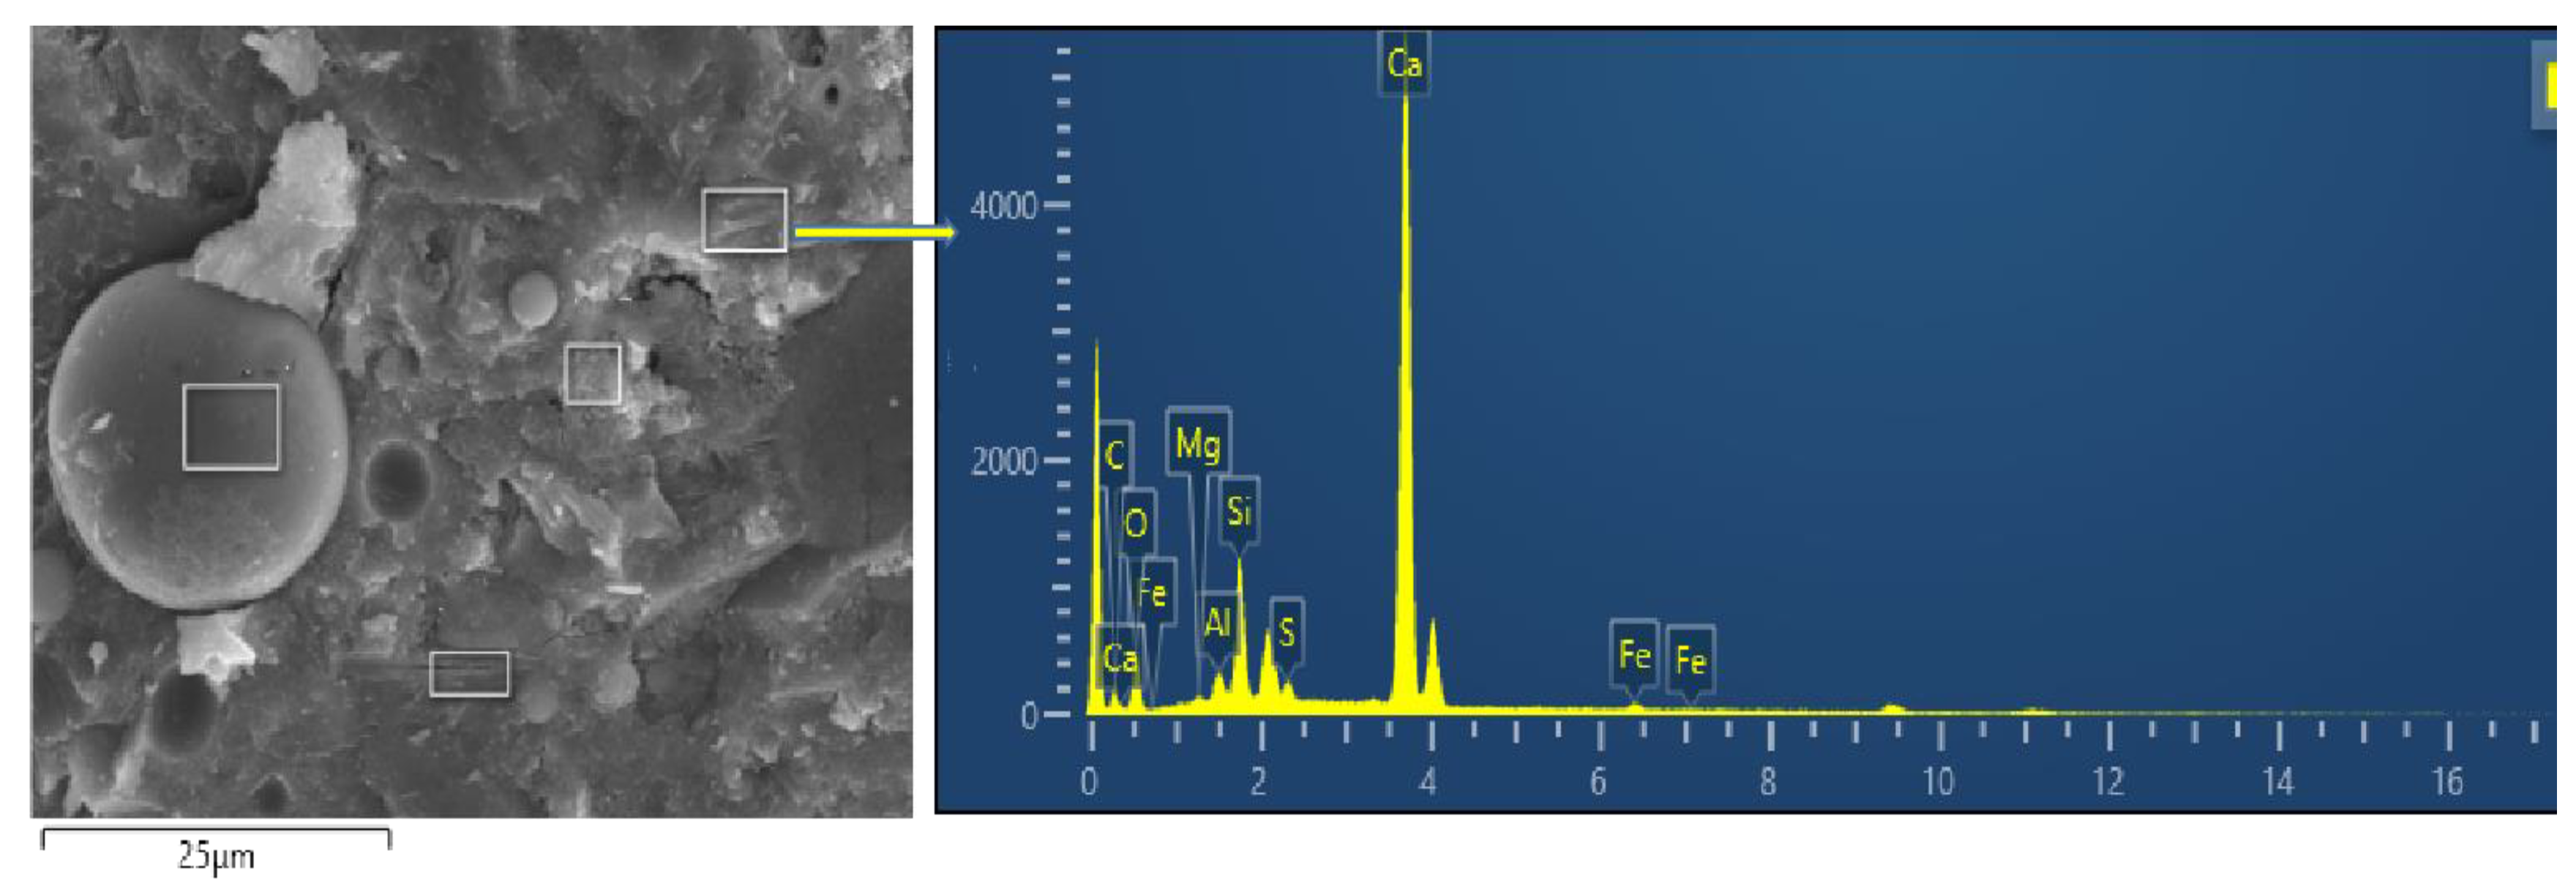
In this paper, standard maintenance and simulated field actual temperature maintenance are carried out. The compressive strength, splitting tensile strength, axial tensile strength, elastic modulus and its growth rate were tested. It is found that temperature has a great influence on the mechanical properties of concrete. Among them, temperature has the greatest influence on splitting tensile strength. The numerical difference of this test is within the acceptable range. It shows that the research in the laboratory has a good reference significance for the actual situation in the field. Based on the N-S maturity formula, F-P equivalent age formula and D-L equivalent age formula proposed by maturity theory, the maturity indexes under two curing conditions are calculated. The development law between strength and maturity is studied by fitting logarithmic function, exponential function and hyperbolic function with fitting software. It is concluded that the strength of low heat Portland cement concrete increases with the increase of maturity under quasi environmental curing and standard curing. The fitting accuracy of hyperbolic function in F-P equivalent age and D-L equivalent age is the highest. XRD was used to analyse the phase of low heat cement. Hydration products and microstructure of low heat cement with 25 % fly ash were analysed by SEM. Energy spectrum analysis of element content. The results showed:The late low heat cement cementitious system has a certain amount of Ca(OH)2. Good compactness, Ensure the later strength development of concrete. It has micro-expansion effect, It has good effect on long-term crack resistance of hydraulic lining structure.
Keywords:
Introduction
1. Experiment
1.1. Raw Materials and Mix Proportion
1.1.1. Raw Material
1.1.2. Mix Proportion
1.1.3. Test Scheme
2. Experiment Results and Analysis
2.1. Test Result
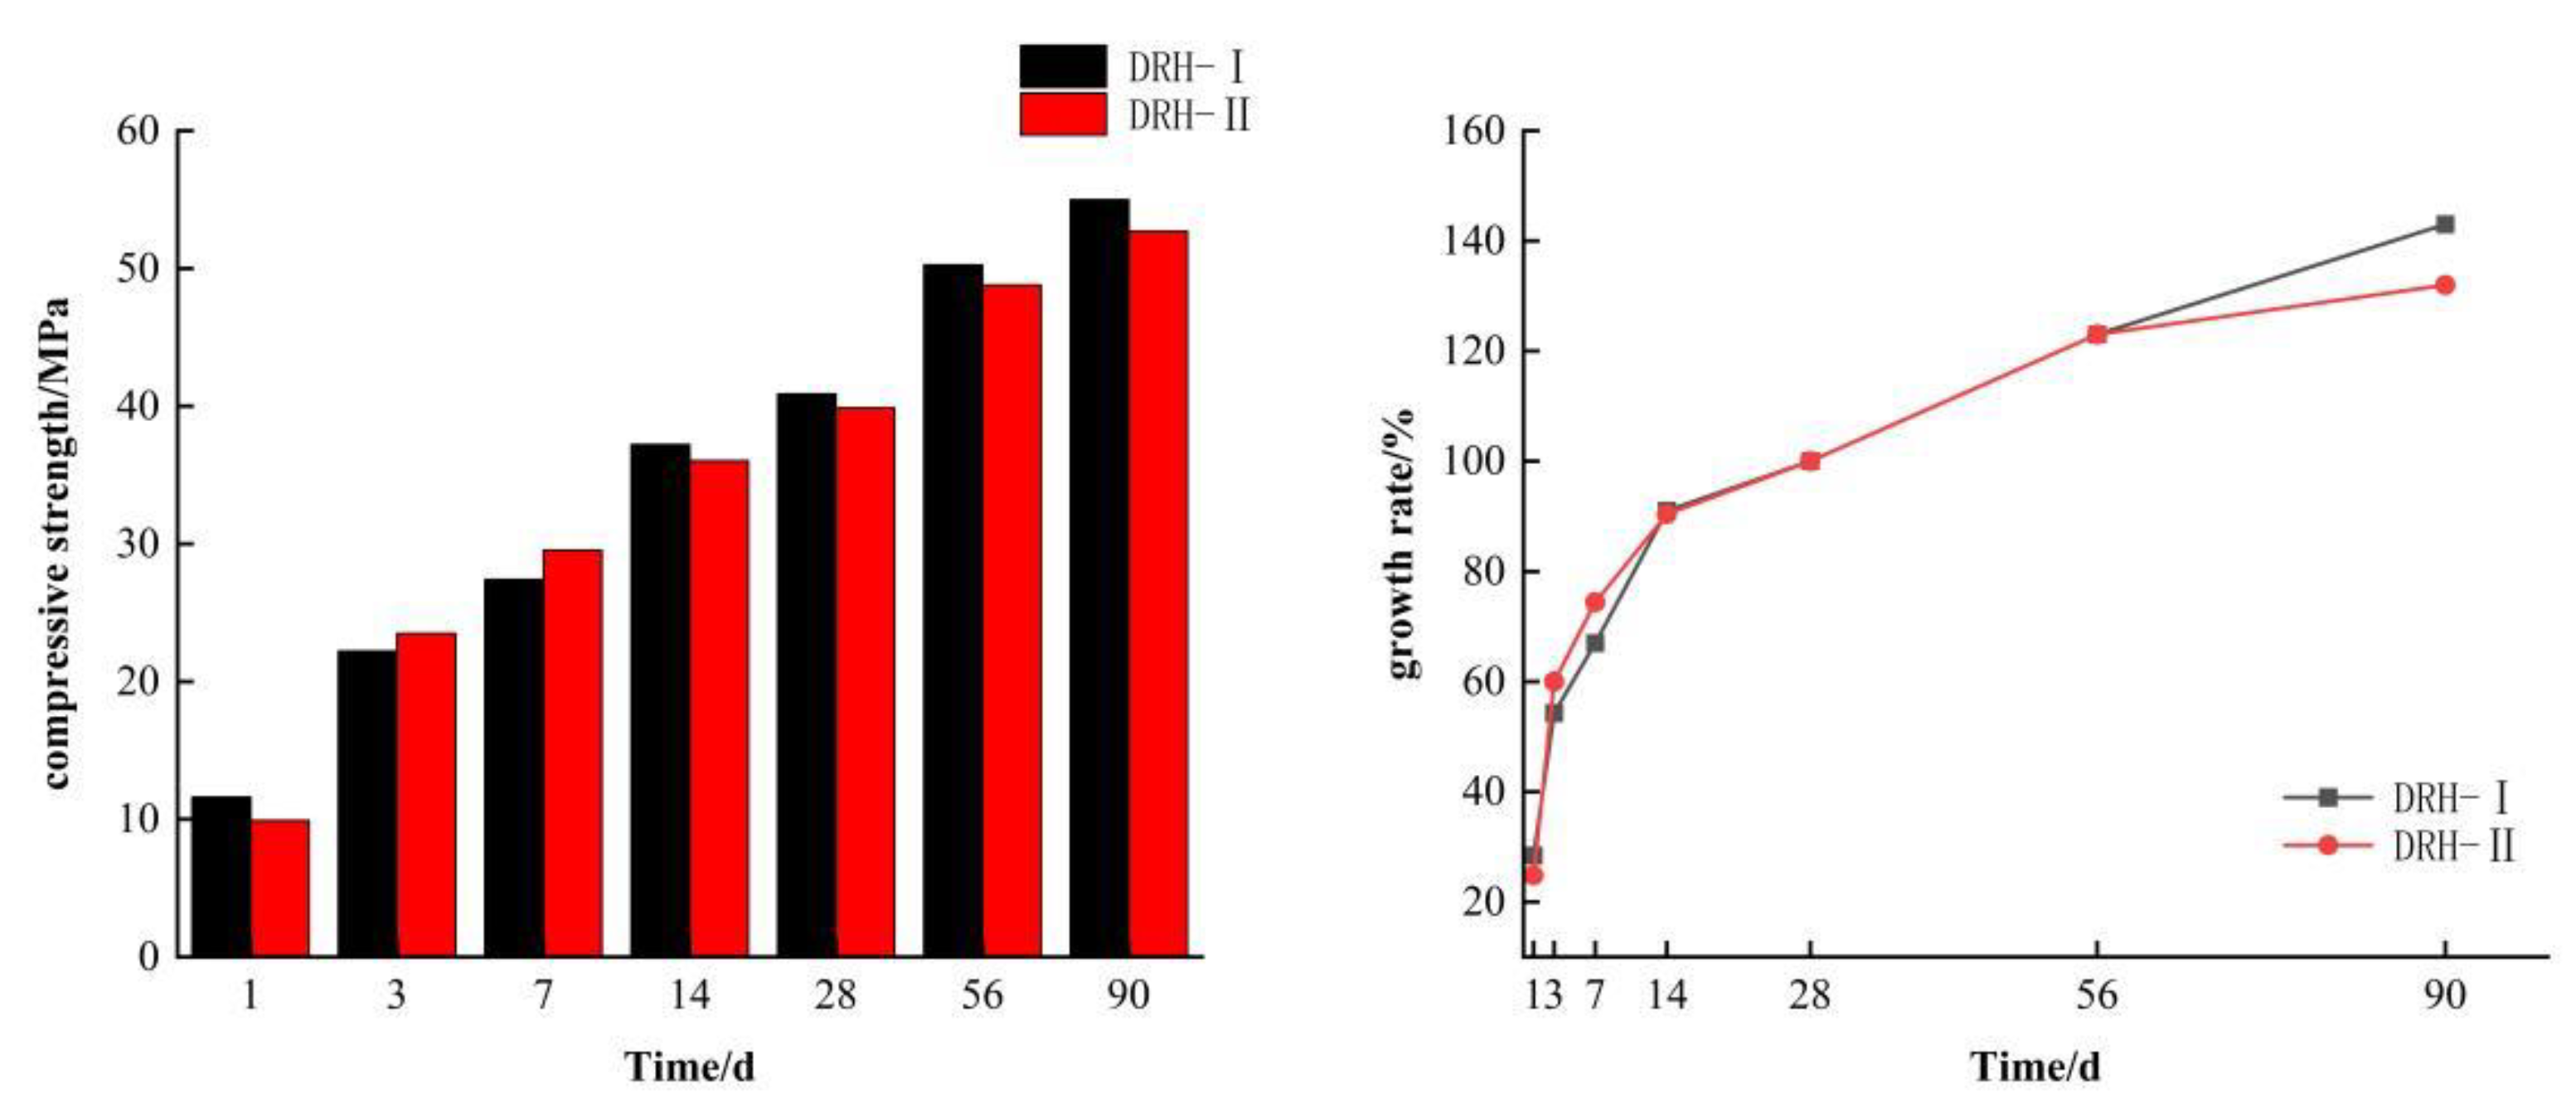
2.1.1. Compressive Strength
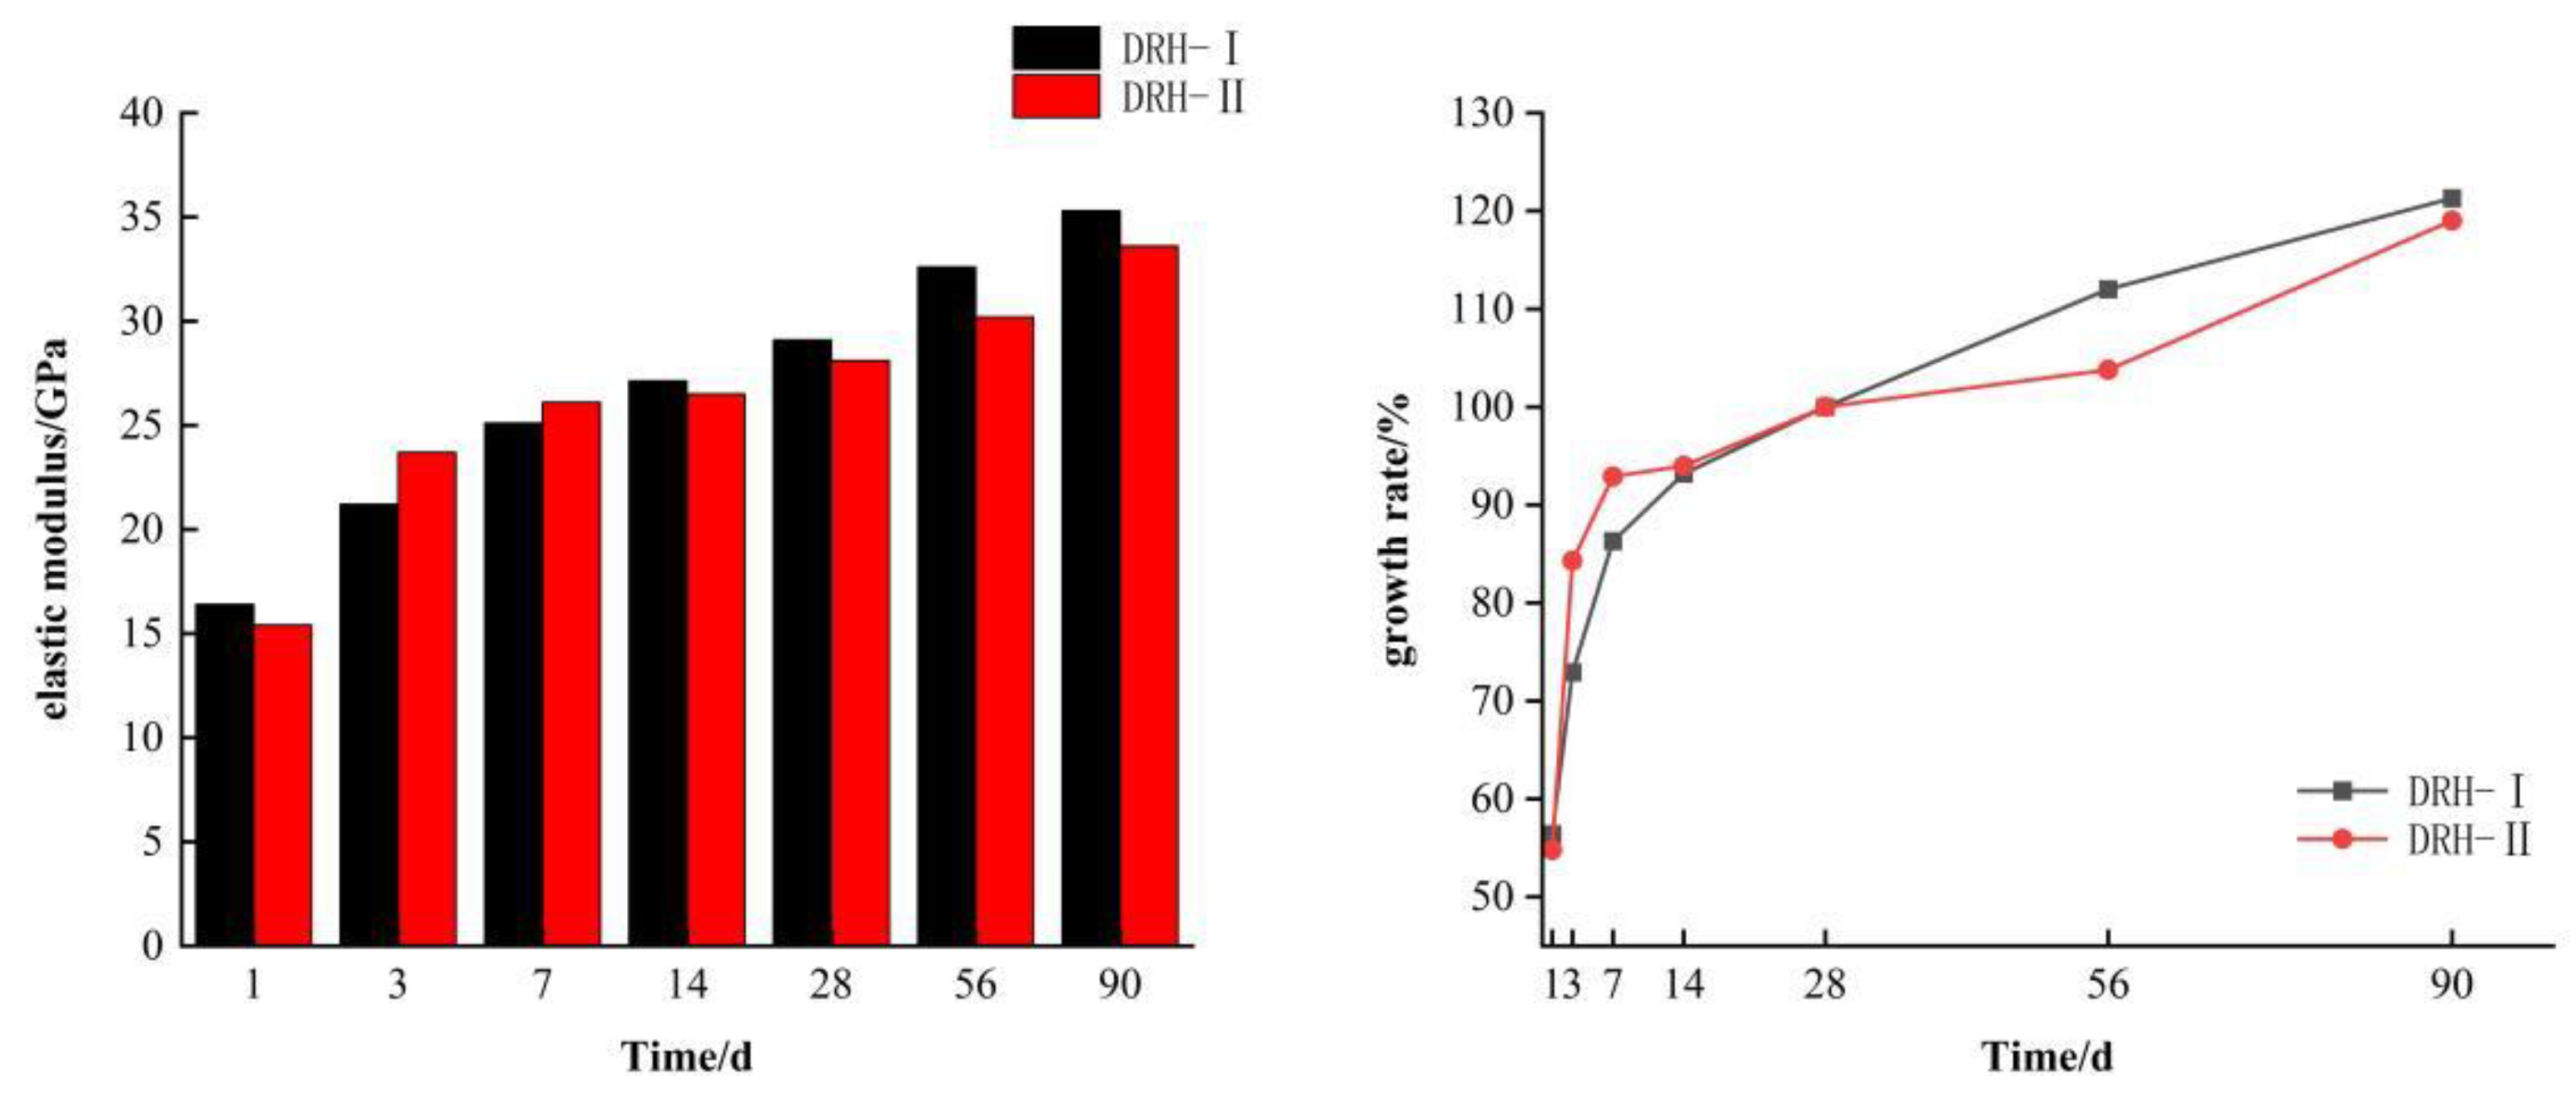
2.1.2. Elastic Modulus
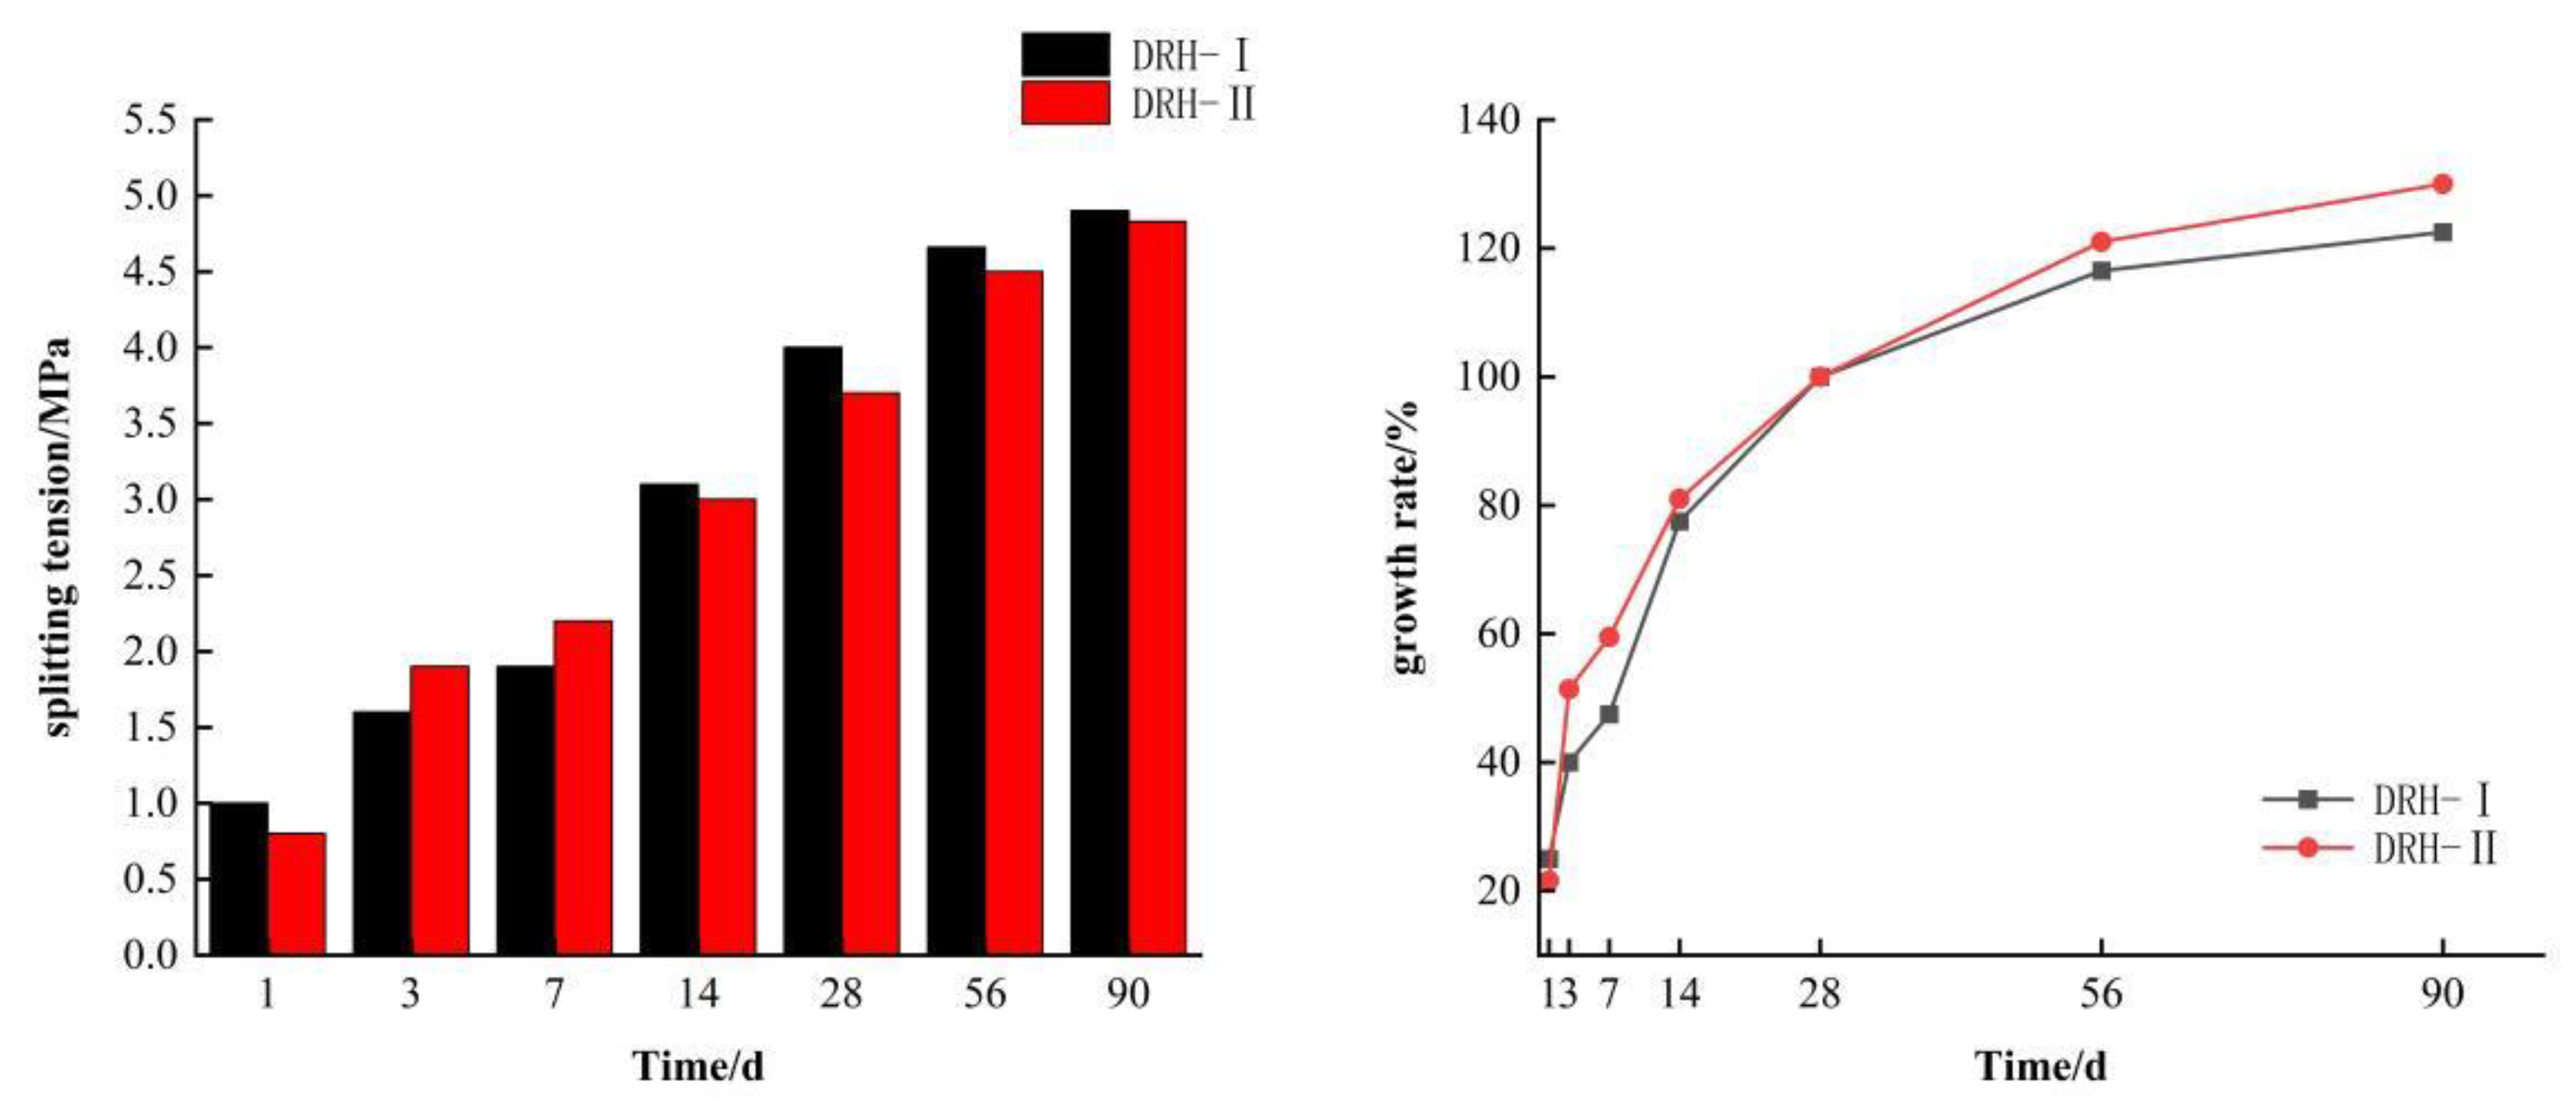
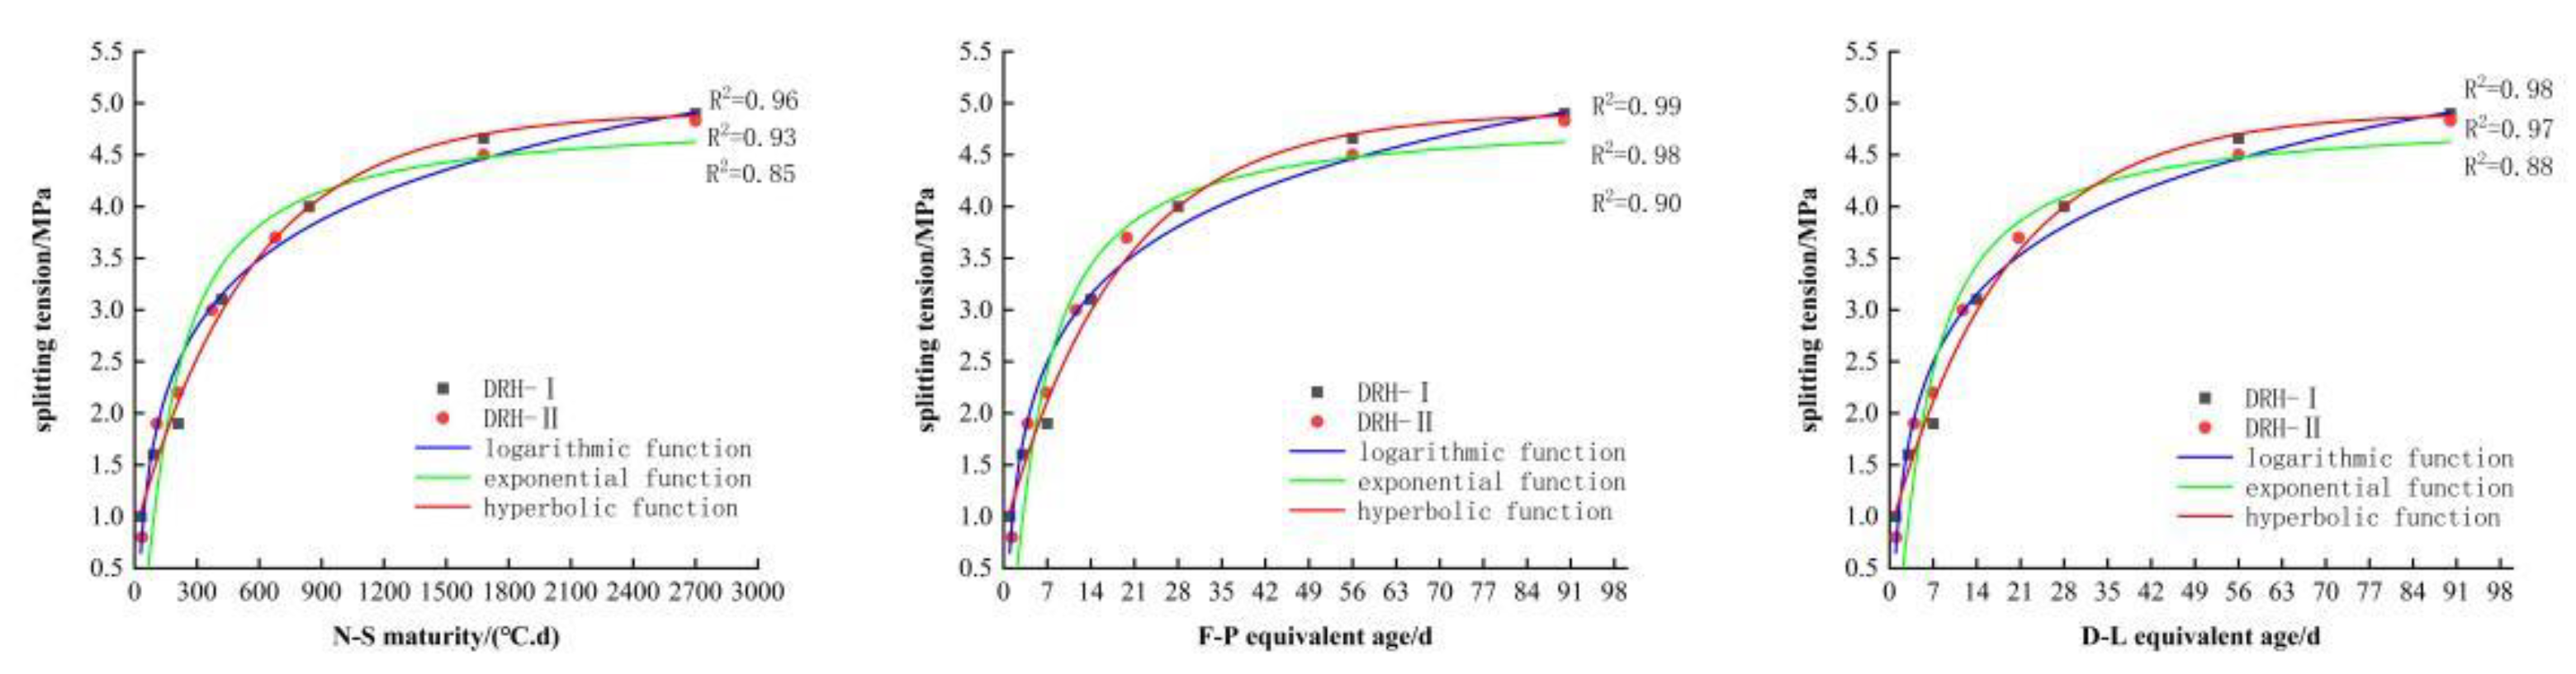
2.1.3. Splitting Tension
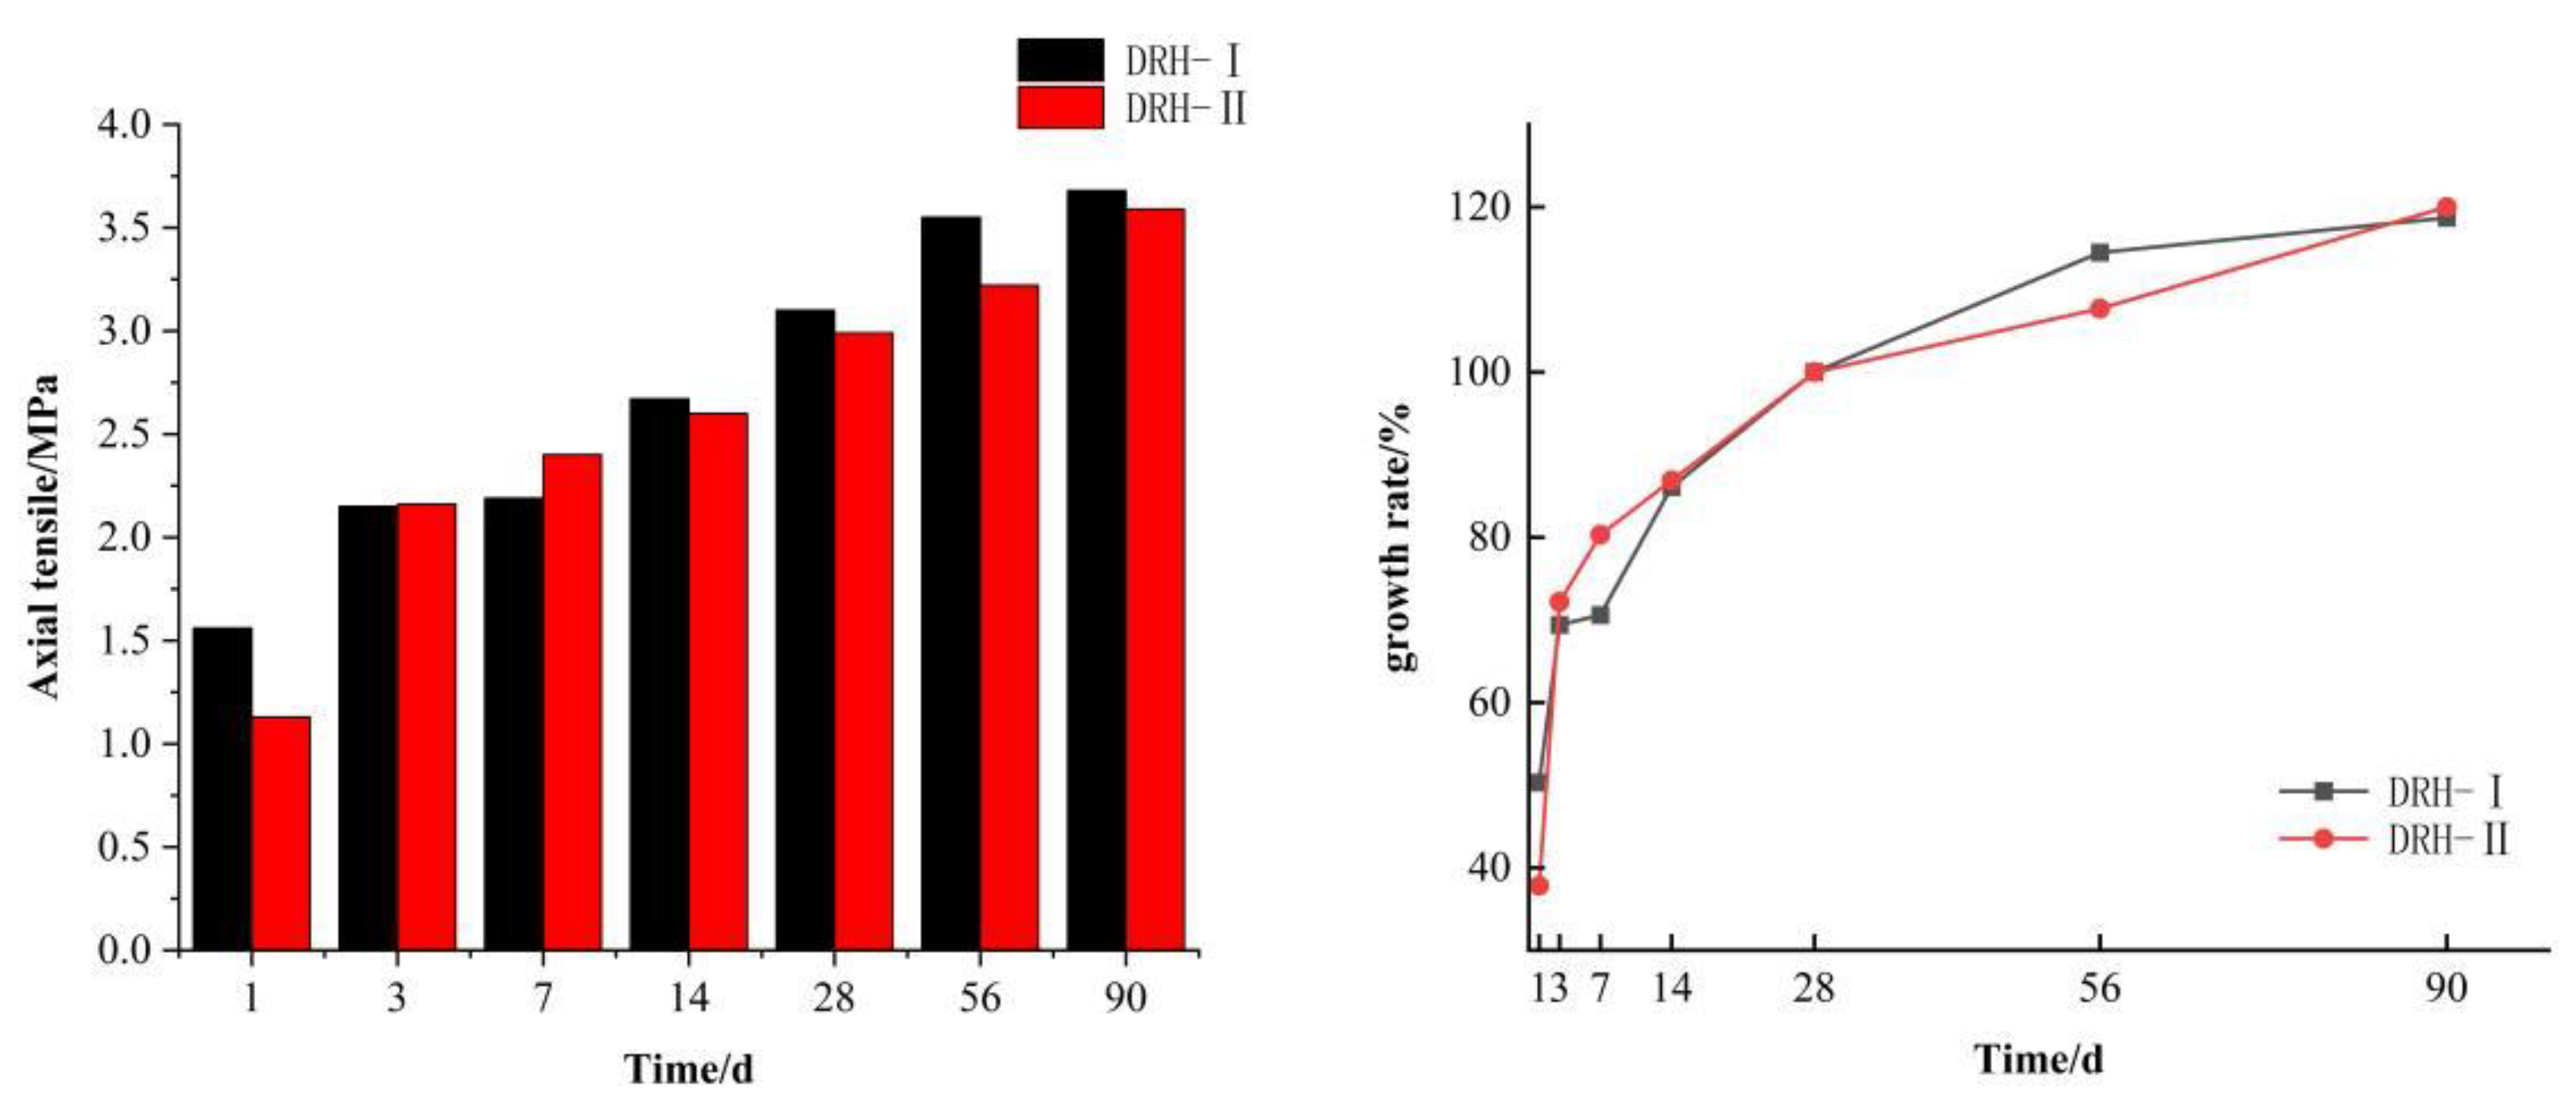
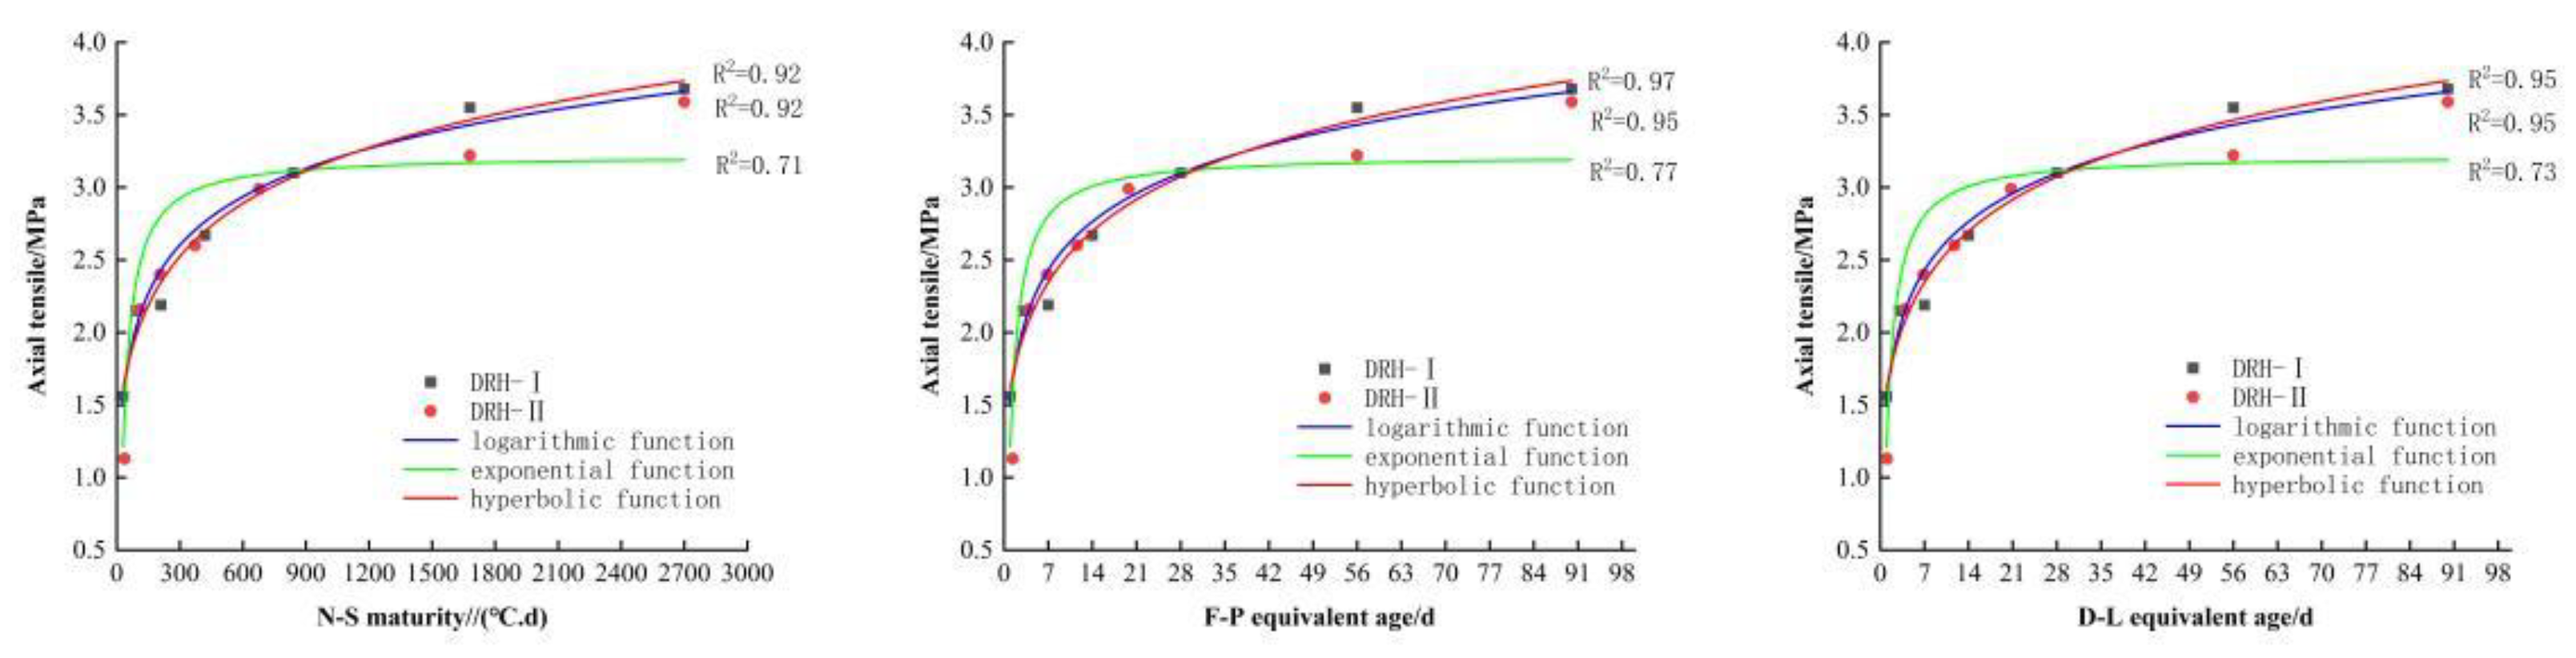
2.1.4. Axial Tensile Strength
2.2. Maturity Theoretical Analysis
2.2.1. Maturity Indicator
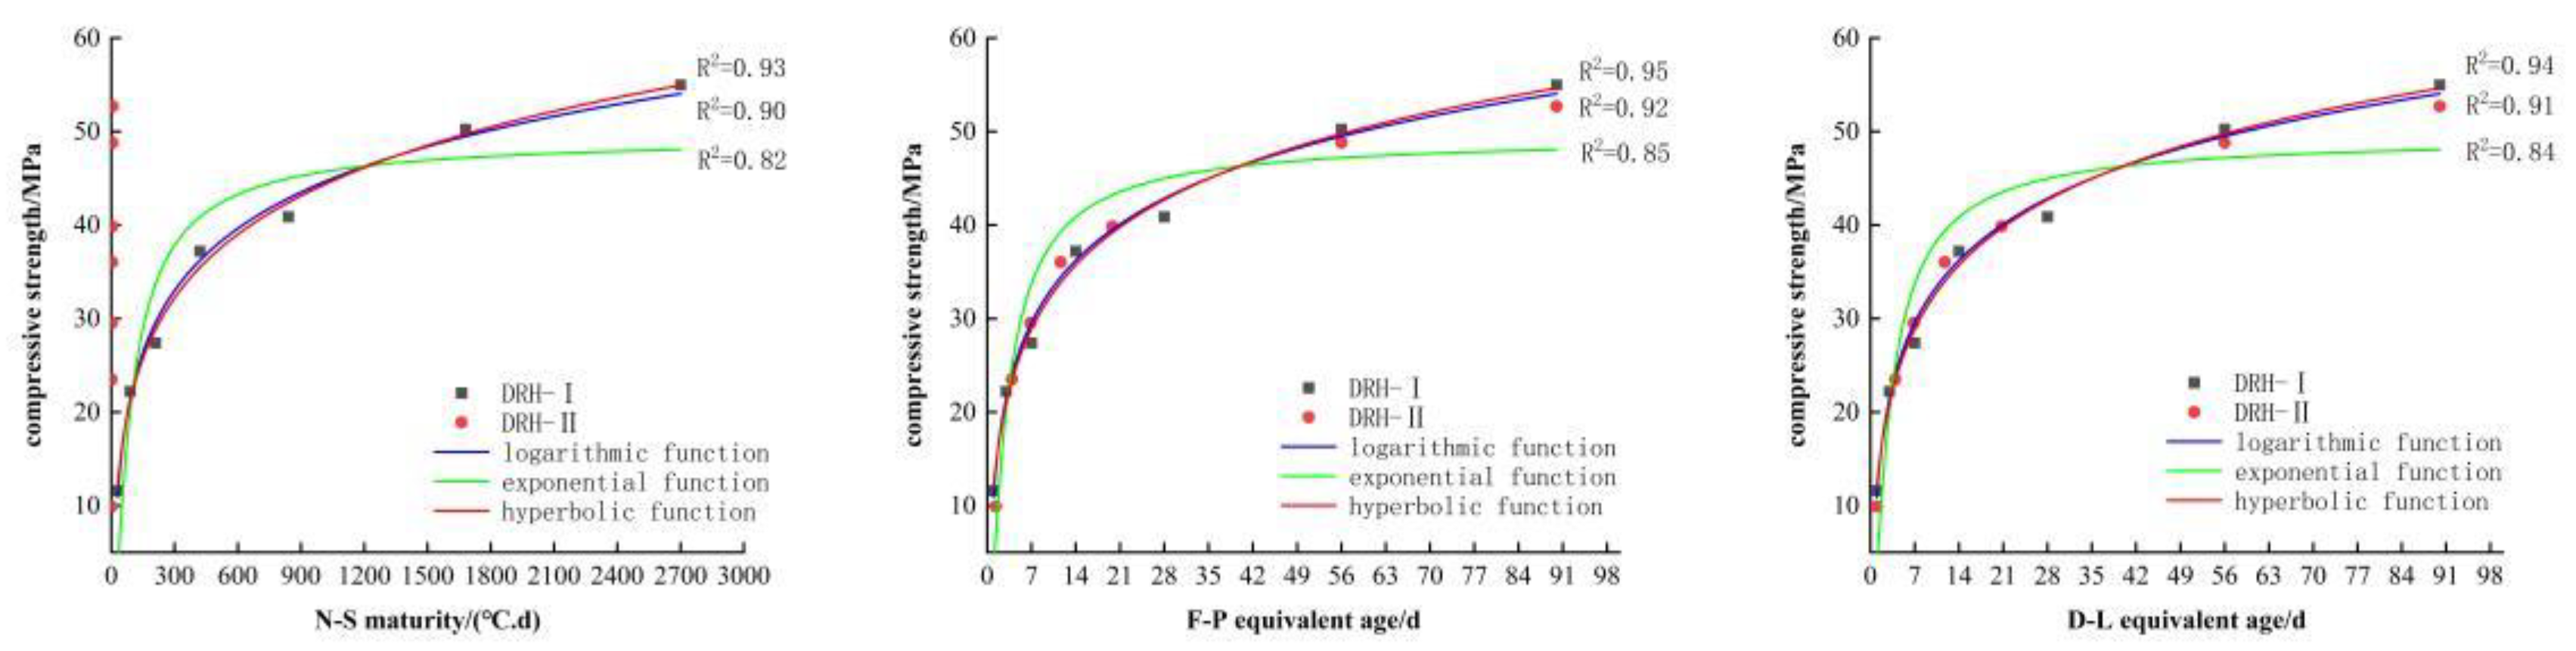
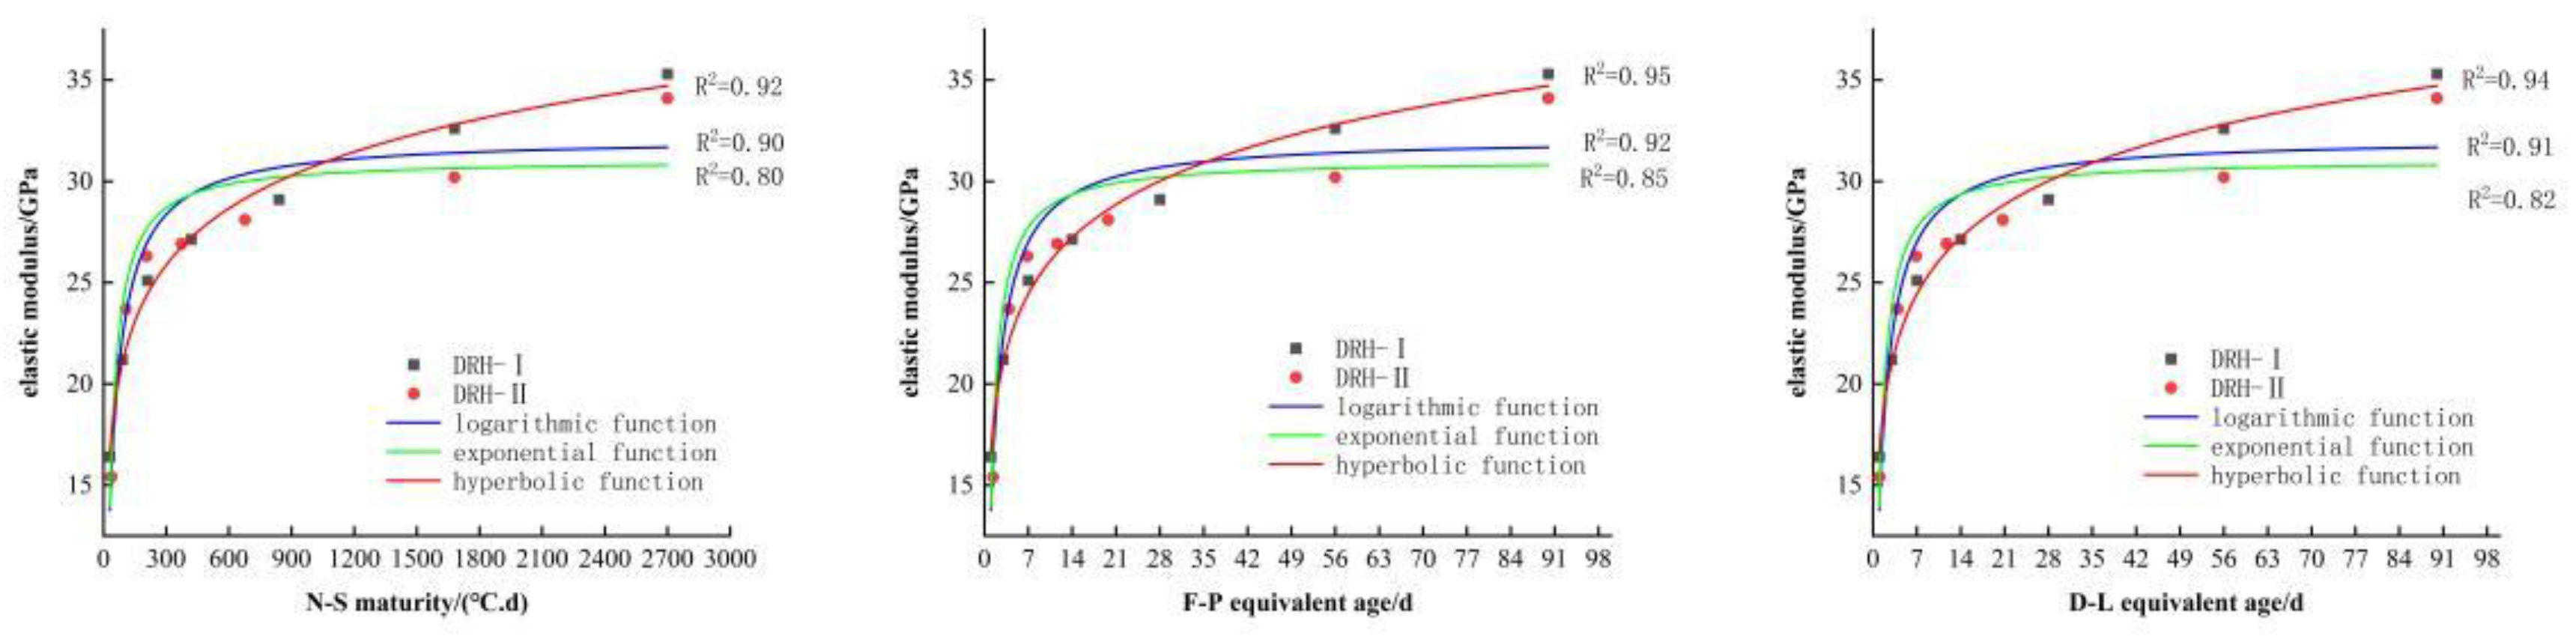
2.2.2. The Relationship Between Maturity and Strength
2.2.3. The Establishment and Analysis of Function Model
2.3. Microscopic Test
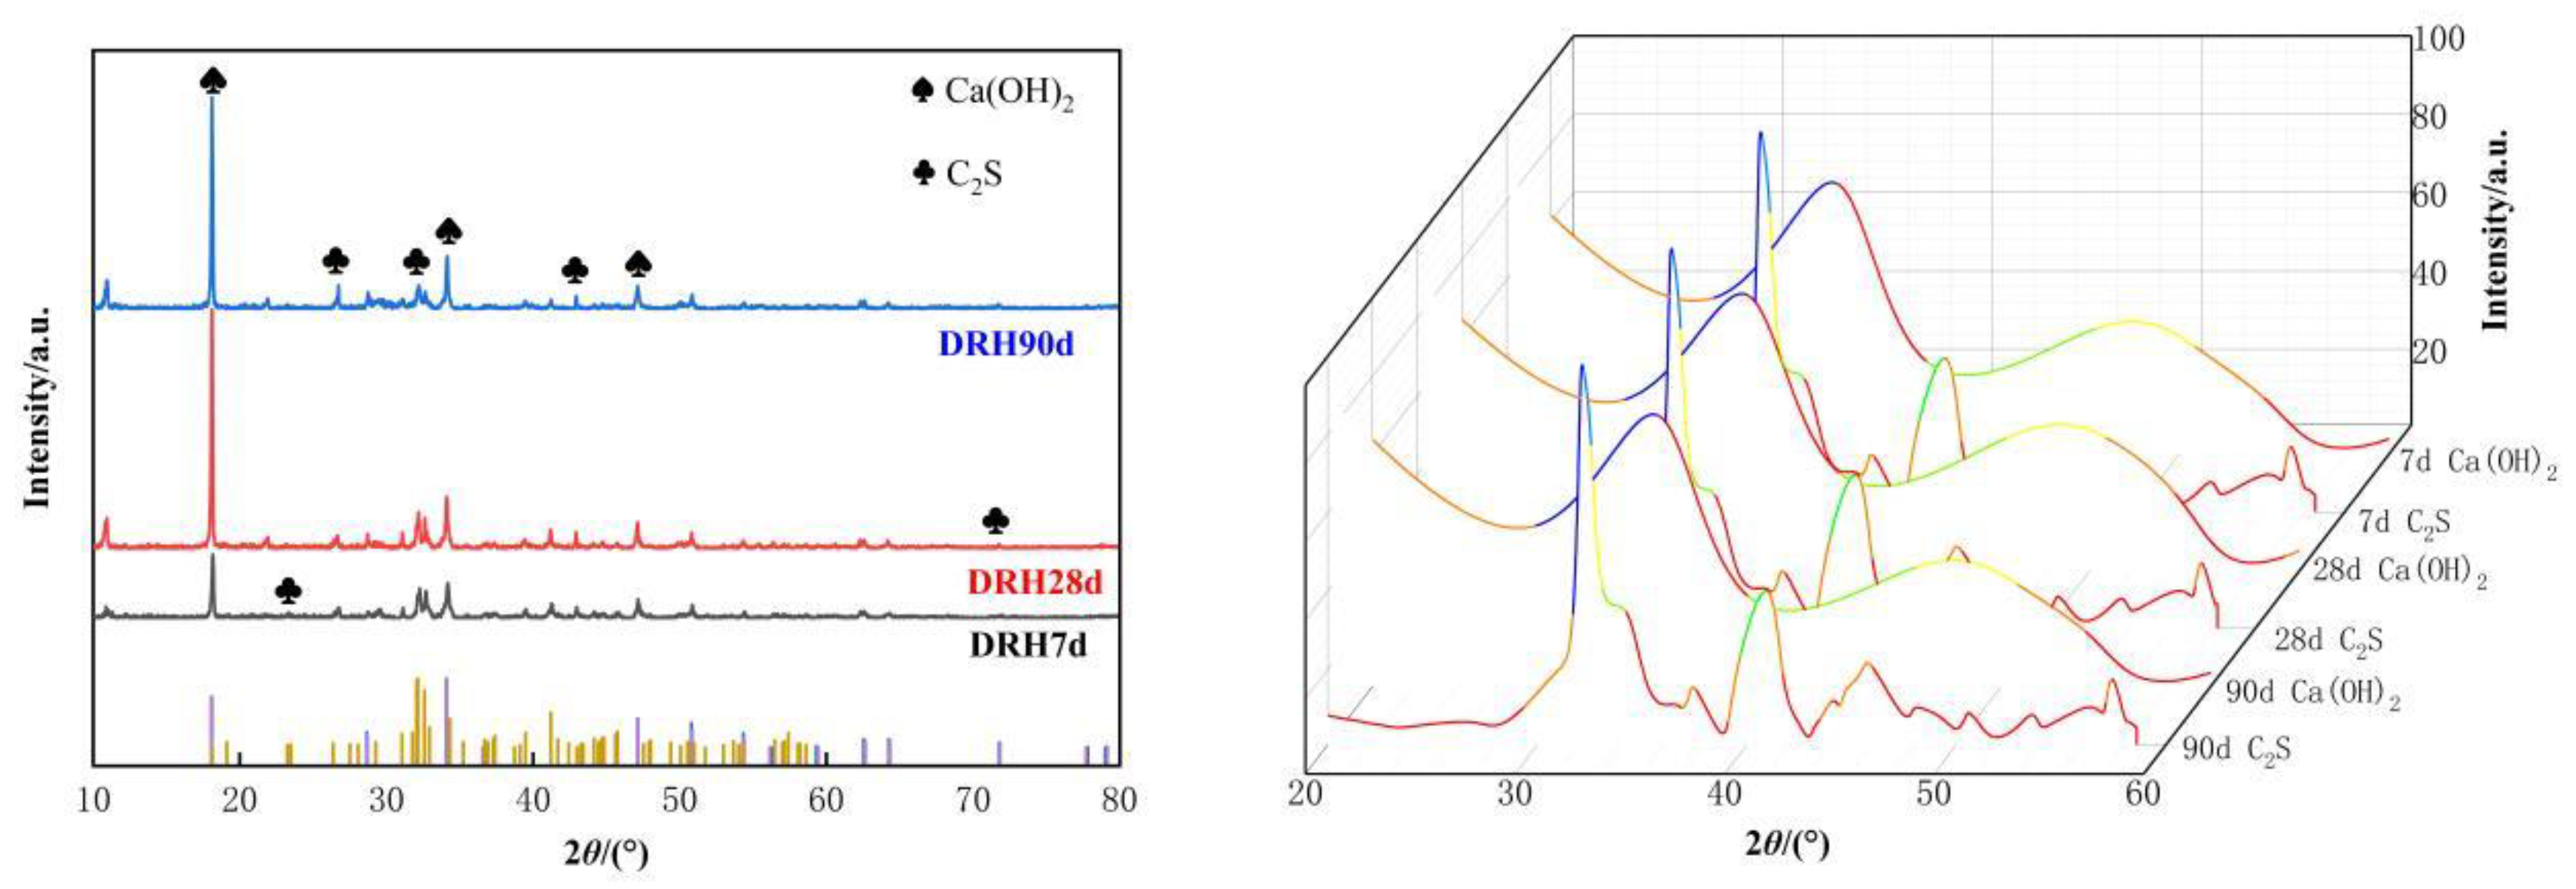
2.3.1. X-Ray Diffraction Analysis
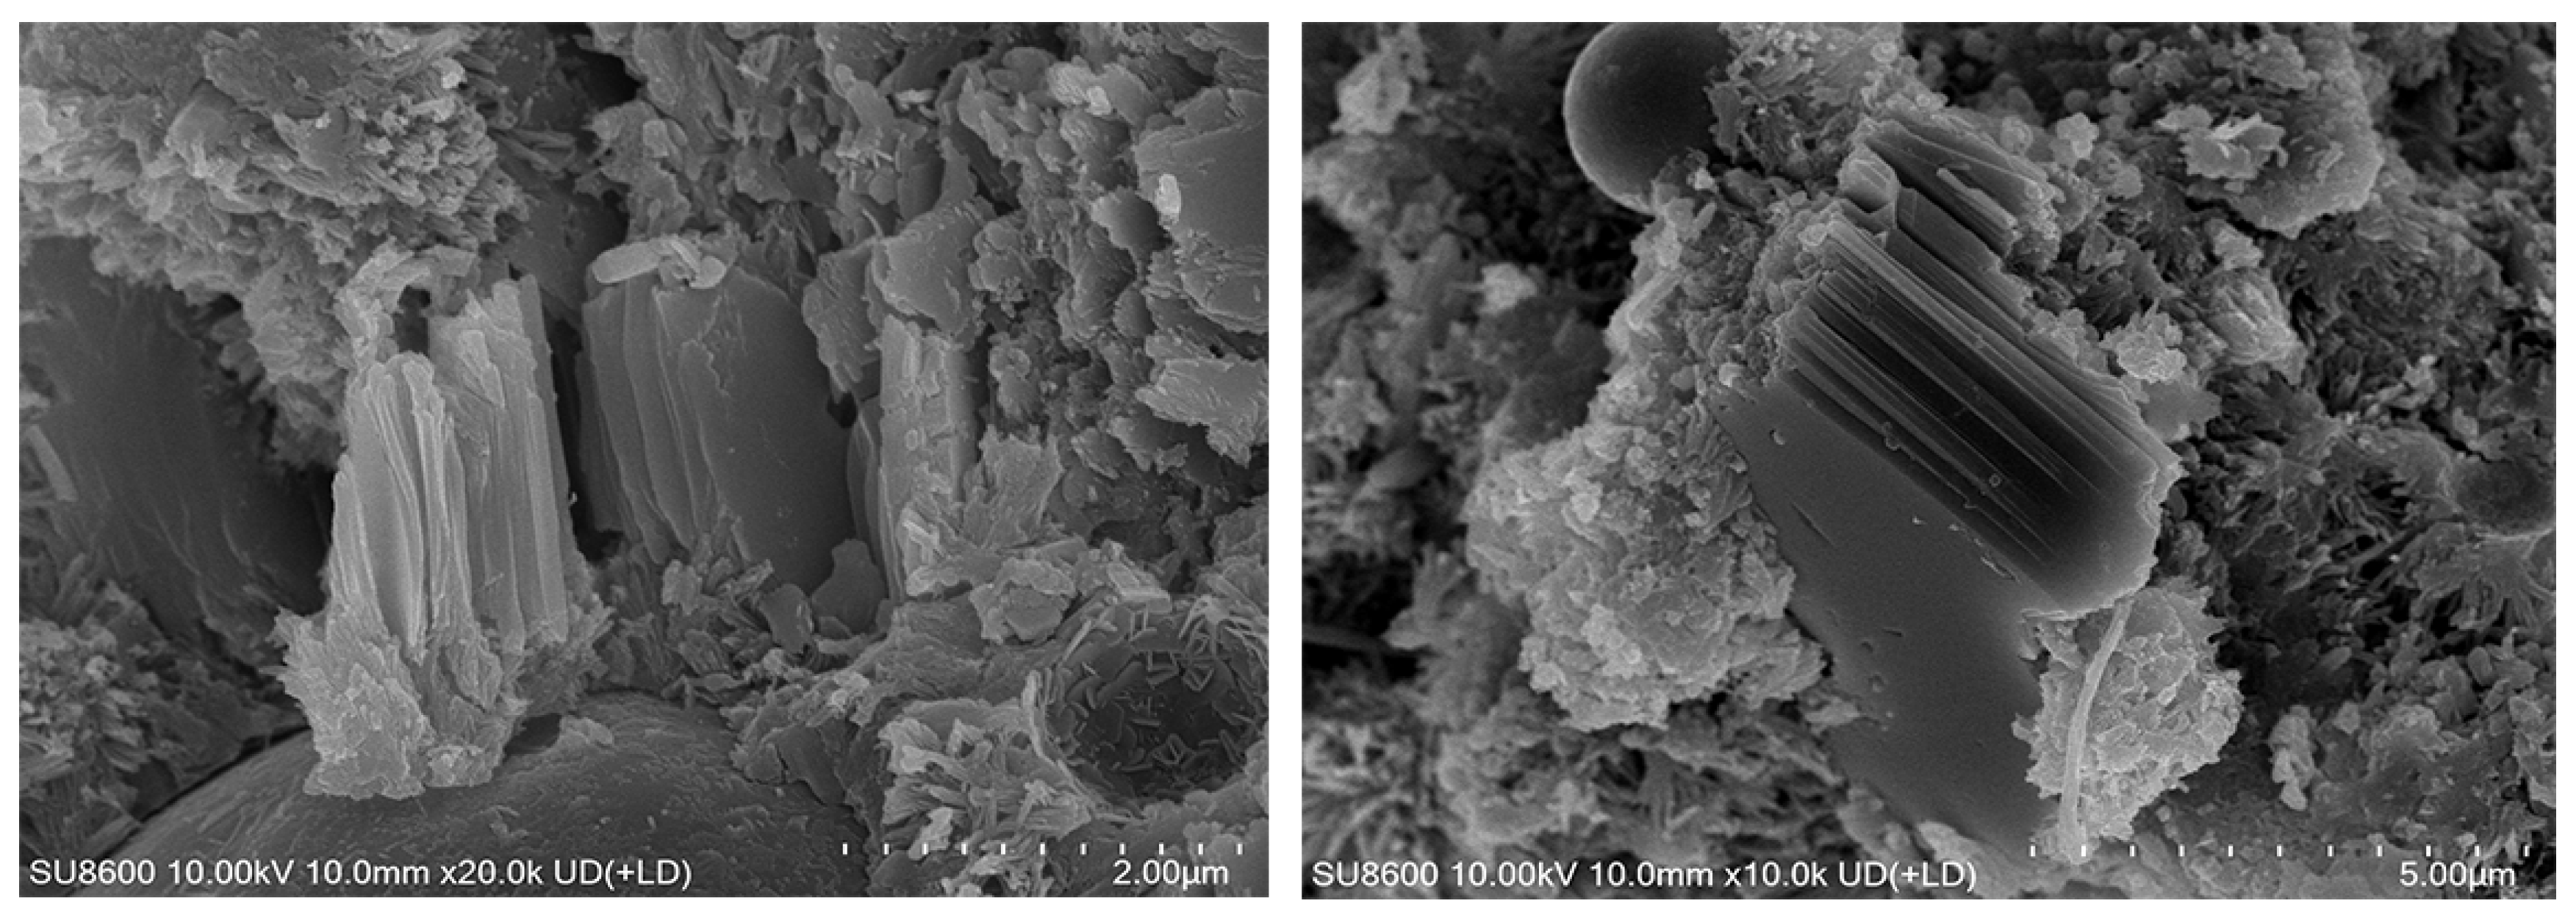
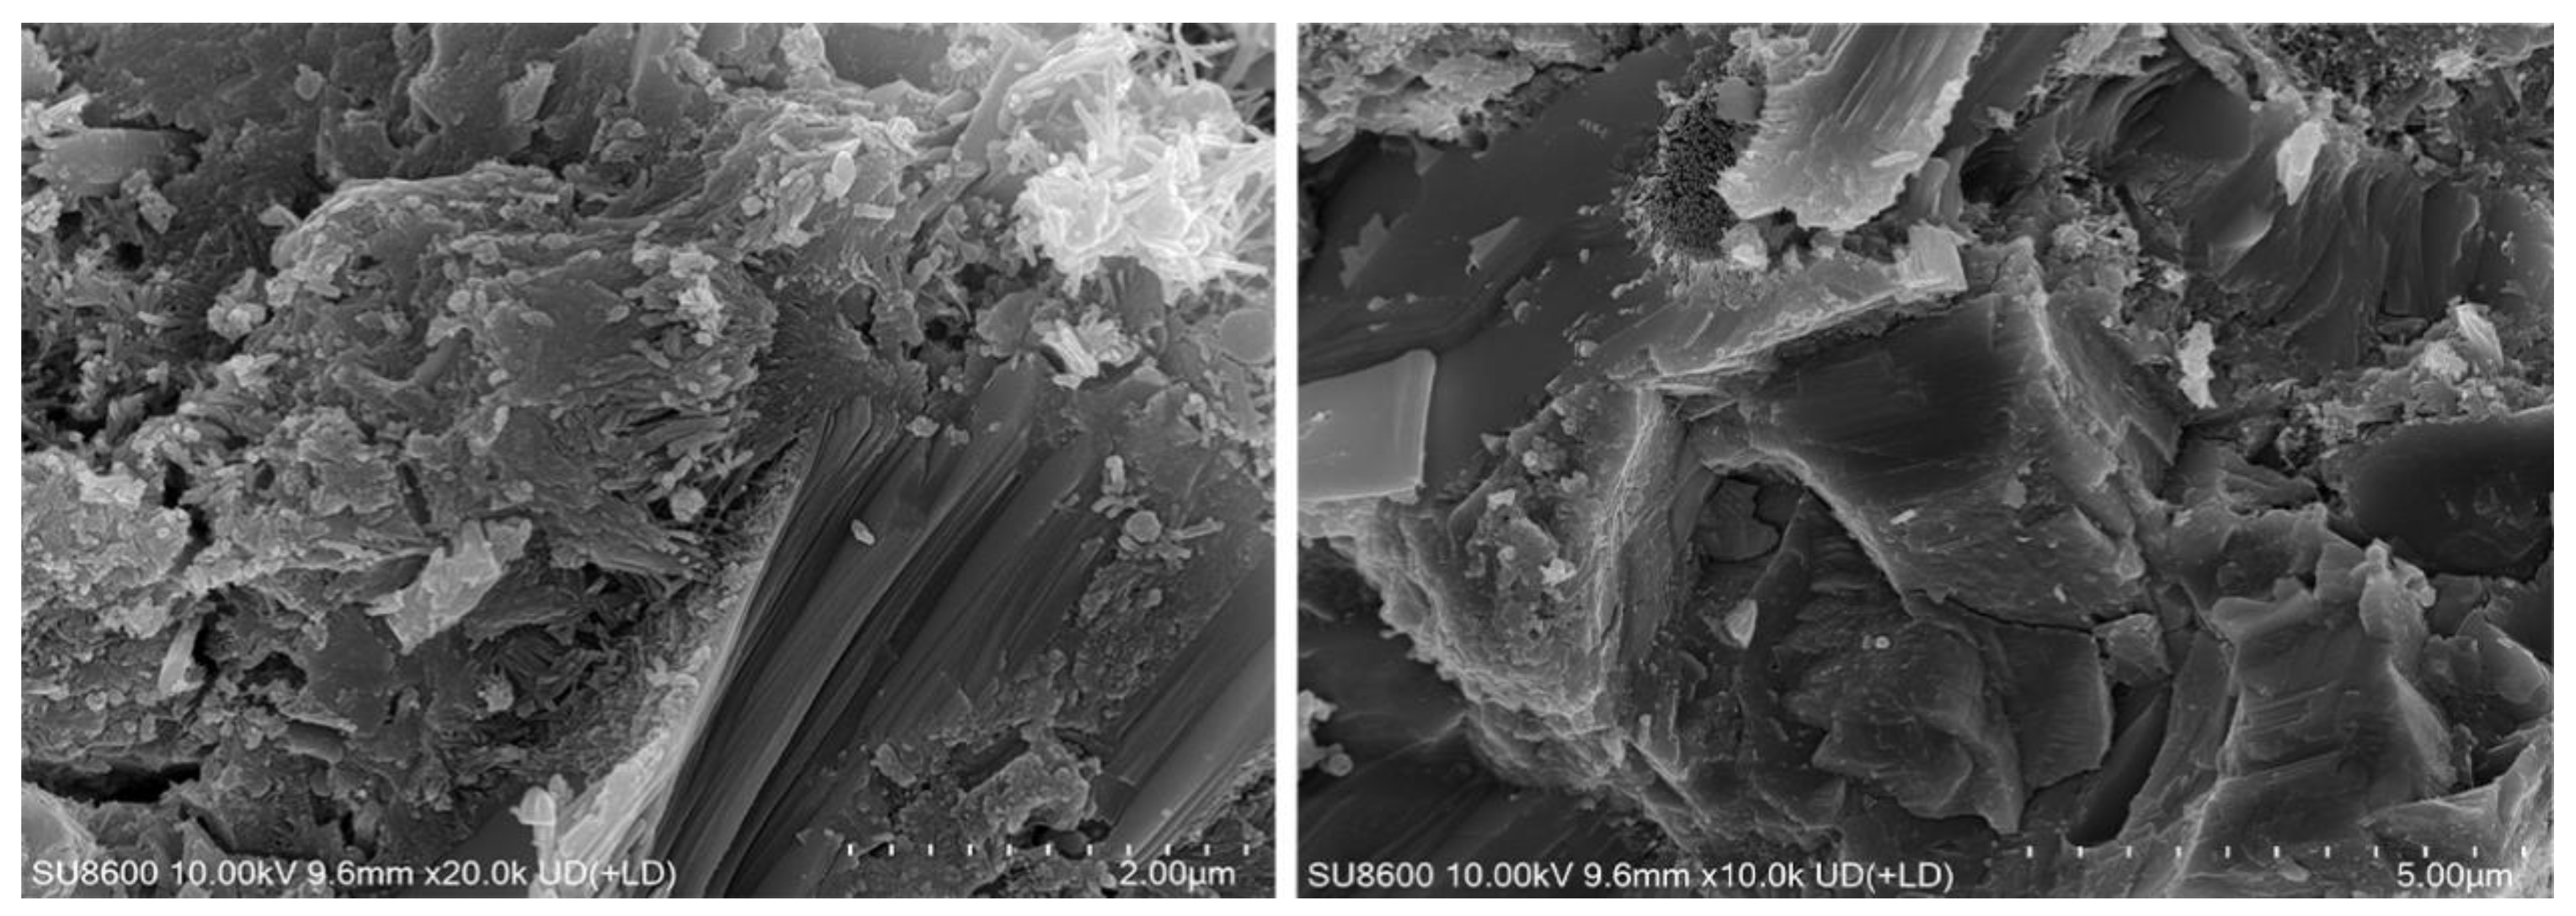
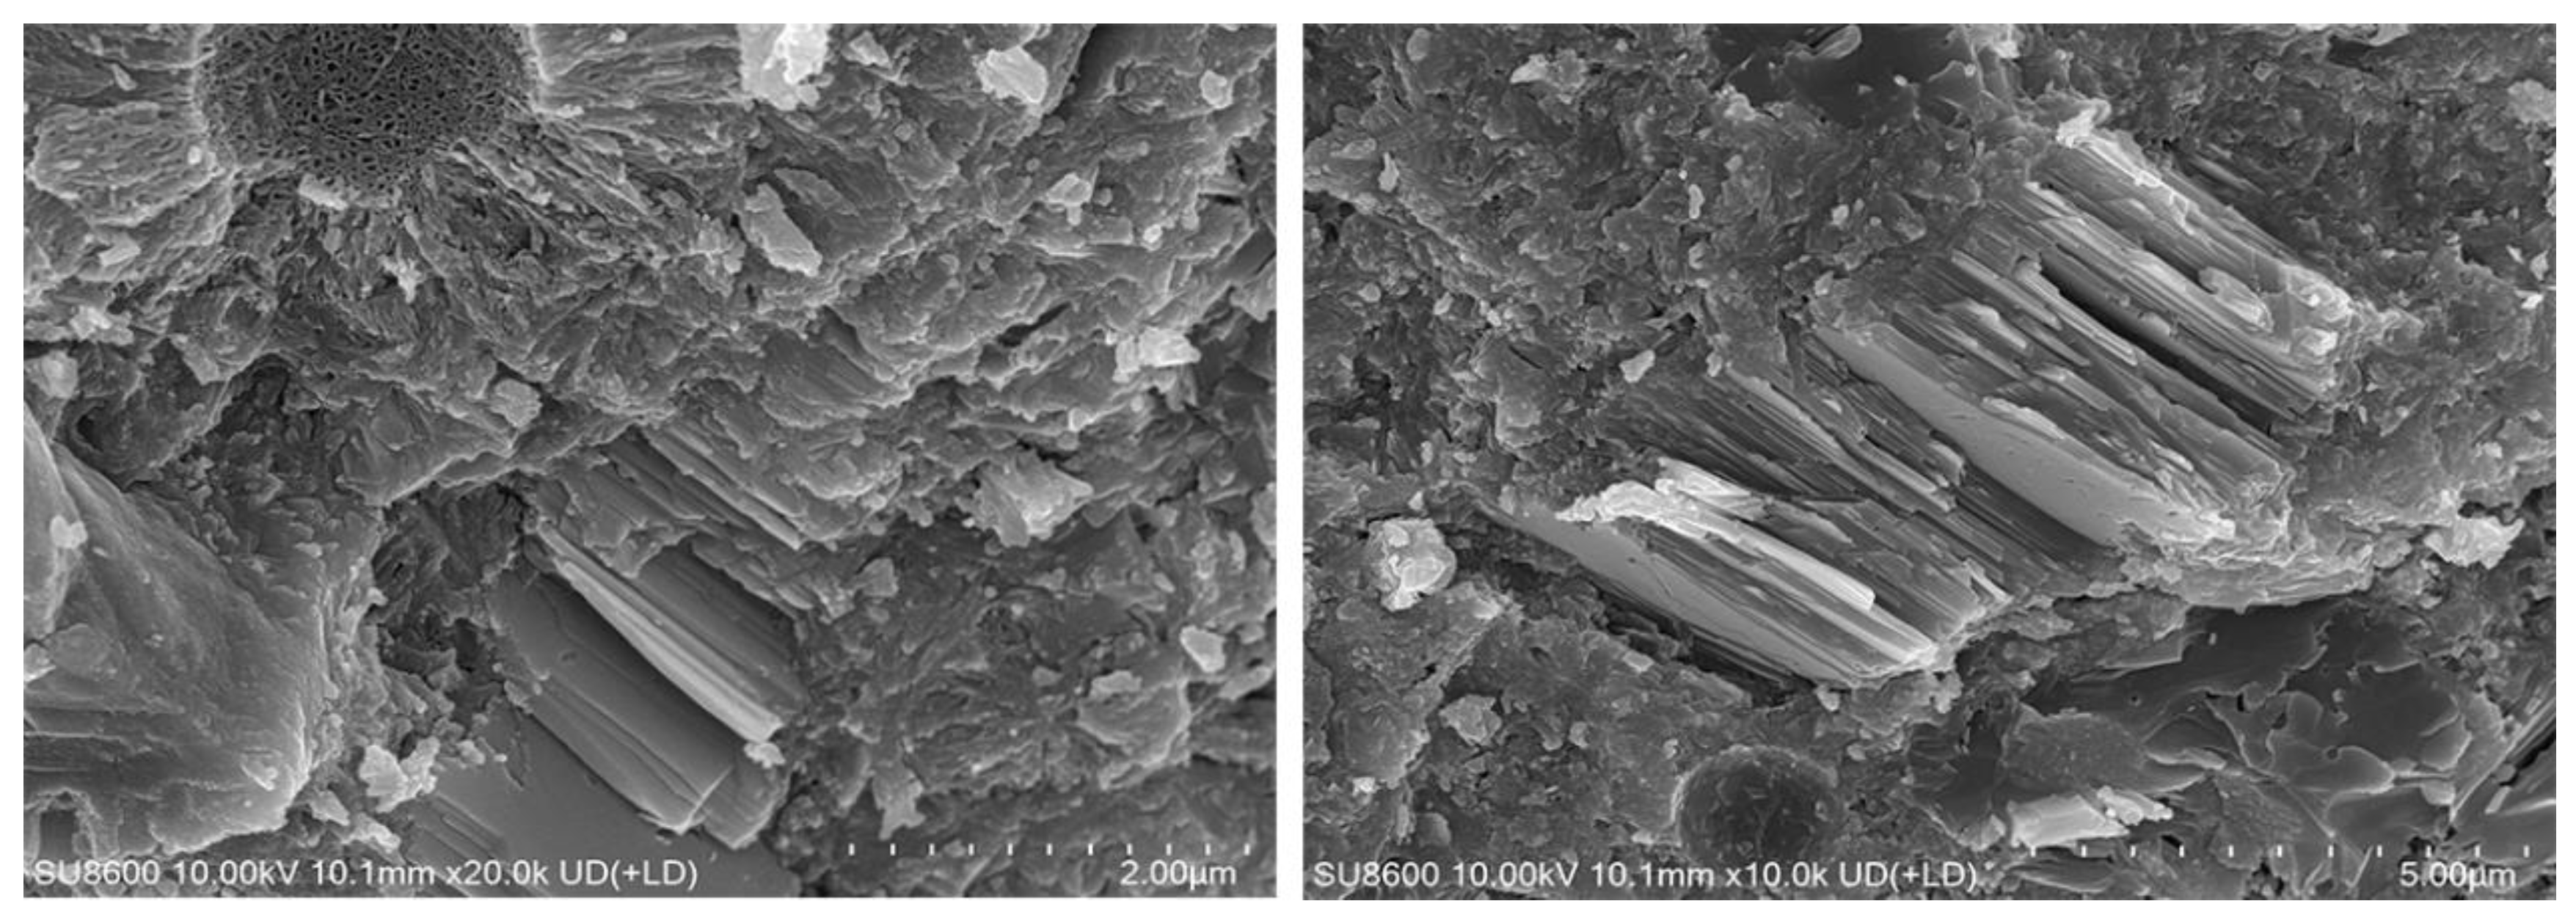
2.3.2. Scanning Electron Microscope
2.3.3. Energy Spectrum Analysis
3. Conclusions
- This experiment found that temperature has an effect on the mechanical properties of concrete. The compressive strength, splitting tensile strength, axial tensile strength, elastic modulus and its growth rate of standard curing and quasi-environmental curing increase with the increase of temperature. The temperature decreases and decreases. The temperature change has the greatest influence on the splitting tensile strength of concrete.
- This test found that the difference of concrete performance change is within the acceptable range. It shows that the research done by the laboratory has a strong reference significance for the actual situation on the spot.
- The hyperbolic fitting function based on F-P equivalent age and D-L equivalent age can well predict the development law between maturity and strength. Strength increases with the increase of maturity.
- Microscopic experiments show that there is a large amount of C-S-H gel in the later stage of low heat cement. Compact structure, And has the effect of micro expansion, It is beneficial to the development of mechanical properties of low heat cement concrete in the later stage.
Fund project
References
- Feifei, L.; Haibo, J.; Pengfei, X.; et al. Study on temperature control and crack prevention of lining structure of high geothermal hydraulic tunnel based on concrete hydration heat effect. Tunn. Constr. (Engl. Chin.) 2024, 44, 1262–1273. [Google Scholar]
- Chen, G.; Liu, Y.; Ji, G.; et al. Study on the application of low heat Portland cement in hydraulic concrete. Water Conserv. Hydropower Technol. (Engl. Chin.) 2021, 52, 191–200. [Google Scholar]
- Pan, L.; Xu, W.; Liang, Z.; et al. Research on anti-cracking technology of mass concrete for main pier cap of Changtai Yangtze River Bridge. Bridge Constr. 2024, 54, 8–14. [Google Scholar]
- Wang, L.; Yang, H.; Zhou, S.; et al. Mechanical properties, long-term hydration heat, shinkage behavior and crack resistance of dam concrete designed with low heat Portland (LHP) cement and fly ash. Constr. Build. Mater. 2018, 187, 1073–1091. [Google Scholar] [CrossRef]
- Li, X.; Huang, X.; Xu, F.; et al. The correlation of basic mechanical indexes of C20 ~ C120 concrete[J/OL]. China Civ. Eng. J. 2024, 1–14. [Google Scholar]
- Zhou, B.; Gu, L.; Wu, Y.R.; et al. A deformability-based mechanical model for predicting shear strength of FRP-strengthened RC beams failed in concrete cover separation. Eng. Fract. Mech. 2024, 311, 110537. [Google Scholar] [CrossRef]
- Garba, J.M.; Tian, Y.; Shalaby, Y.; et al. Effects of liquid accelerators on long-term mechanical strength development and microstructural changes of wet-mixed shotcrete. J. Build. Eng. 2024, 97, 110926. [Google Scholar] [CrossRef]
- Guan, B.; Lu, X.; Chen, B. Effect of curing temperature on thermal conductivity of low heat cement concrete at early age. Yangtze River 2023, 54, 222–229. [Google Scholar]
- Shen, X. Study on the performance of low heat Portland cement in simulated harsh environment of plateau. China Research Institute of Building Materials Science, 2023.
- Ai, D.; Chen, C.; Zhu, H. Monitoring of compressive strength gain in mass concrete using embedded piezoelectric transducers. Struct. Des. Tall Spec. Build. 2024, 33, e2162. [Google Scholar] [CrossRef]
- Kim, S.; Jung, D.; Kim, Y.J.; et al. Study on Early Age Concrete’s Compressive Strengths in Unmanaged Curing Condition Using IoT-Based Maturity Monitoring. Buildings 2024, 14. [Google Scholar] [CrossRef]
- Sun, B.; Dominicus, R.; Dong, E.; et al. Predicting the strength development of 3D printed concrete considering the synergistic effect of curing temperature and humidity: From perspective of modified maturity model. Constr. Build. Mater. 2024, 427. [Google Scholar] [CrossRef]
- Hailu, B.T.; Safat, D.A.; Mohammad, S.U.A.; et al. Maturity method to estimate early age concrete strength in cold weather: Alternative activation energy calibration. Aust. J. Civ. Eng. 2024, 22, 1–12. [Google Scholar]
- National energy board. Code for construction of hydraulic concrete: DL/T 5144-2015. Beijing: China electric power press, 2015.
- Dai, J.; Wang, Q.; Qu, S.; et al. Strength prediction model of low temperature curing concrete based on maturity theory. J. Mater. Sci. Eng. 2018, 36, 263–267. [Google Scholar]
- Zhong, Y.; Wu, L.; Liu, C.; et al. Early age strength test and maturity analysis of low heat cement concrete. Yangtze River 2021, 52, 186–192. [Google Scholar]
- Luo, Q.; Xing, F.; Han, N.; et al. Prediction of early strength of concrete by simplified weight maturity method. Concrete 2010, 39–42. [Google Scholar]
- Liu, Z.; Hu, Y.; Wu, K.; et al. Study on the development characteristics of early age fracture properties of low heat cement concrete. Yangtze River 2022, 53, 175–181. [Google Scholar]
- Zhao, M. Prediction of very early age strength of concrete based on maturity method. He Fei: Hefei University of technology, 2021.
- Hetmanczyk, P.M. A Method to Evaluate the Maturity Level of Robotization of Production Processes in the Context of Digital Transformation—Polish Case Study. Appl. Sci. 2024, 14, 5401. [Google Scholar] [CrossRef]
- Hee-Bok, C.; Gwang-Hee, K.; Kyung-In, K. Predicting the Strength of Recycled Aggregate Concrete—Predicting the strength of artificial neural networks and maturity method. J. Archit. Inst. Korea Struct. Constr. 2005, 21, 49–55. [Google Scholar]
- Kim, T.; Rens, L.K. Concrete Maturity Method Using Variable Temperature Curing for Normal and High-Strength Concrete. I: Experimental Study. J. Mater. Civ. Eng. 2008, 20, 727–734. [Google Scholar] [CrossRef]

| cement | CaO | SiO2 | Al2O3 | MgO | Fe2O3 | SO3 | F-CaO | Loss | K2O | Na2O | R2O |
| LHC | 59.8 | 23.04 | 4.42 | 3.2 | 4.30 | 2.52 | 0.84 | 1.09 | 0.56 | 0.26 | 0.63 |
| cement | specific surface area/m2.kg-1 | Density/g.cm-3 | normal consistency/% | setting time/min | hydration heat/kj.kg-1 | compressive strength/MPa | break off strength/MPa | ||||||||
| initial set | final set | 3d | 7d | 3d | 7d | 28d | 90d | 3d | 7d | 28d | 90d | ||||
| LHC | 317.6 | 3.23 | 27.7 | 216 | 291 | 188 | 220 | 17.4 | 30.3 | 51.3 | 67.4 | 3.9 | 5.0 | 7.0 | 8.2 |
| aggregate | coarse aggregate | fine aggregate | |
| grain size/mm | 20-40 | 5-20 | ≤5 |
| Dry apparent density of saturated surface/kg/m3 | 2680 | 2650 | 2630 |
| water absorption at saturated surface-dry basis/kg/m3 | 0.42 | 0.63 | 0.80 |
| soil content/% | 0.5 | 0.2 | 1.4 |
| fineness modulus | - | - | 2.8 |
| numbering | water-binder ratio | Flyash/% | Admixture/% | amount/kg.m-3 | ||||||
| water reducing admixture | air entraining agent | water | cement | flyash | sand | pebble | nakaishi | |||
| DRH | 0.36 | 25 | 1 | 0.006 | 140 | 291.7 | 97.2 | 771.6 | 566.8 | 469 |
| DRH-Ⅰ | DRH-Ⅱ | |||||||||||||
| Time/d | 1 | 3 | 7 | 14 | 28 | 56 | 90 | 1 | 3 | 7 | 14 | 28 | 56 | 90 |
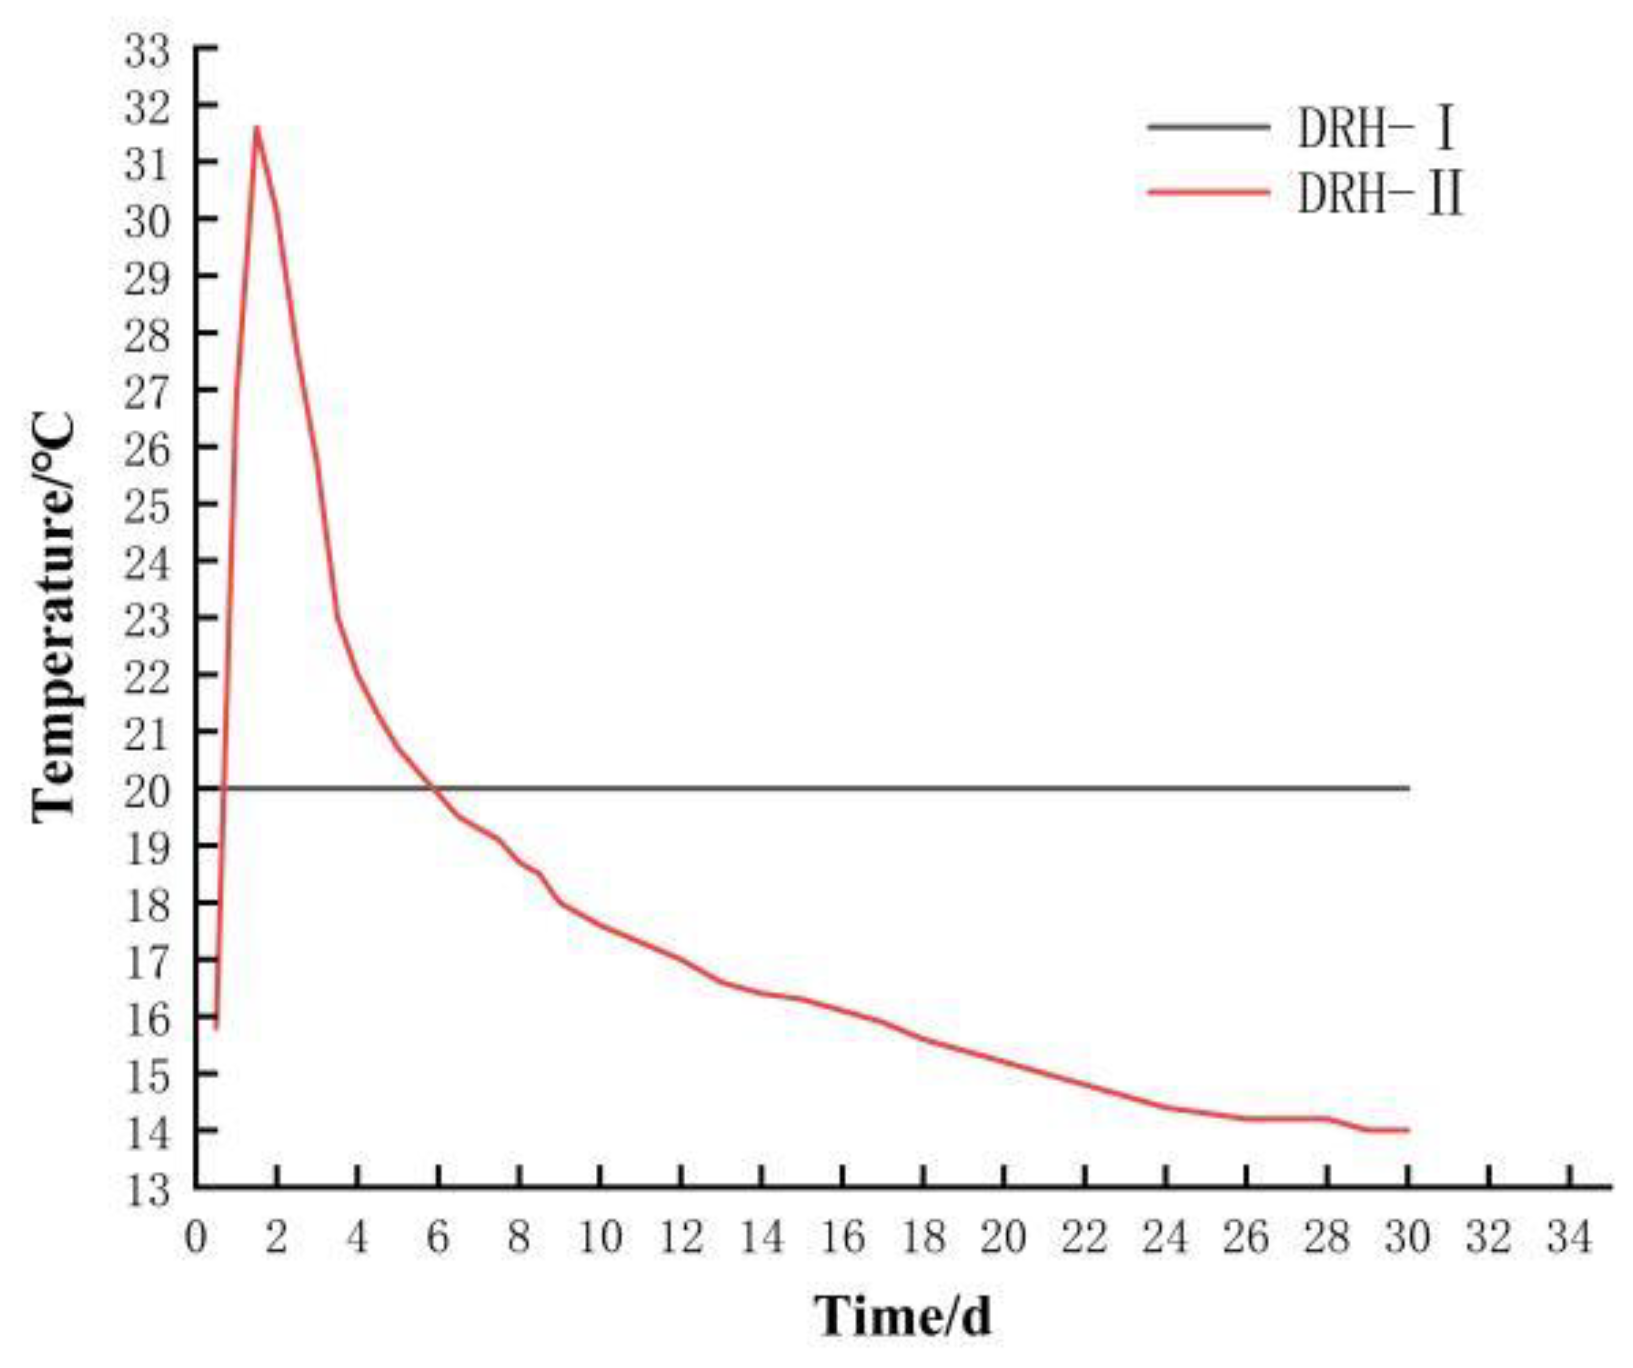
| Temperature/℃ | 20 | 26.8 | 25.7 | 19.5 | 16.6 | 14.2 | 20 | 20 | ||||||
| N-S/(℃.d) | 30 | 90 | 210 | 420 | 840 | 1680 | 2700 | 36.8 | 107.1 | 206.5 | 372.4 | 677.4 | 1680 | 2700 |
| F-P/d | 1 | 3 | 7 | 14 | 28 | 56 | 90 | 1.366 | 3.9 | 6.834 | 11.629 | 19.763 | 56 | 90 |
| D-L/d | 1 | 3 | 7 | 14 | 28 | 56 | 90 | 1.04 | 3.93 | 6.86 | 11.76 | 20.72 | 56 | 90 |
Disclaimer/Publisher’s Note: The statements, opinions and data contained in all publications are solely those of the individual author(s) and contributor(s) and not of MDPI and/or the editor(s). MDPI and/or the editor(s) disclaim responsibility for any injury to people or property resulting from any ideas, methods, instructions or products referred to in the content. |
© 2025 by the authors. Licensee MDPI, Basel, Switzerland. This article is an open access article distributed under the terms and conditions of the Creative Commons Attribution (CC BY) license (http://creativecommons.org/licenses/by/4.0/).


