
Submitted:
02 January 2025
Posted:
07 January 2025
You are already at the latest version
Abstract
The aim of this study is to clarify the characteristics of BDR in the membrane reactor using Pd/Cu membrane and Ni/Cr catalyst by the numerical simulation. This study has conducted the numerical simulation using the CFD software COMSOL Multiphysics ver. 6.2. The impact of the initial reaction temperature and the thickness of Pd/Cu membrane on the characteristics of BDR in the membrane reactor using Pd/Cu membrane and Ni/Cr catalyst is also investigated. The initial reaction temperature is changed by 400 ℃, 500 ℃ and 600 ℃ and the thickness of Pd/Cu membrane is changed by 20 m, 40 m and 60 m. The molar concentrations of CH4 and CO2 decrease with the increase in the initial reaction temperature, while the molar concentrations of H2, CO, H2O and C increase with the increase in the initial reaction temperature. In addition, the molar concentrations of H2 in reaction chamber, Pd/Cu membrane and sweep chamber increase with the increase in the initial reaction temperature. Moreover, the molar concentrations of H2 in Pd/Cu membrane and sweep chamber increase with the decrease in the thickness of Pd/Cu membrane. It is revealed that CH4 conversion, CO2 conversion and H2 yield increase with the increase in the initial reaction temperature as well as the decrease in the thickness of Pd/Cu membrane.
Keywords:
biogas dry reforming
; membrane reactor
; numerical simulation
; thickness of membrane
; Ni/Cr catalyst
1. Introduction
Green H2 is one of promising procedure to solve the global warming problem. Though there is a lot of technology to produce green H2, this study focuses on a biogas dry reforming (BDR) as a technology to produce green H2. A biogas is a fuel consisting of CH4 (55-75 vol%) and CO2 (25-45 vol%) [1], generally. A biogas is produced from fermentation by the action of anaerobic microorganisms on raw materials, e.g., garbage, livestock excretion, and sewage sludge. 1.46 EJ of biogas gas produced in the world in 2020, which was five times as large as that in 2000 [2]. Consequently, it can be expected that the amount of produced biogas increases more in the near future.
A biogas is generally used as a fuel for gas engines and micro gas turbines [3]. However, the power output is lower compared to using a natural gas as a fuel since the heating value is lower due to including CO2. This study has suggested the combination system consisting of a BDR reactor with a solid oxide fuel cell (SOFC) to solve this problem [4,5,6]. CO which is a by-product from BDR can be utilized as a fuel for SOFC. The total energy conversion efficiency is higher than the existing power generation systems, i.e., gas engines and micro gas turbines since SOFC can be a co-generation system.
There are many reported researches on BDR recently [7,8,9,10,11,12,13,14]. The development of catalyst is one subject to improve the performance of BDR. From the literature survey, this study can claim that Ni-based catalysts have been investigated for BDR [7,8,9,10,11,12,13,14]. Ni/Ce/Al was developed and performed of the CH4 conversion of 65 – 79 % and the CO2 conversion of 77 – 86 % at 750 ℃ [7]. La/Ni/SBA-16 exhibited the CH4 conversion of 86 % and the CO2 conversion of 92 % at 700 ℃ [8]. The CH4 conversion and the CO2 conversion increased with the increase in the reaction temperature from 600 ℃ to 700 ℃. Ni/CeO2/Al2O3 performed the CH4 conversion of approximately 100 % and the CO2 conversion of approximately 100 % at 800 ℃ [9]. Ni/γ-Al2O3 exhibited the CH4 conversion of 90 % and the CO2 conversion of 50 % at 800 ℃ [10]. Ni/CeZrO2 performed the CH4 conversion of approximately 40 % and the CO2 conversion of approximately 55 % at 800 ℃ [11]. The CH4 conversion and the CO2 conversion increased with the increase in the reaction temperature from 500 ℃ to 800 ℃. Ni/Al2O3 exhibited the CH4 conversion of approximately 70 % and the CO2 conversion of approximately 70 % at 700 ℃ [12]. Ni/La/Ti performed the CH4 conversion of approximately 100 % and the CO2 conversion of approximately 100 % at 800 ℃ [13]. The CH4 conversion and the CO2 conversion increased from 600 ℃ to 800 ℃ where they increased from approximately 78 % to 100 % and from approximately 55 % to 100 %, respectively. The thermogravimetric analysis for Ni/Cao/Al2O3 was investigated, which clarified the effect of heating rate on the H2 production rate considering some chemical reaction schemes [14]. When the heating rate increased from 5 K/min to 20 K/min, the maximum H2 production rate rose from 7 × 10⁻⁵ mol/s to 1 × 10⁻⁴ mol/s.
Though several Ni-based catalysts have been investigated, the Ni/Cr catalyst has not been examined well without authors’ previous studies [5,15].
In addition, this study thinks it is important to operate at lower temperature in order to improve the thermal energy efficiency of BDR, resulting that BDR is an endothermic reaction. We think a membrane reactor is an effective procedure to match this purpose since the H2 production rate of BDR is promoted by providing the non-equilibrium state with H2 separation from the reaction site of catalyst [5]. Pd is known as a material of H2 separation membrane [16]. The permeation of H2 from a high to a low partial pressure region occurs in the following several stages: (a) dissociative adsorption of H2 on the gas-metal interface; (b) sorption of the atomic H2 into the bulk metal; (c) diffusion of atomic H2 through the bulk metal membrane; (d) recombination of atomic H2 to from H2 molecules at the interface metal/gas permeate; (e) desorption of molecular H2 [16]. Since the cost of pure H2 is expensive, several Pd alloys are considered as a material of H2 separation membrane. Though several Pd alloy membranes such as Pd/Ag and Pd/Au are commercialized as well as used for the research works, the cost of Pd/Cu is relatively smaller compared to that of Pd/Ag, Pd/Au and pure Pd. We think the cost is important factor to apply the proposed system to the industry in the near future. Therefore, this study selects the Pd/Cu as H2 separation membrane. It is reported that Pd/Cu was used for H2 separation membrane used for the previous study [17]. The commercial catalysts such as Al2O3, Cr2O3, CrO3 and CuO were used for a water gas shift reaction (WGS) in the study. The increase in the conversion rate increased with the steam/carbon ratio from 1 to 3 and became smooth from 4 to 5. The membrane reactor using Pd/Cu membrane and Ni/Cu catalyst was investigated by the previous study conducted by the authors of this study experimentally [5]. Though the numerical study on BDR using Ni/Cr catalyst in the rectangular reactor was conducted by the authors of this study [15], the numerical study to clarify the characteristics of BDR conducted in the membrane reactor using Pd/Cu membrane and Ni/Cu catalyst has not been investigated yet.
Therefore, the aim of this study is to clarify the characteristics of BDR in the membrane reactor using Pd/Cu membrane and Ni/Cr catalyst by the numerical simulation. This study conducts the numerical simulation using the CFD software COMSOL Multiphysics ver. 6.2. Since there are many previous studies using COMSOL Multiphysics for the numerical simulation of BDR on reaction characteristic as well as heat and mass transfer [18,19,20,21], this study has adopted COMSOL Multiphysics for the numerical analysis in this study. The impact of the initial reaction temperature and the thickness of Pd/Cu membrane on the characteristics of BDR in the membrane reactor using Pd/Cu membrane and Ni/Cr catalyst is also investigated. The initial reaction temperature is changed by 400 ℃, 500 ℃ and 600 ℃. The thickness of Pd/Cu membrane is changed by 20 μm, 40 μm and 60 μm. 2D model which simulates the membrane reactor used in the authors’ previous studies [4,5] is adopted in order to short the calculation time though the actual experimental reactors 3D. The molar ratio of CH4:CO2 is set 1.5:1, which simulates a biogas in this study. To investigate the initial reaction temperature and the thickness of Pd/Cu membrane on the characteristics of BDR including the other reactions, the following reactions are considered:
<Dry reforming (DR)>
CH4 + CO2 ↔ 2H2 + 2CO + 247 kJ/mol
<Steam reforming (SR)>
CH4 + H2O ↔ CO + 3H2 + 206 kJ/mol
<Reverse water gas shift reaction (RWGS)>
CO2 + H2 ↔ CO + H2O + 41 kJ/mol
<Methanation reaction (MR)>
CO2 + 4H2 ↔ CH4 + 2H2O -165.0 kJ/mol
<Methane decomposition reaction (MDR)>
CH4 ↔ C + 2H2 + 74 kJ/mol
<Boudouard reaction (BD)>
2CO ↔ C + CO2 -172 kJ/mol
2. Numerical Simulation Procedure of BDR Membrane Reactor Using Pd/Cu Membrane and Ni/Cr Catalyst
2.1. A Mathematical Formation
This study conducted the numerical simulation by a commercial multi-physics software, COMSOL Multiphysics, ver. 6.2. As to COMSOL Multiphysics, we can select to customize various partial differential equations and combine to achieve direct coupled multi-physics field analysis easily [22]. COMSOL Multiphysics has simulation function codes. The following governing equations are involved in COMSOL Muitiphysics.
The equations of mass conservation in porous material can be defined as following:
where means a velocity vector [m/s], κ means a permeability [m2], μ indicates a viscosity [Pa∙s], ρ indicates a density [kg/m3], g indicates a gravitational acceleration [m2/s], D indicates a height [m], and Qm indicates a mass source term [kg/(m3∙s)].
The equation of momentum conservation in porous material can be defined by the Brinkmann equation, as following:
where εp indicates a porosity [-], indicates an unit vector [-], and indicates a force vector [kg/(m3∙s)].
The equation of mass transfer in porous material can be defined by the Maxell-Stefan equation, as following:
where ωi, ωk indicates a mass ratio of chemicals i and k, respectively [-], indicates a Fick’s diffusion coefficient of effective multi components [m2/s], indicates a thermal diffusion coefficient [kg/(m·s)], and indicates a reaction rate of chemical species [mol/(m3·s)].
The equations of heat transfer in porous material can be defined as following:
where f indicates a physical quantity on fluid [-], Cp indicates a constant pressure specific heat [J/(kg·K)], indicates a thermal flux vector [W/m2], Q indicates a thermal source [W/m3], Qp indicates a thermal source due to pressure loss [W/m3], Qvd indicates a thermal source due to viscosity dissipation [W/m3], and keff indicates an effective thermal conductivity [W/(m·K)].
2.2. 2D Numerical Simulation Model of BDR Membrane Reactor
Figure 1 illustrates the overview of 2D model. The dimension of reaction chamber and sweep chamber in 2D model is 40 mm × 100 mm. The inlet and the outlet of reaction chamber and sweep chamber are set in 2D model. The length of inlet and outlet of reaction chamber and sweep chamber is 6 mm, which is located vertically in Figure 1. Pd/Cu membrane which is used for H2 separation is located between the reaction chamber and the sweep chamber. The thickness of Pd/Cu membrane is 20 μm, 40 μm and 60 μm, which is followed from the authors’ previous experimental studies [23,24].
2.3. Kinetic Modeling of BDR
This study considers the reaction scheme shown by Equations (1) – (6) for the numerical simulation. Reaction rates of these equations are defined as follows [25,26,27]:
<Dry reforming (DR)>
where , , , .
<Reverse water gas shift reaction (RWGS)>
where , .
<Steam reforming (SR)>
where , , , , , .
<Methanation reaction (MR)>
where , , , , , .
<Methane decomposition reaction (MDR)>
where , , , .
<Boudouard reaction (BD)>
where , , , . In addition, is a kinetic rate (n = 1, 2, 3, 4, 4, 6) [mol/(kg・s)], is a kinetic constant (n = 1, 2, 3, 4, 5, 6) [mol/(kg・s)], is a particle pressure of chemical species i [Pa], is an equilibrium constant (n = 1, 2, 3, 4, 5, 6) [-] and is an absorption equilibrium constants of chemical species i [-].
2.4. Numerical Simulation Parameters and Conditions in This Study
In this study, the molar ratio of CH4:CO2 is set at 1.5:1, which simulates a biogas. The initial reaction temperature is changed by 400 ℃, 500 ℃ and 600 ℃. Ni/Cr alloy is assumed to be the catalyst, which was used for the authors’ previous experimental studies [5,24]. The weight ratio of Cr to the whole weight of Ni/Cr alloy is 20 wt%. The porosity, permeability, constant pressure specific heat and thermal conductivity of Ni/Cr alloy catalysts are estimated considering the weight ratio of Cr. The porosity (εp) is set at 0.95.
The thickness of Pd/Cu membrane is changed by 20 μm, 40 μm and 60 μm. Table 1 lists the main physical properties and parameters for the numerical simulation in this study.
In this study, the following assumptions are set:
- (i)
- Catalyst is a porous material. The porosity, permeability, constant pressure specific heat and thermal conductivity and isotropic.
- (ii)
- Wall temperature is isothermal.
- (iii)
- Gas is a Newton fluid and an ideal gas.
- (iv)
- Wall of reactor excluding inlet and outlet is no-slip.
- (v)
- The pressure of outlet is atmosphere (gauge pressure = 0 Pa).
- (vi)
- The temperature of inflow gas is same as the initial reaction temperature.
- (vii)
- The produced carbon is treated as a gas.
As to (vii), a solid carbon is produced by Equations (5) and (6) generally. However, COMSOL Multiphysics used by this study can’t treat a solid carbon and treat a gaseous carbon. Consequently, this study has considered the assumption (vii).
2.5. Evaluation Factor for Reaction Characteristics in This Study
In this study, the evaluation factors are considered as follows:
where means a molar concentration of CH4 at the inlet [mol], means a molar concentration of CH4 at the outlet [mol].
where means a molar concentration of CO2 at the inlet [mol], means a molar concentration of CO2 at the outlet [mol].
where means a molar concentration of H2 at the outlet [mol].
where means a molar concentration of CO at the outlet [mol].
3. Results and Discussion
3.1. Comparison of the Distriburtion of Pressure along x Direction among Different Initial Reaction Temperature and Thickness of Pd/Cu Membrane
Figure 2 shows the comparison of the distribution of pressure along x direction in reaction chamber (y = 62 mm), Pd/Cu membrane (y = 40 mm) and sweep chamber (y = 20 mm) changing the initial reaction temperature. In this figure, the thickness of Pd/Cu membrane is 20 μm.
It is seen from Figure 2 that the pressure in reaction chamber as well as Pd/Cu membrane decreases along x direction. This is due to the permeation resistance of porous catalyst and Pd/Cu membrane. In addition, we can know that the pressure in reaction chamber as well as Pd/Cu membrane increases with the increase in the initial reaction temperature. It is thought from the state equation, i.e. pV = nRT that the pressure increases with the increase in the temperature. Moreover, the pressures near the inlet and the outlet changes rapidly, especially for those in sweep chamber. Since the length of inlet and outlet of reaction chamber and sweep chamber is 6 mm which is shorter than the height of reaction chamber and sweep chamber of 40 mm, the large pressure change occurs due to the change in cross sectional area for the gas flow.
Figure 3 shows the comparison of the distribution of pressure along x direction in reaction chamber (y = 62 mm), Pd/Cu membrane (y = 40 mm) and sweep chamber (y = 20 mm) changing the thickness of Pd/Cu membrane. In this figure, the initial reaction temperature is 600 ℃. It is seen from Figure 3 that the pressure in reaction chamber as well as Pd/Cu membrane decreases along x direction. This is due to the permeation resistance of porous catalyst and Pd/Cu membrane. According to Figure 3, the pressure in Pd/Cu membrane is higher with the decrease in the thickness of Pd/Cu membrane though the impact of the thickness of Pd/Cu membrane on pressure in reaction chamber and sweep chamber is very small. Since the permeation resistance decreases with the decrease in the thickness of Pd/Cu membrane, the pressure in Pd/Cu membrane is higher.
3.2. Comparison of Each Gas Concentration along x Direction among Different Initial Reaction Temperature and Thickness of Pd/Cu Membrane
Figure 4 shows the comparison of distribution of each gas concentration along x direction in reaction chamber (y = 62 mm) among different initial reaction temperatures. The thickness of Pd/Cu membrane is 20 μm in this figure. According to Figure 4, it is clear that the molar concentrations of CH4 and CO2 decrease with the increase in the initial reaction temperature, while the molar concentrations of H2, CO, H2O and C increase with the increase in the initial reaction temperature. Since Equation (1) is an endothermic reaction, it can be thought the molar concentrations of CH4 and CO2 decrease and those of H2 and CO increase with the increase in the initial reaction temperature. As to the formation of H2O and C, it is thought that Equations (3), (4), (5) and (6) might occur. The formation of H2O and C were observed by the authors’ previous experimental study [23]. After the experiments, carbon was observed as shown in Figure 5 [23]. On the other hand, the formation of H2O was confirmed by the observation by means of the gas bag shown in Figure 6.
Figure 7 shows the impact of the initial reaction temperature on distributions of molar concentration of H2 along x direction in reaction chamber (y = 62 mm), Pd/Cu membrane (y = 40 mm) and sweep chamber (y = 20 mm). It is seen from Figure 7 that the molar concentration of H2 increases along through x direction in reaction chamber, Pd/Cu membrane and sweep chamber. Since the H2 production reactions, i.e., Equations (1), (2) and (5) occur along through x direction, the molar concentration of H2 increases along through x direction. In addition, it is observed that the molar concentration of H2 in reaction chamber, Pd/Cu membrane and sweep chamber increases with the increase in the initial reaction temperature. Since the H2 production reactions, i.e., Equations (1), (2) and (5) are endothermic reactions, the molar concentration of H2 increases with the increase in the initial reaction temperature. In addition, it is known from Figure 7 that the molar concentrations of H2 in Pd/Cu membrane and sweep chamber are higher when the molar concentration of H2 in reaction chamber is higher. Since the molar concentration of H2 in reaction chamber is higher, the driving force to permeate the Pd/Cu membrane being stronger due to the large H2 partial pressure difference between the reaction chamber and the sweep chamber [23]. As a result, the molar concentration of H2 in Pd/Cu membrane and sweep chamber are higher.
Figure 8 shows the comparison of distribution of each gas concentration along x direction in reaction chamber (y = 62 mm) among different thicknesses of Pd/Cu membrane. It is seen from Figure 8 that the impact of thickness of Pd/Cu membrane on each gas concentration along x direction in reaction chamber is small. However, it is found that the molar concentrations of H2 in Pd/Cu membrane and sweep chamber increase with the decrease in the thickness of Pd/Cu membrane according to Figure 9. Since the penetration resistance of Pd/Cu membrane decreases with the decrease in the thickness of Pd/Cu membrane, the molar concentrations of H2 in Pd/Cu membrane and sweep are higher with the decrease in the thickness of Pd/Cu membrane.
3.3. Investigation on Reaction Characteristics by Evaluation Factors
To investigate the reaction characteristics of BDR including the other reactions considered in this study, Table 2 lists CH4 conversion, CO2 conversion, H2 yield, H2 selectivity and CO selectivity for various initial temperature using the thickness of Pd/Cu membrane of 20 μm and various thickness of Pd/Cu membrane at the initial temperature of 600 ℃.
According to Table 2, it is revealed that CH4 conversion, CO2 conversion and H2 yield increase with the increase in the initial reaction temperature. Since Equations (1), (2), (3) and (5) are endothermic reactions, the consumption of CH4 and CO2 as well as the production of H2 increase more with the increase in the initial reaction temperature. In addition, it is clear from Table 2 that CH4 conversion, CO2 conversion and H2 yield increase with the decrease in the thickness of Pd/Cu membrane. Since the penetration resistance of Pd/Cu membrane decreases with the decrease in the thickness of Pd/Cu membrane, the permeation of H2 through Pd/Cu membrane is promoted. As a result, it is thought that Equations (1), (2) and (5), which are reactions of producing H2, would be non-equilibrium state. Therefore, the consumption of CH4 and CO2 as well as the production of H2 increase more with the decrease in the thickness of Pd/Cu membrane. According to Equation (5), C would be produced more if the reaction becomes non-equilibrium state by separating H2 from reaction chamber via Pd/Cu membrane. This phenomenon is confirmed by Figure 4.
As described in Introduction part, the previous studies reported that CH4 conversion and CO2 conversion are approximately 40 - 100 % and 50 - 100 %, respectively [7,8,9,10,11,12,13,14]. These values of CH4 conversion and CO2 conversion are higher than those obtained in this study. This study thinks that the initial reaction temperature of 600 ℃ is not enough to obtain higher performance of BDR, which is compared to the previous studies [7,8,9,10,11,12,13,14]. According to the previous reports using Ni alloy catalysts, CH4 conversion, H2 yield and H2 selectivity increased with the increase in the initial reaction temperature and higher values were obtained over 600 ℃ [28,29,30,31]. This study proposes that the following subjects can be considered to improve the performance of H2 production: (i) the optimization of catalyst shape and composition, (ii) the optimization of thickness and composition of Pd/Cu membrane, (iii) the optimization of H2 separation rate of Pd/Cu membrane and H2 production rate of the catalyst. This study would like to conduct these subjects.
4. Conclusions
This study has clarified the characteristics of BDR in the membrane reactor using Pd/Cu membrane and Ni/Cr catalyst by the numerical simulation with COMSOL Multiphysics. The initial reaction temperature has been changed by 400 ℃, 500 ℃ and 600 ℃. The thickness of Pd/Cu membrane has been changed by 20 μm, 40 μm and 60 μm. As a result, the following conclusions can be drawn:
- (i)
- The pressure in reaction chamber as well as Pd/Cu membrane decreases along x direction and they increase with the increase in the initial reaction.
- (ii)
- The pressure in Pd/Cu membrane is higher with the decrease in the thickness of Pd/Cu membrane though the impact of the thickness of Pd/Cu membrane on pressure in reaction chamber and sweep chamber is very small.
- (iii)
- It is revealed that the molar concentrations of CH4 and CO2 decrease with the increase in the initial reaction temperature, while the molar concentrations of H2, CO, H2O and C increase with the increase in the initial reaction temperature. Since Equation (1) is an endothermic reaction, the molar concentrations of CH4 and CO2 decrease and those of H2 and CO increase with the increase in the initial reaction temperature. In addition, H2O and C are formed since it is thought that Equations (3), (4), (5) and (6) occur.
- (iv)
- It is revealed that the molar concentration of H2 increases along through x direction in reaction chamber, Pd/Cu membrane and sweep chamber. Since the H2 production reactions, i.e., Equations (1), (2) and (5) occur along through x direction, the molar concentration of H2 increases along through x direction.
- (v)
- It is revealed that the molar concentrations of H2 in reaction chamber, Pd/Cu membrane and sweep chamber increase with the increase in the initial reaction temperature. Since the H2 production reactions, i.e., Equations (1), (2) and (5) are endothermic reactions, the molar concentration of H2 increases with the increase in the initial reaction temperature.
- (vi)
- The molar concentrations of H2 in Pd/Cu membrane and sweep chamber are higher when the molar concentration of H2 in reaction chamber is higher. Since the molar concentration of H2 in reaction chamber is higher, the driving force to permeate the Pd/Cu membrane is stronger due to the large H2 partial pressure difference between the reaction chamber and the sweep chamber.
- (vii)
- It is revealed that the molar concentrations of H2 in Pd/Cu membrane and sweep chamber increase with the decrease in the thickness of Pd/Cu membrane. Since the penetration resistance of Pd/Cu membrane decreases with the decrease in the thickness of Pd/Cu membrane, the molar concentrations of H2 in Pd/Cu membrane and sweep are higher with the decrease in the thickness of Pd/Cu membrane.
- (viii)
- It is revealed that CH4 conversion, CO2 conversion and H2 yield increase with the increase in the initial reaction temperature as well as the decrease in the thickness of Pd/Cu membrane.
Author Contributions
Conceptualization and writing—original draft preparation, A.N.; methodology and software, R.I. and S.Y.; data curation, M.I. and T.H.; writing—review and editing, E.H..
Funding
This research was funded by KRI cooperation.
Data Availability Statement
The authors agree to share the data of the article published in this journal.
Conflicts of Interest
The authors declare no conflicts of interest.
References
- Kalai, D.Y.; Stangeland, K.; Jin, R.; Tucho, W.M.; Yu, Z. Biogas dry reforming for syngas production on La promoted hydrotalcitederived Ni Catalyst. Int. J. Hydrogen Energy 2018, 43, 19438–19450. [Google Scholar] [CrossRef]
- World Bioenergy Association. Available online: https://worldbioenergy.org/global-bioenergy-statistics (accessed on 12 December 2024).
- The Japan Gas Association. Available online: https://www.gas.or.jp/gas-life/biogas/ (accessed on 12 December 2024).
- Nishimura, A.; Takada, T.; Ohata, S.; Kolhe, M.L. Biogas dry reforming for hydrogen through membrane reactor utilizing negative pressure. Fuels 2021, 2, 194–209. [Google Scholar] [CrossRef]
- Nishimura, A.; Hayashi, Y.; Ito, S.; Kolhe, M.L. Performance analysis of hydrogen production for a solid oxide fuel cell system using a biogas dry reforming membrane reactor with Ni and Ni/Cr catalysts. Fuels 2023, 4, 295–313. [Google Scholar] [CrossRef]
- Nishimura, A.; Sato, R.; Hu, E. An energy production system powered by solar heat with biogas dry reforming reactor and solar heat with biogas dry reforming reactor and solid oxide fuel cell. Smart Grid and Renew. Energy 2023, 14, 85–106. [Google Scholar] [CrossRef]
- Dogan, M.Y.; Arbag, H.; Tasdemir, M.; Yasyerli, N.; Yasyerli, S. Effect of ceria content in Ni-Ce-Al catalyst on catalytic performance and carbon/coke formation in dry reforming of CH4. International Journal of Hydrogen Energy 2023, 48, 23013–23030. [Google Scholar] [CrossRef]
- Kiani, P.; Meshksar, M.; Rahimpour, M.R. Biogas reforming over La-promoted Ni/SBA-16 catalyst for syngas production: catalytic structure and process activity investigation. International Journal of Hydrogen Energy 2023, 48, 6262–6274. [Google Scholar] [CrossRef]
- Carrasco-Ruiz, S.; Zhang, Q.; Gandara-Loe, J.; Pastor-Perez, L.; Odriozola, J.A.; Reina, T.R.; Bobadilla, L.F. H2-rich syngas production from biogas reforming: overcoming coking and sintering using bimetallic Ni-based catalysts. International Journal of Hydrogen Energy 2023, 48, 27907–27917. [Google Scholar] [CrossRef]
- Ponugoti, P.V.; Pathmanathan, P.; Rapolu, J.; Gomathi, A.; Janardhanan, V.M. On the stability of Ni/γ-Al2O3 catalyst and the effect of H2O and O2 during biogas reforming. Applied Catalysis A, General 2023, 651. [Google Scholar] [CrossRef]
- Martin-Espejo, J.L.; Merkouri, L.P.; Gandara-Loe, J.; Odriozola, J.A.; Reina, T.R.; Pastor-Perez, L. Nickel-based cerium zirconate inorganic complex structures for CO2 valorisation via dry reforming of methane. Journal of Environmental Sciences 2024, 140, 12–23. [Google Scholar] [CrossRef]
- Cao, A.N.T.; Nguyen, H.H.; Pham, T.P.T.; Pham, L.K.H.; Phuong, D.H.L.; Nguyen, N.A.; Vo, D.V.N.; Pham, P.T.H. Insight into the role of material basicity in the coke formation and performance of Ni/Al2O3 catalyst for the simulated-biogas dry reforming. Journal of the Energy Institute 2023, 108. [Google Scholar] [CrossRef]
- Veiga, S.; Romero, M.; Faccio, R.; Segobia, D.; Apesteguia, C.; Perez, A.L.; Brondino, C.D.; Bussi, J. Biogas dry reforming over Ni-La-Ti catalysts for synthesis gas production: Effects of preparation method and biogas composition. Fuel 2023, 346. [Google Scholar] [CrossRef]
- Cherbanski, R.; Kotkowski, T.; Molga, E. Thermogravimetric analysis of coking during dry reforming of methane. International Journal of Hydrogen Energy 2023, 48, 7346–7360. [Google Scholar] [CrossRef]
- Nishimura, A.; Yamada, S.; Ichii, R.; Ichikawa, M.; Hayakawa, T.; Kolhe, M.L. Hydrogen yield enhancement in biogas dry reforming with a Ni/Cr catalyst: A numerical study. energies 2024, 17. [Google Scholar] [CrossRef]
- Jokar, S.M.; Farokhnia, A.; Tavakolian, M.; Pejman, M.; Parvasi, P.; Javanmardi, J.; Zare, F.; Clara Gonqalves, M.; Basile, A. The recent areas of applicability of palladium based membrane technologies for hydrogen production from methane and natural gas: a review. International Journal of Hydrogen Energy 2023, 48, 6451–6476. [Google Scholar] [CrossRef]
- Bang, G.; Moon, D.K.; Kang, J.H.; Han, Y.J.; Kim, K.M.; Lee, C.H. High-purity hydrogen production via a water-gas-shift reaction in a palladium-copper catalytic membrane reactor integrated with pressure swing adsorption. Chemical Engineering Journal 2021, 411. [Google Scholar] [CrossRef]
- Lee, S.; Lim, H. The power of molten salt in methane dry reforming: Conceptual design with a CFD study. Chemical Engineering Process.-Process Intersif. 2021, 159. [Google Scholar] [CrossRef]
- Lee, S.; Lim, H. The effect of changing the number of membranes in methane carbon dioxide reforming: A CFD study. International Journal of Engineering Chemistry. 2020, 87, 110–119. [Google Scholar] [CrossRef]
- Ghasemazadeh, K.; Ghahremani, M.; Amiri, T.Y.; Basile, A. Performance evaluation of Pd-Ag membrane reactor in glyceol steam reforming process: Development of the CFD model. International Journal of Hydrogen Energy 2019, 44, 1000–1009. [Google Scholar] [CrossRef]
- Lee, B.; Lee, S.; Lim, K. ; Numerical modeling studies for a methane dry reforming in a membrane reactor. J. Nat. Gas. Sci. Eng. 2016, 34, 1251–1261. [Google Scholar] [CrossRef]
- Nishimura, A.; Mishima, D.; Ito, S.; Konbu, T.; Hu, E. Impact of separator thickness on relationship between temperature distribution and mass & current density distribution in single HT-PEMFC. Thermal Science Engineering 2023, 6. [Google Scholar] [CrossRef]
- Nishimura, A.; Ito, S.; Ichikawa, M.; Kolhe, M.L. Impact of thickness of Pd/Cu membrane on performance of biogas dry reforming membrane reactor utilizing Ni/Cr catalyst. fuels 2024, 5, 439–457. [Google Scholar] [CrossRef]
- Nishimura, A.; Ichikawa, M.; Yamada, S.; Ichii, R. The characteristics of a Ni/Cr/Ru catalyst for a biogas dry reforming membrane reactor using a Pd/Cu membrane and a comparison of it with a Ni/Cr catalyst. hydrogen 2024, 5, 414–435. [Google Scholar] [CrossRef]
- Lee, S.; Lim, H. The power of molten salt in methane dry reforming: conceptual design with a CFD study. Chemical Engineering and Processing 2020, 159. [Google Scholar] [CrossRef]
- Amini, A.; Sedaghat, M.H.; Jamshidi, S.; Shariati, A.; Rahimpour, M.R. A Comprehensive CFD simulation of an industrial-scale side-fired steam methane reformer to enhance hydrogen production. Chemical Engineering and processing 2023, 184. [Google Scholar] [CrossRef]
- Bengerbaa, Y.; Virginieb, M.; Dumas, C. Computational fluid dynamics study of the dry reforming of methane over Ni/Al2O3 catalyst in membrane reactor – coke deposition. Kinetic and Catalysis 2017, 58, 345–355. [Google Scholar] [CrossRef]
- Kaviani, M.; Rezaei, M.; Alavi, S.M.; Akbari, E. Biogas dry reforming over nickel-silica sandwiched core-shell catalyst with various shell thickness. Fuel 2024, 355. [Google Scholar] [CrossRef]
- Georgiadis, A.G.; Siakavelas, G.I.; Tsiotsias, A.I.; Charisous, N.D.; Ehrhardt, B.; Wang, W.; Sebastian, V.; Hinder, S.J.; Baker, M.A.; Mascotto, S.; Goula, M.A. Biogas dry reforming over Ni/LnOx-type catalysts (Ln = La, Ce, Sm or Pr). International Journal of Hydrogen Energy 2023, 48, 19953–19971. [Google Scholar] [CrossRef]
- Martin-Espejo, J.L.; Merkouri, L.P.; Gandara-Loe, J.; Odriozola, J.A.; Reina, T.R.; Pastor-Perez, L. Nickel-based cerium zirconate inorganic complex structures for CO2 valorisation via dry reforming of methane. Journal of Environmental Sciences 2024, 140, 12–23. [Google Scholar] [CrossRef]
- Kiani, P.; Meshksar, M.; Rahimpour, M.R. Biogas reforming over La-promoted Ni/SBA-16 catalyst for syngas production: Catalytic structure and process activity investigation. International Journal of Hydrogen Energy 2023, 48, 6262–6274. [Google Scholar] [CrossRef]
Figure 1.
Schematic drawing of 2D model used for numerical simulation in this study.
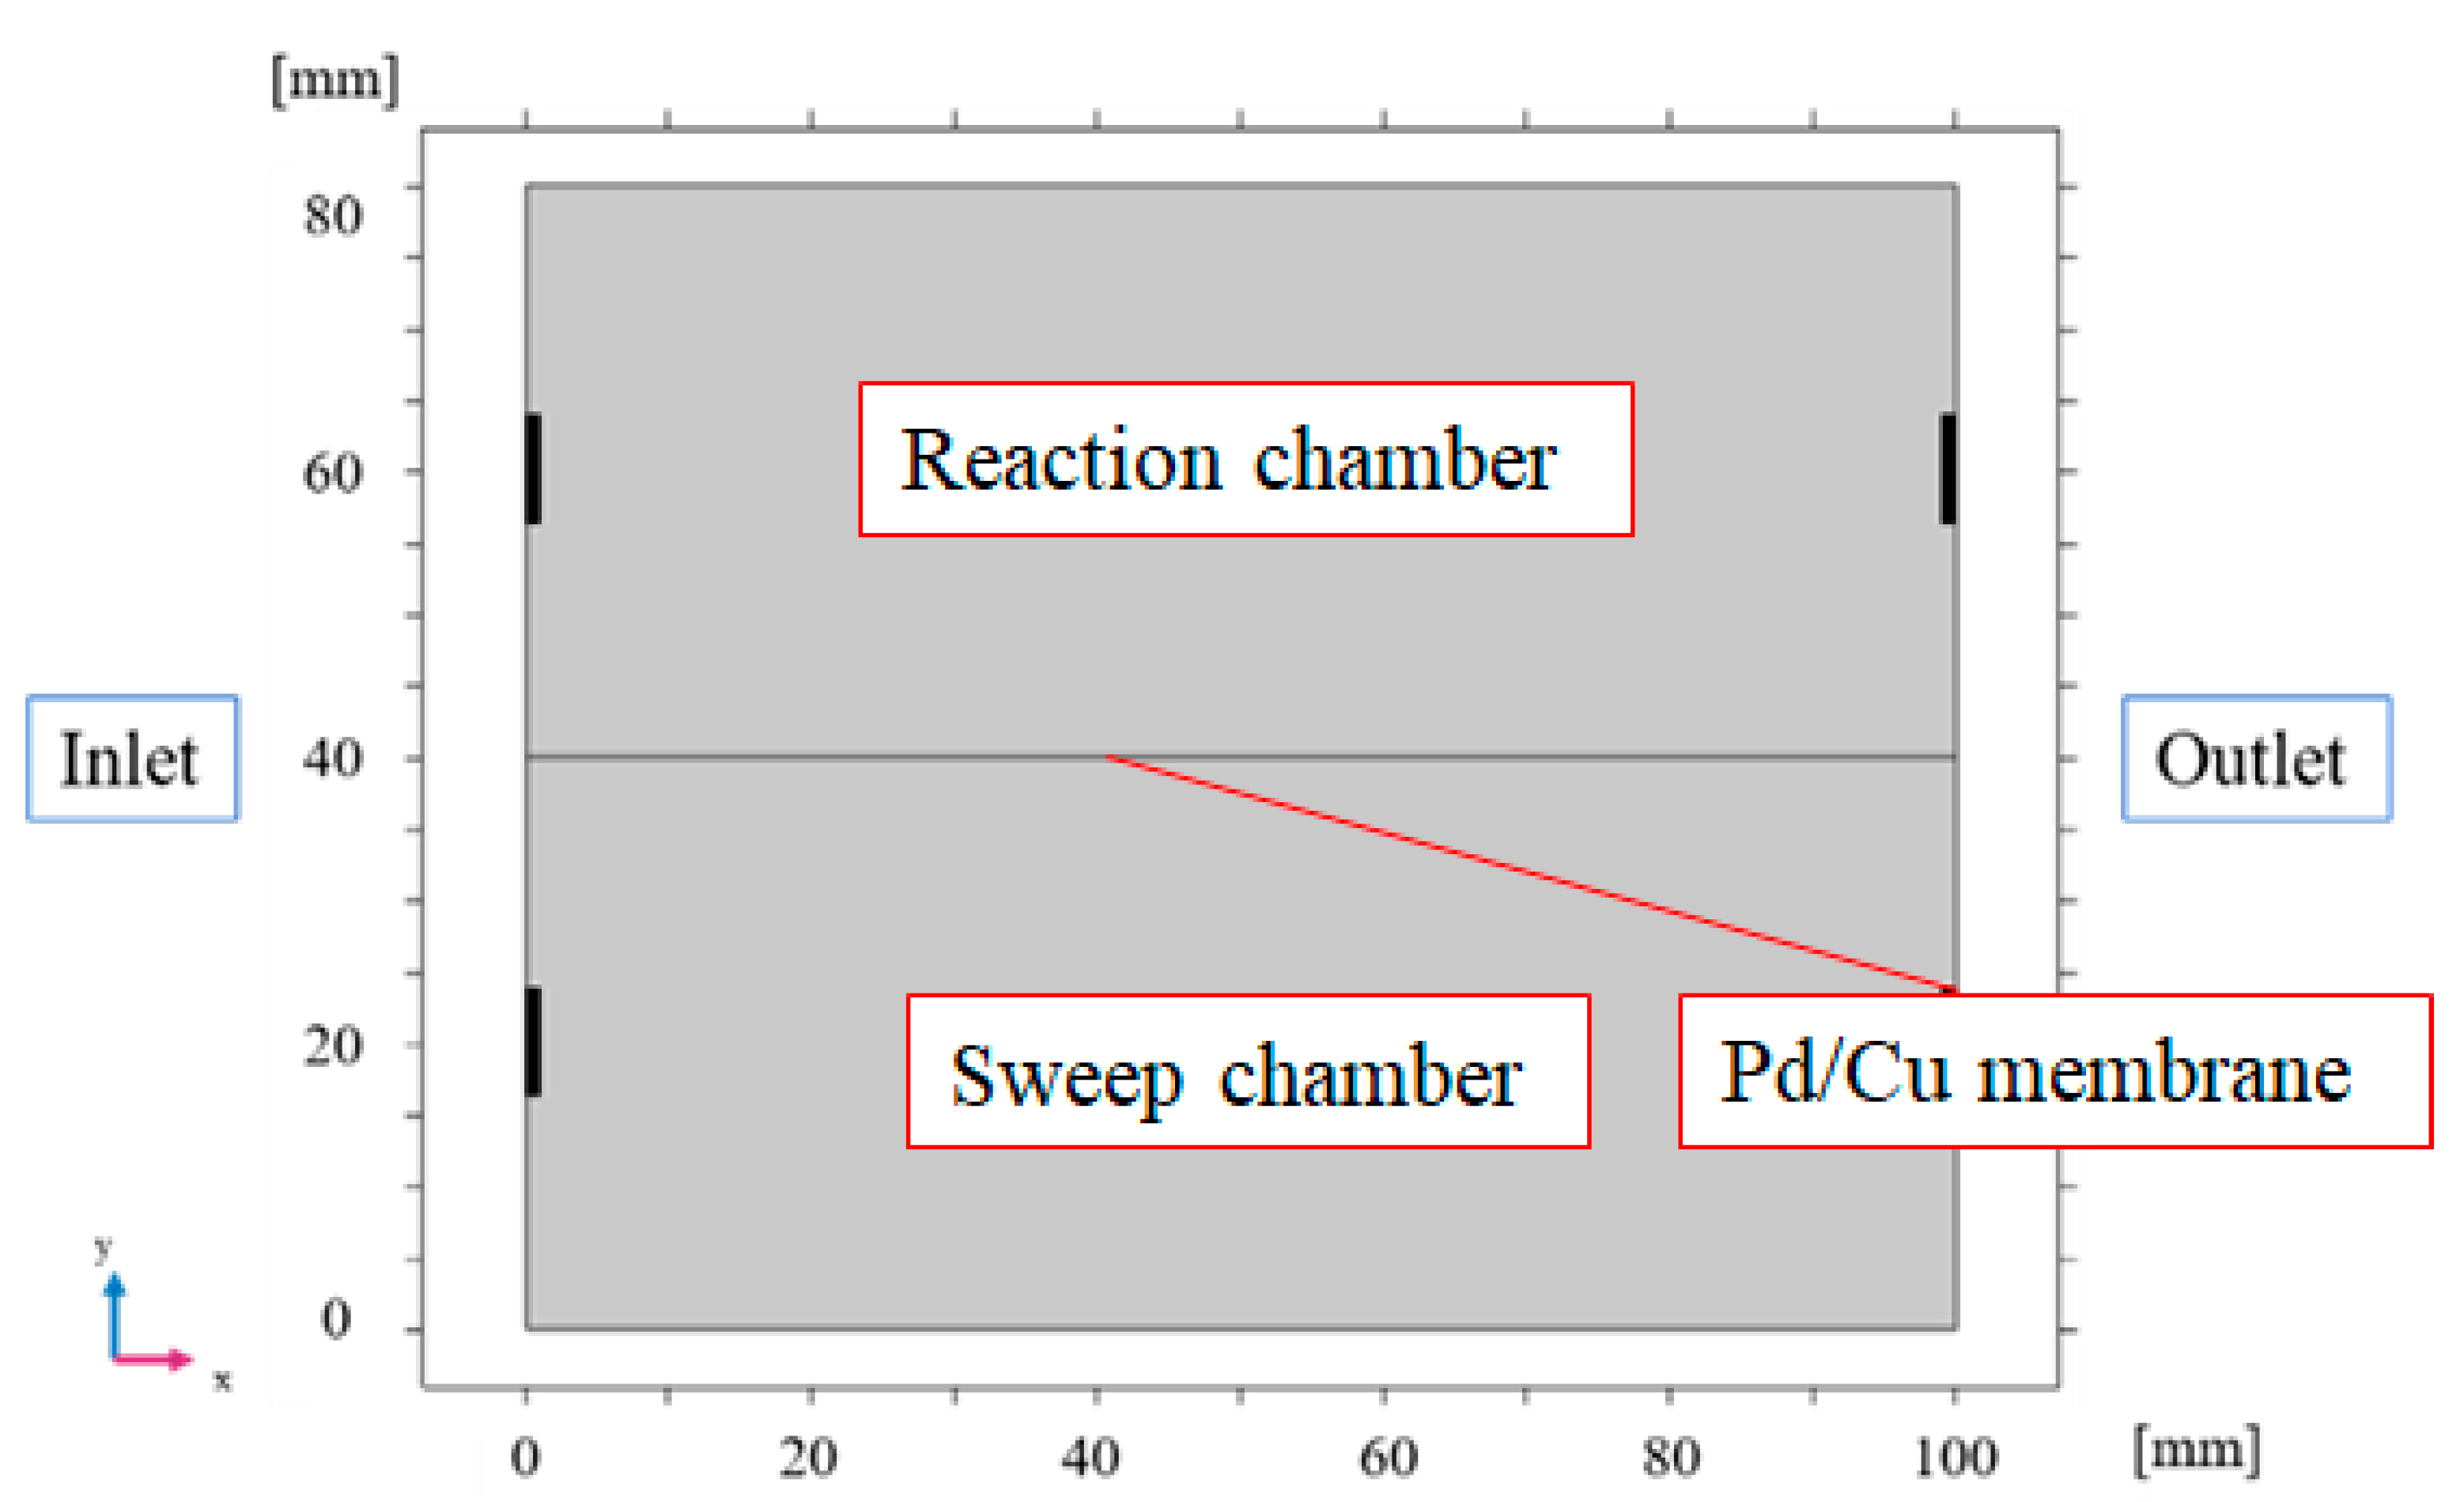
Figure 2.
Impact of the initial reaction temperature on the distribution of pressure along x direction in reaction chamber (y = 62 mm), Pd/Cu membrane (y = 40 mm) and sweep chamber (y = 20 mm).
Figure 2.
Impact of the initial reaction temperature on the distribution of pressure along x direction in reaction chamber (y = 62 mm), Pd/Cu membrane (y = 40 mm) and sweep chamber (y = 20 mm).
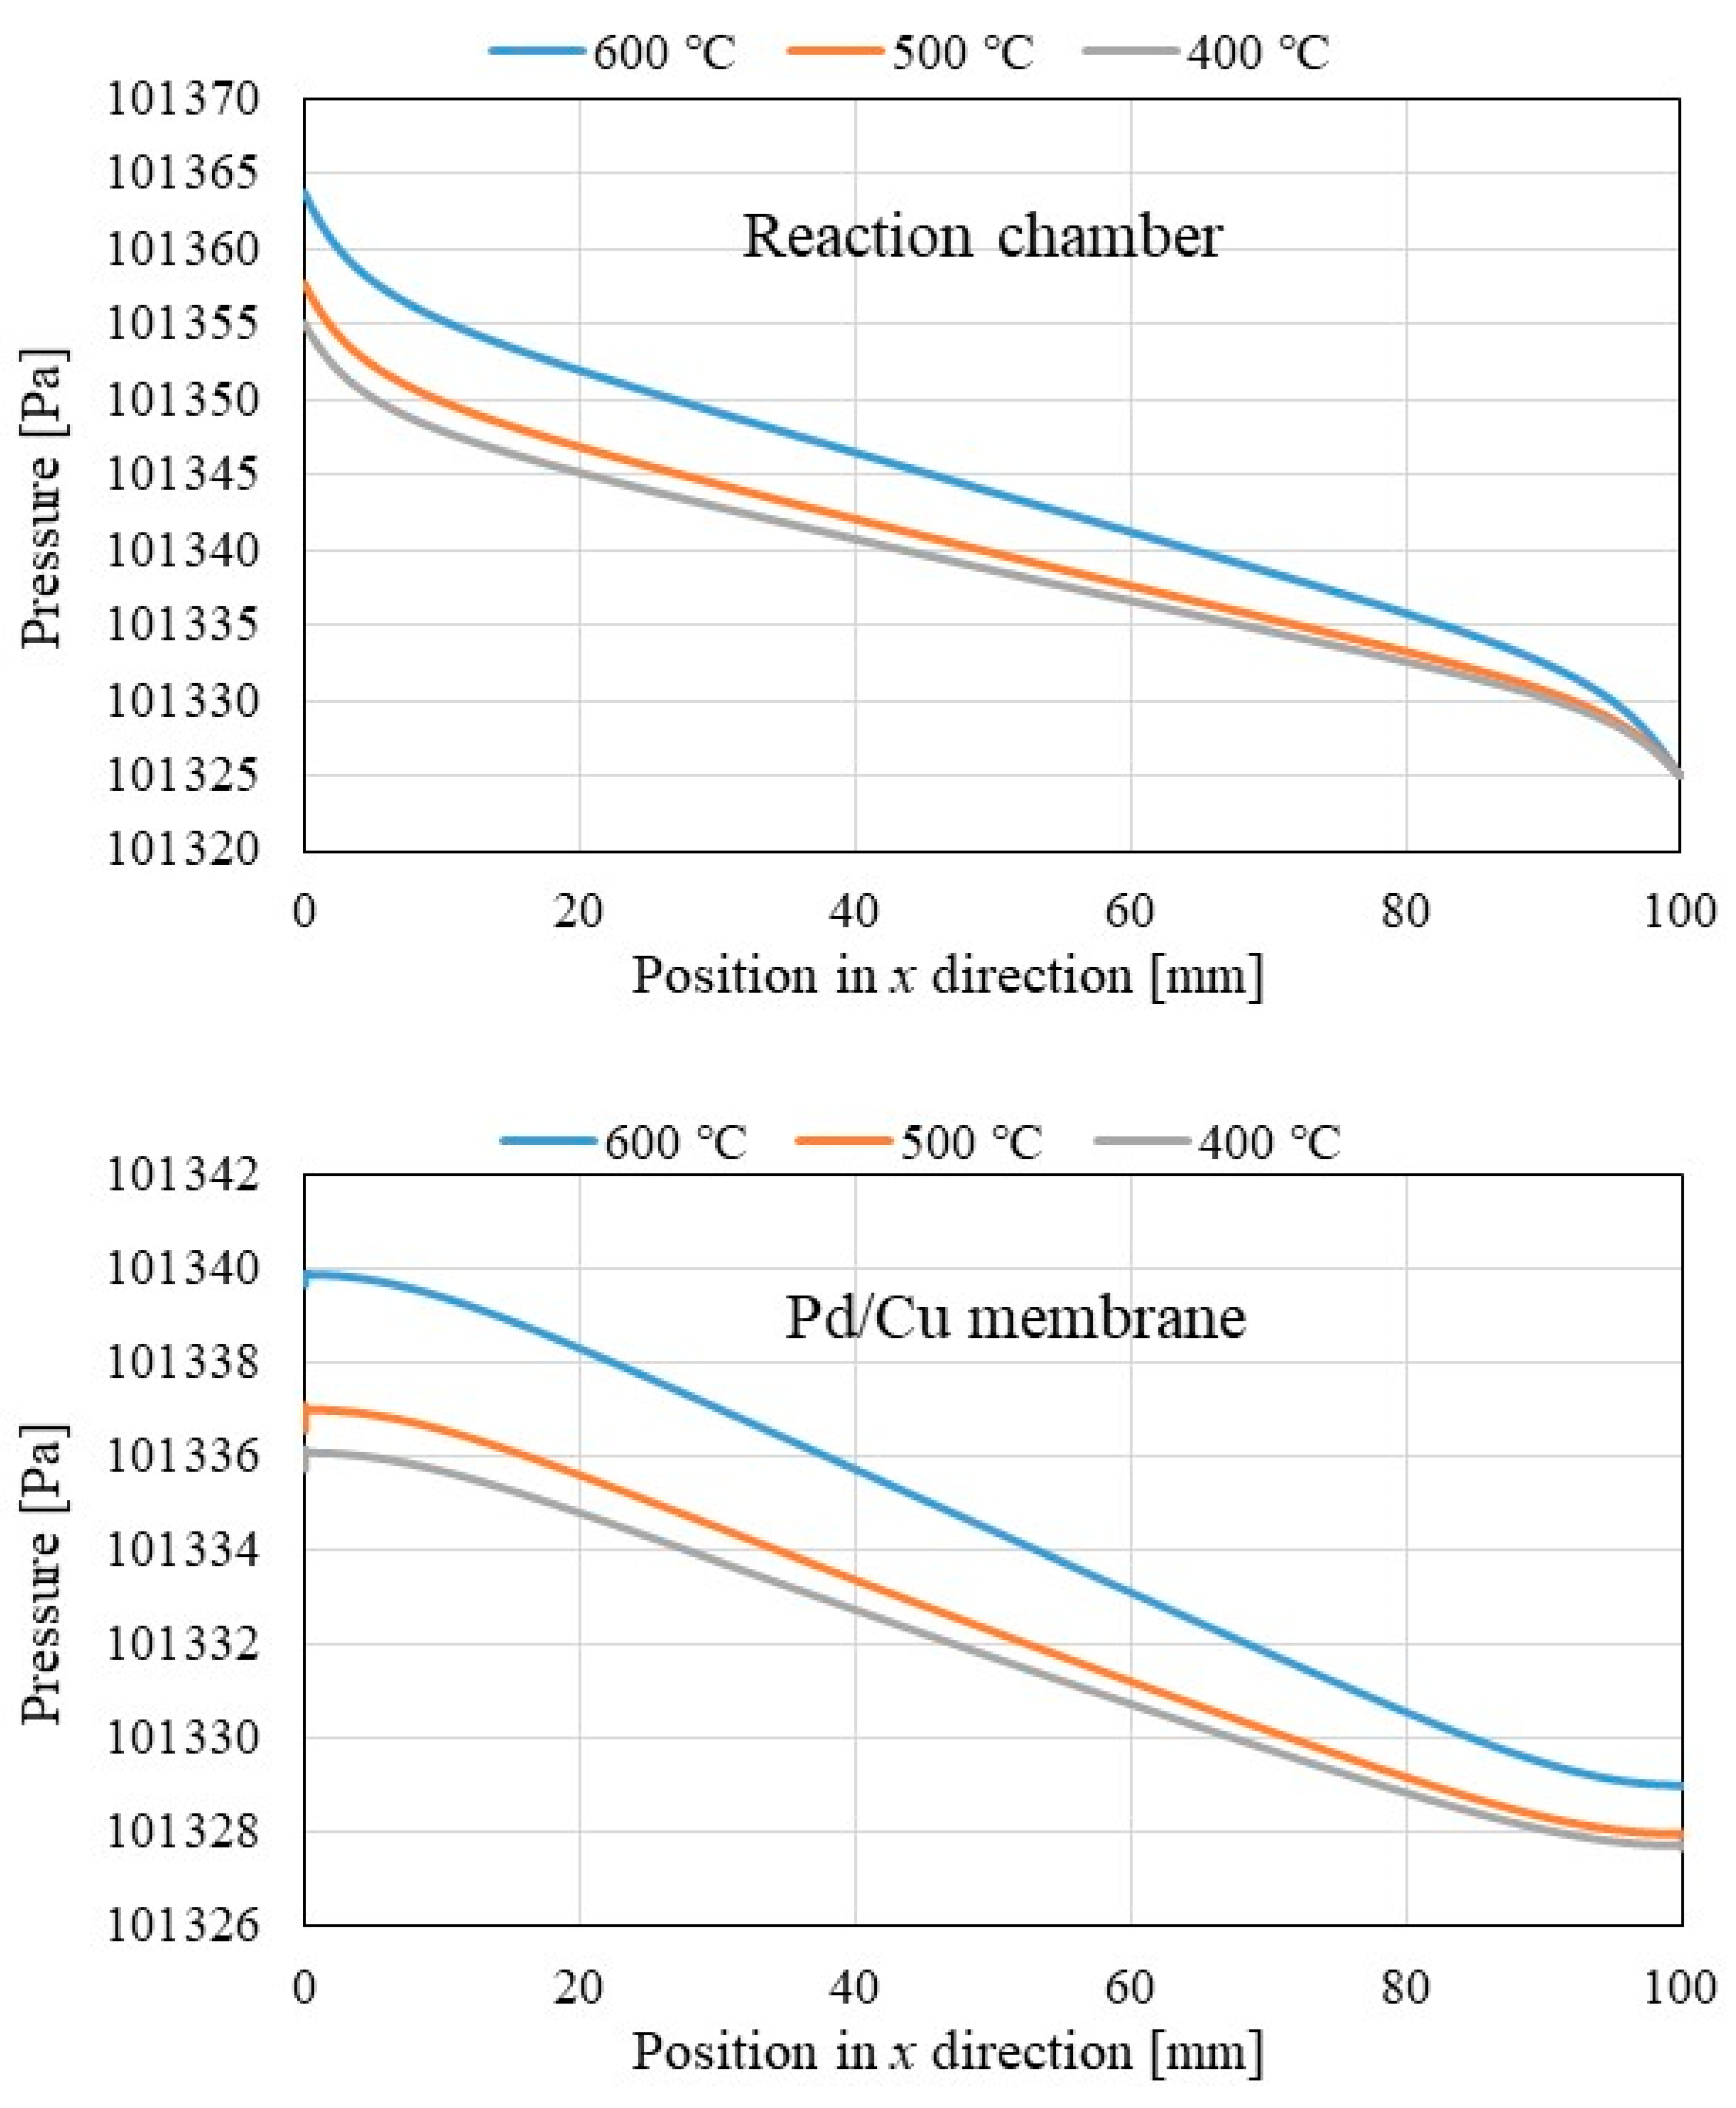
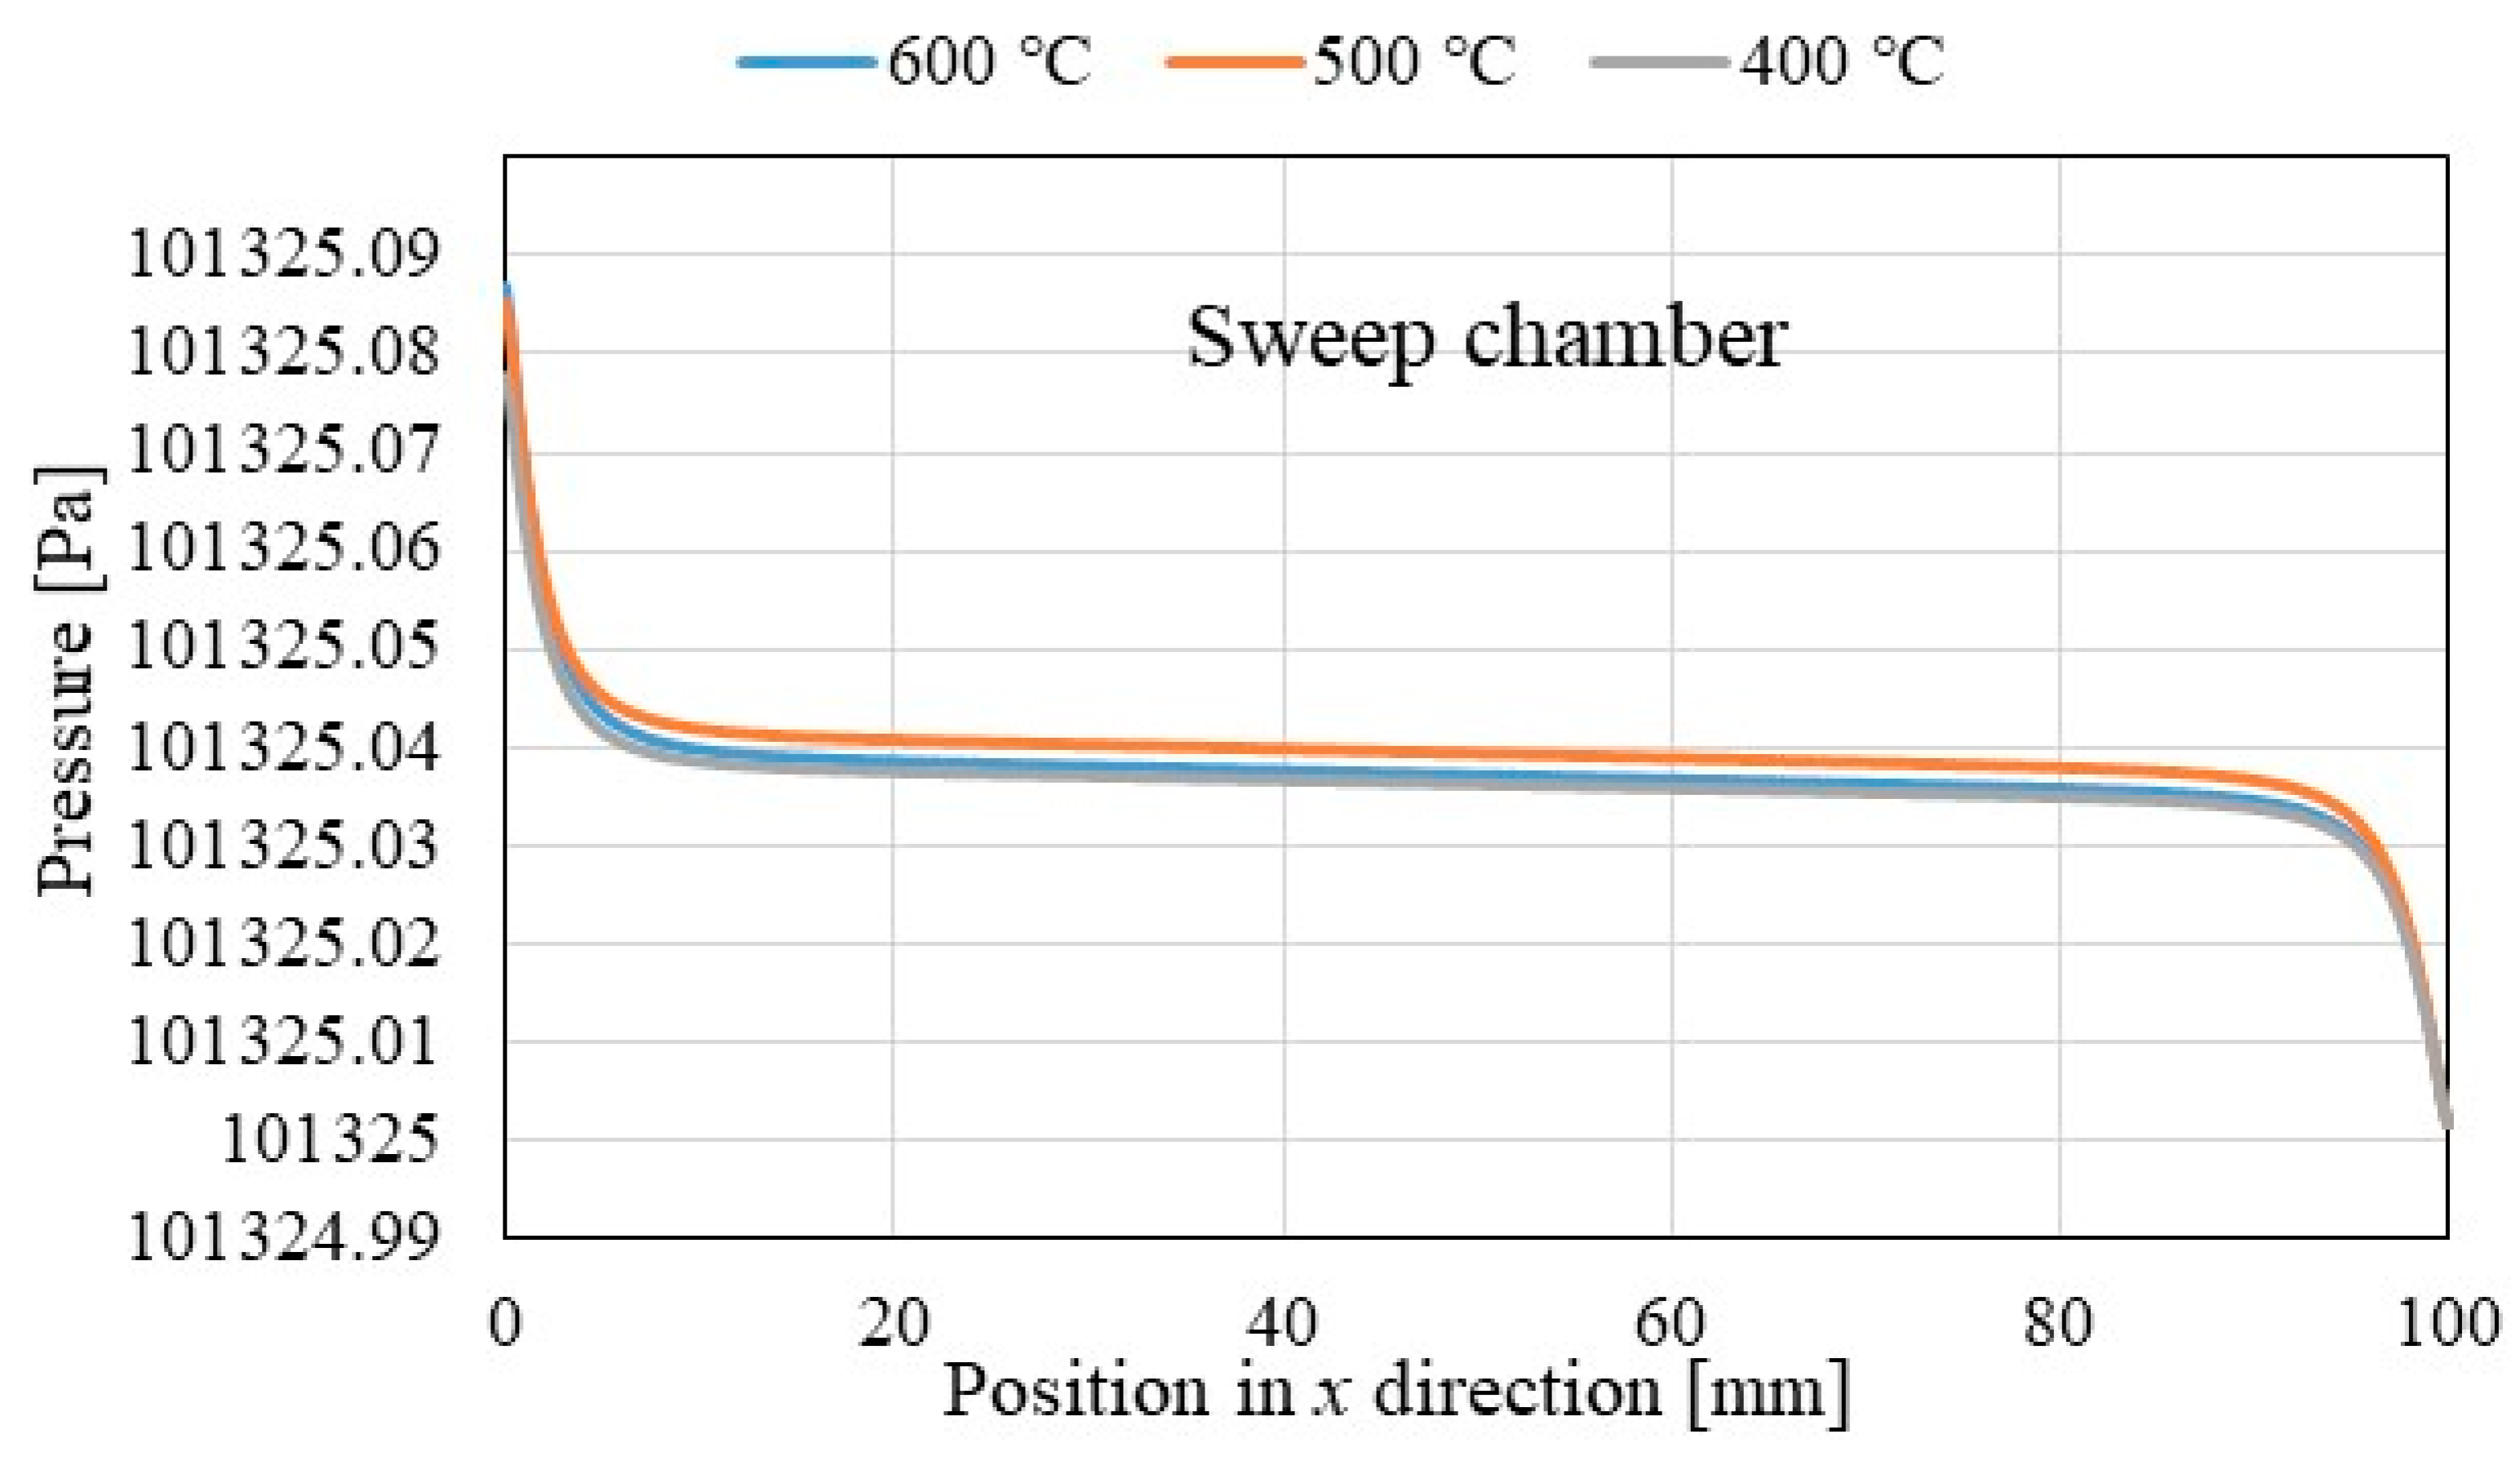
Figure 3.
Impact of the thickness of Pd/Cu membrane on the distribution of pressure along x direction in reaction chamber (y = 62 mm), Pd/Cu membrane (y = 40 mm) and sweep chamber (y = 20 mm).
Figure 3.
Impact of the thickness of Pd/Cu membrane on the distribution of pressure along x direction in reaction chamber (y = 62 mm), Pd/Cu membrane (y = 40 mm) and sweep chamber (y = 20 mm).
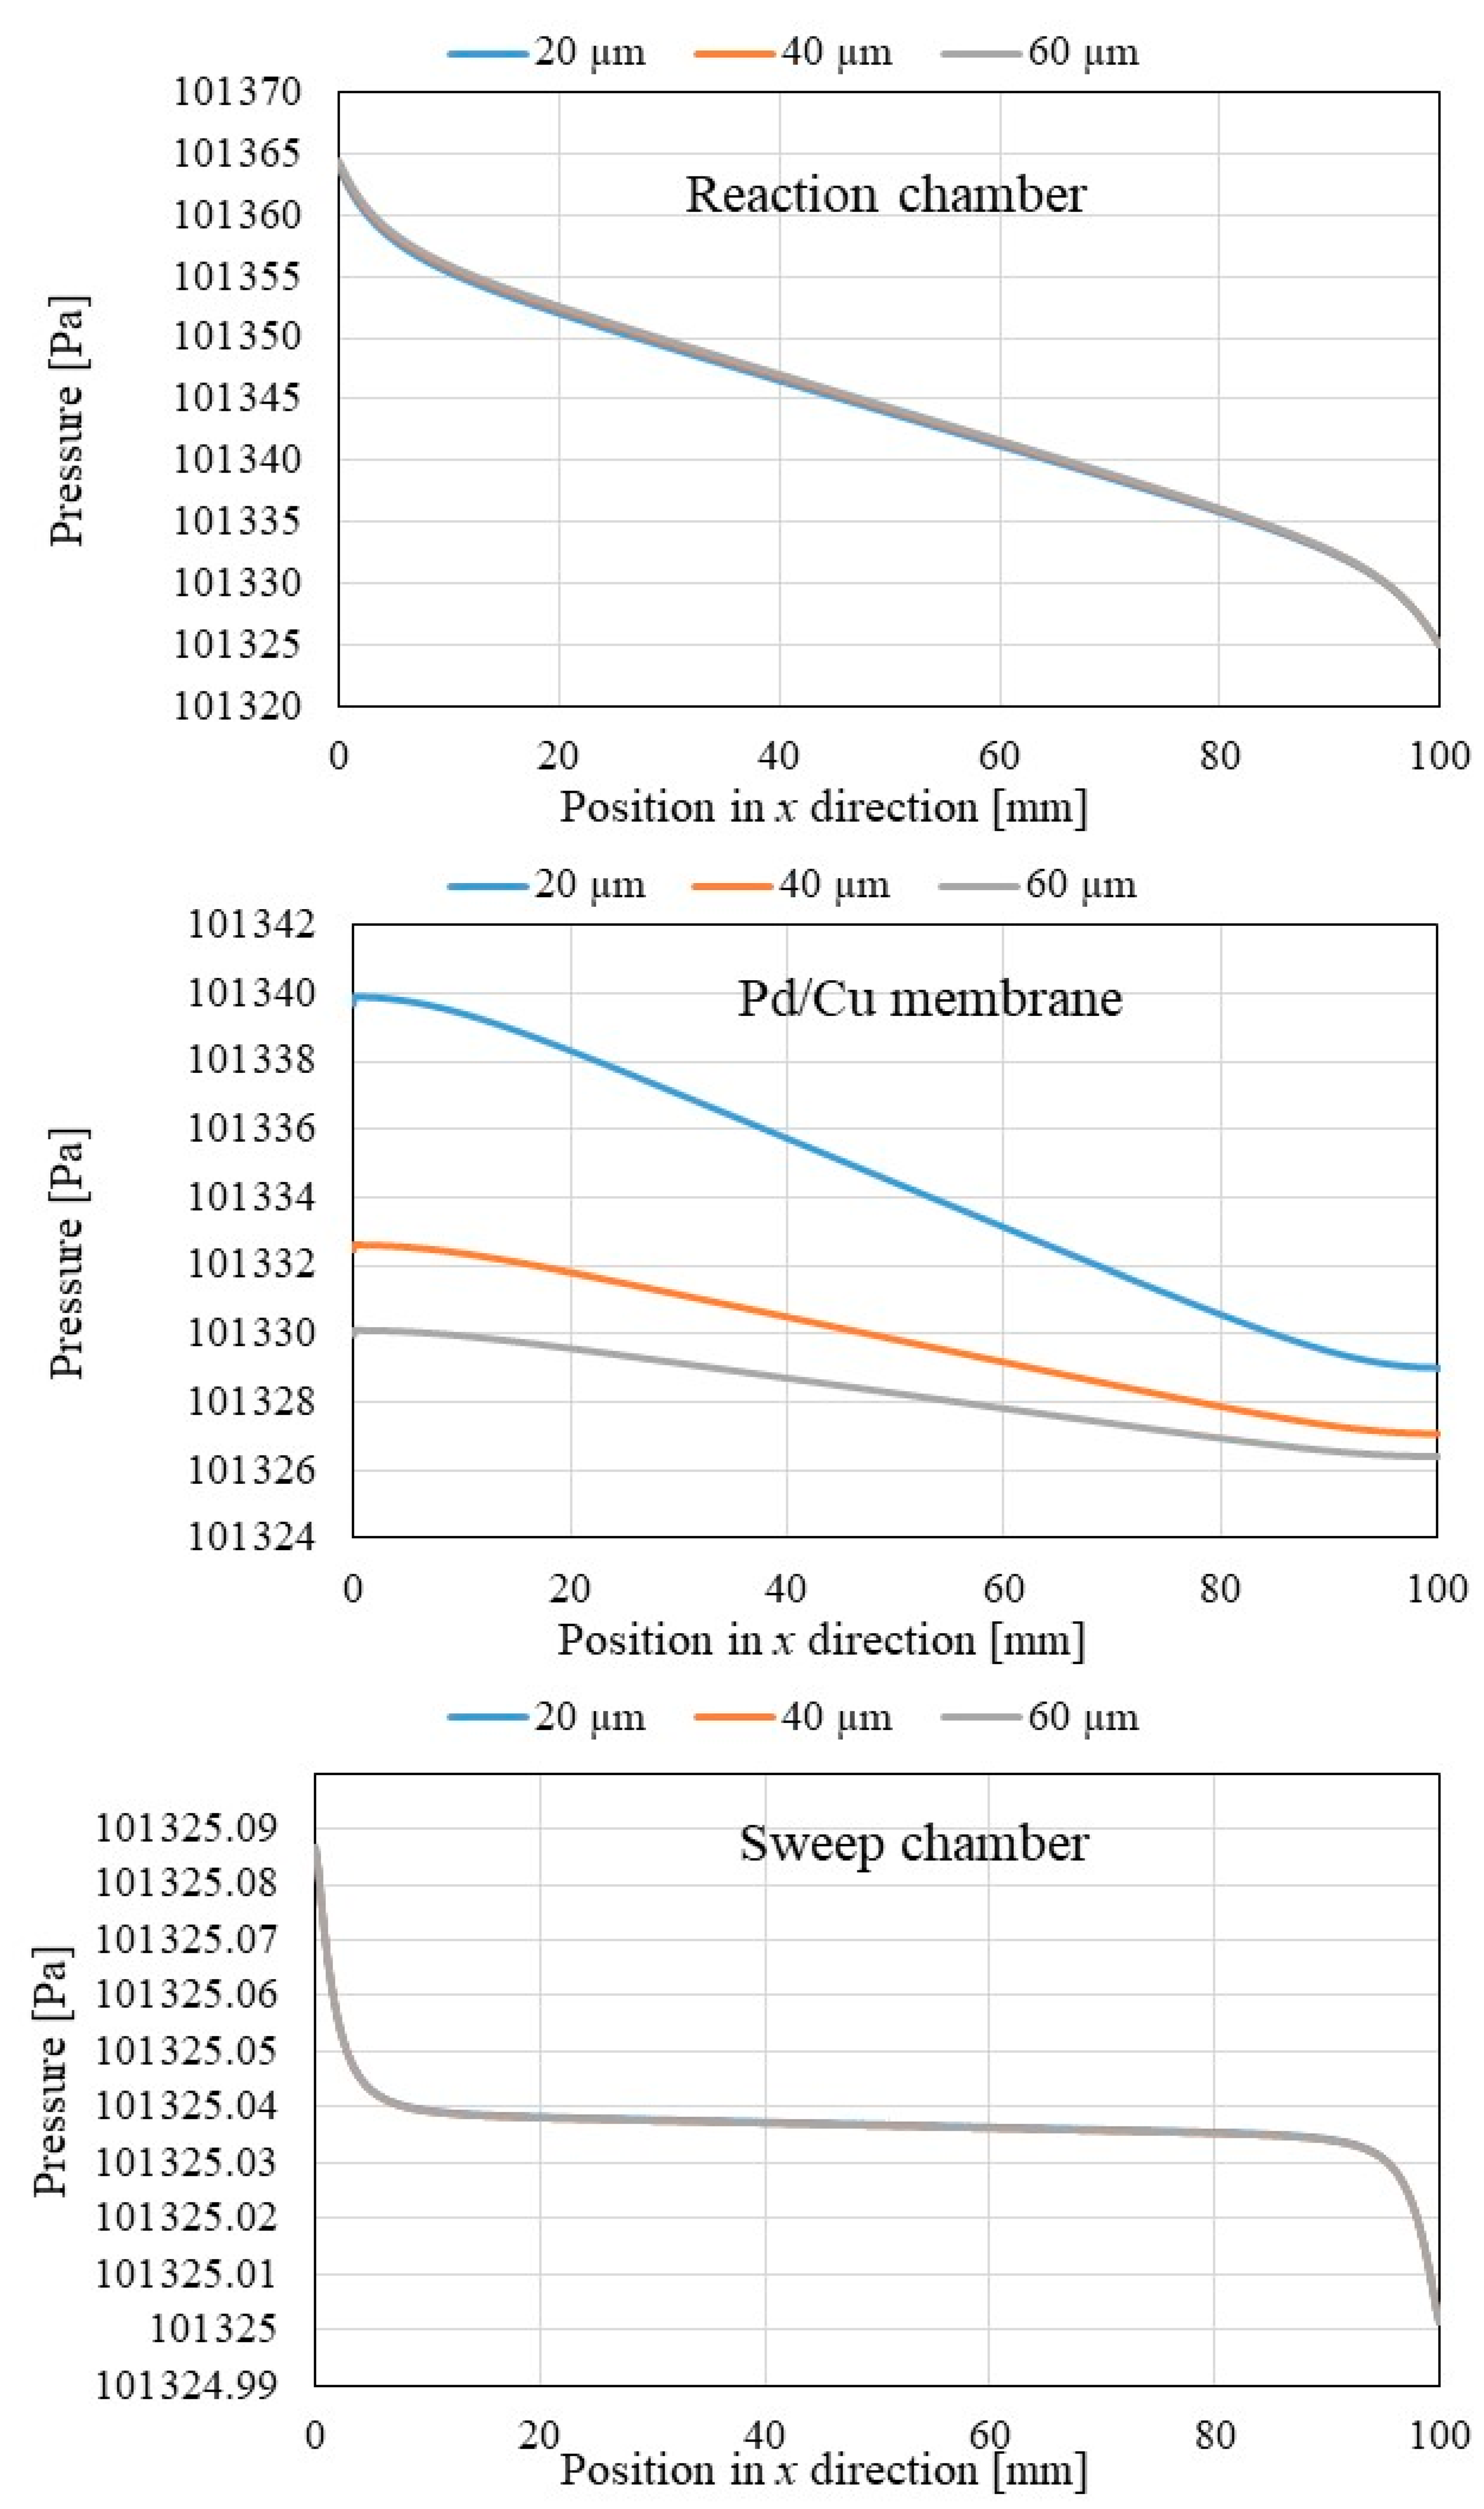
Figure 4.
Impact of the initial reaction temperature on the distribution of each gas concentration along x direction in reaction chamber (y = 62 mm).
Figure 4.
Impact of the initial reaction temperature on the distribution of each gas concentration along x direction in reaction chamber (y = 62 mm).
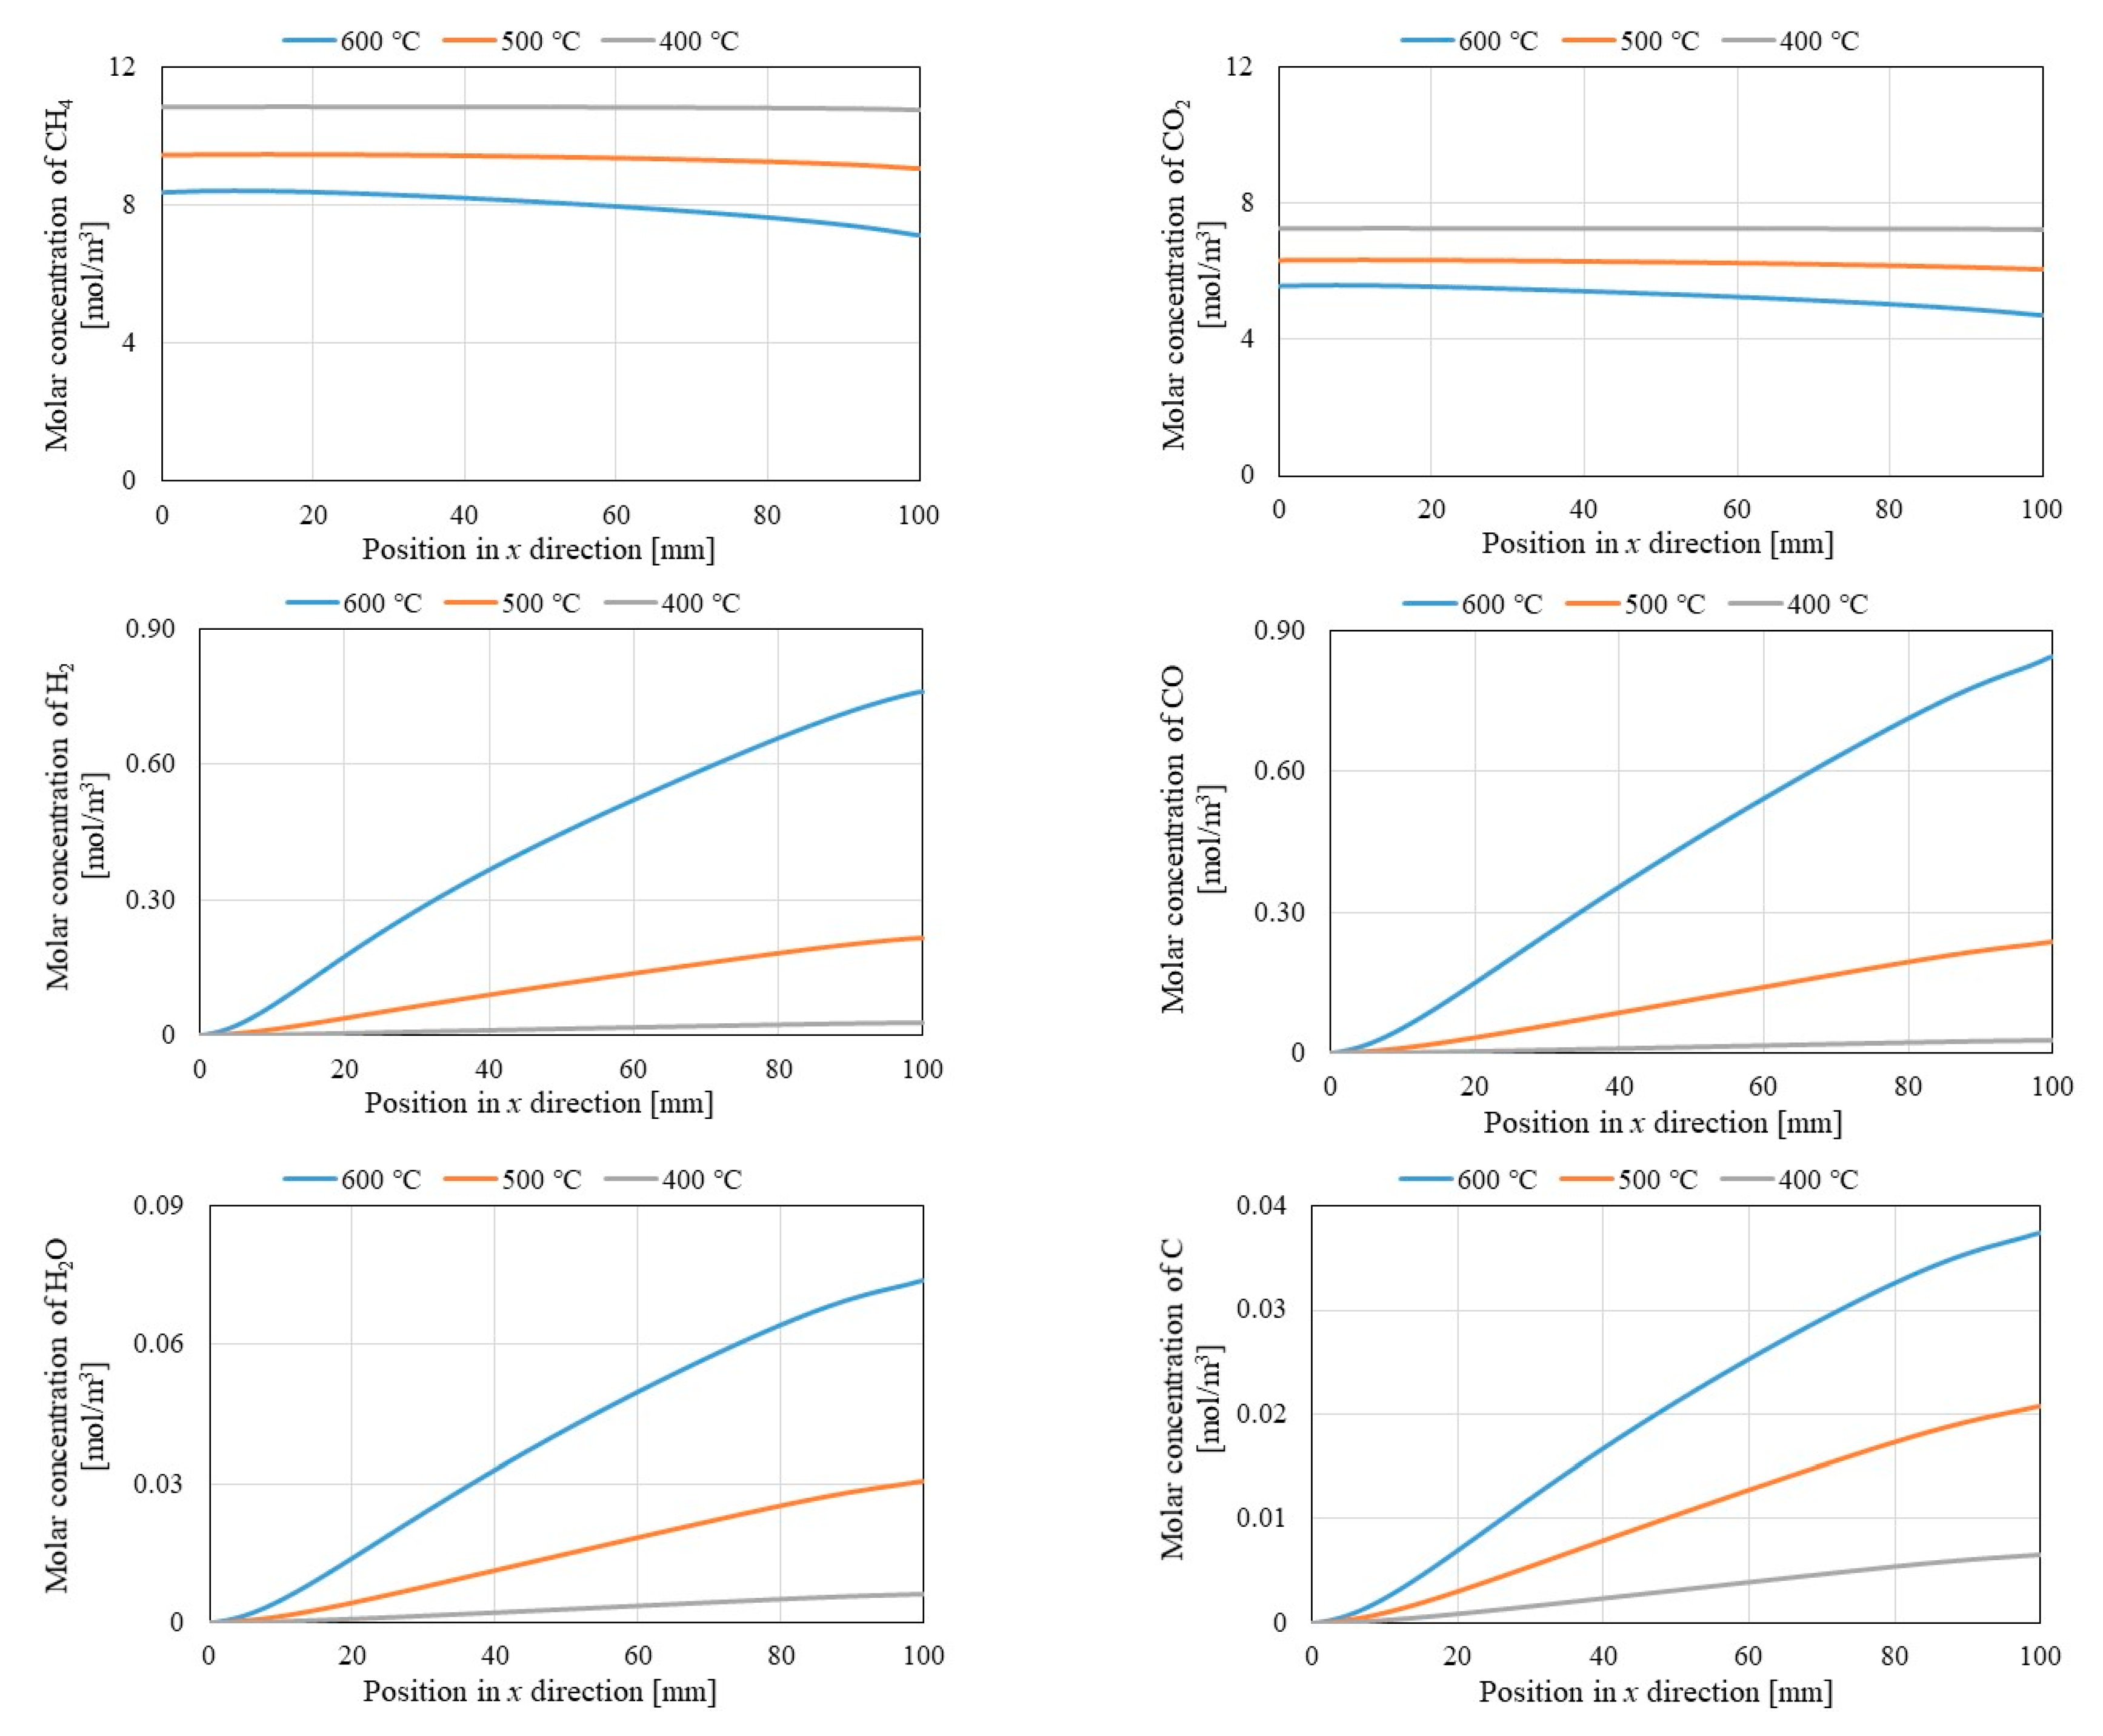
Figure 5.
Photo of Ni/Cr catalyst before and after experiments (left: before experiment, right: after experiment) [23].
Figure 5.
Photo of Ni/Cr catalyst before and after experiments (left: before experiment, right: after experiment) [23].
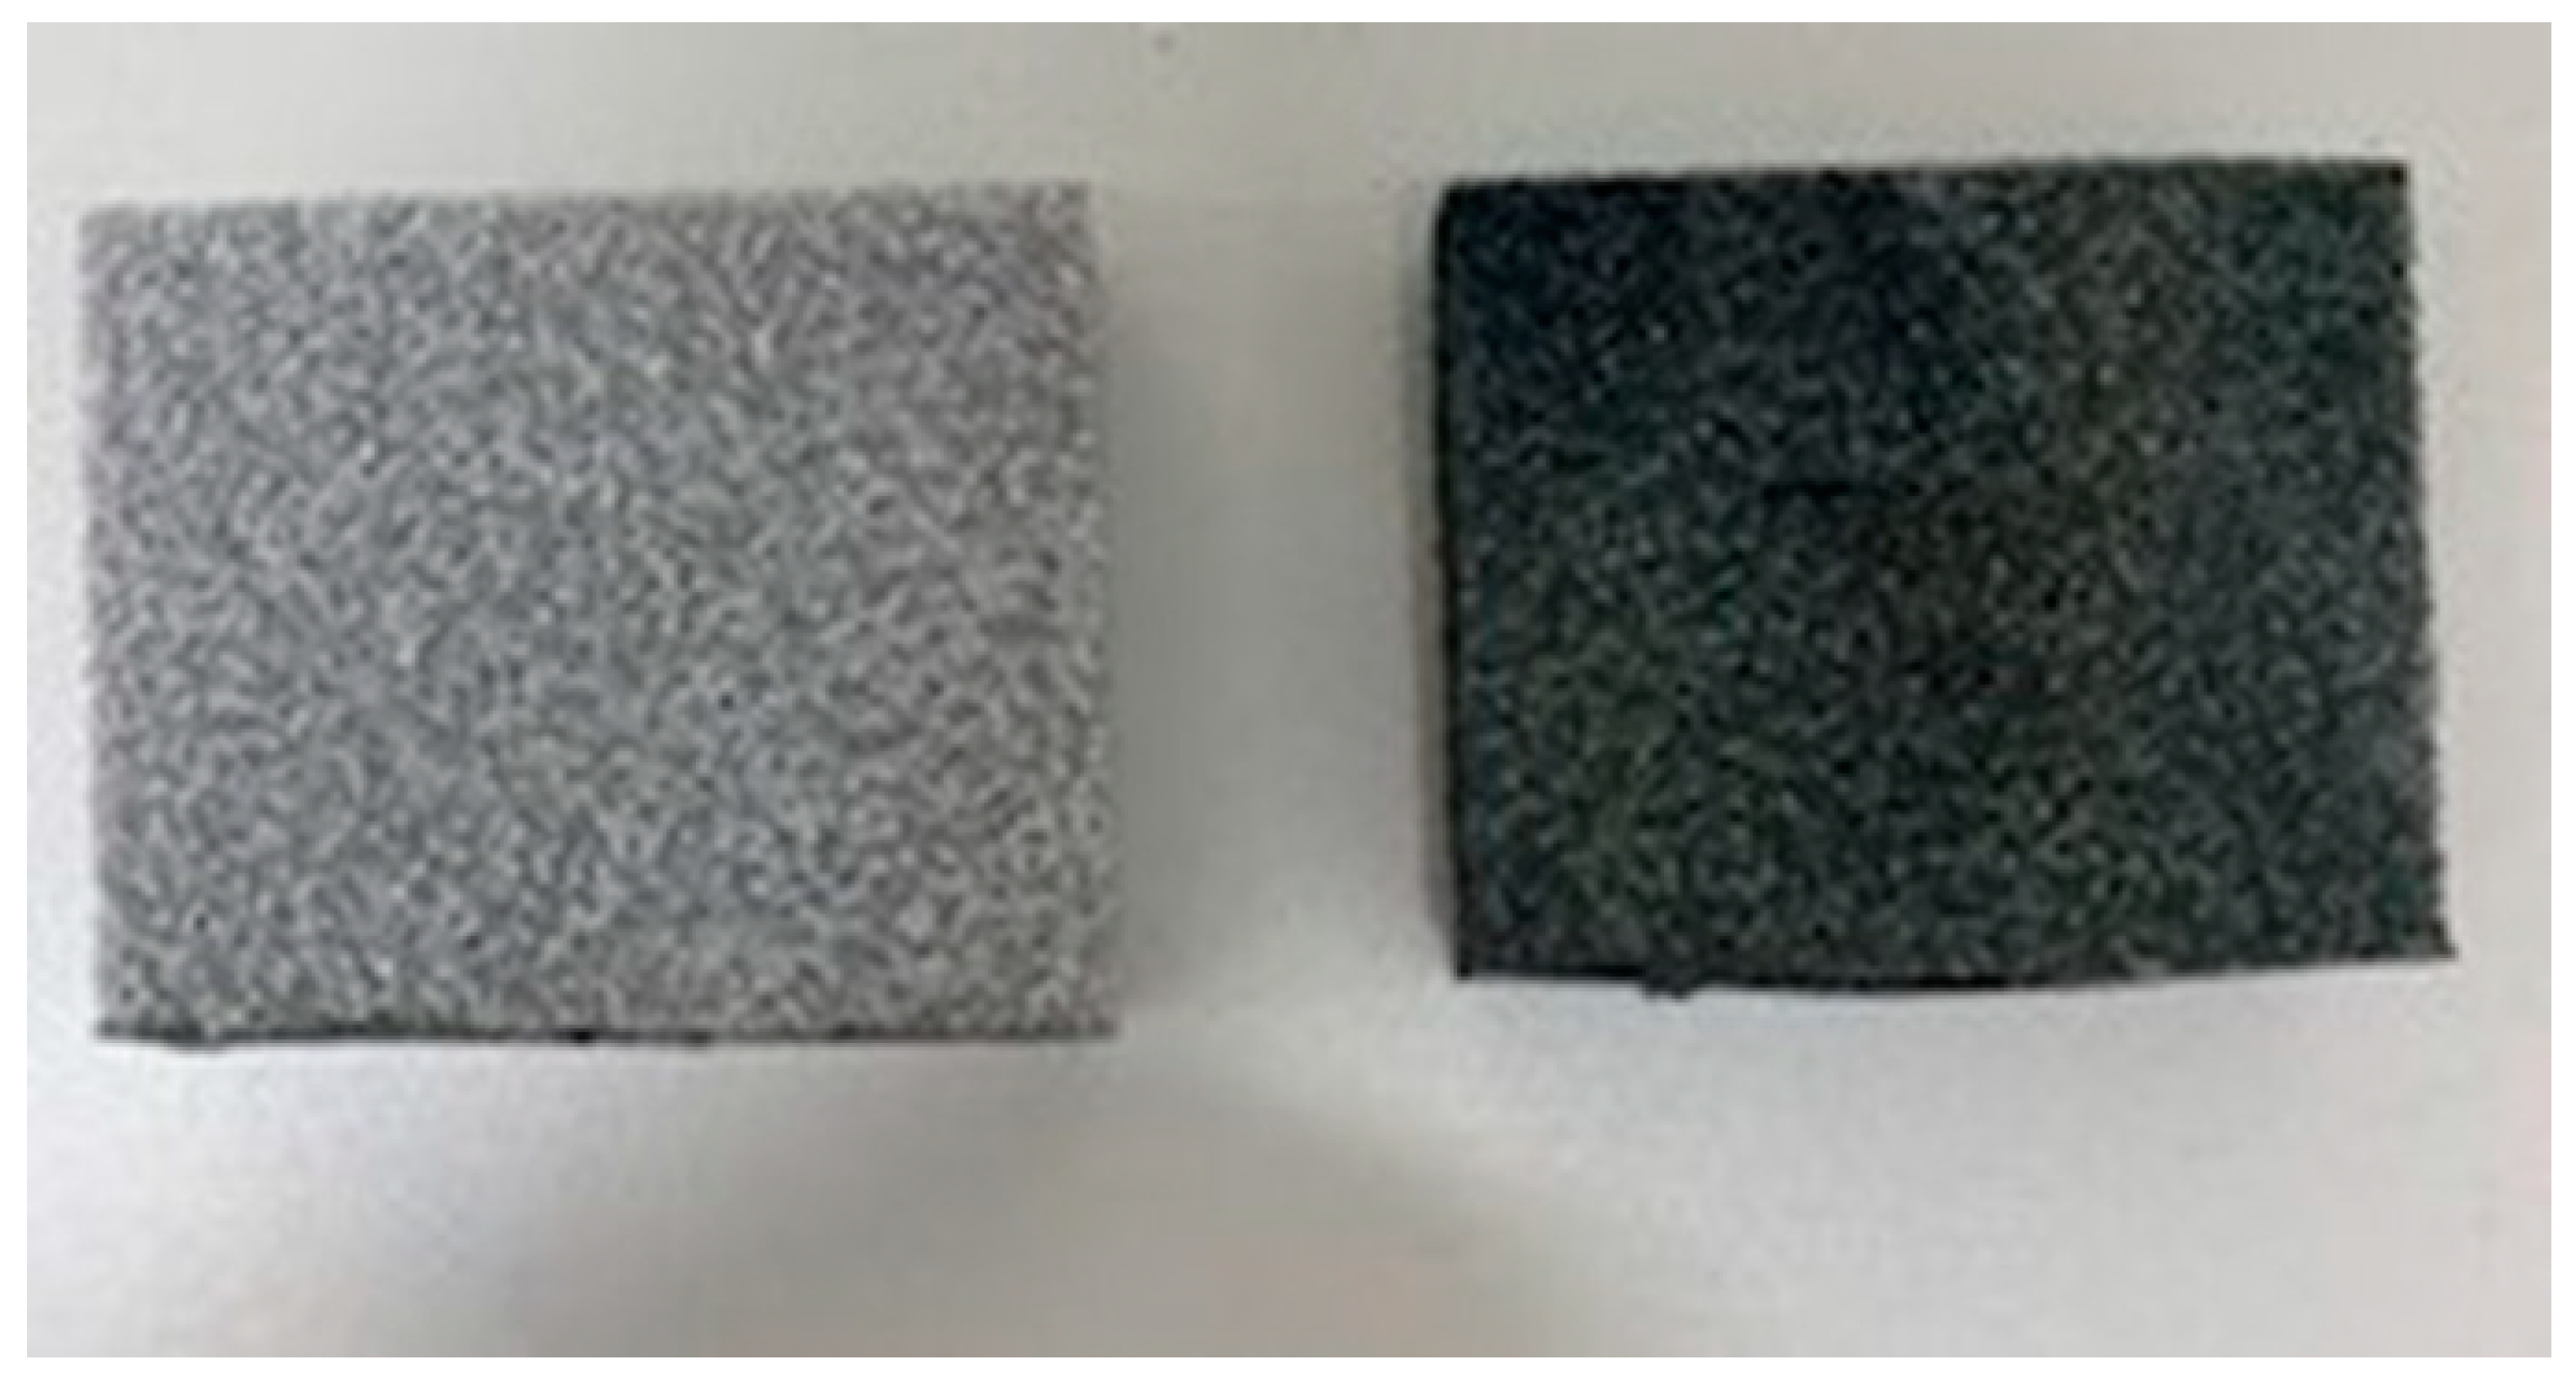
Figure 6.
Photo of produced H2O observed using gas bag [23].
Figure 6.
Photo of produced H2O observed using gas bag [23].
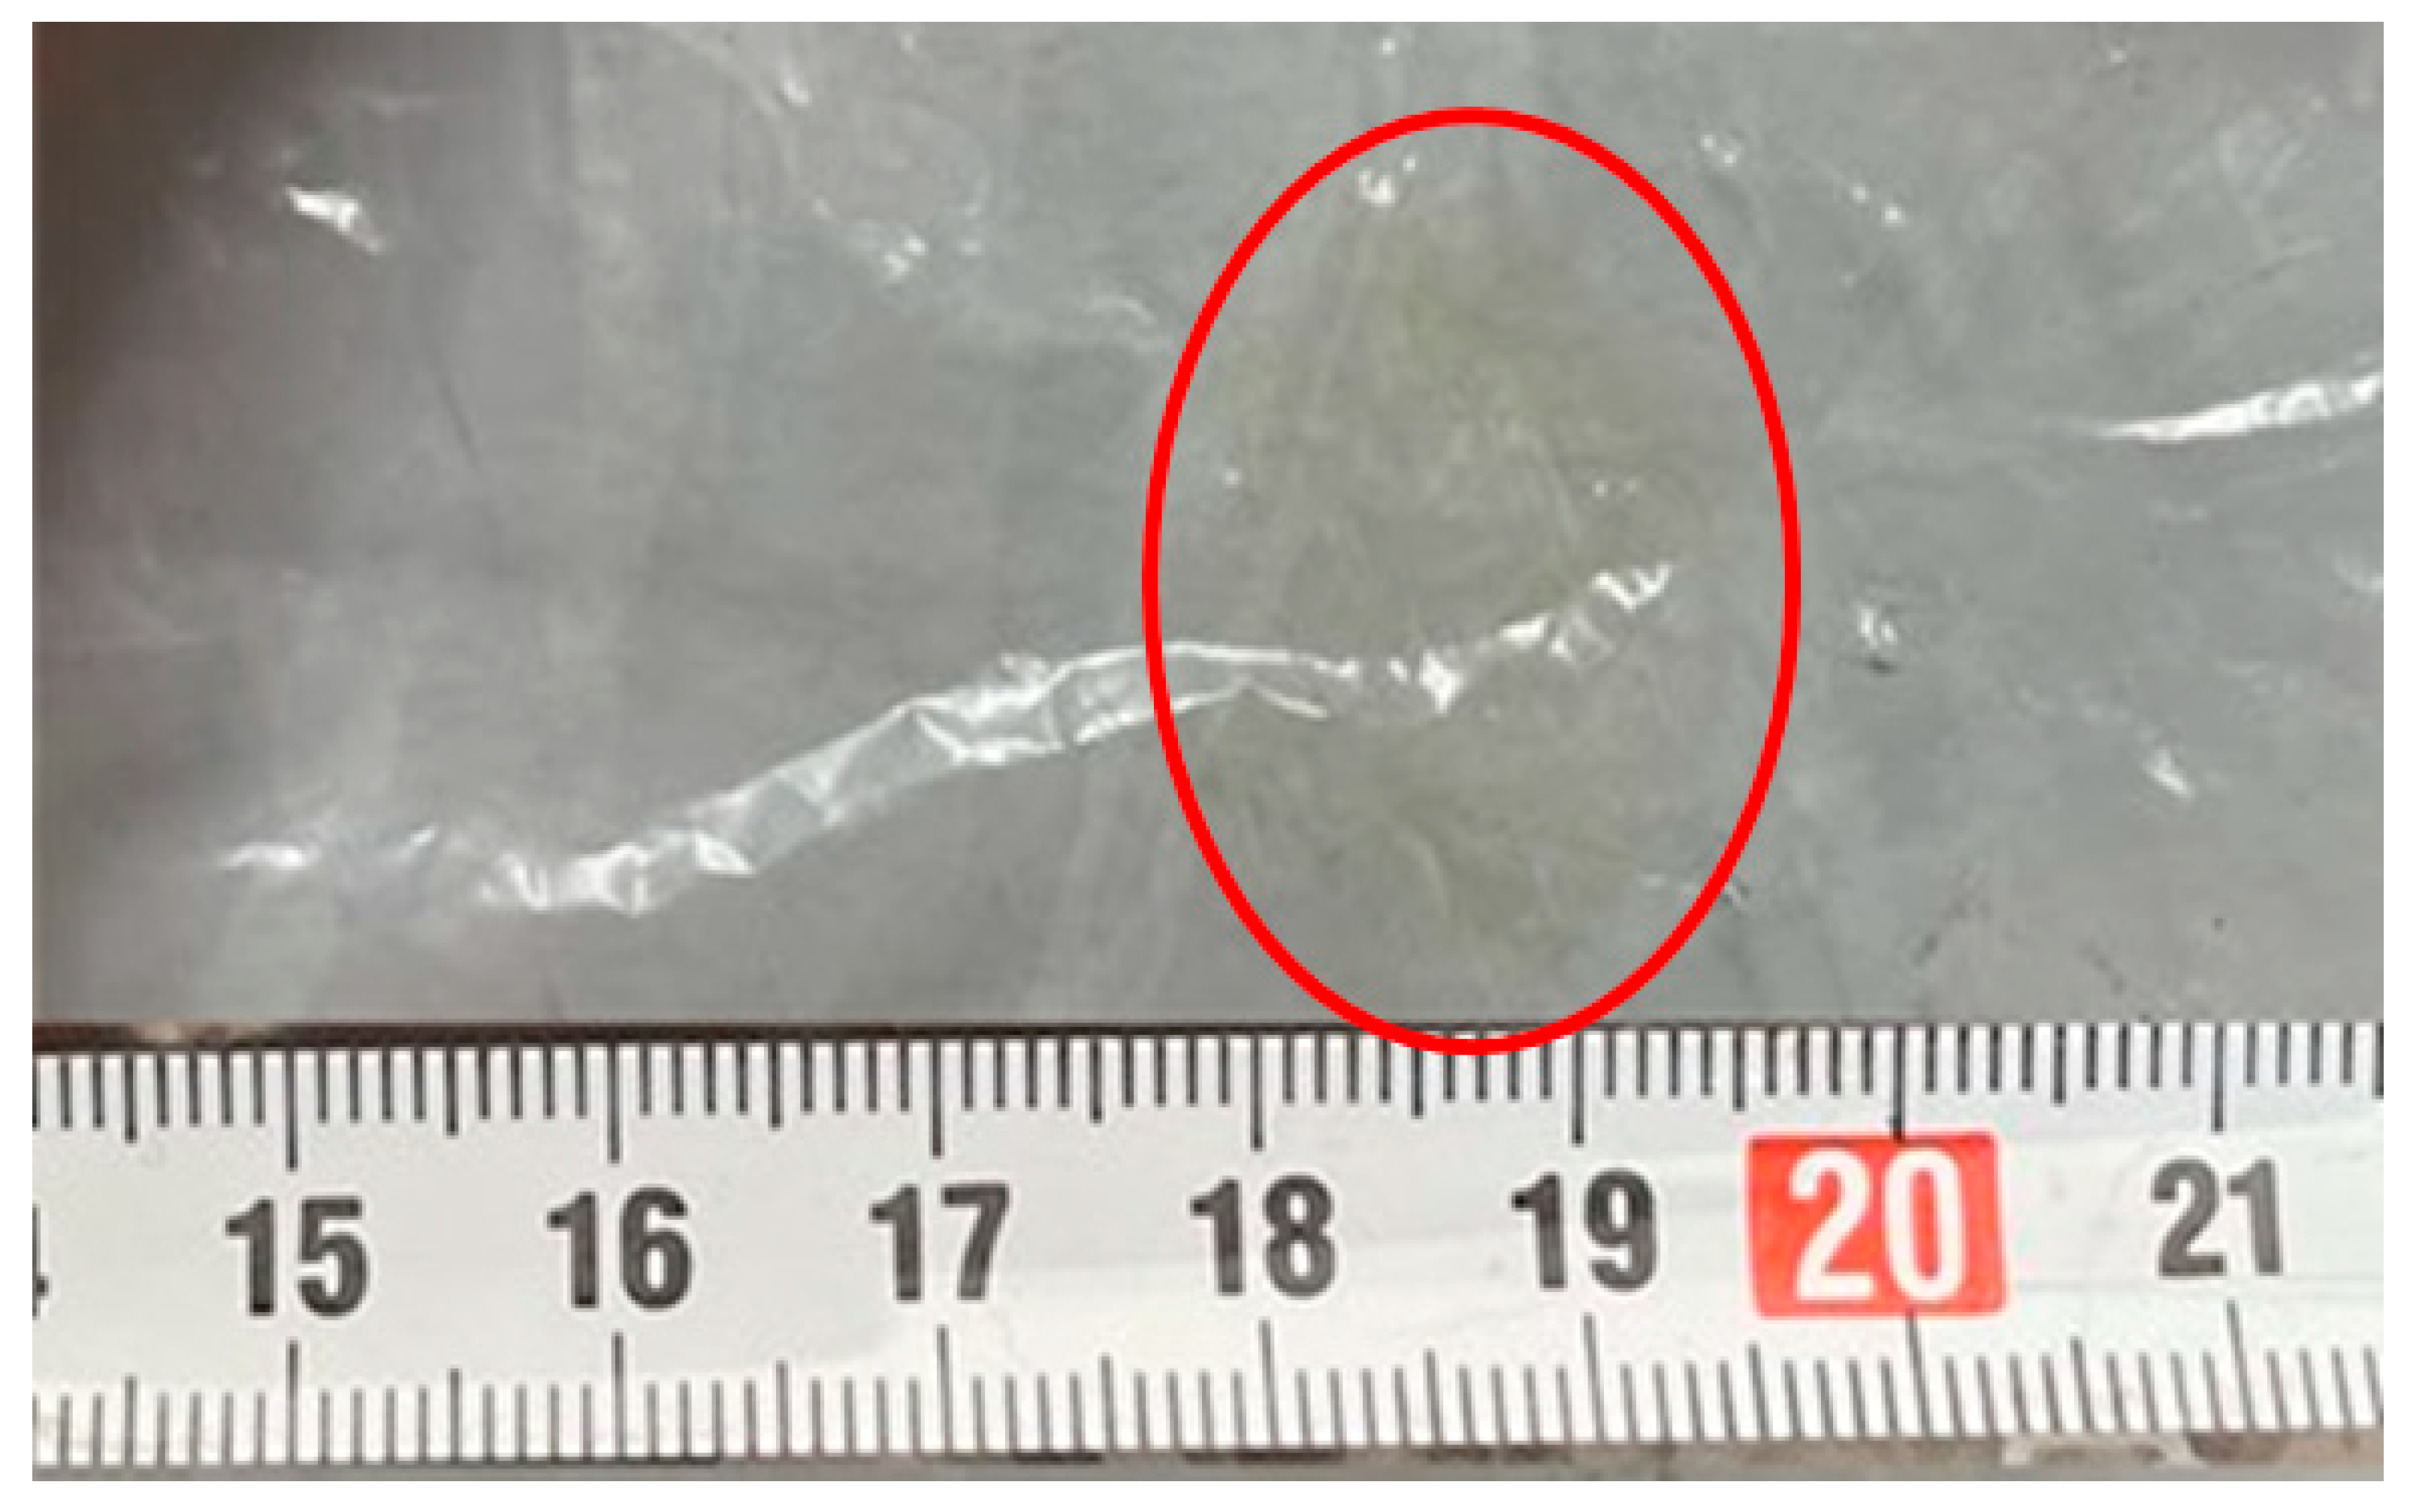
Figure 7.
Impact of the initial reaction temperature on distribution of molar concentration of H2 along x direction in reaction chamber (y = 60 mm), Pd/Cu membrane (y = 40 mm) and sweep chamber (y = 20 mm).
Figure 7.
Impact of the initial reaction temperature on distribution of molar concentration of H2 along x direction in reaction chamber (y = 60 mm), Pd/Cu membrane (y = 40 mm) and sweep chamber (y = 20 mm).
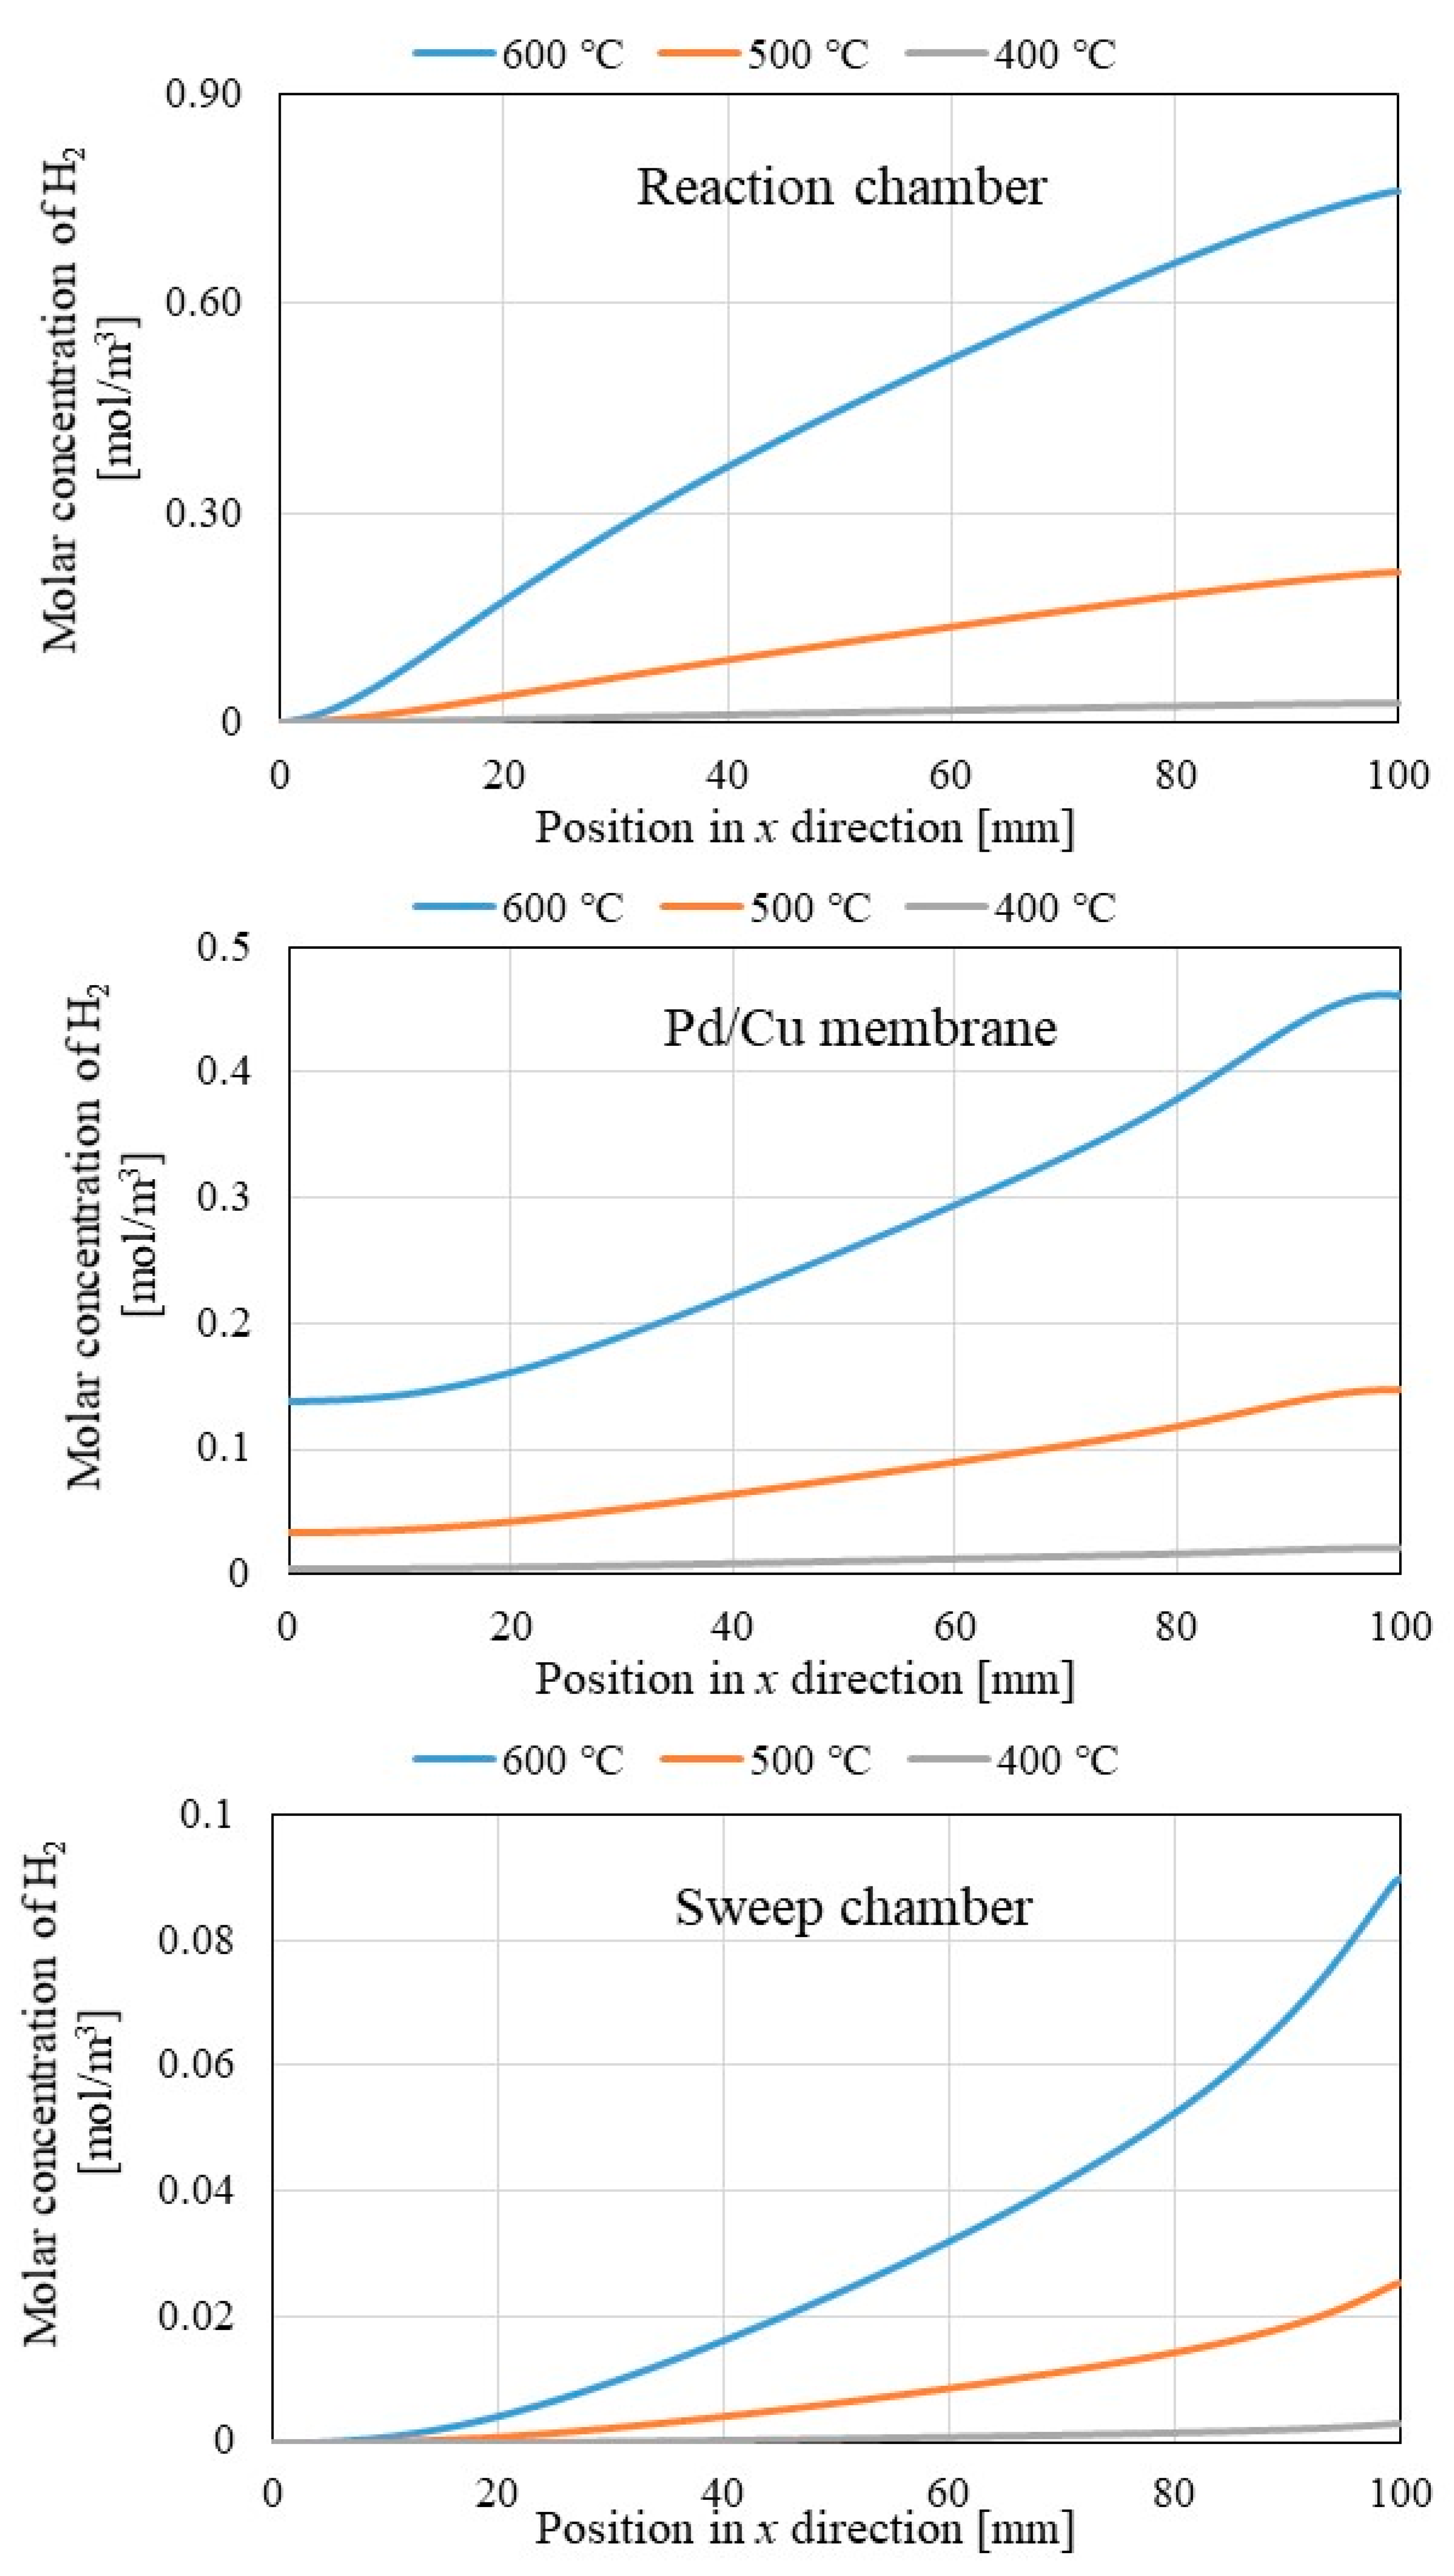
Figure 8.
Impact of the thickness of Pd/Cu membrane on the distribution of each gas concentration along x direction in reaction chamber (y = 62 mm).
Figure 8.
Impact of the thickness of Pd/Cu membrane on the distribution of each gas concentration along x direction in reaction chamber (y = 62 mm).
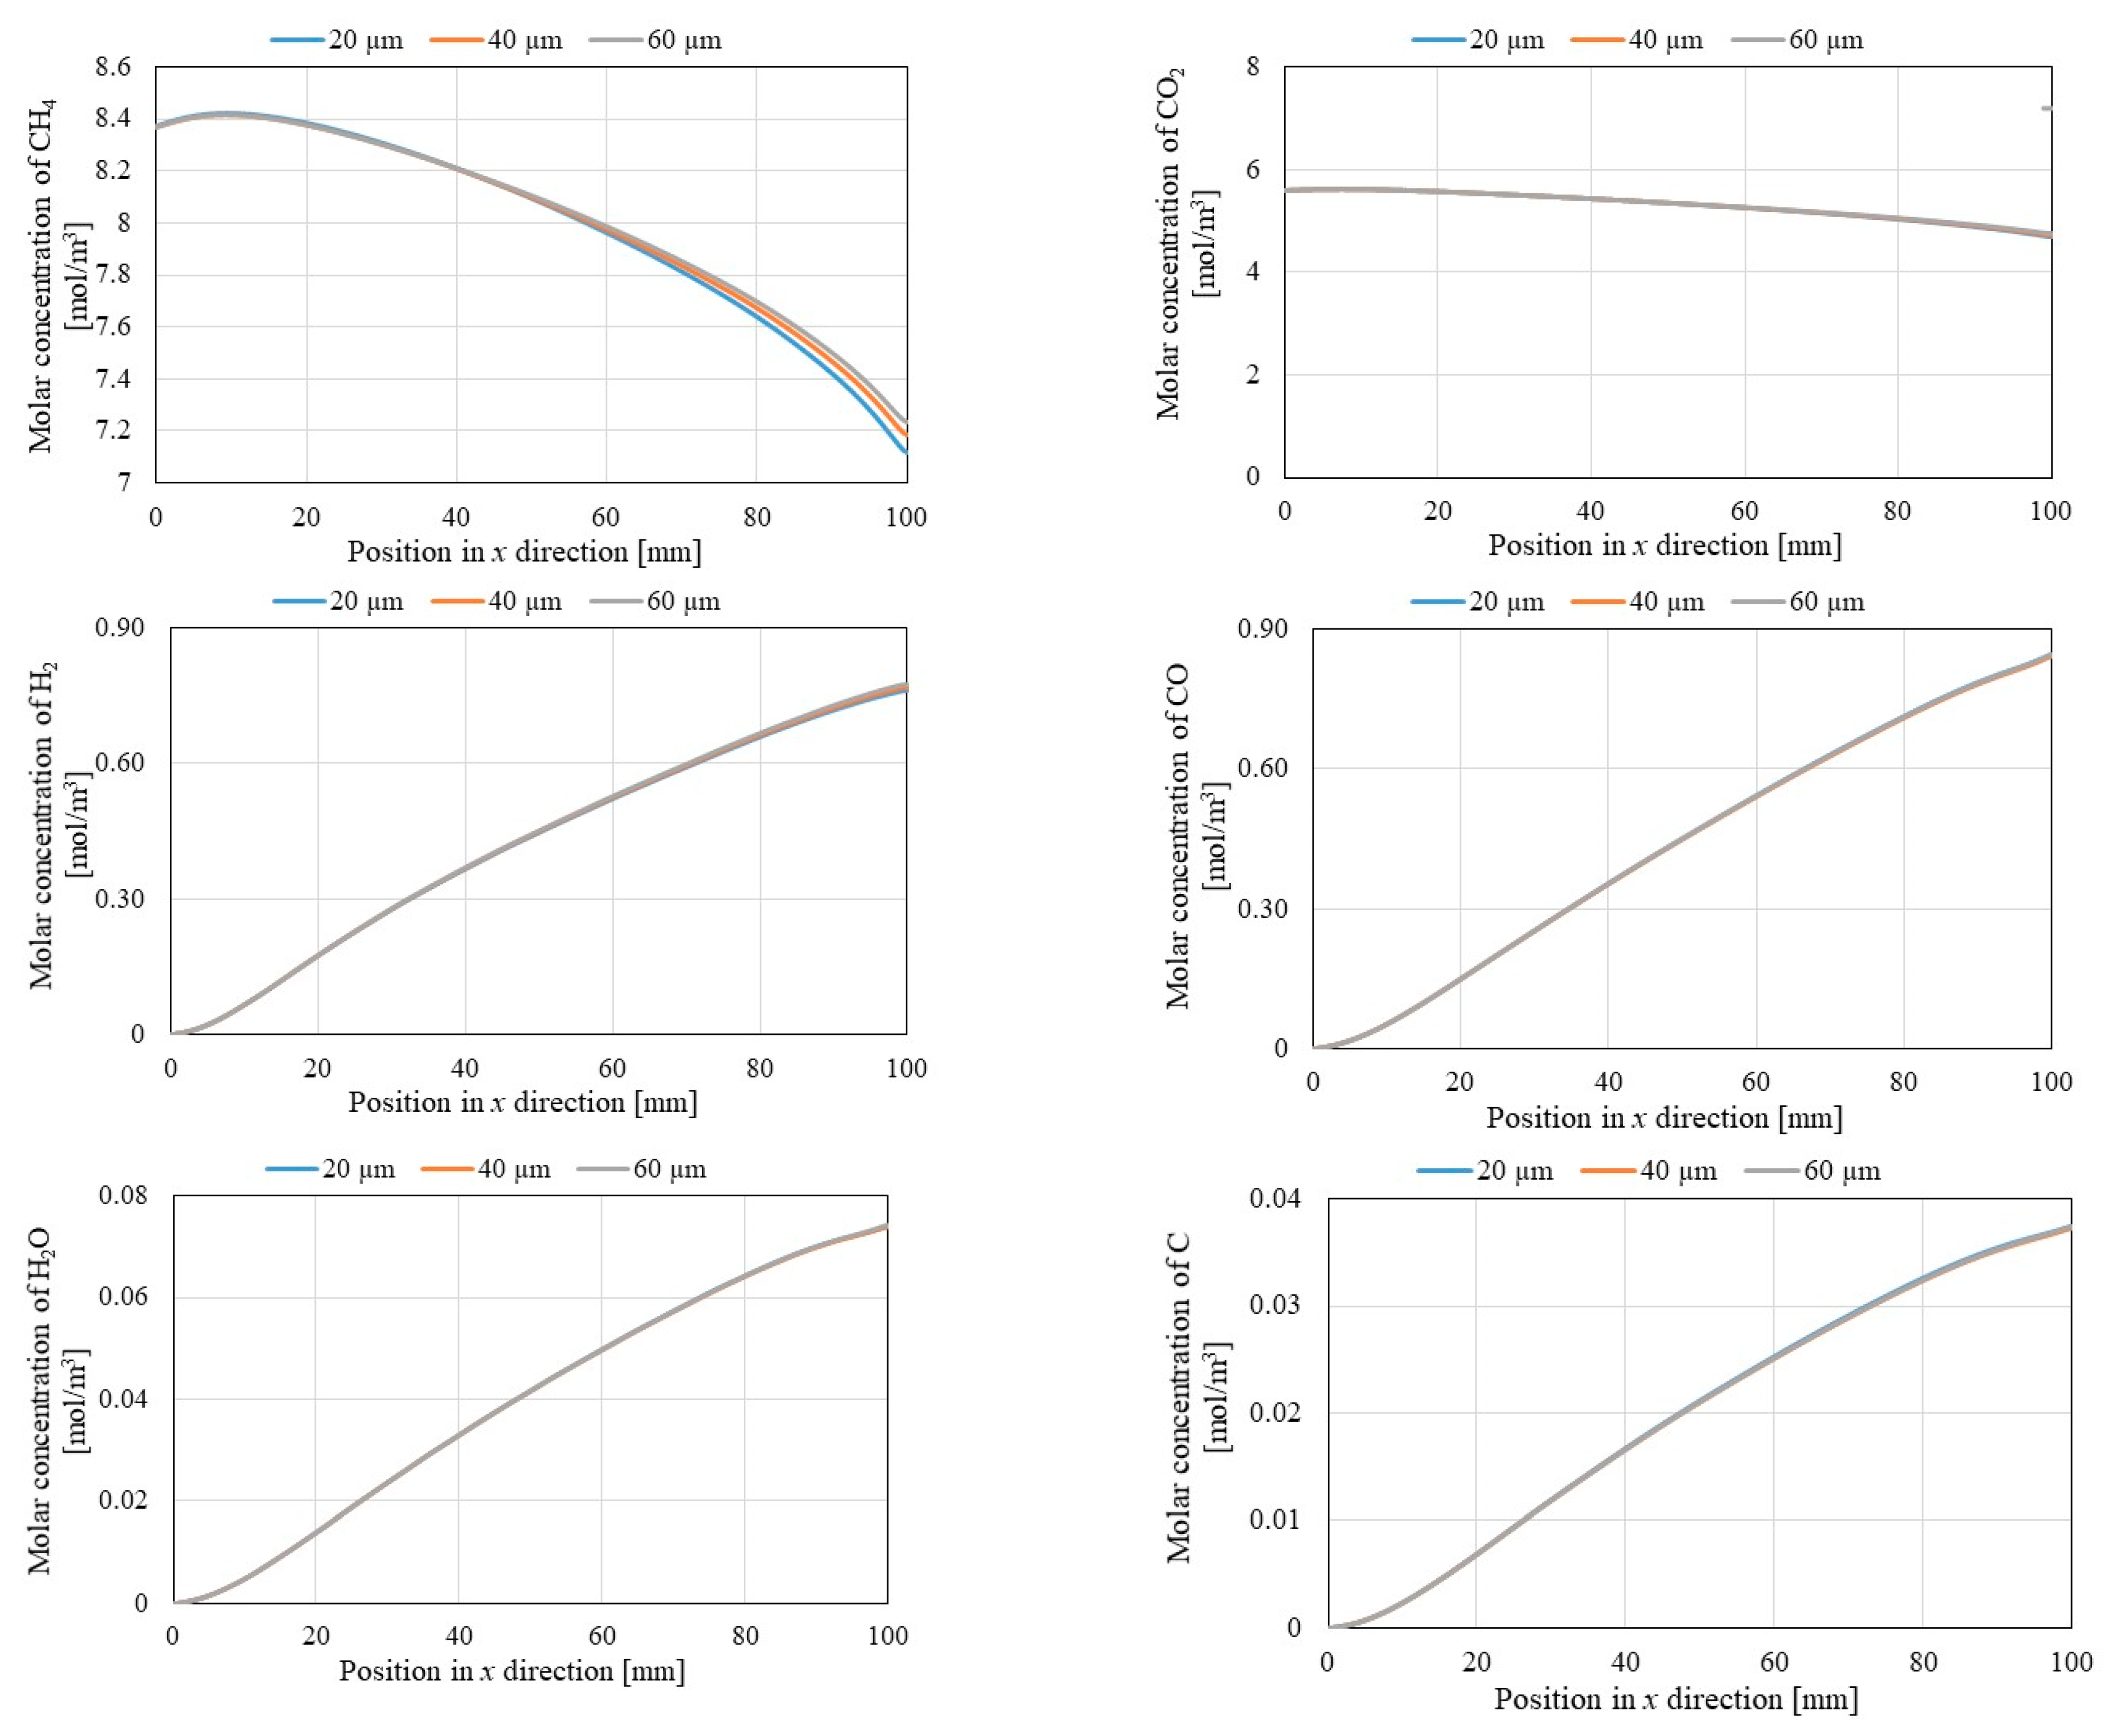
Figure 9.
Impact of the thickness of Pd/Cu membrane on distribution of molar concentration of H2 along x direction in reaction chamber (y = 60 mm), Pd/Cu membrane (y = 40 mm) and sweep chamber (y = 20 mm).
Figure 9.
Impact of the thickness of Pd/Cu membrane on distribution of molar concentration of H2 along x direction in reaction chamber (y = 60 mm), Pd/Cu membrane (y = 40 mm) and sweep chamber (y = 20 mm).
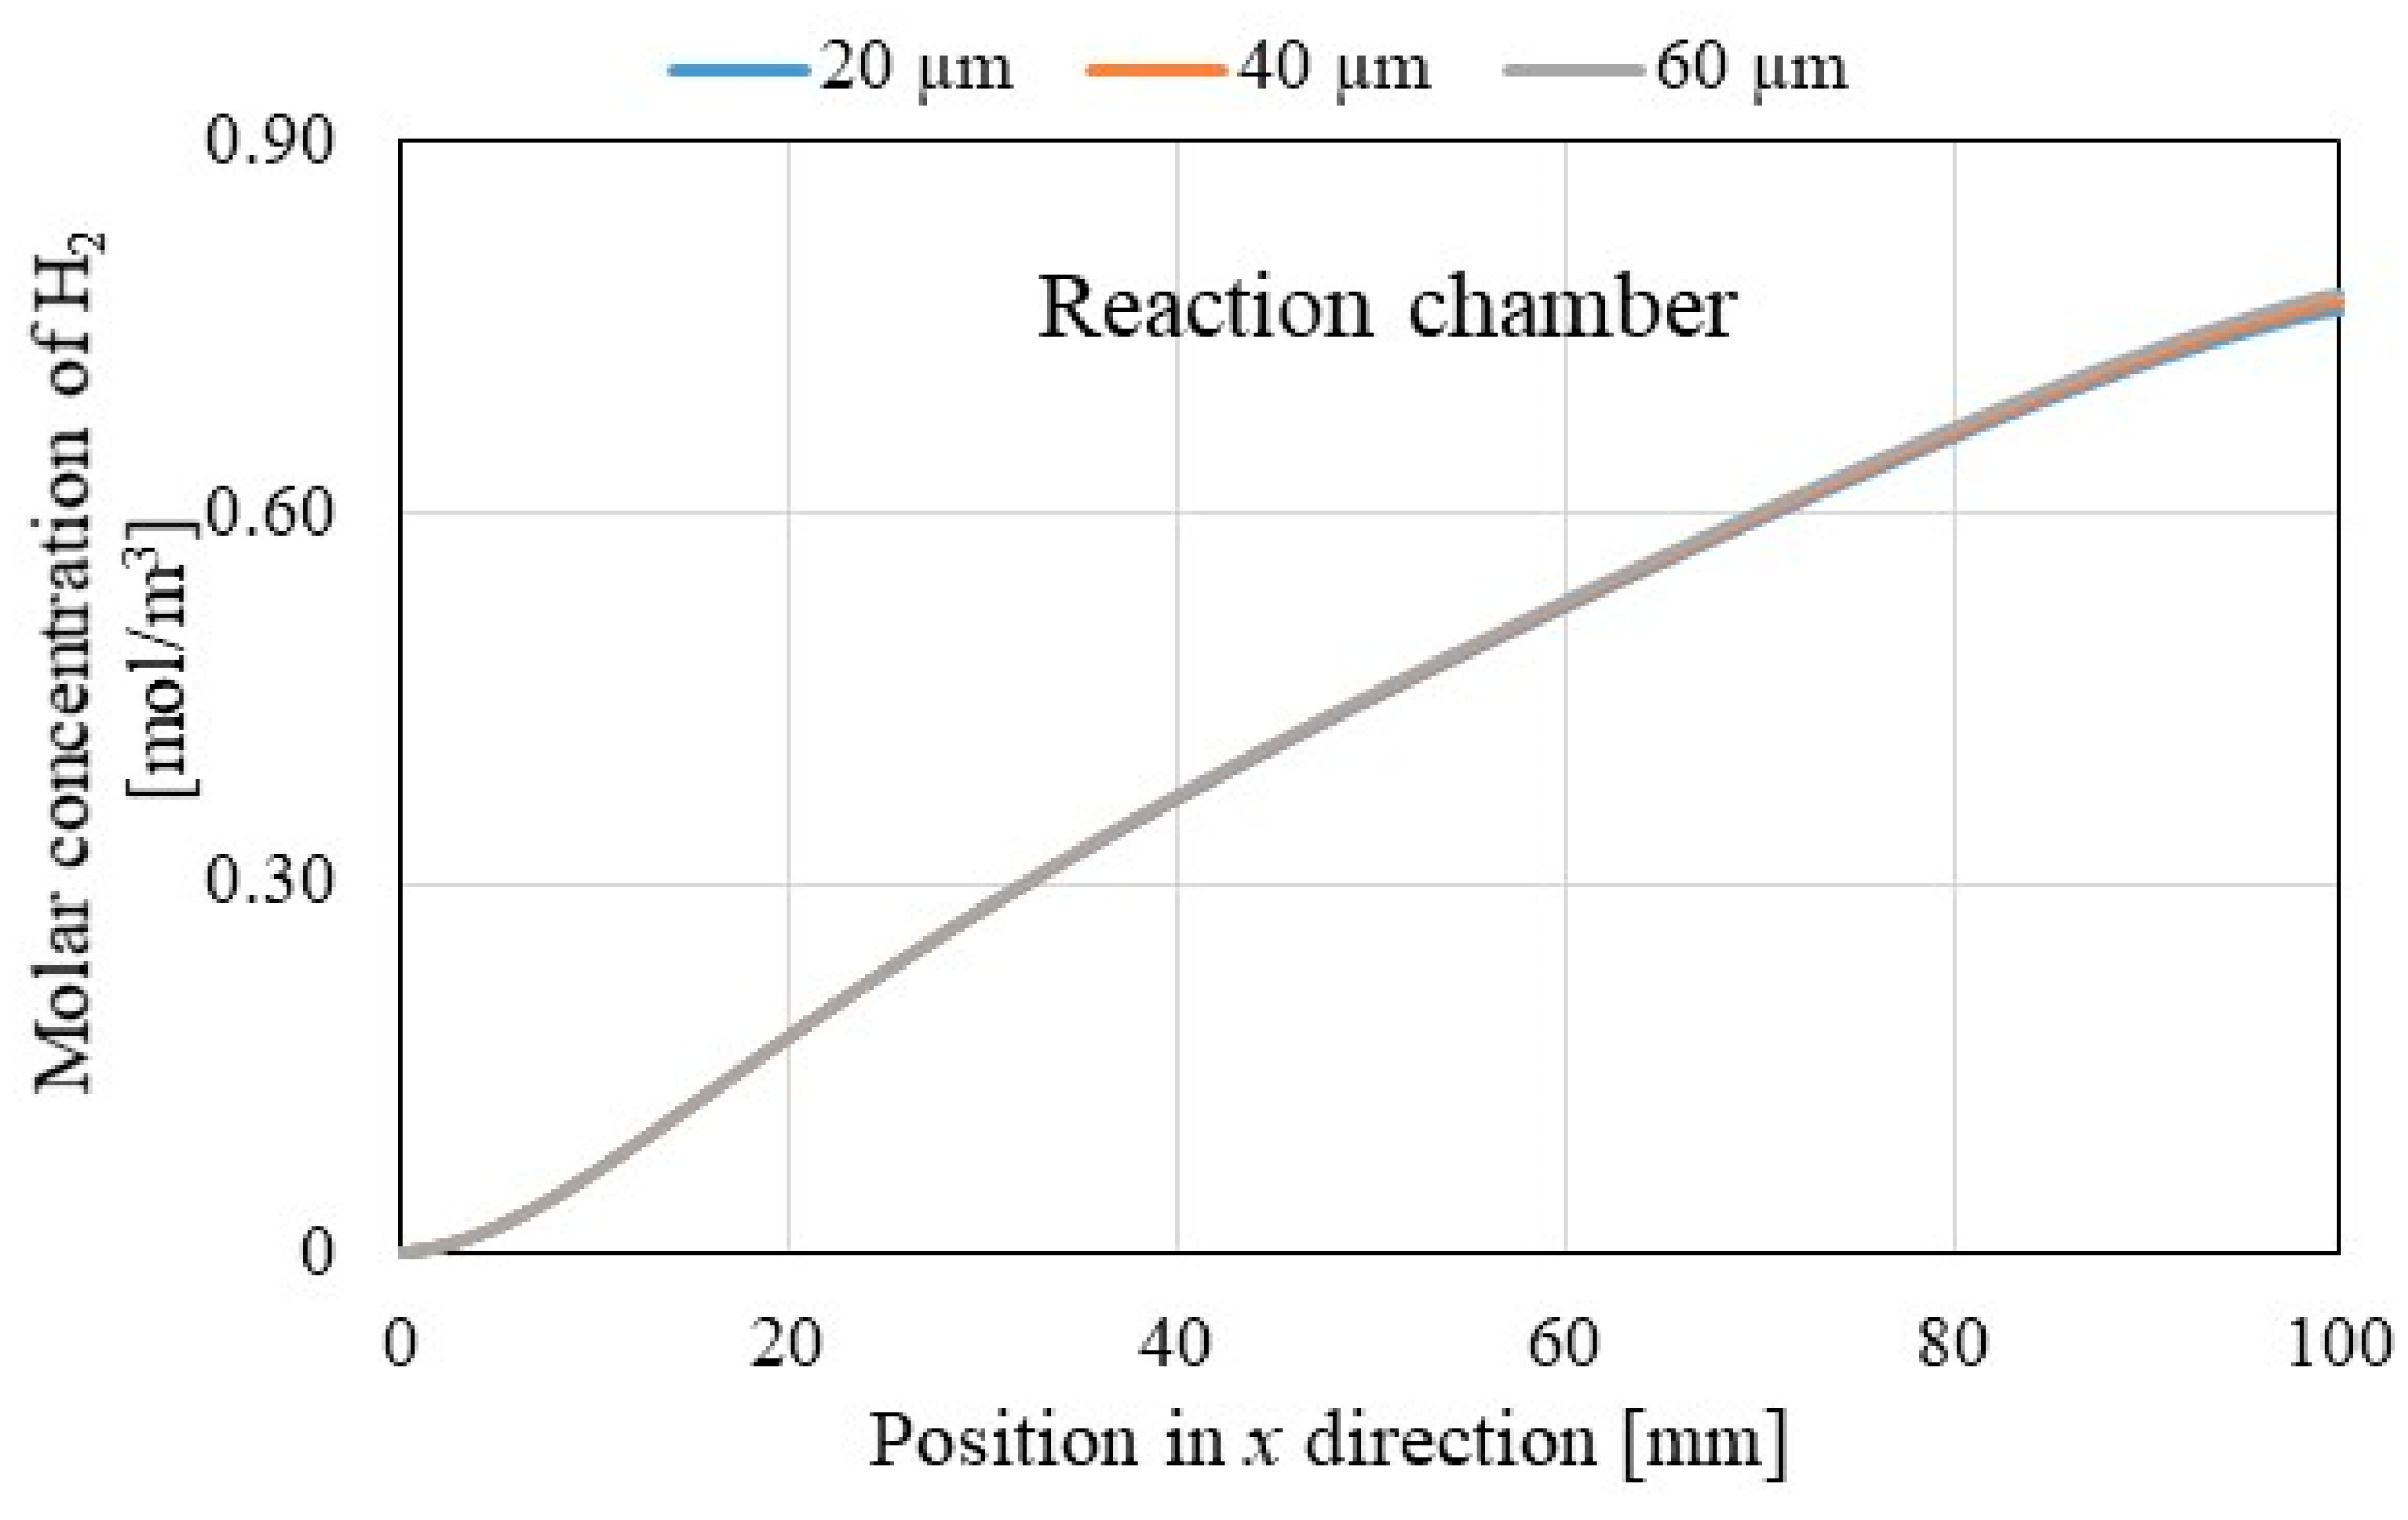
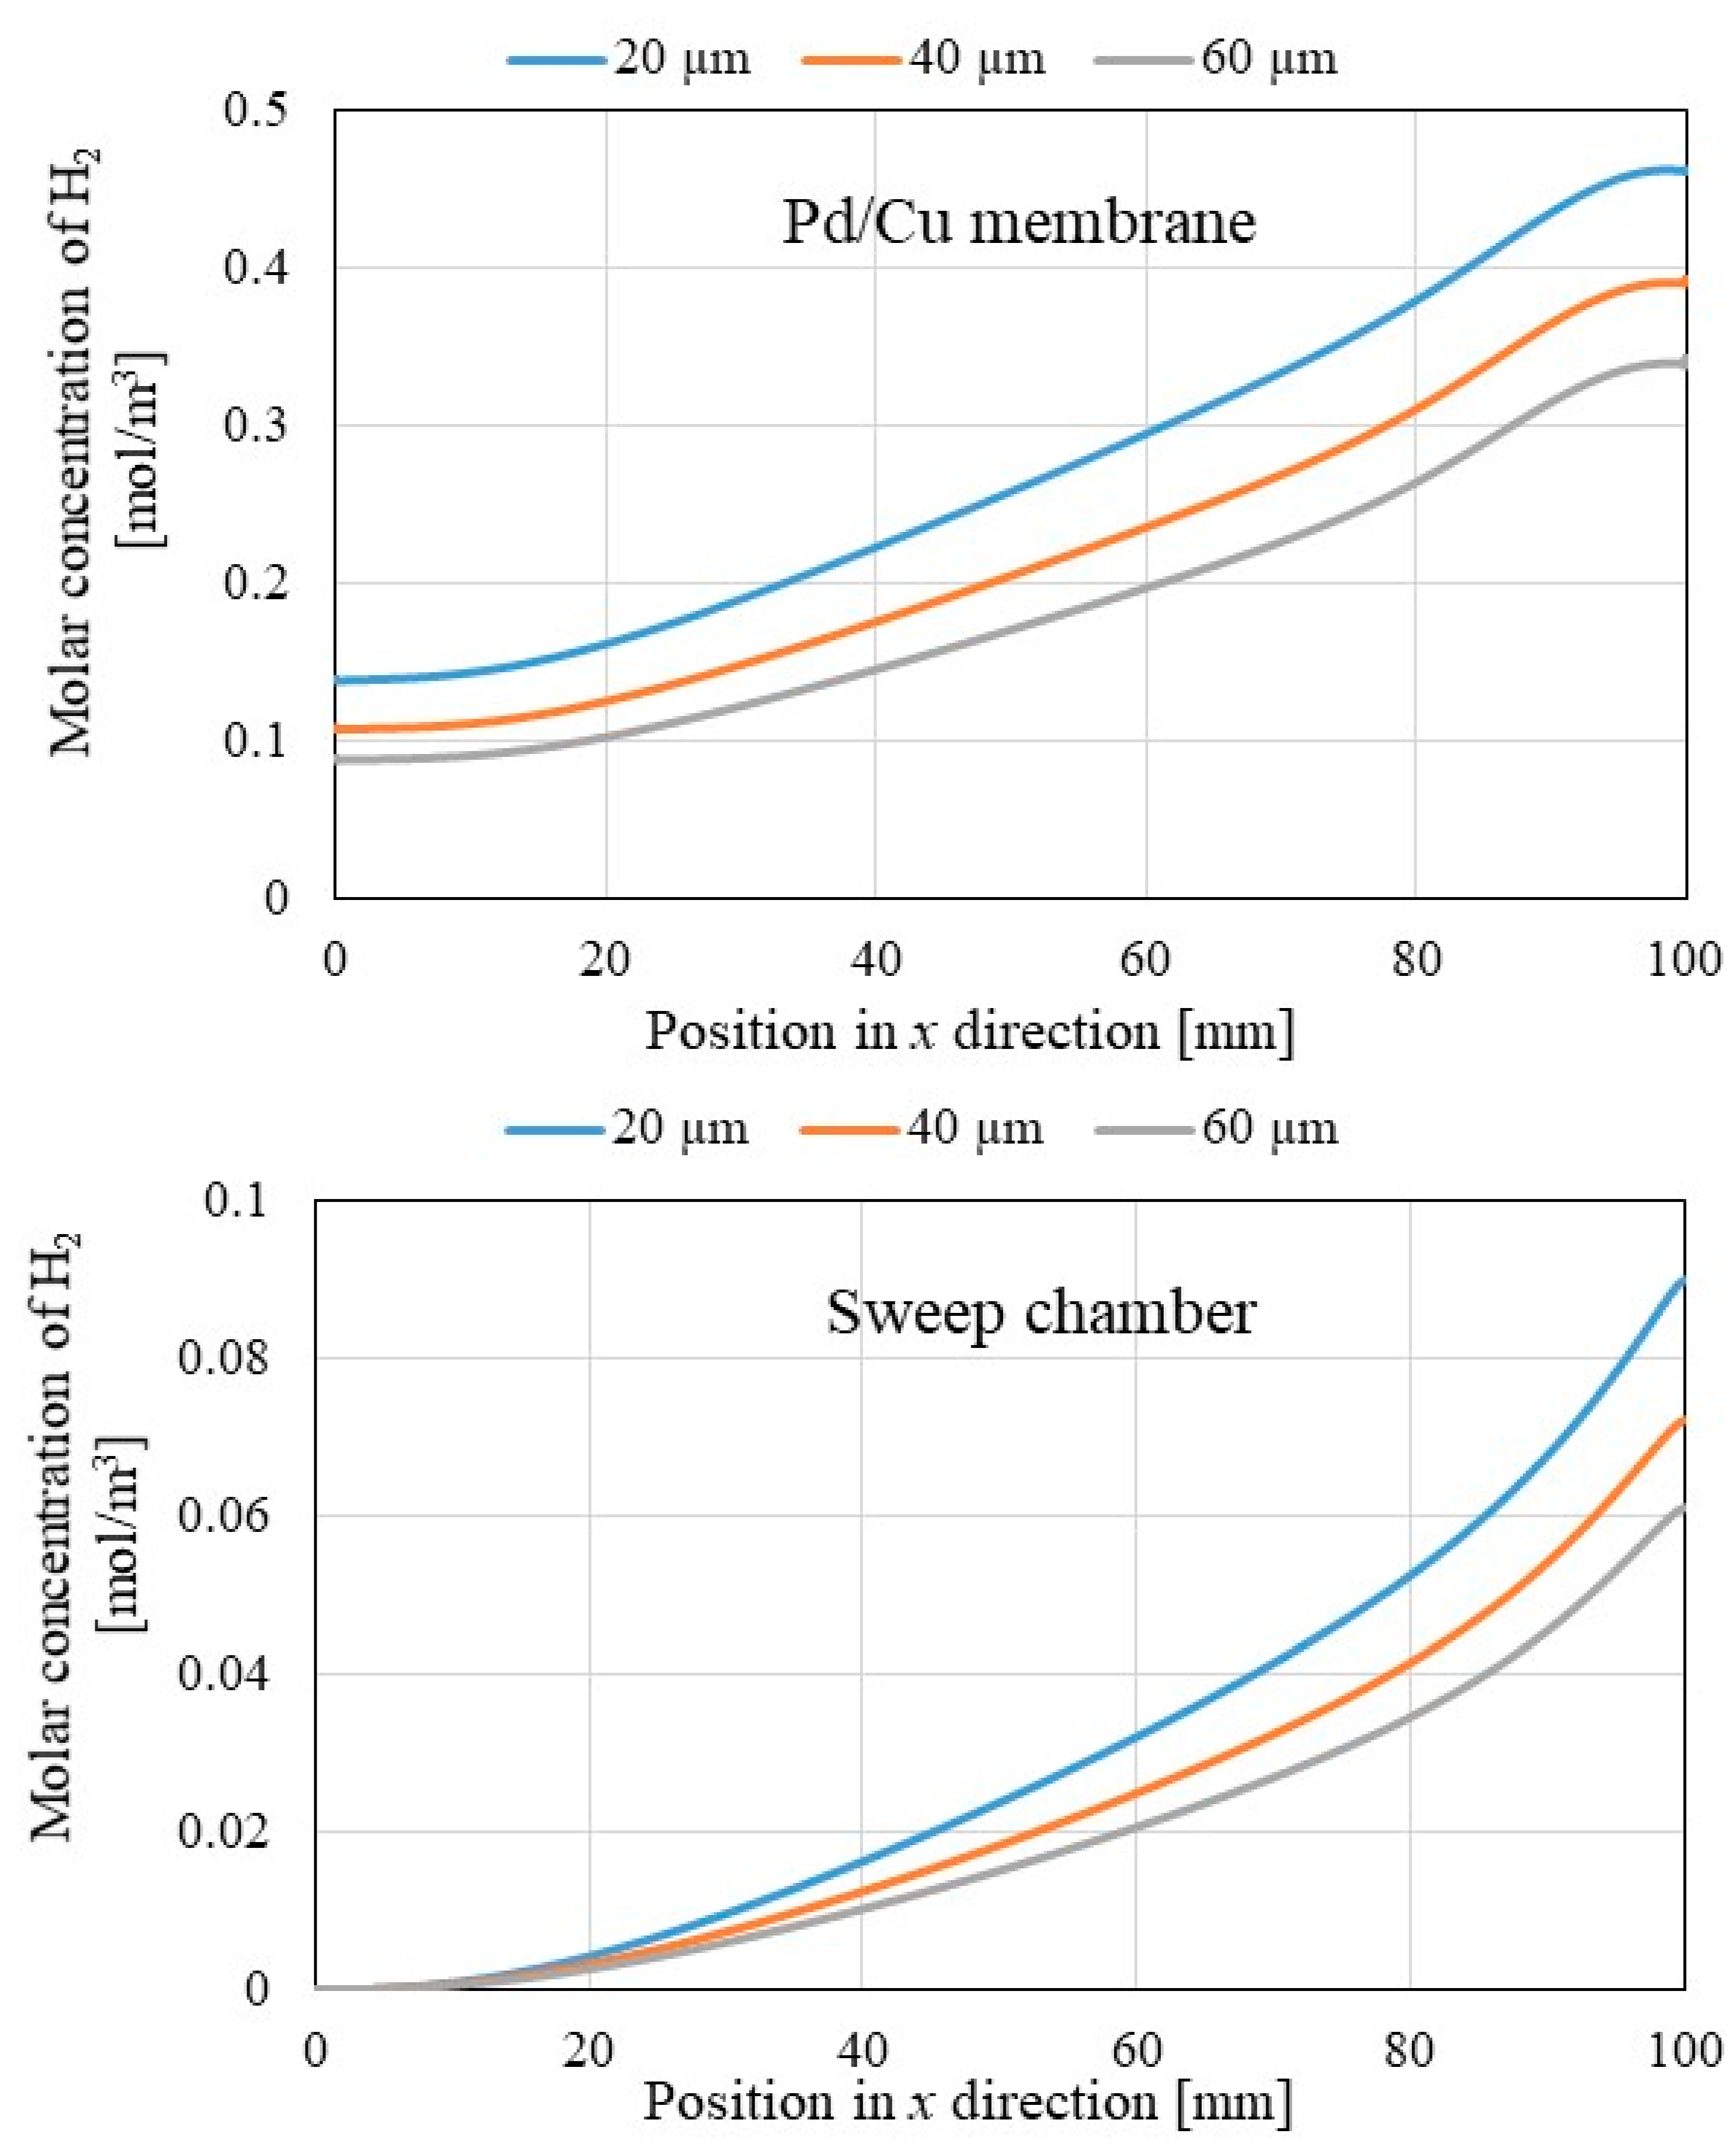

Table 1.
Numerical simulation conditions adopted in this study.
| Initial reaction temperature [℃] | 400, 500, 600 |
| Pressure in reactor [Pa] | 1.013×10⁵ |
| Inlet flow rate of CH4 [NL/min] (CH4:CO2 = 1.5:1) |
1.088 |
| Inlet flow rate of CO2 [NL/min] (CH4:CO2 = 1.5:1) |
0.725 |
| Outlet pressure [Pa] | 1.013×10⁵ |
| Density of catalyst [kg/m3] | 1045, 1042, 1040 (@400 ℃, 500 ℃, 600 ℃) |
| Porosity of catalyst (εp) [-] | 0.95 |
| Permeability of catalyst [m2] | 1.7×0-8, 1.6×10⁻⁸, 1.5×10⁻⁹ |
| Constant pressure of specific heat of catalyst [J/(kg·K)] |
327, 333, 340 |
| Thermal conductivity of catalyst [W/(m·K)] |
197, 194, 192 |
Table 2.
Comparison of CH4 conversion, CO2 conversion, H2 yield, H2 selectivity and CO selectivity for various initial temperature using the thickness of Pd/Cu membrane of 20 μm and various thickness of Pd/Cu membrane at the initial temperature of 600 ℃.
Table 2.
Comparison of CH4 conversion, CO2 conversion, H2 yield, H2 selectivity and CO selectivity for various initial temperature using the thickness of Pd/Cu membrane of 20 μm and various thickness of Pd/Cu membrane at the initial temperature of 600 ℃.
| Thickness of Pd/Cu membrane of 20 m | |||||
| Initial reaction temperature [℃] | CH4 conversion [%] | CO2 conversion [%] | H2 yield [%] | H2 selectivity [%] | CO selectivity [%] |
| 600 | 15.0 | 15.9 | 5.09 | 49.1 | 50.9 |
| 500 | 4.03 | 3.73 | 1.14 | 46.4 | 53.6 |
| 400 | 1.10 | 0.49 | 0.15 | 52.2 | 47.8 |
| Initial temperature of 600 ℃ | |||||
| Thickness of Pd/Cu membrane [μm] | CH4 conversion [%] | CO2 conversion [%] | H2 yield [%] | H2 selectivity [%] | CO selectivity [%] |
| 20 | 15.0 | 15.9 | 5.09 | 49.1 | 50.9 |
| 40 | 14.2 | 15.4 | 5.02 | 49.2 | 50.8 |
| 60 | 13.5 | 15.0 | 5.00 | 49.2 | 50.8 |
Disclaimer/Publisher’s Note: The statements, opinions and data contained in all publications are solely those of the individual author(s) and contributor(s) and not of MDPI and/or the editor(s). MDPI and/or the editor(s) disclaim responsibility for any injury to people or property resulting from any ideas, methods, instructions or products referred to in the content. |
© 2025 by the authors. Licensee MDPI, Basel, Switzerland. This article is an open access article distributed under the terms and conditions of the Creative Commons Attribution (CC BY) license (http://creativecommons.org/licenses/by/4.0/).
Copyright: This open access article is published under a Creative Commons CC BY 4.0 license, which permit the free download, distribution, and reuse, provided that the author and preprint are cited in any reuse.


